The Past and Future of American Economic Growth. Robert J. Gordon Centre for the Study of Living Standards Ottawa, September 14, 2017
|
|
|
- Shana Sparks
- 6 years ago
- Views:
Transcription
1 The Past and Future of American Economic Growth Robert J. Gordon Centre for the Study of Living Standards Ottawa, September 14,
2 Trump Boasted That He Will Boost Growth to 4% Per Year Actual growth of 2% since 2009 Made possible by decline in unemployment rate from 10.0% in late 2009 to 4.4% today Unemployment can t decline much further (3.8% reached 2000, 4.4% reached 2007) How rapidly can output grow at a constant unemployment rate? 2
3 Growth with the Same Unemployment Rate Unemployment 4.7% in 1970:Q2, 1986:Q1, and 2016:Q4 Actual real GDP growth: Sources of Slowing GDP growth Output per Hour (1.8 to 0.9) Hours of Work (1.4 to 0.4) Population 16+ (1.4 to 1.0) Hours per Person (0.0 to -0.6) 3
4 GDP Growth at a Constant Unemployment Rate Year 4

5 Productivity Growth at a Constant Unemployment Rate Year 5

6 Hours Growth at a Constant Unemployment Rate Year 6
7 2% Growth Path for Output per Capita? No Longer 7
8 Sources of Slowdown: Universal vs. U.S. - Centric Productivity Growth and Innovation Shared by all nations in developed world No mention here of catching-up process in emerging nations Headwinds: U. S. Falling Behind Education Inequality Socioeconomic and welfare state issues Job loss, decline of marriage, single-family homes Life expectancy, mortality 8
9 Productivity Growth, U.S. vs. Western Europe 9
10 Productivity Growth, U. S. vs. Developed Asia 10
11 Slowing Productivity Growth Reflects a Smaller Impact of Innovation The best organizing principle to think about innovation is to distinguish among the industrial revolutions (IR #1, IR #2, IR #3). The 1 st IR occurred , continued impact through 1900 Steam engine, railroad, steamships Cotton spinning and weaving Transition from wood to steel 11
12 Second Industrial Revolution: Six Dimensions of Growth Electricity: Light, power, elevators, streetcars, subways, fixed and portable electric machines, kitchen appliances, air conditioning Motor Vehicles: Cars and trucks replace horses, personal travel, commercial air transport Running water and sewers: Female liberation, conquest of infant mortality Info/Communication/Entertainment. Newspapers, telephone, phonograph, radio, motion pictures, TV Chemicals. Plastics, antibiotics, modern medicine Change in working conditions: from hot and dirty agriculture and industry to air-conditioned offices 12
13 All the Transitions That Could Only Happen Once Mainly Rural 1870 => Mainly Urban 1950 Light: Polluting Flames to Instant On-Off Speed: Hoof & Sail => Boeing 707 Inside Temperature: From Cold and Hot =>> Central Heating and Air Conditioning Instantaneous Communication: telegraph, telephone, radio, television Bathrooms and running water Life expectancy improved twice as fast as
14 Third Industrial Revolution Since 1960 the EICT Revolution Entertainment: the evolution of TV from color to time-shifting and streaming Information Tech the evolution from mainframes to PCs, the web, and e-commerce Communications: mobile phones, smart phones Productivity enhancers: ATM, bar-code scanning, fast credit card authorization 14
15 Retrospectives on the Revolutionary Century, Looking Back at 1867 from 1927 Most of the progress had been made by 1939 Looking Ahead to 2000 from 1939 Looking Ahead to 1939 from

16 The Three Eras of Productivity Growth 16

17 The Three Eras of TFP Growth 17
18 What Happened to Make Productivity Growth So Rapid before 1970? The 2 nd IR consisted of at least six dimensions of Great Inventions Each invention had spinoffs developed over In contrast the 3 rd IR has been limited to one dimension, the ICT revolution The 2 nd IR altered every aspect of life for consumers and business, whereas the 3 rd IR mainly mattered for business 18
19 3.50 TFP Growth , Five-Year Moving Average Chart Title :Q1 1962:Q1 1972:Q1 1982:Q1 1992:Q1 2002:Q1 2012:Q
20 IR #3 Has Failed the TFP Test Failure #1: TFP growth post-1970 barely 1/3 of Failure #2: IR #3 boosted TFP growth only briefly STARTLING QUESTON: HAS MOST OF THE PRODUCTIVITY IMPACT OF THE THIRD INDUSTRIAL REVOLUTION ALREADY HAPPENED? 20
21 IR #3 Changed Business Practices, Pre-Internet Phase 1, mechanical calculators, repetitive retyping, file cards, filing cabinets 1970s. Memory typewriters, electronic calculators 1980s. PCs with word processing and spreadsheets Late 1980s, before the arrival of the internet. , electronic catalogs, PCs connected inside firms, proprietary software 21
22 Completing the Change, Late 1990s. The web, search engines, e-commerce flat screens, airport check-in kiosks By 2005 the revolution in business practices was almost over 22
23 Summary: Stasis Everywhere You Look Offices use desktop and laptop computers much as they did years ago Other than e-commerce, Stasis in Retailing: Shelves stocked by humans, meat sliced at service counters, bar-code checkout Finance. ATMs, billion-share days Medicine: electronic medical records are here, little change in what nurses and doctors do Higher Education: cost inflation comes from rising ratio of administrative staff to instructional staff 23
24 Innovations Continue But How 3-D Printing Important Are They? Greatly speeded up speed and efficiency of designing prototypes, not mass production Robots Robots date back to 1961, by mid-1990s were welding and painting auto bodies Robot description from NYT 24
25 Innovations Continue But Are Evolutionary Not Revolutionary Driverless Cars and Trucks Truck drivers don t just drive trucks, they unload them and stock the shelves Consumer Reports Artificial Intelligence Predominant uses of big data are in marketing, zerosum game Evolutionary change: legal searches, radiology reading, voice recognition, language translation, Robo-advice How Big is the Impact? 25
26 Will Computers Take Away All the Jobs? Famous Study by Frey and Osborne in 2013 Computers will replace 47% of jobs within the next decade Let s look at some of their examples Real world: Computers are often complements not just substitutes, reallocate rather than eliminate ATMs did not make bank tellers disappear Bar-code scanning did not make check-out clerks disappear Radiologists have not disappeared, their work has become more accurate 26
27 Genuine Reasons for Worry Job Polarization Fosters Rising Inequality Increased demand for highly skilled technical jobs Increased demand for low-skilled jobs, flipping burgers and making beds, personal trainers and in-home care Decreased demand for middle-skill bluecollar and clerical workers Social and Economic Consequences for Middle-Aged Men 27
28 Middle-Skill Job Loss, Particularly for Men Multiple Consequences of Middle-Skill Job Loss Clash of actual outcome vs. expectations for a better life Labor-force drop outs Males are less attractive marriage partners, decline of marriage Consequences of single-family homes for behavior and outcomes of children Health and mortality consequences 28
29 29
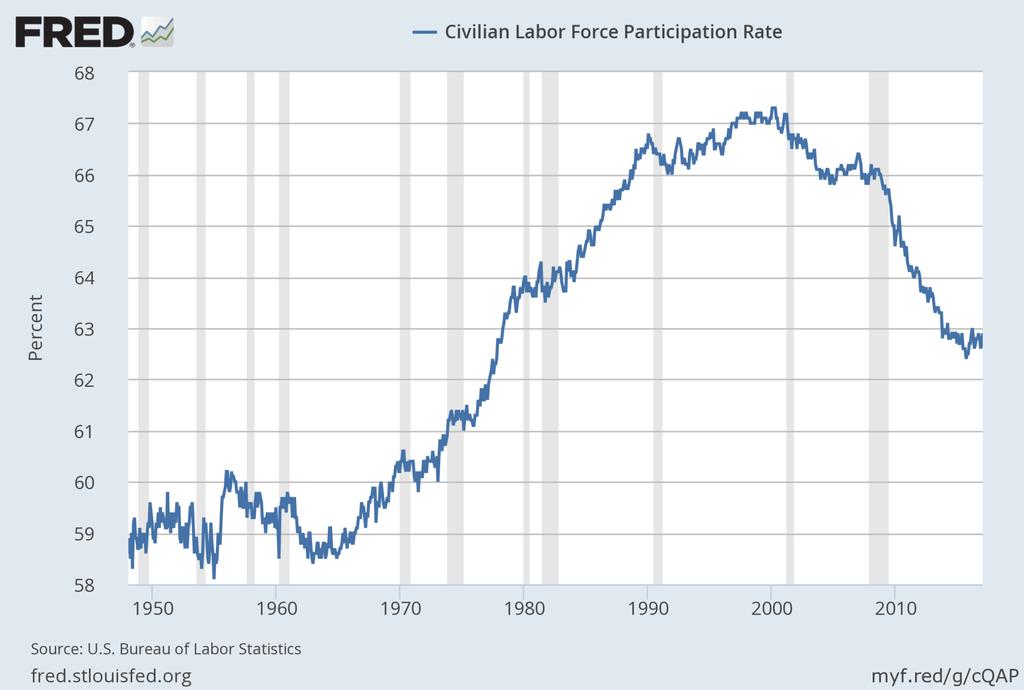
30 Prime-Age Participation Rate Year 30
31 Consequences of Job Loss, Labor Force Dropping Out Loss of protective institutions Unions Catholic Church Comraderie with co-workers at nearby bar The compliant wife Non-college males 51 percent divorce rate Main reasons: infidelity, domestic violence, substance abuse Loss of civilizing influence of marriage and children 31
32 Mortality Outcomes for Middle-Aged Whites (Case-Deaton) 32
33 A Leading Puzzle: The Contrast with Other Countries 33
34 The Decline in Marriage Women don t want to marry men who are less well-educated, less successful than they are Changes 1982 to 2008, children born out of wedlock White high school grads 4 to 34 percent Black high school grads 48 to 74 percent Change , bottom 1/3 of white population For 40-year-old women percent of children living with both biological parents declined from 95 to 34 percent 34
35 Growing Imbalance of College Completion by Sex 35
36 This Extended View of the Demographic Headwind: Consequences for Growth Declining participation reduces growth in hours of work and GDP Decline and postponement of marriage reduces fertility rate and population growth Health consequences raise mortality rate Consequences of single-parent families for children cast shadow on future educational attainment and employability 36
37 Slower Growth Goes Beyond Innovation: The Four Headwinds As above, the demographic headwind The education headwind The inequality headwind The fiscal headwind 37
38 Second Headwind: Education A major driver of that epochal 20 th century productivity achievement was education High school completion rate has barely changed since Most people drop out of 2-year community colleges College completion is increasing but 40% of recent graduates are in jobs that do not require a college education Since 2000 reduced employment and wage premium in cognitive jobs that require a college education High cost, growing indebtedness 38
39 The Education Plateau 39
40 Education: International Comparisons Poor preparation for college. International PISA test scores rank out of 34 OECD countries: US #17 in reading, 20 th in science, 27 th in math U.S. has dropped from #1 to #16 in college completion as percent of population; same for high-school dropouts This will reduce future economic growth by -0.2 percent per year compared to the contribution of education to 20 th century growth 40
41 Third Headwind: Inequality For the top 1% earned 52 percent of the total income gain Bottom 90% annual income growth 0.5 percent slower than the average This is continuing, it s not over. CEO pay, sports and entertainment stars. ($10-15 million) Wage pushbacks lower wages, two-tier wages, shaving pension and medical care benefits Firms pushing employees into part-time work, hiring contract workers instead of employees 41
42 The Income Share of the Top One Percent Since

43 The Life Expectancy Gap by Income Quintile 43
44 The Fiscal Headwind: Debt/GDP, Year 44
45 Combined Effects of Headwinds Demographic headwind reduces hours per person Education headwind reduces productivity growth Inequality headwind reduces median growth below average growth Fiscal headwind raises taxes or reduces transfer payments 45
46 Percent 2.5 Figure Annual Growth Rate of Alternative Real Income Concepts, Actual Outcomes and Projected Values Output per Hour Output per Person Median Output per Person Source: Data underlying Table Disposable Median Income Per Person 46
47 Policy Issues for Q&A Trump wants faster growth, 3.5 to 4% But strong forces will push growth down, not up Growth to date made possible by declining unemployment how much longer? Continuing retirement of baby boom generation Deportations reduce employment & hours of work Continuation of slow productivity growth Limited room for response to deregulation Tax cuts and reform won t boost growth if they re deficit neutral 47
48 Conclusions 70 percent of all TFP growth since 1890 occurred , attributed to IR #2 The big impacts on TFP of IR #3 were largely completed by 2005 Innovation continues but has less impact Much of the slowdown in future growth is caused by the headwinds Slowing innovation shared across countries, but aspects of headwinds are U.S.-centric A moderate pace of innovation means that jobs will not disappear en masse 48
A COMPARISON OF ARIZONA TO NATIONS OF COMPARABLE SIZE
 A COMPARISON OF ARIZONA TO NATIONS OF COMPARABLE SIZE A Report from the Office of the University Economist July 2009 Dennis Hoffman, Ph.D. Professor of Economics, University Economist, and Director, L.
Explanations of Slow Growth in Productivity and Real Wages
 Explanations of Slow Growth in Productivity and Real Wages America s Greatest Economic Problem? Introduction Slow growth in real wages is closely related to slow growth in productivity. Only by raising
Human Population Growth Through Time
 Human Population Growth Through Time Current world population: 7.35 Billion (Nov. 2016) http://www.worldometers.info/world-population/ 2012 7 billion 1999 13 years 12 years 1974 1927 1804 13 years 14 years
Low-Skill Jobs A Shrinking Share of the Rural Economy
 Low-Skill Jobs A Shrinking Share of the Rural Economy 38 Robert Gibbs rgibbs@ers.usda.gov Lorin Kusmin lkusmin@ers.usda.gov John Cromartie jbc@ers.usda.gov A signature feature of the 20th-century U.S.
VIETNAM FOCUS. The Next Growth Story In Asia?
 The Next Growth Story In Asia? Vietnam s economic policy has dramatically transformed the nation since 9, spurring fast economic and social development. Consequently, Vietnam s economy took off booming
THE ROLE OF THE STATE IN ECONOMIC GROWTH PARIS. Globalization and the Rise of the Robots
 THE ROLE OF THE STATE IN ECONOMIC GROWTH PARIS Globalization and the Rise of the Robots A policy brief by Dalia Marin, University of Munich and CEPR Globalization and the Rise of Robots Dalia Marin University
10/11/2017. Chapter 6. The graph shows that average hourly earnings for employees (and selfemployed people) doubled since 1960
 doubled since 1960") Chapter 6 1. Discuss three US labor market trends since 1960 2. Use supply and demand to explain the labor market 3. Use supply and demand to explain employment and real wage trends since 1960 4. Define
Chapter 6 1. Discuss three US labor market trends since 1960 2. Use supply and demand to explain the labor market 3. Use supply and demand to explain employment and real wage trends since 1960 4. Define
65. Broad access to productive jobs is essential for achieving the objective of inclusive PROMOTING EMPLOYMENT AND MANAGING MIGRATION
 5. PROMOTING EMPLOYMENT AND MANAGING MIGRATION 65. Broad access to productive jobs is essential for achieving the objective of inclusive growth and help Turkey converge faster to average EU and OECD income
Over the past three decades, the share of middle-skill jobs in the
 The Vanishing Middle: Job Polarization and Workers Response to the Decline in Middle-Skill Jobs By Didem Tüzemen and Jonathan Willis Over the past three decades, the share of middle-skill jobs in the United
In class, we have framed poverty in four different ways: poverty in terms of
 Sandra Yu In class, we have framed poverty in four different ways: poverty in terms of deviance, dependence, economic growth and capability, and political disenfranchisement. In this paper, I will focus
National Assessments on Gender and Science, Technology and Innovation (STI) Overall Results, Phase One September 2012
 Overall Results, Phase One September 2012") National Assessments on Gender and Science, Technology and Innovation (STI) Scorecard on Gender Equality in the Knowledge Society Overall Results, Phase One September 2012 Overall Results The European
National Assessments on Gender and Science, Technology and Innovation (STI) Scorecard on Gender Equality in the Knowledge Society Overall Results, Phase One September 2012 Overall Results The European
How s Life in Germany?
 October 2015 How s Life in Germany? Additional information, including the data used in this country note, can be found here: www.oecd.org/statistics/hows-life-2015-country-notes-data.xlsx HOW S LIFE IN
HIGHLIGHTS. There is a clear trend in the OECD area towards. which is reflected in the economic and innovative performance of certain OECD countries.
 HIGHLIGHTS The ability to create, distribute and exploit knowledge is increasingly central to competitive advantage, wealth creation and better standards of living. The STI Scoreboard 2001 presents the
The Future of Inequality
 The Future of Inequality As almost every economic policymaker is aware, the gap between the wages of educated and lesseducated workers has been growing since the early 1980s and that change has been both
Trump and the Xenophobic Populist Parties: Cultural Backlash in Artificial Intelligence Society
 Trump and the Xenophobic Populist Parties: Cultural Backlash in Artificial Intelligence Society Ronald Inglehart Higher School of Economics Moscow April 11, 2017 In recent decades virtually all of the
How s Life. in the Slovak Republic?
 How s Life October 2015 in the Slovak Republic? Additional information, including the data used in this country note, can be found at: www.oecd.org/statistics/hows-life-2015-country-notes-data.xlsx HOW
Chapter 10. Resource Markets and the Distribution of Income. Copyright 2011 Pearson Addison-Wesley. All rights reserved.
 Chapter 10 Resource Markets and the Distribution of Income Resource markets differ from markets for consumer goods in several key ways First, the demand for resources comes from firms producing goods and
A2 Economics. Standard of Living and Economic Progress. tutor2u Supporting Teachers: Inspiring Students. Economics Revision Focus: 2004
 Supporting Teachers: Inspiring Students Economics Revision Focus: 2004 A2 Economics Standard of Living and Economic Progress tutor2u (www.tutor2u.net) is the leading free online resource for Economics,
Mexico: How to Tap Progress. Remarks by. Manuel Sánchez. Member of the Governing Board of the Bank of Mexico. at the. Federal Reserve Bank of Dallas
 Mexico: How to Tap Progress Remarks by Manuel Sánchez Member of the Governing Board of the Bank of Mexico at the Federal Reserve Bank of Dallas Houston, TX November 1, 2012 I feel privileged to be with
Economic Growth & Population Decline What To Do About Latvia?
 Economic Growth & Population Decline What To Do About Latvia? Edward Hugh Riga: March 2012 Warning It Is Never Too Late To do Something, But This Is Not An Excuse For Doing Nothing. As We All Know, Latvia
Demographic Change and Economic Growth in the BRICS: Dividend, Drag or Disaster?
 Demographic Change and Economic Growth in the BRICS: Dividend, Drag or Disaster? Presentation based on the 215/16 Global Monitoring Report (GMR) www.worldbank.org/gmr Philip Schellekens Lead Economist,
Asia-Pacific to comprise two-thirds of global middle class by 2030, Report says
 Strictly embargoed until 14 March 2013, 12:00 PM EDT (New York), 4:00 PM GMT (London) Asia-Pacific to comprise two-thirds of global middle class by 2030, Report says 2013 Human Development Report says
The Start of the Industrial Revolution
 The Start of the Industrial Revolution I. Agricultural Revolution A. Industrial Revolution changed Europe from a mostly agricultural economy to industrialization- work driven by machinery B. Improved Farm
Promoting women s participation in economic activity: A global picture
 Promoting women s participation in economic activity: A global picture Ana Revenga Senior Director Poverty and Equity Global Practice, The World Bank Lima, June 27, 2016 Presentation Outline 1. Why should
Real Wage Trends, 1979 to 2017
 Sarah A. Donovan Analyst in Labor Policy David H. Bradley Specialist in Labor Economics March 15, 2018 Congressional Research Service 7-5700 www.crs.gov R45090 Summary Wage earnings are the largest source
Long-Run Economic Growth
 Long-Run Economic Growth Economic Growth Little else is requisite to carry a state to the highest degree of opulence from the lowest barbarism, but peace, easy taxes, and a tolerable administration of
Demography. Demography is the study of human population. Population is a dynamic open systems with inputs, processes and outputs.
 Population Demography Demography is the study of human population. Population is a dynamic open systems with inputs, processes and outputs. This means that change constantly occurs in population numbers,
The Americans (Survey)
") The Americans (Survey) Chapter 34: TELESCOPING THE TIMES The United States in Today s World CHAPTER OVERVIEW President Bill Clinton locks horns with a Republican Congress, reflecting the heated national
The Americans (Survey) Chapter 34: TELESCOPING THE TIMES The United States in Today s World CHAPTER OVERVIEW President Bill Clinton locks horns with a Republican Congress, reflecting the heated national
How s Life in Switzerland?
 How s Life in Switzerland? November 2017 On average, Switzerland performs well across the OECD s headline well-being indicators relative to other OECD countries. Average household net adjusted disposable
The labor market in Japan,
 DAIJI KAWAGUCHI University of Tokyo, Japan, and IZA, Germany HIROAKI MORI Hitotsubashi University, Japan The labor market in Japan, Despite a plummeting working-age population, Japan has sustained its
Is This Time Different? The Opportunities and Challenges of Artificial Intelligence
 Is This Time Different? The Opportunities and Challenges of Artificial Intelligence Jason Furman Chairman, Council of Economic Advisers The National Academies of Sciences, Engineering, and Medicine Washington,
Economic Geography Chapter 10 Development
 Economic Geography Chapter 10 Development Development: Key Issues 1. Why Does Development Vary Among Countries? 2. Where Are Inequalities in Development Found? 3. Why Do Countries Face Challenges to Development?
How s Life in Ireland?
 How s Life in Ireland? November 2017 Relative to other OECD countries, Ireland s performance across the different well-being dimensions is mixed. While Ireland s average household net adjusted disposable
Speech given by Mervyn King, Governor of the Bank of England. At Salts Mills, Bradford, Yorkshire 13 June 2005
 1 Speech given by Mervyn King, Governor of the Bank of England At Salts Mills, Bradford, Yorkshire 13 June 2005 All speeches are available online at www.bankofengland.co.uk/publications/pages/speeches/default.aspx
How s Life in Austria?
 How s Life in Austria? November 2017 Austria performs close to the OECD average in many well-being dimensions, and exceeds it in several cases. For example, in 2015, household net adjusted disposable income
david e. bloom and david canning
 demographics and development policy BY B y late 2011 there will be more than 7 billion people in the world, with 8 billion in 2025 and 9 billion before 2050. New technologies and institutions, and a lot
5.1 Prosperity in the 1920 s
 Social Studies 9 Chapter 5 : Prosperity and Depression 5.1 Prosperity in the 1920 s During the Great War, Canada s industries were focused on wartime goods which drove up the cost of everyday goods. Returning
Trade And Inequality With Limited Labor Mobility: Theory And Evidence From China Muqun Li and Ian Coxhead APPENDIX
 A-1 Trade And Inequality With Limited Labor Mobility: Theory And Evidence From China Muqun Li Ian Coxhead Contents: APPENDIX A.1. Proof of lemma 1... 1 A.2. Relative labor dem... 2 A.3. Trade balance conditions...
Trends Shaping Education Highlights
 Trends Shaping Education 219 Did you ever wonder whether education has a role to play in preparing our societies for an age of artificial intelligence? Or what the impact of climate change might be on
Telephone Survey. Contents *
 Telephone Survey Contents * Tables... 2 Figures... 2 Introduction... 4 Survey Questionnaire... 4 Sampling Methods... 5 Study Population... 5 Sample Size... 6 Survey Procedures... 6 Data Analysis Method...
Italy s average level of current well-being: Comparative strengths and weaknesses
 How s Life in Italy? November 2017 Relative to other OECD countries, Italy s average performance across the different well-being dimensions is mixed. The employment rate, about 57% in 2016, was among the
World Population A.D World Population from the Beginnings to the Present. Words
 1 Today, about 6 billion people live on our earth. Each year, the world s population grows by about 80 million. If it continues to grow at such a rate the world s population will reach 9 billion by the
Lesson 10 What Is Economic Justice?
 Lesson 10 What Is Economic Justice? The students play the Veil of Ignorance game to reveal how altering people s selfinterest transforms their vision of economic justice. OVERVIEW Economics Economics has
Issues in Education and Lifelong Learning: Spending, Learning Recognition, Immigrants and Visible Minorities
 Issues in Education and Lifelong Learning: Spending, Learning Recognition, Immigrants and Visible Minorities Dr. Michael Bloom Executive Director, Strategic Projects, & Director, Education and Learning
How s Life in Slovenia?
 How s Life in Slovenia? November 2017 Slovenia s average performance across the different well-being dimensions is mixed when assessed relative to other OECD countries. The average household net adjusted
Chapter 17. The Labor Market and The Distribution of Income. Microeconomics: Principles, Applications, and Tools NINTH EDITION
 Microeconomics: Principles, Applications, and Tools NINTH EDITION Chapter 17 The Labor Market and The Distribution of Income A key factor in a worker s earnings is educational attainment. In 2009, the
Chapter 6: Human Population & Its Impact How many is too many? 7 billion currently; 1.6 mill. more each week ~2.4 bill. more by 2050 Developing 82%
 Chapter 6: Human Population & Its Impact How many is too many? 7 billion currently; 1.6 mill. more each week ~2.4 bill. more by 2050 Developing 82% of population Developed high resource use; (more coming
ASEAN: THE AEC IS HERE, FINALLY 2030: NOMINAL GDP USD TRILLION US CHINA EURO AREA ASEAN JAPAN UK $20.8 $34.6 IN IN
 14: NOMINAL GDP USD TRILLION US EURO AREA CHINA JAPAN UK $2.9 $4.6 : THE AEC IS HERE, FINALLY $1.4 $13.4 $17.4 3: NOMINAL GDP USD TRILLION US CHINA EURO AREA JAPAN UK $6.8 $6.4 $8.5 $.8 $34.6 $33.6 $2.5
Higher education global trends and emerging opportunities to Kevin Van-Cauter Higher Education Adviser The British Council
 Higher education global trends and emerging opportunities to 2020 Kevin Van-Cauter Higher Education Adviser The British Council Outline Where are international students coming from? Trends in Engineering
Economics of European Integration Lecture # 6 Migration and Growth
 Economics of European Integration Lecture # 6 Migration and Growth Winter Semester 2013/14 Gerald Willmann Gerald Willmann, Department of Economics, Bielefeld University Migration Facts and Theory Immigration:
How s Life in the United States?
 How s Life in the United States? November 2017 Relative to other OECD countries, the United States performs well in terms of material living conditions: the average household net adjusted disposable income
How s Life in Mexico?
 How s Life in Mexico? November 2017 Relative to other OECD countries, Mexico has a mixed performance across the different well-being dimensions. At 61% in 2016, Mexico s employment rate was below the OECD
UNION COLLEGE DEPARTMENT OF ECONOMICS, FALL 2004 ECO 146 SEMINAR IN GLOBAL ECONOMIC ISSUES GLOBALIZATION AND LABOR MARKETS
 UNION COLLEGE DEPARTMENT OF ECONOMICS, FALL 2004 ECO 146 SEMINAR IN GLOBAL ECONOMIC ISSUES GLOBALIZATION AND LABOR MARKETS The Issues wage inequality between skilled and unskilled labor the effects of
APES Chapter 10 Study Guide. 1. How can the population change in a particular year be calculated?
 APES Chapter 10 Study Guide 1. How can the population change in a particular year be calculated? 2. Define the term crude birth rate. 3. Name the continent that has the highest crude birth rate and crude
Chapter 10: Long-run Economic Growth: Sources and Policies
 Chapter 10: Long-run Economic Growth: Sources and Policies Yulei Luo SEF of HKU February 13, 2012 Learning Objectives 1. Define economic growth, calculate economic growth rates, and describe trends in
Demographic Changes in the GCC Countries: Reflection and Future Projection
 Models and Systems of Elderly Care Demographic Changes in the GCC Countries: Reflection and Future Projection Abdulrazak Abyad A. Abyad, MD, MPH, MBA, DBA, AGSF, AFCHSE CEO, Abyad Medical Center, Lebanon.
The Demography of the Labor Force in Emerging Markets
 The Demography of the Labor Force in Emerging Markets David Lam I. Introduction This paper discusses how demographic changes are affecting the labor force in emerging markets. As will be shown below, the
Human Development Indices and Indicators: 2018 Statistical Update. Pakistan
 Human Development Indices and Indicators: 2018 Statistical Update Briefing note for countries on the 2018 Statistical Update Introduction Pakistan This briefing note is organized into ten sections. The
ASSESSING THE ECONOMIC IMPACT OF FOREIGN WORKERS IN MALTA
 ASSESSING THE ECONOMIC IMPACT OF FOREIGN WORKERS IN MALTA Article published in the Quarterly Review 2016:1, pp. 39-44 BOX 3: ASSESSING THE ECONOMIC IMPACT OF FOREIGN WORKERS IN MALTA 1 Between the late
Poverty in the Third World
 11. World Poverty Poverty in the Third World Human Poverty Index Poverty and Economic Growth Free Market and the Growth Foreign Aid Millennium Development Goals Poverty in the Third World Subsistence definitions
A Barometer of the Economic Recovery in Our State
 THE WELL-BEING OF NORTH CAROLINA S WORKERS IN 2012: A Barometer of the Economic Recovery in Our State By ALEXANDRA FORTER SIROTA Director, BUDGET & TAX CENTER. a project of the NORTH CAROLINA JUSTICE CENTER
Chile s average level of current well-being: Comparative strengths and weaknesses
 How s Life in Chile? November 2017 Relative to other OECD countries, Chile has a mixed performance across the different well-being dimensions. Although performing well in terms of housing affordability
Ghana Lower-middle income Sub-Saharan Africa (developing only) Source: World Development Indicators (WDI) database.
 Source: World Development Indicators (WDI) database.") Knowledge for Development Ghana in Brief October 215 Poverty and Equity Global Practice Overview Poverty Reduction in Ghana Progress and Challenges A tale of success Ghana has posted a strong growth performance
Knowledge for Development Ghana in Brief October 215 Poverty and Equity Global Practice Overview Poverty Reduction in Ghana Progress and Challenges A tale of success Ghana has posted a strong growth performance
ECON European Economic History The Industrial Revolution John Lovett $1,600 $1,400 $1,200. (Real GDP/capita) $1,000 $800 $600 $400 $200 $ 0
 $1,000 $800 $600 $400 $200 $ 0") ECON 343 European Economic History The Industrial Revolution John Lovett Exam 3 Code Name: In 28 we cover Perry et al instead. Objective Section: 7 pts, 2.5 points each unless noted. ( points This is just
ECON 343 European Economic History The Industrial Revolution John Lovett Exam 3 Code Name: In 28 we cover Perry et al instead. Objective Section: 7 pts, 2.5 points each unless noted. ( points This is just
Population Aging, Immigration and Future Labor Shortage : Myths and Virtual Reality
 Population Aging, Immigration and Future Labor Shortage : Myths and Virtual Reality Alain Bélanger Speakers Series of the Social Statistics Program McGill University, Montreal, January 23, 2013 Montréal,
CHINA S ONE-CHILD POLICY
 Sinology by Andy Rothman 5 December 1 a Last year s decision to relax China s onechild policy effectively ended one of the most draconian examples of government social engineering ever seen. a But, contrary
Rural Virginia: Issues and Opportunities
 Rural Virginia: Issues and Opportunities Sometimes a picture truly is worth a thousand words. This presentation is a companion piece to the final report of the Rural Virginia Prosperity Commission (RVPC)
How s Life in Norway?
 How s Life in Norway? November 2017 Relative to other OECD countries, Norway performs very well across the OECD s different well-being indicators and dimensions. Job strain and long-term unemployment are
Industrial Development
 Industrial Development Rapid growth 1865 1914 Abundance of cheap natural resources Large pools of labor immigrants Largest free trade market in the world Capital, no government regulation New technological
Development in Migration and Remittance Flows Among FSM Migrants and their Socioeconomic Effects
 Development in Migration and Remittance Flows Among FSM Migrants and their Socioeconomic Effects 2016 Pacific Update Conference July 19, 2016 Michael J. Levin Independent Consultant Remittance Flows Differ
Japan s average level of current well-being: Comparative strengths and weaknesses
 How s Life in Japan? November 2017 Relative to other OECD countries, Japan s average performance across the different well-being dimensions is mixed. At 74%, the employment rate is well above the OECD
Human Development Indices and Indicators: 2018 Statistical Update. Cambodia
 Human Development Indices and Indicators: 2018 Statistical Update Briefing note for countries on the 2018 Statistical Update Introduction Cambodia This briefing note is organized into ten sections. The
Human Development Indices and Indicators: 2018 Statistical Update. Indonesia
 Human Development Indices and Indicators: 2018 Statistical Update Briefing note for countries on the 2018 Statistical Update Introduction Indonesia This briefing note is organized into ten sections. The
MACROECONOMICS. Key Concepts. The Importance of Economic Growth. The Wealth of Nations. GDP Growth. Elements of Growth. Total output Output per capita
 MACROECONOMICS AND THE GLOBAL BUSINESS ENVIRONMENT The Wealth of Nations The Supply Side PowerPoint by Beth Ingram adapted by R Helg Copyright 2005 John Wiley & Sons, Inc. All rights reserved. 3-2 Key
How s Life in Canada?
 How s Life in Canada? November 2017 Canada typically performs above the OECD average level across most of the different well-indicators shown below. It falls within the top tier of OECD countries on household
Qatar. Switzerland Russian Federation Saudi Arabia Brazil. New Zealand India Pakistan Philippines Nicaragua Chad Yemen
 Figure 25: GDP per capita vs Gobal Gender Gap Index 214 GDP GDP per capita per capita, (constant PPP (constant 25 international 211 international $) $) 15, 12, 9, 6, Sweden.5.6.7.8.9 Global Gender Gap
The Economics of Immigration. David Card, UC Berkeley
 The Economics of Immigration David Card, UC Berkeley Background immigration is a defining issue of the populist movement in US, UK, and Europe (Brexit/Trump/right-wing parties not yet as divisive in Canada,
The Future of Inequality: The Other Reason Education Matters So Much
 The Future of Inequality: The Other Reason Education Matters So Much The Harvard community has made this article openly available. Please share how this access benefits you. Your story matters. Citation
Labour market of the new Central and Eastern European member states of the EU in the first decade of membership 125
 Labour market of the new Central and Eastern European member states of the EU in the first decade of membership 125 Annamária Artner Introduction The Central and Eastern European countries that accessed
Automation Biased Technology and Employment Structures in China: 1990 to 2015
 Preliminary Draft Automation Biased Technology and Employment Structures in China: 1990 to 2015 Peng Ge School of Labor and Human Resources, Renmin University of China Wenkai Sun School of Economics, Renmin
Rural and Urban Migrants in India:
 Rural and Urban Migrants in India: 1983 2008 Viktoria Hnatkovska and Amartya Lahiri This paper characterizes the gross and net migration flows between rural and urban areas in India during the period 1983
WORLD VIEWS & HUMAN POPULATION
 WORLD VIEWS & HUMAN POPULATION WORLD VIEW HOW AN INDIVIDUAL THINKS EARTH S NATURAL RESOURCES SHOULD BE USED BY HUMANS. THERE ARE 2 TYPES: CORNUCOPIANISM & ENVIRONMENTALISM NATURAL RESOURCES ANY MATERIALS
The Second Industrial Revolution 13.1
 The Second Industrial Revolution 13.1 Things to know... Westerners in the 1800s worshiped progress due to the amazing material growth from the Second Industrial Revolution. Steel, chemicals, electricity,
The Personal. The Media Insight Project
 The Media Insight Project The Personal News Cycle Conducted by the Media Insight Project An initiative of the American Press Institute and the Associated Press-NORC Center for Public Affairs Research 2013
Human development in China. Dr Zhao Baige
 Human development in China Dr Zhao Baige 19 Environment Twenty years ago I began my academic life as a researcher in Cambridge, and it is as an academic that I shall describe the progress China has made
CURRENT ANALYSIS. Growth in our own backyard... March 2014
 93619 CURRENT ANALYSIS March 14 Composition of the Canadian population % of total adult population 15+ 8 6 4 2 14.1.9 14.9 42.5 * Labour Force Participation Rate % of Population in the Labour Force 69
How s Life in Germany?
 How s Life in Germany? November 2017 Relative to other OECD countries, Germany performs well across most well-being dimensions. Household net adjusted disposable income is above the OECD average, but household
Survey sample: 1,013 respondents Survey period: Commissioned by: Eesti Pank Estonia pst. 13, Tallinn Conducted by: Saar Poll
 Survey sample:,0 respondents Survey period:. - 8.. 00 Commissioned by: Eesti Pank Estonia pst., Tallinn 9 Conducted by: Saar Poll OÜ Veetorni, Tallinn 9 CHANGEOVER TO THE EURO / December 00 CONTENTS. Main
Assuming the Future: Evaluating World Population Projections
 Assuming the Future: Evaluating World Population Projections By Joseph Chamie Extended Abstract World population, now at 7 billion, is expected to be nearing stabilization at 10 billion by the end of the
ECONOMIC GROWTH* Chapt er. Key Concepts
 Chapt er 6 ECONOMIC GROWTH* Key Concepts The Basics of Economic Growth Economic growth is the expansion of production possibilities. The growth rate is the annual percentage change of a variable. The growth
CAMBODIA SYSTEMATIC COUNTRY DIAGNOSTIC Public Engagement
 CAMBODIA SYSTEMATIC COUNTRY DIAGNOSTIC Public Engagement Nov Dec 2016 Contents Objectives of the Engagement Country Context Main research questions I. What are the challenges to sustaining economic growth?
HOW ECONOMIES GROW AND DEVELOP Macroeconomics In Context (Goodwin, et al.)
") Chapter 17 HOW ECONOMIES GROW AND DEVELOP Macroeconomics In Context (Goodwin, et al.) Chapter Overview This chapter presents material on economic growth, such as the theory behind it, how it is calculated,
Chapter 17 HOW ECONOMIES GROW AND DEVELOP Macroeconomics In Context (Goodwin, et al.) Chapter Overview This chapter presents material on economic growth, such as the theory behind it, how it is calculated,
Unit 1 Population dynamics
 Unit 1 Population dynamics Dynamics continually changing Population is the centre around which human geography revolves. Because populations change constantly over time it is necessary for geographers
Financed by the European Commission - MEDA Programme
 European Commission EuropeAid Cooperation Office Financed by the European Commission - MEDA Programme Cooperation project on the social integration of immigrants, migration, and the movement of persons
The Economic Benefits of Passing the DREAM Act
 AP PHOTO/RICH PEDRONCELLI The Economic Benefits of Passing the DREAM Act Juan Carlos Guzmán and Raúl C. Jara October 2012 WWW.AMERICANPROGRESS.ORG FAST FACTS How the DREAM Act helps the economy Passing
Rural and Urban Migrants in India:
 Rural and Urban Migrants in India: 1983-2008 Viktoria Hnatkovska and Amartya Lahiri July 2014 Abstract This paper characterizes the gross and net migration flows between rural and urban areas in India
Visi n. Imperative 6: A Prosperous Economy
 Imperative 6: A Prosperous Economy North Carolina 20/20: Report of the North Carolina Progress Board 6.1 2 2 Visi n North Carolina s growing, diversified economy is competitive in the global marketplace.
WINNERS AND LOSERS: THE FUTURE OF WORK
 WINNERS AND LOSERS: THE FUTURE OF WORK Ruth Milkman, CUNY Graduate Center (USA) Symposium on New Social Inequalities and the Future of Work 19 June 2018, The University of Queensland TECHNOLOGICAL THREATS
Chapter 11: Long-run Economic Growth: Sources and Policies
 Chapter 11: Long-run Economic Growth: Sources and Policies Yulei Luo SEF of HKU February 25, 2013 Learning Objectives 1. Define economic growth, calculate economic growth rates, and describe trends in
Rewriting the Rules of the Market Economy to Achieve Shared Prosperity. Joseph E. Stiglitz New York June 2016
 Rewriting the Rules of the Market Economy to Achieve Shared Prosperity Joseph E. Stiglitz New York June 2016 Enormous growth in inequality Especially in US, and countries that have followed US model Multiple