PROGRAM ON HOUSING AND URBAN POLICY
|
|
|
- Madison Edwards
- 6 years ago
- Views:
Transcription
1 Institute of Business and Economic Research Fisher Center for Real Estate and Urban Economics PROGRAM ON HOUSING AND URBAN POLICY WORKING PAPER SERIES WORKING NO. W PUBLIC TRANSIT AND THE SPATIAL DISTRIBUTION OF MINORITY EMPLOYMENT: EVIDENCE FROM A NATURAL EXPERIMENT These papers are preliminary in nature: their purpose is to stimulate discussion and comment. Therefore, they are not to be cited or quoted in any publication without the express permission of the author. By Harry J. Holzer John M. Quigley Steven Raphael April 2002 UNIVERSITY OF CALIFORNIA, BERKELEY
2 April 2002 Public Transit and the Spatial Distribution of Minority Employment: Evidence from a Natural Experiment Harry J. Holzer Public Policy Institute Georgetown University Hholzer@ui.urban.org John M. Quigley Department of Economics and Goldman School of Public Policy University of California, Berkeley quigley@econ.berkeley.edu Steven Raphael Goldman School of Public Policy University of California, Berkeley raphael@socrates.berkeley.edu We thank Eugene Smolensky and Michael Stoll for their very helpful comments and suggestions. This research was supported by the University of California Transportation Center, the Berkeley Program on Housing and Urban Policy, the Russell Sage Foundation, and the National Science Foundation (grant SBR ).
3 Abstract A recent expansion of the San Francisco Bay Area s heavy rail system represents an exogenous change in the accessibility of inner-city minority communities to a concentrated suburban employment center. We evaluate this natural experiment by conducting a two-wave longitudinal survey of firms, with the first wave of interviews conducted immediately prior to the opening of service and the second wave approximately a year later. We compare within-firm changes in the propensity to hire minority workers for firms located near the station to those located further away, and we also estimate the effect of employer distance to the new stations on changes in propensity to hire minorities. Our results indicate a sizable increase in the hiring of minority workers, particularly Latinos, near the new stations. Keywords: Minority Employment, Spatial Mismatch, Reverse Commuting JEL Codes: J15, J61, R12, R41
4 1. Introduction Racial segregation in housing is a persistent and salient characteristic of American metropolitan areas (Massey and Denton 1993). The labor market implications of racial segregation offer one explanation for persistent wage and employment rate differences between minority and non-minority workers: the racial segregation of minorities in central areas together with the dispersion of metropolitan employment isolates low- and semi-skilled minority workers from suburban employment opportunities. The resulting excess supply of inner-city labor drives down wages or, to the extent that wages are rigid, employment levels in urban neighborhoods. Public transportation systems designed to facilitate reverse commuting from inner-city neighborhoods to suburban employment centers provide one policy response. Advocates for these policies draw support from research demonstrating the importance of transportation barriers in limiting the employment opportunities available to minority workers. Several studies have found that firms located in the suburbs and/or located far from public transit stops are relatively less likely to employ minority workers (Holzer and Ihlanfeldt 1996; Ihlanfeldt and Young 1996; Raphael, Stoll, and Holzer 2000). In addition, researchers have found strong positive effects of car ownership on the likelihood of being employed, with particularly large effects for minority workers and individuals on public assistance (O Regan and Quigley 1999; Raphael and Stoll 2000). This research is instructive, but drawing causal inferences from these studies requires making strong identifying assumptions. For example, interpreting the effect of the proximity of employers to transit stops on the likelihood of hiring minority workers as causal requires the assumption that firms choose locations without regard to their proximity to regional transit systems. On the contrary, employers who rely upon low-skilled, transit-dependent labor may, for this reason, choose locations near transit stops. If minority
5 2 workers are disproportionately represented in the low-skilled labor pool, then firms located nearer to transit stops may be observed to employ minorities at relatively high rates even when transportation access has no effect on minority hiring. Alternatively, firms that wish to avoid minority applicants may choose locations distant from transit stops, thus inducing a spurious correlation between proximity to public transit and the likelihood of hiring minorities. No labor market studies have resolved this issue in a satisfactory way. Indeed, no study has identified a clear exogenous source of variation in spatial access to employment opportunities. In this paper, we evaluate a natural experiment created by an expansion of the San Francisco Bay Area s heavy rail system that provides a truly exogenous change in the accessibility of inner-city minority communities to a concentrated suburban employment center. In May of 1997, the Bay Area Rapid Transit (BART) system extended services to a rapidly expanding region in the eastern suburbs of the Oakland Primary Metropolitan Statistical Area (PMSA). The new BART line provides a direct public-transit link between the predominantly white, high-growth, and low-unemployment suburban cities of Oakland s eastern suburban ring and the metropolitan area s largely minority, low-growth, and high-unemployment urban core. We conducted a two-wave longitudinal survey of firms located in proximity to stations along the new BART line. We conducted the first wave of interviews immediately prior to the commencement of service in 1997, and the second wave approximately one year later. From these surveys, we calculate within-firm changes in the propensity to hire minority workers, as measured by the race and ethnicity of the person hired most recently, and we compare these changes for firms located near the station to those located further away. The relative change in the propensity to hire minority workers for firms near the
6 3 station provides a difference-in-difference estimate of the effect of the service expansion. We also use parametric methods to test for an effect of distance from the new stations on the change in the propensity to hire minority workers after adjusting for several firm characteristics. The results indicate a consistent, sizable increase in the relative employment of minority workers near the station. We find rather large separate effects upon the propensity to hire blacks and on the propensity to hire Latinos. 2. Spatial Mismatch and the Role of Transportation Barriers While the spatial concentration of unemployment, joblessness, and poverty in predominantly minority and urban neighborhoods is well documented (Ihlanfeldt 1992; Jargowsky 1997; Wilson 1987), there is no consensus about causes. On the one hand are explanations where space per se does not exert an independent effect on outcomes. For example, equilibrium theories of socioeconomic housing segregation suggest that when the income-elasticity of housing demand exceeds the income-elasticity of marginal commuting costs, low-income households will concentrate in urban centers (Muth 1969). On the other hand, several spatial explanations propose a direct causal link between residential location and socioeconomic outcomes. For example, residents of neighborhoods with high rates of joblessness may have poor access to informal employment information networks (O Regan and Quigley 1996). Moreover, the concentration of poverty may adversely affect skill acquisition, outlook, and the availability of role models, all factors that are likely to affect employability (Wilson 1987, 1996). In this latter vein, several studies document the relative scarcity of employment in minority
7 4 neighborhoods 1 and the potential barriers to residential and commute mobility. Barriers to residential mobility include racial discrimination in suburban housing markets, particularly against blacks (Yinger 1995), and suburban land-use policy that artificially restricts the supply of affordable housing (Fischel 1985). Barriers to reverse commuting include low minority car-ownership rates (Holzer, Ihlanfeldt, and Sjoquist 1994; Raphael and Stoll 2000) and weak public transit links between suburbs and urban centers (Hughes and Sternberg 1992). Combined, these factors restrict the geographical opportunities of inner-city workers. Moreover, if labor demand relative to supply is lower in urban areas, suburban wage and employment premiums will result. For the most part, this body of research focuses on demonstrating a relationship between measures of spatial accessibility and the employment outcomes of low-skilled minority workers. 2 Several studies find significant and strong effects of spatial access on the employment or minorities, 1 Kasarda (1985, 1989) documents the post-war decline in the employment bases of U.S. central cities. Raphael (1998a, 1998b) demonstrates the relatively inferior access of minority youth to high employment-growth areas within the San Francisco CMSA. Stoll, Holzer, and Ihlanfeldt (2000) show that while low-skilled workers are disproportionately concentrated in minority neighborhoods, low-skilled employment opportunities are disproportionately concentrated in non-minority suburban communities. Finally, Raphael and Stoll (2000) show that, for all but a handfull of small PMSAs, the spatial dissimilarity between black residences and employment sites substantially exceeds the dissimilarity between the residences of whites and their employment opportunities. 2 Researchers have evaluated the mismatch hypothesis using several approaches. One approach compares labor market outcomes of inner city residents to those of otherwise similar suburban residents (Raphael 1998b; Stoll 1999a). Others analyze the intra-metropolitan variation in labor demand using such measures as the mean commute time of neighborhood low-wage workers (Ihlanfeldt 1992; Ihlanfeldt and Sjoquist 1990, 1991), spatial proximity to total jobs (Ellwood 1986; Leonard 1985; O Regan and Quigley 1996), as well as spatial proximity to areas of high net employment growth (Raphael 1998a; Mouw 2000). An alternative approach exploits cross-city variation in spatial conditions (Cutler and Glaeser 1997; Weinberg 2000; Raphael and Stoll 2000). For an extensive review of this research, see Ihlanfeldt and Sjoquist (1998).
8 5 especially blacks (Ihlanfeldt and Sjoquist 1990; Mouw 2000; Raphael 1998a; Weinberg 2000), but the mechanisms by which urban space affects accessibility are unclear. However, designing appropriate policy responses requires precise knowledge. For example, if commute costs reduce employment, policies aimed at facilitating reverse commutes will be effective. Alternatively, if the spatial isolation of minority workers restricts access to the informal job information networks that come with residence in a local market, then transportation policy will be less effective. Some recent research assesses the relative importance of the alternative effects of distance on accessibility. In a study of four metropolitan areas, Holzer and Ihlanfeldt (1996) estimated the effects of the spatial proximity of firms to public transportation and to black residential communities on the propensity of these firms to hire black workers. Proximity to black neighborhoods and public transit stops significantly affected the racial composition of a firm s applicant pool and workforce. In addition, the race of the person in charge of hiring and the percentage of customers that are black affected employment outcomes. The findings of this study suggest that both transportation barriers and discrimination in suburban job markets limit the accessibility of black workers to suburban jobs. In an analysis of fast-food establishments, Ihlanfeldt and Young (1996) found that firm proximity to the stations of Atlanta s commuter rail system and distance from the central city had strong effects on the racial composition of a firm s workforce. The manager s race as well as the racial composition of the firm s clientele also seemed to have substantial effects. These studies make important contributions in identifying the specific determinants of racial employment distributions. However, there are alternative explanations for all these findings; explanations in which spatial accessibility plays no causal role in determining outcomes. For example, firms that use low-
9 6 skilled labor intensively may consider the spatial accessibility of low-skilled workers when choosing a location. Given that low-skilled workers are relatively transit-dependent, 3 these employers are more likely to choose locations near public transit stops. Since minority workers are disproportionately represented among the low-skilled, a spurious correlation between minority hiring rates and proximity to public transit systems will arise. Alternatively, discriminating employers who wish to avoid minority workers may purposefully locate far from minority neighborhoods and in locations that are difficult to reach by public transit. 4 This geographic sorting would limit the ability of transportation and residential mobility policy to improve the accessibility of minority workers to suburban jobs. 3. Description of the Study Area, the Employer Survey, and the Empirical Methodology In this study, we analyze the effect of an exogenous change to a commuter rail system on the propensity of firms located near a new transit facility to hire minority workers. We assess whether firms 3 Raphael and Stoll (2000) show that car-ownership rates increase steeply with age and educational attainment. These patterns exist within racial and ethnic groups, though ownership rates are uniformly lower for blacks and Latinos relative to whites. 4 Several studies attempt to assess whether suburban employers are more likely to discriminate against minorities. Holzer (1996) and Holzer and Reaser (2000) show that the propensity to hire black workers relative to their application rates is lower at suburban firms, suggesting that suburban firms are less likely to hire blacks, holding supply constant. Raphael, Stoll, and Holzer (2000) compare the central city/suburban difference in the propensity to hire blacks at firms where whites are in charge of hiring to that at firms where blacks are in charge of hiring. The authors argue that if blacks firms to not discriminate against black workers, than the geographic difference in the propensity to hire blacks among black firms provides a baseline estimate of the effect of space against which one can compare the analogous difference for white firms. The authors find that both white and black suburban firms are considerably less likely to hire blacks than are their central city counterparts and that the geographic differences within firm types are comparable in magnitude. A study by Stoll (1999b) also addresses this issue. In an analysis of the productivity of spatial job search, the author finds that the return to spatial search is higher for blacks than for whites, suggesting that employers located far from black communities are willing to hire black workers.
10 7 located in the eastern suburbs of Oakland, California increased their hiring of minorities into low-skilled jobs after a BART extension was completed, one that greatly facilitated reverse commuting. We first present a description of the extension and the areas connected by the new line. We then discuss our employer survey and the research design intended to test for an effect of the expansion. A. San Francisco Rail Transport and the Areas Connected by the Service Extension The BART system, in operation since 1972, serves San Francisco County on the west side of the San Francisco Bay, and Alameda and Contra Costa Counties east of the bay. The 13.5 mile Dublin/Pleasanton extension is one of two recent expansions of the original 72 mile system. Planning for the extension began in the early 1980s with the efforts of the Bay Area Rapid Transit District to acquire land for the right-of-way. Funding did not materialize until 1986 when Alameda County voters approved a sales tax intended to fund this and other regional transportation projects (Bay Area Rapid Transit District 1983, 1987). Construction commenced in 1991 and transit services began in May of Figure 1 presents a map of the BART lines running through the Oakland metropolitan area. The new line adds two stations: one in Castro Valley located near the urban core and one in the Dublin/Pleasanton area located on the outer suburban ring. The new stations are separated by a 10 mile stretch of undeveloped hilly land. From the Oakland central city, 5 the line travels south along the existing right-of-way, turns east at the Bay Fair station directly south of Oakland, and then travels along U.S. Highway I580 out to the Dublin/Pleasanton area. 5 The full path of the Dublin line runs from the city of Dublin to Daly City in South San Francisco. This path is meant to facilitate the San Francisco commutes of those residents in the far suburbs along the north-south corridor near U.S. Highway I680.
11 8 This new line is the first rail connection between two areas of the region that differ significantly in their patterns of economic growth, their racial and ethnic composition, and the socioeconomic status of their resident populations. The first area is a low-growth, predominantly minority region of the PMSA encompassing the city of Oakland and the cities immediately south of Oakland. The second area is a highgrowth region of the PMSA along the eastern suburban ring. Figure 2 presents several maps of the 1990 spatial distributions of employment and population. 6 The distribution of total employment in Map A indicates large concentrations of employment along the bay shore and in the eastern suburbs. There is a dense suburban employment node in the area surrounding the new Dublin/Pleasanton station. Map B shows that much of the new employment added during the 1980s was concentrated along the eastern suburban ring. There were relatively few jobs added in census tracts located along the Bay shore. In contrast, employment growth around the Dublin/Pleasanton station was substantial. The distribution of job losses (shown in Map C), on the other hand, is the geographic mirror image of Map B. Nearly all of the tracts in the Oakland PMSA that experienced net job loss are located in the city of Oakland or in the cities immediately south of Oakland. In contrast, none of the census tracts located around the Dublin/Pleasanton station experienced net employment losses. 7 6 Tract-level employment data for 1980 and 1990 come from the Association of Bay Area Governments. Tracts experiencing no net employment gain are coded to zero for Map B while tracts experiencing no net employment loss are coded to zero in Map C. 7 In an aggregate analysis of these two regions, Raphael (1998b) shows that the area along the Bay shore experienced net job loss and slight population gains during the 1980s while the area along the I680 corridor experienced net employment growth that exceeded population growth.
12 9 These two areas also differ in the racial and ethnic composition of their residents. Maps D and E show the spatial distributions of the black and Latino population. 8 The black population resides predominantly in a large geographic cluster beginning in east Oakland, extending northwest into downtown Oakland, and then extending directly north into the cities of Berkeley and Richmond. The Latino population is more evenly distributed along the bay shore, extending south from downtown Oakland to the city of Fremont along the bay. There are few Latinos and blacks residing in the areas surrounding the Dublin/Pleasanton station. Comparisons of Maps D and E with a map of the distribution of non-latino whites confirms that blacks and Latinos are highly segregated from whites. 9 Finally, there are large differences in the averages of residents socioeconomic characteristics in the region surrounding the new BART station and the area along the bay shore. Table 1 presents a comparison of several socioeconomic characteristics of census tracts located within the vicinity of the Dublin/Pleasanton BART station with the rest of Alameda County. 10 The area around the new station has below-average unemployment and poverty rates, a below-average proportion of households headed by 3A. 8 Tract level population data for 1990 comes from the 1990 Census Summary Tape Files (STF) 9 Non-Latino whites basically reside where blacks and Latinos do not. A map of the white residential distribution looks quite similar to the map of total employment in Map A, but with blank spaces in the predominantly black and Latino census tracts depicted in Maps D and E. 10 Calculations in this table are based on data from the 1990 Census STF 3A files. The remainder of Alameda county includes the area surrounding the portion of the BART line running along the bay, all of the city of Oakland, and the cities of Berkeley, Alameda, and Albany. To be sure, the means presented for the rest of the county will provide over-estimates of income levels and under-estimates of poverty (and all of their correlates) for the predominantly minority areas displayed in Maps D and E of Figure 2, due to the inclusion of the relatively wealthy white neighborhoods in the hills and flats at the foot of the hills.
13 10 a female head or receiving public assistance, and above-average median household income and per-capita income. The extent to which the new line improved access for minority workers to the Dublin/Pleasanton area depends on the extent to which the new line lowered the costs of reverse commuting and increased the flexibility of the transit system. The costs of a public transit commute include the monetary costs, the costs of line-haul or in-vehicle travel time, and collection, transfer, and distribution time costs. The degree of flexibility depends on headway times (times between successive trains or buses), hours and days of operation, and reliability. Commuting costs are important since high transportation costs lower the benefits of distant employment opportunities. The flexibility of the system alone may determine whether inner-city workers can take and retain distant suburban jobs. Commuting to a suburban job with non-standard work hours may be infeasible for a transit-dependent, inner-city worker if services are offered infrequently outside peak-period hours. 11 The effects of the new rail line on the reverse commute to the eastern Oakland suburbs is summarized in appendix Table A1. Consider the commute to the Dublin/Pleasanton area at the time the new line was opened. Prior to May 1997, there were two options. First, three BART Express shuttle buses leaving from the Bay Fair station provided weekday service to the cities of Dublin, Pleasanton, and Livermore. Two of the shuttles provided service during peak-period hours only. The third line provided 11 There is some evidence that relatively low-skilled minority workers are less likely to work standard hours. Hamermesh (1996) shows that the young and less-educated are more likely to work the shifts from 7 PM to 10 PM and from 10PM to 6AM. In addition, the author shows that black males are significantly more likely to work these non-standard hours. O Regan and Quigley (1999) present similar results for single women.
14 11 weekday-only service between 6 am and 8 pm, with headway times ranging from 20 to 40 minutes during peak-period hours and one hour during off-peak hours. Second, a shuttle bus from the Hayward station (south of the Bay Fair station) provided weekday and weekend service to Pleasanton. Headway times ranged from 30 to 40 minutes during the weekdays and one hour during the weekends. A potential commuter not residing within the vicinity of these two stations would need to take a bus or train to the station and then transfer to a shuttle. The new BART line made reverse commuting much easier. Line-haul commute times from the Bay Fair station were reduced from 20 to 22 minutes on BART Express buses, to 15 minutes by train, and the approximate 10 minute transfer at the Bay Fair or Hayward stations was eliminated. In addition, for many commuters, the out-of-pocket costs declined. 12 Finally, the hours of operation are longer and the headway times shorter on the new line relative to BART Express connections. Thus, the extension improved the reverse commute services from a predominantly poor, minority, high-unemployment region to a relatively wealthy, non-minority, low-unemployment area. B. The Employer Survey and the Natural Experiment The Dublin/Pleasanton extension provides a unique opportunity to study the effect of transportation improvements on the accessibility of minority workers to suburban employment opportunities. The service improvements for reverse commuters noted above were largely the by products of other transportation goals. The primary objective of the service extension was to facilitate the in-bound San Francisco commute 12 While the current monetary costs of riding BART from Bay Fair to the end of the Dublin line is the same as the cost of an Express bus ($1.10), the costs declined for commuters from stations further north that required a transfer at the Bay Fair station (the magnitude depends on the station of origin).
15 12 of suburban residents rather than the reverse commute of urban residents. 13 In particular, the service extension was not a response to excess labor supply in the area s urban core. Hence, the extension in service really is exogenous to the processes determining the spatial distribution of minority employment. To evaluate the affects of this transport investment on the accessibility of minority workers to employers located in the eastern suburbs of the PMSA, we conducted a two-wave longitudinal survey of establishments located in the areas surrounding the Dublin line. The survey design and instrument are based on the Multi-City Survey of Urban Inequality described in Holzer (1996). We drew a sample of establishments in the following manner. We first defined three geographic strata of establishments based on postal codes. These strata are (1) the city of Castro Valley (encompassing the new Castro Valley station), (2) the cities of Dublin and Pleasanton (surrounding the station at the end of the line), and (3) the cities of Livermore, San Ramon, and Danville. All employers surveyed were located within an approximately 12 mile radius of one of the new BART stations. 14 To ensure detection of any change in hiring near the new stations, we over-sampled firms located in the Castro Valley and Dublin/Pleasanton strata. Within each geographic stratum, we then defined three employer size categories (establishments with 1 to 19 employees, 20 to 99 employees, and 100 plus employees) and we measured employment at 13 Several factors indicate that this is the case. For example, the first train of the day in the in-bound direction leaves earlier than the first train of the day making the reverse commute. In addition, the peakperiod congestion (that the extension was designed to alleviate) flows from the suburbs to the city during the morning rush hour and from the city to the suburbs in the evening rush hour. 14 Employers located in the Castro Valley and Dublin/Pleasanton strata are located within six miles of their respective stations while employers in the Livermore/San Ramon/Danville stratum are located 6 to 12 miles from the Dublin/Pleasanton station.
16 13 establishments of each size category. 15 Within each geographic area and size category, we sampled establishments in proportion to the percentage of workers in each area employed by establishments of each category. 16 The first wave of the longitudinal survey was conducted in April and May of 1997, in the fourweek period preceding the opening of the new line. The second-wave survey was conducted between April and July of 1998, approximately one year later. Telephone interviews were sought with the person in charge of hiring at each sampled establishment. In designing the survey, we were cognizant of the fact that employer response rates to surveys about hiring practices and outcomes are typically low, even for telephone surveys (Kling 1995). Hence, our instrument was brief and focused, and designed to primarily collect information on the establishment s more recent hire. In the first wave, we interviewed those employers who had filled a job vacancy within the last year that did not require a college degree. Of the 537 firms that passed this initial screen, 407 were successfully contacted be telephone. A key question in the interview inquired about the race and ethnicity of the most recent hire. 365 responses were obtained, and 248 of these responded to the second wave survey. 17 Of those providing complete information during the first wave, 248 Incorporated. 15 The aggregate employment measures by firm size were obtained from Survey Sampling 16 Within each geographic stratum/establishment-size cell, establishments were sampled at random. Our sample was purchased from Survey Sampling Incorporated, and the surveys were administered by the Institute for Public Policy and Social Research at Michigan State University. 17 In a follow up to the survey, each of the firms which had provided the race/ethnicity of the most recent hire in the first wave but which had refused to provide similar information in the second wave was contacted by one of us in an attempt to conduct the interview in person. Many of the interviewees expressed hostility about the content of the interview, many suggesting that they had been caught unprepared by the questions posed in the first wave. As a result, few of the non-responses to the second wave were converted to responses.
17 14 responded to the second wave survey. Of these 248 firms, a small number (13) did not hire a new worker during the intervening year, and 29 did not provide second-wave information on the race and ethnicity of the most recent hire. As summarized in Table 2, our final sample consists of 206 firms. A slightly larger proportion of observations were retained for firms located far from the station (61 percent) than were for firms located near the station (54 percent). Information necessary to assess whether sample attrition between the first and second waves alters the characteristics of the final analysis sample is presented in appendix Table A2. 18 The probabilities that the last worker hired was black or Latino are nearly identical for the two samples. Moreover, within areas there are no notable differences in the propensity to hire minority workers. Since these are our principal dependent variables, it is notable that the remaining establishments hired minorities prior to the service expansion at rates that are comparable to those observed in the complete first-wave sample. There are no substantial differences in recruitment methods used, qualifications required, and job tasks between the first wave sample and the final sample. In addition, distance from the station, the proportion of establishments contracting with the federal government, the percent of workers unionized, the industrial distributions, and the proportion of establishment in which the person in charge of hiring is either black or Latino are comparable across the samples. There are notable differences, however, in the size distributions 18 Table A2 presents a comparison of mean characteristics for establishments providing complete information in the first wave survey and establishments providing complete information to both the first and second wave surveys. Within each group, the samples are further subdivided by whether the establishment is located near one of the new stations. The first two variables indicate the race or ethnicity of the last hire. The second set of variables are basic establishment characteristics. The next two variables indicate whether the person in charge of hiring (the survey respondent) is black or Latino. These are followed by sets of dummy variables indicating recruitment methods used during the previous search, job qualifications demanded from applicants, and the daily job tasks for the most recent position filled.
18 15 of establishments. In the first wave sample, 65 percent of establishments employed fewer than 20 employees, while in the final sample the comparable figure is 46 percent. Hence, sample attrition was larger for small establishments. We employ a simple quasi-experimental design to investigate the effect of the expansion of the BART system upon the access of minority workers to job opportunities in the eastern ring of the metropolitan area. Define all establishments located within six miles of one of the new stations as members of the treatment group and all firms located more than six miles from the new stations as members of the control group. 19 For each firm, we calculate the before-after change in variables indicating that the last worker hired (1) is either black or Latino, (2) is black, and (3) is Latino and we compute the averages of these changes for our treatment and control groups. If the new line improved access to suburban employers, we should see relatively larger increases in the propensity to hire minority workers at firms located near the new stations. Using the change in the hiring outcomes for the control group firms as a benchmark intended to capture all other factors that change over the year, we calculate difference-indifference (DD) estimates of the transportation effect by subtracting the mean change for the control group establishments from the mean change for the treatment group establishments. A positive significant DD estimate indicates an accessibility effect of the transportation extension. We also test for a relationship between the change in the propensity to hire minority workers and distance from the station that adjusts for observable firm characteristics. Using linear regression models, we regress the change in the variable indicating the race/ethnicity of the most recent hire on linear distance street route. 19 Distance from the nearest BART station was coded in miles according to the shortest surface
19 16 from the station, observable establishment characteristics, and changes in hiring and recruiting methods. We also consider the appropriately specified multinomial choice model of firm hiring behavior. The specifications of these models are discussed in detail below, along with the presentation of the results. 4. Empirical Results A. Summary Results Figure 3 reports the relationship between the proximity of establishments to the new stations and the change in the variables indicating the race/ethnicity of the new hire. The figures are constructed as follows. We sort the sample in ascending order by distance from the nearest station. We then calculate a thirty-observation moving average of the change in the hiring variables. The figures report scatter plots of the thirty-observation moving averages against distance in miles from the station. 20 Figure 3A presents results for the change in the variable indicating that the last worker hired is black, Figure 3B present results for Latinos, and Figure 3C presents results for the change in the propensity to hire either blacks or Latinos. Figure 3A shows that there is no clear relationship between distance from the new stations and the change in the propensity to hire black workers. Establishments that are 3-6 miles away actually exhibit larger increases in the propensity to hire blacks than those within 3 miles. Moreover, establishments located more than 6 miles from the station, and especially 8-10 miles away, generally increased their hiring of black workers. In contrast, there is a strong negative relationship between the change in the propensity 20 Plots of the raw data against distance are difficult to visually interpret since the dependent variables only take on values of -1, 0, and 1. These moving averages are presented for descriptive purposes only.
20 17 to hire Latino workers and distance from the new stations. Figure 3B reports a general increase in the propensity to hire Latino workers at establishments within 6 miles of the station (especially within the first 2 miles) and a general decline in the propensity to hire Latinos at firms six or more miles away. In addition, within the set of establishments that are relatively near the station, there is a negative relationship between distance and the change in the propensity to hire Latinos. Hence, the figure suggests that the service extension improved the accessibility of Latinos to jobs in the area but not the accessibility of blacks. Interestingly, the plots in Figure 3 also suggest a greater increase in the hiring of blacks than Latinos in the overall area. The mean hiring rates by race in the data confirm this impression. For the sample with complete information in both waves, the hiring of blacks increased by about 30 percent, the hiring of Latinos was relatively unchanged, while the hiring of either blacks or Latinos increased by roughly 15 percent. 21 Since the period over which the two surveys were administered coincides with a major tightening of the labor market (both nationally and regionally), the relatively greater growth of black hiring in this area may well reflect a greater sensitivity of their hiring rates to labor market conditions. 22 However, the geographic distribution of these new hires appears to have been more affected by the new subway system among Latino workers than blacks. A comparison of Figures 3A and 3B also suggests that there may be inter-group competition 21 While these are sizable increases relative to the base hiring rates, these increases are only marginally significant, given the size of our sample. 22 The unemployment rate in the Oakland metropolitan area declined from 4.2 to 3.7 percent in the period between the two surveys. For evidence on the relatively strong sensitivity of black employment to local economic conditions see Bound and Holzer (2000).
21 18 between blacks and Latinos for jobs. The figures indicate that where there are increases in Latino hiring rates there are no increases (or even decreases) in black hiring rates, and visa versa. For example, within three miles of the new stations, the hiring of Latinos increased substantially while the hiring of blacks remained constant. More dramatically, within the area that is eight to ten miles from the new stations, black hiring rates increased while Latino hiring decreased. If these two distance profiles perfectly offset one another, there may be no relative increase in the hiring of minority workers (workers that are relatively under-represented among the residential populations of these areas) at establishments nearer to the new stations. Figure 3C presents a similar geographic profile for the change in the variable indicating that the last worker hired was either black or Latino. Defined in this manner, the figure indicates a clear increase in the hiring of minority workers at firms located within six miles of the station relative to firms located further away. Hence, the increases in hiring among Latinos near the new stations are not completely determined by substitution away from blacks among employers. Table 3 presents mean hiring rates for minority workers by survey wave and by whether the establishments are within six miles of the station. The table also presents before-after changes within areas, near-far differences within sample period, and DD estimates of the relative increase in the propensity to hire minority workers at firms near the station. The table presents three DD matrices using the entire sample and three matrices eliminating establishments located within Castro Valley. We present these additional calculations for several reasons. First, all of the firms in the Castro Valley area are located within approximately two miles of the station. Second, the Castro Valley station is located quite close to the urban areas along the bay shore. To be certain that the transportation effects do not arise solely from the
22 19 establishments located around the Castro Valley station, we present parallel estimation results in Table 3 (and in all tests that follow) omitting observations from this area. 23 For each sample, we present DD matrices for the variable indicating that the last worker hired is either black or Latino, the indicator for the last worker hired is black, and the indicator for the last worker hired is Latino. There are several patterns evident in Table 3 that are not revealed in Figures 3A through 3C. For instance, the pre-expansion hiring statistics indicate that Latinos were hired at a considerably higher rate than blacks even before the opening of the new stations. For firms near the new station sites, nearly 20 percent of newly hired workers were Latinos before the service extension compared with approximately 10 percent that were black workers. For firms located far from the station sites, approximately 32 percent of newly hired workers were Latinos compared with 10 percent that were black. These patterns are similar when we exclude observation located in Castro Valley. 24 Thus, neither blacks nor Latinos were more likely to be hired near the new stations than further away before they were constructed. In contrast, the hiring of Latinos increased more at locations near the new stations than at those further away after construction was completed, with roughly 30 and 21 percent of all new hires being Latino respectively at that time -- i.e., the hiring rates of Latinos rose near the stations and declined further away by approximately 10 percent (both significant at the 10 percent level). The hiring of blacks increased to 12 and 16 percent respectively in the same locations. 23 This restriction eliminates roughly 20 observations. 24 Both blacks and Latinos are hired at rates that exceed their representation in the residential populations (see Table 1). This likely reflects a focus of the survey about the hiring of workers into relatively unskilled (i.e., non-college) jobs.
23 20 In the lower right-hand corner of each sub-matrix, the table presents a DD estimate of the relative increase in the propensity to hire minority workers at firms located nearer to the new stations. This figure is calculated by subtracting the pre-post change in hiring patterns for distant establishments from the comparable change for establishments located near the new stations. The DD estimates are subject to standard tests for the statistical significance of the relative changes. For the variable indicating that the last worker hired was black or Latino, the estimate of the increase in the relative propensity to hire minorities near the station is for the full sample and for the sample eliminating the Castro Valley observations. If there were no effect of the improved transport system on minority hiring, we should expect to obtain these results only about 10 percent of the time (i.e., the p-values are 0.11 and 0.10, respectively). Again, the relative increase in the propensity to hire black workers is not significant among firms that are nearer to the new stations. This result holds in both samples. Finally, the DD estimates for the relative increase in the propensity to hire Latinos are large and significant. For the full sample, firms nearer to the station increase their hiring of Latinos by relative to firms far from the station while for the restricted sample, the comparable point estimate is Both estimates are highly significant and would occur only one time out of fifty by chance. By making some suburban jobs more accessible to urban Latinos, the new subway line has apparently raised the overall demand for Latino labor in the Oakland PMSA. What is the magnitude of this increase? According to the 1990 Census, the municipalities of Castro Valley and Dublin/Pleasanton accounted for about 11.5 percent of all jobs in Alameda county. If Latinos now attain roughly 10 percent more of those jobs than before, and if that group accounts for about 14 percent of all employment in the
24 21 county (based on their population share in Table 1), then the new employment opportunities constitute roughly an eight percent increase in the demand for Latino labor in Oakland. 25 Of course, any positive shift in the labor demand for a particular group can raise their wage levels and/or employment rates, with the exact effect depending on their labor demand and supply elasticities. 26 As noted earlier, net employment in the area under consideration does not appear to have risen for Latinos, since employment expansion near the new stations are roughly offset by their declines further out. 27 Consistent with the notion that labor supply for this group is relatively inelastic, the primary effect of the new subways appears to be lower commuting costs for Latinos, and therefore higher wages net of these costs. In contrast, while the new stations do not appear to have shifted labor demand for blacks, the overall net increase in their suburban employment noted above (that is likely attributable to the business cycle) suggests either more elastic labor supplied or a surplus of labor among that group before the increases occurred. B. Regression Results 25 These calculations assume that the hiring changes observed will be permanent, and reflect the new steady-state employment equilibrium that would ultimately be reached under these circumstances. They also assume stability in the new rates of hiring and employment between these different geographic areas over time. 26 In particular, the elasticities of wages and employment with respect to demand shifts should be 1/(E D +E S ) and E S /(E D +E S ), where E D and E S reflect labor demand and supple elasticities, respectively. 27 As of the 1990 Census, there were 58,000 jobs in the areas where the new subway stations were located and roughly 74,000 in the inaccessible areas. As the former areas have been growing somewhat more rapidly than the latter, the two areas are no doubt more comparable in employment today. Hence, similar increases and decreases in percentage terms constitute roughly offsetting changes in magnitudes as well. Of course, it is quite likely that at least some of the new employment for Latinos near the suburban subway stops went to those who had earlier worked in or nearer to the city of Oakland, who in turn might have been replaced by those who previously commuted by car to the more distant areas but no longer needed to.
25 22 The DD results confirm the findings presented visually; they also demonstrate that where there are visible transit effects, these effects are statistically significant. Since the DD estimates are based on changes in hiring patterns within establishments, they already account for any influence of establishment characteristics that do not change across waves. Nonetheless, there may be factors that change across waves and that do affect hiring outcomes. For example, establishments may change recruiting methods or qualification requirements in a manner that is either more or less likely to result in the hiring of a minority worker. Alternatively, the race of the person in charge of hiring may change between waves, with consequent effects on unobservable indirect recruiting opportunities. In addition, establishments with different fixed characteristics may respond differently (in terms of their hiring patterns) to the change in transportation infrastructure. Larger firms may be more likely than small firms to increase the hiring of minorities in response to an increase in minority application rates. Establishments that contract with the federal government may be more eager to hire out of the fresh applicant pool to meet federal equal employment opportunity requirements. If these variables differ systematically by distance from the new stations, the changes in hiring patterns may arise from factors other than the greater exposure of nearby firms to the transportation extension. To explore these possibilities, we estimate multivariate statistical models where the dependent variable is the change in the race/ethnicity of the most recent hire. Table 4 presents mean values for selected variables for the overall sample. Mean values are also presented by proximity to the stations. We use distance in miles from the station rather than the dichotomous dummy indicating within six miles (the implicit treatment used in the DD calculations). We include several variables as levels (using the preexpansion values) to test for differential responses by fixed establishment characteristics to the service
26 23 extension. This set of variables includes a dummy indicating whether the firm contracts with the federal government, the percent of non-managerial workers that are unionized, four establishment size dummies (the omitted category being less than 20 employees), and three industry classifications. Permitting establishment size to enter as levels in these regression models is particularly important, since the betweenwave attrition was not random with respect to size. If our results hold up after controlling for the differential hiring responses of establishments by size category, concerns over selection bias due to attrition are less salient. We also control for several variables that may change across waves. We include variables measuring changes in the race/ethnicity of the person in charge of hiring, changes in recruitment methods used in the search for the recently-hired employee, changes in the job qualifications that employers demand from applicants, and changes in the description of daily job tasks. Overall, the means in Table 4 indicate that a few fixed characteristics of establishments seem to vary with proximity to the new transit stations. Specifically, establishments located nearby and more likely to be unionized and to be in the trade sectors, while those located further away are more likely to be in manufacturing. We find little clear pattern of variation by proximity in the variables that change over time. Table 5 presents estimation results for the entire sample while Table 6 presents results omitting establishments in Castro Valley. For each of our dependent variables, we estimate three specifications. The first model regresses the change in the race/ethnicity of the most recent hire on distance in miles from the nearest station. The second specification adds all of the level variables listed in Table 4 and the two variables indicating a change in the race/ethnicity of the person in charge of hiring. The final specification adds all of the other change variables listed in Table 4. The first three regressions in each table present results where the dependent variable is the change in the variable indicating that the last hire is either black
27 24 or Latino. The next three regressions provide results for the change in the propensity to hire black workers while the final three regression provide results for the change in the propensity to hire Latinos. Controlling for the variables listed in Table 4 does not change the estimated effects of distance from the station. In the models where the dependent variable is the change in the propensity to hire blacks or Latinos, the negative effect of distance actually increases and becomes more significant as we expand the model specification. In both Tables 5 and 6, the distance effects are negative in the first two specifications and marginally significant. In the final specification, the distance effects become more negative and are significant at the 5 percent level. Again, we find no relationship between the change in the propensity to hire blacks and distance from the station. Finally, the distance effect for propensity to hire Latinos is large and significant at the 5 percent level in all models. 28 Only a few of the other variables included in the model specification are statistically significant. In several models, the percentage of workers that are unionized in the pre-expansion wave exerts a significant negative effect on the change in the propensity to hire minority workers, suggesting that unionized firms are less responsive to the transit innovation. The coefficients on the establishment-size dummies indicate that larger establishments are more likely to increase their hiring of minorities in response to the service extension, though none of these coefficients are statistically significant. Finally, we do not find significant 28 As is evident in Tables 5 and 6, the size of the sample used to estimate the regression models is smaller in the more complete specifications. This is an artifact of missing data for many of the variables listed in Table 4. To insure that the changing sample is not responsible for the distance effects evident in Table 5 and 6, we also estimated each model restricting the sample to those observations with complete information on all variables used in the final complete specification. Appendix Table A3 presents these alternative estimation results. We present only the distance parameters to conserve space. The distance effects using the restricted samples are nearly identical to the results presented in Tables 5 and 6.
28 25 effects of changes in the race/ethnicity of the person in charge of hiring on changes in the race/ethnicity of the most recent hire. This latter result, however, may arise because we observe very few changes in these variables across waves. C. Alternative estimates using a multinomial model We also estimated multinomial logit models using a more flexible specification to analyze the effects of the transit extension on firm propensities to hire minority workers. Specifically, define P White,i, P Black, i, and P Latino,i as the probability that the second-wave most recent hire for firm i is white, black, and Latino, respectively. The probability of hiring a black worker conditional on hiring either a black or white worker is given by P Black, i /(P White,i + P Black, i ) = F(â B X i ), where F(.) is the cumulative density function for this conditional probability. The comparable conditional probability for hiring a Latino worker is given by P Latino, i /(P White,i + P Latino, i ) = F(â L X i ). If we ssume that F(â B X i ) and F(â L X i ) are logistic cumulative distribution functions, than the parameter vectors, â L and â B, can be estimated using multinomial logit. We make use of the two-period structure of our data set by including a dummy variable indicating that the last worker hired in the first wave was black and a dummy variable indicating that the last worker hired in the first wave was Latino among the set of explanatory variables. Controlling for first wave outcomes completely summarizes all of the information that we have on the pre-expansion propensity of each firm to hire minority workers. 29 The other control variables are the second-wave values of the all of the explanatory variables listed in Table 4. Finally, our key explanatory variable is the firm s distance in miles from the new stations. 29 The changes specification presented in Tables 5 and 6 basically constrains the coefficient on lagged hiring outcomes to one.
29 26 Table 7 presents the partial derivatives of the probability of hiring a worker of each given race/ethnicity category with respect to firm distance from the new BART stations. These derivatives are based on the parameter estimates from three increasingly complex specifications of the multinomial logit models. 30 The table also reports the p-value testing whether the effects of distance on the probability of hiring a black or Latino worker differs significantly from the effect of distance on the likelihood of hiring a white worker. As in the OLS models, the strongest effects of proximity are estimated for Latino workers. The range of estimates suggests that the probability of hiring a Latino worker declines by between 1.5 and 2.9 percentage points for each mile of distance from the new station. This effect is not quite significant for the first two specifications (p-values of 0.14 and 0.13, respectively), but is highly statistically significant in the final specification (p-value of 0.005). For the first two specifications, we find no effect of distance from the station on the propensity to hire black workers. For the final specification, we find a small, weakly significant (at the 11 percent level of confidence) negative effect of distance from the station on the likelihood of hiring a black worker in the second wave. The derivative indicates that an additional mile from the station reduces the probability of hiring a black worker by 1.2 percentage points. Finally, there is little relationship between distance from the stations and the likelihood of hiring white workers. If anything, white 30 The specifications are (1) a specification including distance and the two dummy variables indicating the race/ethnicity of the first wave hire, (2) the first specification plus the percent union, a dummy variable indicating that the firm contracts with the federal government, firm size dummies, industry dummies, a dummy indicating that the person in charge of hiring is black, and a dummy indicating that the person in charge of hiring is Latino, and (3) the second specification plus wave-2 level measures of the recruitment methods, job qualifications, and daily job tasks.
30 27 workers are more likely to be hired at employers located further from the new stations. Hence, the multinomial logit results in Table 7 basically confirm the results from the simple OLS regression. 31 D. Discussion of the results The results of the DD calculations and the more elaborate statistical models yield a consistent portrait of the effect of the transportation service extension on the rates at which minority workers are hired in the eastern suburbs of the Oakland PMSA. Among the establishments in our sample, the hiring of Latino workers increased considerably for establishments located nearby the new stations while it declined at establishments located further away. The difference in results across these two areas is statistically significant and remains so after controlling for a host of establishment characteristics. Overall, these results indicate that the new stations increased the demand for Latino labor by about 8 percent. This increase appears to result in lower commuting costs, and potentially higher wages, rather than higher overall employment levels in the region. In contrast, we find no relative increase among nearby firms in the propensity to hire black workers if anything, the hiring of blacks increases somewhat among establishments located further away but remains relatively constant nearby. There is some evidence that the employment gains experienced by members of one minority group were partially offset by the employment losses experiences by the other, although inter-group substitution alone does not explain the transit effect for Latino workers. More specifically, an analysis of the change in the propensity to hire either blacks or Latinos finds that 31 Appendix Table A4 presents comparable multinomial logit results constraining the sample to those observations with complete information on all explanatory variables used in estimating the most completely-specified model. These results are qualitatively similar to those presented in Table 7.
31 28 establishments nearer to the new stations increased such hiring relative to establishments further away. Finally, employing an alternative multinomial estimator yields findings that are qualitatively similar to those from the simple models. The disparity in the results begs the question of why the transportation extension seemed to affect the hiring of Latinos more than blacks, especially since much (though not all) of the evidence on the employment effects of spatial mismatch focuses on the latter group. Several factors that may explain these patterns. To start, as is evident in Table 3, Latinos were employed at nearly twice the rate of blacks before the service extension. To the extent that this provided relatively stronger information flows to predominantly Latino communities, Latino job seekers may have been better poised to respond to the new opportunities created by the service extension. The employer responses to questions concerning their recruitment methods indicates a heavy reliance on employee-referrals. In our final sample, 84 percent of employers report using employee-referrals in recruiting the last worker hired. Moreover, this recruiting method is the one most frequently used (see Appendix Table A1). These recruiting patterns combined with the greater pre-expansion hiring of Latinos suggest that the information flow to Latino job seekers concerning employment opportunities in the newly accessible area was relatively stronger than the flow of information to black job seekers. Whether there is an interaction effect between information flows and the accessibility afforded by the public transit system is an issue for future research. An alternative explanation of the differential impact of the transit extension may be that Latino residences are simply in closer proximity to the areas made accessible by the service extension. The maps of the population distributions (Maps 4D and 4E) do indicate that Latinos are more likely to reside in the vicinity of the Bay Fair station, the point of departure of the new BART line from the old system. To
32 29 explore this possibility further, Figure 4 plots the cumulative Latino and black populations within a 1/2 hour public transit commute from the Bay Fair station (the point of departure for the new line). The area shown covers all those within an approximate one-hour public transit commute from employers in the Dublin/Pleasanton area. 32 Despite the fact that the black population of the Oakland PMSA is larger than the Latino population, the figure clearly shows that the number of Latinos within an hour public-transit commute of the Dublin/Pleasanton area exceeds the comparable number of blacks. 33 Within a distance of thirty minutes from the Bay Fair station, the Latino population exceeds the black population by slightly more than 17,000 persons. These patterns suggest that Latinos stood to benefit more (in terms of accessibility to jobs in the eastern suburbs) from the transit extension than blacks. Another explanation of the differential impact may be that Latinos are willing to travel further for employment than blacks, and hence, were more likely to alter the geography of their supply behavior in 32 Calculations from the 1990 Census 5 Percent Public Use Micro data Sample indicates that the overwhelming majority of black and Latino public transit commuters in the Oakland PMSA have one-way commutes of an hour or less. For black public transit commuters, 45 percent commute 30 minutes or less, 72 percent commutes 45 minutes or less, and 89 percent commute one hour or less. The comparable figures for Latino public transit commuters are 38 percent, 63 percent, and 86 percent, respectively. We use a zone-to-zone public transit travel time matrix for 1990 provided by the Bay Area Metropolitan Transportation Commission and population data from the 1990 Census to construct Figure 4. The travel time matrix provide estimate of the inter-zone commute time (between zone centroids) using the 1990 public transit system. Raphael (1998a) discusses these data in detail. If we assume a five minute transfer at the Bay Fair station, 15 minutes of in-vehicle travel time to the Dublin/Pleasanton station, another five minute transfer at the end of the line, and a five minute bus ride (since there are very few firms within walking distance of the new station) then Figure 4 portrays the population within a one-hour public transit commute to Dublin/Pleasanton employers. 33 Within the traffic analysis zone containing the Bay Fair station, the Latino population is more than three times that of the black population (9,351 vs. 2,934). The flat portion of the profile up till 17 minutes is due to the fact that the nearest neighboring traffic analysis zone is a 17 minute public-transit commute away from the centroid of the traffic analysis zone that encompasses the Bay Fair station.
33 30 response to the transit extension. To investigate this possibility, we estimated group-specific gravity models where the dependent variable is the aggregate journey-to-work flow of black (or Latino) workers traveling by public transit between the Public Use Microdata Areas (PUMAs) of the Oakland PMSA. The key explanatory variables are the number of potential black (or Latino) workers in the origin PUMA, the number of jobs in the destination PUMA, and the distance (in public transit minutes) between the origin and destination. If Latinos are willing to travel further than blacks, than the rate at which transit flows decay with distance should be lower for Latinos than for blacks. We find no evidence that this is the case, and find little reason to suspect that a differential willingness to commute contributes to the differences in our employment results. 34 A final explanation for the difference in results concerns the possibility that blacks are more likely than Latinos to encounter employment and wage discrimination at suburban employers. Our evidence provides no way to test directly for differential discrimination, but certain patterns in the data suggest that this may be an important factor. In particular, blacks are considerably less likely to have been hired than Latinos before the service extension. While this pre-expansion difference may also result from the relatively closer proximity of Latinos, one cannot rule out the possibility of greater employment discrimination. We conclude that the relatively closer proximity of Latinos, combined with the higher pre-expansion hiring levels of Latinos, are the most likely explanations for the differential results. While increases in the hiring of blacks in the overall area (which were likely due to the growing tightness of labor markets in that 34 The gravity model results are available upon request. We also estimated models controlling for the number of intervening opportunities (the number of jobs that are closer to the origin than the jobs located in the destination) and found similar results. For a complete discussion of gravity models and their application to commute flows, see Raphael (1998c).
34 region) were greater than increases among Latinos, the geographic distribution of new hiring was affected by the new subway only among the latter group Conclusion What do the results of our survey imply about the ability to use public transit policy more broadly to connect urban, transit-dependent workers to suburban jobs? Our findings suggest that employment effects are greatest for those residing nearest to the origin of the new transit route. Our findings also suggest that accessibility improvements (as is evidenced by changes in hiring behavior) decline sharply with distance from the destination of the new transit route. Given some of the extreme distances between urban neighborhoods and suburban employment centers in modern metropolitan areas, along with the low-density sprawl development that characterizes many suburban employment centers, these patterns indicate that the potential of transit policy to foster large increases in reverse commuting is limited. Nonetheless, the estimates employment effects for Latinos is large in magnitude and statistically significant. These results clearly suggest that public transit policy has the potential to improve employment opportunities for disadvantaged minorities. However, whether this potential is realized depends on the proximity of the new transit line to specific urban populations as well as to suburban employers. Had the origins of the new subway line been built closer to areas of black residential concentration, the transport investment might well have had a more positive effect on black employment. Moreover, had the new transportation system been combined with efforts to disseminate information about suburban job openings or to improve job placement more generally, the improvement might have been even greater in magnitude. These findings do have implications for the long-standing debate about the importance of spatial
35 32 mismatch as a determinant of inter-racial and inter-ethnic inequality. The results show that for those workers best situated to take advantage of new reverse-commuting possibilities, accessibility matters in determining where one works. Hence, for transit-dependent minority workers, accessibility or lack thereof determines their employment opportunity sets. The results of this paper, combined with the growing body of research finding that spatial mismatch explains a substantial portion of racial differences in employment outcomes, emphasizes the importance of the accessibility of minority workers to employment as a factor in urban transport policy.
36 33 References Bay Area Rapid Transit District (1983), Short Range Transit Plan for the Five Year Period Bay Area Rapid Transit District (1987), Short Range Transit Plan for the Five Year Period Bound, John and Harry J. Holzer (2000), Demand Shifts, Population Adjustments, and Labor Market Outcomes During the 1980 s. Journal of Labor Economics, 18(1): Cutler, David M. and Edward L. Glaeser (1997), Are Ghettos Good or Bad? Quarterly Journal of Economics, 112(3): Ellwood, David T. (1986), "The Spatial Mismatch Hypothesis: Are there Teenage Jobs Missing in the Ghetto?" in Freeman, Richard B. and Harry J. Holzer (eds.), The Black Youth Employment Crisis, Chicago, IL: The University of Chicago Press. Fischel, William (1985), The Economics of Zoning Laws: A Property Rights Approach to American Land-Use Controls, Baltimore, MD: Johns Hopkins University Press. Hamermesh, Daniel S. (1996), Workdays, Work Hours, and Work Schedules: Evidence for the United States and Germany, Kalamazoo, MI: W.E. Upjohn Institute for Employment Research. Holzer, Harry J. (1996), What Employers Want: Job Prospects for Less-Educated Workers, New York, NY: Russell Sage Foundation. Holzer, Harry J. and Keith R. Ihlanfeldt (1996), "Spatial Factors and the Employment of Blacks at the Firm Level," New England Economic Review: Federal Reserve Bank of Boston, May/June: Holzer, Harry J; Ihlanfeldt, Keith R. and David J. Sjoquist (1994), Work, Search, and Travel among White and Black Youth, Journal of Urban Economics, 35(2): Holzer, Harry J. and Jess Reaser, (2000) Black Applicants, Black Employees, and Urban Labor Market Policy, Journal of Urban Economics, 48(3): Hughes, Mark and Julie Sternberg (1992), The New Metropolitan Reality, Washington, D.C.: The Urban Institute. Ihlanfeldt, Keith R. (1992), Job Accessibility and the Employment and School Enrollment of Teenagers, Kalamazoo, MI: W.E. Upjohn Institute for Employment Research.
37 34 Ihlanfeldt, Keith R. and David L. Sjoquist (1990), "Job Accessibility and Racial Differences in Youth Employment Rates," The American Economic Review, 80(1): Ihlanfeldt, Keith R. and David L. Sjoquist (1991), "The Effect of Job Access on Black and White Youth Employment: A Cross-Sectional Analysis," Urban Studies, 28(2): Ihlanfeldt, Keith R. and David L. Sjoquist (1998), The Spatial Mismatch Hypothesis: A Review of Recent Studies and Their Implications for Welfare Reform, Housing Policy Debate, 9(4): Ihlanfeldt, Keith R. and Madelyn V. Young (1996), The Spatial Distribution of Black Employment Between the Central City and the Suburbs, Economic Inquiry, 34(4): Jargowsky, Paul A. (1997), Poverty and Place: Ghettos, Barrios, and the American City, New York, NY: Russell Sage Foundation. Kasarda, John (1985), "Urban Change and Minority Opportunity," in Paul E. Patterson (ed.), The New Urban Reality, Washington D.C.: The Brookings Institution. Kasarda, John (1989), "Urban Industrial Transition and the Underclass," The Annals of the American Academy of Political and Social Science, 501: Kling, Jeffrey (1995), High Performance Work Systems and Firm Performance, Monthly Labor Review, 18: Leonard, Jonathon S (1985), "Space, Time, and Unemployment," Unpublished Manuscript, University of California, Berkeley. Massey, Douglas and Nancy. Denton (1993), American Apartheid: The Making of the Underclass, Cambridge, MA: Harvard University Press. Mouw, Ted (2000), Job Relocation and the Racial Gap in Unemployment in Detroit and Chicago : A Fixed-Effects Estimate of the Spatial Mismatch Hypothesis, American Journal of Sociology, 65(5): Muth, Richard (1969), Cities and Housing, Chicago: University of Chicago Press. O Regan, Katherine M. And John M. Quigley (1996), Spatial Effects Upon Employment Outcomes: The Case of New Jersey Teenagers, New England Economic Review, May/June:
38 O Regan, Katherine M. and John M. Quigley (1999), Spatial Isolation of Welfare Recipients: What do we Know?, Program on Housing and Urban Policy Working Paper #W Raphael, Steven (1998a), The Spatial Mismatch Hypothesis of Black Youth Joblessness: Evidence from the San Francisco Bay Area, Journal of Urban Economics, 43(1): Raphael, Steven (1998b), Inter and Intra-Ethnic Comparisons of the Central City-Suburban Youth Employment Differential: Evidence from the Oakland Metropolitan Area, Industrial and Labor Relations Review, 51(3): Raphael, Steven (1998c), Intervening Opportunities, Competing Searchers, and the Intra-metropolitan Flow of Male Youth Labor, Journal of Regional Science, 38(1): Raphael, Steven and Michael A. Stoll (2000), Can Boosting Minority Car-Ownership Rates Narrow Inter-Racial Employment Gaps?, Berkeley Program on Housing and Urban Policy Working Paper #W Raphael, Steven; Stoll, Michael A.; and Harry J. Holzer (2000) Are Suburban Firms More Likely to Discriminate Against African-Americans? Journal of Urban Economics, 48(3): Stoll, Michael A. (1999a), Spatial Mismatch, Discrimination, and Male Youth Employment in the Washington, DC Area: Implications for Residential Mobility Policies, Journal of Policy Analysis and Management, 18(1): Stoll, Michael A. (1999b), Spatial Job Search, Spatial Mismatch, and the Employment and Wages of Racial and Ethnic Groups in Los Angeles, Journal of Urban Economics, 46(1): Stoll, Michael A.; Holzer, Harry J.; and Keith R. Ihlanfeldt (2000), Within Cities and Suburbs: Racial Residential Concentration and the Spatial Distribution of Employment Opportunities Across Sub- Metropolitan Areas, Journal of Policy Analysis and Management, 19(2): Weinberg, Bruce A. (2000), Black Residential Segregation and the Spatial Mismatch Hypothesis, Journal of Urban Economics, 48(1): Wilson, Julius William (1987), The Truly Disadvantaged: the Inner City, the Underclass, and Public Policy, Chicago, IL: The University of Chicago Press. Wilson, William Julius (1996), When Work Disappears: The World of the New Urban Poor, New York, NY: Alfred A. Knopf. 35
39 Yinger, John (1995), Closed Doors, Opportunities Lost: The Continuing Costs of Housing Discrimination, New York, NY: Russell Sage Foundation. 36
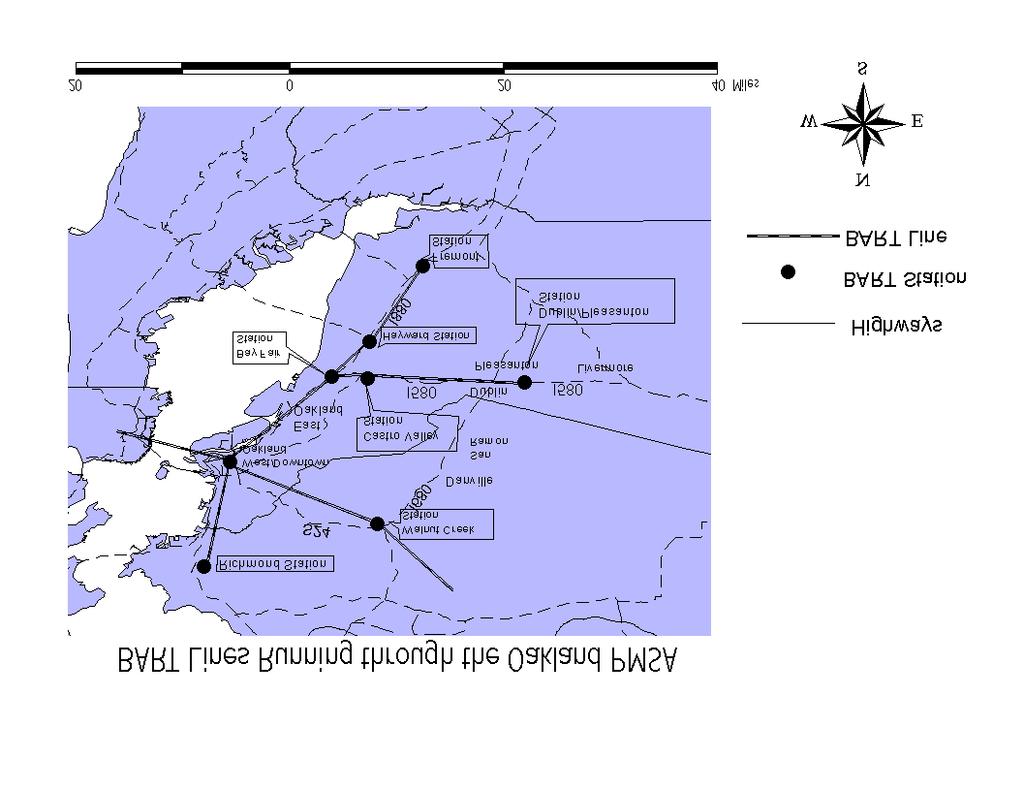
40 Figure 1
Public Transit and the Spatial Distribution of Minority Employment: Evidence from a Natural Experiment
 Public Transit and the Spatial Distribution of Minority Employment: Evidence from a Natural Experiment Harry J. Holzer John M. Quigley Steven Raphael Abstract A recent expansion of the San Francisco Bay
Are Suburban Firms More Likely to Discriminate Against African-Americans?
 October 1999 Revised: February 2000 Are Suburban Firms More Likely to Discriminate Against African-Americans? Steven Raphael Goldman School of Public Policy University of California, Berkeley 2607 Hearst
Are Suburban Firms More Likely to Discriminate Against African Americans?
 Institute for Research on Poverty Discussion Paper no. 1160-98 Are Suburban Firms More Likely to Discriminate Against African Americans? Steven Raphael Department of Economics University of California,
8AMBER WAVES VOLUME 2 ISSUE 3
 8AMBER WAVES VOLUME 2 ISSUE 3 F E A T U R E William Kandel, USDA/ERS ECONOMIC RESEARCH SERVICE/USDA Rural s Employment and Residential Trends William Kandel wkandel@ers.usda.gov Constance Newman cnewman@ers.usda.gov
The Effects of Housing Prices, Wages, and Commuting Time on Joint Residential and Job Location Choices
 The Effects of Housing Prices, Wages, and Commuting Time on Joint Residential and Job Location Choices Kim S. So, Peter F. Orazem, and Daniel M. Otto a May 1998 American Agricultural Economics Association
Local Land-use Controls and Demographic Outcomes in a Booming Economy
 Urban Studies, Vol. 41, No. 2, 000 000, February 2004 Local Land-use Controls and Demographic Outcomes in a Booming Economy John M.QuigleyGoldman School of Public PolicyUniversity of California Berkeley2607
Meeting the Demand: Hiring Patterns of Welfare Recipients in Four Metropolitan Areas ...a spatial FINDINGS mismatch may
 Center on Urban & Metropolitan Policy Meeting the Demand: Hiring Patterns of Welfare Recipients in Four Metropolitan Areas Harry J. Holzer, Georgetown University and The Urban Institute, and Michael A.
Residential segregation and socioeconomic outcomes When did ghettos go bad?
 Economics Letters 69 (2000) 239 243 www.elsevier.com/ locate/ econbase Residential segregation and socioeconomic outcomes When did ghettos go bad? * William J. Collins, Robert A. Margo Vanderbilt University
OFFICE OF THE CONTROLLER. City Services Auditor 2005 Taxi Commission Survey Report
 OFFICE OF THE CONTROLLER City Services Auditor 2005 Taxi Commission Survey Report February 7, 2006 TABLE OF CONTENTS INTRODUCTION 3 SURVEY DATA ANALYSIS 5 I. The Survey Respondents 5 II. The Reasonableness
Customer Discrimination and Employment Outcomes for Minority Workers. Harry J. Holzer Michigan State University address:
 Institute for Research on Poverty Discussion Paper no. 1122-97 Customer Discrimination and Employment Outcomes for Minority Workers Harry J. Holzer Michigan State University E-mail address: holzer@pilot.msu.edu
PROGRAM ON HOUSING AND URBAN POLICY
 Institute of Business and Economic Research Fisher Center for Real Estate and Urban Economics PROGRAM ON HOUSING AND URBAN POLICY WORKING PAPER SERIES WORKING PAPER NO. W99-003 SPATIAL ISOLATION AND WELFARE
Revisiting Residential Segregation by Income: A Monte Carlo Test
 International Journal of Business and Economics, 2003, Vol. 2, No. 1, 27-37 Revisiting Residential Segregation by Income: A Monte Carlo Test Junfu Zhang * Research Fellow, Public Policy Institute of California,
Poverty Reduction and Economic Growth: The Asian Experience Peter Warr
 Poverty Reduction and Economic Growth: The Asian Experience Peter Warr Abstract. The Asian experience of poverty reduction has varied widely. Over recent decades the economies of East and Southeast Asia
Patrick Adler and Chris Tilly Institute for Research on Labor and Employment, UCLA. Ben Zipperer University of Massachusetts, Amherst
 THE STATE OF THE UNIONS IN 2013 A PROFILE OF UNION MEMBERSHIP IN LOS ANGELES, CALIFORNIA AND THE NATION 1 Patrick Adler and Chris Tilly Institute for Research on Labor and Employment, UCLA Ben Zipperer
IV. Residential Segregation 1
 IV. Residential Segregation 1 Any thorough study of impediments to fair housing choice must include an analysis of where different types of people live. While the description of past and present patterns
Institute for Public Policy and Economic Analysis
 Institute for Public Policy and Economic Analysis The Institute for Public Policy and Economic Analysis at Eastern Washington University will convey university expertise and sponsor research in social,
Working Overtime: Long Commutes and Rent-burden in the Washington Metropolitan Region
 Working Overtime: Long Commutes and Rent-burden in the Washington Metropolitan Region By Kathryn Howell, PhD Research Associate George Mason University School of Public Policy Center for Regional Analysis
HOUSEHOLD TYPE, ECONOMIC DISADVANTAGE, AND RESIDENTIAL SEGREGATION: EMPIRICAL PATTERNS AND FINDINGS FROM SIMULATION ANALYSIS.
 HOUSEHOLD TYPE, ECONOMIC DISADVANTAGE, AND RESIDENTIAL SEGREGATION: EMPIRICAL PATTERNS AND FINDINGS FROM SIMULATION ANALYSIS A Thesis by LINDSAY MICHELLE HOWDEN Submitted to the Office of Graduate Studies
Changing Cities: What s Next for Charlotte?
 Changing Cities: What s Next for Charlotte? Santiago Pinto Senior Policy Economist The views expressed in this presentation are those of the speaker and do not necessarily represent the views of the Federal
Chapter 5. Residential Mobility in the United States and the Great Recession: A Shift to Local Moves
 Chapter 5 Residential Mobility in the United States and the Great Recession: A Shift to Local Moves Michael A. Stoll A mericans are very mobile. Over the last three decades, the share of Americans who
Department of Economics Working Paper Series
 Accepted for publication in 2003 in Annales d Économie et de Statistique Department of Economics Working Paper Series Segregation and Racial Preferences: New Theoretical and Empirical Approaches Stephen
Stuart A. Gabriel and Gary D. Painter* Abstract. In a paper published in The Review of Economics and Statistics some 20 years ago, we sought to
 HOUSEHOLD LOCATION AND RACE: A TWENTY-YEAR RETROSPECTIVE Stuart A. Gabriel and Gary D. Painter* Abstract In a paper published in The Review of Economics and Statistics some 20 years ago, we sought to assess
Part 1: Focus on Income. Inequality. EMBARGOED until 5/28/14. indicator definitions and Rankings
 Part 1: Focus on Income indicator definitions and Rankings Inequality STATE OF NEW YORK CITY S HOUSING & NEIGHBORHOODS IN 2013 7 Focus on Income Inequality New York City has seen rising levels of income
Race, Gender, and Residence: The Influence of Family Structure and Children on Residential Segregation. September 21, 2012.
 Race, Gender, and Residence: The Influence of Family Structure and Children on Residential Segregation Samantha Friedman* University at Albany, SUNY Department of Sociology Samuel Garrow University at
In abusiness Review article nine years ago, we. Has Suburbanization Diminished the Importance of Access to Center City?
 Why Don't Banks Take Stock? Mitchell Berlin Has Suburbanization Diminished the Importance of Access to Center City? Richard Voith* In abusiness Review article nine years ago, we examined the role that
Immigrants and the Spatial Mismatch Hypothesis: Employment Outcomes among Immigrant Youth in Los Angeles. Cathy Yang Liu
 Preliminary draft do not cite without permission Immigrants and the Spatial Mismatch Hypothesis: Employment Outcomes among Immigrant Youth in Los Angeles by Cathy Yang Liu liuyang@usc.edu Gary Painter
Metropolitan Growth and Neighborhood Segregation by Income. Tara Watson Williams College November 2005
 Metropolitan Growth and Neighborhood Segregation by Income Tara Watson Williams College November 2005 Abstract: U.S. metropolitan neighborhoods have become increasingly segregated by income over the past
The problem of growing inequality in Canadian. Divisions and Disparities: Socio-Spatial Income Polarization in Greater Vancouver,
 Divisions and Disparities: Socio-Spatial Income Polarization in Greater Vancouver, 1970-2005 By David F. Ley and Nicholas A. Lynch Department of Geography, University of British Columbia The problem of
! # % & ( ) ) ) ) ) +,. / 0 1 # ) 2 3 % ( &4& 58 9 : ) & ;; &4& ;;8;
 ) ) ) ) +,. / 0 1 # ) 2 3 % ( &4& 58 9 : ) & ;; &4& ;;8;") ! # % & ( ) ) ) ) ) +,. / 0 # ) % ( && : ) & ;; && ;;; < The Changing Geography of Voting Conservative in Great Britain: is it all to do with Inequality? Journal: Manuscript ID Draft Manuscript Type: Commentary
! # % & ( ) ) ) ) ) +,. / 0 # ) % ( && : ) & ;; && ;;; < The Changing Geography of Voting Conservative in Great Britain: is it all to do with Inequality? Journal: Manuscript ID Draft Manuscript Type: Commentary
Moving to job opportunities? The effect of Ban the Box on the composition of cities
 Moving to job opportunities? The effect of Ban the Box on the composition of cities By Jennifer L. Doleac and Benjamin Hansen Ban the Box (BTB) laws prevent employers from asking about a job applicant
Firm racial segregation and affirmative action in the highway construction industry
 Small Bus Econ (29) 33:44 43 DOI.7/s87-9-924-8 Firm racial segregation and affirmative action in the highway construction industry Justin Marion Accepted: 9 January 29 / Published online: 6 May 29 Ó The
PROGRAM ON HOUSING AND URBAN POLICY
 Institute of Business and Economic Research Fisher Center for Real Estate and Urban Economics PROGRAM ON HOUSING AND URBAN POLICY WORKING PAPER SERIES WORKING PAPER NO. W98-002 ACCESSABILITY AND ECONOMIC
UC Berkeley Earlier Faculty Research
 UC Berkeley Earlier Faculty Research Title The car, immigrants and poverty: implications for immigrant earnings and job access Permalink https://escholarship.org/uc/item/6bh7m91q Authors Clark, William
UCLA Working Paper Series
 UCLA Working Paper Series Title Job Access, Commute, and Travel Burden Among Welfare Recipients Permalink https://escholarship.org/uc/item/1bq662vc Authors Ong, Paul M. Blumenberg, Evelyn Publication Date
Social Science Research 35 (2006) Neighborhood resources, racial segregation, and economic mobility: Results from the Gautreaux program q
 Neighborhood resources, racial segregation, and economic mobility: Results from the Gautreaux program q") Social Science Research 35 (2006) 892 923 Social Science RESEARCH www.elsevier.com/locate/ssresearch Neighborhood resources, racial segregation, and economic mobility: Results from the Gautreaux program
Social Science Research 35 (2006) 892 923 Social Science RESEARCH www.elsevier.com/locate/ssresearch Neighborhood resources, racial segregation, and economic mobility: Results from the Gautreaux program
Community Well-Being and the Great Recession
 Pathways Spring 2013 3 Community Well-Being and the Great Recession by Ann Owens and Robert J. Sampson The effects of the Great Recession on individuals and workers are well studied. Many reports document
Racial Differences in Adult Labor Force Transition Trends
 Illinois Wesleyan University From the SelectedWorks of Michael Seeborg 1991 Racial Differences in Adult Labor Force Transition Trends Michael C. Seeborg, Illinois Wesleyan University Mark Israel Available
THE BRAIN GAIN: 2015 UPDATE. How the Region s Shifting Demographics Favor the Lower Manhattan Business District
 THE BRAIN GAIN: 2015 UPDATE How the Region s Shifting Demographics Favor the Lower Manhattan Business District 2015 UPDATE THE BRAIN GAIN: How the Region s Shifting Demographics Favor the Lower Manhattan
APPENDIX B. Environmental Justice Evaluation
 Appendix B. Environmental Justice Evaluation 1 APPENDIX B. Environmental Justice Evaluation Introduction The U.S. Department of Transportation has issued a final order on Environmental Justice. This final
Minority Suburbanization and Racial Change
 University of Minnesota Law School Scholarship Repository Studies Institute on Metropolitan Opportunity 2006 Minority Suburbanization and Racial Change Institute on Metropolitan Opportunity University
Ethnic Enclave Residence and Employment Accessibility of Latino Workers in Chicago, Los Angeles and Washington, D.C.
 Preliminary Draft Ethnic Enclave Residence and Employment Accessibility of Latino Workers in Chicago, Los Angeles and Washington, D.C. Cathy Yang Liu 1 School of Policy, Planning and Development University
The Rise and Decline of the American Ghetto
 David M. Cutler, Edward L. Glaeser, Jacob L. Vigdor September 11, 2009 Outline Introduction Measuring Segregation Past Century Birth (through 1940) Expansion (1940-1970) Decline (since 1970) Across Cities
John Parman Introduction. Trevon Logan. William & Mary. Ohio State University. Measuring Historical Residential Segregation. Trevon Logan.
 Ohio State University William & Mary Across Over and its NAACP March for Open Housing, Detroit, 1963 Motivation There is a long history of racial discrimination in the United States Tied in with this is
Race, Spatial Mismatch, and Job Accessibility: Evidence from a Plant Relocation
 Race, Spatial Mismatch, and Job Accessibility: Evidence from a Plant Relocation April, 2006 Race, Spatial Mismatch, and Job Accessibility: Evidence from a Plant Relocation Abstract One of the most prominent
Land Use, Job Accessibility and Commuting Efficiency under the Hukou System in Urban China: A Case Study in Guangzhou
 Land Use, Job Accessibility and Commuting Efficiency under the Hukou System in Urban China: A Case Study in Guangzhou ( 论文概要 ) LIU Yi Hong Kong Baptist University I Introduction To investigate the job-housing
INEQUALITY AND THE MEASUREMENT OF RESIDENTIAL SEGREGATION BY INCOME IN AMERICAN NEIGHBORHOODS. by Tara Watson*
 roiw_346 820..844 Review of Income and Wealth Series 55, Number 3, September 2009 INEQUALITY AND THE MEASUREMENT OF RESIDENTIAL SEGREGATION BY INCOME IN AMERICAN NEIGHBORHOODS by Tara Watson* Williams
Was the Late 19th Century a Golden Age of Racial Integration?
 Was the Late 19th Century a Golden Age of Racial Integration? David M. Frankel (Iowa State University) January 23, 24 Abstract Cutler, Glaeser, and Vigdor (JPE 1999) find evidence that the late 19th century
Migration Patterns and the Growth of High-Poverty Neighborhoods,
 Institute for Research on Poverty Discussion Paper no. 1172-98 Migration Patterns and the Growth of High-Poverty Neighborhoods, 1970 1990 Lincoln Quillian Department of Sociology University of Wisconsin
Wage Trends among Disadvantaged Minorities
 National Poverty Center Working Paper Series #05-12 August 2005 Wage Trends among Disadvantaged Minorities George J. Borjas Harvard University This paper is available online at the National Poverty Center
NBER WORKING PAPER SERIES EMPLOYMENT IN BLACK URBAN LABOR MARKETS: PROBLEMS AND SOLUTIONS. Judith K. Hellerstein David Neumark
 NBER WORKING PAPER SERIES EMPLOYMENT IN BLACK URBAN LABOR MARKETS: PROBLEMS AND SOLUTIONS Judith K. Hellerstein David Neumark Working Paper 16986 http://www.nber.org/papers/w16986 NATIONAL BUREAU OF ECONOMIC
Segregation in Motion: Dynamic and Static Views of Segregation among Recent Movers. Victoria Pevarnik. John Hipp
 Segregation in Motion: Dynamic and Static Views of Segregation among Recent Movers Victoria Pevarnik John Hipp March 31, 2012 SEGREGATION IN MOTION 1 ABSTRACT This study utilizes a novel approach to study
Title VI Review: Service and Facility Standards Monitoring
 Title VI Review: Service and Facility Standards Monitoring Prepared by SRF Consulting Group, Inc. SRF No. 7709 Table of Contents Executive Summary...5 Technical Analysis of Service Standards... 5 Additional
Rural and Urban Migrants in India:
 Rural and Urban Migrants in India: 1983-2008 Viktoria Hnatkovska and Amartya Lahiri July 2014 Abstract This paper characterizes the gross and net migration flows between rural and urban areas in India
What kinds of residential mobility improve lives? Testimony of James E. Rosenbaum July 15, 2008
 What kinds of residential mobility improve lives? Testimony of James E. Rosenbaum July 15, 2008 Summary 1. Housing projects create concentrated poverty which causes many kinds of harm. 2. Gautreaux shows
Metropolitan Growth, Inequality, and Neighborhood Segregation by Income. Tara Watson* March 2006
 Metropolitan Growth, Inequality, and Neighborhood Segregation by Income Tara Watson* March 2006 Abstract: This paper investigates the relationship between metropolitan area growth, inequality, and segregation
Labor Market Dropouts and Trends in the Wages of Black and White Men
 Industrial & Labor Relations Review Volume 56 Number 4 Article 5 2003 Labor Market Dropouts and Trends in the Wages of Black and White Men Chinhui Juhn University of Houston Recommended Citation Juhn,
The Brookings Institution
 The Brookings Institution Metropolitan Policy Program Bruce Katz, Director Understanding Regional Dynamics: Implications for Social and Economic Justice Understanding Regional Dynamics: Implications for
EMBARGOED UNTIL THURSDAY 9/5 AT 12:01 AM
 EMBARGOED UNTIL THURSDAY 9/5 AT 12:01 AM Poverty matters No. 1 It s now 50/50: chicago region poverty growth is A suburban story Nationwide, the number of people in poverty in the suburbs has now surpassed
Housing Segregation and Earnings: Identifying Regional Differences over Time
 Housing Segregation and Earnings: Identifying Regional Differences over Time Andrew T. Foerster * Davidson College Davidson, NC February 29, 2004 * Andrew Foerster will graduate from Davidson College in
Evaluating the Role of Immigration in U.S. Population Projections
 Evaluating the Role of Immigration in U.S. Population Projections Stephen Tordella, Decision Demographics Steven Camarota, Center for Immigration Studies Tom Godfrey, Decision Demographics Nancy Wemmerus
Rural Manitoba Profile:
 Rural Manitoba Profile: A Ten-year Census Analysis (1991 2001) Prepared by Jennifer de Peuter, MA and Marianne Sorensen, PhD of Tandem Social Research Consulting with contributions by Ray Bollman, Jean
RESEARCH BRIEF: The State of Black Workers before the Great Recession By Sylvia Allegretto and Steven Pitts 1
 July 23, 2010 Introduction RESEARCH BRIEF: The State of Black Workers before the Great Recession By Sylvia Allegretto and Steven Pitts 1 When first inaugurated, President Barack Obama worked to end the
IN THE UNITED STATES DISTRICT COURT FOR THE EASTERN DISTRICT OF PENNSYLVANIA
 IN THE UNITED STATES DISTRICT COURT FOR THE EASTERN DISTRICT OF PENNSYLVANIA Mahari Bailey, et al., : Plaintiffs : C.A. No. 10-5952 : v. : : City of Philadelphia, et al., : Defendants : PLAINTIFFS EIGHTH
5A. Wage Structures in the Electronics Industry. Benjamin A. Campbell and Vincent M. Valvano
 5A.1 Introduction 5A. Wage Structures in the Electronics Industry Benjamin A. Campbell and Vincent M. Valvano Over the past 2 years, wage inequality in the U.S. economy has increased rapidly. In this chapter,
This analysis confirms other recent research showing a dramatic increase in the education level of newly
 CENTER FOR IMMIGRATION STUDIES April 2018 Better Educated, but Not Better Off A look at the education level and socioeconomic success of recent immigrants, to By Steven A. Camarota and Karen Zeigler This
SECTION TWO: REGIONAL POVERTY TRENDS
 SECTION TWO: REGIONAL POVERTY TRENDS Metropolitan Council Choice, Place and Opportunity: An Equity Assessment of the Twin Cities Region Section 2 The changing face of poverty Ebbs and flows in the performance
Residential Location, Transportation, and Welfare-to-Work in the United States: A Case Study of Milwaukee
 393 Residential Location, Transportation, and Welfare-to-Work in the United States: A Case Study of Milwaukee Qing Shen University of Maryland College Park Thomas W. Sanchez Virginia Tech Abstract This
Regional Total Population: 2,780,873. Regional Low Income Population: 642,140. Regional Nonwhite Population: 1,166,442
 BALTIMORE REGION Neighborhood change in Baltimore is marked by a major city suburban divide, reflecting its long and troubled history of racial segregation. In the suburbs, only about one in six residents
Sleepwalking towards Johannesburg? Local measures of ethnic segregation between London s secondary schools, /9.
 Sleepwalking towards Johannesburg? Local measures of ethnic segregation between London s secondary schools, 2003 2008/9. Richard Harris A Headline Headteacher expresses alarm over racial segregation in
The Brookings Institution Metropolitan Policy Program Bruce Katz, Director
 The Brookings Institution Metropolitan Policy Program Bruce Katz, Director State of the World s Cities: The American Experience Delivering Sustainable Communities Summit February 1st, 2005 State of the
Community Development Research Brief. Suburbanization of Poverty in the Bay Area
 Community Development Research Brief Suburbanization of Poverty in the Bay Area Federal Reserve Bank of San Francisco Matthew Soursourian January 2012 EXECUTIVE SUMMARY Using data from U.S. Census Bureau,
Black access to suburban housing in America s most racially segregated metropolitan area: Detroit
 Black access to suburban housing in America s most racially segregated metropolitan area: Detroit Joe T. Darden Michigan State University Department of Geography 314 Natural Science Building East Lansing,
World of Labor. John V. Winters Oklahoma State University, USA, and IZA, Germany. Cons. Pros
 John V. Winters Oklahoma State University, USA, and IZA, Germany Do higher levels of education and skills in an area benefit wider society? Education benefits individuals, but the societal benefits are
Spatial Mismatch and Urban Labor Markets in the United States: Evidence for Blacks, Immigrants and Hispanics
 Preliminary draft Spatial Mismatch and Urban Labor Markets in the United States: Evidence for Blacks, Immigrants and Hispanics Janet Kohlhase* and Jia-Huey Lin** December 2009 Abstract Our work updates
Relationships between the Growth of Ethnic Groups and Socioeconomic Conditions in US Metropolitan Areas
 Relationships between the Growth of Ethnic Groups and Socioeconomic Conditions in US Metropolitan Areas ChiHyoung Park* Abstract: Growth of the three largest US ethnic minorities (Hispanics, blacks, and
Immigration and Poverty in the United States
 April 2008 Immigration and Poverty in the United States Steven Raphael and Eugene Smolensky Goldman School of Public Policy UC Berkeley stevenraphael@berkeley.edu geno@berkeley.edu Abstract In this paper,
Where Do We Belong? Fixing America s Broken Housing System
 Where Do We Belong? Fixing America s Broken Housing System PRESENTER: john a. powell Director, Haas Institute DATE: 10/5/2016 Housing in America Nearly ten years after the foreclosure crisis, we have a
The Unintended Significance of Race: Environmental Racial Inequality in Detroit*
 The Unintended Significance of Race: Environmental Racial Inequality in Detroit* liam downey, University of Colorado Abstract This article addresses shortcomings in the literature on environmental inequality
Immigrant Legalization
 Technical Appendices Immigrant Legalization Assessing the Labor Market Effects Laura Hill Magnus Lofstrom Joseph Hayes Contents Appendix A. Data from the 2003 New Immigrant Survey Appendix B. Measuring
Explaining the Deteriorating Entry Earnings of Canada s Immigrant Cohorts:
 Explaining the Deteriorating Entry Earnings of Canada s Immigrant Cohorts: 1966-2000 Abdurrahman Aydemir Family and Labour Studies Division Statistics Canada aydeabd@statcan.ca 613-951-3821 and Mikal Skuterud
Black Immigrant Residential Segregation: An Investigation of the Primacy of Race in Locational Attainment Rebbeca Tesfai Temple University
 Black Immigrant Residential Segregation: An Investigation of the Primacy of Race in Locational Attainment Rebbeca Tesfai Temple University Introduction Sociologists have long viewed residential segregation
The Effect of Ethnic Residential Segregation on Wages of Migrant Workers in Australia
 The Effect of Ethnic Residential Segregation on Wages of Migrant Workers in Australia Mathias G. Sinning Australian National University and IZA Bonn Matthias Vorell RWI Essen March 2009 PRELIMINARY DO
Measuring Residential Segregation
 Measuring Residential Segregation Trevon D. Logan and John M. Parman March 24, 214 Abstract We develop a new measure of residential segregation based on individual-level data. We exploit complete census
Job Displacement Over the Business Cycle,
 cepr CENTER FOR ECONOMIC AND POLICY RESEARCH Briefing Paper Job Displacement Over the Business Cycle, 1991-2001 John Schmitt 1 June 2004 CENTER FOR ECONOMIC AND POLICY RESEARCH 1611 CONNECTICUT AVE., NW,
City of Hammond Indiana DRAFT Fair Housing Assessment 07. Disparities in Access to Opportunity
 ANALYSIS EDUCATIONAL OPPORTUNITIES i. Describe any disparities in access to proficient schools based on race/ethnicity, national origin, and family status. ii. iii. Describe the relationship between the
furmancenter.org WORKING PAPER Race and Neighborhoods in the 21st Century: What Does Segregation Mean Today?
 WORKING PAPER Race and Neighborhoods in the 21st Century: What Does Segregation Mean Today? Jorge De la Roca, Ingrid Gould Ellen, Katherine M. O Regan August 2013 We thank Moneeza Meredia, Davin Reed,
Chapter 7. Urbanization and Rural-Urban Migration: Theory and Policy 7-1. Copyright 2012 Pearson Addison-Wesley. All rights reserved.
 Chapter 7 Urbanization and Rural-Urban Migration: Theory and Policy Copyright 2012 Pearson Addison-Wesley. All rights reserved. 7-1 The Migration and Urbanization Dilemma As a pattern of development, the
Separate When Equal? Racial Inequality and Residential Segregation
 Separate When Equal? Racial Inequality and Residential Segregation Patrick Bayer Hanming Fang Robert McMillan January 13, 2005 Abstract Conventional wisdom suggests that residential segregation will fall
Publicizing malfeasance:
 Publicizing malfeasance: When media facilitates electoral accountability in Mexico Horacio Larreguy, John Marshall and James Snyder Harvard University May 1, 2015 Introduction Elections are key for political
Rural and Urban Migrants in India:
 Rural and Urban Migrants in India: 1983 2008 Viktoria Hnatkovska and Amartya Lahiri This paper characterizes the gross and net migration flows between rural and urban areas in India during the period 1983
In class, we have framed poverty in four different ways: poverty in terms of
 Sandra Yu In class, we have framed poverty in four different ways: poverty in terms of deviance, dependence, economic growth and capability, and political disenfranchisement. In this paper, I will focus
SEVERE DISTRESS AND CONCENTRATED POVERTY: TRENDS FOR NEIGHBORHOODS IN CASEY CITIES AND THE NATION
 ANNIE E. CASEY FOUNDATION MAKING CONNECTIONS INITIATIVE SEVERE DISTRESS AND CONCENTRATED POVERTY: TRENDS FOR NEIGHBORHOODS IN CASEY CITIES AND THE NATION G. Thomas Kingsley and Kathryn L.S. Pettit October
Unequal Recovery, Labor Market Polarization, Race, and 2016 U.S. Presidential Election. Maoyong Fan and Anita Alves Pena 1
 Unequal Recovery, Labor Market Polarization, Race, and 2016 U.S. Presidential Election Maoyong Fan and Anita Alves Pena 1 Abstract: Growing income inequality and labor market polarization and increasing
REPORT. Highly Skilled Migration to the UK : Policy Changes, Financial Crises and a Possible Balloon Effect?
 Report based on research undertaken for the Financial Times by the Migration Observatory REPORT Highly Skilled Migration to the UK 2007-2013: Policy Changes, Financial Crises and a Possible Balloon Effect?
The Effects of the 1930s HOLC Redlining Maps
 The Effects of the 1930s HOLC Redlining Maps Daniel Aaronson Daniel Hartley Bhashkar Mazumder Federal Reserve Bank of Chicago Minneapolis Fed, October 26, 2017 The views expressed are those of the authors
Patterns of Housing Voucher Use Revisited: Segregation and Section 8 Using Updated Data and More Precise Comparison Groups, 2013
 Patterns of Housing Voucher Use Revisited: Segregation and Section 8 Using Updated Data and More Precise Comparison Groups, 2013 Molly W. Metzger, Assistant Professor, Washington University in St. Louis
HCEO WORKING PAPER SERIES
 HCEO WORKING PAPER SERIES Working Paper The University of Chicago 1126 E. 59th Street Box 107 Chicago IL 60637 www.hceconomics.org Now You See Me, Now You Don t: The Geography of Police Stops Jessie J.
12 Socio Economic Effects
 12 Socio Economic Effects 12.1 Introduction This chapter considers the socio-economic impact of Edinburgh Tram Line One during its construction and operation. Two main aspects of the scheme are considered:
EPI BRIEFING PAPER. Immigration and Wages Methodological advancements confirm modest gains for native workers. Executive summary
 EPI BRIEFING PAPER Economic Policy Institute February 4, 2010 Briefing Paper #255 Immigration and Wages Methodological advancements confirm modest gains for native workers By Heidi Shierholz Executive
Canadian Labour Market and Skills Researcher Network
 Canadian Labour Market and Skills Researcher Network Working Paper No. 29 The Effect of Immigrant Selection and the IT Bust on the Entry Earnings of Immigrants Garnett Picot Statistics Canada Feng Hou