Regional Commuting Patterns and Workforce Mobility within the Greater Oklahoma City Partnership Region
|
|
|
- Reynold Blankenship
- 6 years ago
- Views:
Transcription


1 Regional Commuting Patterns and Workforce Mobility within the Greater Oklahoma City Partnership Region January 2011
2 Table of Contents 2 Executive Summary 3 Workforce Mobility Map 4 Net Worker Flow Map 5 Net Imported Map 6 Where Are Employed 7 Where Live 8 Worker Flows by 9 Generated 10 Flows 11 Net Imported 12 by gender 13 Job Creation 14 Net Job Flow 16 Canadian 18 Cleveland 20 Grady 22 Kingfisher 24 Lincoln 26 Logan 28 McClain 30 Oklahoma 32 Payne 34 Pottawatomie 36 Methodologies 1
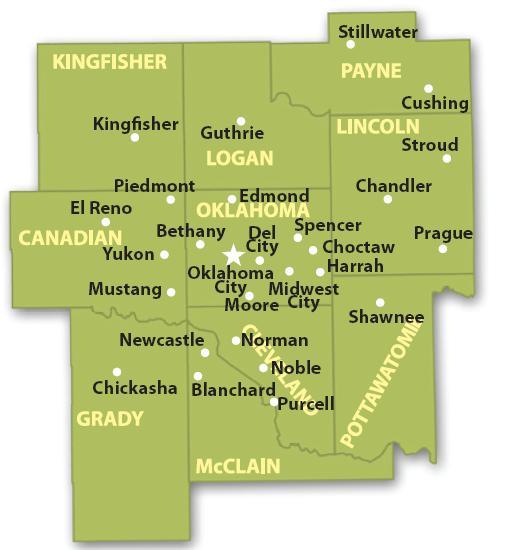
3 Executive Summary The purpose of this study was to identify the commuting patterns and workforce mobility within the ten county Greater Oklahoma City Partnership Region. Commuting pattern information is critical to understanding the linkages and importance of the region and how counties are dependent upon each other. A brief summary of select highlights include: The study showed that 170,419 or 32.7% of the region s workforce daily commute between counties within the 10 county partnership region. This shows an increase of 36,759 or 10 percentage points higher than the 2000 Commuter Pattern study. These numbers point to the higher degree of economic linkage between the component counties. Over the same time period (2000 to 2008), population grew by 10 percent (1,243,058 to 1,368,338). Similarly, the number of jobs grew by 7.5 percent. 67 percent of all workers in the region work in Oklahoma (413,292 workers). Cleveland is second with 13 percent of all workers in the region working in Cleveland (77,741). 53 percent of all workers in the region live in Oklahoma (315,328 workers). Cleveland is second with 18 percent of all workers in the region living in Cleveland (109,548). Jobs in Oklahoma generate over $17.2 billion in payroll, or 73% of total payroll for the region. Oklahoma exports $4.6 billion in payroll to other partnership counties. It is estimated that 247,232 people both live and work in Oklahoma. Approximately 34,550 Oklahoma residents commute to a county outside of Oklahoma for work. Conversely, 110,129 people from the region daily commute to Oklahoma for work. This speaks to the importance of Oklahoma as the driving economic engine of the region. Note: 2008 data was used in completing the study and was the most recent data available. The document updates commuter flow information from the year The recent availability of LED On The Map tool will now enable the data to be updated annually and not rely on the decennial census. The full report, Regional Commuting Patterns and Workforce Mobility within the Greater Oklahoma City Partnership Region, is available at Further questions and comments can be directed to Eric Long, Economic Research Manager, elong@okcchamber.com. Total Daily Commuting Workforce 170,419 (compared to 133,660 in 2000) Total - $6.4 billion (compared to $3.4 billion in 2000) 2
4 645 51, , , , Workforce Mobility Exported : $44,231,409 Imported: $74,166,672 Kingfisher 1,977 1, Logan OUTBOUND INBOUND Payne 10,425 4, ,008 Exported : 435 $84,837,632 Imported: $418,470,454 4, Daily 170, % Exported : $14,476,571 Imported: $169,064,168 * Exported : $393,328,821 Imported: $1,294,194,988 Exported : $88,083,636 Imported: $258,600,854 Canadian 31,997 11,541 6,777 2,833 Grady 967 Exported : $4,587,533,624 Imported: $1,116,535,870 7,483 34,550 28,016 Exported : $98,299,226 Imported: $283,167, Exported : $869,355,986 Imported: $2,334,914,457 7,526 Oklahoma McClain 57,599 26,678 Cleveland 3, ,129 2, ,172 1,574 10,124 5,178 Pottawatomie Lincoln 4,928 2,060 Exported : $61,385,940 Imported: $181,422,560 Exported : $150,089,508 Imported: $391,315,009 Source: LED On The Map 2008, Bureau of Labor Statistics * Note: Daily value in the black box above represents the total commuters between counties within the partnership region (170,419). Furthermore, 32.7% of the workforce in the partnership region commutes between counties daily. 3
5 Net Worker Flow Net Outflow Net Inflow Kingfisher Logan Payne ,417 Canadian -20,456 Oklahoma 75,579 Lincoln -2,868 Cleveland -3,944-30,921-4,946 Grady -4,060 McClain Pottawatomie Source: LED On The Map 2008, Bureau of Labor Statistics 4

6 Net Net Export Net Import Kingfisher Logan Payne $154,587,597 $29,935,263 $333,632,822 Canadian $900,866,167 Oklahoma -$3,470,997,754 Lincoln $120,036,620 Cleveland $170,517,218 $1,465,558,471 $241,225,501 Grady $184,868,095 McClain Pottawatomie Source: LED On The Map 2008, Bureau of Labor Statistics 5

7 Where are Employed Employed takes account of every worker employed within a county, regardless of where that worker lives. This includes both workers that commute to a given county as well as workers that live and worker in the same county. employment is useful in measuring the impact that a particular county has on an entire region. This measure is particularly useful because it allows policy makers to see where jobs are located, and where more jobs may be needed. In many ways, job location has become increasingly less important. In today s society workers are choosing to live farther from work, which makes job location less dependent on an immediate population. are more willing to commute to work. These commuting patterns are particularly useful to the Greater Oklahoma City Partnership because workers are willing and able to travel throughout the region to find the best job opportunities. Total Employment Canadian 27,799 Cleveland 77,741 Grady 12,711 Kingfisher 6,659 Lincoln 7,358 Logan 7,699 McClain 7,694 Oklahoma 413,292 Payne 31,318 Pottawatomie 21,880 Source: US Census Bureau LED On The Map,
8 Where Live This data takes account every worker that lives in a given county, regardless of county employment. This includes both workers that commute from a given county as well as workers that live and work in the same county. Nearly 33% of all workers in the Greater Oklahoma City Partnership Region commute between counties. This high level of commuting activity illustrates the importance of collaboration between counties. For instance, Oklahoma has about 350,000 working residents, but the total employment of the county is nearly 420,000. These additional 70,000 workers come from surrounding communities. Since Oklahoma has a relatively high wage rate, this influx of workers benefits the entire region, not just the region of employment. Working Residents Canadian 49,495 Cleveland 109,548 Grady 17,615 Kingfisher 6,892 Lincoln 10,010 Logan 15,993 McClain 12,546 Oklahoma 315,328 Payne 30,908 Pottawatomie 27,079 Source: US Census Bureau LED On The Map,
9 Worker Flows by Worker flows are at the center of commuting patterns. These flows are used in calculations of payroll data as well as net worker flow. At the heart of the matter is determining where workers work and live. Understanding this data is essential to show the value of a particular region. Indeed, the partnership is only as viable as its parts; every county is important no matter its size, payroll or location. This data is evidence that the entire region is interdependent. In commute Live & Work Out commute Canadian 11,541 12,252 31,997 Cleveland 26,678 40,171 57,599 Grady 2,833 7,152 6,777 Kingfisher 1,237 3,454 1,977 Lincoln 2,060 3,082 4,928 Logan 3,008 3,606 10,425 McClain 3,466 2,783 7,526 Oklahoma 110, ,232 34,550 Payne 4,289 18,770 4,516 Pottawatomie 5,178 12,466 10,124 Source: US Census Bureau LED On The Map,
10 Generated generated accounts for the total payroll earned as a result of jobs in a given county. This data does not take into account the flow of workers; rather, it serves as a reference for the amount of payroll generated as a result of employment within a county. This data is useful in determining a numerical approximation of the overall impact an individual county has on the economy of the entire region. Not surprisingly, counties with more workers and more residents produce higher payrolls. Although payroll generated is important, it does not take into account the supply of workers from different Generated Percent of Total Canadian $ 947,417, % Cleveland $ 2,533,345, % Grady $ 395,210, % Kingfisher $ 238,105, % Lincoln $ 219,261, % Logan $ 217,142, % McClain $ 218,209, % Oklahoma $ 17,216,091, % Payne $ 1,056,638, % Pottawatomie $ 634,213, % TOTAL $ 23,675,636,367 Sources: US Census Bureau LED On The Map, Bureau of Labor Statistics, 2008 counties and their impact. Consequently, it would be unwise to consider payroll generated as the sole indicator of a county s economic value to the region as a whole. 9
11 Flows The chart to the right shows the payroll imported and exported by county. Exported payroll is the payroll of workers employed in a given county but live in a separate county. Imported payroll is the payroll of residents of a given county but work in another county. flows attempt to show the overall economic value of worker movements between counties. In the next section, we will examine the ramifications of net payroll flow and how it relates to payroll imported and payroll exported. Imported Exported Canadian $ 1,294,194,988 $ 393,328,821 Cleveland $ 2,334,914,457 $ 869,355,986 Grady $ 258,600,854 $ 88,083,636 Kingfisher $ 74,166,672 $ 44,231,409 Lincoln $ 181,422,560 $ 61,385,940 Logan $ 418,470,454 $ 84,837,632 McClain $ 283,167,321 $ 98,299,226 Oklahoma $ 1,116,535,870 $ 4,587,533,624 Payne $ 169,064,168 $ 14,476,571 Pottawatomie $ 391,315,009 $ 150,089,508 Sources: US Census Bureau LED On The Map, Bureau of Labor Statistics QCEW, 2008 Imported Exported 10
12 Net Imported Net payroll imported is defined as total payroll imported less total payroll exported. Counties that are net importers tend to rely on the jobs found in net exporting counties. All counties except Oklahoma are net importers of payroll. This implies that Oklahoma provides many jobs to the surrounding communities. Further, surrounding communities rely on Oklahoma for jobs for their residents, as well as income generated in Oklahoma to sustain industry and tax bases in the various surrounding communities. Conversely, Oklahoma relies on neighboring communities to bolster the workforce in the county. Numerical results are found in the table to the right. Graphical results are below. Net Imported Canadian $900,866,167 Cleveland $1,465,558,471 Grady $170,517,218 Kingfisher $29,935,263 Lincoln $120,036,620 Logan $333,632,822 McClain $184,868,095 Oklahoma ($3,470,997,754) Payne $154,587,597 Pottawatomie $241,225,501 Sources: US Census Bureau LED On The Map, Bureau of Labor Statistics QCEW,
13 by Gender The Oklahoma City Partnership region is defined by a fairly even distribution of jobs between genders. To the right, a numerical breakdown of employment by gender is given for each county in the partnership. In seven of the ten partnership counties, the number of male workers exceeds the number of female workers, whereas in three counties the number of female workers exceeds the number of male workers. Kingfisher has the highest relative male employment at 58.52%. Pottawatomie has the highest relative female employment at 53.49%. For the total partnership region, males make up 50.23% of the total workforce while females make up 49.77% of total workers. The following chart depicts the above data. As evidenced above, employment by gender is relatively even across all partnership counties. Male Female Canadian 14,797 12,163 Cleveland 36,371 41,236 Grady 6,504 6,150 Kingfisher 3,513 2,490 Lincoln 3,795 3,675 Logan 3,778 3,999 McClain 3,920 3,600 Oklahoma 208, ,116 Payne 15,845 15,589 Pottawatomie 9,937 11,428 Total 307, ,446 Source: US Census Bureau QWI Online,
14 Job Creation 2008 was an excellent year for jobs in the Greater Oklahoma City Partnership region. All ten partnership counties experienced job creation. Oklahoma experienced the highest job creation at 23,103 while Kingfisher experienced the least job creation at 357. Oklahoma s job creation represents 7.33% of the county s resident workers, the highest in the region. Logan, on the other hand, experienced the lowest ratio of job creation to resident workers at 3.21%. Although this data is encouraging, it is important to remember that the data represents 2008 when the economy was hitting on all cylinders. Below is a graphical representation of job creation by county. As expected, counties with more jobs tend to have the highest amount of created jobs. Job Creation Canadian 2,141 Cleveland 4,395 Grady 747 Kingfisher 357 Lincoln 616 Logan 514 McClain 520 Oklahoma 23,103 Payne 1,568 Pottawatomie 1,172 Total 35,133 Source: US Census Bureau QWI Online,
15 Net Job Flow As with job creation, net job flow data was positive for the region in Net job flow is defined as the total inflow of jobs to the region less the total outflow of jobs from the region. Alternatively, it can be defined as the sum of the differences between current and previous employment at each business for a particular year. All counties except Pottawatomie experienced positive net job flow in Oklahoma led the way with 1,113. Lincoln had the greatest ratio of net job flow to employment at 3.11% while Pottawatomie had the least at -1.44%. Net Job Flow Canadian 443 Cleveland 492 Grady 40 Kingfisher 80 Lincoln 229 Logan 67 McClain 27 Oklahoma 1,113 Payne 43 Pottawatomie -314 Total 2,220 Source: US Census Bureau QWI Online,
16 Detail 15
17 Canadian Canadian sits in an advantageous position. It is close to vibrant, metropolitan Oklahoma City, and contains growing communities such as Yukon, Mustang, and El Reno. Canadian receives 11,541 workers from other partnership counties, and sends off 31,997 workers to other partnership counties. Although the county is a net exporter of workers, it benefits from the large number of employees that call Canadian county home. Canadian Imported Exported Canadian $ 1,294,194,988 $ 393,328,821 Sources: US Census Bureau LED On The Map, Bureau of Labor Statistics QCEW,
18 Where Canadian Live: Canadian 12,252 Cleveland 1,643 Grady 645 Kingfisher 584 Lincoln 144 Logan 295 McClain 249 Oklahoma 7,483 Payne 180 Pottawatomie 318 Total Inflow 11,541 Source: US Census Bureau LED On The Map, 2008 Where Canadian Residents Work: Canadian 12,252 Cleveland 2,291 Grady 412 Kingfisher 266 Lincoln 101 Logan 198 McClain 237 Oklahoma 28,016 Payne 225 Pottawatomie 251 Total Outflow 31,997 Source: US Census Bureau LED On The Map,
19 Cleveland Cleveland benefits from the firms in its area as well as its proximity to Oklahoma City. Cleveland is home to the University of Oklahoma, and the county employs 26,678 workers. Although 57,599 residents work in neighboring partnership counties, particularly Oklahoma, Cleveland s payroll imported far exceeds its payroll exported. Thus, Cleveland, despite its residents leaving the county to work elsewhere, benefits from employment both in the county and in surrounding counties. Cleveland Imported Exported Cleveland $ 2,334,914,457 $ 869,355,986 Sources: US Census Bureau LED On The Map, Bureau of Labor Statistics QCEW,

20 Where Cleveland Live: Canadian 2,291 Cleveland 40,171 Grady 967 Kingfisher 96 Lincoln 379 Logan 605 McClain 2,341 Oklahoma 17,870 Payne 555 Pottawatomie 1,574 Total Inflow 26,678 Source: US Census Bureau LED On The Map, 2008 Where Cleveland Residents Work: Canadian 1,643 Cleveland 40,171 Grady 607 Kingfisher 80 Lincoln 161 Logan 222 McClain 1,604 Oklahoma 51,601 Payne 509 Pottawatomie 1,172 Total Outflow 57,599 Source: US Census Bureau LED On The Map,
21 Grady Grady certainly benefits from its position as a part of the Oklahoma City Metropolitan Statistical Area. Chickasha, the county seat, is the largest community in the county. Overall, Grady receives 2,833 commuters from neighboring partnership areas, bolstering the workforce in the county. Approximately 6,777 residents work outside of the county, but Grady benefits from the overall importation of payroll, sustaining the quality of life Grady county residents enjoy. Grady Imported Exported Grady $ 258,600,854 $ 88,083,636 Sources: US Census Bureau LED On The Map, Bureau of Labor Statistics QCEW,


22 Where Grady Live: Canadian 412 Cleveland 607 Grady 7,152 Kingfisher 23 Lincoln 58 Logan 59 McClain 361 Oklahoma 1,190 Payne 52 Pottawatomie 71 Total Inflow 2,833 Source: US Census Bureau LED On The Map, 2008 Where Grady Residents Work: Canadian 645 Cleveland 967 Grady 7,152 Kingfisher 46 Lincoln 30 Logan 107 McClain 392 Oklahoma 4,328 Payne 116 Pottawatomie 146 Total Outflow 6,777 Source: US Census Bureau LED On The Map,

23 Kingfisher Kingfisher sits at the northwestern edge of the Greater Oklahoma City partnership region. Although its location on the fringe of the region diminishes the commuter impact on the county, this impact is still significant. Kingfisher receives 1,237 workers from neighboring counties within the partnership, and sends out 1,977 workers to other partnership counties. Kingfisher certainly benefits from its mobile workforce, proximity to Oklahoma City, and high standard of living. Kingfisher Imported Exported Kingfisher $ 74,166,672 $ 44,231,409 Sources: US Census Bureau LED On The Map, Bureau of Labor Statistics QCEW,
24 Where Kingfisher Live: Canadian 266 Cleveland 80 Grady 46 Kingfisher 3,454 Lincoln 24 Logan 213 McClain 36 Oklahoma 487 Payne 44 Pottawatomie 41 Total Inflow 1,237 Source: US Census Bureau LED On The Map, 2008 Where Kingfisher Residents Work: Canadian 584 Cleveland 96 Grady 23 Kingfisher 3,454 Lincoln 6 Logan 84 McClain 35 Oklahoma 1,050 Payne 57 Pottawatomie 42 Total Outflow 1,977 Source: US Census Bureau LED On The Map,

25 Lincoln Lincoln sits at the eastern edge of the Greater Oklahoma City partnership region. Chandler, the county seat, is the largest community in the county. Lincoln receives 2,060 workers from surrounding partnership counties. Lincoln also sends 4,928 residents to jobs in neighboring partnership counties. Although Lincoln is a net exporter of workers, the county benefits from residents that bring their income back to the county. The net influx of payroll certainly helps maintain the quality of life in Lincoln. Lincoln Imported Exported Lincoln $ 181,422,560 $ 61,385,940 Sources: US Census Bureau LED On The Map, Bureau of Labor Statistics QCEW,
26 Where Lincoln Live: Canadian 101 Cleveland 161 Grady 30 Kingfisher 6 Lincoln 3,082 Logan 74 McClain 45 Oklahoma 672 Payne 311 Pottawatomie 660 Total Inflow 2,060 Source: US Census Bureau LED On The Map, 2008 Where Lincoln Residents Work: 25 Canadian 144 Cleveland 379 Grady 58 Kingfisher 24 Lincoln 3,082 Logan 53 McClain 35 Oklahoma 2,564 Payne 794 Pottawatomie 877 Total Outflow 4,928 Source: US Census Bureau LED On The Map, 2008
27 Logan Logan sits in an advantageous position. It is immediately to the north of Oklahoma City and benefits from being located next to Oklahoma, the largest county by population in the state. This explains why Logan is a net exporter of workers. Logan gains 3,008 workers from surrounding partnership areas, but sends off 10,425 residents to work in nearby counties, particularly Oklahoma. Although Logan residents largely leave the county to work, they bring their income back to the Logan. Logan Imported Exported Logan $ 418,470,454 $ 84,837,632 Sources: US Census Bureau LED On The Map, Bureau of Labor Statistics QCEW,
28 Where Logan Live: Canadian 198 Cleveland 222 Grady 107 Kingfisher 84 Lincoln 53 Logan 3,606 McClain 27 Oklahoma 1,958 Payne 301 Pottawatomie 58 Total Inflow 3,008 Source: US Census Bureau LED On The Map, 2008 Where Logan Residents Work: Canadian 295 Cleveland 605 Grady 59 Kingfisher 213 Lincoln 74 Logan 3,606 McClain 54 Oklahoma 8,599 Payne 435 Pottawatomie 91 Total Outflow 10,425 Source: US Census Bureau LED On The Map,

29 McClain McClain sits at the southernmost edge of the Greater Oklahoma City Partnership Region. It is a popular residential region centered on the regional hubs of Purcell and Newcastle. Overall, McClain gains 3,466 workers from other partnership counties, and sends 7,526 residents to jobs in neighboring partnership counties. Although many residents leave the county to work, the region greatly benefits from its proximity to Oklahoma City and the prosperity that it brings to McClain. McClain Imported Exported McClain $ 283,167,321 $ 98,299,226 Sources: US Census Bureau LED On The Map, Bureau of Labor Statistics QCEW,
30 Where McClain Live: Canadian 237 Cleveland 1,604 Grady 392 Kingfisher 35 Lincoln 35 Logan 54 McClain 2,783 Oklahoma 914 Payne 72 Pottawatomie 123 Total Inflow 3,466 Source: US Census Bureau LED On The Map, 2008 Where McClain Residents Work: Canadian 249 Cleveland 2,341 Grady 361 Kingfisher 36 Lincoln 45 Logan 27 McClain 2,783 Oklahoma 4,255 Payne 82 Pottawatomie 130 Total Outflow 7,526 Source: US Census Bureau LED On The Map,
31 Oklahoma Oklahoma is at the center of the Greater Oklahoma City Partnership, both physically and economically. Oklahoma is the only county in the region to gain more workers than it sends out. Oklahoma gains 110,129 workers from partnership counties alone, and sends out 34,550 workers to partnership counties. Oklahoma is also unique in that the county exports more payroll than it imports. This is indicative of the county s role in the region. Oklahoma serves as a regional hub for employment as well as arts and culture. The economic growth in Oklahoma has spilled over into all the counties within the partnership. Oklahoma is the economic focus of the region, impacting all ten partnership counties. Oklahoma Imported Exported Oklahoma $ 1,116,535,870 $ 4,587,533,624 Sources: US Census Bureau LED On The Map, Bureau of Labor Statistics QCEW,
32 Where Oklahoma Live: Canadian 28,016 Cleveland 51,601 Grady 4,328 Kingfisher 1,050 Lincoln 2,564 Logan 8,599 McClain 4,255 Oklahoma 247,232 Payne 2,752 Pottawatomie 6,964 Total Inflow 110,129 Source: US Census Bureau LED On The Map, 2008 Where Oklahoma Residents Work: Canadian 7,483 Cleveland 17,870 Grady 1,190 Kingfisher 487 Lincoln 672 Logan 1,958 McClain 914 Oklahoma 247,232 Payne 1,756 Pottawatomie 2,220 Total Outflow 34,550 Source: US Census Bureau LED On The Map,
33 Payne Payne sits at the northeastern corner of the Greater Oklahoma City partnership region. Home to Oklahoma State University and situated between Oklahoma City and Tulsa, the county enjoys economic advantages of its location. Payne receives 4,289 workers from other partnership counties, while it sends 4,516 residents to jobs in other partnership regions. Stillwater is the county seat and the largest city in the county, serving as the economic focus of the region. Payne Imported Exported Payne $ 169,064,168 $ 14,476,571 Sources: US Census Bureau LED On The Map, Bureau of Labor Statistics QCEW,
34 Where Payne Live: Canadian 225 Cleveland 509 Grady 116 Kingfisher 57 Lincoln 794 Logan 435 McClain 82 Oklahoma 1,756 Payne 18,770 Pottawatomie 315 Total Inflow 4,289 Source: US Census Bureau LED On The Map, 2008 Where Payne Residents Work: 33 Canadian 180 Cleveland 555 Grady 52 Kingfisher 44 Lincoln 311 Logan 301 McClain 72 Oklahoma 2,752 Payne 18,770 Pottawatomie 249 Total Outflow 4,516 Source: US Census Bureau LED On The Map, 2008
35 Pottawatomie Pottawatomie sits at the southeastern corner of the Greater Oklahoma City partnership region. Shawnee, the county seat and largest city, is the economic focus of the Pottawatomie. Overall, Pottawatomie employs 5,178 workers from other partnership counties, and 10,124 residents of Pottawatomie are employed in other partnership counties. Although Pottawatomie is a net exporter of jobs, many residents bring their income back into the region, helping to keep Pottawatomie an attractive place to live. Pottawatomie Imported Exported Pottawatomie $ 391,315,009 $ 150,089,508 Sources: US Census Bureau LED On The Map, Bureau of Labor Statistics QCEW,
36 Where Pottawatomie Live: Canadian 251 Cleveland 1,172 Grady 146 Kingfisher 42 Lincoln 877 Logan 91 McClain 130 Oklahoma 2,220 Payne 249 Pottawatomie 12,466 Total Inflow 5,178 Source: US Census Bureau LED On The Map, 2008 Where Pottawatomie Residents Work: Canadian 318 Cleveland 1,574 Grady 71 Kingfisher 41 Lincoln 660 Logan 58 McClain 123 Oklahoma 6,964 Payne 315 Pottawatomie 12,466 Total Outflow 10,124 Source: US Census Bureau LED On The Map,
37 Methodologies Although the commuter patterns study is merely an update, there are several significant improvements from the previous report. This report contains information on the flow of workers between counties, as well as the flow of employees payroll between counties. The data reflects information from 2008 (the most recent data available). The data on the flow of workers between counties within the Greater Oklahoma City Partnership was obtained using the U.S. Census Bureau s On The Map 4 interactive database. By using the Paired Labor Shed Analysis function, selecting all jobs, and choosing the year 2008, we were able to see where employees live and work. This database was not available at the time of the previous study, but it now allows us to determine complete interaction between partnership counties. Once data was obtained for all counties, we determined the worker flows between counties. This data can be found at: The data on payroll was obtained, in part, from data from the U.S. Bureau of Labor Statistics. Within the employment databases, the State and Employment and Wages (also known as QCEW) database was used to determine the average wage in each county in Once this data was found, each specific county s wage was multiplied by the number of workers commuting to and from the specific county. exported was determined by multiplying the wage in the county by the number of workers that commute to the county, but live in another partnership county. The imported was determined by looking at the number of workers that live in the county in question, but work in another partnership county. The number of workers commuting to each county was multiplied by each county s respective average wage and was then summed. This effectively tells us how much workers commuting from a given county make in the counties where they work. Information on payroll generated was obtained by simply multiplying the total workforce in each county (from On The Map) by 36
38 the average wage in that county (from BLS State and Employment and Wages). This data can be found at: Data on net job flow, job creation, and workers by gender were obtained using the QWI data from the Local Employment Dynamics database at the US Census Bureau. Once within the database, we selected the year in question (for our study, 2008) by adjusting the selector to quarter 4 and reading from the chart column titled Avg:Selected + 3 Prior qtrs. The chart will give the data for net job flow and job creation. Simply select the county in question from the drop-down menu to obtain the pertinent information. Data on workers by gender was obtained using the same database (QWI). First, select the correct year and county as described above. Next select male or female from the drop-down menu for each county in question (again, be sure to read the column Avg:Selected + 3 Prior qtrs to get an annual average. This data can be found at: In summation, the Greater Oklahoma City Chamber would like to thank the Census Bureau and the Bureau of Labor Statistics for making available the data for the study. We hope you find the information contained to be relevant and useful. For further information, please contact: Greater Oklahoma City Partnership Eric Long Economic Development elong@okcchamber.com 37
Oklahoma Marijuana Arrests
 Working to Reform Marijuana Laws The NORML Almanac of Marijuana Arrest Statistics Oklahoma Marijuana Arrests Marijuana Arrests 1995-2002 (Summary) Marijuana Possession Arrests-2002 (Demographics) Marijuana
ECONOMY MICROCLIMATES IN THE PORTLAND-VANCOUVER REGIONAL ECONOMY
 MICROCLIMATES IN THE PORTLAND-VANCOUVER REGIONAL by Sheila Martin, Director of the Institute of Portland Metropolitan Studies, Portland State University 1 Introduction The Regional Labor Market Portland-Vancouver
Economic and Demographic Trends
 Economic and Demographic Trends Minden, Kearney County, and the Surrounding Area March 2015 Prepared by: Ken Lemke Nebraska Public Power District Economic Development Department PO Box 499, 1414 15 th
CÉSAR M. MELGOZA / FOUNDER & CEO
 CÉSAR M. MELGOZA / FOUNDER & CEO Although the current rhetoric from the White House about immigration and wall-building diminishes the perceptions of immigrants and specifically Hispanics, it is imperative
EPI BRIEFING PAPER. Immigration and Wages Methodological advancements confirm modest gains for native workers. Executive summary
 EPI BRIEFING PAPER Economic Policy Institute February 4, 2010 Briefing Paper #255 Immigration and Wages Methodological advancements confirm modest gains for native workers By Heidi Shierholz Executive
The Impact of Interprovincial Migration on Aggregate Output and Labour Productivity in Canada,
 The Impact of Interprovincial Migration on Aggregate Output and Labour Productivity in Canada, 1987-26 Andrew Sharpe, Jean-Francois Arsenault, and Daniel Ershov 1 Centre for the Study of Living Standards
New York Saw Boost in Restaurant Worker Wages and Employment after Tipped Minimum Wage Increase
 New York Saw Boost in Restaurant Worker Wages and Employment after Tipped Minimum Wage Increase A Policy Brief by the Institute for Policy Studies and Restaurant Opportunities Centers United January 4,
Bringing the Census to schools
 Bringing the Census to schools 6 th Year Course In preparation for: 1 Table of Contents Introduction to Population Studies... 3 Lesson 1... 4 You will need... 4 Objectives... 4 Calculating Population Density...
The Road to Work: Commuting in Wyoming
 The Road to Work: Commuting in Wyoming and what it means for Economic Development Community Planning Policy Making Resource Use Employee Recruiting Executive Summary Last year, the Wyoming Workforce Development
Chapter 7. Migration
 Chapter 7 Migration Chapter 7 Migration Americans have traditionally been highly higher levels of educational attainment than Figure 7-1. mobile, with nearly 1 in 7 people changing residence each year.
The State of Rural Minnesota, 2019
 P.O. Box 3185 Mankato, MN 56002-3185 (507)934-7700 www.ruralmn.org The State of Rural Minnesota, 2019 January 2019 By Kelly Asche, Research Associate Each year, the Center for Rural Policy and Development
AN ANALYSIS OF THE LABOR FORCE OF THE LAWTON, OKLAHOMA LABOR MARKET
 LOCAL AREA LABOR FORCE STUDIES AN ANALYSIS OF THE LABOR FORCE OF THE LAWTON, OKLAHOMA LABOR MARKET A SUMMARY REPORT PRESENTED TO Lawton Chamber of Commerce and Industry and Oklahoma Department of Commerce
Employment and Economic Trends
 Employment and Economic Trends January 2019 Employment and Economy While many factors influence the need for housing, employment opportunities represent a predominant demand-generator. Without jobs and
MIGRATION CHALLENGES
 MIGRATION CHALLENGES Trends in People s Movement to and from the Milwaukee Area and Wisconsin Illuminate Important Issues By John D. Johnson and Charles Franklin Marquette Law School launched the Lubar
Labor Supply Factors and Labor Availability for the Geneva (Fillmore County) Labor Area
 Labor Area") Labor Supply Factors and Labor Availability for the Geneva (Fillmore County) Labor Area June 2015 Prepared by: Kenneth M. Lemke, Ph.D. Economist Nebraska Public Power District 1414 15 th Street - P.O.
Labor Supply Factors and Labor Availability for the Geneva (Fillmore County) Labor Area June 2015 Prepared by: Kenneth M. Lemke, Ph.D. Economist Nebraska Public Power District 1414 15 th Street - P.O.
Pull Factors: A Measure of Retail Sales Success Estimates for 77 Oklahoma Cities (2018) July 2018
 July 2018") Oklahoma Cooperative Extension Service AGEC-1079 Pull Factors: A Measure of Retail Sales Success Estimates for 77 Oklahoma Cities (2018) July 2018 Ryan Loy Undergraduate Research Assistant Brian Whitacre
Oklahoma Cooperative Extension Service AGEC-1079 Pull Factors: A Measure of Retail Sales Success Estimates for 77 Oklahoma Cities (2018) July 2018 Ryan Loy Undergraduate Research Assistant Brian Whitacre
STRENGTHENING RURAL CANADA: Fewer & Older: Population and Demographic Crossroads in Rural Saskatchewan. An Executive Summary
 STRENGTHENING RURAL CANADA: Fewer & Older: Population and Demographic Crossroads in Rural Saskatchewan An Executive Summary This paper has been prepared for the Strengthening Rural Canada initiative by:
Riverside Labor Analysis. November 2018
 November 2018 The City of Labor Market Dynamics and Local Cost of Living Analysis Executive Summary The City of is located in one of the fastest growing parts of California. Over the period 2005-2016,
With the notable exception of the migration of Oklahomans to California during the Dust Bowl years in
 OKLAHOMA KIDS COUNT ISSUE BRIEF 2013 Voices for Oklahoma s Future. www.oica.org 3909 N. Classen Blvd., Suite 101 Oklahoma City, OK 73118 (405) 236-5437 [KIDS] info@oica.org Changing Demographics: A Catalyst
WILLIAMSON STATE OF THE COUNTY Capital Area Council of Governments
 WILLIAMSON STATE OF THE COUNTY 2011 Capital Area Council of Governments POPULATION Capital Area Council of Governments POPULATION THE RISE OF TEXAS During the past decade, the State of Texas has proved
Private Sector Commission
 Private Sector Commission Technical Information Bulletin No. 4 Labour Force and Employment in the Guyana Economy Private Sector Commission 157 Waterloo Street North Cummingsburg Georgetown Labour Force
Povery and Income among African Americans
 Povery and Income among African Americans Black Median Household income: $35,481 (all races $53,657) All Black Workers 2015 weekly earnings:$624 (all races $803) Black Men weekly earnings: $652 (All men
An Equity Assessment of the. St. Louis Region
 An Equity Assessment of the A Snapshot of the Greater St. Louis 15 counties 2.8 million population 19th largest metropolitan region 1.1 million households 1.4 million workforce $132.07 billion economy
Community Economic Impact Study of the Proposed Kenosha-Racine-Milwaukee (KRM) Commuter Rail
 Commuter Rail") Institute for Survey and Policy Research P. O. Box 413 Milwaukee, WI 53201 Community Economic Impact Study of the Proposed Kenosha-Racine-Milwaukee (KRM) Commuter Rail Prepared by the Institute for Survey
Institute for Survey and Policy Research P. O. Box 413 Milwaukee, WI 53201 Community Economic Impact Study of the Proposed Kenosha-Racine-Milwaukee (KRM) Commuter Rail Prepared by the Institute for Survey
3 SOCIOECONOMIC ANALYSIS
 3 SOCIOECONOMIC ANALYSIS A. INTRODUCTION Cumberland, Maryland has historically been the center for manufacturing and industry within Western Maryland with multimodal (rail, auto, and recreation) transportation
Summary of the U.S. Census Bureau s 2015 State-Level Population Estimate for Massachusetts
 Summary of the U.S. Census Bureau s 2015 State-Level Population Estimate for Massachusetts Prepared by: Population Estimates Program For Release December 22, 2015 On December 22, 2015, the U.S. Census
Economic Trends Report: Miami County
 THE UNIVERSITY OF KANSAS Kansas Center for Community Economic Development Policy Research Institute TECHNICAL REPORT SERIES Economic Trends Report: Miami County Prepared by Luke Middleton Research Economist
Population Vitality Overview
 8 Population Vitality Overview Population Vitality Overview The Population Vitality section covers information on total population, migration, age, household size, and race. In particular, the Population
FISCAL POLICY INSTITUTE
 FISCAL POLICY INSTITUTE Learning from the 90s How poor public choices contributed to income erosion in New York City, and what we can do to chart an effective course out of the current downturn Labor Day,
Structural Change: Confronting Race and Class
 Structural Change: Confronting Race and Class THE KIRWAN INSTITUTE FOR THE STUDY OF RACE AND ETHNICITY & ISAIAH OHIO ORGANIZING COLLABORATIVE WEEKLONG TRAINING TOLEDO, OH JULY 19, 2010 Presentation Overview
Broward by the Numbers 1
 Broward County experiences a net loss of during the daytime, because many residents commute to neighboring counties. Within the County, Fort Lauderdale, Pompano Beach, Deerfield Beach and Pembroke Park
8AMBER WAVES VOLUME 2 ISSUE 3
 8AMBER WAVES VOLUME 2 ISSUE 3 F E A T U R E William Kandel, USDA/ERS ECONOMIC RESEARCH SERVICE/USDA Rural s Employment and Residential Trends William Kandel wkandel@ers.usda.gov Constance Newman cnewman@ers.usda.gov
PRESENT TRENDS IN POPULATION DISTRIBUTION
 PRESENT TRENDS IN POPULATION DISTRIBUTION Conrad Taeuber Associate Director, Bureau of the Census U.S. Department of Commerce Our population has recently crossed the 200 million mark, and we are currently
Population Dynamics in the Greater Golden Horseshoe Millennials vs. Baby Boomers
 Population Dynamics in the Greater Golden Horseshoe Millennials vs. Baby Boomers November 19, 2015 Population Dynamics in the Greater Golden Horseshoe Millennials vs. Baby Boomers Campus Location The opinions
The State of. Working Wisconsin. Update September Center on Wisconsin Strategy
 The State of Working Wisconsin Update 2005 September 2005 Center on Wisconsin Strategy About COWS The Center on Wisconsin Strategy (COWS), based at the University of Wisconsin-Madison, is a research center
Regional Data Snapshot
 Regional Data Snapshot Population, Economy & Education Features SET Civic Forum Glacial Lakes Region, South Dakota Table of Contents 01 Overview 03 Human Capital 02 Demography 04 Labor Force 01 overview
Labor Supply Factors and Labor Availability for the Fillmore County, Nebraska Labor Area
 Labor Supply Factors and Labor Availability for the Fillmore County, Nebraska Labor Area September 2018 Prepared by: Kenneth M. Lemke, Ph.D. Economist Nebraska Public Power District 1414 15 th Street -
The Tenth District s Brain Drain: Who Left and What Did It Cost?
 The Tenth District s Brain Drain: Who Left and What Did It Cost? By Deron Ferguson Most of the Tenth Federal Reserve District states experienced a brain drain, or an outmigration of highly educated people,
Regional Data Snapshot
 Regional Data Snapshot Population, Economy & Education Features SET Civic Forum East Central NM, New Mexico Table of Contents 01 Overview 03 Human Capital 02 Demography 04 Labor Force 01 overview East
Definition: The number of disposed cases as a percentage of the Active Caseload.
 Definition: The number of disposed cases as a percentage of the Active Caseload. Analysis and Interpretation: The disposition rate is a measure of the cases a court disposed in the quarter compared to
The movement of people into and out of a state can have important
 Migration in the Tenth District: Long-Term Trends and Current Developments By William R. Keeton and Geoffrey B. Newton The movement of people into and out of a state can have important implications for
Community Snapshot Whitehorse, Yukon
 Introduction This snapshot was prepared using the Rural Secretariat s Community Information Database (www.cid-bdc.ca), a free online resource developed to provide rural communities and governments with
Online Appendices for Moving to Opportunity
 Online Appendices for Moving to Opportunity Chapter 2 A. Labor mobility costs Table 1: Domestic labor mobility costs with standard errors: 10 sectors Lao PDR Indonesia Vietnam Philippines Agriculture,
Part 1: Focus on Income. Inequality. EMBARGOED until 5/28/14. indicator definitions and Rankings
 Part 1: Focus on Income indicator definitions and Rankings Inequality STATE OF NEW YORK CITY S HOUSING & NEIGHBORHOODS IN 2013 7 Focus on Income Inequality New York City has seen rising levels of income
Job Displacement Over the Business Cycle,
 cepr CENTER FOR ECONOMIC AND POLICY RESEARCH Briefing Paper Job Displacement Over the Business Cycle, 1991-2001 John Schmitt 1 June 2004 CENTER FOR ECONOMIC AND POLICY RESEARCH 1611 CONNECTICUT AVE., NW,
STRENGTHENING RURAL CANADA: Fewer & Older: The Coming Demographic Crisis in Rural Ontario
 STRENGTHENING RURAL CANADA: Fewer & Older: The Coming Demographic Crisis in Rural Ontario An Executive Summary 1 This paper has been prepared for the Strengthening Rural Canada initiative by: Dr. Bakhtiar
As Figure 1 below shows, unemployment levels jumped significantly during the
 June 2012 Like all American cities, San Diego suffered from the 2008 financial crisis and ensuing recession. Gradual and positive trends in unemployment, real estate, tourism and production indicate that
Melissa Scopilliti Eric B. Jensen Population Division U.S. Census Bureau
 The Impact of Revising the International Migration Components on the 2010 Demographic Analysis Sex Ratios By Melissa Scopilliti Eric B. Jensen Population Division U.S. Census Bureau Poster to be presented
Illinois: State-by-State Immigration Trends Introduction Foreign-Born Population Educational Attainment
 Illinois: State-by-State Immigration Trends Courtesy of the Humphrey School of Public Affairs at the University of Minnesota Prepared in 2012 for the Task Force on US Economic Competitiveness at Risk:
COMPARATIVE ANALYSIS OF NEIGHBORHOOD CONTEXTS: ANNIE E. CASEY FOUNDATION CITIES
 ANNIE E. CASEY FOUNDATION MAKING CONNECTIONS INITIATIVE COMPARATIVE ANALYSIS OF NEIGHBORHOOD CONTEXTS: ANNIE E. CASEY FOUNDATION CITIES G. Thomas Kingsley and Kathryn L.S. Pettit December 2003 THE URBAN
STRENGTHENING RURAL CANADA: Fewer & Older: The Coming Population and Demographic Challenges in Rural Newfoundland & Labrador
 STRENGTHENING RURAL CANADA: Fewer & Older: The Coming Population and Demographic Challenges in Rural Newfoundland & Labrador An Executive Summary 1 This paper has been prepared for the Strengthening Rural
Union Byte By Cherrie Bucknor and John Schmitt* January 2015
 January 21 Union Byte 21 By Cherrie Bucknor and John Schmitt* Center for Economic and Policy Research 1611 Connecticut Ave. NW Suite 4 Washington, DC 29 tel: 22-293-38 fax: 22-88-136 www.cepr.net Cherrie
Regional Data Snapshot
 Regional Data Snapshot Population, Economy & Education Features SET Civic Forum Uwharrie Region, NC Table of Contents 01 Overview 03 Human Capital 02 Demography 04 Labor Force 01 overview Uwharrie Region,
Librarian Salaries: Have they kept pace with inflation? Denise M. Davis, Director Office for Research & Statistics American Library Association
 Librarian Salaries: Have they kept pace with inflation? Denise M. Davis, Director Office for Research & Statistics American Library Association July 1, 2005 The American Library Association has collected
STRENGTHENING RURAL CANADA: Fewer & Older: Population and Demographic Challenges Across Rural Canada A Pan-Canadian Report
 STRENGTHENING RURAL CANADA: Fewer & Older: Population and Demographic Challenges Across Rural Canada A Pan-Canadian Report This paper has been prepared for the Strengthening Rural Canada initiative by:
Alice According to You: A snapshot from the 2011 Census
 Research Brief 201301 Alice According to You: A snapshot from the 2011 Census Pawinee Yuhun, Dr Andrew Taylor & James Winter The Northern Institute Charles Darwin University (Image source: Alice Springs
An economic profile of Right-to-Work states
 ILLINOIS POLICY JANUARY 2015 An economic profile of Right-to-Work states Paul Kersey, Director of Labor Policy The problem Unions are powerful in Illinois, and the state allows them to sign contracts with
Who Represents Illegal Aliens?
 F E D E R ATI O N FO R AM E R I CAN I M M I G R ATI O N R E FO R M Who Represents Illegal Aliens? A Report by Jack Martin, Director of Special Projects EXECUTIVE SU M MARY Most Americans do not realize
The UK and the European Union Insights from ICAEW Employment
 The UK and the European Union Insights from ICAEW Employment BUSINESS WITH CONFIDENCE icaew.com The issues at the heart of the debate This paper is one of a series produced in advance of the EU Referendum
Summary of the U.S. Census Bureau s 2015 County-Level Population and Component Estimates for Massachusetts
 Summary of the U.S. Census Bureau s 2015 County-Level Population and Component Estimates for Massachusetts Prepared by: UMass Donahue Institute Economic and Public Policy Research Population Estimates
Dane County Trends. Dane County Trends
 Dane County Trends Dane County Trends Economic, Growth and Labor Economic, Growth and Labor Presented by: Phyllis Wilhelm Director of Economic Development your community energy company Definition of E.D.
Gone to Texas: Migration Vital to Growth in the Lone Star State. Pia Orrenius Federal Reserve Bank of Dallas June 27, 2018
 Gone to Texas: Migration Vital to Growth in the Lone Star State Pia Orrenius Federal Reserve Bank of Dallas June 27, 2018 Roadmap History/Trends in migration to Texas Role in economic growth Domestic migration
AN ANALYSIS OF THE LABOR FORCE OF THE OKMULGEE AREA IN NORTHEAST OKLAHOMA
 LOCAL AREA LABOR FORCE STUDIES AN ANALYSIS OF THE LABOR FORCE OF THE OKMULGEE AREA IN NORTHEAST OKLAHOMA A SUMMARY REPORT PRESENTED TO Okmulgee Area Development Corporation and Oklahoma Department of Commerce
Le Sueur County Demographic & Economic Profile Prepared on 7/12/2018
 Le Sueur County Demographic & Economic Profile Prepared on 7/12/2018 Prepared by: Mark Schultz Regional Labor Market Analyst Southeast and South Central Minnesota Minnesota Department of Employment and
NORTHERN ONTARIO IMMIGRATION PROFILE. Michael Haan & Elena Prokopenko
 NORTHERN ONTARIO IMMIGRATION PROFILE Michael Haan & Elena Prokopenko FALL 2015 This Employment Ontario project is funded by the Ontario government The views expressed in this document do not necessarily
Summary of the U.S. Census Bureau s 2018 State-Level Population Estimate for Massachusetts
 Summary of the U.S. Census Bureau s 2018 State-Level Population Estimate for Massachusetts Prepared by: Population Estimates Program For Release December 19, 2018 On December 19, 2018, the U.S. Census
How Have Hispanics Fared in the Jobless Recovery?
 How Have Hispanics Fared in the Jobless Recovery? William M. Rodgers III Heldrich Center for Workforce Development Rutgers University and National Poverty Center and Richard B. Freeman Harvard University
MIGRATION STATISTICS AND BRAIN DRAIN/GAIN
 MIGRATION STATISTICS AND BRAIN DRAIN/GAIN Nebraska State Data Center 25th Annual Data Users Conference 2:15 to 3:15 p.m., August 19, 2014 David Drozd Randy Cantrell UNO Center for Public Affairs Research
The Community Progress Report
 Imagine Inform Invest Inspire Working together to build a stronger community now and forever The Community Progress Report MEASURING THE WELLBEING OF GREATER 641,472 residents live in The Community Foundation
MISSISSIPPI WOMEN, WORK AND THE WAGE GAP Marianne Hill, Ph.D.
 MISSISSIPPI WOMEN, WORK AND THE WAGE GAP Marianne Hill, Ph.D. Women now make up 48% of Mississippi's workforce. They constitute the majority of workers in several industries, and their earnings account
Labor markets in the Tenth District are
 Will Tightness in Tenth District Labor Markets Result in Economic Slowdown? By Ricardo C. Gazel and Chad R. Wilkerson Labor markets in the Tenth District are tighter now than at any time in recent memory.
The Changing Faces of New England. Increasing Spatial and Racial Diversity
 Reports on New England The Changing Faces of New England Increasing Spatial and Racial Diversity Kenneth M. Johnson Building Knowledge for Families and Communities Reports on NEW ENGLAND Volume 1, Number
PI + v2.2. Demographic Component of the REMI Model Regional Economic Models, Inc.
 PI + v2.2 Demographic Component of the REMI Model 2018 Regional Economic Models, Inc. Table of Contents Overview... 1 Historical Data... 1 Population... 1 Components of Change... 1 Population Forecast...
Components of Population Change by State
 IOWA POPULATION REPORTS Components of 2000-2009 Population Change by State April 2010 Liesl Eathington Department of Economics Iowa State University Iowa s Rate of Population Growth Ranks 43rd Among All
Low-Skill Jobs A Shrinking Share of the Rural Economy
 Low-Skill Jobs A Shrinking Share of the Rural Economy 38 Robert Gibbs rgibbs@ers.usda.gov Lorin Kusmin lkusmin@ers.usda.gov John Cromartie jbc@ers.usda.gov A signature feature of the 20th-century U.S.
STATE GOAL INTRODUCTION
 STATE GOAL There is no specific state goal that addresses population; however, all other goals depend on an understanding of population and demographic data for the municipality and region. INTRODUCTION
OFFICE OF THE CONTROLLER. City Services Auditor 2005 Taxi Commission Survey Report
 OFFICE OF THE CONTROLLER City Services Auditor 2005 Taxi Commission Survey Report February 7, 2006 TABLE OF CONTENTS INTRODUCTION 3 SURVEY DATA ANALYSIS 5 I. The Survey Respondents 5 II. The Reasonableness
NBER WORKING PAPER SERIES THE EFFECT OF IMMIGRATION ON NATIVE SELF-EMPLOYMENT. Robert W. Fairlie Bruce D. Meyer
 NBER WORKING PAPER SERIES THE EFFECT OF IMMIGRATION ON NATIVE SELF-EMPLOYMENT Robert W. Fairlie Bruce D. Meyer Working Paper 7561 http://www.nber.org/papers/w7561 NATIONAL BUREAU OF ECONOMIC RESEARCH 1050
Kansas State Fair Economic Impact and Marketing Study. Executive Summary
 State Fair Economic Impact and Marketing Study Executive Summary by Norman Clifford and Pat Oslund Charles Krider Director Principal Investigator Institute for Public Policy and Business Research University
Nebraska s Foreign-Born and Hispanic/Latino Population
 January 2011 Nebraska s Foreign-Born and Hispanic/Latino Population Socio-Economic Trends, 2009 OLLAS Office of Latino/Latin American Studies (OLLAS) University of Nebraska - Omaha Off i c e o f La t i
In abusiness Review article nine years ago, we. Has Suburbanization Diminished the Importance of Access to Center City?
 Why Don't Banks Take Stock? Mitchell Berlin Has Suburbanization Diminished the Importance of Access to Center City? Richard Voith* In abusiness Review article nine years ago, we examined the role that
Vista. The Texas Mexico border is a fast-growing region, a complex blend of U.S. and Mexican cultures, languages and customs.
 Federal Reserve Bank of Dallas San Antonio Branch South Economic Trends and Issues Issue 2, 2005 Cyclical Differences Emerge in Border City Economies S Vista ince the implementation of NAFTA, the South
Alberta s Demand for Workers is Affecting the Labour Market in BC
 Volume 4, Issue 2, April 2014 Alberta s Demand for Workers is Affecting the Labour Market in BC Highlights Through inter-provincial migration, BC has experienced a significant loss of working-age individuals
ASIAN AMERICAN BUSINESSES EXPLODING IN DIVERSITY & NUMBERS
 ASIAN AMERICAN BUSINESSES EXPLODING IN DIVERSITY & NUMBERS CENTRAL TEXAS ASIAN AMERICAN OWNED BUSINESSES REPORT 2016 PRESENTED BY THE GREATER AUSTIN ASIAN CHAMBER OF COMMERCE FORWARD Exploding in Diversity
People. Population size and growth. Components of population change
 The social report monitors outcomes for the New Zealand population. This section contains background information on the size and characteristics of the population to provide a context for the indicators
THE ECONOMIC EFFECTS OF ADMINISTRATIVE ACTION ON IMMIGRATION
 THE ECONOMIC EFFECTS OF ADMINISTRATIVE ACTION ON IMMIGRATION November 2014 Updated February 2015 Updated February 2015 In February 2015, the Department of Homeland Security (DHS) published a final rule
WORKFORCE ATTRACTION AS A DIMENSION OF REGIONAL COMPETITIVENESS
 RUR AL DE VELOPMENT INSTITUTE WORKFORCE ATTRACTION AS A DIMENSION OF REGIONAL COMPETITIVENESS An Analysis of Migration Across Labour Market Areas June 2017 WORKFORCE ATTRACTION AS A DIMENSION OF REGIONAL
Characteristics of Poverty in Minnesota
 Characteristics of Poverty in Minnesota by Dennis A. Ahlburg P overty and rising inequality have often been seen as the necessary price of increased economic efficiency. In this view, a certain amount
Greater Golden Horseshoe
 Greater Golden Horseshoe 2017 REGIONAL MARKET ACTIVITY (AS AT Q3 2016) TORONTO - OVERVIEW The Toronto Census Metropolitan Area ( CMA ) is comprised of the City of Toronto, which is the capital of the province
University of Oklahoma Libraries Western History Collections. Jessie E. Moore Collection
 University of Oklahoma Libraries Western History Collections Jessie E. Moore Collection Moore, Jessie Elizabeth Randolph (1871 1956). Papers, 1916 1930. 6.66 feet. Court clerk. Correspondence (1927 1930)
How s Life in the United Kingdom?
 How s Life in the United Kingdom? November 2017 On average, the United Kingdom performs well across a number of well-being indicators relative to other OECD countries. At 74% in 2016, the employment rate
Formal sector internal migration in Myanmar
 Page1 Formal sector internal migration in Myanmar Dr. Michael P Griffiths, Director of Research, Social Policy & Poverty Research Group U Kyaw Zaw Oo, Research Office, Social Policy & Poverty Research
Race, Ethnicity, and Economic Outcomes in New Mexico
 Race, Ethnicity, and Economic Outcomes in New Mexico Race, Ethnicity, and Economic Outcomes in New Mexico New Mexico Fiscal Policy Project A program of New Mexico Voices for Children May 2011 The New Mexico
Population and Dwelling Counts
 Release 1 Population and Dwelling Counts Population Counts Quick Facts In 2016, Conception Bay South had a population of 26,199, representing a percentage change of 5.4% from 2011. This compares to the
ABSTRACT...2 INTRODUCTION...2 LITERATURE REVIEW...3 THEORETICAL BACKGROUND...6 ECONOMETRIC MODELING...7 DESCRIPTIVE STATISTICS...9 RESULTS...
 TABLE OF CONTENTS ABSTRACT...2 INTRODUCTION...2 LITERATURE REVIEW...3 THEORETICAL BACKGROUND...6 ECONOMETRIC MODELING...7 DESCRIPTIVE STATISTICS...9 RESULTS...10 LIMITATIONS/FUTURE RESEARCH...11 CONCLUSION...12
Chapter 1: The Demographics of McLennan County
 Chapter 1: The Demographics of McLennan County General Population Since 2000, the Texas population has grown by more than 2.7 million residents (approximately 15%), bringing the total population of the
Rutgers Center on Law, Inequality & Metropolitan Equity
 Rutgers Center on Law, Inequality & Metropolitan Equity Displacement Risk and Gentrification: The CLiME Displacement Risk Indicators Matrix (DRIM) Methodology A CLiME Research Brief November 2017 By David
THE BALANCE OF PAYMENTS
 THE BALANCE OF PAYMENTS REMITTANCE REPORT June 2016 Economic Information & Publications Department RESEARCH AND ECONOMIC PROGRAMMING DIVISION I S S N 0 7 9 9 3 2 8 5 THE BALANCE OF PAYMENTS REMITTANCE
People Come and People Go
 The Northeast: America s Gateway to the World People Come and People Go a lesson on Population INTRODUCTION: In this lesson we are going to investigate population growth in the northeastern part of the
A Multivariate Analysis of the Factors that Correlate to the Unemployment Rate. Amit Naik, Tarah Reiter, Amanda Stype
 A Multivariate Analysis of the Factors that Correlate to the Unemployment Rate Amit Naik, Tarah Reiter, Amanda Stype 2 Abstract We compiled a literature review to provide background information on our