The Socio-Economic Impacts of Ebola in Liberia
|
|
|
- Jodie Bryan
- 5 years ago
- Views:
Transcription


1 The Socio-Economic Impacts of Ebola in Liberia Results from a High Frequency Cell Phone Survey November 19, 2014
2 This note was prepared by Kristen Himelein, Senior Economist / Statistician in the Poverty Global Practice at the World Bank Group, with substantial inputs from the Dr. T. Edward Liberty, Director General of the Liberia Institute of Statistics and Geo-Information Services in Monrovia, Liberia, and from his team, including Kormay Adams, Nagraj Rao, and Sehr Syed. The implementation of the high frequency phone survey was led by Stephanie Kafka and Patrick Bogart of the Gallup Organization. Very capable research assistance was provided by Shweta Bhogale of Innovations for Poverty Action. In addition, the team benefitted from useful advice and comments from World Bank Group colleagues, including: Joao Pedro Azevedo (Senior Economist, Poverty Global Practice), Amparo Ballivian (Lead Economist, Development Economics Data Group), Kathleen Beegle (Lead Economist, Office of the Chief Economist, Africa Region), Timothy J. Bulman (Senior Economist, Macroeconomics and Fiscal Management Global Practice), Andrew Dabalen (Lead Poverty Specialist, Poverty Global Practice), David Evans (Senior Economist, Office of the Chief Economist, Africa Region), Pablo Fajnzylber (Sector Manager, Poverty Global Practice), Errol Graham (Senior Economist, Macroeconomics and Fiscal Management Global Practice), and Laura Ralston (Economist, Social Protection and Labor Global Practice). Vice President Country Director Senior Director Sector Manager Task Manager Makhtar Diop Yusupha Crookes Ana Revenga Pablo Fajnzylber Kristen Himelein 2
3 Overview As of early November, 2014, Liberia has had nearly 7,000 cases of Ebola Virus Disease (EVD) and more than 2,500 deaths. Many of the cases have occurred in the poorest and most densely populated areas of the capital city, Monrovia, but all counties have now been affected by EVD. In an effort to measure the economic impact of EVD on Liberian households, the World Bank, with the Liberian Institute of Statistics and Geo-Information Services and the Gallup Organization, has conducted two rounds of mobile-phone surveys, in October and November Based on these results, it is clear that the EVD has substantially impacted the Liberian economy across all sectors of employment, in both affected and non-affected counties. In all, nearly half of the working population of Liberia is no longer working since the crisis began. Those engaged in self-employment activities have been the hardest hit, in large part due to the closure of markets in which they operate. Before the crisis, over 30 percent of working household heads were self-employed as of this latest survey, this is down to just above 10 percent. The wage employment sector has also seen substantial job losses, with only about half of those originally surveyed still working since the crisis unfolded. The main reason cited by respondents is that their business or government office is closed; illness-related absence was only named by a small percentage of respondents. After an initial downturn, the agricultural sector is showing the most resilience in the face of EVD. Rural areas have seen a substantial return to farming; the latest survey round coincided with the beginning of harvest season in many areas of the country. These economic impacts have exacerbated existing issues, especially those related to food prices and food security. Imported rice prices have seen a huge jump of nearly 40 percent over the average for October but over 70 percent of respondents said that regardless of price, they do not have enough money to afford food. Many households have reduced the number of meals eaten, and restricted adult consumption in order to feed their small children, but still more than 90 percent of those surveyed worried that their household would not have enough to eat. With the arrival of the harvest, these figures have and will likely continue to trend downward, but they remain alarmingly high. Whether directly affected by the virus or not, communities in every corner of Liberia are suffering from its consequences. Government mandated closures and other policies to contain and reverse the spread of EVD are in place across the country, and therefore the negative economic effects of EVD touch everyone. It will be essential to focus relief efforts not only in areas where the virus is active, which is crucial, but also in those remote counties where the population was already quite poor, food availability was scarce and is now worsening, markets are closed, and mobility is extremely limited. The Ebola virus has tempered our economy. It has hurt our economic investments. Our businesses have been closed down and our country has been abandoned. 39 year old male respondent, Bomi county 3
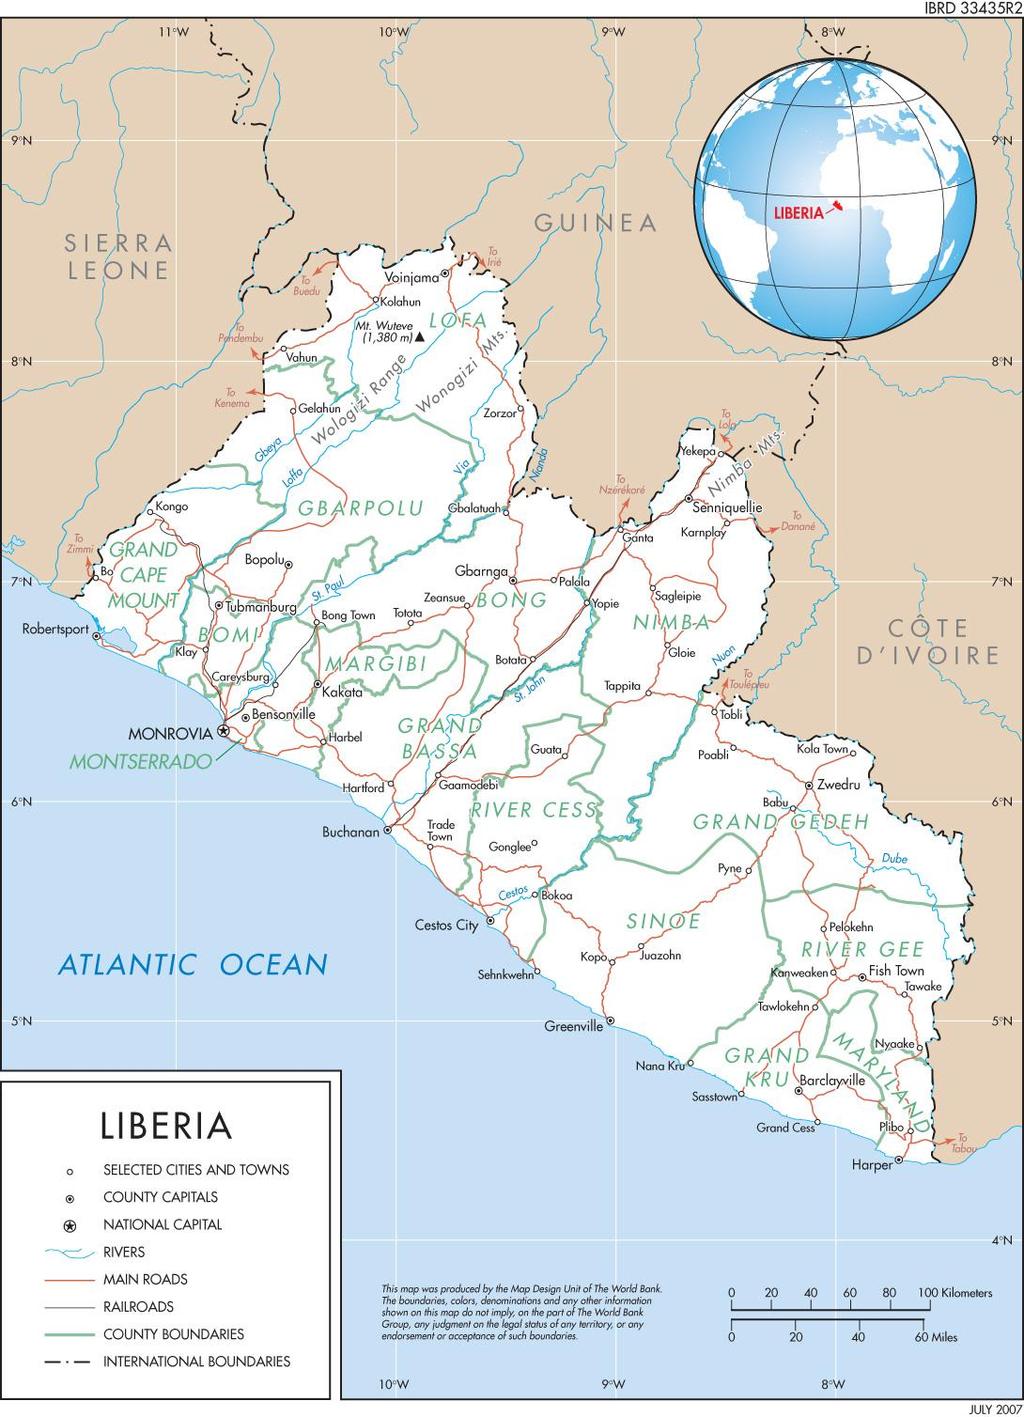
4 Map 4
5 Gbarpolu Grand Gedeh Sinoe River Gee River Cess Maryland Grand Kru Grand Cape Grand Bassa Bomi Nimba Bong Margibi Lofa Montserrado* Gbarpolu Grand Gedeh Sinoe River Gee River Cess Maryland Grand Kru Grand Cape Grand Bassa Bomi Nimba Bong Margibi Lofa Montserrado* cumulative deaths deaths in previous 7 days cumulative deaths deaths in previous 7 days Objective The Economic Impact of Ebola survey is a high frequency cell phone survey designed to monitor the socio-economic impacts of the ongoing Ebola crisis in Liberia. The survey has been conducted in two rounds in the fall of 2014 and is based on the nationally representative Household Income and Expenditure Survey (HIES) implemented from February to August 2014 by the Liberia Institute of Statistics and Geo-Information Services (LISGIS). This effort was designed to provide rapid indicators from households across the country at a time when conducting a traditional face-to-face survey is extremely challenging. To that end, the survey was conducted by phone, calling a sub-sample of households who participated in the HIES and for whom cell phone numbers were recorded. The Methodological Annex provides details on the data collection and the survey weights. Low response rates hinder the representativeness of the survey. This report begins with a brief background of the situation in Liberia in terms of Ebola-related deaths at the time of data collection. This is followed by five sections focusing on the survey findings with respect to knowledge of Ebola, employment, prices, food security, and migration. Background Montserrado county and the city of Monrovia specifically are some of the most highly affected areas, but new infections are no longer concentrated only in the north and west of the country. Since its initial appearance in December 2013 in rural Guinea, the Ebola Virus Disease (EVD) has spread to four other West African countries. As of November 4, 2014, Liberia has had nearly 7,000 cases and more than 2,500 deaths. There have been a significant number of cases in the capital of Monrovia, many occurring in the poorest and most densely populated parts of the city. In the short period of time during which the two rounds of the survey were conducted (October 1- October 7 and October 21-November 7), the geographic pattern of the disease has shifted. At the time of the first round, the most affected county was Montserrado, which contains the capital Monrovia. The next highest counties in terms of total deaths were Lofa and Margibi, but there were a higher number of new infections in Bong county. Figure 1. New and cumulative cases by county for survey periods week ending October 5 cumulative new week ending November 4 cumulative new * includes Monrovia * includes Monrovia Source: Humanitarian data exchange (accessed November 12, 2014) 5
6 percentage have received information For the week ending on November 4, the highest numbers of cumulative and new deaths were again in Montserrado, but Margibi had surpassed Lofa county for the second highest total. Margibi also had a higher number of new deaths during this period, and there were growing numbers in Nimba and Grand Cape Mount counties. Deaths had also declined in the previously affected counties of Bomi and Bong. He is not alive year old man in Monrovia in response to why household head is no longer at previous job. Knowledge of Ebola Information campaigns about EVD launched by government, NGOs, and donor organizations were widely successful in reaching the population. The overwhelming majority of round 1 respondents, more than 93 percent, had Figure 2. Source of information on EVD heard of EVD. In addition, when this 10 question was asked to new round 2 respondents, all but one had heard of 5 0 the virus. Of those having heard of the virus, nearly all said they knew how to protect themselves and had received information from one or more sources, including healthcare workers (39) percent, the radio (39) percent, local authorities/palava hut (27) percent, neighbors/family (16) percent, TV (12) percent, poster/billboard/flyer (10) Source of information percent, traditional healers/pastor/faithbased healers (7) percent, SMS (6) November 2014) Source : Results from high frequency phone survey (October percent, and through a phone number (4) percent. In addition, 35 percent of respondents indicated having received information from other sources. Because of the Ebola virus - I did not want the contact with people year old man in Monrovia in response to question on why he is not working. Employment Prior to EVD, the majority of the rural labor force was in smallholder agricultural activities while wage work non-agricultural self-employment activities were equally prevalent in urban areas. Figure 3 shows the distribution of the working age (16-64) adult population across five employment categories: 6
7 wage labor, self-employment outside agriculture, agriculture (smallholder farming), unpaid household work, and out of the labor market. The latter category includes groups such as the unemployed and students. Figure 4 shows the same distribution but for household heads only, the group most directly comparable to high frequency phone survey respondents. Urban areas have the largest share of workers evenly split between wage labor and non-agricultural self-employment, while the majority in rural areas works in agriculture. While the data refers to household heads, these results can be generalized to the working population generally since EVD would impact all those in working in the sector. Figure 3. Distribution of working age adults prior to EVD wage self-employment agriculture unpaid family work other* urban rural total 0% 10% 20% 30% 40% 50% 60% 70% 80% 90% 100% * outside labor market - includes unemployed, those in school, etc) Figure 4. Distribution of household heads prior to EVD urban rural total 0% 10% 20% 30% 40% 50% 60% 70% 80% 90% 100% * outside labor market - includes unemployed, those in school, etc) Source: Preliminary findings from the HIES (2014) The construction closed, no more job available year old man in urban Bong county in response to question on why he is not working. There is not enough people to work. People are staying back and not going to work year old woman in urban Margibi county in response to question on why she is earning less. 7
8 total rural urban EVD has substantially impacted employment activities, especially in urban areas and for those previously engaged in non-agricultural self-employment. Figure 5 shows the impact of EVD by sector and location for those working at the time of the HIES baseline (conducted earlier in 2014). The gray area shows the fraction of those who had been working but were out of work by mid-october (Round 1) and early November (Round 2). In urban areas the wage and self-employment sectors were the most heavily impacted, while the small share involved in agriculture was largely unaffected. This is consistent with large numbers of public servants that were deemed to be non-essential staff being released from work, though most are still being paid for this period. The self-employed experienced the largest decline in work with the closure of markets in which they operate. In rural areas, the impact is roughly evenly divided between three main groups: wage, self-employed, and farming. By Round 2, there was almost no change in urban areas, though there was a further decline among the self-employed. Rural areas saw a substantial return to farming; this round coincided with the beginning of the harvest period for many areas of the country. Figure 5. Impact by sector and location on those respondents working at baseline wage self-employment agriculture not working baseline round 1 round 2 53% 45% baseline round 1 round 2 36% 31% baseline round 1 round 2 42% 46% 0% 10% 20% 30% 40% 50% 60% 70% 80% 90% 100% Source : Results from high frequency phone survey (October November 2014) 8
9 agriculture selfemployed wage Employment impacts were not disproportionately worse in counties most affected by EVD. As there are not a sufficient number of observations to detect differences within the sectors at county level, four groups of counties are constructed. The first is Montserrado county, which contains the capital city of Monrovia. The second consists of Lofa and Margibi counties, the two most affected counties after Monrovia. The third includes Bomi, Bong, Grand Bassa, and Nimba counties, which were all affected by EVD though not to the same extent as the previous three. The final category includes the remaining counties which have been thus far only marginally affected. In Round 1, there were no statistically significant differences between these categories in the probability of not working compared to the baseline in any of the three sectors. 1 In addition, the level of affectedness of the county explains very little of the variation in the probability of not working, with an R 2 of 0.01 for wage employment, 0.02 for self-employment, and 0.10 for agriculture. In round 2, there are still not statistically significant differences between the geographic areas for the three sectors. The values of R 2 have increased slightly to 0.02, 0.06, and 0.07 for wage, self-employment, and agriculture, respectively. Some in agriculture have returned to work since early October, but the wage and non-agricultural selfemployment sectors have seen further losses. By using the 424 households that responded in both rounds, it is possible to examine the transitions into and out of work. Of those working at the baseline, respondents are divided into four groups: those that were consistently working in both rounds of the high frequency phone survey, those that were consistently not working in both rounds, those that had returned to work or found new jobs between rounds 1 and 2, and those that stopped working between round 1 and round 2. Overall job loss was greatest for the wage sector and the self-employed sector between rounds, while agriculture saw a substantial percentage returning to work. Figure 6 shows these transitions in further detail. Figure 6. Work transitions by sector returned to work working left work not working round 1 not working working round 2 round 1 round 2 round 1 round Source : Results from high frequency phone survey (October November 2014) 1 There was a statistically significantly lower probability of working in agriculture in Montserrado county in round 1 but this finding is based on only three observations. 9
10 Wage Labor Many in wage labor are not working because their business or government office is closed, and very few have been able to return or find alternative employment. In the HIES, 38 percent of household heads indicated their primary employment was in wage labor. Of these wage employees, 40 percent indicated they were no longer working in their previous job in round 1 and 51 percent in round 2. The percentage was relatively steady between rounds in urban areas, just about 45 percent, but seems to have increased in rural areas (though the limited sample size makes it difficult to measure the magnitude). The main reason cited in round 1 was the closure of the business or government office where the respondent was working (46 percent), followed by temporary absence (14 percent), and a reduction in staff due to reduced business (13 percent). As shown by figure 7, which presents the results from round 1, this is true in both urban and rural areas. Relatively few respondents indicated health reasons for their absence: one percent for illness and three percent to care for an ill relative. Also while interviewers and analysts allocated responses into specific categories that best described the reason, the majority of respondents mentioned Ebola specifically in their answers. Of those no longer working in their the same job as in the baseline, five percent indicated that they were able to find other employment in round 1, but nearly universally this group indicated that they were earning less. Of the panel respondents, approximately six percent were able to find another job between rounds 1 and 2, though a further 15 percent stopped working in their original position during this period. Of those who returned to work, nearly 90 percent went to a different job from that in which they were previously working. It should also be noted, however, that many public servants are still being paid even though they are not going to work, so the negative welfare impacts are somewhat overstated. It is estimated that approximately 15 percent of wage employees are in the public sector. Figure 7. Reason household head not working in job from baseline total business/government closed temporary absence / seasonal position other reduction in staff due to less business illness / care for ill relative urban rural 0% 10% 20% 30% 40% 50% 60% 70% 80% 90% 100% Source : Results from high frequency phone survey (October November 2014) It s a driving business, nothing good going on year old man in Monrovia in response to question on why he is not working. All the teachers are sitting home, no way to put bread on the table year old man in Monrovia in response to question on why he is not working. 10
11 Self-Employment The largest and most sustained impacts were on those engaged in the non-agricultural selfemployment sector. Self-employment was the second most common sector for household heads, employing 28 percent in the HIES, including 33 percent of urban heads. In the overall labor market for adults aged 16-64, self-employment is more prevalent than even wage labor. Additionally, of the working age population engaged in self-employment, nearly two-thirds were women and it is the most common source of livelihood for female headed households. Of those interviewed in the high frequency phone survey, 57 percent in round 1 and 64 percent in round 2 were no longer operating their businesses. Of this group, the most common reason cited in the first round was usual place of business closed due to Ebola (60 percent), followed by cannot travel / transport goods for trade (18 percent), and cannot get inputs (12 percent). Similar to wage employment, very few respondents cited reasons related to health. In both urban and rural areas, the usual location for business being closed was the most prevalent reason. Transportation issues were also important in rural areas and the inability to procure inputs was cited only in urban areas. See figure 8 for further details on round 1. Of the 73 respondents in the non-farm self-employment sector, only one was able to find a new job as of round 1. Of those respondents in the panel, less than two percent returned to work between the first and second rounds, while an additional 12 percent stopped working. More than 90 percent of those who were not working in the first round remained out of work by round 2. Figure 8. Reason household head not working in job from baseline usual place of business closed because of Ebola can't get inputs illness / care for ill relative can t travel/transport goods for trade no customers other total urban rural 0% 10% 20% 30% 40% 50% 60% 70% 80% 90% 100% Source : Results from high frequency phone survey (October November 2014) Ebola is in Liberia. Everyone is not buying clothes and shoes, they are just buying food year old woman in Montserrado county in response to question on why her small business is earning less. I sell oranges. The business is way down year old woman in Bong county in response to question on why her small business is earning less. 11
12 Agriculture There has been a substantial return to agriculture since early October but it is too early yet to estimate the impact on the ongoing harvest. Agriculture was the most common sector of employment in rural areas, comprising 31 percent of the aged rural population, and was the main source of livelihood for 49 percent of rural household heads. Agriculture is also the most difficult sector to accurately measure with this instrument. The response rate is particularly low in rural areas due to limited cell phone network and availability of electricity to charge handsets. Also the nature of agricultural work naturally has extended lapses in activities, such as in the post-planting and postharvest periods. The 2014 harvest period in Liberia began in August and finished in September for the southern counties of Maryland, Grand Kru, Rivergee, Sinoe and Grand Gedeh. This is one month later than the normal agricultural season due to a slightly late start for the rainy season in these areas. In the remainder of the county, the harvest season began around October and will be completed by December. In the first round of the survey, corresponding to pre-harvest period for most of the country, 30 percent of respondents indicated that they were no longer working in agriculture compared to the baseline HIES. The majority cited worries about Ebola as the main reason they were not working. At the same time, of this group, two-thirds indicated that someone within the household was still engaged in farming. This suggests that generally farms were not being abandoned by households. While it is not possible to distinguish between staple farming and vegetable gardening, more than 70 percent of farm households that were growing rice in the HIES will harvest. About half believe the harvest will be smaller than last year s, 35 percent believe it will be larger, with the remainder believing it will be about the same. By the second round of the survey, corresponding with the start of the harvest in many areas, the percentage of rural households in which the head indicated not working had halved. Of those who were still not working, more than 80 percent indicated that someone in the household was farming. With the caveat that the agriculture section has the most methodological issues, the high frequency phone survey shows that while agriculture has been affected by EVD, the impact is short of some of the more dire predictions of wide spread farm abandonment. It is difficult, however, to gauge the overall impact on food security from pre-harvest estimates. Also many farmers depend on the kuu system of shared labor during the harvest period. Mobility limitations and fear of infection may limit available labor this year. Follow-up question on labor during the harvest period and on yields in the post-harvest period are planned for later rounds. The sickness has affected us. My strength has gone down, personally year old man in rural Grand Cape Mount county on why the harvest will be smaller this year. People are afraid to leave their houses to work on the farms year old man in rural Grand Cape Mount county on why the harvest will be smaller this year. We are afraid of going to the farm. The rice is used to feed the animals year old man in rural Grand Cape Mount county on why agricultural profits will be lower this year. 12
13 Prices Rice prices have spiked well above usual seasonal increases. Due to the lack of available historical data, it is difficult to analyze the impact of EVD on prices. Numerous surveys, the high frequency phone survey included, have shown price increases since the outbreak began in July. Some increase in price, however, is to be expected due the seasonal shortages of locally produced rice in the immediate post-harvest period. Figure 9 shows the estimated price for a 50 kg bag of rice in 2014 as well as the average for 2012 and 2013 by month. 2 The price Figure 9. Price index for rice for 2014 compared to average for 2012 and * October 1-7, 2014 ** October 21 - November 7, / 2013 Source: 2014 HIES, high frequency phone survey, WFP VAM trends upwards historically, particularly during September and October, but the 2014 increase was markedly higher. In 2012/13 data, prices were about seven percent higher than their January base price. In October 2014, however, the observed increase reached above 40 on average percent above the baseline. There are a number of different factors behind the rice price increase. While the high frequency survey has neither a large enough sample nor a sufficiently extensive questionnaire to fully disentangle the issues, the spatial price variation and information on availability can provide some information on driving factors. In both the first and second rounds, approximately 30 percent of respondents indicated that they could not purchase rice at their local market. These households were concentrated in Monrovia, Bong, Lofa, and Nimba counties. At the same time, though prices have risen compared to the pre-evd baseline across the country, the price data showed statistically significantly lower prices in Monrovia compared to the rest of the country, and higher prices in the three easternmost counties (Rivergee, Grand Kru, and Maryland). The other three counties with availability issues did not have higher prices than the remainder of the country. It would seem contradictory to basic supply-and- 2 In the HIES the question refers specifically to imported rice while in the high frequency phone survey, the question is more general. These issues of comparability will be corrected in the next round, though the impacts are likely to be small due to the relative unavailability of local rice during this part of the agricultural calendar. 13
14 demand that market shortages would not automatically head to higher prices. The pattern may be explained, however, if the lack of availability was caused by market closures and transportation issues. If the markets are closed, traders either stop participating or move to areas where they are still able to sell. This densification, accompanied by the fact that as the main port of entry for imported rice, prices in Monrovia are historically lower, explain both the lower prices and limited availability. Prices are higher outside the capital due to transportation costs, and there are similar issues with market closures in Nimba, Bong, and Lofa counties due to EVD. In addition, travel limitations may prevent supply from reaching some areas as well as preventing people from traveling to other areas with availability to push up prices there. Also, the distribution of food aid though treatment centers would offset upward price pressures. Finally, the poor infrastructure and travel restrictions would increase transportation costs, which would be most acutely felt in the more remote areas, particularly if border closures limit alternatives. This pattern of a lack of availability without accompanying price increases has also been observed in neighboring Sierra Leone according to the International Center for Growth s November Report on Markets, Traders, and Food Security, and will be an area of focus in subsequent rounds of the high frequency survey in Liberia. Despite large rice price increases, evidence suggests insufficient income may be a larger threat to food security than prices. Such large increases in food prices have most likely had significant negative effects on food security, but this has been compounded by reductions in disposable income. In both the first and second rounds of the high frequency phone survey, conditional on rice being available for sale, more than two-thirds of respondents indicated that at some point in the previous two weeks they were unable to buy enough rice for their household. As with prices, it is likely that there is a seasonal component to food shortages, but when asked as to the reason why they were unable to buy enough rice, only about one-quarter indicated that the prices were too high. A small percentage cited availability issues, but the vast majority, approximately 70 percent across the two rounds, said that they did not have enough money consistent with the large job losses. This finding points to important income effects compounding the impact of higher prices. The price has increased. We do not have money. There is a state of emergency here and the government is not allowing travel to Monrovia year old man in rural Grand Cape Mount county on why he was not able to buy enough rice for his household. Food Security There is evidence of widespread food insecurity though it is difficult to estimate the relative impact of EVD compared to seasonal issues. More than 90 percent of households indicated that they were worried that their household would not have enough to eat at some point in the previous week over the two rounds of data collection. Sixty-two percent said yes to this measure of food security in both rounds, 10 percent did not report issues in the first round but did in the second round, and 20 percent had issues in the first round but not the second. While these figures remain high by most measures, they do show a downward trend. This means that it is likely that at least some of the issues are related to seasonal food insecurity, and will continue to decrease as the harvest progresses. The largest 14
15 reductions between the two rounds occurred in Nimba county, which is the largest grain producing area of the county and which traditionally begins the harvest in late October. Overall households have pursued a variety of coping mechanisms to deal with food insecurity, the most common being reducing the number of meals eaten and restricting adult consumption. The frequency of these strategies has not changed markedly between rounds. See table 1 below for further details. Table 1. Coping strategies for food insecurity In the past 7 days, how many days have you or someone in your household had to rely on less preferred and/or less expensive foods? limit portion size at mealtimes? reduce number of meals eaten in a day? restrict consumption by adults in order for small children to eat? borrow food, or rely on help from a friend or relative? Round Round Source: High frequency phone survey (October November 2014) Migration Migration has been limited and local and is most likely for economic reasons rather than health fears. In the first round of data collection, a small number of households, about 14 percent, indicated having moved dwellings since the Ebola outbreak, but only 30 percent of these households left the county in which they had been living. Of those that remained in the county as in the HIES, about one-third were located within Monrovia, but overall movement was no more common in affected counties than in the remainder of the country. In addition, seven percent of households indicated that a regular household member had left due to Ebola, with more than half indicating that the member went to Monrovia and a further one-quarter said they remained within the same county but in a different location. Approximately five percent indicated that a household member had left Liberia. By the second round, the percentage of households that moved remained constant around 15 percent, but the percentage of households in which a usual member had left had nearly doubled to 13 percent. The majority of these movers remained within the original county, with only about one-quarter going to Monrovia. Among those interviewed in both rounds, 94 percent of households remained in the same county. Of those that moved, 39 percent shifted from Montserrado to another county. Most did not go to the largely unaffected areas in the east, but rather to Bomi or Grand Cape Mount counties, which had low but growing numbers of infections. Of the remainder of the movers, 35 percent moved to Montserrado, coming from a range of counties distributed across the country. The remaining 26 percent moved between counties outside Montserrado, but again there was not a definite pattern. Overall migration during this period was limited, possibly in part due to the uncertainty of the situation and the restrictions on travel put in place by the government. A small percentage changed dwellings but this is more likely natural movement as it did not occur more frequently in affected counties compared to the unaffected. Between the two rounds, a growing number of households indicated that though the 15
16 household itself remained, a usual household member had left. Since it was single members or small groups leaving, it is more likely to be attributed to economic migration than related directly to fear of infection. There also appears to be limited evidence for the hypothesis that there has been a recent increase in migration to previously unaffected areas. Also the data shows that a small number of households reported a usual member leaving the country but these were rare events occurring mainly in the earlier part of the outbreak. 3 Conclusion The Ebola Virus Disease has severely impacted the Liberian economy across all sectors of employment. Large percentages of those in wage employment have either been asked to stay at home or have lost their positions entirely. Similarly those involved in non-agricultural self-employment activities, such as small scale traders, have seen their business fall as markets are closed, potential customers become more reserved in their spending, and travel restrictions disrupts supply. This group is more vulnerable to negative impacts on their well-being because they are not receiving public sector salaries and because they have been less able to find alternative jobs. The impact on farmers has been the smallest in terms of overall percentage of the workforce, and there are signs that many that had stopped farming have now returned to farming, consistent with the start of the harvest period. There is still the potential for food insecurity as many farmers believe the harvest will be smaller this year, in part due to lack of labor from the traditional shared-labor systems. Food insecurity is widespread in the country, though a fraction of this is seasonal. The annual shortage in the pre-harvest period is being compounded this year by both higher prices and loss of income due to the inability to work because of EVD. Though some limited migration has taken place in response to these conditions for the most part this has been local and likely more focused on economic activities than fear of infection. There is some evidence of people leaving the country in the early stages but this seems to have decreased as the situation normalized. Overall the situation remains quite serious but there are some signs that it may be improving, including a return to farming. Further information will be available as the situation develops and after the next round of the survey is fielded in December. 3 It should be noted that the nature of the high frequency phone survey is vulnerable to under-reporting events such as outmigration. If members leave the country, they can no longer receive phone calls on their Liberian numbers. The propensity score component of the weight calculations to some extent adjusts for this, though some underestimation may remain. 16
17 Methodological Annex The high frequency economic impact of Ebola survey was initiated by the World Bank, in partnership with the Liberia Institute of Statistics and Geo-Informational Services (LISGIS) and implemented by the Gallup Organization, to estimate the socioeconomic impact of the Ebola Virus Disease (EVD). The first round was conducted from October 1 through October 7 and the second round from October 21 to November 7. This note describes the survey methodology underlying the data collection and analysis. Sample Design The sampling frame uses the Household Income and Expenditure Survey (HIES), a nationally representative household survey launched by the LISGIS in February 2014 and halted about halfway through collection, in August, due to the outbreak. Since the HIES was designed to produce representative estimates for each quarter, the half-year dataset is representative nationally though not at the originally planned level of precision. As part of that survey, interviewers collected re-contact information for the households, including cell phone numbers for household members. Of the 4088 households for which data was collected before fieldwork stopped, 2137 included numbers. The limited list of available numbers is due to relatively low levels of cell network penetration in Liberia. The available numbers represent nearly all urban households and about one-third of the rural sample. Those households reporting numbers is unevenly distributed across the sample, but fortunately there is at least partial coverage in all counties, ranging from 80 percent with numbers in Monrovia / Montserrado county to 11 percent in Nimba county. All available numbers from the HIES were included in the high frequency phone survey. Questionnaire As the survey was being administered over the phone, the targeted length was 15 minutes. The round 1 questionnaire focused on economic impacts, including labor market conditions, remittances, prices, and food security. The questionnaire also included a number of questions on knowledge of EVD, focusing on whether the respondent had heard of Ebola, what were their main sources of information, etc. Questions specifically related to health were excluded since the instrument was not designed to detect and analyze rate events, such as EVD illness, and as to not increase suspicion among respondents at a time of high levels of distrust in the government and foreigners. The questions were worded as closely as possible to those in the HIES to allow for differences-in-differences analysis. Where topics were outside those covered in the HIES, previously pretested questions, such as those included in the Listening-to-Africa questionnaires, were used. For round 2, the new respondents received the round 1 questionnaire while the panel respondents received a slightly modified version which dropped certain questions (such as the knowledge of Ebola section) and took into account the fact that respondents had previously provided some information. Implementation The survey was implemented by the Gallup Organization from their Nebraska-based call center. During the review of the concept note, there was extensive discussion around this decision. The benefits of using Gallup were that they had extensive experience in the planning, programming, collection, and documentation of surveys of this type. This is in contrast to the only other viable implementation partner, the LISGIS, which has limited capacity overall and no experience in conducting telephone-based surveys. In addition, travel restrictions due to EVD limited the scope for technical assistance from consultants. 17
18 first round The interview plan was for each number to be called up to five times. If the phone was answered, the interviewer identified if the respondent was an original member of the household, and if so, which member. Even if the respondent was not an original member, the interview was continued after collecting a few necessary identifying characteristics, such as name, age, gender, location, and main source of employment in the previous 12 months. The assumption was that in most of the cases in which the respondent was unrelated to the original household, there was likely an error in the number, either at the recording stage or the data entry stage. This type of error would result in the de facto selection of a random respondent, which would, on average, be the same as the originally interviewed respondent that the team was attempting to contact. Response Rate Overall the response rate was lower than had been targeted during the design phase. The first round resulted in 648 complete interviews, 30 percent of the available 2137 numbers and the 16 percent of the total 4088 households. Following the results from this round, the team decided to implement a test for the non-responding households in the first round of data collection. These nonresponders received a text message describing an incentive payment of one US dollar in phone credit for completed interviews. All numbers were again attempted five times, but the exercise netted only 48 additional households. This incentive structure was also used in the second wave of data collection. Prior to the second wave, the text message was sent to all respondents that participated in the first wave of data collection. The text message prior to the second round explained the purpose of the call and told them about the incentive. The Gallup Organization then re-contacted the original 648, completing 426 interviews. The second round then has a total of 472 observations, 426 of which form a panel with the first round. According to the metadata collected by Gallup, of the original 2137 numbers, the largest component of the non-response was from those that did not answer the call at any point during the repeated attempts. Table A1 below shows further details on the breakdown of call outcomes. The categories include interviewed households; did not connect, which includes mainly those that never answered the phone even though it rang; disconnected numbers for which the interviewer received a recorded message saying the number was no longer in service; and refusal in which the phone was answered but the respondent declined to participate in the survey. Table A1. Round 1 and round 2 outcomes from original 2317 numbers second round interviewed did not connect disconnected refusals total interviewed did not connect disconnected refusals total There are a number of hypotheses as to why these calls have gone unanswered. One is related to the suspicion of potential respondents to unknown foreign numbers, particularly during a crisis situation. A second relates to respondents not paying to have phones charged at a time when incomes have been reduced. Similarly, travel restrictions have limited the ability of traders to bring diesel to rural areas to 18
19 power generators, further complicating the process of charging phones. To explore these possibilities, the text messages were sent using a system that confirms delivery. Of the 1011 text messages sent before the second round, only 621 were delivered. This means that only about 61 percent of cell phones were turned on at any point during the week-long survey period, and suggests that both hypotheses played a role in the high non-response rates. Overall the characteristics of respondents were similar in distribution to those in the original sample. Of the 648 interviewed in the first round, 83 percent were household heads, seven percent were other members of the original household, and ten percent were not part of the original household. These figures were 92, 4, and 4 percent, respectively in the second round. Comparing the average age of respondents to that of the original sample of household heads, the most logical available comparison group, the average age of a respondent was both 40 in the first and second rounds, compared to 39 in the original sample. In the high frequency phone survey, 22 percent of respondents were female in the first round and 21 percent in the second round, compared with 26 percent of household heads in the original sample. Tables A2 and A3, found at the end of this section, show the distribution by sector of employment and geography for the original sample and the two cell phone rounds. There are no statistically significant differences between the two samples, though the limited sample size means that there is limited power for these tests. The only area where there was a marked difference between urban and rural areas was in the urban/rural status of the respondent. Seventy-two percent of respondents in both the first and second rounds were living in urban areas, compared to 56 percent in the original sample. Weights Despite the general similarities between the original sample and high frequency phone survey respondents, it was necessary to calculate and apply an attrition correction in addition to the probability weights. To attempt to most accurately represent the original population, two steps were applied in the calculations. The first was to calculate a propensity score adjustment, which uses the available characteristics of the household head from the HIES (age, gender, location, and sector of employment) to calculate an aggregate probability of response. The results of this analysis for the two cross section and the panel rounds are presented in table A4 at the end of this section. The inverse of this probability is then applied to the probability weights, therefore increasing the weight for underrepresented groups. In addition, a post-stratification adjustment was applied. This adjustment increases the total weights in each stratum, in this case county by urban/rural, to match a known distribution. In most cases this would be numbers from the previous census inflated for population growth, but as this information is not available reliably at the stratum level, the total from the previous census were used. This means that these data cannot be used to calculate totals, such as the total number of Liberians who are no longer working, and therefore analysis of that type is excluded from this report. This methodology is applied to the two rounds of data to produce three sets of weights: cross-sectional weights for round 1, cross-sectional weights for round 2, and panel weights for those households that appear in both rounds. Verbatim responses For all questions in the questionnaire in which answer choices were given, interviewers could select other if respondent did not select one of the answer choices. The interviewer would then record the respondent s answer verbatim to later be coded (if possible) into an existing category. The quotes listed in blue at the end of certain chapters come from these responses. 19
20 Table A2. Sector of employment of household head sector of hh HIES round 1 round 2 wage self-employment agriculture unpaid family other Table A3. Regional distribution of households round 1 round 2 % households survey % households survey county % households (census) n n (unweighted) (unweighted) Bomi Bong Grand Bassa Grand Cape Mount Grand Gedeh Grand Kru Lofa Margibi Maryland Montserrado Nimba River Cess Sinoe River Gee Gbarpolu Urban Rural Total
21 Table A4: Regression coefficients for logit response model round 1 round 2 panel coef se coef se coef se Respondent Characteristics female * ** ** age 0.045* age squared * Sector of Employment (Reference : Wage) self-employment ** * agriculture *** *** *** unpaid family work other Geographic Strata (Reference : Monrovia) Bomi Urban *** *** Bomi Rural *** *** *** Bong Urban ** *** ** Bong Rural *** *** *** Grand Bassa Urban * Grand Bassa Rural *** *** *** Grand Cape Mount Urban ** * ** Grand Cape Mount Rural *** *** *** Grand Gedeh Urban * Grand Gedeh Rural *** *** *** Grand Kru Urban ** * * Grand Kru Rural *** *** *** Lofa Urban *** ** * Lofa Rural *** *** ** Margibi Urban ** ** Margibi Rural *** *** ** Maryland Urban *** *** *** Maryland Rural *** *** *** Montserrado Urban Montserrado Rural Nimba Urban *** * ** Nimba Rural *** *** *** River Cess Urban ** * River Cess Rural *** *** *** Sinoe Urban *** *** ** Sinoe Rural *** *** *** River Gee Urban *** ** ** River Gee Rural *** *** *** Gbarpolu Urban Gbarpolu Rural *** *** *** Constant N Pseudo R-squared note: *** p<0.01, ** p<0.05, * p<0.1 21
The Socio-Economic Impacts of Ebola in Liberia
 The Socio-Economic Impacts of Ebola in Liberia Results from a High Frequency Cell Phone Survey Round 3 January 12, 2015 This note was prepared by Kristen Himelein, Senior Economist / Statistician in the
The Socio-Economic Impacts of Ebola in Liberia
 The Socio-Economic Impacts of Ebola in Liberia Results from a High Frequency Cell Phone Survey Round 4 February 24, 2015 This note was prepared by Kristen Himelein, Senior Economist / Statistician in the
The Socio-Economic Impacts of Ebola in Liberia
 The Socio-Economic Impacts of Ebola in Liberia Results from a High Frequency Cell Phone Survey Round 5 April 15, 2015 This note was prepared by Kristen Himelein, Senior Economist / Statistician in the
Chapter 2: Population Size and Composition
 HH SIZE / Map 2-21 Average Household Size in 28 The average household size is a measure of the number of persons per household. It is important in the planning process because many people are found in
Testimony of Javier Alvarez Senior Team Lead of Strategic Response and Global Emergencies, Mercy Corps
 Testimony of Javier Alvarez Senior Team Lead of Strategic Response and Global Emergencies, Mercy Corps Submitted to the Senate Foreign Relations Subcommittee on African Affairs For the hearing: The Ebola
National Tally Center Preliminary Results Report
 National Tally Center Preliminary Results Report for the Run-off Election on 26 December 2017 as of 28 December 2017 4:00 pm http://www.necliberia.org/results2017/ Page 1 of 6 Republic of Liberia Tally
LIBERIA CORE WELFARE INDICATORS QUESTIONNAIRE (CWIQ) SURVEY ABRIDGED REPORT
 SURVEY ABRIDGED REPORT") REPUBLIC OF LIBERIA LIBERIA CORE WELFARE INDICATORS QUESTIONNAIRE (CWIQ) SURVEY ABRIDGED REPORT 2010 Liberia Institute of Statistics & Geo-Information Services (LISGIS) Statistics House 9th Street, Sinkor
REPUBLIC OF LIBERIA LIBERIA CORE WELFARE INDICATORS QUESTIONNAIRE (CWIQ) SURVEY ABRIDGED REPORT 2010 Liberia Institute of Statistics & Geo-Information Services (LISGIS) Statistics House 9th Street, Sinkor
The Socio-Economic Impacts of Ebola in Sierra Leone
 The Socio-Economic Impacts of Ebola in Sierra Leone Results from a High Frequency Cell Phone Survey Round 2 April 15, 2015 This note was prepared by Abubakarr Turay (Statistics Sierra Leone), Samuel Turay
National Tally Center Final Results Report
 National Tally Center Final Results Report for the Run-off Election on 26 December 2017 as of 29 December 2017 3:00 pm http://www.necliberia.org/results2017/ Page 1 of 6 Republic of Liberia Tally Reporting
LIBERIA. Highlights. Situation Overview INTERNATIONAL ORGANIZATION FOR MIGRATION
 LIBERIA INTERNATIONAL ORGANIZATION FOR MIGRATION SITUATION REPORT March 2016 Highlights IOM continued to support health screening at Points of Entry for the UNHCR-led Voluntary Repatriation of Ivorian
The Liberian Prospective of Global Education, Research and Technology for Sustainable Development
 The Liberian Prospective of Global Education, Research and Technology for Sustainable Development Article by Dorbor Kpangbala Management, Texila American University, Liberia E-mail: ddkpangbala@yahoo.com
ECC PRELIMINARY STATEMENT ON THE PRESIDENTIAL RUNOFF. The Liberian people have spoken, their will must be respected
 For Immediate Release Dec. 28, 2017 Press Release Press Contact: Mr. Oscar Bloh, Chairman, ECC Steering Committee Phone: +231(0)886554109 Barwudu Williams, National Coordinator, ECC Secretariat Mobile:
LIBERIA. Highlights. Situation Overview INTERNATIONAL ORGANIZATION FOR MIGRATION
 LIBERIA INTERNATIONAL ORGANIZATION FOR MIGRATION SITUATION REPORT December 2015- February 2016 Highlights Implementing partners and the Bong County Health Team at the Community Event-Based Surveillance
Under-five chronic malnutrition rate is critical (43%) and acute malnutrition rate is high (9%) with some areas above the critical thresholds.
 and acute malnutrition rate is high (9%) with some areas above the critical thresholds.") May 2014 Fighting Hunger Worldwide Democratic Republic of Congo: is economic recovery benefiting the vulnerable? Special Focus DRC DRC Economic growth has been moderately high in DRC over the last decade,
May 2014 Fighting Hunger Worldwide Democratic Republic of Congo: is economic recovery benefiting the vulnerable? Special Focus DRC DRC Economic growth has been moderately high in DRC over the last decade,
ECC Voters List Exhibition (June 28, 2017)
") 2017 Presidential and Legislative Elections ECC Voters List Exhibition (June 28, 2017) The Elections Coordinating Committee (ECC) is a civil society platform, comprising 30 organizations that observes
2017 Presidential and Legislative Elections ECC Voters List Exhibition (June 28, 2017) The Elections Coordinating Committee (ECC) is a civil society platform, comprising 30 organizations that observes
Economic conditions and lived poverty in Botswana
 WWW.AFROBAROMETER.ORG Economic conditions and lived poverty in Botswana Findings from Afrobarometer Round 6 Surveys in Botswana At a Glance Economic Conditions: Trend analysis on present living conditions
Participation time denotes the number of times a lawmaker speaks in a plenary sitting.
 Institute for Research and Democratic Development (IREDD) Full Monitoring Report Theme: Promises Fulfilled 1 st Session of the 54 th Legislature January September 15, 2018 Summary The Institute for Research
Job Displacement Over the Business Cycle,
 cepr CENTER FOR ECONOMIC AND POLICY RESEARCH Briefing Paper Job Displacement Over the Business Cycle, 1991-2001 John Schmitt 1 June 2004 CENTER FOR ECONOMIC AND POLICY RESEARCH 1611 CONNECTICUT AVE., NW,
The Role of Migration and Income Diversification in Protecting Households from Food Insecurity in Southwest Ethiopia
 The Role of Migration and Income Diversification in Protecting Households from Food Insecurity in Southwest Ethiopia David P. Lindstrom Population Studies and Training Center, Brown University Craig Hadley
Sampling Characteristics and Methodology
 Sampling Characteristics and Methodology The unit of observation for the survey is the household. Interviews were conducted with an equal number of women and men, each representing their households. Additional
Liberia Cash for Work Temporary Employment Project
 Liberia Cash for Work Temporary Employment Project Giuseppe Zampaglione World Bank DDVE Seminar Presentation 2009-2 A presentation made on April 23, 2009 at the World Bank-IMF Spring Meetings Civil Society
SIERRA LEONE KAMBIA DISTRICT PROFILE
 Population 341,690 1 Male 161,731 1 Female 179,959 1 Ethnic diversity Temne, Susu, Limba, Fula, and Mandingo 2 Geographical area 3108 sq. km (1200 sq. miles) 2 Language District level poverty rate 60%
VULNERABILITY STUDY IN KAKUMA CAMP
 EXECUTIVE BRIEF VULNERABILITY STUDY IN KAKUMA CAMP In September 2015, the World Food Programme (WFP) and the United Nations High Commissioner for Refugees (UNHCR) commissioned Kimetrica to undertake an
EASTERN SUDAN FOOD SECURITY MONITORING
 EASTERN SUDAN FOOD SECURITY MONITORING KASSALA STATE, ROUND 1 JULY 2010 Highlights Round 1 of the FSMS in was carried out at the peak of the lean season. The food security situation in the urban and rural
A Time of Plenty, A World of Need: The Rold of Food Aid in 2020
 International Food Policy Research Institute 2020 Brief 10, February 1995 A Time of Plenty, A World of Need: The Rold of Food Aid in 2020 by Patrick Webb Food aid is one of the constants of human experience.
FOOD SECURITY MONITORING, TAJIKISTAN
 Fighting Hunger Worldwide BULLETIN February 2017 ISSUE 18 Tajikistan Food Security Monitoring Highlights The food security situation presents expected seasonal variation better in December after the harvest,
Unemployment and underemployment data
 Helpdesk Report Unemployment and underemployment data Laura Bolton Institute of development Studies 23 November 2016 Question Identify the number (absolute and as a proportion of the working age population)
Poverty and Migration in the Digital Age: Experimental Evidence on Mobile Banking in Bangladesh
 Poverty and Migration in the Digital Age: Experimental Evidence on Mobile Banking in Bangladesh Jean Lee, Jonathan Morduch, Saravana Ravindran, Abu Shonchoy, Hassan Zaman April 26, 2017 1 Context Migration
Kakuma Refugee Camp: Household Vulnerability Study
 Kakuma Refugee Camp: Household Vulnerability Study Dr. Helen Guyatt Flavia Della Rosa Jenny Spencer Dr. Eric Nussbaumer Perry Muthoka Mehari Belachew Acknowledgements Commissioned by WFP, UNHCR and partners
The Informal Economy: Statistical Data and Research Findings. Country case study: South Africa
 The Informal Economy: Statistical Data and Research Findings Country case study: South Africa Contents 1. Introduction 2. The Informal Economy, National Economy, and Gender 2.1 Description of data sources
ANNUAL SURVEY REPORT: BELARUS
 ANNUAL SURVEY REPORT: BELARUS 2 nd Wave (Spring 2017) OPEN Neighbourhood Communicating for a stronger partnership: connecting with citizens across the Eastern Neighbourhood June 2017 1/44 TABLE OF CONTENTS
Assessing Poverty Outreach of Microfinance Institutions in Cambodia - A Case Study of AMK
 Research article erd Assessing Poverty Outreach of Microfinance Institutions in Cambodia - A Case Study of AMK THUN VATHANA Angkor Mikroheranhvatho Kampuchea (AMK) Co. Ltd., Phnom Penh, Cambodia Email:
Rural Pulse 2019 RURAL PULSE RESEARCH. Rural/Urban Findings March 2019
 Rural Pulse 2019 RURAL PULSE RESEARCH Rural/Urban Findings March 2019 Contents Executive Summary 3 Project Goals and Objectives 9 Methodology 10 Demographics 12 Detailed Research Findings 18 Appendix Prepared
How s Life in Hungary?
 How s Life in Hungary? November 2017 Relative to other OECD countries, Hungary has a mixed performance across the different well-being dimensions. It has one of the lowest levels of household net adjusted
Backgrounder. This report finds that immigrants have been hit somewhat harder by the current recession than have nativeborn
 Backgrounder Center for Immigration Studies May 2009 Trends in Immigrant and Native Employment By Steven A. Camarota and Karen Jensenius This report finds that immigrants have been hit somewhat harder
2016 Nova Scotia Culture Index
 2016 Nova Scotia Culture Index Final Report Prepared for: Communications Nova Scotia and Department of Communities, Culture and Heritage March 2016 www.cra.ca 1-888-414-1336 Table of Contents Page Introduction...
15+85A. Situation Overview: Western Bahr el Ghazal, South Sudan. Introduction. Population Movement and Displacement
 Situation Overview: Western Bahr el Ghazal, South Sudan January - March 2018 Introduction. Ongoing conflict in Western Bahr el Ghazal (WBeG) State resulted in a continued deterioration of food security
FOOD SECURITY AND OUTCOMES MONITORING REFUGEES OPERATION
 Highlights The yearly anthropometric survey in Kakuma was conducted in November with a Global Acute Malnutrition (GAM) rate of 11.4% among children less than 5 years of age. This is a deterioration compared
ANNUAL SURVEY REPORT: REGIONAL OVERVIEW
 ANNUAL SURVEY REPORT: REGIONAL OVERVIEW 2nd Wave (Spring 2017) OPEN Neighbourhood Communicating for a stronger partnership: connecting with citizens across the Eastern Neighbourhood June 2017 TABLE OF
HOUSEHOLD LEVEL WELFARE IMPACTS
 CHAPTER 4 HOUSEHOLD LEVEL WELFARE IMPACTS The household level analysis of Cambodia uses the national household dataset, the Cambodia Socio Economic Survey (CSES) 1 of 2004. The CSES 2004 survey covers
Online Appendices for Moving to Opportunity
 Online Appendices for Moving to Opportunity Chapter 2 A. Labor mobility costs Table 1: Domestic labor mobility costs with standard errors: 10 sectors Lao PDR Indonesia Vietnam Philippines Agriculture,
PROJECTING THE LABOUR SUPPLY TO 2024
 PROJECTING THE LABOUR SUPPLY TO 2024 Charles Simkins Helen Suzman Professor of Political Economy School of Economic and Business Sciences University of the Witwatersrand May 2008 centre for poverty employment
Syria Crisis Regional Response M&E Updates. April-June 2014
 Syria Crisis Regional Response M&E Updates April-June Monitoring results from WFP Regional Emergency Operation 200433 Food assistance to vulnerable Syrian populations in Jordan, Lebanon, Iraq, Turkey,
How s Life in Slovenia?
 How s Life in Slovenia? November 2017 Slovenia s average performance across the different well-being dimensions is mixed when assessed relative to other OECD countries. The average household net adjusted
An Emergency Market Mapping and Analysis Study Liberia s Slow Onset Crisis
 An Emergency Market Mapping and Analysis Study Liberia s Slow Onset Crisis Written by: Carol Brady and Nanthilde Kamara Edited by: Tessa Vorbohle, Emily Henderson and Philippa Young A cash transfer beneficiary
How s Life in Austria?
 How s Life in Austria? November 2017 Austria performs close to the OECD average in many well-being dimensions, and exceeds it in several cases. For example, in 2015, household net adjusted disposable income
Household Income and Expenditure Survey Methodology 2013 Workers Camps
 Household Income and Expenditure Survey Methodology 2013 Workers Camps 1 Content Introduction 3 Target community: 4 Survey geographical coverage: 4 Sampling method: 4 Survey variables: 5 Survey Questionnaires:
How s Life in the Slovak Republic?
 How s Life in the Slovak Republic? November 2017 Relative to other OECD countries, the average performance of the Slovak Republic across the different well-being dimensions is very mixed. Material conditions,
How Important Are Labor Markets to the Welfare of Indonesia's Poor?
 Public Disclosure Authorized Public Disclosure Authorized Public Disclosure Authorized Public Disclosure Authorized S /4 POLICY RESEARCH WORKING PAPER 1665 How Important Are Labor Markets to the Welfare
How s Life in Switzerland?
 How s Life in Switzerland? November 2017 On average, Switzerland performs well across the OECD s headline well-being indicators relative to other OECD countries. Average household net adjusted disposable
Haiti Urban Food Security Assessment
 Haiti Urban Food Security Assessment PRELIMINARY FINDINGS Highlights In the urban areas assessed in June 2016, 30% of the households are food insecure with 2% severely food insecure. The level of food
The World Food Programme (WFP) Jordan FOOD SECURITY OUTCOME MONITORING (FSOM) Quarter 4 (Q4) 2016: Summary Report
 Jordan FOOD SECURITY OUTCOME MONITORING (FSOM) Quarter 4 (Q4) 2016: Summary Report") The World Food Programme (WFP) Jordan FOOD SECURITY OUTCOME MONITORING (FSOM) Quarter 4 (Q4) 26: Summary Report Quarter 4 (Q4) 26: Summary Report KEY FINDINGS: The food security situation has overall worsened
The World Food Programme (WFP) Jordan FOOD SECURITY OUTCOME MONITORING (FSOM) Quarter 4 (Q4) 26: Summary Report Quarter 4 (Q4) 26: Summary Report KEY FINDINGS: The food security situation has overall worsened
Zimbabwe Complex Emergency
 BUREAU FOR DEMOCRACY, CONFLICT, AND HUMANITARIAN ASSISTANCE (DCHA) OFFICE OF U.S. FOREIGN DISASTER ASSISTANCE (OFDA) Zimbabwe Complex Emergency Situation Report #3, Fiscal Year (FY) 2009 February 13, 2009
How s Life in Belgium?
 How s Life in Belgium? November 2017 Relative to other countries, Belgium performs above or close to the OECD average across the different wellbeing dimensions. Household net adjusted disposable income
It's Still the Economy
 It's Still the Economy County Officials Views on the Economy in 2010 Richard L. Clark, Ph.D Prepared in cooperation with The National Association of Counties Carl Vinson Institute of Government University
Openness and Poverty Reduction in the Long and Short Run. Mark R. Rosenzweig. Harvard University. October 2003
 Openness and Poverty Reduction in the Long and Short Run Mark R. Rosenzweig Harvard University October 2003 Prepared for the Conference on The Future of Globalization Yale University. October 10-11, 2003
THE LOUISIANA SURVEY 2018
 THE LOUISIANA SURVEY 2018 Criminal justice reforms and Medicaid expansion remain popular with Louisiana public Popular support for work requirements and copayments for Medicaid The fifth in a series of
How s Life in Australia?
 How s Life in Australia? November 2017 In general, Australia performs well across the different well-being dimensions relative to other OECD countries. Air quality is among the best in the OECD, and average
Liberia: Still Waiting
 Liberia: Still Waiting Humanitarian Briefing World Vision International February 2004 Humanitarian Briefing Liberia: Still Waiting Since UNMIL assumed responsibility for facilitating Liberia s return to
Spain s average level of current well-being: Comparative strengths and weaknesses
 How s Life in Spain? November 2017 Relative to other OECD countries, Spain s average performance across the different well-being dimensions is mixed. Despite a comparatively low average household net adjusted
How s Life in Poland?
 How s Life in Poland? November 2017 Relative to other OECD countries, Poland s average performance across the different well-being dimensions is mixed. Material conditions are an area of comparative weakness:
MALAWI mvam Bulletin #10: October 2016
 Food security improves for the first time in three months in response to humanitarian assistance Key points: Negative coping strategies decrease across the country on account of increased scale up of humanitarian
How s Life in Canada?
 How s Life in Canada? November 2017 Canada typically performs above the OECD average level across most of the different well-indicators shown below. It falls within the top tier of OECD countries on household
The Sudan Consortium African and International Civil Society Action for Sudan. Sudan Public Opinion Poll Khartoum State
 The Sudan Consortium African and International Civil Society Action for Sudan Sudan Public Opinion Poll Khartoum State April 2015 1 Table of Contents 1. Introduction... 3 1.1 Background... 3 1.2 Sample
How s Life in Portugal?
 How s Life in Portugal? November 2017 Relative to other OECD countries, Portugal has a mixed performance across the different well-being dimensions. For example, it is in the bottom third of the OECD in
How s Life in France?
 How s Life in France? November 2017 Relative to other OECD countries, France s average performance across the different well-being dimensions is mixed. While household net adjusted disposable income stands
SKBN CU Humanitarian Update. May 2017
 Overview SKBN CU Humanitarian Update May 2017 Conflict in and nearby refugee camps puts thousands in danger and threatens the stability of the region during the main planting season. Medical supplies,
% of Total Population
 12 2. SOCIO-ECONOMIC ANALYSIS 2.1 POPULATION The Water Services Development Plan: Demographic Report (October December 2000, WSDP) provides a detailed breakdown of population per settlement area for the
PATHWAYS TO RESILIENCE: TRANSFORMING SYRIAN REFUGEE CAMPS INTO SELF-SUSTAINING SETTLEMENTS
 PATHWAYS TO RESILIENCE: TRANSFORMING SYRIAN REFUGEE CAMPS INTO SELF-SUSTAINING SETTLEMENTS FEASIBILITY STUDY FOR RESILIENCE-BUILDING IN SYRIAN REFUGEE CAMPS AND THEIR NEIGHBOURING HOST COMMUNITIES IN THE
There is a seemingly widespread view that inequality should not be a concern
 Chapter 11 Economic Growth and Poverty Reduction: Do Poor Countries Need to Worry about Inequality? Martin Ravallion There is a seemingly widespread view that inequality should not be a concern in countries
The Cook Political Report / LSU Manship School Midterm Election Poll
 The Cook Political Report / LSU Manship School Midterm Election Poll The Cook Political Report-LSU Manship School poll, a national survey with an oversample of voters in the most competitive U.S. House
REACH Situation Overview: Intentions and Needs in Eastern Aleppo City, Syria
 REACH Situation Overview: Intentions and Needs in Eastern Aleppo City, Syria 18 August 2016 INTRODUCTION Since the closure of Castello road in early July and the ensuing intensification of conflict in
MONTHLY UPDATE ON FOOD SECURITY AND PRICES IN RURAL AND URBAN AREAS
 BULLETIN January 2015 ISSUE 30 Fighting Hunger Worldwide MONTHLY UPDATE ON FOOD SECURITY AND PRICES IN RURAL AND URBAN AREAS ISSUE #30, World Food Programme Monthly Update on Food Security and Prices is
Poverty Profile. Executive Summary. Kingdom of Thailand
 Poverty Profile Executive Summary Kingdom of Thailand February 2001 Japan Bank for International Cooperation Chapter 1 Poverty in Thailand 1-1 Poverty Line The definition of poverty and methods for calculating
R Eagleton Institute of Politics Center for Public Interest Polling
 2002 SURVEY OF NEW BRUNSWICK RESIDENTS Conducted for: Conducted by: R Eagleton Institute of Politics Center for Public Interest Polling Data Collection: May 2002 02-02 EXECUTIVE SUMMARY TABLE OF CONTENTS
Tuesday, April 16, 2013
 Tuesday, April 16, 13 What is the Afrobarometer? The Afrobarometer (AB) is a comparative series of public opinion surveys that measure public attitudes toward democracy, governance, the economy, leadership,
How s Life in the Czech Republic?
 How s Life in the Czech Republic? November 2017 Relative to other OECD countries, the Czech Republic has mixed outcomes across the different well-being dimensions. Average earnings are in the bottom tier
NEPAL. mvam Food Security Monitoring Survey respondents interviewed. 6.2 members per household on average. 17% female headed households
 NEPAL mvam Bulletin #1: June 2017 mvam Food Security Monitoring Survey Mid-Western and Far-Western The eight districts of the mid and far-western mountains of are some of the most food insecure areas in
Hearing from Tanzanians
 Bill & Melinda Gates Foundation Canada is currently developing a new framework for international assistance policy, funding, and delivery. This is an unprecedented opportunity to review and rethink how
Public Attitudes Survey Bulletin
 An Garda Síochána Public Attitudes Survey Bulletin 218 Research conducted by This bulletin presents high level findings from the second quarter of the Public Attitudes Survey conducted between April and
REMITTANCE TRANSFERS TO ARMENIA: PRELIMINARY SURVEY DATA ANALYSIS
 REMITTANCE TRANSFERS TO ARMENIA: PRELIMINARY SURVEY DATA ANALYSIS microreport# 117 SEPTEMBER 2008 This publication was produced for review by the United States Agency for International Development. It
Above-average use of food-related coping continued for households in Anbar (20%) and Ninewa (18%) and declined by 11 percent in Salah Al-Din.
 and Ninewa (18%) and declined by 11 percent in Salah Al-Din.") Fighting hunger worldwide Bulletin 11 October 2015 IRAQ October 2015: Food security indicators continue to be poor in Anbar and Ninewa governorates, and for IDPs Highlights Food consumption indicators
Fighting hunger worldwide Bulletin 11 October 2015 IRAQ October 2015: Food security indicators continue to be poor in Anbar and Ninewa governorates, and for IDPs Highlights Food consumption indicators
FOURTH ANNUAL IDAHO PUBLIC POLICY SURVEY 2019
 FOURTH ANNUAL IDAHO PUBLIC POLICY SURVEY 2019 ABOUT THE SURVEY The Fourth Annual Idaho Public Policy Survey was conducted December 10th to January 8th and surveyed 1,004 adults currently living in the
Police Firearms Survey
 Police Firearms Survey Final Report Prepared for: Scottish Police Authority Prepared by: TNS JN:127475 Police Firearms Survey TNS 09.12.2014 JN127475 Contents 1. Background and objectives 3 2. Methodology
Insecure work and Ethnicity
 Insecure work and Ethnicity Executive Summary Our previous analysis showed that there are 3.2 million people who face insecurity in work in the UK, either because they are working on a contract that does
HOUSEHOLD SURVEY FOR THE AFRICAN MIGRANT PROJECT: UGANDA
 HOUSEHOLD SURVEY FOR THE AFRICAN MIGRANT PROJECT: UGANDA 1. Introduction Final Survey Methodological Report In October 2009, the World Bank contracted Makerere Statistical Consult Limited to undertake
The Poor in the Indian Labour Force in the 1990s. Working Paper No. 128
 CDE September, 2004 The Poor in the Indian Labour Force in the 1990s K. SUNDARAM Email: sundaram@econdse.org SURESH D. TENDULKAR Email: suresh@econdse.org Delhi School of Economics Working Paper No. 128
Changes in rural poverty in Perú
 Lat Am Econ Rev (2017) 26:1 https://doi.org/10.1007/s40503-016-0038-x Changes in rural poverty in Perú 2004 2012 Samuel Morley 1 Received: 15 October 2014 / Revised: 11 November 2016 / Accepted: 4 December
How s Life in Denmark?
 How s Life in Denmark? November 2017 Relative to other OECD countries, Denmark generally performs very well across the different well-being dimensions. Although average household net adjusted disposable
How s Life in the United States?
 How s Life in the United States? November 2017 Relative to other OECD countries, the United States performs well in terms of material living conditions: the average household net adjusted disposable income
LIBERIA. and Food. Security
 Nimba Refugee Assessment LIBERIA Ivorian Refugee Influx and Food Security March 2011 Data collected from 8 to 13 March 2011 This report was produced by: Sayba Y. Tamba, Food Security Analyst, MOA. sayb.tambyawa@gmail.com
Monthly Census Bureau data show that the number of less-educated young Hispanic immigrants in the
 Backgrounder Center for Immigration Studies July 2009 A Shifting Tide Recent Trends in the Illegal Immigrant Population By Steven A. Camarota and Karen Jensenius Monthly Census Bureau data show that the
How s Life in Ireland?
 How s Life in Ireland? November 2017 Relative to other OECD countries, Ireland s performance across the different well-being dimensions is mixed. While Ireland s average household net adjusted disposable
Shock and Poverty in Sub-Saharan Africa: The Case of Burkina Faso (Report on Pre-Research in 2006)
") Shock and Poverty in Sub-Saharan Africa: The Case of Burkina Faso (Report on Pre-Research in 2006) Takeshi Sakurai (Policy Research Institute) Introduction Risk is the major cause of poverty in Sub-Saharan
Shock and Poverty in Sub-Saharan Africa: The Case of Burkina Faso (Report on Pre-Research in 2006) Takeshi Sakurai (Policy Research Institute) Introduction Risk is the major cause of poverty in Sub-Saharan
EMPLOYMENT AND QUALITY OF LIFE IN THE MISSISSIPPI DELTA. A Summary Report from the 2003 Delta Rural Poll
 EMPLOYMENT AND QUALITY OF LIFE IN THE MISSISSIPPI DELTA A Summary Report from the 2003 Delta Rural Poll Alan W. Barton September, 2004 Policy Paper No. 04-02 Center for Community and Economic Development
How s Life in Germany?
 How s Life in Germany? November 2017 Relative to other OECD countries, Germany performs well across most well-being dimensions. Household net adjusted disposable income is above the OECD average, but household
Global Employment Trends for Women
 December 12 Global Employment Trends for Women Executive summary International Labour Organization Geneva Global Employment Trends for Women 2012 Executive summary 1 Executive summary An analysis of five
ANNUAL SURVEY REPORT: ARMENIA
 ANNUAL SURVEY REPORT: ARMENIA 2 nd Wave (Spring 2017) OPEN Neighbourhood Communicating for a stronger partnership: connecting with citizens across the Eastern Neighbourhood June 2017 ANNUAL SURVEY REPORT,
How s Life in Finland?
 How s Life in Finland? November 2017 In general, Finland performs well across the different well-being dimensions relative to other OECD countries. Despite levels of household net adjusted disposable income
The World Food Programme (WFP) Jordan FOOD SECURITY OUTCOME MONITORING (FSOM) Quarter 3 (Q3) 2017: Summary Report
 Jordan FOOD SECURITY OUTCOME MONITORING (FSOM) Quarter 3 (Q3) 2017: Summary Report") The World Food Programme (WFP) Jordan FOOD SECURITY OUTCOME MONITORING (FSOM) KEY FINDINGS: Food consumption improved amongst Syrian refugee households in quarter 3 (Q3), for both WFP general food assistance
The World Food Programme (WFP) Jordan FOOD SECURITY OUTCOME MONITORING (FSOM) KEY FINDINGS: Food consumption improved amongst Syrian refugee households in quarter 3 (Q3), for both WFP general food assistance