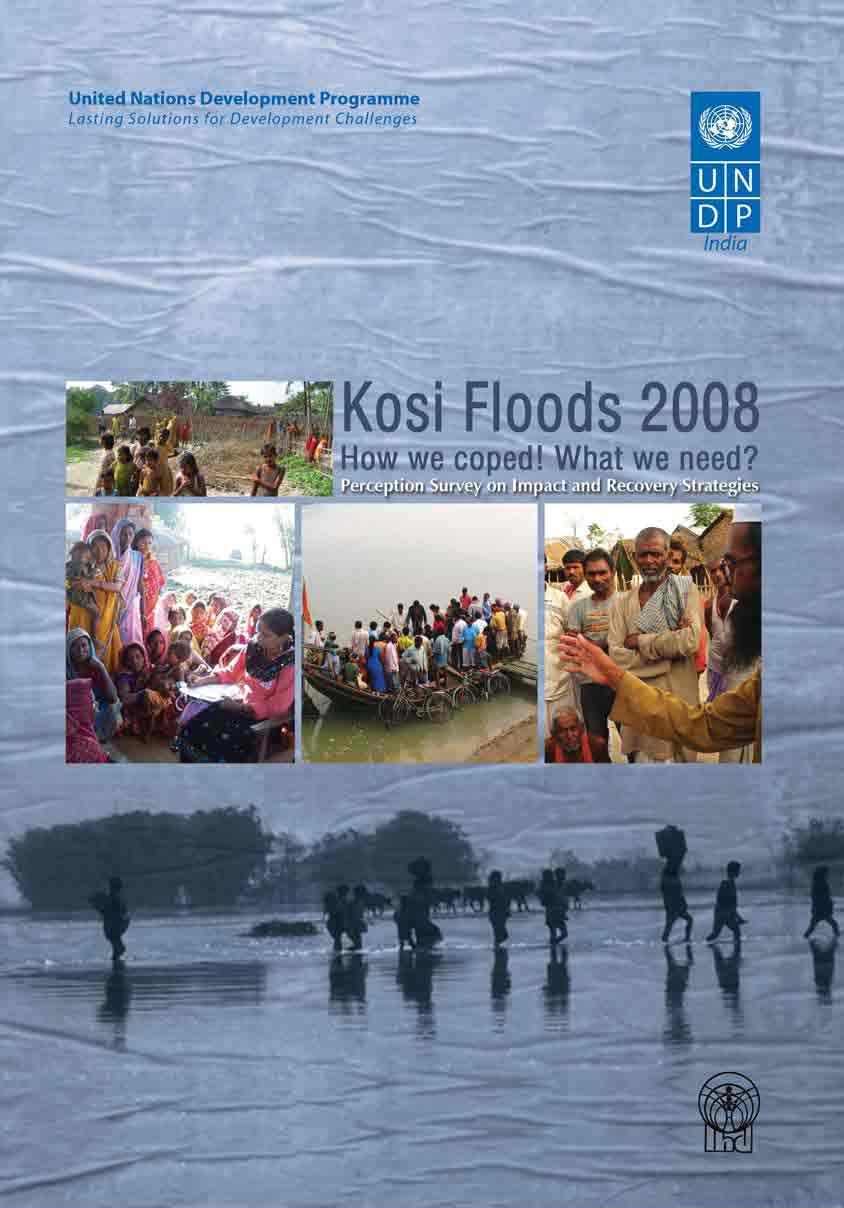
Kosi Floods 2008 How we coped! What we need? Perception Survey on Impact and Recovery Strategies
|
|
|
- Lauren Shaw
- 5 years ago
- Views:
Transcription
1
2 Kosi Floods 2008 How we coped! What we need? Perception Survey on Impact and Recovery Strategies
3 Published by United Nations Development Programme in the year of IHD Research Team Project Director: Project Advisor: Other Researchers: Alakh N. Sharma Gerry Rodgers Sunil K. Mishra, Tawheed R. Noor & Sonia S. Ashrafee Disclaimer The view in the publication are those of the authors and do not necessarily reflect those of the United Nations Development Programme. Copyright 2009 All rights reserved, Manufactured in India
4 FOREWORD As part of the United Nations Development Programme s (UNDP) contribution to disaster risk reduction and recovery endeavours in India, I am pleased to present: Kosi Floods 2008: How We Coped? What We Need? Perception Survey on Impact and Recovery Strategies. This report is a primary survey about the views and perceptions of the people affected by floods in the eastern Indian state of Bihar, in 2008, following the breach of the embankment of the Kosi river. It aims to highlight existing local capacities, knowledge and skills of women and men, with regard to coping mechanisms; and documents their requirements and preferred recovery strategies. The survey was conducted between October and December 2008, covered 800 households and an additional 200 respondents in relief camps in the five most-affected districts of Araria, Saharsa, Supaul, Madhepura and Purnia, by the Institute of Human Development it has benefited from their vast experience and understanding of the socio-economic conditions prevailing in Bihar. Disasters are quick to strike but their effects take very much longer to overcome. The extent to which their effects increase existing inequalities is dependent to a significant extent on how governments and other actors integrate human development into preparedness and response. In this context, the shift in the approach led by the Government of India, to integrate disaster mitigation into the development process is a step in the right direction. This shift assumes importance as India is traditionally vulnerable to natural disasters, on account of its unique geo-climatic conditions; with over 40 million hectares being prone to floods. This perception survey demonstrates an important method of proactive consulting with women and men, affected by floods, to devise methods of sustainable disaster risk management, based on their experiences and requirements. I hope that this perception survey, that has been enriched with important contributions from the women and men in the flood affected districts will prove to be a useful resource for administrators and institutions involved in disaster management. Deirdre Boyd Country Director i
5 ACKNOWLEDGEMENTS This study is an outcome of the collaborative efforts of the United Nations Development Programme (UNDP) and the Institute for Human Development (IHD). I am grateful to Ms. Deirdre Boyd, Country Director of UNDP, New Delhi, for giving IHD the opportunity to conduct such an important study. She not only took keen interest in it, but also gave valuable inputs to the research design. I am likewise thankful to Dr. K. Seeta Prabhu, Ms. Meenakshi Kathel and Dr. K.S. Vatsa of UNDP for providing their support. Their valuable inputs and experience shared enriched the study and was particularly useful at the questionnaire development phase. The help from other UNDP officials (in the study districts), who supported us directly during fieldwork, is also gratefully acknowledged. I would like to record my heartfelt thanks to Dr. Gerry Rodgers, for his invaluable support throughout. He not only helped in conceptualizing the study and developing the questionnaire but also participated briefly in fieldwork. Most importantly, he assisted considerably in analysis of the field data and provided extremely valuable comments on the draft We are thankful to International Labour Organisation (ILO) for providing Gerry Rodgers services for this work. Immense thanks are due to Dr. Sunil Kumar Mishra, Mr. Tawheed Reza Noor and Ms. Sonia Sultana Ashrafee for their contributions in analysis and drafting parts of the report. Dr. Sunil Mishra also managed the data processing in a very short time, for which he deserves special appreciation. The team of research investigators and supervisors deserve our great appreciation for conducting very difficult fieldwork. In several cases, they had to reach villages either on foot or by boat, given that roads were damaged or waterlogged. I especially thank Dr. Ramashray Singh, Mr. Ashwani Kumar, Mr. S.D. Choudhary, Mr. Subodh Kumar, Mr. Vijay Prasadh, Ms. Shashi Gupta and Mr. B.N. Singh all the field supervisors for managing the fieldwork and ensuring quality in the information. I would like to thank Dr. Krishnamurty and Mr. Navin Chandra, for going through the draft report and providing comments. The valuable help of my colleague Mr. C. Upendranadh was very important in completing this study. Apart from other support, he also contributed to the analysis and drafted a part of the report. The support received from the IHD administration needs to be acknowledged, especially that of Mr. S.P. Sharma for typesetting. I am also thankful to Ms. Shashikala Menon, for editing the draft and improving it. Last but not least, preparing this report would never have been possible if the villagers from the affected areas had not spared their valuable time and wholeheartedly cooperated and responded to queries. We are immensely grateful to them for their time and hope that they will soon be able to overcome the miseries. January 2009 Alakh N. Sharma Director Institute for Human Development ii
6 CONTENTS Foreword Acknowledgements List of Tables, Boxes and Charts List of Abbreviations Executive Summary Chapter 1: Introduction Context Methodology Timeframe and Team Composition Plan of Analysis Structure of the Report 4 Chapter 2: Socioeconomic Characteristics of Study Areas and Villages Characteristics of Study Districts Characteristics of Sample Households 8 Chapter 3: Experiences of the Floods Intensity of Damage: Lands Submerged Dwelling During the Flood Means of Evacuation Death and Health-Related Issues Relief Camp Experiences Conclusions 24 Chapter 4: Impact of the Floods on Livelihoods Losses at Village Level Losses at Household Level Conclusions 39 Chapter 5: Coping Mechanisms Coping Mechanisms Resources for Recovery and Rebuilding Migration as a Coping Mechanism Conclusions 49 Chapter 6: Recovery Strategies Willingness to Relocate Preferred Assistance for Recovery Recovery Strategies: Key Points from FGDs Conclusions 58 Chapter 7: Conclusions and Policy Implications Experiences and Impact of the Floods Coping Mechanisms and Recovery Strategies Policies for Recovery and Livelihoods Enhancement 63 Note on Projected Losses in Kosi Region 67 Annexures Annexure I Name of Village Surveyed 69 Annexure II List of Field Supervisors and Investigators 73 Annexure III Village Level Questionnaire 75 Annexure IV Household Level Questionnaire 89 Annexure V Focus Group Discussion 101 i ii iv vi vii iii
7 LIST OF TABLES, BOXES AND CHARTS List of Tables 2.1 Population Distribution and Social Composition of Study Districts, Demographic Characteristics and Literacy Levels of Study Districts, Worker Profile of Study Districts, Villages With Basic Facilities in Study Districts, General Characteristics of Households Land Ownership Details of Households Distribution of Households, by Landholdings and Social Groups Occupational Distribution of Households, by Social Groups Occupational Distribution of Households, by Poverty Groups Intensity of Damage of Living Areas and Agricultural Land in Surveyed Villages Percentage Distribution of Households by Their Staying Arrangements, by Social Groups Percentage Distribution of Households by Their Staying Arrangements During Floods, by Social Group and Head of Household Percentage of Households Experiencing Theft in Their Houses, by Social Groups Percentage Distribution of Households by Means of Evacuation, by Social Groups Percentage Distribution of Households by Means of Evacuation, by Social Group and Head of Household Number and Percentage of Villagers Suffering Diseases Post-Flood Percentage of Households Receiving Government Relief, by Social Groups Percentage of Households Receiving Different Types of Relief from Government, by Social Groups (Based on Multiple Answers) Percentage of Households Receiving Different Types of Relief from Government, by Social Groups and Heads of Household (Based on Multiple Answers) Percentage of Households Receiving Relief from NGOs or Other Agencies, by Social Groups Percentage Distribution of Households by Types of Difficulties in Relief Assistance ( All Respondents) Average Number of Days in Camps, by Social Groups Percentage Distribution of Households, by Bathing Arrangements Percentage Distribution of Households, by Quality of Food Percentage Distribution of Households, by Drinking Water Facility in Camps Percentage of Households, by Diseases in Camps* Number of Villages, by Extent of Road Damage a Percentage of Villages With Electricity, by Extent of Damage b Percentage of Villages With Telecommunications, by Extent of Damage Sources of Irrigated Areas, by Extent of Damage Damage to Drinking Water Sources Number of Villages, by Extent of Damage to Toilet Facilities Crop Damages Due to Floods (%) Number of Households With Livestock Lost and Average Amount of Loss Percentage Distribution of Houses, by Intensity of Damage Percentage of Houses Damaged, by Social Groups Percentage Distribution of Households by Foodgrain Losses and Average Value of Loss, by Social Groups Percentage Distribution of Households by Foodgrain Losses and Average Value of Loss, by Occupational Groups a Percentage of Households Where Males Experienced Illness/Disease Post-Flood, by Social Groups (Multiple response) 33 iv
8 4.12 b Percentage of Households Where Females Experienced Illness/Disease Post-Flood, by Social Groups (Multiple response) Percentage of Households Receiving Health Assistance, by Social Groups Percentage of Households Seeking Health Services from Different Sources, by Social Groups Percentage of Households Seeking Health Services from Different Sources, by Occupational Groups Percentage Distribution of Loss of Households, by Social Groups Percentage Distribution of Loss of Households, by Occupational Groups Loss of Agricultural Implements and Number of Days of Agricultural Activities Reported Loss of Working Days in Agriculture, by Social Groups Percentage of Households With Income Loss from Floods Percentage of Households With Income Loss, by Social Groups Percentage of Households by Income Loss, by Head of HH Percentage of Households Adopting Various Coping Mechanisms, by Social Groups Percentage of Households by Type of Coping Mechanism, by Occupational Groups Coping Mechanisms Undertaken, by Social Groups Percentage Distribution of Households Borrowing from Different Sources, by Social Groups Percentage of Households, by Borrowing Type and Head of Household Percentage Distribution of Households by Major Ways of Getting Resources for House Reconstruction/Repair, by Social Groups The Future of Agriculture - Can It Be Resumed Immediately? Reported Migration in Affected Villages Flow of Migration Before and After Floods, by Social Groups Percentage Distribution of Household Migration, by Nature and Destination Percentage Distribution of Households, by Willingness to Relocate a Priorities of SC and ST Households Among Different Types of Assistance (Up to First Three Priorities) b Priorities of Households Other than SC and ST Among Different Types of Assistance (Up to First Three Priorities) Projected Losses in Kosi Region 62 List of Boxes 3.1 Struggle for Survival Relief Distribution Experience of Women in Camps Case of Desperation Flood Made Health More Costly Initiative for Reviving Livelihoods 54 List of Charts 4.1 Issues in Accessing Water and Sanitation During/After Floods (FGDs with Women s Groups) Issues in Accessing Shelter During/After Floods (FGDs with Women s Groups) Problems Regarding Livelihoods Coping Mechanisms Issues for Women and Coping Mechanisms Adopted 45 v
9 LIST OF ABBREVIATIONS AAY APL BDO BPL FGD FHHs HHS IAY IHD MHHs NGO NREGS OBC I OBC II PDS SCs SDO SHG SSB STs UNDP Antodaya Anna Yojana Above Poverty Line Block Development Officer Below Poverty Line Focus Group Discussion Female-Headed Households Household Survey Indira Awaas Yojana Institute for Human Development Male-Headed Households Non-Government Organization National Rural Employment Guarantee Scheme Other Backward Caste I Other Backward Castes II Public Distribution System Scheduled Castes Sub-Divisional Officer Self-Help Group Seema Suraksha Bal Scheduled Tribes United Nations Development Programme vi
10 EXECUTIVE SUMMARY The massive Kosi River floods of August 2008 caused unprecedented loss to lives, livelihoods, infrastructure and property in north-eastern Bihar. Although floods have been a recurring feature in parts of the state, the 2008 floods were not usual. The Kosi burst its embankments and changed course, inundating areas of Bihar that had not experienced such flooding for half a century. About 1,000 villages in five districts (Araria, Madhepura, Purnia, Saharsa and Supaul) were affected, involving three million people, of whom about one million were evacuated. This perception survey was conducted to document the experiences of affected groups; explore the extent of damage at village and household levels; document impacts on shelter, access to food, water and sanitation, health and education, and livelihoods; identify coping mechanisms of people belonging to different social and occupational groups; and document potential recovery mechanisms as suggested by people. A total of 40 broadly representative villages were surveyed, as well as 820 sample households, of which 377 respondents were women; another 200 respondents from relief camps were selected. Focus Group Discussions (FGDs) were held with people belonging to various social groups in 20 out of 40 villages, where household surveys were not conducted. Since most affected households had not experienced floods for several decades, they were not prepared to respond quickly, which resulted in more loss of life and property. The State also was not prepared to deal with a catastrophe of this magnitude. A large number of households did not wait for the Government or outside agencies to evacuate them to safer places, but used their own means. The study findings suggest that nevertheless the Government played a significant role in rescue and evacuation operations. Government camps, even with minimal facilities, were seen as important and were appreciated because they provided food and shelter. No discrimination was found in disbursement of relief assistance (foodgrains, cash, medicines, clothes) across social groups, including to Scheduled Castes, Muslims and Other Backward Castes. Likewise, very few instances of corruption were reported during the FGDs. On the whole, Government relief was well targeted and managed. Both the local economy and livelihoods were severely disrupted, and there was massive damage at both village and household levels. Among villages, the losses were focused on roads, public infrastructure, and electricity and irrigation systems, while at the household level, the losses were more in terms of lives, livestock, agricultural operations and employment opportunities. Ill health also contributed to loss of livelihoods. Almost all households, across social groups (93 percent), reported income losses of more than 50 percent during the first three months after the floods, a very significant observation given that most of the affected people eke out their living by casual labour and agricultural work. Households across social groups also reported the loss of work implements, household goods, stored food, and other items, rending them completely dependent on the Government for relief and rehabilitation. The valuation of houses damaged stands at around Rs. 880 crores (US$ 195 million). Enormous amounts of goods were lost, including foodgrains and domestic items worth Rs. 400 crores (nearly US$ 88 million) and Rs. 155 crores (US$ 34 million) respectively. vii
11 Table A: Estimated Losses in the Affected Region, due to Kosi Floods (Rs. crores) Value of houses lost 880 Value of foodgrain lost 400 Value of livestock lost 390 Value of domestic items lost 155 Value of agricultural implements lost 75 Value of other losses (crops, trees) 60 Coping and Recovery Strategies Households adopted several short-term coping mechanisms, including finding temporary shelter, selling assets, withdrawing children from school and engaging them in work (if any), reducing household food portions, using stored foodgrains, and resorting to drinking contaminated water. Short-term migration, particularly to sites outside Bihar, proved a key coping mechanism. Other coping mechanisms dependent on external support included food and cash relief to buy food, chlorine tablets to purify drinking water, attending existing medical facilities, and relief for restoring livelihoods. Key longer-term recovery strategies identified by affected people included Government support for rebuilding their houses, through Indira Awaas Yojana (IAY) provision of land to the landless for house construction and of loans at cheap interest rates/compensation for house damage; continuation of short-term Government assistance (food or cash); creation of employment; and provision of food at a subsidized price through the public distribution system (PDS). Also suggested were repair of non-functional tubewells and installation of adequate numbers of tubewells with appropriate depth; provision of more healthcare facilities in villages; connecting schools with high-quality roads; provision of midday meals to schoolchildren; and reconstruction or renovation of schools, irrigation and electricity systems, embankments, roads and bridges. In particular, cultivators suggested the provision of subsidies and moratoriums on payment of debt; effective steps for land improvement though National Rural Employment Guarantee Scheme (NREGS); Government construction/repair of irrigation systems; supply of fertilizers and pesticides at subsidized rates; free distribution of diesel-pump sets; compensation for lost crops, shelter and assets; provision of crop insurance; and waiver of loans for flood-affected farmers. Among labour and artisan households, suggested strategies included reconstruction of destroyed/damaged houses; provision of subsidized loans for establishing small enterprises or shops; encouragement of activities such as piggery, animal husbandry and poultry; life insurance for the poor and landless as well as people with disabilities; encouragement of income generating activities; and extensive, effective implementation of NREGS. For women, suggested strategies included implementation of NREGS on a large scale; provision of debt relief and credit at low interest rates; provision of training for microenterprises; and formation of Self-Help Groups (SHGs). viii
12 Chapter 1 Introduction 12

13 Chapter 1 INTRODUCTION 1.1 Context The massive Kosi floods of 18 August 2008, caused by an extensive breach in the Kosi River, caused unprecedented loss to lives, livelihoods, infrastructure and property in north-eastern Bihar. Although floods have been a recurring feature in Bihar, these floods were not usual. The Kosi River, coming from Nepal in the north, burst its embankments, causing the river to change course and affecting areas of Bihar that had not experienced such floods for at least half a century. The floods caused widespread devastation and displaced more than one million people in the five districts of Supaul, Madhepura, Araria, Saharsa and Purnia, with the first three districts being most severely affected. Overall, about three million people in 1,000 villages of 35 blocks were affected. Provision of relief for flood victims has been satisfactory, including the setting up of relief camps primarily by the Government; however, apart from loss of shelter and property the floods also have long-term implications for the affected villages, with the fear that vast areas of agricultural land may become infertile for years. This survey assesses the impact of the floods impact on various aspects of livelihoods and assists in formulating livelihood strategies for recovery and reconstruction of the affected population and locations. In particular, it analyzes the impact on (i) shelter, health and sanitation, and access to food; (ii) means of immediate and long-term employment and earnings, such as cultivable land, livestock, fisheries and businesses; (iii) on the most vulnerable groups, and (iv) coping strategies adopted by affected men and women for recovery. 1.2 Methodology This survey is based on an extensive survey of over 40 representative villages in the five affected districts. Depending upon the extent of flooding in a district, 10 blocks were selected from a list of affected blocks prepared by the Bihar Government and UNDP personnel; selected blocks were verified by the research team through field visits. Three blocks each were selected in Supaul and Madhepura (most affected districts), two in Araria and one each in Purnia and Saharasa (partially affected districts). From each block, four villages were randomly selected; out of these, Boundaries of Districts are as per Survey of India Map and are for Indicative purposes only Photo UNDP India two were chosen for detailed household study and two for FGDs. Detailed village level data and information were collected from all 40 villages. The list of selected blocks and villages is given in Annexure Table 1. The survey adopted three types of survey instruments village schedule, household schedule and checklists for FGDs. 2
14 (i) Village Schedule Major village level information captured in the village schedule includes land use and cropping patterns, labour use patterns, migration structure, loss of village infrastructure and overall impact of floods on the village economy. A pre and post-flood comparison also was made. Most data and information were collected from key informant groups and knowledgeable persons, such as the village sarpanch and local teachers, while some came from village and panchayat offices. (ii) Household Survey The household survey undertaken in 20 villages (two each from each block) covered 820 households, with 40 to 42 households from each sample village. These households were selected proportionately, on the basis of a circular systematic sampling method, from Above Poverty Line (APL) and Below Poverty Line (BPL) households 1. In the household survey, a large number of respondents from the sample households were women 377 women in 820 households. In addition to these households, another 200 randomly chosen people were surveyed from three selected relief camps, one each from Madhepura (70 respondents), Araria (65 respondents) and Supaul (65 respondents) districts. This was done in November 2008, almost at the end of the household survey, when most camps were closing. Major aspects covered in the household survey include employment structure of household members, ownership and loss of assets, borrowing strategy and coping mechanisms. Several sections in the questionnaire contained questions on the situation before and during the floods. iii) Focus Group Discussions FGDs were carried out with various groups from 20 villages, where the household survey was not conducted. Groups included agricultural labourers, marginal and small farmers, medium and large farmers, people involved with non-agricultural activities (such as artisans or barbers), and women. Some members of each group also were women. In identifying participants, caution was taken to ensure that they were roughly of the same socio-economic group or had a similar background in relation to issues under investigation. Age and sex composition also were taken into account. Major questions covered diverse areas including shelter, access to food, water and sanitation, health and overall livelihoods. Each discussion explored the impact of the floods, coping mechanisms and recovery strategies. In many cases, it was difficult to segregate different occupational groups, given the multiplicity of occupations within households. The study particularly emphasized the inclusion of women and vulnerable groups such as Scheduled Castes (SCs), OBCs and minorities. It was ensured that these groups actively participated in FGDs as well as the village schedule. Finally, the stratification of households into APL and BPL, for the purpose of sample selection, also facilitated the inclusion of vulnerable groups in sample households. 1.3 Timeframe and Team Composition This study was carried out during October and December 2008, with rigorous fieldwork began in November and lasted about a month. A four member research team was constituted supported by 35 field investigators, (including 12 women). These women investigators conducted the interviews and FGDs with women. In addition, six experienced persons supervised the fieldwork. 1 Based on a comprehensive set of indicators, a census survey of all households by the Government identifies poor and non-poor households as BPL and APL; in order to provide several public services to the poor in rural areas. 3
15 1.4 Plan of Analysis To assess the impact of the floods on households, the analysis has been divided according to social and occupational groups. Social groups include: (SCs), (STs), Other (OBC I); Other Backward Classes II (OBC II), Others (overwhelmingly Hindu dominant castes such as Brahmin, Bhumihar or Rajputs), and Muslims. The first two groups, SCs and STs, are socially and economically the most vulnerable, while in Bihar the OBC I group is more vulnerable than the OBC II group. The first five groups belong to the Hindu community; all Muslims are included in the last category. The second type of analysis of data is by occupation. In the studied villages, the major occupation of households includes agricultural labour, cultivation, services, and business and artisanal work. As noted above, in many cases it was difficult to categorize a household in a particular occupation because of the multiplicity of occupations pursued by family members. However, based on certain criteria and value judgments, each household has been classified in a specified occupation. The first criteria considered was the occupation of members in the households: If all household members worked in a single trade or occupation, then the household was included in that occupational category. If a household comprised more of than one working member and they were involved in more than one occupation, then the occupation that provided most of the household income determined its occupational group. Broadly, the survey households have been divided into seven occupational groups: casual wage labourers, small and marginal cultivators, medium and large cultivators, salaried households, skilled workers and artisans, self employed in business, and other households. In casual wage labour households, casual labourers working in agriculture, construction and other non-agricultural sectors have been included, along with related labourers in agricultural and non-agricultural sectors. Households were categorized in the second and third occupational categories, on the basis of operational landholdings, those with landholdings of less than five acres were categorized as small and marginal cultivators and those work more than five acres considered large cultivators. All skilled workers like tailors, masons, plumbers, mechanics and electricians, as well as artisans like shoe makers, weavers and basket makers are included as skilled workers and artisans. The remaining are grouped as other households. The study has attempted to take into account gender inequality by disaggregating data by sex, wherever relevant and possible. A projection of loss for the whole Kosi region has also been attempted for some important items. For estimation, we have considered the total affected families due to Kosi floods for all the 1,000 villages, as reported by the Government of Bihar. The percentages of families that lost different items such as livestock, houses, foodgrains, domestic goods, other goods and agricultural implements and their average values of losses from the household survey have been used for this estimation. The details of estimation are provided in the Note (page 67). Needless to say, these estimates are very rough and only highlight the magnitude, and do not measure the exact amounts of losses. 1.5 Structure of the Report The report consists of seven chapters. Chapter 1 describes the design and methodology of the study. Chapter 2 provides the socioeconomic profile of the Kosi regions study districts, as well as the villages and households affected. Chapter 3 presents the experiences of the floods as related by the villages in the region, based on the survey. Chapter 4 assesses the impact of the floods on village infrastructure, live and livelihoods. Coping strategies of people and households in meeting the disaster are presented in Chapter 5. Chapter 6 presents the long and short-term recovery strategies identified by the study. Chapter 7 provides the conclusions and policy implications that emerge from the study. 4
16 Chapter 2 Socio economic Characteristics of Study Areas and Villages 12
.")
17 Chapter 2 SOCIO ECONOMIC CHARACTERISTICS OF STUDY AREAS AND VILLAGES The river Kosi, originating in Nepal, passes through most of north eastern Bihar. Although about eight districts in north east Bihar are regularly inundated during the monsoon by the Kosi, the floods of 2008 affected five districts (Araria, Madhepura, Purnia, Saharsa and Supaul). Moreover, the change in the course of the river during the 2008 floods marks an important departure, with many villages flooded for the first time. 2.1 Characteristics of the Study Districts The five flood-affected districts are among the poorest in India. In 2001, during the last national Census, the total population of the five districts was about 8.3 million. The population is overwhelmingly rural, ranging from 91 percent in Purnia and Saharsa to some 95 percent in Araria, Madhepura and Supaul (Table 2.1). A significant proportion of the population is Muslim particularly in Araria and Purnia (41 and 37 percent respectively). The proportion of people belonging to STs is very small, but the proportion SCs especially in Madhepura and Saharsa. Photo UNDP India Table 2.1: Population Distribution and Social Composition of Study Districts, 2001 District Population % Rural Social Composition (lakh) Population % SC % ST % Hindus % Muslims Araria Madhepura Purnia Supaul Saharsa Bihar Source: Census of India, 2001 Average household size varies from 5.2 to 5.7, less than the overall average household size in the state (6.0). The sex ratio is unfavourable for females in all districts. (Table 2.2). All five districts also have extremely loss literacy levels much lower than the average for Bihar, which is itself the lowest in India. The female literacy rate is even cover, with rates of 21 percent in Supaul to about 25 percent in Saharsa; in all districts, female literacy rates are less than half that of male literacy rates. 6

18 Table 2.2: Demographic Characteristics and Literacy Levels of Study Districts, 2001 District Avg HH Size Sex Ratio (Females per 1,000 Males) Literacy (%) Male Female Total Araria Madhepura Purnia Supaul Saharsa Bihar Source: Census of India, 2001 Agriculture, on which about 90 percent of the population is dependent, is largely subsistence, with very low productivity. As Table 2.3 shows, all five districts have higher work participation rates than the average for Bihar; however, this appears to be related to widespread poverty, which pushes people to work even in activities that very low incomes provide. It is revealing that the proportion of workers engaged in non-agricultural activities ranged from as low as 7 percent in Madhepura to 10 percent in Saharsa in Agricultural labourers thus constitute the majority of workers and in Araria and Purnia comprise two-thirds of all workers (Table 2.3). Table 2.3: Worker Profile of Study Districts, 2001 District % Workers to Total % of Total Workers Population Agricultural Labour Cultivators HH Industry Others Araria Madhepura Purnia Supaul Saharsa Bihar Source: Census of India, 2001 The vulnerability of these districts is reflected not only in demographic, occupational and other characteristics of the population but also in terms of acute shortages of basic facilities and social infrastructure. For example, Purnia has far fewer villages with primary schools than the state average of 62.2 percent; as Table 2.4 illustrates, in 2001 only 53 percent of the villages in Purnia had primary schools. Striking gaps also exist with respect to access to industrial and training schools: Only 10 industrial schools existed in all five districts in 2001, with Purnia, Madhepura and Saharsa having none at all. Health facilities display a similar picture the number of allopathic hospitals per one lakh (100,000) population is very low. Only one primary Photo UNDP India health centre per one lakh population was found in four districts out of five only in Madhepura was the situation in marginally better. At the same time, although irrigation facilities are available for about 50 percent of the cultivable land, the quality of irrigation is poor. Further, on average, 77 percent of villages in these districts did not have electricity in 2001 (Census of India). 7
19 Table 2.4: Villages With Basic Facilities in Study Districts, 2001 District % Villages Having Primary Schools % Villages Having Middle Schools % Villages With Secondary Schools Number of Industrial Schools Training Schools Allopathic Hospitals per Lakh Population Maternity Homes per Lakh population Primary Health Centres per Lakh Population Post Offices per Lakh Population % Irrigated Area Supaul Araria Purnia Madhepura Saharsa Total in five districts Bihar Source: Census of India, 2001 Thus, the five flood-affected districts were extremely poor, with low indications human development (income education & health) regard to almost all aspects of human development. Given this acute vulnerability and poverty, it is hardly surprising that every year a very large number of people migrate from the region to other parts of India in search of work. 2.2 Characteristics of Sample Households Out of 820 households surveyed, about 23 percent people belonged to SCs and 38 percent to OBC II (middle castes); and 17 percent were Muslims. The rest were spread across other caste groups, with 14 percent belonging to OBC I, (who are more vulnerable than OBC II). More than half of the households (about 55 percent), were reported as Below Poverty Line households (BPL), with access to a ration card entitling them to subsidized food grains and other development initiatives. Table 2.5 provides details of characteristics of the households surveyed. Table 2.5: General Characteristics of Households Total Households (HHs) Surveyed 820 Socio-Religious Distribution of HHs % Scheduled Castes 23.4 Scheduled Tribes 3.5 Other Backward Castes I 13.9 Other Backward Castes II 38.7 Others Muslims 17.1 All 100 Distribution by Poverty Groups (%) Above Poverty Line (APL) 43.0 Below Poverty Line (BPL) 54.8 Antodaya Anna Yojana (AAY) Don t Know 0.4 All Comprises mostly Hindu dominant castes such as Brahmin, Bhumihar and Rajput 3 Households included in AAY (food security Initiative for the poorest of the poor) 8

20 As shown in Table 2.6, which presents land ownership details of sample households, half of all households were landless or near-landless, which is consistent with the acute vulnerability of the people of these districts. Only seven percent of the households reported having between 5-10 acres of land, while fewer than three percent reported more than 10 acres. The rest were small or medium farmers. Table 2.6: Land Ownership Details of Households Land Distribution Categories % Landless or near-landless (<0.5 acre) to 1.0 acre to 2.0 acres to 5.0 acres to 10.0 acres 7.1 >10.0 acres 2.7 All 100 Juxtaposing land ownership data with social group data reveals that landlessness largely prevails among people belonging to SCs, STs, Muslims and OBC I households. Among SC households, three in four were landless or near-landless, while among ST and Muslim households, the ratio was about three in five (Table 2.7). This has strong implications for coping and recovery strategies of the flood-affected population. Table 2.7: Distribution of Households, by Landholdings and Social Groups Land Size SC ST OBC I OBC II Others Muslims Total Landless Less than 0.5 acre to 1.0 acre to 2.0 acres to 5.0 acres to 10.0 acres >10.0 acres Total no. of HHs Occupational patterns in the households by different social groups are summarized in Table 2.8. Most SC and ST households are casual wage labourers (62 and 59 percent respectively), and half the Muslim households also belong to this category. Small and marginal cultivators mainly belong to the category Others (primarily Hindu dominant castes), OBC II, OBC I and STs. One in every 10 households was a medium/large farmer, most belonged to OBC II or Other categories. Skilled workers and artisans hail mainly from Muslim families. Nearly eight percent of the households were salaried and self-employed in small businesses. Photo UNDP India 9
21 Table 2.8: Occupational Distribution of Households, by Social Groups Occupational Group SC ST OBC I OBC II Others Muslims Total Total no. of HHs Casual Wage Labour Small and Marginal Cultivators Medium and Large Cultivators Salaried Households Skilled Workers and Artisans Self-Employed in Small Businesses Other Households All Total Number of HHs Occupational distribution of households by poverty groups (Table 2.9) suggests that casual labourers represent the poorest of the poor, followed by skilled workers and artisans. As many as three-fourths of casual wage labourers and close to three-fifths of skilled workers and artisans live below the poverty line. Table 2.9: Occupational Distribution of Households, by Poverty Groups Occupational Group APL BPL AAY* Don t Know Total HHs Casual Wage Labour Small and Marginal Cultivators Medium and Large Cultivators Salaried Households Skilled Workers and Artisans Self-Employed in Small Business Other Households Total Again, household level analysis confirms that the five flood affected districts are extremely vulnerable in terms of human development, facing widespread poverty and access to very few basic amenities. A large number of households belong to particularly vulnerable SC, ST, OBC I and Muslim communities, with most households landless or near-landless. Nearly all these households, the vast majority of which are engaged in agricultural labour or cultivation, thus suffer from severe multiple social deprivations. In all, a strong association is observed between social marginalization, resource poverty and income poverty. 10
22 Chapter 3 Experiences of the Floods 12


23 Chapter 3 EXPERIENCES OF THE FLOODS Highlighting the intensity of the 2008 flood damage, particularly to croplands and living areas, this chapter reports how women and men experienced floods. It deals with types of accommodation that villagers opted for, their experiences with evacuation, casualties and illnesses, and relief-related issues. Likewise, it surveys villagers experiences in relief camps, including personal hygiene, quality of food, access to drinking water, incidence of disease and protection mechanisms. 3.1 Intensity of Damage: Lands Submerged Historically, the flooding of the Kosi River is regarded as an annual bane for the population of north eastern Bihar, particularly those living near the river s banks and accustomed to the its fury during monsoons. But in 2008, for nearly three in four surveyed households the Kosi s severe flooding was a new experience.critically, no disaster preparedness had been undertaken in villages where floods occurred for the first time, with more than half of villagers receiving no early Photo UNDP India warning and being forced to arrange their own means for reaching other towns, for safely and relief. Yet, 10 out of the 40 affected villages lacked even a boat; in 14 villages, residents had to flee on foot, in search of shelter. Crops, infrastructure and other assets were extensively damaged by the floods, and villages remained waterlogged for an average of nearly two months (53 days). The highest and lowest duration of standing water in homestead areas was three months and 10 days, respectively. For agricultural land, waterlogging persisted even longer, for an average of nearly three months, up to a maximum of four months. Roads were the worst hit; in many villages the earthen road was completely washed away. Where the road survived, standing water remained an average of two months. In two out of three villages, more than 75 percent of the living area was affected. Nine in 10 villages had at least 50 percent of agricultural land affected, while seven in 10 villages suffered devastation to more than 75 percent of croplands (Table 3.1). Photo UNDP India 12


24 Table 3.1: Intensity of Damage of Living Areas and Agricultural Land in Surveyed Villages Extent of Damage Number of Villages Extent of Living Area Affected Extent of Agricultural Land Flooded Less or Equal to 25% 3 26% to 50% 4 51% to 75% 8 76% to 90% 7 > 90% 18 < 50% 4 50% to 75% 8 76% to 90% 10 More than 90% 18 Photo UNDP India 3.2 Dwelling During the Flood Evacuation and immediate relief were critical for affected households, as shown in Table 3.2. One-third of households shifted to nearby Government camps during the flood, while only four percent took shelter in the camps run by NGOs/charitable organizations. About one in four household made their own arrangements to move out of flood-affected villages. Notably, every ST household reported being forced out of their villages by the floods, with four in five household tak shelter in camps (66 percent in Government camps, 14 percent in NGO camps). On the other hand, one in three SC households made their own arrangements, as did Muslims and other Hindus. Only one in six households did not leave their villages, which is not surprising given that for most households the floods were a new experience. Photo UNDP India 13

25 Table 3.2: Percentage Distribution of Households by Their Staying Arrangements During Floods, by Social Groups Staying Arrangement SC ST OBC I OBC II Others Muslims Total Village Government Camps Camps Run by NGO or Charitable Organization With Relatives and Friends in Other Villages Own Other Arrangements Others Total HHs If we consider the use of the shelter arrangements during the flood by occupational category, it can be seen that the families of casual wage labourers and skilled workers/artisans took shelter mainly in Government camps. Table 3.3 suggests that compared to male-headed households (MHHs), a proportionately larger number of female-headed households (FHHs) took shelter in Government camps and houses of relatives/friends. FHHs belonging to SC/ST and Muslim families mainly went to Government camps. On the other hand, MHHs also took shelter in self-arranged facilities and camps run by NGOs or charitable organizations. Table 3.3 Percentage Distribution of Households by Their Staying Arrangements During Floods, by Social Group and Head of Household Staying Arrangement Male-Headed Households (MHHs) SC/ ST OBC II & Others OBC I & Muslims Total Female-Headed Households (FHHs) SC/ST OBC II & others Photo UNDP India OBC I & Muslims Village Government Camps Camp Run by NGO or Charitable Organization With Relatives and Friends in Other Village Own Other Arrangement Others Total HHs Total 14

26 About one in four medium and large cultivators and salaried employees stayed back in their villages, perhaps because they possessed houses that were comparatively safe and secure. As relatively better off households, they also may have feared theft; indeed, about 12 percent of households that moved to safer places particularly OBC I and Others reported thefts in their homes (Table 3.4). Although the average value of loss was around Rs. 4,500 (about US$100 at the time), this is a considerable amount given the rural context and the economic vulnerability of households. Table 3.4: Percentage of Households Experiencing Theft in Their Houses, by Social Groups %Reporting Theft SC ST OBC I OBC II Others Muslims No. of HHs Reporting Theft Total Note: The percentages reported are only for those households that had left their houses during the floods. Box 3.1: Struggle for Survival We got no early warning of the flood and thought that the flood would not hit us. So we had no preparation to protect us from the sudden flood. We stayed in our village for 15 days and then took shelter in the school building of a neighbouring village, called Tulsha. Though initially there was no support from the Government, the villagers of Tulsha came forward to save us. They used to prepare khichudi, and we had two meals a day. After a few days, the school was turned to a Government camp, and from then on we started receiving Government relief and three meals a day. Photo UNDP India 3.3 Means of Evacuation Only one in 10 affected households received Government assistance for evacuation and the rest largely left their villages through their own efforts, implying that the Government was unprepared for flooding of this extent. Likewise, NGOs were absent in ensuring immediate evacuation (Table 3.5). This was true for households from all social groups. 15
27 Table 3.5: Percentage Distribution of Households by Means of Evacuation, by Social Groups Evacuation Type SC ST OBC I OBC II Others Muslims All Government Assistance With Help of NGOs or Other Agencies With Own Efforts Others Total Number of HHs Note: The other 137 households stayed in their villages during the floods. This absence of outside support assumes particular importance for FHHs, which usually require additional support during disasters, to ensure their own safety and that of their children. Yet, the overwhelming majority of households, whether male or female-headed, sought their own means of evacuation from flood-hit villages (Table 3.6). Government support and assistance were higher among FHHs of Muslims and OBC I compared to others, an important finding in view of these households extra vulnerability. Table 3.6: Percentage Distribution of Households by Means of Evacuation, by Social Group and Head of Household Male-Headed HHs Female-Headed HHs Evacuation Type SC/ST OBC II & Others OBC I &Muslims Total SC/ST OBC II & Others OBC I &Muslims All Government Assistance With Help of NGOs or Other Agencies With Own Efforts Others Total No. of HHs Interactions with the villagers through FGDs suggest that the evacuation experience of people villages in relatively remote areas was more strenuous and distressing than that of the people in villages closer to towns, where affected people were eventually rescued by Government boats. The survey found several examples where people showed great courage in saving their family members or others. But many people had to wait in marooned villages to be rescued, while villagers near the Indo-Nepal border had no Government boats for evacuation; instead, they had to flee on self-made temporary rafts of oil drums and bamboo or banana plants. In some cases, affected people, including women and made girls, had to wade through water which was nearly a metre deep for distance of three kilometers. 16
 - visited during the floods to oversee evacuations.")
28 FGD participants from remote villages told investigators that very few local Government officials -Block Development Officer (BDO), Sub-Divisional Officer (SDO), District Magistrate (DM) or Superintendent of Police (SP) - visited during the floods to oversee evacuations. Some NGOs and social welfare societies visited the villages for this purpose, as did officials of the Seema Suraksha Bal (Border Security Force - BSF) who made two or three visits. In some cases, poor households faced numerous difficulties in evacuation. According to villagers from Bohra in Purnia and Rampur in Madhepura, villagers perceived that Government boatmen charged higher prices (as much as Rs. 500) from people belonging to marginalized groups for transport to safer places. They also reportedly forced villagers belonging to poorer groups to wait up to 10 days in flood affected villages before coming to rescue them. 3.4 Death and Health-Related Issues The floods threatened the lives and health of many people through food shortages (resulting from crop failure), loss of purchasing power for basic necessities, and the potential spread of water-borne or food deficiency-related diseases (Table 3.7). Some 493 persons (275 men, 218 women) died in the surveyed villages because of the floods. Major casualties were caused by water-borne diseases (diarrhoea, jaundice, gastric diseases), followed by death from drowning. About 11 pregnant women died from lack of emergency health facilities in or near the villages. Outbreaks of disease were common, with the predominant illnesses reported in the survey encompassing skin diseases, fever, problems related to the stomach, cold/cough, and diarrhoea. About five percent of people in the surveyed villages suffered from skin diseases, the most frequent category, followed by fever (three percent). A significant number of people (about 2.4 percent) also suffered from stomach problems. Findings suggest that both men and women experienced a similar morbidity pattern. The floods devastation also had a strong psycho-social impact on the people, particularly on the women and children. Photo UNDP India 17


29 Table 3.7: Number and Percentage of Villagers Suffering Different Diseases Post-Flood Males Females All Disease Type Number % of total population Number % of total population Number % of total population Cold and Cough Water-borne diseases Digestive problem Fever Skin disease Stomach problem Others Total population* * 40 surveyed villages 3.5 Relief The Government response to the crisis was swift. The village survey reveals that the Government s direct transfers to flood victims were eventually well-targeted, although immediate relief went mainly to seriously flood-exposed villages. The Government and charitable organizations established camps, where a large number of people took shelter and were provided food and other basic amenities. During the first phase of relief, affected households received grain transfers of one quintal and a cash transfer of Rs. 2,250. Almost all surveyed households received this relief, although it should be noted that household members said they felt that it was too little for their needs. Photo UNDP India An overwhelming majority of households, encompassing all social groups, reported receiving Government assistance of some kind. One reason could be the large number of households that had taken shelter in Government supported camps (Table 3.8); in addition, Table 3.9 shows that a larger percentage of SC/ST households received food and clothes compared to other groups. With regard to cash and grains, differences across social groups were minimal. Table 3.10 also reveals that the proportion of FHHs obtaining relief, such as food and medicine, was higher than for MHHs. The percentage is marginally higher in the case of cash and grains, although a somewhat smaller number of FHHs got clothes. Thus, it appears that Government assistance was well-targeted in favour of the more vulnerable groups. Photo UNDP India 18
30 Table 3.8: Percentage of Households Receiving Government Relief, by Social Groups Social Groups % SC 96.4 ST 100 OBC I 96.5 OBC II 92.0 Others 92.9 Muslims 97.9 Total 95.0 Table 3.9: Percentage of Households Receiving Different Types of Relief from Government, by Social Groups (Based on Multiple Answers) Relief Type SC ST OBC I OBC II Others Muslims Total Food Medicine Clothes Cash Grains Government Credit Others No. of Beneficiaries Table 3.10: Percentage of Households Receiving Different Types of Relief from Government, by Social Groups and Heads of Household (Based on Multiple Answers) Male-Headed HHs Female-Headed HHs/ Relief Type SC/ST OBC II & Others OBC I &Muslims All SC/ST OBC II & Others OBC I &Muslims All Food Medicine Clothes Cash Food Grains Government Credit Others No. of Beneficiaries
31 Apart from Government, NGOs and other agencies also provided relief in the form of food, medicine, clothes, utensils and so forth. Such assistance was reported by about 38 percent of households surveyed (Table 3.11). Thus, although the Government played the most important role in relief operations, civil society s role also was significant. No difference existed across social groups in this respect. Table 3.11: Percentage of Households Receiving Different Types of Relief from NGOs or Other Agencies, by Social Groups Relief Type SC ST OBC I OBC II Others Muslims All Food Medicine Clothes Cash Credit Other* No. of Beneficiary HHs % of Beneficiary HHs to All HHs *Note: Other assistance includes cooking utensils, mugs, buckets, torches, match boxes etc. Besides food support, households across different social groups received relief including utensils, mugs, buckets, torches, match boxes and so forth from NGOs. Table 3.11 shows that members from SC and Muslim families received mainly clothes, followed by OBC II families. Relatively higher proportions of OBC I and OBC II families received credit support from NGOs. Overall, leakages in the supply of relief items were very small (Table 3.12). It is equally important to note that officials involved with relief operations behaved well-incidents of rude behaviour reported were very few. Further, little discrimination was reported in distribution of relief, although a small percentage of SC households reported encountering discrimination. On the a whole, it appears Government relief was well-targeted and managed. Table 3.12: Percentage Distribution of Households, by Types of Difficulties in Relief Assistance (All Respondents) Type of Difficulty SC ST OBC I OBC II Others Muslims All Lack of Awareness Distance from Relief Centre/Camp Discrimination in Distribution of Relief Assistance Leakages in Supply in Relief Items Rude Behaviour of Relief functionaries All

32 During FGDs, however, more villagers shared instances of being discriminated against as well as cheated by Government relief authorities. While it would be difficult to generalize based on such instances, potential discrimination needs to be acknowledged as an issue to be addressed in the future to ensure effective, transparent systems of relief and rehabilitation. Particularly in some of the more remote areas, villagers expressed deep anger about the role of the Government authorities in the lack of coordination during the floods. The survey team also reported some instances of corruption by panchayat functionaries and officials involved in relief Nonetheless, the general conclusion was that corruption during the floods was far less than what might be expected. 3.6 Camp Experiences Many families were in camps for several months and faced numerous challenges during their stay. The Survey team gathered information on this issue, so as to be able to confirm measures that can be taken in the future to effectively manage short-term relief. Box 3.2: Relief Distribution In getting food support, irregularities are reported. Cash of 2,250 rupees was properly distributed, but grains in each packet were of less weight than stated, and some packets were inedible. Residents of Dumarbanna village, Araria District Camp experiences were collected from two sets of respondents: those who had stayed in the camps but returned to the villages after the flood waters receded, and those still in the camps at the time of the survey (although most Government camps had already closed). The sample Photo UNDP India size for these two groups was 292 and 200 respectively. Information in the following sub-sections is supplemented with data gathered through FGDs, with communities that narrated their experiences at camp sites Duration of Stay in Camps The average number of days in relief camps varied from 41 to 60 days across different social groups, reflecting the considerable time it took for floodwaters to recede (Table 3.13). People generally moved back to their villages as soon as they could. The survey team were also informed of a few instances where officials pressurised people to vacate the camp. Table 3.13: Average Number of Days in Camps, by Social Groups Social Group Avg. No of Days SC 60 ST 53 OBC I 54 OBC II 52 Others 60 Muslims 41 All 53 21
; more than 40 percent of SC, ST and Muslim respondents reported bathing in the open.")
33 3.6.2 Personal Hygiene While most families in camps reported having temporary bathing places near the handpump or well, a significant 35 percent overall reported they had to use open spaces for bathing (Table 3.14); more than 40 percent of SC, ST and Muslim respondents reported bathing in the open. Given hygiene and sanitation conditions and the density of population, lack of proper bathing arrangements led not only to personal discomfort, particularly for women, but also to potential health hazards such as the spread of water-borne and communicable diseases. Table 3.14: Percentage Distribution of Households, by Bathing Arrangements Bathing Arrangements SC ST OBC I OBC II Others Muslims All Temporary Bathroom in the Camp Temporary Arrangement Near Handpump/Well Pumps/Rivers Open Space All Women from Kamp Pashchimi and Kachra villages of Saharsa reported similar constraints to those noted in Box 3.3. Women of Kamp Pashchimi village also reported that sometimes they were forced to use ash on cloth in place of sanitary napkins, since not enough of the latter were available. All this caused Reproductive Tract Infections (RTIs). Box 3.3: Experience of Women in Camps In the relief camps, we particularly women and adolescent girls experienced very complicated situations in terms of personal hygiene. The problem was more acute during menstruation as neither any cloth nor any sanitary napkins were available. We had hardly any space or usable water to clean ourselves. At the same time, we were lacking clothes to wear. We had to cover our body mainly with a one-yard long cloth, which restrained us from taking regular showers and also caused body odour. We had to wrap our body with the same wet clothes after we showered, which caused skin diseases and irritation. Photo UNDP India Women s group, Kusha village, Supaul district Quality of Food The vast majority of respondents reported the quality of food distributed at the camps was tolerable (Table 3.15); in conditions of distress, and given the enormity of task, one might assume that food arrangements in camps would be reasonable for consumption. However, one-fourth of Muslim respondents in the camps perceived that the quality of food was very bad. 22
34 Table 3.15: Percentage Distribution of Households, by Quality of Food Food Quality SC ST OBC I OBC II Others Muslims All Good Tolerable Very Bad Others All Access to Drinking Water Apart from sanitation and food, drinking water was another important facility at the campsites (Table 3.16). It can be seen that handpumps were the major source of water for those staying in the camps. While the handpump is the traditional source of water for people of the region, the fact that temporary toilets were erected close to the handpumps could lead to poor water quality. Table 3.16: Percentage Distribution of Households, by Drinking Water Facility in Camps Sources of Drinking Water SC ST OBC I OBC II Others Muslims All Tubewell Well Handpump Tap Water Tanker Others All Incidence of Disease in Camps Illness in the camps was also observed, with a number of camp residents reporting bouts of viral fever, dehydration/dysentery and ailments like cough and cold (Table 3.17). Malaria and dehydration/ dysentery were observed proportionately more among SC and ST respondents. Table 3.17: Percentage of Households, by Diseases in Camps* Disease Type SC ST OBC I OBC II Others Muslims All Malaria Dehydration /Dysentery Viral Fever Kalazar Cough and Cold Chickenpox Skin Diseases All Households *Household that stayed in camp 23
35 3.6.6 Collectivity and Protection Mechanisms in Camps During the crisis when survival was in question, affected people who hardly knew each other developed close ties to protect themselves. Many private camps were established in open spaces, and the Government could not deploy police at the private camps and was able to do so only rarely in its own camps. In camps in villages such as Jagta, Bela, Manikpur and Dumarbanna under Narpatganj block of Araria district, affected people even formulated a self-defence system to ensure their security. Teams of members from affected families in the camps were formed to guard the camp in four shifts. At least two or three people were deployed at each of several checkposts established about 100 metres from the camp. However, it must be noted that field investigators received no major complaints about violence and discrimination, from any of the camps, which indicates that camp residents largely felt secure. 3.7 Conclusions The following main points emerge from the analysis of households experiences during the floods, based on the sample survey and FGDs: For most households, the experience of floods was new and sudden, and hence they were not in a position to respond quickly to evacuate themselves to safer places. This resulted in loss of life as well as property. Many households did not wait for the Government to provide evacuation; they used their own means to move out of flooded villages. Friends, relatives and other agencies helped the victims, as did the Government. Government camps were seen as important locations for the people to reach soon after evacuation. Although these camps had minimal facilities, respondents expressed overwhelming appreciation for Government efforts in providing food and shelter, even as many were concerned about health and hygiene facilities. Incidence of water-borne diseases in camps and other sites, as well as the practice of using handpumps, were issues of concern. No discrimination was found across social groups in terms of disbursement of relief assistance. FHHs appear to have received food and medicines in larger proportions. At the same time, some participants in FGDs reported of instances of corruption and discrimination in the disbursement of relief. Though not widely reported, this reflects the need to set up mechanisms for enhanced transparency and accountability. Some communities organized themselves for safety and security at the camps, which complemented Government efforts. Largely people appeared to feel secure in the camps. 24
36 Chapter 4 Impact of the Floods on Livelihoods 12


37 Chapter 4 IMPACT OF THE FLOODS ON LIVELIHOODS This chapter examines losses due to the Kosi floods at two levels, the village and the household. At the village level, general losses are considered, including damage to village infrastructure, irrigation systems and drinking water sources and sanitation. Damage to infrastructure focuses on the extent to which roads, electricity and telecommunications facilities were affected. Losses at the household level are specific in nature: Crops, livestock, houses, food, and domestic and other goods, as well as disruption in accessing health and education. Finally, the chapter concentrates on livelihoods, employment and income-related losses. 4.1 Losses at Village Level Damage to Village Infrastructure The severe floods extensively damaged physical infrastructure such as roads, electricity lines, embankments, bridges and culverts, and telecommunications, hindering efficient relief work and access to basic services. Table 4.1 summarizes the extent of damage with regard to roads. Villages with katcha roads were most affected, with six out of seven of these roads seriously damaged or washed away. About 40 percent of semi-pukka roads also experienced severe damage. Table 4.1: Number of Villages, by Extent of Road Damage Type of Road Some Damage Damaged but Repairable Seriously Damaged/ Washed Away Pukka Semi-Pukka Katcha Total Other most important village infrastructure facilities that were severely affected included electricity (Table 4.2a) and telecommunications (Table 4.2b). Photo UNDP India All Electricity was damaged as electric poles were uprooted or wires disconnected by the heavy flow of water. Before the floods, nearly two-thirds of the 40 villages had electricity connections, which fell sharply after the floods by about half (from 25 to 12 villages). Similarly, the number of households with electricity connections declined by nearly half (115 hhs before the floods, 62 hhs afterwards.). Photo UNDP India 26
38 Table 4.2a: Percentage of Villages With Electricity, by Extent of Damage Type Before Floods After Floods % Point Change Villages Having Electricity Villages Not Having Electricity All 25 (62.5) 15 (37.5) 40 (100) Average No. of HHs With Electricity (30.0) 28 (70.0) 40 (100) (-32.5) (32.5) Before the floods, nearly 90 percent of the villages (35 out of 40) had mobile phone communication links, while just under three in five villages had land the communication systems. In almost all villages with land lines, facilities were badly or partially damaged by the floods. The mobile phone network was also affected, although only to a small extent. Table 4.2b: Percentage of Villages With Telecommunications, by Extent of Damage Type Badly Damaged Partially Damaged No Damage Villages Not Having Such Facilities Land Line 91.30% (21) 4.35% (1) 4.35% (1) 42.50% (17) Access to Mobile Network 22.86% (8) 31.43% (11) 45.71% (16) 12.50% (5) Damage to Irrigation Systems The floods severely damaged irrigation systems, which are highly dependent on tubewells. About three-fourths of tubewells were severely or completely damaged, and in many cases repair proved difficult; similarly, about 77 percent of canals were severely or completely damaged. This will involve huge expenditures for repair (Table 4.3). The survey also found that around two-thirds of diesel pump sets were severely or completely damaged and one-third were partially damaged. Table 4.3: Sources of Irrigated Areas, by Extent of Damage Irrigation Sources Severely/ Completely Damaged Partially Damaged No Damage All Boring Canal Others Total Damage to Drinking Water Sources and Sanitation Flooding caused major deterioration in the quality of households health environment, destroying or damaging toilet facilities and reducing people s access to safe water. Issues in accessing water and sanitation facilities are summarized in Chart
39 Chart 4.1: Issues in Accessing Water and Sanitation During/ After Floods (FGDs with Women s Groups) Frequently Mentioned Very few facilities for pure water source Toilet not nearby Long walk (minimum 30 minutes) to fetch water Open defecation Sense of embarrassment and insecurity Use of contaminated water for all purposes Moderately Mentioned Mentioned a Few Times Infrequent bathing while in camps because of not having extra clothes Long line to fetch water Issues during menstruation Water emitting foul smell because of carcasses of dead animals Flooding caused enormous damage to drinking water sources, which are dependent upon public and private handpumps. Almost half of functioning public handpumps were damaged, as were one-third of private handpumps. Public and private wells also were severely affected by the floods, with the water easily polluted (Table 4.4). Table 4.4: Damage to Drinking Water Sources Type Total Number Functioning Before Flood Public Well * Private Well * Public Handpump Private Handpump * Public and private wells are functioning but are not used for drinking purposes now. Functioning After Flood Unsafe drinking water in turn caused numerous water-related diseases. During FGDs, villagers emphasized the significant health impact from sources of water being grossly contaminated. For example, although the iron content in the area s water was normally high, after the floods it became so high that consumption became harmful. Nonetheless, villagers had no option but to drink this polluted water. In the camps, however, access to relatively good-quality water was available, since boring was deeper; tankers with safe water also were provided to camp residents. Villagers further reported that water changed its colour and taste after its collection. Micro-organisms were found in the water, and the percentage of sand and clay in it was also found to have increased. Villagers main expectation form the Government was that it should immediately provide safe drinking water. The few tubewells still functioning post-flood have become the main points for water collection. Some are located far from villages, entailing extra effort for women to collect water. In addition, marginalized groups still face discrimination in accessing water points; some villages reported that dominant and middle caste villagers (OBC II) usually did not allow the SC community to use private or public tubewells. Major damage also occurred to sanitation facilities. In the 35 villages with toilets, in 16 villages nearly half were badly or severely damaged, with the vast majority in the latter category (Table 4.5). 28
 6 Medium Damage (26% to 50%) 13")
40 Table 4.5: Number of Villages, by Extent of Damage to Toilet Facilities Extent of Damage No. of Villages Mild Damaged (<=than 25 % of latrine damaged) 6 Medium Damage (26% to 50%) 13 Bad Damaged (51% to 75%) 3 Severe Damaged (>75%) 13 Toilet Not Used Losses at Household Level Crops Lost Damage to the kharif-season crops, including paddy, maize, jute and other vegetables, was extensive, as shown in Table 4.6. Aghani paddy, the major crop, was severely/completely damaged in nearly 75 percent of villages and partially damaged in another 20 percent. Similarly, jute and maize have been very badly damaged. Damage to vegetables (brinjal, chilli, potato, Photo UNDP India leafy vegetables), and pulses (urad, mung) was equally extensive. The study showed that the prospect of rabi crops also was adversely affected: Threefourths of villages reported no possibility of rabi crops, and in the rest, although sowing was possible, production was expected to be low. Table 4.6: Crop Damage Due to Floods (%) Crop Completely/ Severely Damaged Partially Damaged No Damage All Aghani Paddy Maize Mung Urad Groundnut Sugarcane Vegetables Sunflower Jute Flowers Livestock Lost More than one in three households reported lost or missing bullocks, cows or goats, with two in five reporting lost or missing buffaloes. Household losses of pigs and poultry were even more extensive. 29
41 Table 4.7: Number of Households With Livestock Lost and Average Amount of Loss Social Groups No. of HHs Lost Livestock Avg Value of Livestock Lost (Rs) Average income lost* (Rs) SC ST OBC I OBC II Others Muslims All * Income calculated for approximately three months, from the day of the floods to the day of the survey Box 4.1: Case of Desperation Somehow we managed to arrive in Tulsha village, either on foot or by flat boats made by banana stems or bamboo, but we were not in a position to save our animals. So we had to sell our animals at extremely lower prices; for example, we sold a cow worth Rs. 1,300 at a price of only Rs Many of the households reporting livestock losses were from the OBC II community, followed by SCs and Muslims (Table 4.7). Values of the lost livestock averaged Rs. 2,059 with individual highs of nearly Rs. 10,000 which has major implications for households income earning opportunities. From Table 4.7, it can be estimated that the value of livestock lost in the region totaled Women from Narayanpur village, Purnia District about Rs. 390 crore 4. Although villagers may have overestimated their losses, hoping for additional compensation, clearly the overall loss is enormous and much higher than official statistics Houses Damaged Damage to houses was extensive, with data revealing about 37 percent of houses completely/severely damaged and another 40 percent partially damaged. Of thatched houses, which are home to nearly three in four households, only 13 percent were undamaged by the floods. Similarly, more than 96 percent of katcha houses were completely or partially damaged. Table 4.8 also details damage to pukka and semi-pukka houses. For many, houses are also used as work places and quite often this would mean losing work related equipment that gets washed away with the building. Table 4.8: Percentage Distribution of Houses, by Intensity of Damage House Type Severely/ Completely Damaged Partially Damaged Not Damaged Katcha Pukka Semi-Pukka Thatched Total Total No. of Houses 4 See Note on Projected Losses in Kosi Region page
42 Across all social groups, most households reported damaged houses (Table 4.9), with severe damage in one-third to one-half of all damaged houses. Muslims, the OBC I community and SCs reported comparatively greater damage to their houses than other groups. Respondents across social groups estimated the amount required for house repair/reconstruction to range from Rs. 85,00 to 17,000, with an average of Rs. 15,000. Altogether, estimated costs of repairing the damage to housing amount to Rs. 880 crore (US$ 195 million) in the affected region as a whole 5. Table 4.9: Percentage of Houses Damaged, by Social Groups Social Group Total No. of HHs % Damaged Of Total Houses Damaged, % of Slightly Damaged Severely Damaged Collapsed SC ST OBC I OBC II Others Muslims All Avg Amt Needed to Repair (Rs)* During FGDs with villagers, it was found that villagers from many remote locations were forced to stay in open places for two to three days following the floods. In addition, issues particularly faced by women in accessing shelter are summarized in Chart 4.2. Chart 4.2: Issues in Accessing Shelter During/After Floods (FGDs with Women s Groups) Frequently Mentioned Feeling of sudden homelessness due to house being damaged Shelter taken by families on roof of house to escape floodwaters Lack of privacy Moderately Mentioned Mentioned a Few Times Walls collapsed Still water standing around house Abundance of insects, mosquitoes, flies and snakes Food After the floods, food scarcity became common throughout the affected area, exacerbated by lack of firewood. Three-fourths of households reported losing foodgrains stored for future use. At the same time, according to half of the households, they lost domestic goods like utensils and buckets. This implies a lack of preparedness, arising from no previous flood experience. Table 4.10 shows the distribution of households according to the extent of loss of foodgrains. It can be observed that this reflects poverty between social groups, with people belonging to SCs showing the least loss and other Hindus the greatest. 5 See Note on Projected Losses in Kosi Region page
43 Table 4.10: Percentage Distribution of Households by Foodgrains Losses and Average Value of Loss, by Social Groups Social Group Total HH Foodgrains % HHs Lost Average Value of Loss (Rs) SC ST OBC I OBC II Others Muslims All From Table 4.10, it can be estimated that foodgrains lost to the region totaled about Rs. 400 crore (US$ 88 million) 6. Meanwhile, households engaged in different occupations also lost foodgrains differ, ranging from 62 percent of skilled workers and artisans to 84 percent of salaried households, again reflecting the low income or asset levels of some groups (Table 4.11). Table 4.11: Percentage Distribution of Households by Foodgrain Loss and Average Value of Loss, by Occupational Groups Occupational Group Total HHs Casual Wage Labour Small and Marginal Cultivators Medium and Large Cultivators Salaried Households Skilled Workers and Artisans Self-Employed in Small Business Other Households All Foodgrains % HH Lost Average Value Of Loss (Rs) Access to Health and Education In disaster situations, minor ailments like viral fever and cough and cold are frequent and extensive. Following the 2008 Kosi floods, in addition to these minor ailments, more than one in three households reported dehydration/dysentery, which is directly related to quality of water as well as hygienic conditions. Responses by community to illness/disease reflect the overall pattern (Tables 4.12a and 4.12b). For men, viral fever (51 percent) was most dominant, followed by cough/cold (42 percent) and dehydration/dysentery (37 percent). Interestingly, the prevalence of diseases in women seemed fewer: 37 percent of women suffered cough/cold, followed by viral fever (33 percent) and dehydration/ dysentery (27 percent). 6 See Note on Projected Losses in Kosi Region page
44 Table 4.12a: Percentage of Households Where Males Experienced Illness/Disease Post-Flood, by Social Groups (Multiple response) Disease SC ST OBC I OBC II Others Muslims All Malaria Dehydration/Dysentery Viral Fever Kalazar Cough and Cold Chickenpox Skin Diseases Other HHs Experiencing Disease Table 4.12b: Percentage of Households Where Females Experienced Illness/Disease Post-Flood, by Social Groups (Multiple response) Disease SC ST OBC I OBC II Other Muslim All Malaria Dehydration/Dysentery Viral Fever Kalazar Cough and Cold Chickenpox Skin Diseases Other HHs Experiencing Disease The response of the Government as well as private agencies in providing health assistance is critical in a disaster situation. As Table 4.13 indicates, across all communities, an overwhelming majority of households reported receiving health assistance during the floods, reflecting Government and private efforts to meet basic health needs as part of relief. Indeed, private clinics played an important role in providing medical support, given that affected people were accustomed to receiving services from small private clinics available in rural areas and catering to the population for minor ailments. Household members in the study sought health support, mainly from mobile/emergency medical teams, followed by private clinics and Government hospitals. Among the most vulnerable, SC and ST families sought support largely from mobile medical teams and the Government. 33
45 Table 4.13: Percentage of Households Receiving Health Assistance, by Social Groups Social Category Males Females Total SC ST OBC I OBC II Others Muslims All This study shows that dehydration/dysentery, viral fever, and cough and cold are the most common diseases afflicting households. Among available health services, respondents reported, irrespective of sex of household head, that they sought health support from private clinics, emergency medical teams and Government hospitals (Table 4.14). During FGDs in the villages, it was reported that Government health services were inadequate during the floods, which made health costs higher and in some cases led to unnecessary casualties (Box 4.2). According to the villagers, even before the floods, health facilities faced severe constraints; for this reason, households opted for private clinics which were expensive. At the same time, many people had to cover long distances to avail of these services. Participants in FGDs who lived relatively closer to towns identified several issues relating to health services in their localities. These included: inadequate health support; irregular visits by doctors; need to go to town for treatment; need to incur high medical costs to see private doctors and conduct other medical tests; and inadequate health support for maternity related cases. Box 4.2: Floods Made Health More Costly Doctor came to see us only twice in the first week of setting up the emergency medical camp in Bohra School. We had to come to Purnia to see the doctor in the Government hospital or private clinic. We had to pay Rs. 200 as consultation fees if we saw a private doctor. The costs ranged from 500 to 700 Rupees if some additional tests were included. Women s groups: SC/ST, Muslim, Landowners, Bohra village, Purnia A compounder visits the village once in a week for attending to women with maternity problems. But this service is really not sufficient. A nursing home should be set up, within the vicinity of the village. Women s groups: SC/ST, Muslim, Landowners, Bohra village, Purnia Due to lack of health facilities, during an emergency situation in the area, we just leave the patient s life in the hands of God. Soniya Sardar, a woman belonging to an SC family, Sukhnagar village, Supaul District On the other hand, participants in FGDs from remote villages faced health facilities not within the vicinity of villages; roads to health centres were washed away and there were no suitable means of transport; misbehaviour of doctors and associates; non-availability of medicines; and increased medical costs as Government doctors advised patients to seek their services privately. 34
46 Table 4.14: Percentage of Households Seeking Health Services from Different Sources, by Social Groups Sources of Health Services Male-Headed Households Female-Headed Households SC/ST OBC II & Others OBC I & Muslims Total SC/ST OBC II & Others OBC I & Muslims Total Mobile/Emergency Medical Team General Health Practitioner Traditional Health Practitioners Government Hospital Private Clinic Others Number of Households Health-seeking patterns by occupation also suggest that wage labourers, irrespective of the sex of household head, went to Government hospitals, emergency medical teams and private clinics for treatment (Table 4.15). Table 4.15: Percentage of Households Seeking Health Services from Difference Sources, by Occupational Groups Occupational Group Male-Headed Households Female-Headed Households Wage Labour Landed Households Other Households Total Wage Labour Landed Households Other Households Total Mobile/Emergency Medical Team General Health Practitioner Traditional Health Practitioner Government Hospital Private Clinic Other (Specify) Number of HHs
47 4.2.6 Losses of Domestic and Other Goods Tables 4.16 and 4.17 present the percentage of households (by social and occupational groups respectively) that lost domestic and other goods during the floods, and average values of such losses. Table 4.16 shows that half of the households lost domestic goods like utensils and buckets; at the same time, 10 percent lost other goods, which may include other consumables and durables. The estimated value of domestic goods lost ranges from Rs. 2,505 (for Muslim households) to Rs. 8,431 (households belong to Others), whereas it is Rs. 2,813 (for SC households) to Rs. 8,813 (for OBC II) in cases of other goods lost. Table 4.16: Percentage Distribution of Household Loss, by Social Groups Domestic Goods Other Losses Social Group Total HHs % HHs lost Average Value Lost (Rs) % HHs lost Avg Value (Rs) SC ST OBC I OBC II Others Muslims All Table 4.17: Percentage Distribution of Household Loss, by Occupational Groups Domestic Goods Other Losses Occupational Group Total HHs % HHs Lost Avg Amt of Loss (Rs) % HHs Lost Avg Amt of Loss (Rs) Casual Wage Labour Small and Marginal Cultivators Medium and Large Cultivators Salaried Households Skilled Workers and Artisans Self-Employed in Small Business Other Households All Table 4.17 suggests that a substantial number of casual wage labourers (more than half) lost domestic goods, although the average value of loss was relatively lower (Rs. 2,908). It indicates that total domestic goods lost and other losses would total Rs. 155 crores (US$ 34 million) and 60 crores (US$13 million) 7 respectively. 7 See Note on Projected Losses in Kosi Region page 67 36

48 4.2.7 Livelihood and Employment Losses Loss of agricultural implements was reported by a large number of households. Although most households are poor, even medium and large farmers found their livelihoods affected by such losses. Overall, about 27 percent of households reported losing agricultural implements (Table 4.18). The table suggests that total loss of agricultural implements would be about Rs. 75 crore (US$ 16 million). Table 4.18: Loss of Agricultural Implements and Number of Days of Agricultural Activities Photo UNDP India Social Groups % of HHs Losing Agricultural Implements Value of Agricultural Implements Lost (Rs) SC ST OBC I OBC II Others Muslims All Households also reported losing potential agriculture working days, which meant loss of income for agricultural and casual labourers alike, along with land owning households. Table 4.19 shows that across social groups, an average 86 days of work were reportedly lost because of the floods. Table 4.19: Reported Loss of Working Days in Agriculture, by Social Groups Social Group Average Number of Working Days Lost SC 85 ST 86 OBC I 88 OBC II 86 Others 88 Muslims 85 All 86 In terms of income lost during the floods, Table 4.20 reflects the devastating impact of the losses: About two-thirds of all households reported a loss of income between 50 and 99 percent, with another 28 percent reported losses of 25 to 50 percent. While the income losses reported by villagers may be somewhat overstated, clearly they were substantial. Maximum losses were among near-landless and already vulnerable SC communities, of whom nearly three in four lost from half to 99 percent of their income. 37
49 Table 4.20: Percentage of Households With Income Loss from Floods Income Loss SC ST OBC I OBC II Others Muslims All Less than 10% to 25% to 50% to 99% Total Table 4.21 illustrates a similar pattern of income loss occurring in female and male-headed households, with two-thirds losing more than 50 percent of their incomes. Female-headed households SC/ST families experienced the highest income losses. In addition, Table 4.22 suggests that a larger proportion of female-headed households wage labourers lost their incomes, while Chart 4.3 shows the multiple issues that FGD participated particularly in regaining employment. Table 4.21: Percentage of Households With Income Loss, by Social Groups Male-Headed HHs Female-Headed HHs Income Lost SC/ST OBC II & Other OBC I & Muslim Others SC/ST OBC II & Other OBC I & Muslim Others Less than 10% to 25% to 50% to 99% Total No. of HHs Table 4.22: Percentage of Households With Income Loss, by Head of HH Male-Headed HHs Female-Headed HHs Income Lost Wage Labour Landed Households Other Households Total Wage Labour Landed Households Other Households Total Less than 10% to 25% to 50% to 99% Total No. of HHs

50 Chart 4.3: Problems Regarding Livelihoods Frequently Mentioned Women Lost Employment No Income Male-Biased Employment Opportunities Moderately Mentioned Mentioned a Few Times Loss of working equipment Inability to migrate out of the villages for work because of damaged roads In sum, the 2008 Kosi floods severely disrupted the local economy and livelihoods of the region. Although all sections of the villagers were affected, the intensity of suffering varied among social and occupational groups. Daily wage labourers were the most severely affected, as their employment and monthly earnings reduced sharply, with a decline in the wage rate by percent after the floods. In the FGDs, villagers from different groups also reported that they had been largely unemployed during the three months between the floods and the group discussions, except those who had migrated. 4.3 Conclusions At the village level, significant losses from the Kosi floods were reported in terms of public infrastructure, including roads, irrigation and electricity systems, and telecommunications. In contrast, at the household level losses were reported in terms of lives, livestock, agricultural operations and employment opportunities. Most households in all social groups reported losing more than half and up to nearly all of their income. This observation is critical, since the socio economic status of the households even before the floods was precarious, and most people eked out their living by casual labour and agricultural work. Households in all social groups also lost stored food, equipment/ implements, household goods and other consumables, which rendered many of them dependent on the Government for relief and rehabilitation. Lastly, it should be remembered that the floods caused widespread illness among affected people. This, in turn, has constrained their employment capacity and affected their income. Photo UNDP India 39
51
52 Chapter 5 Coping Mechanisms

53 Chapter 5 COPING MECHANISMS As mentioned above, most of the affected villagers were experiencing severe floods for the first time. Accordingly, they were mentally and physically ill-prepared for the calamity, as illustrated by several indicators of their immediate response. Coping strategies that villagers adopted are discussed below. 5.1 Coping Mechanisms Most households across all social groups expressed the need for Government assistance to cope with the floods and their aftereffects. Respondents reported seeking loans from money lenders, using available and old materials for reconstruction of damaged houses, and planning for reconstruction with future earnings. Dipping into previous savings formed an important coping mechanism, but only for a small number of households. Given the poor economic conditions and occupational Photo UNDP India profiles of the affected households, they did not have cash savings of enough magnitude to help tide over the calamity. Across social groups, an overwhelming majority of households indicated they would depend on the Government. (Table 5.1). Borrowing turned out to be the second most important coping strategy, with more than 28 percent of households indicating this option; the percentages among some poorer groups (SC, OBC I and Muslims) were even higher. Table 5.1: Percentage of Households Adopting Various Coping Mechanisms, by Social Groups Coping Strategies SC ST OBC I OBC II Others Muslims All Government Relief Other Than Government Relief (NGOs and other Charitable Organizations) Relatives Support Own Savings Borrowings Temporary Employment No. of HHs Table 5.2 gives the preferred coping mechanisms by occupational groups, considering the sex of the household head. Although Government relief is most demanded across the groups as a whole, it is important to note that wage labourers are distinctly more dependent on Government relief. Borrowing from others is the second most important coping mechanism for MHHs, whereas it varies for FHHs. While wage labourers and FHHs overall, considered borrowing as their second most important 42

54 coping mechanism, landed FHHs considered support from relatives as preferable. Most households, irrespective of sex of the head of household, put less emphasis on their own savings as a coping mechanism. About 35 percent of FHHs, who are wage labourers, indicated borrowing as a coping mechanism (Table 5.2). Table 5.2: Percentage of Households by Type of Coping Mechanism, by Occupational Groups Relief Type Male-Headed HHs Female-Headed HHs Wage Labour Landed Households Other Households Total Wage Labour Landed Households Other Households Total Government Relief Other Than Government Relief (NGOs and Charitable Organizations) Relatives Support Own Savings Borrowings Temporary Employment Total The consequences of floods and the related displacement can be seen through coping strategies adopted by the households, including withdrawing children from school and putting them to work, selling assets, reducing household food stocks and seeking work under the NREGS. Although a significant number of people lost at least some of their stored foodgrains because of the floods, some nevertheless were able to use remaining stores to help them cope with food scarcity. Across social groups, Table 5.3 shows, households reported using stored foodgrains as an important coping mechanism. Photo UNDP India Table 5.3: Coping Mechanisms Undertaken, by Social Groups Social Group % HHs Storing Foodgrains % HHs Selling Assets % HHs Reducing Food Post-Flood SC ST OBC I OBC II Other Muslim All % HHs Seeking Work from NREGS 43
55 During the FGDs, affected groups of men and women alike suggested coping mechanisms that they would like the Government and other agencies to take up in such challenges. They discussed these strategies in terms of shelter, food, water and sanitation, health and education. Chart 5.1 depicts a consolidated picture vis-a-vis coping mechanisms as expressed by agricultural labourers, small and marginal farmers, medium and large farmers, artisans and women. It should be underscored that while some coping mechanisms are immediate in nature, others are longer-term. Participants identified several key mechanisms that are dependent on external support to overcome a dire situation of no food and no drinking water or potable water; these include food and cash relief in accessing food; chlorine tablets for accessing safe drinking water; attendance at medical facilities for disease treatment; and relief support to restore livelihoods. Chart 5.1: Coping Mechanisms Area Shelter Access to Food Access to Water and Sanitation Access to Health and Education Livelihoods Coping Mechanisms Temporary arrangements Staying on the premises of panchayat office or any other public place Sharing other villagers shelters Food and cash relief Ate one meal a day Half-fed at each meal Compromise on food items Borrowed foodgrains from others because Government relief inadequate Ate two meals a day Did not serve some family members, including children Fasted Used chlorine tablets supplied by NGOs Drank contaminated water Drank less water each day Drank boiled water (very rare) Defecated in open places Defecated in others toilets Attended medical facilities, if existing Visited traditional healers in the vicinity Took patients to nearby blocks/towns if emergency Abstained from seeking health support Migrated Took credit at very high interest rates Leased land Accepted relief assistance FGDs with women revealed the multiple issues they faced in meeting the disaster, particularly with regard to shelter, food security, health, water and sanitation, and livelihoods. Details are provided in Chart 5.2, summarized according to the frequency with which they were mentioned. 44
56 Chart 5.2: Issues for Women and Coping Mechanisms Adopted Access to Food Coping Mechanisms Frequently Mentioned Ate one meal a day Half-fed at each meal Compromised food items Borrowed foodgrains from others because Government relief inadequate Mentioned a Few Times Ate two meals a day Some family members, including children, not served Mentioned a Very Few Times Fasted Access to Water and Sanitation Water Frequently Mentioned Used chlorine tablets supplied by NGOs Drank contaminated water Mentioned a Few Times Drank less water each day Mentioned a Very Few Drank boiled water Times Sanitation Frequently Mentioned Defecated in open places Mentioned a Few Times Defecated in others latrines Livelihoods Frequently Mentioned Mentioned a Few Times Child labour Took credit at very high interest rates Leased land Migrated Accessed relief assistance Women were also concerned about the lack of warm clothes to protect themselves from the coming winter. The floods had claimed all their warm clothes, so receiving woollen clothes and blankets was a necessity. The winter season has already come. We have lost everything in the floods. We do not have any woollen clothes and blankets. How will we protect ourselves and our children from the cold? Uma Sardar, 25, SC, Sukhnagar village, Pratapganj block, Supaul District 5.2 Resources for Recovery and Rebuilding All social groups, relatives and friends, as well as money lenders, were the main sources of borrowing following the floods. Table 5.4 suggests that about 30 percent of households reported they had taken loans from various sources. Informal sources, though timely, also demand high interest rates, which results in further indebtedness and dispossession of assets for most poor and marginalized households. Informal money lenders represent the main source of borrowing for both MHHs and FHHs, followed by relatives and friends (Table 5.6). 45
57 Table 5.4: Percentage Distribution of Households Borrowing from Different Sources, by Social Groups Borrowing Sources SC ST OBC I OBC II Others Muslims All Relatives and Friends Moneylenders Cooperative Banks and Microfinance Total HHs Borrowing % of Households With Any Loans Total No. of HHs Table 5.5: Percentage of Households, by Borrowing Type and Head of Household Source of Borrowing Male-Headed HHs Female-Headed HHs Number % Number % Relatives and Friends Moneylenders Cooperative Banks and Microfinance All % HHs Borrowing As Table 5.6 indicates, householders own savings and bank loans do not figure in the list of long-term coping mechanisms, possibly because of the poor economic conditions of the households and their inability to access formal lending institutions. At the same time, the table also shows the willingness of some affected groups (particularly SCs and STs) to repair their houses by future savings. Table 5.6: Percentage Distribution of Households by Major Ways of Getting Resources for House Reconstruction/Repair, by Social Groups Sources of House Reconstruction SC ST OBC I OBC II Others Muslims All Own Savings Borrowing from Relatives/ Friends Moneylenders Using Old/Available Building Materials Government Assistance Banks and Financial Institutions Through Own Future Savings Others Total no. of HHs

58 For most households about 55 percent resuming agriculture was not an immediate option (Table 5.7). This is significant and highlights that floodwaters remained in villages and fields for a considerable period, so that farmers will have to undertake extensive land development before cultivation. To resume agriculture, the overwhelming majority of affected households were expecting Government support, which is not surprising given the affected population s socioeconomic conditions. Borrowing from informal sources such as moneylenders, local traders and larger farmers also was used to meet working capital and other immediate consumption needs and to resume livelihoods. Table 5.7: The Future of Agriculture - Can It Be Resumed Immediately? Social Group Can Resume Can t Resume Can t Say No. of HHs With Land SC ST OBC I OBC II Others Muslims All Migration as a Coping Mechanism Migration was widespread in the region, even before the floods. The survey found that more than 30,000 persons from the 40 villages used to migrate seasonally pre-flood, to other states in India. Most work at the destination is casual agricultural labour, construction labour, rickshaw pulling or hawking. The 2008 Kosi floods had a substantive impact on migration, both out-migration and return. In nearly two-thirds of villages (27 out of 40), villagers reported that they found hardly any work within or near the village post-flood (Table 5.8), and outmigration increased in three-fourths of villages. Interestingly, the flow of female migrants was either the same (in 23 villages) or less than before the floods (in four villages). This may be either because females are more involved in resettling their households while males go out in search of jobs, or because the massive damage to roads has reduced their mobility for outside work. Photo UNDP India At the same time, return migration has been substantial, with a large percentage of out-migrants from most villages returning to enquire about their families and loss of assets and property. 47
59 Table 5.8: Reported Migration in Affected Villages Items No. of Villages Possibility of Finding Work Outside the Village Post-Flood Yes 13 No 27 Flow of Male Out-Migrants Post-Flood More than before the flood 31 Less than before the flood 7 Same 2 Flow of Female Out-Migrants Post-Flood More than before the flood 13 Less than before the flood 4 Same 23 Villagers Staying Outside Return to Villages Post-Flood Yes 34 No 6 Average Number of People Returning to Village 370 Although out-migration as a whole increased, it did so moderately at the household level. With the increase in migration, most households reported short-term migration and destinations outside Bihar, at least for males (Tables 5.9 and 5.10). Table 5.9: Flow of Migration Before and After Floods, by Social Groups Social Group Total no. of HHs % HHs Migrating Before Flood Of the total HH migrating before flood % Migrating Post- Flood % Not Migrating Post- Flood Of the total HH Total Migrant HH (Migrating and New Additions) SC ST OBC I OBC II Others Muslims All Migrant HHs to Total HHs (Migrating and New Additions) Table 5.10: Percentage Distribution of Household Migration, by Nature and Destination Social Male Migration by Nature (%) Male Migration by Destination (%) Total No. No. of HHs Group Other Districts of HHs Migrating Short-Term Long- Term Outside Bihar of Bihar SC ST OBC I OBC II Others Muslims All
60 5.4 Conclusions Most households expressed their reliance on Government relief measures as an important coping mechanism to meet short-term needs for food and shelter. Dependence on Government of wage labourers in particular is even higher than for other groups. By contrast, very few households reported reliance on their own savings or reserves, underscoring that households resource base is very low and losses are difficult to recoup with only their own assets. A key coping mechanism was provided by migration, already a tradition in the region. More households that lost livelihoods appear to have moved to other places, particularly outside Bihar, in search of work. This increased incidence, although not significantly higher than the pre-flood scenario, is nonetheless important to count as a strategy for survival. Thus, creating livelihoods within villages or in surrounding areas before the next disaster assumes greater importance, since households need to rebuild their lives around where they live. An important suggestion emerging from affected communities, irrespective of gender or social group, involves expanded support from Government and NGOs for livelihood activities, given that most affected people would like to work and enhance their earnings. Other suggestions focused on Government providing additional basic services health, education, and water and sanitation facilities in rural areas so that healthy living is more feasible. 49
61
62 Chapter 6 Recovery Strategies
63 Chapter 6 RECOVERY STRATEGIES Recovery strategies are medium to long-term in nature and should focus on restoring secure life and livelihoods. This chapter focuses on villagers preferred assistance for recovery as well as their willingness to relocate. Key discussions regarding proposed recovery strategies identified by different groups through FGDs are given in the final section. 6.1 Willingness to Relocate Relocating to new areas following the floods, although preferred by relatively few affected people, represents an important recovery strategy, because many households in severely affected villages have limited hopes for new livelihood generating opportunities. In such situations, one option may be to relocate (Table 6.1). Reasons for relocation include concerns about safety of existing locations, possibility of frequent flooding in the future, and loss of arable land. Table 6.1: Percentage Distribution of Households, by Willingness to Relocate Social Group Total No. of HHs % Like to Relocate Village Rendered Unsafe for Continued Habitation % HHs by Reasons for Relocation Frequent Flooding SC ST OBC I OBC II Others Muslims All Loss of Land 6.2 Preferred Assistance for Recovery Another household recovery strategy focuses on receiving assistance for livelihood restoration. SC and ST households prefer long-term provision of foodgrains and support to agricultural inputs (Table 6.2a). For these households, compensation for crop loss and access to credit at low interest rates are their third priority, and starting NREGS works on a large scale also garners significant support. 52
64 Table 6.2a: Priorities of SC and ST Households Among Types of Assistance (Up to First Three Priorities) Type of Assistance First Preference Second Preference Third Preference Agricultural Input Support Provision of Foodgrains Assistance for Crop Losses Starting NREGS Works on Large Scale Small Grants for Business Recovery Access to Cheap Credit Skills Training Debt Relief Others Total For households other than SC and ST, the situation is similar yet a bit different. Such households also prefer assistance to agricultural inputs, provision of foodgrains and assistance for crop losses, but provision of credit at low interest rates is not as highly preferred albeit still noteworthy. Table 6.2b: Priorities of All Households Other than SC and ST Among Types of Assistance (Up to First Three Priorities) Type of Assistance First Preference Second Preference Third Preference Assistance for Agricultural Inputs Provision of Foodgrains Assistance for Crop Losses Starting NREGS Works on Large Scale Small Grants for Business Recovery Access to Cheap Credit Skills Learning Debt Relief Others No Response Total Recovery Strategies: Key Points from FGDs In FGDs, agricultural labourers, small and marginal farmers, medium and large farmers, artisans and women have expressed views on several long-term recovery strategies. Important strategies supported include creation of employment for women, expanded education, skills development, land development and reclamation, improving rural infrastructure (roads, irrigation), and credit support. These views provide valuable insights in formulating long-term strategies for recovery. 53

65 6.3.1 Restoration and Building of Infrastructure Among FGDs with all groups, restoring and building rural infrastructure emerged as an important priority. Major suggestions included the following: Construct/repair of irrigation systems Construct embankments to protect villages from future floods Repair and construct roads and bridges to connect villages to other places as well as different hamlets inside villages. Restore electricity connections and electrify villages without such facilities pre-flood Photo UNDP India Restoration and Enhancement of Livelihoods Perhaps the most important challenge arising from the 2008 Kosi floods is to restoration and enhancement of livelihoods of the affected people and this emerged as the major concern of all groups. Suggested strategies for livelihood restoration and enhancement include: Cultivators Provide subsidy and moratorium on debt payment Take effective steps to improve land, including removal of sand from cultivable lands, though NREGS and other measures Construct/repair irrigation systems Supply fertilizers, pesticides at subsidized rates Distribute free diesel pump-sets to all farmers Compensate for lost crops, shelter and assets Encourage activities like plantation and fisheries Provide crop insurance Waive loans for flood-affected farmers Labour and Artisan Households Reconstruct destroyed and damaged houses Subsidize loans for establishing small enterprises or shops Encourage activities such as piggery, animal husbandry and poultry Provide Government life insurance f or the poor and landless, and for people with disabilities Encourage jute-based industries, agarbatti making and carpet making at the village level to supplement households income Widely and effectively implement the NREGS Some affected people also demonstrated commendable initiative in starting new livelihoods, as illustrated in Box 6.1. Box 6.1: Initiative for Reviving Livelihoods Naresh Kumar Jha of Bhattabari village, a Brahmin, is now back from the relief camp. The floodwaters have receded, but they swept away his shelter. All the crops on his lands were damaged. All his farm lands are now water-logged, some of them being prey to erosion by the Sursari River, which has widened its course after the floods. But despite being homeless, Naresh did not give up. With nominal capital, Naresh started a tea stall. Now he has in a new identity the owner of a small business. 54
66 6.3.3 Shelter Among the FGD groups, agricultural labourers were most concerned about precautions to be taken against future floods, since their shelters were more prone to disaster. As part of long-term recovery strategies, they suggested proper maintenance of dams to avert such events and recommended that villagers be given advance flood warnings via radio or television. During FGDs, all occupational groups except medium and large farmers said they expected Government support for rebuilding their houses, through IAY. Agricultural labourers showed an inclination to construct pukka houses with such support, and many sought land from the Government on which to build houses. Non-agricultural labourers said they were willing to construct their new houses on elevated land to protect against inundation in the future. Both agricultural and non-agricultural labourers suggested that bank loans at very low interest rates for reconstruction would be beneficial, while medium and large farmer groups showed a willingness to receive low-interest, mid or long-term Government loans to rebuild their houses. Unlike the labourer households, farmer groups demanded compensation for damage to their houses. Three population groups marginal and small farmers, non-agricultural labourers and women expressed their interest in improving household facilities like electricity and latrines, if Government or private support was provided Access to Food To meet food requirements after the floods, FGD participants emphasized the need for Government assistance through food or cash support. Agricultural labourers in particular stated that the Government should provide food relief every month at least for one year, whereas marginal and small farmers felt that such relief was appropriate for six to eight months, either from the Government or from other organizations. For their part, medium and large farmers suggested that the Government provide food relief of at least 50kg wheat and 50kg rice, per household per month, for five to six months, as well as food at a subsidized price through the PDS for six to eight months. They emphasized that food relief should be extended until agricultural production is assured. They also expected cash assistance from the Government for such production. Both non-agricultural labourers and women s groups wanted the Government to continue relief (Rs. 2,250) and foodgrains to the household) for an indefinite period of time. At the same time, women s groups thought that the Government should offer differential relief support according to family size. They also sought long-term food support from the Government, especially for small children. All groups, except medium and large farmers, stated that the massive floods had left them jobless and urged the Government to create employment opportunities that could help them meet their food requirements. In particular, poor women expressed the willingness and need to become involved in different activities under NREGS, so that they can earn and purchase food. Similarly, both agricultural and non-agricultural labourers highlighted effective implementation of NREGS, as necessary to improve their access to food. 55
67 6.3.5 Access to Water and Sanitation All FGD groups mentioned that water purification tablets should be used to make polluted water safe for drinking. Notably, women s groups also knew the name of the chlorine tablets and bleaching powder used for this purpose. Medium and large farmers suggested that water purifying tablets be distributed to all flood affected households, while non-agricultural labourers suggested the use of plastic buckets with covers for maintaining water quality. Agricultural labourers suggestions focused on cleaning of local rivers, ponds and well, and on repair of non-functional tubewells. Installing an adequate number of new tubewells also marks an important step in recovery, according to the FGD groups. Likewise, adequate depth for new tubewells was considered critical for access to fresh water. According to medium and large farmer groups, depth of the boring hole should be at least 45 or 50 feet, instead of the current 25 feet. In particular, women s groups sought the construction of more water points in villages, so that they can fetch water without travelling a great distance; they also expressed the need for tap water at the household level. Women s groups were also knowledgeable on hygiene-related issues, and they suggested constructing pukka latrines at the household level Access to Health Access to health care was considered critical by all groups, and they suggested increased health care facilities in villages. Agricultural labourers, in particular, suggested that free medical care be offered. Distribution of free medicine was supported not only by this group, but also by medium and larger farmers and women; in contrast, non-agricultural labourers suggested the availability of good-quality medicine at, reasonable prices. The unavailability in villages of Primary Health Care Units and of doctors concerned several groups, and the suggestion was that doctors be made available at least once a week. Women s groups highlighted numerous areas such as antenatal and post-natal care, child care, women s health, hygiene education and support, health facilities required and special programmes for girls and women. Proposals included: Antenatal and Postnatal Care Provide facilities for institutional deliveries Organize facilities for vaccination for newborns and pregnant women Child Care Distribute nutritious food to children Provide arrangements for children s health checkups Women s Health Distribute important medicines to women Appoint doctors to look into women-specific diseases Distribute vitamin tablets amongst villagers, particularly to women Arrange a camp to treat infectious diseases Increase awareness among women about treatment for infectious diseases 56
68 Hygiene Provide training on personal hygiene Provide required materials (such as sanitary pads) for maintaining cleanliness, particularly during menstruation Health Facilities Deploy sub-centre or mobile medical teams in most affected villages Make weekly visits by medical teams compulsory Special Programmes Initiate health programmes with special emphasis on girls and women Access to Education Access to education was strongly linked to infrastructure, with all groups except non-agricultural labourers, pointing out that connecting each school with a pukka road from the village might improve educational levels by encouraging continued enrollment. Both agricultural labourers and women s groups, suggested effective provision of midday meals to schoolchildren; the latter groups also suggested reconstructing or renovating school buildings damaged in the floods and the re-distribution of educational materials, since many children had lost these in the floods. Among some groups, there still appeared to be little appreciation for education. For example, landless and agricultural labourers of Kusha village in Supaul District, expressed their reluctance by stating that education was not useful unless a job was guaranteed after completion of studies. Establishing Government high schools in or near villages was found to be a priority for all groups. Women s and farmer s groups also suggested increasing the number of Anganwadi centres; going further, women s groups urged the use of these centres for basic information dissemination and proposed implementing special back-to-school programmes. Like women s groups, medium and large farmer groups seemed concerned about girls and women s education, and suggested increasing/improving educational facilities Recovery Strategies for Children and Elderly Male and female respondents in FGDs also focused on health and education in suggesting recovery strategies for flood-affected children. Both sexes emphasized organizing special psycho-social counselling initiatives for these children, to help them deal with the trauma. They also suggested children s immunization programmes. Female respondents added two more important strategies: distributing milk and other basic nutrients, and conducting regular health checkups for all children. Regarding education, both men and women expected school management to schedule extra classes to cover children s education losses during and after the floods. They recommended free distribution of school uniforms, books and stationery to enable a smooth re-starting of schooling. Turning to the elderly, options for recovery strategies focused mainly on health, finances and other support. Free health facilities for the elderly, irrespective of socio economic status or religion, were suggested, by both men and women FGD participants. Male respondents hold that moral support to sick and disabled elders should be given through special initiatives. A financial safety net was viewed as essential after a certain age, since income virtually ceases. Providing pensions to all aged persons also was suggested, regardless of social group or poverty status. 57
69 Free Government bus/train passes for the elderly were also recommended. Other economic support suggested by male respondents included free ration facilities, through the PDS, while female respondents suggested that clothes and other necessary items be provided, more cheaply in a support package. Lastly, focus was given to the vulnerability of the elderly, arising from the lack of a place to stay. Both male and female respondents suggested that the Government provide housing support not only to the elderly but also to people with disabilities. In addition, women said arrangements should be made for social welfare units for the elderly, at the panchayat level, and for pensions for entertainment of the elderly. 6.4 Conclusions Strategies for medium to long-term recovery were of prime concern to affected people. Across social and occupational groups, households strongly expressed the priority need for enhancement of their livelihoods, with Government support, particularly through creating employment and restoring agricultural activities. Social infrastructure such as health and education also figured in long-term recovery but were lower-priority areas, while cheaper credit, debt relief and rebuilding of physical infrastructure were widely perceived as extremely important livelihood strategies. Given the extensive damage to houses, Government support to repair and rebuilding was emphasized by all, particularly by poor households. Women in particular, expressed the need to improve both health and livelihood activities, and suggested the need for antenatal and post-natal care, hygiene and child-related support. They also expressed need for implementing of NREGS. 58
70 Chapter 7 Conclusions and Policy Implications

71 Chapter 7 CONCLUSIONS AND POLICY IMPLICATIONS The Kosi floods have caused unprecedented loss to lives, livelihoods, infrastructure and property in north eastern Bihar. This study brings to light the nature and extent of suffering of the people, as well as the effectiveness of public action in mitigating the impact. Critically, it suggests strategies for short and long-term planning for recovery of livelihoods and avoiding such disasters and specifically addresses people-centred aspects of the floods and devastation. The study reveals that most affected households had not experienced any floods for at least 50 Photo UNDP India years; this experience was, therefore, especially devastating and traumatic. Neither the State, nor the households were prepared to respond quickly to the deluge. As a result, a large number of affected households did not wait for Government or private assistance in evacuating to safer places, using their own means to move out of flooded villages, as soon as possible. 7.1 Experiences and Impact of the Floods Experiences of the Floods The Kosi flood was a new experience for nearly three in four households, even as remaining households reported that they experienced floods almost annually. In villages where floods came for the first time, no preparedness existed, including boats for evacuation or early warning systems. As noted above, most households moved to safe areas through their own efforts. On average, villages remained waterlogged for nearly two months (53 days), with some experiencing standing water in household areas for 90 days. For agricultural land, the average duration of standing water was nearly three months. Even village roads remained waterlogged for more than six weeks. In two-thirds of villages, more than 75 percent of the living area was affected, while in about 70 percent of villages, more than 75 percent of agricultural land was affected, indicating the massive power of the floods. One-third of households shifted to nearby Government camps and about one-quarter made their own arrangements by moving to other places. Government assistance appeared to be geared toward the most vulnerable, targeting groups such as female headed households of Muslims and OBC I families. Across all communities, an overwhelming majority of households reported receiving health assistance during the floods. The Government s direct relief to flood victims was well targeted, with the vast majority of households receiving Government assistance (100 kgs rice and Rs. 2,250 per household). Female headed households 60
72 received food and medicines in proportionately larger numbers. Overall, reported leakages in the supply of relief items were low, and no major complaints of discrimination in the distribution of relief were reported. Families stayed in Government camps for between six weeks to two months. Although they faced difficulties in the camps, including overcrowding, lack of proper bathing arrangements and the location of drinking water points being near toilets, satisfaction was generally reported on functioning and management of relief camps. In some camps, meanwhile, communities developed self-defence mechanisms to ensure safety and security. Impact of the Floods on Livelihoods The Kosi floods caused extensive damage at both village and household levels. At the village level, losses were reported in terms of roads, embankments, bridges, culverts, public infrastructure, and irrigation and electricity systems. Because roads were severely damaged or destroyed, this became a hindrance to efficient relief work and provision of basic necessities. Electricity and telecommunications were very badly affected, and about three-fourths of tubewells, a major source of irrigation, were severely damaged. At the household level, losses were in lives, livestock, agricultural operations and employment opportunities. The floods destroyed or damaged the overwhelming majority of people s homes, reduced their access to safe water, and destroyed or damaged toilet facilities. About 40 percent of houses were completely/severely damaged and another 40 percent partially damaged. Vulnerable groups such as Muslims, OBC I and Scheduled Castes reported more damage to their houses than others. Almost half of functioning public handpumps and one-third of private handpumps were affected, resulting in difficulty in obtaining safe drinking water. Damage to Kharif-season crops, including Aghani paddy (the major crop), maize, jute and other vegetables, was extensive, and massive livestock losses occurred, particularly among the OBC II community, SCs and Muslims. Nearly every household lost agricultural implements, affecting their livelihoods, and an average of nearly three months of work has been lost. Shortage/unavailability of food and firewood became common problems, as three-fourths of households lost stored foodgrains and half lost domestic goods. Maximum income losses by social group were found in SC communities, ranging from 50 to 99 percent of incomes. At the same time, two-thirds of FHHs lost more than 50 percent of income; FHHs from SC/ST families experienced the highest losses. Among occupational groups, daily wage labourers were the most severely affected, with both employment and monthly earnings falling sharply after the flood by up to 30 percent. In estimating the losses to the region (1,000 villages) from the floods, the investigators found estimated losses to be far higher than official statistics. These are summarized in Table
73 Table 7.1: Projected Losses in Kosi Region Table 7.1: Estimated Losses for the Whole Region due to Kosi Floods Rs crore Value of loss of houses 880 Value of food grain loss 400 Value of livestock lost 390 Value of domestic items lost 155 Value of loss of agricultural implements 75 Value of other losses (trees, crops etc.) 60 Total Coping Mechanisms and Recovery Strategies Households adopted several short-term coping mechanisms, including selling assets, withdrawing children from school and engaging them in work (if any), reducing household food (such as having one meal a day or not serving some family members), and using stored foodgrains to cope with the food scarce situation. For shelter, temporary arrangements were made by the Government, while some households stayed in public facilities such as the panchayat office or in other villagers houses. Most households had no option but to drink contaminated water or to take less water per day. Defecation occurred either in open places or in others toilets, if available. Significant coping strategies for livelihoods included migrating, taking credit at very high interest rates and leasing land. Villagers themselves identified some preferred coping mechanisms that are dependent on external support, including food and cash relief for food, using chlorine tablets and purifying drinking water, attending existing medical facilities, and obtaining relief for restoring livelihoods. All groups particularly wage labourers expressed reliance on Government relief measures as an important coping mechanism to meet short-term needs for food and shelter. Borrowing and migration represented other key coping mechanisms, with migration outside Bihar becoming even more deeply embedded in the social fabric of the region than it was before the floods. Critically, in wide-ranging FGDs villagers also offered numerous insights into suggested medium and long-term strategies for recovery, including: Shelter: Properly maintaining dams to avert such a disaster; ensuring Government support for rebuilding houses through IAY; constructing pukka houses, also with due support; donating land to the landless for constructing houses; providing loans at cheap interest rates; and providing compensation for damage to houses. Food: Continuing Government assistance (food or cash); creating employment, so that there is income to buy food; and providing food at a subsidized price through a public distribution system. Water and Sanitation: Cleaning local rivers, ponds and wells; repairing non-functional tubewells; installing an adequate number of new tubewells, and with due depth; constructing more water points in villages; performing regular water quality testing; and constructing pukka latrines. Health: Ensuring expanded healthcare facilities in villages; making good quality medicines available at reasonable prices; making doctors available at least once a week in villages; providing support for antenatal and post-natal care for pregnant women; and providing additional support for childcare and women s health. 62
74 Education: Connecting each school with a pukka road; introducing effective provision of midday meals to schoolchildren; reconstructing or renovating destroyed or damaged schools; establishing Government high schools in or near villages; increasing the number of Anganwadi centres; and implementing special back to school and other programmes. Restoring/Building Infrastructure: Constructing/repairing roads, bridges, irrigation systems and embankments; restoring electricity connections; and electrifying villages not yet connected to the electricity grid. Cultivators: Providing subsidy and moratorium on debt payments; taking effective steps for land improvement, including removal of sand from cultivable lands, though NREGS; constructing/repairing irrigation systems; supplying fertilizers and pesticides at subsidized rates; distributing free diesel-pump sets; compensating for lost crops, shelter and assets; encouraging activities such as plantations and fisheries; providing crop insurance; and waiving loans for flood-affected farmers. Labour and Artisan Households: Reconstructing destroyed/damaged houses; providing subsidized loans for establishing small enterprises or shops; encouraging activities such as piggery, animal husbandry and poultry raising; providing Government life insurance for the poor, landless and people with disabilities; expanding income generating activities at the village level, including agarbatti making, basket making and carpet making; and effectively and extensively implementing NREGS. Women: Implementing NREGS on a large scale; providing debt relief and credit at low interest rates; providing training for microenterprises; and forming Self-Help Groups. Children: Organizing special psycho-social counselling initiatives for flood-affected children to help them recover from the trauma; expanding immunization programmes; distributing milk and other basic nutrients; ensuring regular health checkups; scheduling extra classes to cover education losses; and distributing books, stationery and other educational assets to replace materials damaged in the floods. Elderly: Providing free health facilities for the elderly, irrespective of socioeconomic status or religion; providing moral support to sick and disabled elders; providing financial safety nets, pensions and free rations through the PDS; and providing housing support for all aged people. 7.3 Policies 8 for Recovery and Livelihood Enhancement Although the prevailing situation is one of great inequality, all groups seem to have been reached fairly by relief operations. In fact, a disaster such as these floods can be an opportunity to ensure that the benefits of future development are more evenly shared, because it is possible to apply new criteria and build new programmes. It will be important to ensure that all new development programmes respect criteria of inclusion and equality, with respect to both gender and socio-religious groups. Considering this, policy recommendations are grouped under three broad categories: short-term recovery measures, longer-term development of livelihoods and welfare, and the over arching question of water control and management. Short-Term Recovery Measures Short-term relief after the floods worked reasonably well but needs to be maintained for up to a year, because it takes time for people to recover and for damaged infrastructure and housing to be repaired. Elements needed here are: 8 Policy recommendations provided by IHD 63
75 Public-sector creation of employment, especially locally. NREGS, may be in an expanded form will be a major policy instrument that should be used intensively, since it contributes to reconstruction. A special IAY may be introduced in the affected villages under which all the damaged houses are covered. All the BPL households may be provided legal entitlement to homeshead lead, in case they do not have such entitlements. Universal old age pension for BPL and female headed households may be introduced in all the affected villages. Repair to damaged infrastructure (also contributing to employment creation). Offering of cheap credit to support replacement of tools and livestock. Financing of restoration of damaged land, as well as seeds and inputs for the next crop. Continued grain distribution and relief payments, increasingly focused on households that have lost family members; include vitamin tablets. Management of the flow of migrants to ensure there is no exploitation. Stimulation of public health and education systems to resume normal functions, with particular attention to antenatal and post-natal care, and more local facilities. Immunization and provision of nutritious food to children; distribution of sanitary pads to women. Special Mid-Day Meals should be started for all children, regardless of whether they are going to school. An extended NREGA may be introduced in the affected villages with waiving of restrictions on number of working days and number of persons for family as well as introducing wages for working on rebuilding their own houses, and de-silting or reclaiming their own fields. Stationing of adequate medical personnel in Primary Health Centres in flood-affected areas. Restoration of safe drinking water through deeper and more tubewells, cleaning of local rivers, distribution of water purification tablets, provision of buckets and tanks, and regular testing. Strengthening of Government systems to ensure that relief funds continue to be used efficiently and with minimal corruption. Redistribution of materials needed for school, including books, uniforms and stationery, that were lost during the floods. Extended counselling services to children to help them deal with the psycho-social impact of the floods. Longer-Term Development of Livelihoods and Welfare Expanded investments in health and education. Development of new high-value crops. Restoration and development of irrigation systems, including free distribution of diesel pump sets to cultivators. Offering of crop insurance. Debt moratoriums, where appropriate, and/or subsidized loans. Investment in training and extension services. Opportunities for non-agricultural activities, particularly micro-enterprises in services and agricultural processing. Programmes of repair/reconstruction to support longer-term development (for example, telecommunications and electricity services can be upgraded in the reconstruction process). Imparting of skills training for livelihoods regeneration to women through formation of SHGs. Effective and efficient maintenance of dams. Delivery of flood warnings in advance. 64
76 Water Control and Management Massive investment in a State strategy for water control and harvesting. Expanded research into how to limit the adverse effects of smaller-scale, frequent flooding. Consider location of housing (building up of higher ground), investment in pukka houses that can withstand floods better, and the channeling of rivers. Development of new economic activities and new crops that can take advantage of abundant water (aquaculture, paper production,). Given the perceptions of the people, the State needs to rethink its strategies to protect the people permanently from the scourge of floods, through scientific management of river water and effective protection of embankments from erosion. Public goods such as health, sanitation and education services may be taken up on a wide scale by the Government. Apart from repairing damaged schools, the State should install a sufficient number of hand pumps and construct community toilets in the affected villages. Health care specific to women and children should be given due priority. The building of infrastructure, particularly roads and power and irrigation systems, needs to form an important agenda. Effective strategies should be formulated in partnership with donors and private sector. Considering the scale of the devastation, restoration and enhancement of livelihoods in affected villages will need to be largely carried out by only the Government. Building on the recommendations above, specific important measures required include: Lump-sum grants and technical support for rebuilding and repair of houses. Removal of sand from fields, land improvement, support for agricultural credit at subsidized rates, and provision of cheap credit are necessary for revitalization of agricultural activity. An important step in this direction should be the free provision of one diesel pump set to each cultivator household. Moratoriums on the payment of loans and some debt relief measures also can be considered, as appropriate. Subsidized loans for establishing small enterprises or shops should be provided to nonagricultural and artisan households. It also is important to provide technical support and skills training for such activities. Support to activities such as plantations, fisheries, piggeries, animal husbandry and poultry for various groups of people, as per their aptitude and expertise, should be pursued by the Government. Employment generation through public investment is of utmost importance. Comprehensive and effective implementation of NREGS for all those seeking work is accordingly the most important need of the waged workers. NREGS can be an important instrument in land improvement and development, provision of public goods, building of infrastructure and even construction and repair of houses. Provision of food items by the Government until people s livelihoods are restored. Appropriate and adequate training and extension services may be provided for scientific agriculture, horticulture and aquaculture. With sustained commitment and effort, such recommended policy measures can ensure that those affected by the devastating 2008 Kosi floods do not face a disaster of this magnitude again, and that their overall human development is supported for years to come. 65
77
78 Note on Projected Loss in Kosi Region
79 Note on Projected Losses in Kosi Region The total loss of items such as food grains, livestock, domestic goods, other goods and houses have been estimated from the household data collected from 20 villages. The total number of household suffering a particular loss has been first estimated by multiplying the ratio of such households in the samples by the total number of affected households (839,335)officially acknowledged ( nic.in/downloads/flood-impact-report-1.pdf). Having thus estimated the total number of households suffering a particular loss, the total loss has been obtained by multiplying average loss suffered by each household in the sample, by the number of such estimated households. Detailed methods of calculation for each variable follows: 1. The percentage of affected households or families in the villages surveyed has been used to estimate the total number of affected villages as follows Estimated number of affected households=% of affected households in sample/100* Valuewise loss of all other items such as houses, food grains, livestocks etc=average amount of loss per household in the sample*estimated number of affected households. In case of houses, value lost has been taken to be equal to the cost of repair as projected by the respondents. Projection of Value of Loss of Various Types for the Flood Affected Kosi Region (Rs) Items Total households affected in the region % of Households lost Projected number of households who loss Average amount loss per households Total loss in the region (in crore) Rounded value of total loss (in crore) Livestock Houses Food grains Domestic goods Other goods Agricultural implements Notes : Column 2 : Government website: ( Column 3 : taken from household schedule (except houses which are taken from village schedule) Column 5 : Taken from household schedule 68
80 Annexure I Names of Village Surveyed 31
81 ANNEXURE I Names of Village Surveyed, with Survey Instrument District Block Madhepura Shankerpur Murliganj Gram Panchayat Village Village Schedule Survey Instrument Household Schedule* Jirba Madheli Jirba Rampur Lahi Garha Rampur Sonbarsa Balwa Parsa Parsa Raghunath Pur Raghunath Pur Rajni Rajni Jargawan Jargawan Rampur Rampur Gwalpara Sahapur Sindhuyari Biswari Rajpur sarsandi Pir Nagar Shyam Gwalpara Nohar Supaul Pratapganj Tekuna Tekuna Bhawanipur South Islampur Sukhanagar Sukhanagar Suryapur Suryapur Chhatapur Chunni Chunnimal Gheewha Gheewha Daharia Daharia Jhakhargarh Bhattabari Triveniganj Latauna (South) Shivnagar Daparkha Hemantnagar Kusaha Musa Kusaha Mirjawa Mirjawa Araria Narpatganj Raj Bela Bela Pathraha Patharha Manikpur Manikpur Babuaan Dumarbanna Raniganj Vistoria Domariya Domariya Bagulaha Barhara FGD 70
82 Purnia Banmankhi Kharsahi Jagta Kalabalua Kalabalua Chandpur Bhangha Sahuria Subhai Millick Chandpur Bhangha Sahuria Sabhai Millick Naulakhi Naulakhi Bahora Bahora Saharsa Saur Bazar Suhat Bhabtia Kamp East Gauravgarh Karahia Kachra Kamp West Kamp Gonth Note : From each village, 40 households selected for detailed interview 71
83
84 Annexure II List of Field Supervisors and Investigators
85 Annexure II List of Field Supervisors and Investigators Field Supervisors and Research Associates Ramashray Singh Ashwani Kumar S. D. Choudhary Vijay Prasad Field Investigators and Research Associates Mukesh Kumar Murlidhar Choudhary Anupam Kumari Niranjan Kumar Satish Kumar Prabhat Kumar Gautam Neeraj Roy Prakash Kumar Vinita Kumari Ashish Kumar Thakur Pooja Niraj Kumar Dilip Kumar Gautam Kumar Anjali Prabha Samir Kumar Veebhesh Anand Vijay Narayan Singh Ram Shankar Singh Ravi Shankar Kanchan Kumari Bablu Kumar Pooja Verma Amita Kumari Someshwar Sharma Vimal Prakash Rafat Masood Pratibha Kumari Ankita Roy Neha Sinha Rajesh Kumar Praful Kumar Priyardhi Anugya Kumari Manisha Kumari Rakesh Ranjan Subodh Kumar Sarvesh Kumar 74
86 Annexure III Village Level Questionnaire
87 ANNEXURE III Village Level Questionnaire 1. State: 2. District: 3. Block: 4. Gram Panchayat: 5. Village: 6. Respondent s Name: 6. Investigator s Name: 7. Investigator s Signature: 8. Date: INSTITUTE FOR HUMAN DEVELOPMENT NIDM Building, 3rd Floor, IIPA Campus I.P Estate, Mahatma Gandhi Marg, New Delhi Phones , / Fax: ihd@vsnl.com, website: 76
88 BASIC CHARACTERISTICS OF AFFECTED VILLAGES I. Basic Population Data a. Population of the Village Sl. No. Category 2001* At present (2008)** 1. No. of Households 2. No. of Males 3. No. of Females 4. No. of Literate Males 5. No. of Literate Females 6. No. of Scheduled Castes 7. No. of Scheduled Tribes 8. Total Population * To be constructed from census records ** From village records and documents b. Religion /Social Class Distribution of Households (Number) Sl. No. Communities Number of Households Religious Category 1. Hindus 2. Muslims 3. Other (specify) Social Groups 1. Dominant Castes 2. OBC 3. Scheduled Castes 4. Scheduled Tribes 5. Other (Specify) II. Socioeconomic Base a. Land Use Type of Land 1. Forest 2. Uncultivable 3. Non-Agricultural Uses 4. Cultivable Waste 5. Pasture/Grazing 6. Orchards, Etc. 7. Other Fallow Land 8. Current Fallow Land 9. Net Area Sown 10. Area Sown More Than Once Source: Village Records from the Block Office Area in Hectares 77
89 b. Crop-Related 1. What are the main crops grown in the village and damaged due to the floods? a. For Rabi Season (2008 Before the Floods) Sl. No. Main Crops Area (Ha) Yield in Normal Period (Quintal/Acre) 1. Wheat 2. Pulse 3. Mustard 4. Beans 5. Vegetables b. For Kharif season (2008) Sl. No. Main Crops Area (in Approx. Acres) Yield in Normal Period (Quintal/Acre) Whether Damaged (Yes 1, No 2) Extent of Damage* 1. Garma Paddy 2. Aghani Paddy 3. Maize * Completely Damaged 1, Moderately Damaged 2, Not Damaged Is there any prospect of Rabi crops (2009)? No possibility 1, Possible to Sow but Produce Low 2, Normal 3, Better than Usual How can agriculture be revived in the village? i) ii) iii) 78
90 c. Employment in Agricultural and Non-Agricultural Activities 1. Main Agricultural Activities Type of Activity Number of HHs Engaged 1. Owner-Cultivator 2. Sharecropper 3. Agricultural Labour (tied) 4. Agricultural Labour (casual) 5. Fisherman Main Non-Agricultural Activities Type of Activity Number of HHs Engaged 1. Small Shop 2. Construction 3. Tailor 4. Barber 5. Teacher
91 3. Prevailing Wages (During Normal Season) Activities Agricultural Activities Harvesting Construction Other Non-Agricultural Unskilled Activities Male Wages (INR) Female d. Commuting and Migration 1. How many villagers regularly migrate seasonally for work? Type of Work Where* Male Number Female * Within District-1; Other District-2; Out of State-3; Other How many villagers have regular wage work outside the village, where they go on a daily or weekly basis? Male - Female - 80
92 B. Infrastructure a. Roads 1. What types of roads are there in the nearest market towns? Pukka 1, Semi-Pukka 2, Katcha 3 2. What is the extent of damage of the roads due to the floods? Some Damage-1; Damaged but Easily Repairable 2; Seriously Damaged/Washed Away 3 3. How far is the nearest market town from the village? 4. If roads are damaged, how are you reaching the nearest market town? Not Going to the Town 1, By Boat 2, On Foot 3, Other 4 5. What are your suggestions to revive the situation? b. Telecommunications Type Whether in the Village Yes 1, No - 2 Extent of Damage* Telecommunications: Land Line Telecommunications: Access to Mobile Line *Badly Damaged 1, Partially Damaged 2, Not Damaged-3 c. Electricity 1. Did you have electricity in the village before the flood? (Yes 1, No 2) 2. Do you have electricity in the village after the flood? (Yes 1, No 2) 3. How many houses are connected with electricity? Before the Flood (Number of HHs) After the Flood (Number of HHs) 81
93 C. Facilities a. Health Type of Health Facilities Within the Village Yes 1, No - 2 Distance (km) If Not in the Village Type of Approach Road* Extent of Damage** 1. Primary Health Sub-Centre 2. Primary Health Centre 3. Hospital/ Dispensary 4. Chemist/ Medicine Shop *Type of Approach Road: Pukka 1, Semi-Pukka 2, Katcha 3 ** Completely Damaged 1, Partially Damaged 2, Not Damaged-3 b. Education Type of Education Facilities 1. Primary School 2. Middle School 3. High School 4. Anganbadi Within the Village Yes 1, No - 2 Distance (km) If Not in the Village 5. Other (specify) *Type of Approach Road: Pukka 1, Semi-Pukka 2, Katcha 3 ** Completely Damaged 1, Partially Damaged 2, Not Damaged-3 Type of Approach Road* Extent of Damage** 1. Have there been any interim arrangements for education in the village after the floods? Yes 1, No How would you like the interim school arrangements to continue? i) ii) iii) c. Irrigation 1. What are the irrigation systems available in the village? Canal 1, Tubewell 2, Electric Pump Set 3, Diesel Pump Set 4, Boring 5, Other (specify) - 6 Types of Irrigation Facilities Area Irrigated (in Hectares) Extent of Damage* *Completely Damaged 1, Partially Damaged 2, Not Damaged 3 82
94 d. Water and Sanitation I. Drinking Water Type 1. Public Well 2. Private Well 3. Public Hand Pump 4. Private Hand Pump 5. Public Tubewell 6. Private Tubewell 7. Public Stand Post 8. Tap Water Inside House 9. Tank/River 10. Other (specify) Total No. Before Floods Functioning (Number) After Floods 1. Has drinking water been contaminated by the floods? Yes 1, No What needs to be done to improve the supply of clean water to the villagers as part of the recovery programme? i) ii) iii) II. Toilet Facilities 1. How many households are using any type of latrines? 2. What is the extent of damage to these latrines due to floods (in percentage terms)? D. Extent of Flooding 1. How frequently do the villages face flooding? Annually 1, Biannually 2, Once in 5 Years 3, Once in 10 Years 4, No memory 5, Others 6 2. Did the villagers get any early warning before the floods? Yes 1, No 2 3. I f yes, when did the villagers come to know about the floods? 6 Hours Before 1, 12 Hours Before 2, 24 Hours Before 3, 48 Hours Before 4, More Than 48 Hours Before 5, A Week Before 6, Other (specify) 7 4. Did they get any Government assistance with evacuation? Yes 1, No 2 5. How much of living areas are affected by floods (in percentage terms)? 83
95 6. What is the extent of agricultural land flooded (in percentage terms)? 7. What was the duration of the floods in the village? Areas Whether Flooded Yes 1, No - 2 Duration of Standing Water (Days) 1. Homestead Areas 2. Agricultural Lands 3. Nearby Pukka Roads 4. Earthen Roads E. Overall Impact of Floods I. Life and Health 1. How many people in the village died because of the floods? During the floods: After the floods: 2. What were the reasons for deaths? Reasons Drowned or Missing Fever Due to Water-Borne Diseases (diarrhoea, jaundice, gastric) Lack of Emergency Facilities for Pregnant Women Miscellaneous Unknown Diseases Total Male Number of Dead Female 3. Has there been any outbreak of disease since the floods? Yes 1, No 2 4. What were common diseases that villagers suffered from since the floods? Number of People Suffered From Common Diseases Male Female 1. Diarrhoea 2. Skin Diseases 3. Fever Did the villagers receive any health assistance from health centre/hospital/mobile medical teams during the floods? Yes 1, No 2 84
96 II. Habitat and Housing 1. How many houses were affected by floods? 2. What kind of damages have most houses in the village suffered (in percentage terms)? % Damaged by Floods Type of House Total number of HHs Completely Damaged Partially Damaged Not Damaged Katcha Pukka Semi-Pukka Huts/Thatched III. Land (Degradation) 1. How much of the land cultivated has been lost or damaged? Type Damaged/ Lost (in Acres) Destroyed Siltation Waterlogging Others IV. Livestock/Fisheries/Poultry 1. What is the status of non-crop resources? a. Livestock Type Livestock Buffalo Bullock Cow Goat Pigs Poultry (% lost) Before the Floods Number Lost Due to Floods b. Fisheries Type Whether Damaged Yes 1, No - 2 Extent of Damage* Fish Ponds Orchards *Completely Lost 1, Partially Lost 2, Not Lost-3 85
97 c. Access to Common Property Type Whether Accessible After Floods Yes 1, No - 2 Extent of Damage* Fishing from Rivers/Canals Collection of Fuel wood Grazing Lands * Severely Affected 1, Partially Affected 2, Not Affected-3 V. Employment Type Days Lost Due to Floods Agricultural Worker Non-Agricultural Wage worker Fishermen Badly Affected 1, Partially Affected 2, Not Affected 3 VI. Migration 1. Was it possible to find work outside the village after the floods? Yes 1, No What was the flow of male out-migrants after the floods? More Than Before the Floods 1, Less Than Before the Floods 2, Same 3 3. What was the flow of female out-migrants after the floods? More Than Before the Floods 1, Less Than Before the Floods 2, Same 3 4. Are some villagers staying outside for work (out-migrants) now returning to the village? Yes 1, No 2 5. If yes, how many? F. Relief and Other Support 1. Did villagers receive any relief for meeting their emergency needs? (Yes - 1, No - 2) If yes, continue: 2. Who received the relief? Relief Received by Responses by Men Responses by Women * Household Head 1, Spouse 2, Son/Daughter 3, Brother/Sister 4, Father/Mother 5, Father-in- Law/Mother-in-Law 6, Other (specify) - (7) 86
98 3. What sorts of relief? Types of Relief* Responses by Men Responses by Women *Food -1, Medicine-2, Clothes-3, Cash-4; Grain-5; Government Credit-6, Other (specify) Which organizations/agencies extended cooperation for providing relief? 5. How many households took shelter in the camps during the floods and returned to the village after the floods? HH Category Types of Shelter Returned to the village (#) OBC Scheduled Caste Scheduled Tribe Hindus Other Hindus Muslims Other (specify) Code for Camps: Government Camp-1; Camp Run by NGOs/Charitable Organizations-2; Other Informal Camps-3; Other (specify) 4 G. Can you tell us your Opinions about the Various Strategies for Recovery? (a) Response of Men (i) What actions are required for recovery of the village economy? (ii) What are the main needs for recovering situations for children? (iii) What are the main needs for recovering situations for women? (iv) What are the main needs for recovering situations for elderly people? (b) Response of Women (i) What actions are required for recovery of the village economy? (ii) What are the main needs for recovering situations for children? (iii) What are the main needs for recovering situations for women? (iv) What are the main needs for recovering situations for elderly people? H. Overall Assessment of the Investigators about the Impact of Floods & Recovery Strategies 87
99
100 Annexure IV Household Level Questionnaire
101 Annexure IV Household Questionnaire A. Basic Information 1. District Block... 3.Village Name of the Household Head Name of the Respondent Sex (Male-1, Female-2) 7. Religion 8. Caste Category [ Hindu 1, Muslim - 2, Other (specify) - 3 [SC - 1, ST - 2, OBC I - 3, OBC II 4,Other Caste 5,Others (specify) 6)] 9. Land Ownership Category [ Landless - 1; Less than 0.5 Acre - 2; Acre-3; 1 to 2 Acres - 4; 2 to 5 Acres 5; 5-10 Acres - 6; More than 10 Acres - 7] 10. Poverty Group: (APL 1, BPL 2, Antodaya-3, Do Not Know -4) 11. Do you/your household own any ration card? (Yes 1, No 2) 12. Do you have any voter ID? (Yes 1, No 2) Investigator s Name... Signature and Date... Supervisor s Name... Signature and Date... INSTITUTE FOR HUMAN DEVELOPMENT NIDM Building, IP Estate, Mahatma Gandhi Marg, New Delhi Phones: ; / Fax: ihd@vsnl.com / website: 90
102 B. Household Details ID No. Name Sex (Male-1, Female-2) Age (in Complete Years) Marital Status ** Educational Level *** Occupation**** Main Subsidiary ** Unmarried - 1, Married-2, Widow/Widower-3, Divorced/Separated-4, Others (specify)-5 *** Illiterate-1; Below Primary or Informal Education - 2; Primary - 3; Middle - 4; Management/ Commercial School Course (Vocational) - 5; Matric/High School/Secondary - 6; Higher Secondary/Pre- University/Intermediate - 7; Technical Diploma or Certificate Below Degree - 8; Technical/Professional Degree (Medical, Engineering, Law, Management, etc.) - 9; Graduate Degree (General) - 10; Post- Graduate Degree (General) - 11; Other (specify) 12 **** Cultivators-1 Casual Labour (CL) in Agriculture-2; CL in Construction-3; CL in Other Non-Agricultural Work-4; Long-Term Attached Labour in Agriculture-5; Long-Term Attached Labour in Non-Agriculture Work-6; Own Business Based on Agriculture and Allied Activities (animal husbandry, poultry, aquaculture, etc)-7; Fishermen/women and Related Workers-8; Own Small Business/Trade/Construction-9; Big Business /Trade/Construction-10; Personal Services (caste occupations such as carpenter, blacksmith, potter, barbers, etc.)-11, Shoemakers and Other Leather Workers-12; Tailors and Related Workers-13; Bidi and Other Tobacco Processing Workers-14; Salaried Workers - Clerical and Above-15; Salaried Workers Below Clerical Level-16; Domestic Work Only-17; Domestic Work but Also Engaged in Free Collection of Goods and Fodder/Cutting Wood -18; Unemployed (Willing to Work, but Work Not Available)-19; Carpenter-20; Mason-21; Blacksmith-22; Potter-23, Plumber-24; Electrician-25; Welder-26; Mechanic-27; Weaver-28; Craft-29; Mechanical Equipment Operator-30; Brickmaker-31; Basketmaker-32 Driver-33; Beggars etc.-34, Retired/Pensioners/Very Old-35; Disabled/Handicapped/Sick-36; Student -37; Too Young -38 Others (specify)
103 C. Experience of Impact of Current Floods I. Experience of Current Floods 1. How frequently do you get floods generally? (Annually - 1; Biannually-2; Once in 5 Years-3; Once in 10 Years-4; No Memory-5) (If code 5, skip question 2) 2. Where did you stay during the floods? Village-1; Government Camp-2; Camp Run by NGOs/Charitable Organizations-3; Other Informal Camps-4; With Relatives and Friends in Other Village/Place-5; Other Own Arrangements-6 [If the answer is 1 (i.e., village), then skip to Question 9, otherwise continue] a. If answer is code 2 or 3, then the distance from the village (km) b. If own arrangement (code 6), what type of arrangement? 3. How did you get evacuated? Govt assistance-1; With the Help of NGOs/Other Agencies-2; With Own Efforts-3, Others (specify) 4. If own efforts (code 3), what arrangements did you undertake for evacuation? On Foot-1; By Boat-2; Swimming - 3; Others If you were not in your house, was anything stolen? Yes-1; No-2 5a. If yes, value of estimated theft? (INR) 6. How many days did you live in the camp/any other arrangement? 7. How many members of your family were in the camp/any other arrangement? (a) Male (b) Female 8. Did you get any relief from the Government? (Yes-1, No-2) 8a. If Yes, please mention the type of relief assistance (in order of ranking) Food -1, Medicine-2, Clothes-3, Cash-4; Grain-5; Government Credit-6, Others (specify) Did you get any help from NGOs or other agencies? (Yes-1, No-2) 10. If yes, what kind of help? (in order of ranking) Food -1, Medicine-2, Clothes-3, Cash-4, Government Credit-5, Others (specify) Did you experience any corruption in accessing relief? (Yes-1, No-2) 12. Did you experience any discriminatory experience in accessing relief? (Yes-1, No-2) 92
104 12a. If yes, what type of discrimination did you experience? (Caste-Based-1; Religion-Based-2; Gender-Based-3) II. Separation from the Family and Health Problems 1. Did you get separated from the family? (Yes -1, No -2) 2. How long were you separated? (Number of days) 3. Are you now united with the family? (Yes-1, No-2, Partially-3) 4. Did you or your family members experience any illness/diseases since the floods? (Yes-1; No-2) 5. If yes, what types of diseases did you or your family members experience since the floods? 5a. Male 5b. Female * (Malaria-1; Dehydration/dysentery-2; Viral fever-3; Kalazar-4; Cough and Cold-5; Chicken Pox-6; Skin Diseases-7; Other (specify)-8} 6. Did you or your family members get health care assistance? (Yes-1, No-2) If yes, continue 7. Where did you get these health services? (Multiple answers) [Mobile/Emergency Medical Team-1; General Health Practitioner-2; Traditional Health Practitioner-3; Government Hospital-4; Private Clinic-5; Other (specify)-6] III. Loss of Habitat and Housing 1. What kind of house did you have before the flood? [Pukka-1, Semi-Pukka-2, Katcha-3, Thatched-4, Others (specify)--5; Don t Own Any House-6] 2. If own house, can you please tell us something about your housing condition? 2a. Water (i) What are the most important sources of drinking water at your house? [Tubewell-1; Well-2; Handpump-3; Tap Water-4; River/Pond-5; Others (specify)-6] (ii) Were those sources of drinking water affected due to the floods? (Yes-1; No-2) 2b. Latrine (i) Do you have any latrines? (Yes-1; No-2) 3. Did your house suffer any damage during the floods? (Yes-1; No-2) 3a. If yes, how serious are these damages? (Slightly Damaged-1, Severely Damaged-2, Collapsed-3) 93
105 4a. If there is any damage to your house, then how much money would you require to build similar house/s? (in INR) 4b. How would you get money for rebuilding/repairs? (in order of ranking) (Own Savings-1, Borrowings from Relatives/Friends-2, Moneylenders-3, Using the Old/ Available Building Materials-4, Government Assistance-5, Bank and Financial Institution-6, Through Own Savings in Future-7; Other-8) 5. Have you lost the following during the floods? Items Yes-1; No-2 Estimated Loss (INR) a. Domestic household articles and goods, appliances, furniture, consumer durables and other domestic possessions b. Jewellery c. Grain Store d. Others (Specify) 6. If you would like to relocate to a new place, what are the reasons? [Village Unsafe for Continued Habitation-1, Frequent Flooding-2, Loss of Land - 3, Migration of Relatives - 4, Better Opportunities Elsewhere 5, Other (specify)- 6] IV: Livelihood Losses a. Livestock Losses 1. Have you lost livestock during the floods? (Yes-1, No-2) 2. If yes, what is the estimate of all the livestocks lost? (in INR) 3. What would have been the approximate income from animal husbandry (including sale of milk and milk products) that you have lost during the floods? (INR) 4. If you have lost cattle, how would you purchase new ones? (With Own Resources-1, With Borrowings-2, Not Purchase-3) b. Cultivators, Fishermen, etc. 1. Do you own agricultural land? (Yes-1, No-2) 1a. If yes, how much agricultural land did you have before the floods? (in acres) 2. Are you an agricultural tenant/sharecropper? (Yes-1, No-2) 2a. How much agricultural land do you lease or sharecrop? 94
106 3. How much of the land you (own/tenant) cultivated has been lost due to floods? a. Temporary (in acres) b. Permanently (in acres) 4. Do you think you would be able to resume agriculture in the next season? (Yes-1, No-2, Can t Say-3) 5. What is the value of crops you have lost in the floods, including cost of cultivation? (in INR) 6. Would you be able to get credit for starting agricultural operations? (Yes-1, Yes, but at Higher Interest-2, No-3, Can t Say-4) 7. Have you lost your agricultural implements and tools? (Yes-1, No-2) 7a. What is their approximate value (INR)? 7b. If yes, how would you replace them? (Purchase With Own Resources-1, Borrow From Others-2, Not Purchase-3) 8. What is the approximate number of days you could not work in your agriculture and related work because of floods? (No. of days) 9. If you are a fisherman, have the floods affected the fishing activity and sale of fish? (Yes-1, No-2) 10. What is the estimated income that you have lost in fishing because of floods? (in INR) c. Local Agricultural Labourers 1. How many days were you involved as agricultural labourers in the last month? 1a. Male 1b. Female 2. What was the daily wage in the last month (in INR)? 2a. Male 2b. Female 3. How many days did you not work because of floods? 3a. Male 3b. Female 4. What is the estimated loss of income because of not getting employment (in INR)? 4a. Male 4b. Female 5. Are you looking for more work now? (Yes-1; No-2) 95
107 6. If you are not working now, how are you planning to? 6a. Male 6b. Female (Work in Other Trades / Professions Such as Construction-1, Work in Urban Centres Such as Hotels, Workshops, Etc. -2, Seek Work on the National Rural Employment Guarantee Scheme (NREGS)-3, Migrate to Other States-4; Others (specify) - 5]) d. Local Non-Agricultural Labourers 1. How many days were you involved in non-agricultural work in the last month? 1a. Male 1b. Female 2. What was the daily wage in the non-agricultural work in the last month (in INR)? 2a. Male 2b. Female 3. How many days did you not work in the non-agricultural work because of floods? 3a. Male 3b. Female 4. What is the estimated loss of income in non-agricultural work due to not getting employment (in INR)? 4a. Male 4b. Female 5. Are you looking for more work now? (Yes-1; No-2) 6. If you are not working now, how are you planning to? 6a. Male 6b. Female (Work in Other Trades / Professions Such as Construction-1, Work in Urban Centres Such as Hotels, Workshops, Etc. -2, Seek Work on the National Rural Employment Guarantee Scheme (NREGS)-3, Migrate to Other States-4; Others (specify) - 5]) 7. Did you lose any working instruments or equipment or suffer damage to business premises during the floods? (Yes-1, No-2, Partially-3) 8. What is the estimated loss because of this? (in INR) e. Shopkeepers / Traders / Vendors / Hawkers 1. Have the floods damaged your shops / business premises / stalls / business? (Yes-1, No-2) 2. Have you stopped your business in the wake of floods? (Yes-1, No-2) 3. If no, has the business been affected in terms of sales? (Yes-1, No-2) 4. How many days have you been away from your business due to floods? 5. How much income did you lose as a whole because of floods? (INR) f. Home-Based Work/Handicrafts 1. Are/were you involved with any home-based work? (Yes-1, No-2) If yes, 1a. Male (no.) 1b. Female (no.) 96
108 2. In what sort of home-based work were you and your family members engaged? 2a. Male 2b. Female (Sewing/Stitching 1, Tailoring 2, Pottery 3, Grocery Shop - 4, Making Dry Foods (such pickle, homemade cakes, etc.) - 5, Other - 6) 3. Did you lose any tool or equipment during the floods? (Yes-1, No-2, Partially-3) 4. How have the floods affected your home-based work? (Fully-1, Partially-2, Not affected at all-3) 5. If fully or partially affected, how many working days of employment did you lose? (no. of days) 5a. Male 5b. Female 6. What is the estimated loss of income because of this flood (in INR)? 6a. Male 6b. Female g. Other Losses 1. Can you recollect if you have lost anything because of floods that we have not listed above? (Yes-1; No-2) 2. If yes, what are those? Sl. No. Items Value (Rs.) VI. Migration 1. Have you or any of your family members been migrating to other places? (Yes-1; No-2) 2. If yes, please give the following information Sex Nature of Migration* Place of Migration** Male Female * Commuters-1; Short-Term Migration (3-8 Months)-2; More than 8 Months-3 **Within the District-1, Other Districts of Bihar-2, Outside Bihar-3, Outside India-4 3. Did you or any of your family members migrate after the floods? (Yes-1; No-2) 97
109 4. If yes, please give the following information Persons Nature of Migration* Place of Migration** (i) (ii) (iii) * Commuters-1; Short-Term Migration (3-8 Months)-2; More than 8 Months-3 **Within the District-1, Other Districts of Bihar-2, Outside Bihar-3, Outside India-4 5. If not migrating, what are the reasons for not migrating? (No Money to Go Elsewhere-1; No Time -2, Take Care of Family-3; Others-4) D. Coping Mechanisms, Recovery and Livelihood Diversification 1. What is the loss of your daily income due to the floods? (Less than 10% - 1, 10-25% - 2, 25-50% - 3, 50-99% - 4, 100% - 5) 2. How are you coping with the situation? (Govt. Relief-1, Other than Govt. Relief (NGOs/International Aid-2, Relatives Support-3, Own Savings-4, Borrowings-5, Temporary Employment-6) 2a. If your answer is 4, how do you save? With Banks-1, Members of Self-Help Groups-2, Post Office/Cooperatives-3, Other- 4 2b. If your answer is 5, what are your sources of borrowings after the floods? (Relatives/Friends - 1, Moneylenders - 2, Cooperative Banks/Microfinance Institutions - 3) 3. Are you aware of the relief assistance being made available through the Government? (Yes-1, No-2) 4. Did you get ex gratia relief assistance from the Government? (Yes-1, No-2) 5. What kind of difficulties do you face in accessing relief assistance? (Lack of Awareness-1, Distance from Relief Centres/ Camps-2, Discrimination in the Distribution of Relief Assistance - 3, Leakages in Supply of Relief Items - 4, Rude Behaviour of Relief Functionaries 5, Not Enlisted in the Relief Beneficiary List - 6) 6. Did you have to withdraw children from schools? (Yes-1, No-2) 7. Did you store food grains / savings? (Yes-1, No-2) 8. Did you have to sell your assets to cope with the floods? (Yes-1, No-2) 9. Did you have to reduce food/other essential consumption? (Yes-1, No-2) 10. Did you seek any employment on the NREGS works? (Yes-1, No-2) 98
110 How many days did you get employment on the NREGS works (no. of days)? 10 a. Male 10 b. Female 11. If you got employment on NREGS works or any other employment programme, what wages did you receive per day? (INR) 12. Would you like to get more employment through the NREGS? (Yes-1, No-2) 13. What kind of assistance would you need for recovery? (Rank the priorities) 1. Assistance for agricultural inputs 2. Provision of foodgrains 3. Assistance for crop losses 4. Starting NREGS works on a large scale 5. Small grants for business recovery 6. Access to cheap credit 7. Skills learning 8. Debt relief 9. Other (specify) This section for respondents still staying in the camps E. Exclusive Experience of Camp 1. Please tell us about the following aspects of the camp (a) Bathing arrangements [Temporary Bathroom in the Camp-1; Temporary Arrangement Near Handpump/Well-2; Pumps/Rivers -3; Open Space -.4; Other (specify) 5] (b) Availability of food (Good-1; Tolerable-2; Very Bad-3; Others (specify)-4] (c) Source of drinking water (Tubewell-1, Well-2; Handpump-3; Tap Water-4; Tanker-5; Other (specify)- 6] (d) Facilities for defecation (Pukka Toilet - 1; Katcha toilet - 2; Open Space/Field - 3) 2. Are the women/young girls safe and secure in the camp? (Yes 1, No 2) 3. (i) Did you suffer from any illness/disease in the camp? Yes-1, No-2] (ii) If yes, what kind of illness/disease? (Malaria-1; Dehydration/Dysentery-2, Viral fever-3; Kalazar-4; Cough and Cold-5; Chickenpox-6; Skin Diseases-7; Other (specify)-8] 99
111 (iii) What were the health services available in case of illness/disease? [Mobile/Emergency Medical Team-1; General Health Practitioner-2; Traditional Health Practitioners -3; Government Hospital-4; Private Clinic-5; Other (specify)-6] 4. Was there any discrimination in the camp (in terms of caste and religion) in accessing facilities in the camp? (Yes-1; No-2) 4a. If yes, type of discrimination (Caste-Based-1; Religion-Based-2; Gender-Based-3) 5. What is your overall assessment about the camp life? (Good-1; Satisfactory-2; Tolerable -3; Very Bad-4] 100
112 Annexure V Focus Group Discussion
113 Annexure V Focus Group Discussion The focus of the FGDs was to find out, in free-flowing discussions, the requirements for early recovery. In identifying participants, it was ensured that they were roughly of the same socioeconomic group or had a similar background in relation to the issue under investigation. At least 50 percent of discussions were women. The FGDs were conducted in villages where the household questionnaire was not canvassed. Groups for FGDs were based on occupational groups, including agricultural labourers, cultivators and those in non-agricultural occupations such as artisans. Men and women both were included. A separate group discussion was conducted with women, who were predominantly employed (including women engaged in home-based work). Questions dealt with in the FGDs are given below: General Issues 1. Are men and women, girls and boys affected differently by the floods? Did people belonging to the marginalized groups face extra difficulties? Who, according to you, are the worst affected? 2. Do you think the way men and women responded to disaster was different? 3. This flood was unexpected, so how did you cope up? How do you think you will prepare yourself for floods or any other natural disaster in the future? 4. From where did you get the most help Government, NGO, other? Did you find coordination prevalent among different agencies (Government/NGO/other) during the emergency response? 5. What are your immediate priorities, and how do you intend to address these? Which recovery mechanisms will be more appropriate to the different affected groups? 6. What challenges do you foresee in resettlement/rehabilitation? Suggest solutions. 7. Do you think the compensation norms are fair? If not, why? Suggest solutions. 8. Are you aware /part of any community-led initiative to cope with floods? (Find out if people are using natural resources as coping mechanisms to supplement normal forms of income, and identify detrimental coping mechanisms such as child labour etc.) Special Issues Shelter 9. What is your plan for rebuilding houses? What would help increase your access to shelter/lands? 10. In what ways do you intend to improve the housing conditions such as separate place for animals/ bathroom within house/ washing place within house/ toilets within or adjacent to house? Access to Food 11. Are you able to meet your/your family s food requirement? How? 12. What would help increase your access to food? 102
114 Access to Water and Sanitation 13. How are you meeting your current requirements? Please tell us methods and time spent in water collection. 14. What can be done to increase access to safe and potable water? 15. What role can women and men play in operation, maintenance and distribution of water services? 16. Are water points safe? Can users (especially women and children) access them safely? Health and Education 17. In what ways do you think you can have an increased access to services such as health care and education and can contribute to maintaining these services? What are your suggestions for improving the quality? 18. Do people belonging to marginalized groups face discrimination in accessing these services? What kind of obstacles? 19. What types of common diseases have you been suffering from? Are people here also suffering from any more serious/complicated diseases (such as typhoid, jaundice)? What about HIV? (Check for awareness.) 20. Do you feel secure in your village? If no, why? What can be done to increase your security? (SPECIFICALLY ASK THIS QUESTION IN ALL WOMEN FGDs) Livelihoods 21. Do you think the activities performed by men and women before and after the floods have changed or remained the same? [Explore the division of labour by sex.] 22. Have women and men from different social groups been affected differently in relation to livelihoods and loss of employment? 23. What are the different support mechanisms that the Government/assistance agencies are using in rebuilding livelihoods? 24. Are women/different social groups involved in decision making when decisions are being taken in relation to rebuilding livelihoods? 25. Do women have equal access to resources, land and financial assistance, skills training in rebuilding livelihoods? 26. What are the prevailing attitudes, religious and cultural norms, practices and prejudices that affect women s ability to contribute to and benefit from engaging in livelihood activities? 27. Which population groups will require social security provisions because of lack of employment? 28. Views on migration What, according to you, should be the priorities area for road connectivity? 103
115
Kosi Floods How we coped! What we need? Perception Survey on Impact and Recovery Strategies
 Kosi Floods 2008 How we coped! What we need? Perception Survey on Impact and Recovery Strategies Published by United Nations Development Programme, 2009. IHD Research Team Project Director: Project Advisor:
Migration and Informality
 Migration and Informality Alakh N. Sharma Dhruv Sood Institute for Human Development NIDM Building, 3 rd Floor, IP Estate Mahatma Gandhi Marg New Delhi-110002 Why People Migrate? Labour migration is an
Principal Authors Amrita Datta, Sunil Kumar Mishra, Gerry Rodgers, Janine Rodgers, Alakh N Sharma
 Research Team Project Directors Alakh N Sharma and Gerry Rodgers Principal Authors Amrita Datta, Sunil Kumar Mishra, Gerry Rodgers, Janine Rodgers, Alakh N Sharma Fieldwork Organizers and Supervisors Ashwani
INTRODUCTION I. BACKGROUND
 INTRODUCTION I. BACKGROUND Bihar is the second most populous State of India, comprising a little more than 10 per cent of the country s population. Situated in the eastern part of the country, the state
AN ANALYSIS OF SOCIO-ECONOMIC STATUS OF SCHEDULED CASTES: A STUDY OF BORDER AREAS OF JAMMU DISTRICT
 Indian Streams Research Journal ISSN:-2230-7850 AN ANALYSIS OF SOCIO-ECONOMIC STATUS OF SCHEDULED CASTES: A STUDY OF BORDER AREAS OF JAMMU DISTRICT ORIGINAL ARTICLE Pradeep Arora and Virendar Koundal Research
IMPACT OF CYCLONE AILA ON THE LIVELIHOOD OF THE PEOPLE OF WEST BENGAL. Kalindi Sharma Research Scholar Department of Anthropology University of Delhi
 IMPACT OF CYCLONE AILA ON THE LIVELIHOOD OF THE PEOPLE OF WEST BENGAL Kalindi Sharma Research Scholar Department of Anthropology University of Delhi The Inception: On 25 th May 2009 A tropical Cyclone
ABHINAV NATIONAL MONTHLY REFEREED JOURNAL OF REASEARCH IN COMMERCE & MANAGEMENT MGNREGA AND RURAL-URBAN MIGRATION IN INDIA
 MGNREGA AND RURAL-URBAN MIGRATION IN INDIA Pallav Das Lecturer in Economics, Patuck-Gala College of Commerce and Management, Mumbai, India Email: Pallav_das@yahoo.com ABSTRACT The MGNREGA is the flagship
RP297. Resettlement and Rehabilitation (R&R) Entitlement Framework
 Entitlement Framework") Public Disclosure Authorized Public Disclosure Authorized Public Disclosure Authorized Public Disclosure Authorized FINAL REPORT Resettlement and Rehabilitation (R&R) Entitlement Framework RP297 Under
Public Disclosure Authorized Public Disclosure Authorized Public Disclosure Authorized Public Disclosure Authorized FINAL REPORT Resettlement and Rehabilitation (R&R) Entitlement Framework RP297 Under
Dimensions of rural urban migration
 CHAPTER-6 Dimensions of rural urban migration In the preceding chapter, trends in various streams of migration have been discussed. This chapter examines the various socio-economic and demographic aspects
Social Science Class 9 th
 Social Science Class 9 th Poverty as a Challenge Social exclusion Vulnerability Poverty Line Poverty Estimates Vulnerable Groups Inter-State Disparities Global Poverty Scenario Causes of Poverty Anti-Poverty
THE EFFECTIVENESS OF COMMUNITY-BASED DISASTER PREPAREDNESS. Alex Joseph, Discipleship Centre
 THE EFFECTIVENESS OF COMMUNITY-BASED DISASTER PREPAREDNESS Alex Joseph, Discipleship Centre Bihar State Population 86m.; 50% below poverty line More than 50% of India s flood affected people are in Bihar
SOCIAL INCLUSION AND RURAL DEVELOPMENT THROUGH MGNREGA
 SOCIAL INCLUSION AND RURAL DEVELOPMENT THROUGH MGNREGA MOOSA FARIN Assistant Professor Department of Economics AKI s Poona College of Arts, Science & Commerce Pune (MS) INDIA DR. SHAKEEL AHMED Vice-Principal
Theme : Marginalised Social Groups: Dalits/Tribals/Minorities
 COMPLETED RESEARCH PROJECTS Theme : Marginalised Social Groups: Dalits/Tribals/Minorities Development of a Vulnerability to Debt Bondage Index Collaboration/s: International Labour Organization (ILO) Project
INDIA : ORISSA CYCLONE
 INDIA : ORISSA CYCLONE 6 December 1999 appeal no. 28/99 situation report no. 4 period covered: 17th - 26th November 1999 As the full impact of the super cyclone that devastated Orissa one month ago becomes
NCERT Class 9th Social Science Economics Chapter 3: Poverty as a Challenge
 NCERT Class 9th Social Science Economics Chapter 3: Poverty as a Challenge Question 1. Describe how poverty line is estimated in India. A common method used to measure poverty is based on income or consumption
Labour Force Participation in Rural Bihar: A Thirty-Year Perspective based on Village Surveys
 WP 04/2012 Labour Force Participation in Rural Bihar: A Thirty-Year Perspective based on Village Surveys Janine Rodgers Working paper NO. WP 04/2012 Labour force participation in rural bihar: A thirty-year
Engenderment of Labour Force Surveys: Indian Experience. Prepared by. Dr. Swaraj Kumar Nath Director-General, Central Statistical Organisation INDIA
 GLOBAL FORUM ON GENDER STATISTICS ESA/STAT/AC.140/5.4 10-12 December 2007 English only Rome, Italy Engenderment of Labour Force Surveys: Indian Experience Prepared by Dr. Swaraj Kumar Nath Director-General,
15-1. Provisional Record
 International Labour Conference Provisional Record 105th Session, Geneva, May June 2016 15-1 Fifth item on the agenda: Decent work for peace, security and disaster resilience: Revision of the Employment
Highlights. Situation Overview. 340,000 Affected people. 237,000 Internally displaced. 4,296 Houses damaged. 84 People dead
 Sri Lanka: Floods and landslides Situation Report No. 1 (as of 22 May 2016) This report is produced by OCHA Regional Office for Asia and the Pacific, in collaboration with humanitarian partners. It covers
Impact of MGNREGS on Labour Supply to Agricultural Sector of Wayanad District in Kerala
 Agricultural Economics Research Review Vol. 25(No.1) January-June 2012 pp 151-155 Research Note Impact of MGNREGS on Labour Supply to Agricultural Sector of Wayanad District in Kerala Merin S. Thadathil*
ECONOMIC CONDITIONS OF THE MIGRANT WORKERS IN KERALA: A STUDY IN THE TRIVANDRUM DISTRICT
 (ISSN: 2321-4155), 33-46 Economics ECONOMIC CONDITIONS OF THE MIGRANT WORKERS IN KERALA: A STUDY IN THE TRIVANDRUM DISTRICT Dilip Saikia* ABSTRACT In recent years, Kerala has been experiencing a large
VULNERABILITY STUDY IN KAKUMA CAMP
 EXECUTIVE BRIEF VULNERABILITY STUDY IN KAKUMA CAMP In September 2015, the World Food Programme (WFP) and the United Nations High Commissioner for Refugees (UNHCR) commissioned Kimetrica to undertake an
PATHWAYS TO RESILIENCE: TRANSFORMING SYRIAN REFUGEE CAMPS INTO SELF-SUSTAINING SETTLEMENTS
 PATHWAYS TO RESILIENCE: TRANSFORMING SYRIAN REFUGEE CAMPS INTO SELF-SUSTAINING SETTLEMENTS FEASIBILITY STUDY FOR RESILIENCE-BUILDING IN SYRIAN REFUGEE CAMPS AND THEIR NEIGHBOURING HOST COMMUNITIES IN THE
The Socio-economic Status of Migrant Workers in Thiruvananthapuram District of Kerala, India. By Dilip SAIKIA a
 Journal of Economic and Social Thought www.kspjournals.org Volume 3 March 2016 Issue 1 The Socio-economic Status of Migrant Workers in Thiruvananthapuram District of Kerala, India By Dilip SAIKIA a Abstract.
Case studies of Cash Transfer Programs (CTP) Sri Lanka, Lebanon and Nepal
 Sri Lanka, Lebanon and Nepal") Case studies of Cash Transfer Programs (CTP) Sri Lanka, Lebanon and Nepal June 2017 Solidar Suisse Humanitarian Aid Unit International Cooperation I. Introduction The nature of humanitarian crises is changing.
Case studies of Cash Transfer Programs (CTP) Sri Lanka, Lebanon and Nepal June 2017 Solidar Suisse Humanitarian Aid Unit International Cooperation I. Introduction The nature of humanitarian crises is changing.
Data base on child labour in India: an assessment with respect to nature of data, period and uses
 Public Disclosure Authorized Public Disclosure Authorized Public Disclosure Authorized Public Disclosure Authorized Understanding Children s Work Project Working Paper Series, June 2001 1. 43860 Data base
Rapid Multi Sectoral Needs Assessment in Kukawa, Cross Kauwa and Doro Baga
 Rapid Multi Sectoral Needs Assessment in Kukawa, Cross Kauwa and Doro Baga November 2017 List of Contents Introduction and Methodology... 2 Main findings... 2 Kukawa... 2 Cross Kauwa... 4 Doro Baga...
HUMAN RESOURCES MIGRATION FROM RURAL TO URBAN WORK SPHERES
 HUMAN RESOURCES MIGRATION FROM RURAL TO URBAN WORK SPHERES * Abstract 1. Human Migration is a universal phenomenon. 2. Migration is the movement of people from one locality to another and nowadays people
Minimizing the adverse of impact of distress migration. District study of Nayagarh in western Odisha by Madhyam Foundation
 Minimizing the adverse of impact of distress migration District study of Nayagarh in western Odisha by Madhyam Foundation Mr. Subrat Kumar Singhdeo, Executive Director, Madhyam Foundation, N-3 / 202, IRC
Gender Equality and Development
 Overview Gender Equality and Development Welcome to Topic 3 of the e-module on Gender and Energy. We have already discussed how increased access to electricity improves men s and women s lives. Topic Three
EVALUATION REPORT ON INTEGRATED TRIBAL DEVELOPMENT PROJECTS
 EVALUATION REPORT ON INTEGRATED TRIBAL DEVELOPMENT PROJECTS PEO Study No. 136 1. The Study As per 1981 Census, the total population of India was 68.52 crores, out of which 5.16 crores (7.53%)consisted
Impact of MGNREGA on Socio-Economic Upliftment of the Beneficiaries A Case Study of Pali District of Rajasthan. Doctor of Philosophy
 Impact of MGNREGA on Socio-Economic Upliftment of the Beneficiaries A Case Study of Pali District of Rajasthan A Synopsis Submitted in partial fulfillment for the degree of Doctor of Philosophy (Management)
Migration Trend Analysis of Farmers and Agricultural Labours in Yadgir District of Karnataka, India
 International Journal of Current Microbiology and Applied Sciences ISSN: 2319-7706 Volume 7 Number 01 (2018) Journal homepage: http://www.ijcmas.com Original Research Article https://doi.org/10.20546/ijcmas.2018.701.371
Bihar Flood 2007-SSVK
 WELCOME SSVK Bihar - Bihar Floods, 6 th August,2007 An Update context Incessant rains, both in the upper and lower catchments of the North Bihar rivers, since the third week of July 2007 have caused serious
*Suggestions for State Budget *
 1 *Suggestions for State Budget 2012 13* Demands for Adivasi(Schedule Tribe) By 3, Aishwarya Apartment, Nr.Sardar Patel Colony, Stadium Road, Ahmedabad 14 Patheya.budget@hotmail.com www.pathey.in 2 Tribal
Nepal: Oxfam EFSVL response to the Nepal Mid and Far West Floods and Landslides, Oxfam Canada s Intervention CHAF September 01, 2014
 Canadian Humanitarian Assistance Fund (CHAF) Disaster Response Strategy Nepal: Oxfam EFSVL response to the Nepal Mid and Far West Floods and Landslides, 2014 Oxfam Canada s Intervention CHAF September
[text from Why Graduation tri-fold. Picture?]
![[text from Why Graduation tri-fold. Picture?]](/thumbs/91/105296859.jpg "[text from Why Graduation tri-fold. Picture?]") 1 [text from Why Graduation tri-fold. Picture?] BRAC has since inception been at the forefront of poverty alleviation, disaster recovery, and microfinance in Bangladesh and 10 other countries BRAC creates
1 [text from Why Graduation tri-fold. Picture?] BRAC has since inception been at the forefront of poverty alleviation, disaster recovery, and microfinance in Bangladesh and 10 other countries BRAC creates
FOOD SECURITY BILL 1
 FOOD SECURITY BILL 1 FOOD SECURITY BILL FOREWORD For the many poor people in the country, getting food grains at cheap prices that they can afford will now no longer be a problem. The Government of India
NREGA in Abu Road, Rajasthan
 NREGA in Abu Road, Rajasthan Rina Bhattacharya and Ratna M. Sudarshan Institute of Social Studies Trust New Delhi Presented at Conference on "EMPLOYMENT OPPORTUNITY AND PUBLIC EMPLOYMENT POLICY IN GLOBALISING
444% 0-2 years 4% Multi-Sector Needs Assessment - July W Demographics. Camp 23 / Shamlapur, Teknaf, Cox s Bazar, Bangladesh
 +53A 47% +43A 57% Multi-Sector Needs Assessment - July 2018 Background and Methodology An estimated 723,000 Rohingya refugees have fled violence in Myanmar s Rakhine state since August 25, 2017 1. Most
ISSN: Int. J. Adv. Res. 4(11), RESEARCH ARTICLE...
, RESEARCH ARTICLE...") Journal Homepage: - www.journalijar.com Article DOI: 10.21474/IJAR01/2083 DOI URL: http://dx.doi.org/10.21474/ijar01/2083 RESEARCH ARTICLE IMPACT OF OUT-MIGRATION ON DEMOGRAPHICS: EVIDENCE FROM DARBHANGA
Journal Homepage: - www.journalijar.com Article DOI: 10.21474/IJAR01/2083 DOI URL: http://dx.doi.org/10.21474/ijar01/2083 RESEARCH ARTICLE IMPACT OF OUT-MIGRATION ON DEMOGRAPHICS: EVIDENCE FROM DARBHANGA
Rapid Joint Needs Assessment Phase 01- INDIA [VILLAGE / HAMLET]
![Rapid Joint Needs Assessment Phase 01- INDIA [VILLAGE / HAMLET]](/thumbs/84/89566900.jpg "Rapid Joint Needs Assessment Phase 01- INDIA [VILLAGE / HAMLET]") INDIA RAPID Needs Assessment Format Phase 1 Initial Days (1-25 days in the immediate aftermath of a disaster) Village Level Assessment Format An India Humanitarian Collective Action To be Used by the Humanitarian
INDIA RAPID Needs Assessment Format Phase 1 Initial Days (1-25 days in the immediate aftermath of a disaster) Village Level Assessment Format An India Humanitarian Collective Action To be Used by the Humanitarian
133% 65+ years 1% % years 14% 544% 0-2 years 5%
 +59A 41% +50A 50% Multi-Sector Needs Assessment - July 2018 Background and Methodology An estimated 723,000 Rohingya refugees have fled violence in Myanmar s Rakhine state since August 25, 2017 1. Most
011% 65+ years 0% 666% 0-2 years 6%
 +58A 42% +42A 58% Multi-Sector Needs Assessment - July 2018 Background and Methodology An estimated 723,000 Rohingya refugees have fled violence in Myanmar s Rakhine state since August 25, 2017 1. Most
KISENYI III NEIGHBORHOOD PROFILE Urban community assessment Kampala, Uganda - July 2018
 KISENYI III NEIGHBORHOOD PROFILE Urban community assessment Kampala, Uganda - July 8 CONTEXT Surrounded by countries facing political instability, Uganda is the primary destination for refugees from South
INDIAN SCHOOL MUSCAT SENIOR SECTION DEPARTMENT OF SOCIAL SCIENCE CLASS: IX TOPIC/CHAPTER: 03-Poverty As A Challenge WORKSHEET No.
 INDIAN SCHOOL MUSCAT SENIOR SECTION DEPARTMENT OF SOCIAL SCIENCE CLASS: IX TOPIC/CHAPTER: 0-Poverty As A Challenge WORKSHEET No. : 4 (206-7) SUMMARY WRITE THESE QUESTIONS IN YOUR CLASS WORK NOTE BOOK 5,
Nature And Reasons For Migration: A Case Study Of Migrated Unskilled Labour To Hyderabad City
 IOSR Journal Of Humanities And Social Science (IOSR-JHSS) Volume 21, Issue11, Ver. 11 (Nov. 216) PP 21-26 e-issn: 2279-837, p-issn: 2279-845. www.iosrjournals.org Nature And Reasons For Migration: A Case
Site Assessment: Round 8
 IOM BANGLADESH Needs and Population Monitoring (NPM) Site Assessment: Round 8 Following an outbreak of violence on 25 August 2017 in Rakhine State, Myanmar, a new massive influx of Rohingya NPM refugees
DISPLACEMENT TRACKING MATRIX (DTM) Round IX Report - April, 2016 DISPLACEMENT HIGHLIGHTS
 Round IX Report - April, 2016 DISPLACEMENT HIGHLIGHTS") DISPLACEMENT TRACKING MATRIX (DTM) Round IX Report - April, 2016 DISPLACEMENT HIGHLIGHTS 2,155,618 individuals (352,840 households) were identified in Adamawa, Bauchi, Benue, Taraba, Yobe, Nasarawa, Plateau,
DISPLACEMENT TRACKING MATRIX (DTM) Round IX Report - April, 2016 DISPLACEMENT HIGHLIGHTS 2,155,618 individuals (352,840 households) were identified in Adamawa, Bauchi, Benue, Taraba, Yobe, Nasarawa, Plateau,
Education and Employment: A Change Agent for Andh Community
 Education and Employment: A Change Agent for Andh Community SHEIKH NAZIR JABBAR Manavloks College of Social Sciences, Ring Road Ambajogai District Beed 431517, Maharashtra E-mail: nazirsheikh1972@gmail.com
RESETTLEMENT AND REHABILITATION PLAN
 CHAPTER 14 RESETTLEMENT AND REHABILITATION PLAN 14.1 AFFECTED FAMILIES The total affected family may be categorized as fully affected and partially affected. Fully affected families are those who will
KAWEMPE I NEIGHBORHOOD PROFILE Urban community assessment Kampala, Uganda - July 2018
 KAWEMPE I NEIGHBORHOOD PROFILE Urban community assessment Kampala, Uganda - July 8 CONTEXT Surrounded by countries facing political instability, Uganda is the primary destination for refugees from South
PRESS RELEASE: New Delhi, 28 September 2017
 PRESS RELEASE: New Delhi, 28 September 2017 HLRN Welcomes India s Acceptance of UPR III Recommendations on Housing, Land, and Sustainable Development; Calls for a Human Rights Approach to Implementation
RAPID NEED ASSESSMENT REPORT
 RAPID NEED ASSESSMENT REPORT Syrian Refugees Marj el Khokh Informal Camp Marjeyoun District, South Lebanon 3 rd of April 2013 AVSI Foundation EMERGENCY TEAM Jounieh Ghadir, Rue st. Fawka (Lebanon) Telefax:
Workforce Participation in Tribal Districts of Gujarat: Comparative Study of ST and Non ST
 Continuous issue-22 June July 2016 Workforce Participation in Tribal Districts of Gujarat: Comparative Study of ST and Non ST The constitution of India ensures that all citizens enjoy equal rights and
Under-five chronic malnutrition rate is critical (43%) and acute malnutrition rate is high (9%) with some areas above the critical thresholds.
 and acute malnutrition rate is high (9%) with some areas above the critical thresholds.") May 2014 Fighting Hunger Worldwide Democratic Republic of Congo: is economic recovery benefiting the vulnerable? Special Focus DRC DRC Economic growth has been moderately high in DRC over the last decade,
May 2014 Fighting Hunger Worldwide Democratic Republic of Congo: is economic recovery benefiting the vulnerable? Special Focus DRC DRC Economic growth has been moderately high in DRC over the last decade,
BWAISE II NEIGHBORHOOD PROFILE Urban community assessment Kampala, Uganda - July 2018
 BWAISE II NEIGHBORHOOD PROFILE Urban community assessment Kampala, Uganda - July 8 CONTEXT Surrounded by countries facing political instability, Uganda is the primary destination for refugees from South
Executive summary. Strong records of economic growth in the Asia-Pacific region have benefited many workers.
 Executive summary Strong records of economic growth in the Asia-Pacific region have benefited many workers. In many ways, these are exciting times for Asia and the Pacific as a region. Dynamic growth and
Step 4: Dynamic pressures and underlying causes
 SECTION 7 Step 4: Dynamic pressures and Dynamic have a major influence on vulnerability and capacity, either from within the community itself or from some external source. Influences can be positive or
CONTENTS INTRODUCTION ORIGIN AND REGIONAL SETTING DISTRIBUTION AND GROWTH OF POPULATION SOCIAL COMPOSITION OF POPULATION 46 53
 CONTENTS CHAPTER PAGE NOs. INTRODUCTION 1 8 1 ORIGIN AND REGIONAL SETTING 9 19 2 DISTRIBUTION AND GROWTH OF POPULATION 20 44 3 SOCIAL COMPOSITION OF POPULATION 46 53 4 SEX COMPOSITION OF POPULATION 54
<click here to view a map of the affected area, or here for detailed contact information>
 India: Floods Information bulletin no 04 GLIDE FL-2008-000145-IND 29 August 2008 The state of Bihar is facing one of the worst floods in 50 years, as the river Kosi in Nepal has discharged huge levels
Economic and Social Council
 UNITED NATIONS E Economic and Social Council Distr. GENERAL E/C.12/1/Add.21 2 December 1997 Original: ENGLISH COMMITTEE ON ECONOMIC, SOCIAL AND CULTURAL RIGHTS CONSIDERATION OF REPORTS SUBMITTED BY STATES
B. Resolution concerning employment and decent work for peace and resilience.
 International Labour Conference Provisional Record 106th Session, Geneva, June 2017 13-1(Rev.) Date: Thursday, 15 June 2017 Fifth item on the agenda: Employment and decent work for peace and resilience:
ILO STRATEGY FOR THE RECONSTRUCTION, REHABILITATION AND RECOVERY OF THE EARTHQUAKE AND TSUNAMI-AFFECTED COUNTRIES IN ASIA
 1 ILO STRATEGY FOR THE RECONSTRUCTION, REHABILITATION AND RECOVERY OF THE EARTHQUAKE AND TSUNAMI-AFFECTED COUNTRIES IN ASIA THE BACKGROUND The UN Secretary-General described the December 26, 2004 catastrophe
011% 65+ years 0% % years 14% 744% 0-2 years 7%
 +53A 47% +47A 53% Multi-Sector Needs Assessment - July 2018 Background and Methodology An estimated 723,000 Rohingya refugees have fled violence in Myanmar s Rakhine state since August 25, 2017 1. Most
Determinants of International Migration in Egypt: Results of the 2013 Egypt-HIMS
 Determinants of International Migration in Egypt: Results of the 2013 Egypt-HIMS Rawia El-Batrawy Egypt-HIMS Executive Manager, CAPMAS, Egypt Samir Farid MED-HIMS Chief Technical Advisor ECE Work Session
Chapter III SOCIO- ECONOMIC ASSESSMENT OF SLUM POPULATION IN PIMPRI- CHINCHWAD URBAN AREA
 Chapter III SOCIO- ECONOMIC ASSESSMENT OF SLUM POPULATION IN PIMPRI- CHINCHWAD URBAN AREA 1. Introduction 2. Economic status of slum population in Pimpri Chinchwad urban area 2.1: Average Annual income
A Framework for People-Oriented Planning in Refugee Situations Taking Account of Women, Men and Children
 A Framework for People-Oriented Planning in Refugee Situations Taking Account of Women, Men and Children United Nations High Commissioner for Refugees A Practical Planning Tool for Refugee Workers by Mary
Indigenous Peoples Development Planning Document. IND: Assam Integrated Flood and Riverbank Erosion Risk Management Investment Program
 Indigenous Peoples Development Planning Document Indigenous Peoples Development Framework Document Stage: Draft for Consultation Project Number: 38412 June 2009 IND: Assam Integrated Flood and Riverbank
Report TOT Regional Level Capacity Building for Professional on Implementation on SFDRR 5-9 December 2016
 Report TOT Regional Level Capacity Building for Professional on Implementation on SFDRR 5-9 December 2016 Participants representing different locations in Assam, workshop on 5-7 December 2016. 1 Context
Poverty Profile. Executive Summary. Kingdom of Thailand
 Poverty Profile Executive Summary Kingdom of Thailand February 2001 Japan Bank for International Cooperation Chapter 1 Poverty in Thailand 1-1 Poverty Line The definition of poverty and methods for calculating
Annex 2: Does the Xayaburi resettlement comply with Lao law?
 Annex 2: Does the Xayaburi resettlement comply with Lao law? The Xayaburi project s resettlement scheme has not complied with Lao laws and policies on involuntary resettlement and compensation. As the
CHAPTER - I INTRODUCTION
 CHAPTER - I INTRODUCTION Urban poverty in India is large and widespread. As per the Planning Commission data, out of an estimated urban population of 309.5 million, 80.8 million were below poverty line
WOMEN AND GIRLS IN EMERGENCIES
 WOMEN AND GIRLS IN EMERGENCIES SUMMARY Women and Girls in Emergencies Gender equality receives increasing attention following the adoption of the UN Sustainable Development Goals (SDGs). Issues of gender
THE WAGES OF WAR: How donors and NGOs can build upon the adaptations Syrians have made in the midst of war
 THE WAGES OF WAR: How donors and NGOs can build upon the adaptations Syrians have made in the midst of war FEBRUARY 2018 The scale of death and suffering in Syria is monumental. What began as a series
Lao People s Democratic Republic Peace Independence Democracy Unity Prosperity. Prime Minister s Office Date: 7 July, 2005
 Lao People s Democratic Republic Peace Independence Democracy Unity Prosperity Prime Minister s Office No 192/PM Date: 7 July, 2005 DECREE on the Compensation and Resettlement of the Development Project
BE it enacted by Parliament in the Sixty-third Year of the Republic of India as follows:
 The National Right to Homestead Bill, 2013 STATEMENT OF OBJECTS AND REASONS The poorest and most vulnerable among the rural families are those who are landless and homesteadless. An estimated 13 to 18
PANCHAYATI RAJ AND POVERTY ALLEVIATION IN WEST BENGAL: SUMMARY OF RESEARCH FINDINGS. Pranab Bardhan and Dilip Mookherjee.
 PANCHAYATI RAJ AND POVERTY ALLEVIATION IN WEST BENGAL: SUMMARY OF RESEARCH FINDINGS Pranab Bardhan and Dilip Mookherjee December 2005 The experience of West Bengal with respect to Panchayat Raj has been
About half the population of the Kyrgyz
 Building a fair society Kyrgyzstan s unions and poverty reduction In Kyrgyzstan, trade unions have been closely involved in drawing up and implementing the National Poverty Reduction Programme. They believe
ECONOMIC AND SOCIAL EFFECT OF POVERTY OF TRIBAL COMMUNITY IN THANE DISTRICT (MAHARASHTRA)
") 18 ECONOMIC AND SOCIAL EFFECT OF POVERTY OF TRIBAL COMMUNITY IN THANE DISTRICT (MAHARASHTRA) ASSO. PROF. DR. DEEPAK D SHELAR (HOD ECONOMICS) P.L. SHROFF COLLEGE OF ARTS AND COMMERCE. CHINCHANI. TAL. DAHANU
18 ECONOMIC AND SOCIAL EFFECT OF POVERTY OF TRIBAL COMMUNITY IN THANE DISTRICT (MAHARASHTRA) ASSO. PROF. DR. DEEPAK D SHELAR (HOD ECONOMICS) P.L. SHROFF COLLEGE OF ARTS AND COMMERCE. CHINCHANI. TAL. DAHANU
RESULTS AND DISCUSSION
 67 CHAPTER IV RESULTS AND DISCUSSION The results of the present study, "Rural Labour Out - Migration in Theni District: Determinants and Economic Impact among Migrant Workers in Cardamom Estates" has been
122% 65+ years 1% 544% 0-2 years 5%
 +51A 49% +49A 51% Multi-Sector Needs Assessment - July 2018 Background and Methodology An estimated 723,000 Rohingya refugees have fled violence in Myanmar s Rakhine state since August 25, 2017 1. Most
The Power of. Sri Lankans. For Peace, Justice and Equality
 The Power of Sri Lankans For Peace, Justice and Equality OXFAM IN SRI LANKA STRATEGIC PLAN 2014 2019 The Power of Sri Lankans For Peace, Justice and Equality Contents OUR VISION: A PEACEFUL NATION FREE
Jee Grace B. Suyo, Rodelio F. Subade, Farisal U. Bagsit*, Jorge S. Ebay, Emeliza C. Lozada and Josefa T. Basco
 Gender-differentiated adaptation and coping mechanisms to extreme climate event: A case study on the coastal households in Dumangas, Iloilo, Philippines Jee Grace B. Suyo, Rodelio F. Subade, Farisal U.
Kakuma Refugee Camp: Household Vulnerability Study
 Kakuma Refugee Camp: Household Vulnerability Study Dr. Helen Guyatt Flavia Della Rosa Jenny Spencer Dr. Eric Nussbaumer Perry Muthoka Mehari Belachew Acknowledgements Commissioned by WFP, UNHCR and partners
THE VOICE OF THE COMMUNITIES OF LATIN AMERICA AND THE CARIBBEAN
 THE VOICE OF THE COMMUNITIES OF LATIN AMERICA AND THE CARIBBEAN TOWARDS THE WORLD HUMANITARIAN SUMMIT (WHS) Report of the Survey under the Consultation with the Affected Communities of Latin America and
Rural Bill of Rights
 Rural Bill of Rights People living in rural areas earn less, yet have higher housing costs; live longer, yet find healthcare more difficult to access; pay more for fuel, energy and almost every commodity
MULTI SECTOR INITIAL RAPID NEEDS ASSESSMENT TO DIKWA TOWN
 MULTI SECTOR INITIAL RAPID NEEDS ASSESSMENT TO DIKWA TOWN Author: Filip Lozinski Date of report: 21 st April 2017 Assessment Team: Mustapha Mohammed Grema, Lare Maina, Danladi Bitrus Mamza Basic details
A PREVENTIVE APPROACH TO AVOID POVERTY FROM SOCIETY
 A PREVENTIVE APPROACH TO AVOID POVERTY FROM SOCIETY SUNITA RANI Research Scholar, department of economics CDLU, SIRSA (India) ABSTRACT The main reason of undevloping country is poverty. India is also one
Youth labour market overview
 1 Youth labour market overview With 1.35 billion people, China has the largest population in the world and a total working age population of 937 million. For historical and political reasons, full employment
ROHINGYA REFUGEE CRISIS Camp Settlement and Protection Profiling Cox s Bazar, Bangladesh Round 3
 ROHINGYA REFUGEE CRISIS Camp Settlement and Protection Profiling Cox s Bazar, Bangladesh Round 3 April 2018 UNHCR/Roger Arnold 1 Overview Upazila: Ukhiya Union: Palong Khali Introduction This profile provides
Climate Change & Migration: Some Results and Policy Implications from MENA
 Climate Change & Migration: Some Results and Policy Implications from MENA Outline 1. An abridged history of climate induced migration 2. Investigating CIM in MENA 3. Some results and policy considerations
Mapping women s economic exclusion in Tanzania
 Helpdesk Report Mapping women s economic exclusion in Tanzania Iffat Idris GSDRC, University of Birmingham 11 May 2018 Question What evidence shows how women have been excluded from some of the employment
Present Position and Future Strategy for Migrant Workers: Towards Social Security
 Present Position and Future Strategy for Migrant Workers: Towards Social Security Migration of workers is a human phenomenon which has historical roots and wider implications. Search for source of livelihood
 Kingdom of Cambodia Nation Religion King National Committee for Disaster Management REPORT ON FLOOD MITIGATION STRATEGY IN CAMBODIA 2004 I. BACKGROUND Cambodia is one of the fourteen countries in Asia
Socio-Economic Profile of Inter-state and Intra-State Urban Migrants. A Case study of Nashik, Maharashtra
 Socio-Economic Profile of Inter-state and Intra-State Urban Migrants A Case study of Nashik, Maharashtra Indian Institute of Public Health-Delhi, Public Health Foundation of India Disha Foundation, Nasik
Chapter 8 Migration. 8.1 Definition of Migration
 Chapter 8 Migration 8.1 Definition of Migration Migration is defined as the process of changing residence from one geographical location to another. In combination with fertility and mortality, migration
Socio - Economic Impact of Remittance on Households in Lekhnath Municipality, Kaski, Nepal
 Economic Literature, Vol. XII (39-49), December 2014 Socio - Economic Impact of Remittance on Households in Lekhnath Municipality, Kaski, Nepal Ananta Raj Dhungana, PhD 1 * Dipendra Pandit** ABSTRACT The
POST-DISTRIBUTION MONITORING REPORT:
 POST-DISTRIBUTION MONITORING REPORT: Reporting Period: 01 August - 30 November 2015 Targeted Areas: Matoon, Tani, Gurbaz, Nadir Shah Kot & Mandozai of Khost Province The Post-Distribution Monitoring (PDM)
Struggles for Equality
 10 CHAPTER Struggles for Equality In this book, you have read about people like Kanta, the Ansaris, Melani and Swapna. The thread that connects all of these lives is that they have been treated unequally.