City of Kingston Information Report to Housing and Homelessness Advisory Committee Report Number HHC
|
|
|
- Lillian Chambers
- 5 years ago
- Views:
Transcription

1 To: From: City of Kingston Information Report to Housing and Homelessness Advisory Committee Report Number HHC Resource Staff: Date of Meeting: September 27, 2018 Subject: Executive Summary: Chair, Housing and Homelessness Advisory Committee Lanie Hurdle, Commissioner, Community Services Sheldon Laidman, Director, Housing & Social Services 2018 Homelessness Enumeration Project In 2013 and 2016, homelessness enumeration processes were conducted in the City of Kingston and County of Frontenac. In 2018, the first provincially legislated homelessness enumeration was conducted in all communities across Ontario. The objectives of the homelessness enumeration are to understand the extent and characteristics of the population experiencing homelessness. The results will be used provincially and locally for policy and program planning with the objective of ending chronic homelessness in the community. In April 2018, homelessness enumeration processes were conducted in Kingston s urban area, the County of Frontenac and Kingston s rural area. Kingston s urban enumeration was conducted by the United Way with support from partner agencies and volunteers using a Pointin-Time Count (PiT Count) methodology. In collaboration with Southern Frontenac Community Services, Rural Frontenac Community Services, and Addiction and Mental Health Services KFL&A, an enumeration of homelessness in the County of Frontenac and rural Kingston took place over a ten day period conducted by the City of Kingston. This report provides an overview of key findings, socio-demographic characteristics, and an outline of next steps to incorporate the findings within the local homelessness service system design. Recommendation: This report is for information purposes only. 25
2 Information Report to Housing and Homelessness Advisory Committee Report Number HHC September 27, 2018 Page 2 of 7 Authorizing Signatures: Lanie Hurdle, Commissioner, Community Services Gerard Hunt, Chief Administrative Officer Consultation with the following Members of the Corporate Management Team: Jim Keech, President & CEO, Utilities Kingston Not required Desirée Kennedy, Chief Financial Officer & City Treasurer Not required Denis Leger, Commissioner, Corporate & Emergency Services Not required 26
3 Information Report to Housing and Homelessness Advisory Committee Options/Discussion: September 27, 2018 Page 3 of 7 Report Number HHC In January 2015, Ontario established an Expert Advisory Panel on Homelessness to provide advice on how to achieve the goal of ending homelessness under the province's Poverty Reduction Strategy. The Panel made a number of recommendations including that the Province require local enumeration of people experiencing homelessness. Recognizing the importance of data to inform policy and program development, the objectives of homelessness enumeration include: providing information on the scope and experiences of those facing homelessness, providing a baseline to evaluate progress over time, and to allow service providers to monitor the impact of local strategies. In December 2016, the Province passed legislation that requires all Service Managers to conduct an enumeration of people experiencing homelessness in their service area starting in The City of Kingston s Housing & Social Services Department is the Service Manager for housing and homelessness programs in the City of Kingston and County of Frontenac. The 10-Year Municipal Housing and Homelessness Plan included a recommendation to complete the first homelessness enumeration in 2013 and to conduct regular enumerations thereafter to establish a baseline and to measure progress over time. Enumeration data will help the federal, provincial and local governments and sector organizations understand the scale and nature of homelessness to better prevent, reduce and end chronic homelessness. In 2016, the second homelessness enumeration process was conducted in the Kingston-Frontenac service area. In April 2018, the third homelessness enumeration project took place. In Kingston s urban area, the United Way conducted a homelessness enumeration on April 11, 2018 using a PiT Count methodology. In collaboration with Southern Frontenac Community Services, Rural Frontenac Community Services, and Addiction and Mental Health Services KFL&A, an enumeration of homelessness in the County of Frontenac and rural Kingston took place between Monday, April 9 th and Friday, April 20 th, In accordance with the Provincial government s endorsed guidelines, the local homeless enumeration processes considered the following three forms of homelessness: 1. Unsheltered: this is absolute homelessness which generally includes people sleeping outdoors or in makeshift shelters, tents, vehicles, etc. 2. Emergency Sheltered: includes those sleeping in emergency shelters. 3. Provisionally Housed: includes people who lack permanent housing and are sleeping in unsustainable situations such as couch surfing at a friend s or family member s house, living in transitional housing or living in overcrowded housing. The Ministerial Directive for homeless enumeration requires Service Managers to conduct enumeration processes using one of the prescribed methods. A survey of those experiencing homelessness is required to address 15 common data points: current housing, chronicity of 27
4 Information Report to Housing and Homelessness Advisory Committee September 27, 2018 Page 4 of 7 Report Number HHC homelessness, frequency of homelessness, reason for homelessness/housing loss, age, Indigenous identity, racialized identity, gender identity, sexual orientation, language, family homelessness, military service, health, child welfare (history of foster care) and current income source. In addition to the mandatory questions, surveys can also include locally defined questions to provide data to assist in local policy and program development. Both the 2018 urban and rural enumerations included the required 15 common data points and additional questions which were developed with input from local homelessness service providers. All data was collected anonymously and nowhere were names recorded on the survey. For participating in the survey, all respondents were provided an honorarium and brochures with information regarding locally available services and programs. Key Findings Exhibits A and B include the 2018 urban and rural homelessness enumeration summary reports in full. When considering the information presented in the reports, it is important to consider that homelessness enumeration methodologies are known to provide undercounts due to the impracticality of enumerating all individuals experiencing homelessness in a community. Accordingly, the results should be considered a minimum estimation of the number of people experiencing homelessness in the City of Kingston and County of Frontenac. The following provides a summary of key indicators and socio-demographic characteristics of respondents to the 2018 urban and rural homelessness enumeration processes. Number of Households Experiencing Homelessness The number of individuals identified in the urban PiT Count continued to decline in This can likely be attributed to the implementation of the Housing First system in 2015 which provides ongoing housing support services and monthly housing subsidies to the most acute and chronically homeless individuals and households. Since 2015, 347 households have been housed through the Housing First system. While a portion of clients have since left their housing for a variety of reasons, the majority continue to be stably housed. In the chart below Absolute Homeless refers to those sleeping outside or in makeshift/inappropriate shelters and those staying in emergency shelters; Total Homeless also includes those staying in transitional or non-permanent housing. Number of People Experiencing Homelessness Urban (Absolute Homeless) Urban (Total Homeless) N/A Rural 54 30¹ 61 Note: ¹ In 2016, the decrease in individuals identified relates to fewer agency surveyors being available to conduct the enumeration process. 28
5 Information Report to Housing and Homelessness Advisory Committee September 27, 2018 Page 5 of 7 Report Number HHC Number of Households Unsheltered In 2018, the number of households living unsheltered appeared to decline in both the urban and rural areas. This trend likely reflects the continued implementation of the Housing First system and related homelessness prevention and diversion programs. In addition, the number of individuals experiencing hidden homelessness (i.e. couch-surfing or staying with family or friends) has increased which also would support a reduction in those living unsheltered. Percent of People Living Unsheltered or in Inappropriate Shelter (i.e. RV, vehicle, cabin, etc.) Urban 16% 22% 9% Rural 2% 40% 19% Chronically Homeless Chronically Homeless refers to individuals and households that have been homeless for six months or more in the past year. In 2018, the proportion of those surveyed experiencing chronic homelessness increased in both the urban and rural areas. From strictly a financial perspective, understanding the situations and extent of those experiencing chronic homelessness is important because continuous homelessness is much more costly and demanding of public services (i.e. health care, emergency responses, law enforcement services, etc.) than the costs to sustain a household with permanent housing subsidies and support services. The declining vacancy rate and lack of affordable housing has resulted in households staying homeless longer than in prior years. As such, a portion of homeless households have now become chronically homeless. Chronically Homeless Urban 33% 50% Rural 47% 62% Socio-Demographic Trends and Characteristics Relative to the proportion of the total population, those identifying as Indigenous/Aboriginal tend to comprise a higher proportion of the homeless population in Canada. This trend continued in 2018 in both the urban and rural areas where Indigenous/Aboriginal identity was 24% and 46% of those surveyed respectively. These percentages have increased since the 2013 and 2016 enumerations. The number of youth experiencing homelessness in both the urban and rural areas increased from 2016 to In the urban area, youth comprised 26% of the homeless population and 24% in the rural area. In both the urban and rural area, approximately 30% of respondents indicated they had been in foster care or a group home. 29
6 Information Report to Housing and Homelessness Advisory Committee September 27, 2018 Page 6 of 7 Report Number HHC In Canada, the majority of people experiencing homelessness are single men. A study of emergency shelters in Canada completed by the Homelessness Partnering Strategy found that approximately 74% of shelter users are men while women comprise slightly more than one-quarter. In Kingston, previous homelessness enumerations have found females comprise a greater proportion of those experiencing homelessness relative to the Canadian average. In 2018, the urban and rural enumerations identified females comprise 55% and 43% of the homeless population respectively. In both the urban and rural areas, approximately 80% of participants self-identified as experiencing a mental health issue and approximately 25% indicated they had a physical disability. In the urban area, 46% of participants identified as having an addictions issue while 35% in the rural area reported an addictions issue. Next Steps In accordance with the Ministerial Directive for homelessness enumeration, Service Managers are required to report back to the community with the results of the enumeration process. This report and the attached summary reports are intended to fulfill this requirement. The reports will be made available long-term on the United Way s Homelessness Point-in-Time Count webpage. In addition, the collected data has been provided to Ontario s Ministry of Municipal Affairs and Housing to support the Province s homeless reduction initiatives. Locally, the results of the homeless enumeration processes will be used to inform the five-year update of the 10-Year Municipal Housing and Homelessness Plan which will occur in the later months of 2018 and continue through the winter and spring of Key trends revealed in the 2018 homelessness enumeration include a high proportion of women; increasing youth homelessness; a high proportion of individuals experiencing physical health, mental health and addictions issues; and a high proportion of Indigenous/Aboriginal individuals. The identified trends and characteristics of the local population experiencing homelessness will be used to inform policy and program development which will be explored in greater detail through the fiveyear review process. The completion of the 2018 homelessness enumeration process will be communicated to the community and service providers via a media release and within other mediums including the annual City of Kingston and County of Frontenac 2018 Housing and Homelessness Report, the City of Kingston website and social media. Existing Policy/By-Law: 10-Year Municipal Housing and Homelessness Plan Notice Provisions: Not applicable 30
7 Information Report to Housing and Homelessness Advisory Committee Report Number HHC September 27, 2018 Page 7 of 7 Accessibility Considerations: Not applicable Financial Considerations: Not applicable Contacts: Lanie Hurdle, Commissioner, Community Services extension 1231 Sheldon Laidman, Director, Housing & Social Services extension 4957 Other City of Kingston Staff Consulted: Ruth Noordegraaf, Manager, Housing and Childcare Programs Melanie Bale, Housing Programs Administrator John Henderson, Housing Programs Administrator Exhibits Attached: Exhibit A Exhibit B 2018 County of Frontenac & Rural Kingston Homelessness Enumeration: Results Report Results of the 2018 Urban Kingston Point-in-Time Count 31


8 Exhibit A 2018 Rural Homelessness Enumeration County of Frontenac and Rural Kingston RESULTS REPORT Prepared by City of Kingston Housing and Social Services Department Released September
9 2018 County of Frontenac & Rural Kingston Homelessness Enumeration Results Report Exhibit A Contents Introduction and Background... 1 Acknowledgements... 3 Overview... 3 Methodology and Limitations... 4 Methodology... 4 Limitations... 5 Results of the Survey... 6 Sleeping Arrangements... 6 Length of Homelessness... 7 Episodes of Homelessness... 8 Reason for Leaving Housing... 9 Socio-Demographic Characteristics Age Gender Household Composition Family Sexual Orientation Indigenous Identity Racial Identity Immigrant/Refugee Status Military Service Presence of Physical or Mental Health Issue Child Welfare Source of Income Households new to the County Place of Origin Interaction with emergency services Barriers to Permanent Housing Youth Homelessness
10 2018 County of Frontenac & Rural Kingston Homelessness Enumeration Results Report Exhibit A Comparison of Rural Homeless Populations: 2013, 2016 & Conclusion Participating Agencies Appendix A: The Survey
11 2018 County of Frontenac & Rural Kingston Homelessness Enumeration Results Report Exhibit A Introduction and Background During a ten day period from April 9 to 13 and April 16 to 20, 2018, a homelessness enumeration process was conducted in the County of Frontenac and rural Kingston to obtain an updated understanding of the extent of homelessness in the rural community. As part of this initiative, surveys were conducted in order to better understand the unique needs and experiences of the rural homeless population. This work is part of a larger initiative, supported by the national Homelessness Partnering Strategy, to measure homelessness across Canada and learn how communities can work together toward a common goal of ending homelessness. An initial homeless enumeration process was conducted in the County of Frontenac and rural Kingston in 2013 which was followed by participation in the first country-wide coordinated enumeration in In 2018, the first legislated homelessness enumeration process is being conducted in communities across the province and will be completed every two years thereafter. 1 Participating in the coordinated count allows the community to take part in a larger, national initiative to measure homelessness across Canada. In 2013 and 2016, homelessness enumeration processes were conducted in Kingston s urban area using a Point-in-Time (PiT) Count method. In conjunction with the County of Frontenac and rural Kingston enumeration process, the United Way of Kingston, Frontenac, Lennox and Addington conducted an urban PiT Count process in April The results of this project can be found at: As communities across the country work toward ending homelessness, enumeration is a critical component of measuring the scope of homelessness and tracking progress. Conducting a coordinated count using similar methodology assists in providing an accurate picture of homelessness on a national scale as the data is captured in the same manner. Using this standardized approach also allows communities to draw more accurate comparisons between survey periods. 1 Ministry of Municipal Affairs and Housing Housing Services Act (2011) 35 1

12 2018 County of Frontenac & Rural Kingston Homelessness Enumeration Results Report Exhibit A 2 36
13 2018 County of Frontenac & Rural Kingston Homelessness Enumeration Results Report Exhibit A Acknowledgements The City of Kingston would like to thank everyone involved in the completion of this survey, including Southern Frontenac Community Services, Rural Frontenac Community Services, Addiction and Mental Health Services KFLA, in addition to other agencies and organizations that provided input on the project. The City of Kingston and County of Frontenac would further like to thank those who agreed to participate in the survey by providing personal information and sharing their experiences in order to help the City, County, and partner agencies better meet the needs of the homeless community. Overview During the ten day period from April 9 to 13 and April 16 to 20, 2018, the City of Kingston s Housing and Social Services Department in collaboration with its partner agencies conducted a homelessness enumeration process in the County of Frontenac and rural Kingston. This was part of a second Canada-wide coordinated homelessness enumeration project which aimed to provide an updated snapshot of the state of homelessness in the community. Although it is impossible to determine a definitive number of persons experiencing homelessness, completing an enumeration process at regular intervals provides a consistent data source that Service Managers and service agencies can use to measure progress, identify trends, and support policy and program design. The data collected provides a broad method to measure progress toward ending homelessness in accordance with the local 10-Year Municipal Housing & Homelessness Plan. Traditionally, in urban settings, homelessness enumeration is conducted using a Pointin-Time Count (PiT Count) methodology which obtains a snapshot of homelessness in the community. The enumeration process occurs on a single night and surveys those who are staying in institutions such as emergency shelters, hospitals or detoxification centres on the night of the count, as well as those who are encountered on the street and determined to be living unsheltered. Given the vast geography of the study area a PiT Count methodology would not provide an accurate reflection of the extent of homelessness in a rural community. In rural areas, homeless enumeration processes are conducted over a multi-day period by staff from social service agencies during their regular interactions with clients accessing services. Homelessness in rural areas appears different than in urban areas where it can be more visible. In the rural area, homeless individuals and households are more likely to be provisionally accommodated. The Canadian Observatory of Homelessness defines provisionally accommodated as those whose accommodation is temporary or lacks 37 3
14 2018 County of Frontenac & Rural Kingston Homelessness Enumeration Results Report Exhibit A security or tenure ; this would typically include those couch-surfing with friends or family or other forms of housing that is unstable or inappropriate for long-term accommodation. For this project local social service staff administered the enumeration survey over a period of two weeks during regular interactions with clients, including both unsheltered and provisionally accommodated homeless individuals and families. Based on population size and geography, the scope of homelessness in the County of Frontenac and rural Kingston was previously estimated in the 10-Year Municipal Housing and Homelessness Plan to be in the range of 21 to 61 individuals. The previous homelessness enumeration processes conducted in 2013 and 2016 found 54 and 30 individuals experiencing homelessness, respectively. In 2018, a total of 37 surveys were completed by respondents who indicated they were either a single or a family household that did not have a permanent address to return to that night. In total, the survey captured 61 individuals representing 37 households. Given the limitations of homelessness enumeration methodologies, the following data should be considered a minimum estimation of homelessness in the County of Frontenac and rural Kingston; the actual scope of homelessness is anticipated to be higher. Methodology and Limitations Methodology The survey was administered by staff of several agencies that support clients in securing and maintaining housing and accessing other social services and programs in the County of Frontenac and rural Kingston. Staff from Southern Frontenac Community Services, Rural Frontenac Community Services, and Addictions and Mental Health Services KFL&A conducted surveys with individuals accessing services at their agencies, either in person or via telephone. Some participants were known by the agency staff person to be homeless and were solicited to participate in the survey. Others self-identified as homeless while receiving other services and agreed to complete the survey. Survey location points were available in Sharbot Lake, Sydenham, and Verona. A phone-in survey option was available throughout the County and rural Kingston. Publicity for the enumeration process included print and social media advertising, as well as direct communications with local health and social service organizations. 38 4
15 2018 County of Frontenac & Rural Kingston Homelessness Enumeration Results Report Exhibit A Upon onset of the survey, clients were asked several screening questions to determine whether they were experiencing homelessness prior to obtaining their consent to complete the full survey. Limitations Although an accepted homeless enumeration process was adopted, there are limitations to consider: - There are no emergency shelters or institutions such as detox centres in rural Kingston or the County of Frontenac. - The survey was limited to those individuals who were already seeking services in the homelessness system. Only those individuals that sought out services during the two week period the survey was administered, or those who were known to be homeless and solicited by staff, were included in the survey. - There is no street outreach program in the area to identify and survey those who may be experiencing homelessness but not accessing services. - Due to the vast size of the study area, the traditional method of canvassing the area and surveying individuals found to be living unsheltered was not possible in the rural setting. - The definition of homelessness may vary for residents of urban areas and those from rural areas. Places not fit for habitation due to lack of amenities including running water and heat are more common in rural settings and as such, these clients may not consider themselves to be homeless and therefore may be underrepresented in the survey results. 39 5


16 2018 County of Frontenac & Rural Kingston Homelessness Enumeration Results Report Exhibit A Results of the Survey Sleeping Arrangements The survey was completed with 37 households who indicated they did not have permanent housing to return to on the date the survey was completed. The 37 households represented 61 individuals. Of those, 75% indicated they would be staying with a friend or family member on the night of the survey. 19% of respondents, or 7 households, indicated they would be sleeping in some form of shelter unfit for long-term accommodation, including one household sleeping in a vehicle. Of the remaining two households, one indicated they would be staying in transitional housing, while the other did not know where they would spend the night. Survey Question: Where are you staying tonight? Transitional housing 3% Vehicle 3% Makeshift shelter, tent or shack 16% Unknown 3% Someone else's place 75% 6 40
17 2018 County of Frontenac & Rural Kingston Homelessness Enumeration Results Report Exhibit A Length of Homelessness Chronic homelessness is defined as those households that have been homeless for six or more months in the past year. 62% of those surveyed or 23 households reported being chronically homeless at the time of the survey. When interpreting the following graph, it is important to note that some of those households captured in the 4-6 mos category were considered chronically homeless. Survey Question: In total, how much time have you been homeless over the past year? 35% 32% 30% 25% 20% 27% 24% 15% 10% 5% 8% 8% 0% 0-3 mos 4-6 mos 7-9 mos mos 12+ mos Length of homelessness (months) 7 41
18 2018 County of Frontenac & Rural Kingston Homelessness Enumeration Results Report Exhibit A Episodes of Homelessness 43% of households reported the current episode to be their only experience of homelessness in the last year. Survey Question: In total, how many different times have you experienced homelessness over the past year? 50% 45% 40% 35% 30% 25% 20% 43% 38% 15% 10% 5% 0% 5% 8% 0% 0% 3% 3% Decline Episodes of homelessness (last 12 months) 8 42
19 2018 County of Frontenac & Rural Kingston Homelessness Enumeration Results Report Exhibit A Reason for Leaving Housing Survey respondents were asked to identify the reason or reasons they lost their most recent housing. The most common response was the presence of an illness or medical condition reported by 12 households; followed by addiction or substance use; family conflict between a spouse/partner; and unsafe housing conditions. Responses recorded under Other Reason included mental health, threats, death of a family member, and fire. Survey Question: What happened that caused you to lose your housing most recently? 35% 32% 30% 27% 27% 27% 25% 20% 15% 19% 19% 22% 16% 14% 14% 10% 5% 3% 3% 3% 0% Illness/Medical Condition Addiction/Substance Use Job Loss Evicted: Unable to pay rent Evicted: Other reason Domestic Abuse: Spouse/Partner Family Conflict: Spouse/Partner Family Conflict: Parent/Guardian Unsafe Housing Conditions Left Care Incarcerated Don't Know Other Reason 9 43
20 2018 County of Frontenac & Rural Kingston Homelessness Enumeration Results Report Exhibit A Socio-Demographic Characteristics Age Nearly one third of households (27%) were led by an adult between the ages of Six households (16%) were youth-led. Survey Question: How old are you? or What year were you born? 30% 27% 25% 20% 15% 16% 14% 14% 19% 10% 5% 0% 5% 5% Decline Age in years (head of household) 25% 23% 20% 17% 19% 15% 13% 10% 10% 10% 5% 4% 4% 0% Decline Age in years (including dependents) 10 44

21 2018 County of Frontenac & Rural Kingston Homelessness Enumeration Results Report Exhibit A Gender 54% of households were led by men and 46% were led by women. Survey Question: What gender do you identify with? Gender (head of household) Male 54% Female 46% Gender (including family members) Unknown 5% Male 52% Female 43% 52% of those identified as homeless were male, 43% were female, and the gender of the remaining 5% was not disclosed

22 2018 County of Frontenac & Rural Kingston Homelessness Enumeration Results Report Exhibit A Household Composition Of the households surveyed, 23 (62%) were singles and 14 (38%) were families comprised of a partner, dependent children, or both. Survey Question: What family members will stay with you tonight? Singles 62% Families 38% Household Composition 70% 60% 62% 50% 40% 30% 20% 10% 16% 14% 8% 0% Singles Partner Only Child(ren)/Dependents Only Both Partner and Child(ren) 12 46

, 21% Partner Only, 43% Child(ren)/ Dependents Only, 36% 15")
 were youth (16-24).")
23 2018 County of Frontenac & Rural Kingston Homelessness Enumeration Results Report Exhibit A Family Of the 14 family households six indicated they had a partner staying with them, five reported having children/dependents, and three households reported having both a partner and child(ren). Family Composition Both Partner and Child(ren), 21% Partner Only, 43% Child(ren)/ Dependents Only, 36% 15 people, or 29% of those experiencing homelessness were dependent children. Of those, 12 were below the age of 15 and three (20%) were youth (16-24) Frequency to 5 6 to to to 24 Age of children/dependents (in years) 13 47


24 2018 County of Frontenac & Rural Kingston Homelessness Enumeration Results Report Exhibit A Sexual Orientation 97% of respondents identified as being straight/heterosexual while 3% of households self-identified as queer. Survey Question: How to you describe your sexual orientation? Queer 3% Straight/ Heterosexual 97% Indigenous Identity Based on 2016 census data those identifying as Indigenous comprise approximately 5% of population in the County of Frontenac though it is important to note that Indigenous individuals are usually under-represented in census counts. 17 households, or 46% of surveyed households, identified as First Nations or having Indigenous ancestry. Survey Question: Do you identify as Indigenous/Aboriginal or do you have Indigenous/Aboriginal ancestry? This includes First Nations, Métis, Inuit, with or without status. Declined to answer 3% Yes, First Nations/ Indigenous ancestry 46% No 51% 14 48
. 12 households did not respond to this question. Survey Question: What racialized identity do you identify with?")

25 2018 County of Frontenac & Rural Kingston Homelessness Enumeration Results Report Exhibit A Racial Identity 16 households indicated their race was Aboriginal/Indigenous, and 9 households indicated they were White (European-Canadian). 12 households did not respond to this question. Survey Question: What racialized identity do you identify with? Decline 33% Aboriginal or Indigenous 43% White - European- Canadian 24% Immigrant/Refugee Status Respondents were asked whether they arrived in Canada as an immigrant or refugee within the last five years. Of the 37 surveys completed, 35 answered no and 2 declined to answer. Survey Question: Did you come to Canada as an immigrant or refugee within the past 5 years? Decline to Answer 5% No 95% 49 15
26 2018 County of Frontenac & Rural Kingston Homelessness Enumeration Results Report Exhibit A Military Service The majority of households (86%) reported having no prior military service. One household indicated they had served in the military, and four households declined to answer. Survey Question: Have you ever had any service in the Canadian Military or RCMP? Declined to answer 11% Yes 3% No 86% 16 50

27 2018 County of Frontenac & Rural Kingston Homelessness Enumeration Results Report Exhibit A Presence of Physical or Mental Health Issue Respondents were asked to identify the presence of a physical or mental health issue. 81% of households reported having a mental health issue and 43% reported having a chronic or acute medical condition. Approximately one third (35%) of households indicated having an addiction and 27% indicated having a physical disability. Survey Question: Do you identify as having any of the following? 90% 80% 81% 70% 60% 50% 40% 30% 43% 27% 35% 20% 10% 0% Chronic or Acute Medical Condition Physical Disability Addiction Mental Health Issue Child Welfare 10 households (27%) indicated having spent time in foster care and/or in a group home. 26 households reported no history of foster care and 1 household declined to answer. Survey Question: Have you been in foster care and/or a group home? Declined to answer 3% Yes 27% No 70% 51 17
28 2018 County of Frontenac & Rural Kingston Homelessness Enumeration Results Report Exhibit A Source of Income Nearly all households surveyed (89%) reported having a formal source of income. Welfare/Income Assistance was the most common source of income, with 51% of households in receipt of social assistance. One household reported Informal/Selfemployed as the source of income; this response includes activities such as panhandling or returning bottles. Three households declined to answer this question. Note that the sum of responses is greater than 100% as several households reported more than one source of income. Survey Question: What is your income source? 60% 50% 51% 40% 30% 20% 10% 0% 5% 11% 22% 5% 8% 8% 3% 8% Seniors Benefit Welfare/Income Assistance GST Refund Disability Benefit Employment Employment Insurance Child and Family Tax Benefits Informal/Self-Employed Decline to Answer 18 52


29 2018 County of Frontenac & Rural Kingston Homelessness Enumeration Results Report Exhibit A Households new to the County Of the 37 surveys completed, 12 households indicated they had moved to the County of Frontenac or rural Kingston area within the last year. 23 households indicated they had not move to the area within the last year, and 2 declined to answer. Survey Question: Did you move to the County of Frontenac or rural Kingston in the past year? Decline to Answer 5% No 62% Yes 33% 19 53


30 2018 County of Frontenac & Rural Kingston Homelessness Enumeration Results Report Exhibit A Place of Origin Of the 12 households that indicated they were new to the County of Frontenac or rural Kingston within the last year, four stated they had moved from Kingston, and two from Gananoque. Other cities/regions identified included Ottawa, London, Belleville, and Leeds and Grenville. Two households declined to answer this question. Survey Question: If you moved to the County of Frontenac or rural Kingston in the last year, where were you living prior to coming here? Belleville 8% Decline to Answer 17% Gananoque 17% Leeds and Grenville 8% Ottawa 8% London 8% Kingston 34% 20 54
31 2018 County of Frontenac & Rural Kingston Homelessness Enumeration Results Report Exhibit A Interaction with emergency services Respondents were asked about involvement with emergency services in the last 12 months. Many households declined to answer these questions. Of the households that responded, or those who indicated a number other than zero, seven households indicated having been hospitalized one to two times, and one household reported attending more than five times in the last 12 months. Five households reported having used emergency medical service (such as ambulance) in the last 12 months while three households reported visiting the emergency department. Four households reported having one to two interactions with police over the last 12 months, and of them, one household disclosed having attended prison or jail Survey Question: In the past year, how many times have you: to 2 times 3 to 4 times 5+ times 1 0 Been hospitalized Used emergency medical service Visited emergency room Had police interaction Attended prison/jail 21 55
32 2018 County of Frontenac & Rural Kingston Homelessness Enumeration Results Report Exhibit A Barriers to Permanent Housing More than three-quarters (81%) of households surveyed indicated their greatest barrier to securing permanent housing was not enough income, followed closely by high rent costs, which was cited by 70% of respondents. 62% of households indicated appropriate housing was not available, while 43% cited mental health issues as a barrier to housing. Survey Question: What barriers are keeping you from having permanent housing right now? 90% 80% 70% 60% 81% 70% 62% 50% 40% 35% 43% 35% 30% 24% 22% 20% 10% 0% 14% Unemployment Not enough income Rent is too high Family/relationship conflict or 11% Eviction(s) Health problems/disability issues Substanse abuse/addiction Mental health issues 8% Criminal history Housing options undesirable/not Housing not available 0% Don't want housing 8% 3% 3% 0% 3% Other - unspecified Other - fire Other - transportation None of the above Decline to answer 22 56
33 2018 County of Frontenac & Rural Kingston Homelessness Enumeration Results Report Exhibit A Youth Homelessness In an effort to help identify trends in youth homelessness, secondary schools in the Limestone District School Board and the Algonquin & Lakeshore Catholic District School Board report on the number of students that are perceived to be homeless each year. Beginning in 2013, schools have provided the number of students perceived to be absolutely homeless, transitionally housed, and precariously housed (couch surfing). This number is estimated on a specific day each year to ensure consistency and provide data that can be meaningfully compared. Although this information was not gathered as part of the survey, it provides an indicator of the homeless population as it captures youth that would not be counted under traditional enumeration methods. The school board homelessness data includes secondary schools in the County of Frontenac which include Sydenham High School and Granite Ridge High School. In 2018, 26 students attending these schools were perceived to be precariously housed. There were no students reported by these schools to be either absolutely homeless or transitionally housed
34 2018 County of Frontenac & Rural Kingston Homelessness Enumeration Results Report Exhibit A Comparison of Rural Homeless Populations: 2013, 2016 & 2018 Rural Homelessness Enumeration Characteristic Number homeless Number of households Average length of homelessness 7 months 4 months 7 months Percent chronically N/A 47% 62% homeless 2 Percent unsheltered 3 2% 40% 19% Percent hidden homeless 4 83% 25% 75% Female 5 63% 53% 43% Average Age Youth (age 16-24) 14% 17% 24% Indigenous(self-identified) 37% 43% 46% 2 Chronically homeless refers to those experiencing homelessness for six months or more in the last 12 months. This figure is not available for 2013 as the Canadian definition of chronic homelessness was developed after the completion of the 2013 count. 3 Unsheltered refers to those experiencing homelessness without a suitable shelter including sleeping rough, in tents or makeshift structures, vehicles, etc. 4 Hidden homelessness refers to those who identified as couch surfing or staying temporarily with friends or family. 5 Percent female and percent male do not equal 100% as there were several dependents included in surveys for which gender was not specified
35 2018 County of Frontenac & Rural Kingston Homelessness Enumeration Results Report Exhibit A The 2013, 2016, and 2018 enumeration processes identified 54, 30, and 61 persons respectively that were provisionally accommodated or living unsheltered. It is important to note the apparent increase in homelessness from 2016 to 2018 can in part be explained by a more extensive advertising program conducted in advance of the enumeration period in order to encourage greater participation. In 2018, the project was promoted through posters, social media, local newspaper advertising, and coordination with local social service providers. Given the increased advertising of the project, the increase in households identified as homeless was anticipated. Several notable trends were noted comparing the 2013, 2016, and 2018 data: A greater portion of participating households were found to be chronically homeless in 2018 relative to This figure was not available for 2013 as the definition of chronic homelessness had not been developed at the time 70% 60% 50% 40% 30% 20% 10% 47% Chronically homeless 62% 0% There was a significant increase in the number of households living unsheltered between 2013 and The 2016 report also cited a decline in the number of participants couch-surfing, suggesting that friends and family were becoming less able to provide temporary accommodation. Interestingly, this dynamic seems to have shifted again in 2018; fewer than half as many households were living unsheltered in 2018 compared to 2016, and the percentage of households experiencing hidden homelessness has tripled. It is encouraging to see that despite longer episodes of homelessness, the number of unsheltered persons has decreased by 53%. The majority of 2018 survey respondents indicated they were staying with friends or family, with only a small percentage of respondents living rough, in makeshift shelters or in vehicles

36 2018 County of Frontenac & Rural Kingston Homelessness Enumeration Results Report Exhibit A 45% 40% 35% 30% 25% 20% 15% 10% 5% 0% Percent Unsheltered 40% 19% 2% % 80% 70% 60% 50% 40% 30% 20% 10% 0% Hidden Homelessness 83% 75% 25% The survey results indicate a decline in the number of females experiencing homelessness in the area, including a 19% decrease in the number of females experiencing homelessness in 2018 compared to

37 2018 County of Frontenac & Rural Kingston Homelessness Enumeration Results Report Exhibit A Females 70% 60% 50% 40% 63% 53% 43% 30% 20% 10% 0% Indigenous persons in the County continue to be overrepresented in the homeless population. There was a slight increase in the number of Indigenous persons experiencing homelessness from 2013 to 2016; however, the number of households that self-identified as Indigenous in 2018 remained relatively the same as in Similar to previous years, the main barrier to housing remains unaffordable rents/insufficient income. The average age of those identified as homeless (including dependents) was 33 in 2018, 5 years lower than in This figure includes dependents, but does not include partners, as survey respondents were not asked to disclose the age of their partner. The number of youth experiencing homelessness has continued to increase since
38 2018 County of Frontenac & Rural Kingston Homelessness Enumeration Results Report Exhibit A Conclusion The 2018 homelessness enumeration project provides valuable insight into the scope of homelessness in rural Kingston and the County of Frontenac. Conducting enumeration at regular intervals provides consistent data points that can be meaningfully compared over time to identify trends and measure progress. The 2018 project identified an increase in the number of households experiencing homelessness, but given the enhanced advertising initiatives, this change is believed to capture a more accurate picture of the scope of homelessness in the region rather than signify an increase in the homeless population. Additionally, although similar methodologies were adopted for each project, each year had slightly different practices including advertising methods and number of participating agencies. These factors should be considered when comparing data points from year-to-year. Conducting homelessness enumeration at regular intervals will continue to provide additional data points that will allow service providers to identify trends with more accuracy and design policies and programs accordingly. There are several positive outcomes to take away from the 2018 survey results, including an ongoing decrease in number of females experiencing homelessness and fewer individuals sleeping unsheltered. Extremely low vacancy rates and a lack of affordable housing have likely contributed to people experiencing longer episodes of homelessness and in many cases, becoming chronically homeless. Understanding this shift in the experience of homeless individuals will offer service providers a better understanding of how to serve this population as we continue in our plan to end homelessness. The data collected will be provided to the Province of Ontario to support the development of a province-wide perspective of homelessness. In addition the information will be used to inform the five-year review of the 10-Year Municipal Housing and Homelessness Plan scheduled for Participating Agencies The City of Kingston would like to thank the following agencies for their participation in this important study: South Frontenac Community Services Rural Frontenac Community Services Addictions & Mental Health Services KFL&A City of Kingston, Housing and Social Services 62 28
39 2018 County of Frontenac & Rural Kingston Homelessness Enumeration Results Report Exhibit A Appendix A: The Survey 29 63
40 2018 Rural Homelessness Enumeration Survey Tool County of Frontenac & Rural Kingston Screening Process Hello, my name is. We re doing a survey to help provide better programs and services to people experiencing homelessness. It takes about 10 minutes to complete. Participation is voluntary and your name will not be recorded. You can choose to skip any question or to stop the interview at any time. Results will contribute to the understanding of homelessness in our community and across Canada, and will help with research to improve services. A. Are you willing to participate in the survey? [YES: Go to B] [NO: Thank and tally if presenting indicators of homelessness] Exhibit A B. Have you answered this survey with anyone at another agency in the County (between April 3 rd & April 20 th or in Kingston on April 11 th )? [YES: Thank] [NO: Go to C] C. Do you have a permanent residence to return tonight? YES NO DON T KNOW DECLINE TO ANSWER D. Where are you staying tonight? [DO NOT READ CATEGORIES] a) Decline to answers c) Decline to answer b) Own home or apartment d) Someone else s place (friend or family) e) Motel or hotel f) Hospital, jail, prison, remand centre g) Emergency shelter h) Transitional housing i) Public space (e.g. park, forest, etc.) j) Vehicle (car, van, RV, truck) k) Makeshift shelter, tent, garage, shack, hunt camp l) Abandoned / vacant building m) Other (ask participant to specify) n) Participant doesn t know BEGIN SURVEY AND NOTE RESPONSES TO THANK do not proceed with survey C & D IN QUESTIONS 1a and 1b 64
41 Exhibit A SURVEY DETAILS De-duplication Information Interviewer to complete this section following screening questions and completion of consent form First Name Initial Birth Month Birth Year Agency: Time: AM / PM Interviewer: In-Person or Phone-In Consent: In-person survey (review consent with participant and provide signed copy) Phone-in survey (read and confirm consent) SURVEY QUESTIONS 1a. Do you have a permanent residence that you can return to tonight? [Circle response] a. YES b. NO c. DON T KNOW d. DECLINE TO ANSWER 1b. Where are you staying tonight? [Record answer here] Decline to answer Someone else s place (friend or family) Motel or hotel Hospital, jail, prison, remand centre Emergency shelter Transitional housing Public space (e.g. park, forest, etc.) Vehicle (car, van, RV, truck) Makeshift shelter, tent, garage, shack, hunt camp Abandoned / vacant building Other (ask participant to specify) Participant doesn t know 2. In total, how much time have you been homeless over the past year? IF UNSURE [Circle response] LENGTH DAYS / WEEKS / MONTHS BEST GUESS: 0-2 MONTHS DON T KNOW 3-5 MONTHS DECLINE TO ANSWER 6-12 MONTHS 3. In total, how many different times have you experienced homelessness over the past year? [Includes this time. Best estimate.] IF [Circle response] NUMBER OF TIMES UNSURE: 1 TIME [current episode] DON T KNOW 2 TIMES DECLINE TO ANSWER 3 OR MORE TIMES 4. What happened that caused you to lose your housing most recently? [Do not read the options. Check boxes for all that apply. Housing does not include temporary arrangements (e.g., couch surfing) or shelter stays.] ILLNESS OR MEDICAL CONDITION FAMILY CONFLICT: PARENT OR ADDICTION OR SUBSTANCE USE GUARDIAN JOB LOSS LEFT CARE (CHILD PROTECTION)/(PROV. EVICTED: UNABLE TO PAY RENT TERM) EVICTED: OTHER REASON INCARCERATED (JAIL OR PRISON) DOMESTIC ABUSE: SPOUSE OR PARTNER HOSPITALIZATION OR TREATMENT DOMESTIC ABUSE: PARENT OR GUARDIAN PROGRAM FAMILY CONFLICT: SPOUSE OR PARTNER DON T KNOW UNSAFE HOUSING CONDITIONS DECLINE TO ANSWER 65 OTHER REASON:
42 Exhibit A 5. How old are you? [OR] What year were you born? [If unsure, ask for best estimate] DECLINE TO AGE OR YEAR BORN DON T KNOW ANSWER 6. Do you identify as Indigenous/Aboriginal or do you have Indigenous/Aboriginal ancestry? This includes First Nations, Métis, Inuit, with or without status. [If yes, please follow-up to specify.] YES If YES: FIRST NATIONS NO INUIT DON T KNOW MÉTIS DECLINE TO ANSWER NON-STATUS / INDIGENOUS ANCESTRY 7. People may identify as belonging to a particular racial group. For example, some people may identify as Black or African-Canadian, other people may identify as Asian or South Asian and other people may identify as white. What racialized identity do you identify with? [Do not list categories. Select all that apply] INDIGENOUS OR ABORIGINAL ARAB ASIAN (e.g. CHINESE, KOREAN, JAPANESE, ETC) SOUTH-EAST ASIAN (e.g. EAST INDIAN, PAKISTANI, SRI LANKAN, ETC.) WEST ASIAN (e.g. IRANIAN, AFGHAN, ETC.) BLACK OR AFRICAN-CANADIAN FILIPINO HISPANIC OR LATIN AMERICAN WHITE (e.g. EUROPEAN-CANADIAN) OTHER (PLEASE SPECIFY) DON T KNOW DECLINE TO ANSWER 8. What gender do you identify with? [Do not read categories. Show list to respondent] MALE/MAN TRANSGENDER DON T KNOW FEMALE/WOMAN OTHER DECLINE TO ANSWER TWO-SPIRIT RESPONSE 9. How do you describe your sexual orientation, for example straight, gay, lesbian? [Show list to respondent.] STRAIGHT/HETEROSEXUAL GAY LESBIAN BISEXUAL TWO-SPIRIT QUESTIONING QUEER OTHER RESPONSE DON T KNOW DECLINE TO ANSWER 66
43 Exhibit A 10. In what language do you feel best able to express yourself? ENGLISH FRENCH NO PREFERENCE OTHER RESPONSE DON T KNOW DECLINE TO ANSWER 11. What family members will stay with you tonight? NONE OTHER ADULT PARTNER DECLINE TO ANSWER CHILD(REN)/DEPENDENT(S) [indicate age for child/dependent] GENDER AGE 12. Have you ever had any service in the Canadian Military or RCMP? [Military includes Canadian Navy, Army, or Air Force] YES, MILITARY NO DON T KNOW YES, RCMP 13. Do you identify as having any of the following? a) CHRONIC/ACUTE MEDICAL CONDITION YES NO DON T KNOW DECLINE TO ANSWER b) PHYSICAL DISABILITY YES NO DON T KNOW DECLINE TO ANSWER a) ADDICTION YES NO DON T KNOW DECLINE TO ANSWER a) MENTAL HEALTH ISSUE YES NO DON T KNOW DECLINE TO ANSWER 14. Have you ever been in foster care and/or a group home? YES NO DON T KNOW DECLINE TO ANSWER DECLINE TO ANSWER 67
44 Exhibit A 15. What are your sources of income? [Read list and check all that apply] SENIORS BENEFITS (E.G., CPP/OAS/GIS) EMPLOYMENT CHILD AND FAMILY TAX BENEFITS INFORMAL/SELF-EMPLOYMENT (E.G., GST REFUND BOTTLE RETURNS, PANHANDLING) MONEY FROM FAMILY/FRIENDS EMPLOYMENT INSURANCE OTHER SOURCE WELFARE/INCOME ASSISTANCE NO INCOME DISABILITY BENEFIT DECLINE TO ANSWER 16a. Did you move to the County of Frontenac or rural Kingston in the past year? DECLINE TO YES NO DON T KNOW ANSWER 16b. If you moved to the County of Frontenac or rural Kingston in the last year, where were you living prior to coming here? COMMUNITY NAME PROVINCE OR COUNTRY DON T KNOW DECLINE TO ANSWER 17. Did you come to Canada as an immigrant or refugee within the past 5 years? DECLINE TO YES NO DON T KNOW ANSWER 18. In the past year (12 months), how many: [Ask respondents to give their best estimate] TIMES YOU HAVE BEEN HOSPITALIZED # DAYS IN TOTAL YOU HAVE SPENT HOSPITALIZED Days TIMES HAVE YOU USED EMERGENCY MEDICAL SERVICE # TIMES HAVE YOU BEEN TO A HOSPITAL EMERGENCY # ROOM TIMES HAVE YOU HAD INTERACTIONS WITH THE POLICE # TIMES YOU HAVE BEEN TO PRISON/JAIL # DAYS IN TOTAL YOU HAVE SPENT IN PRISON/JAIL Days 19. What barriers are keeping you from having permanent housing right now? [Do not read the options. Check all that apply.] UNEMPLOYMENT NOT ENOUGH INCOME RENT IS TOO HIGH FAMILY/RELATIONSHIP CONFLICT OR BREAKDOWN EVICTION(S) HEALTH PROBLEMS /DISABILITY ISSUES SUBSTANCE ABUSE / ADDICTION MENTAL HEALTH ISSUES CRIMINAL HISTORY HOUSING OPTIONS UNDESIRABLE / NOT SUITABLE HOUSING NOT AVAILABLE DON T WANT HOUSING OTHER (PLEASE SPECIFY) NONE OF THE ABOVE DECLINE TO ANSWER 68


45 69 Exhibit B


46 70 Exhibit B
47 Exhibit B Table of Contents Key Findings... 3 Overview... 4 Survey Results Highlights PiT Count Background... 8 Housing and Homelessness Updates PiT Count Methods PiT Count Limitations Results Homeless Populations Absolute Homelessness Precarious Housing Demographics Gender Age Indigenous / Aboriginal Communities Racial Identity Language Sexual Orientation Veteran Status Foster Care Physical and Mental Health Survey Data Sleeping Arrangements Shelter Occupancy Duration of Homelessness Age of First Episode Reasons for Housing Loss Geography and Immigrant / Refugee Status Sources of Income Level of Education Service Usage Barriers to Housing Youth-Specific Data and Demographics Comparative Data Conclusion

48 72 Exhibit B
 Homeless Count in urban Kingston as part of the nationally coordinated PiT count. A total of 81 people were found to be absolutely homeless on April 11, 2018.")
49 Exhibit B Overview On April 11, 2018, United Way KFLA, through a grant from Employment and Social Development Canada s Homelessness Partnering Strategy (HPS), conducted a coordinated Point in Time (PiT) Homeless Count in urban Kingston as part of the nationally coordinated PiT count. A total of 81 people were found to be absolutely homeless on April 11, Absolute homelessness refers to those individuals who are unsheltered or sleeping rough, and those who are emergency sheltered. These individuals were staying in an emergency shelter, domestic violence shelter, an institution, or in public spaces on the night of the count. Employment and Social Development Council defines emergency shelters as: Facilities providing temporary, short-term accommodation for homeless individuals and families. This may or may not include other services such as food, clothing or counselling. 1 An additional 59 individuals were staying in transitional housing. The HPS defines transitional housing as: Housing facilities that provide services beyond basic needs and that, while not permanent, generally allow for a longer length of stay than emergency housing facilities (up to three years). These facilities offer more privacy to residents than emergency housing. Transitional housing is targeted to those in need of structure, support, and/or skill-building to move from homelessness to housing stability, and ultimately to prevent a return to homelessness. 2 1 Employment and Social Development Canada, Shelter Capacity Report Employment and Social Development Canada, Homelessness Partnering Strategy Directives

50 Exhibit B A total of 12 survey respondents who did not have a permanent residence were sleeping at a motel or at someone else s place. These individuals are considered to be a part of the hidden homeless population, as they lack permanent housing but often do not interact with the homelessness system and service providers. As is the case with any homeless count, this should be considered the minimum number of people experiencing homelessness on that night. Those who are precariously housed, living in motels, or couch-surfing are not all captured. Absolute Homelessness Of the 152 people encountered, 81 were experiencing absolute homelessness. Of these 81 individuals, 60 or 74% were sheltered, meaning they slept in an emergency shelter, domestic violence shelter, or an institution such as a detox centre, hospital, or remand centre on the night of the count. 13 or 16% were unsheltered, meaning that they were sleeping in parks, tents, or on the streets on the night of April people or 10% did not know where they would be sleeping that night. 74
51 Exhibit B Survey Results Highlights The Canadian Observatory on Homelessness defines homelessness as the situation of an individual or family without stable, permanent, appropriate housing, or the immediate prospect, means and ability of acquiring it. Homelessness describes a range of housing and shelter circumstances, with people being without any shelter at one end, and being insecurely housed at the other. 3 A total of 152 people were encountered on the night of April 11, 2018 who meet the criteria of the Canadian definition of homelessness. Of these individuals, 98 agreed to complete brief surveys in order to capture demographic and experiential data. The statistics that follow represent those who were surveyed. 55% are women Kingston has a much higher rate of female homelessness than other Canadian cities 86% are sheltered 48% were found in emergency or domestic violence shelters, 40% were living in transitional housing, 5% were staying at a motel, and 7% were couch surfing 183 days The median length of time people spent homeless within the past year 188 days The average length of time people spent homeless within the past year 31 years old The average age of people experiencing homelessness 50% are chronically homeless One half of respondents have been homeless for 6 months or more in the past year 3 Canadian Observatory on Homelessness, Canadian Definition of Homelessness 75

52 Exhibit B 16% are episodically homeless Almost one sixth of respondents have been homeless 3 or more times in the past year 78% receive income assistance OW and ODSP are the main sources of income for people experiencing homelessness 49% say they don t have enough income to afford housing 44% say rents are too high to be affordable; 41% say housing is not available 12 families 12 families were found homeless, including 19 children 76
53 Exhibit B 2018 PiT Count Background A Point-In-Time (PiT) Homeless Count is a snapshot of individuals and families experiencing homelessness that collects numerical and basic demographical information at a single point in time. There are two primary purposes of conducting a PiT count: A count of people experiencing absolute homelessness: It is intended to identify how many people in a community experience homelessness in shelters and on the streets at a given time. Conducted over several years, PiT Counts can be used by the community to track progress in reducing homelessness. A survey of the homeless population: Through an accompanying survey, the Count gives the community information on the demographics and service needs of their homeless population. This information can be used to target community resources to where they are most needed. 4 Individuals enumerated include those staying in emergency shelters, domestic violence shelters, transitional housing, police custody, detox programs, and those staying outdoors in parks, makeshift shelters, on the streets, and in other public areas. A PiT Count is the best available method of obtaining an accurate picture of the number of people experiencing homelessness in urban centres, but its limitations must be considered. For example, a PiT Count is unable to capture all of those persons experiencing hidden homelessness, who may be staying at a friend s house or living in a motel room. Additionally, the unsheltered count relies on volunteers to find those experiencing homelessness in public areas, and some who may not appear to be homeless, who are well-hidden, or who are actively avoiding being counted may be missed. All PiT counts, due to their inherent limitations, underrepresent the total number of people experiencing homelessness in a given community. The findings from this PiT count should therefore be considered the minimum number of people that were homeless in Kingston on the night of April 11, Through a grant from ESDC s Homelessness Partnering Strategy (HPS), United Way KFL&A in consultation with the City of Kingston conducted Kingston s third PiT homeless count as part of the second nationally coordinated count on the evening of April 11, Shelter and transitional housing occupancy totals were obtained from the Homeless Individuals and Families Information System (HIFIS), a city-wide database used by all homelessness service providers in KFL&A to track demographics and services accessed by people experiencing homelessness. A comprehensive outdoor enumeration and surveys were also conducted to capture the most accurate number possible of people experiencing homelessness. Surveys were administered at shelters and transitional housing units to obtain demographic and experiential data on those homeless individuals who are sheltered. 4 Employment and Social Development Canada, Guide to Point-In-Time Counts in Canada of the Homelessness Partnering Strategy 77
54 Exhibit B The City of Kingston, as Service Manager for the County of Frontenac, also conducted a separate enumeration of people living in rural areas of our community who were currently homeless or experiencing housing vulnerability. This was the second rural homelessness enumeration, the first being conducted in 2016, to better understand the extent of challenges associated with rural homelessness. In partnership with local social service providers, anonymous surveys were completed at three rural social services providers located in Sydenham, Verona and Sharbot Lake, between April 9 to April 13 and April 16 to April 20, The Frontenac and Rural Kingston Homelessness process was timed to intentionally coincide with the Urban Kingston Point-in-Time Count. A separate report has been developed by the City of Kingston on the findings of the 2018 rural homelessness study also marks the first provincially mandated homeless enumeration in Ontario. All Service Managers in the province of Ontario were required to perform an enumeration of homeless individuals in To meet this requirement, United Way KFL&A and the City of Kingston worked together to ensure that surveys for both the 2018 Urban Kingston PiT Count and Rural Homelessness Enumeration were designed to align with the national and provincial directives. Common procedures, tools, and timelines were implemented to ensure comparability of results and the reliability of aggregating regional, provincial, and national data. United Way KFLA had a dedicated PiT Count Coordinator who provided support to the planning phase of this initiative, and who was primarily responsible for the implementation of the 2018 Urban Kingston Point in Time Count. United Way facilitated the recruitment and training of over 80 volunteers who canvassed 22 designated (high/medium) areas that were determined based on where homeless individuals are known to be. This included the elimination of one survey zone previously canvassed in 2013 and 2016, and the addition of two new survey zones due to migration of homeless individuals into our City s west end. Special teams were created to survey the hot spots in Kingston such as tent cities, abandoned buildings, forested areas, and public parks where people experiencing homelessness are known to frequent. These teams each included individuals with knowledge of and experience working with homeless populations, including front-line service providers. Support workers in 5 emergency shelters and 7 transition houses conducted interviews with clients and residents to provide survey data from these individuals on the night of the count. All volunteers attended a training session immediately before deploying to their designated areas to conduct surveys on the night of the PiT Count. They were instructed to survey everyone they encountered, using questions from a screening tool to determine whether or not the person they were interviewing was experiencing homelessness. If the person was homeless, volunteers conducted the full survey after obtaining consent. If the person was not homeless, volunteers discontinued the survey process and recorded the interaction on a tally sheet. If any person declined to participate in the survey, but volunteers perceived evidence that the person was experiencing homelessness (i.e. carrying bag of belongings, sleeping bag, blankets, sleeping on a bench or vehicle, etc.), they recorded the person as observed homeless on a tally sheet, including their perceived age and gender. 78

55 Exhibit B Housing and Homelessness Updates Since 2013, there have been significant changes to the City of Kingston s approach to housing and homelessness. These shifts in strategic direction and service provision align with the City of Kingston s 10-Year Municipal Housing & Homelessness Plan, adopted in The City has adopted a Housing First approach to address the most vulnerable populations experiencing chronic homelessness. Housing First is defined as: A specific type of intervention which seeks out homeless people that have complex and cooccurring issues, and serves those with the highest acuity first with minimal pre-conditions, such as housing readiness. The only real expectation that the person agrees to before starting the program is to have their support workers visit them in the home, to pay rent on time, and to work hard to avoid disrupting others that might lead to eviction. 5 In 2017 alone, 122 highly vulnerable homeless households were housed through the Housing First program. 185 households were housed from the Social Housing Registry wait list in An additional 89 households from the Social Housing Registry wait list have been housed as of July 31, *2018 data represents statistics from January 1 to July 31, City of Kingston Housing and Social Services Department, 10-Year Municipal Housing & Homelessness Plan 6 City of Kingston Housing and Social Services Department, City of Kingston & County of Frontenac 2017 Report on Housing & Homelessness 79

56 Exhibit B Kingston s vacancy rate continues to fluctuate. In 2015 the vacancy rate was 2.8%, in 2016 it dropped slightly to 2.6%, and in 2017 it was the lowest in Ontario at 0.7%. The average market rent in Kingston also continues to rise disproportionately to the housing allowances for social assistance. 7 There have also been considerable changes to the shelter system since The Elizabeth Fry Society of Kingston opened a 6-bed shelter for vulnerable women and women involved in or at risk of becoming involved in the justice system in July of 2015, which was expanded to an 8-bed capacity in March During an operational review of homeless services beginning in August 2017, the Elizabeth Fry Society notified the City of Kingston that it no longer had the capacity to run the emergency shelter program, but agreed to deliver the program until April 30, 2018 to ensure continuation of services specific to women. An RFI was issued for the provision of emergency shelter beds for vulnerable women, and Kingston Home Base Non-Profit Housing was selected to operate 6 women s emergency shelter beds. These beds will be co-located at In From the Cold, Home Base Housing s co-ed adult emergency shelter, but renovations will be completed to provide a segregated women-only space for these clients. These beds are to become operational on May 1, As of May 1, 2017, there was a reduction in the number of emergency shelter beds in Kingston from 86 to 71. Since the reduction, there has been a maximum monthly shelter bed utilization of 78% of capacity, and the City has developed a Service Standard to establish a protocol for motel stays in the case that shelters are at capacity. 7 City of Kingston Housing and Social Services Department, 2017 Report on Housing & Homelessness in the City of Kingston & County of Frontenac 80
57 Exhibit B Methods To ensure a more accurate number and utilize resources most efficiently, the following techniques were used to enhance data quality: 1. Working with the City of Kingston housing staff to prioritize all neighbourhoods based on where people experiencing homelessness are known to frequent, as well as the density of the known homeless population (i.e. high priority [5+ individuals], medium priority [2-4 individuals], and low priority [0-1 individuals]. 2. Engaging with police, shelter staff, and social service agencies to identify specific hot spots such as camp sites, abandoned buildings, and forested areas where homeless individuals are known to be. Special teams were assigned to survey these areas. 3. Instructing volunteers to engage with everyone encountered, regardless of appearance (not just those that may look homeless). During the planning stages, the PiT Count Coordinator worked to engage the local community and the homelessness services sector. The United Way Homelessness Partnering Strategy (HPS) Community Advisory Board (CAB) acted as the oversight committee. The Coordinator developed plans and organized logistics for survey development, community engagement, and volunteer recruitment. The PiT Coordinator engaged in the creation and review of the survey with input from social service agencies, community stakeholders, and key informants. The unsheltered count locations were defined, logistics for the day of the count were determined, and volunteers were recruited from a variety of sources. The Coordinator then reviewed volunteer applications and assigned volunteers to appropriate teams. On the night of April 11, the PiT Count Coordinator led volunteer training and managed the base command centre, accounting for all documentation and returning volunteers. Following the Count, the Coordinator oversaw data cleaning, data entry into HIFIS, and the analysis of results. The PiT Count survey was developed in consultation with the City of Kingston, which coordinated the first PiT Count in The 15 core questions recommended by the Canadian Observatory on Homelessness (COH) were used, as well as several of the sub-set questions from the same source. The survey was also aligned with the provincially mandated homeless enumeration process. Additional community questions were added in consultation with key stakeholders. Follow-up meetings were scheduled with shelter and transitional housing providers and community agencies to seek their feedback on questions and methodology, and engage them in the PiT Count process. As a result, many front line staff volunteered to take part in the PiT Count. This facilitated the implementation of the plan and ensured that every survey team had at least one person with experience or knowledge in working with this population. In addition to inviting volunteers from organizations and the community at large, the process included targeting individuals from specific groups such as City of Kingston Housing and Social 81
58 Exhibit B Services department staff, Queen s University and St. Lawrence College students (i.e. urban planning, policy studies, police foundations, behavioural science, community & justice, psychology, public health, medicine, nursing, social services, etc.), shelter and transitional housing staff, service providers, HPS CAB members, United Way board members and volunteers. Volunteers were assigned to teams of 2-3 people, with at least one individual having experience working with homeless populations, and ensuring a mix of male and female volunteers. Two special teams were created that each included experienced front line staff to survey areas that had been identified as hot spots. All high and medium priority neighbourhoods were thoroughly canvassed and surveyed. The majority of low priority neighbourhoods are suburban and geographically widespread. During Kingston s 2013 PiT Count, few to no individuals experiencing homelessness were encountered in these areas. As such, low priority neighbourhoods were not surveyed in 2016 or Each volunteer was given a tally sheet on which they listed their name and indicated the survey zone number they were responsible for. Surveys were numbered so that they could be matched with the corresponding volunteer and tally sheet. These were reviewed to detect and correct omissions and inaccuracies (i.e. if the question Where are you staying tonight? was left blank, but the survey was conducted at an emergency shelter, Emergency Shelter / Domestic Violence Shelter was assumed during the data cleaning process). Individuals who elected to participate in the survey were offered an honorarium consisting of a string backpack that contained a pair of socks, Tim Hortons gift card, 2-ride bus transit pass, granola bar and juice box, 211 card and other information pamphlets about community housing and homelessness services including services geared toward specific populations such as Aboriginal peoples and veterans. Of the 152 people encountered, 98 consented to complete the survey. The experiential results in this report reflect the data collected through the 98 survey respondents. Limitations Though a Point-in-Time Count is the most comprehensive methodology for enumerating and facilitating the collection of data on people experiencing homelessness, its limitations must be considered in full. When conducted over several years, PiT Counts can be used to measure community progress in reducing homelessness. By focusing on a single day, the count will not include some people who cycle in and out of homelessness. What it will do, is provide an estimate of how many of these people are homeless at a given time. 8 8 Employment and Social Development Canada, Guide to Point-In-Time Counts in Canada of the Homelessness Partnering Strategy 82

59 Exhibit B It is important to note that any PiT Count under-represents the number of people experiencing homelessness, and that the results should therefore be taken as the minimum value. There are likely to be additional people experiencing homelessness who were not counted. However, through this process we know that there were at least 93 people who were homeless and an additional 59 people living in time-limited transitional housing on the night of April 11, Homeless persons enumerated in outdoor spaces were only counted if they were encountered on public property, or in participating indoor locations (such as Kingston Street Mission). If people who are homeless are indoors in non-participating locations, they are not counted. This includes those who are couch-surfing, living in a motel, sleeping in ATM foyers, or other comparable arrangements. Finally, it is also important to note the weather on the night of the count. On April 11 th there was moderate rain prior to and during the time of the count which may have reduced the number of homeless people who were outdoors in public spaces. It is possible that some individuals took shelter in alternate locations to avoid the weather and were not encountered. It is possible that some people who would typically be sleeping rough were not counted on the night of April 11, Results Homeless Populations 152 homeless individuals were encountered during the Point in Time Count process. This total includes those who were unsheltered and those staying in emergency or domestic violence shelters (absolute homelessness) as well as individuals living in time limited transitional housing. Some of the individuals encountered and included were couch surfing or staying in a motel with no permanent residence to return to. 83


60 Exhibit B Absolute Homelessness A total of 81 people were found to be absolutely homeless on April 11, 2018, with an additional 59 living in transitional housing and 12 staying at a motel or at a friend s place. Of the 81 people, 58 or 72% were sheltered, meaning that they slept in an emergency shelter or a domestic violence shelter on the night of the count. Two additional people (2%) were found in a hospital, detox centre, or remand centre on the night of the count, and stated that they had No Fixed Address (NFA). 13 people, or 16%, were unsheltered, meaning that they were found in parks, on the streets, or in other public spaces. 8 people, or 10% did not know where they would be sleeping that night. Precarious Housing 59 of the 152 people encountered on April 11, 2018 were living in transitional housing. An additional 5 were staying in a motel, and 7 were staying at someone else s place, or couch surfing. According to the Canadian definition of homelessness, these individuals are considered to be homeless. Their tenure in transitional housing is time limited, and thus they cannot be considered to have attained stable, permanent housing. Similarly, individuals staying at a motel or with a friend who do not have a permanent residence to return to are also considered to be homeless. 84
61 Exhibit B Demographics Gender On the night of April 11 th, 55% of people experiencing homelessness in Kingston were women. If dependent children are excluded, the percentage of adult and independent youth who identify as women increases to 60%. This is atypical to the national rate of the proportion of women experiencing homelessness, based on the results of PiT Counts elsewhere in Canada. Women are more likely to report domestic abuse and family breakdown or conflict as the reason they became homeless compared to men. Of the 98 surveys completed, 59 or 60% of the respondents were women. The 98 survey respondents reported a total of 19 accompanied children. When accompanied children are included in the demographics, 65 (55%) of the 117 are female. Of the 59 adults and independent youth who were women, the average length of time spent homeless within the past year was 6 months. 75% of all female survey respondents had stayed in an emergency shelter within the past year. The average age of female survey respondents was 37 years. When accompanied children are included, the average age is 34 years. 4% of adult / independent youth survey respondents identified as transgender. Of these, 75% were trans women, and 25% were gender non-conforming. People who identify as transgender disproportionately experience violence and discrimination when compared with the cisgender population. 9 9 Mark Cull, Hazel Platzer, & Sue Balloch, Out On My Own: Understanding the Experiences and Needs of Homeless Lesbian, Gay, Bisexual and Transgender Youth 85
.")


62 Exhibit B Age The average age of people experiencing homelessness on the night of the PiT Count was 31 years. The most common age range was The majority of people encountered were adults (58%). Indigenous / Aboriginal Communities During the data collection process, individuals who were experiencing homelessness were asked, Do you identify as Indigenous or do you have Indigenous ancestry? Respondents self-reported whether or not they were indigenous, or could opt not to answer the question. 24% indicated that they were First Nations, Métis, or Inuit. A further 3% said that they had Aboriginal ancestry, and 4% were unsure whether they were Indigenous. 86
63 Exhibit B Racial Identity In 2018, a question was added to the PiT Count survey that asked respondents what racialized identity they identify with. Respondents were asked to indicate all identities that apply. The majority (71%) of respondents identified themselves as white. 14% identified their race as Aboriginal or Indigenous, 4% identified as Black, 4% identified as Arab, 2% identified as Hispanic or Latin American, 1% identified as Asian, 3% said they don t know, and 3% declined to answer. Language An additional question was added to the survey in 2018 that asked participants in what language they feel best able to express themselves. 89% indicated that they were most comfortable communicating in English, 2% in French, 3% had no preference between English and French, 5% were most comfortable expressing themselves in a language other than English or French, and 1% declined to answer. Sexual Orientation As a part of the PiT Count survey, individuals experiencing homelessness were asked how they self-identify in regard to sexual orientation. 17% of survey respondents indicated that they identify as LGBQ+ (lesbian, gay, bisexual, queer), 76% identify as straight / heterosexual, and 7% chose not to answer the question. We know that youth who identify as LGBQ+ are more likely to become homeless than their heterosexual peers due to family conflict and homophobia in the home. 10 Preliminary research is also being conducted that suggests that adults who are LGBQ+ also disproportionately experience homelessness. 11 Of the individuals who identified themselves as LGBQ+, 59% were independent youth. Survey respondents were asked at what age they first experienced homelessness. The average age at which individuals who identified as straight / heterosexual first became homeless was 30 years, while the average age that LGBQ+ individuals first became homeless was 15 years. Veteran Status A total of 5% of respondents indicated that they were veterans who had served in the Canadian Armed Forces. There were no respondents who indicated they had served in the Royal Canadian Mounted Police. Less than 2% of Canadians are veterans, which tells us that the number of people experiencing homelessness within this population in Kingston is somewhat high. 12 However, in both Canada and the United States, veterans are known to be at higher risk of homelessness than the general population. 10 Canadian Observatory on Homelessness, Where am I Going to Go? Intersectional Approaches to Ending LGBTQ2S Youth Homelessness in Canada & the U.S. 11 Dr. John Ecker, A Review of the Literature on LGBTQ Adults Who Experience Homelessness 12 Veterans Affairs Canada, General Statistics 87
64 Exhibit B Foster Care In 2018, a question was added to the PiT Count survey that asked respondents whether they had ever been in foster care or a group home. 30% of participants indicated that they had been in foster care or a group home as a child. The average length of time respondents spent in care was 4.7 years. 34% of those who had been in foster care were youth on the night of April 11, Of the youth (ages 16-24) who completed surveys, 37% had been in foster care. Across Canada, about 43% of homeless youth have been in foster care or group homes. 13 This includes foster youth who have aged out of the system, youth who have left their placement homes due to negative experiences, and youth who returned to their family home or lived with relatives. Physical and Mental Health The 2018 survey included additional local questions that asked respondents about their physical and mental health. 39% indicated that they had a chronic or acute medical condition, and 21% indicated that they had a physical disability. 46% of respondents self-identified as having an addiction. When compared with the general population, a disproportionate percentage of the homeless population in Kingston indicate that they have poor mental health. 78% of survey respondents self-identified as having mental health issues. We know that people with poor mental health are more likely to become homeless, and that experiencing homelessness amplifies symptoms of poor mental health. In general, 30-35% of people (up to 75% of women) experiencing homelessness have mental illnesses, and 20-25% have concurrent disorders (i.e. have severe mental illness and addictions simultaneously) Stephen A. Gaetz, Coming of Age: Reimagining the Response to Youth Homelessness in Canada 14 Laura Munn-Rivard, Current Issues in Mental Health in Canada: Homelessness and Access to Housing 88

65 Exhibit B Survey Data Sleeping Arrangements The 2018 PiT Count found that the majority of individuals experiencing homelessness in Kingston are sheltered. Of the 98 people who completed surveys, the majority indicated that they were sleeping in an emergency shelter, domestic violence shelter, or transition house on the night of April 11, % of respondents indicated that they would be sleeping in an emergency or domestic violence shelter, and 35% were staying in transitional housing. 14% of those who chose to complete a survey were unsheltered. 3% reported that they would be sleeping in a public space, 2% in a vehicle, 1% in another unsheltered location, and 8% did not know where they would be sleeping. 89

66 Exhibit B Shelter Occupancy On the night of April 11, 2018, emergency and domestic violence shelters were operating at 60% capacity. This means that no one who was seeking shelter would need to be turned away due to lack of available beds. However, the Elizabeth Fry emergency shelter for vulnerable women was at capacity, so there is a potential that some women who would be most comfortable in a womenonly space would not have had access to such a space. As previously noted, women are overrepresented in the homeless population in Kingston. 90

67 Exhibit B Duration of Homelessness Kingston s 2018 PiT Count found that 50% of survey respondents had been homeless for 6 months or longer. 26% had been homeless for 0-2 months, and 16% had been homeless for 3-5 months. 5% did not know how long they had been homeless, and 3% declined to answer. The average length of time respondents had spent homeless in the past year was 188 days. 63% of survey respondents reported that they had been homeless only once within the past year. 10% said they had been homeless twice, and 17% said they had been homeless three or more times. 7% did not know how many times they had been homeless, and 3% declined to answer. 10% of respondents had been homeless for 6 months or longer and had been homeless three or more times within the past year. 91

68 Exhibit B Age of First Episode Those who completed surveys were asked at what age they first became homeless in their lives. An alarming proportion of people experiencing homelessness as adults first became homeless as youth, which provides further evidence of the need to focus on both preventative and intervention-based solutions to end youth homelessness. 35% of those surveyed said they were under 25 the first time they were homeless. The City of Kingston s 10-Year Housing & Homelessness Plan hopes to address chronic homelessness. In January of 2015, the City began implementing changes to end chronic homelessness by moving toward a Housing First model through collaboration with community partners in both the public and private sectors in order to better address the housing needs of the chronically homeless population. The City has prioritized an integrated system of housing and individualized supports with coordinated access and service provision in an attempt to move people out of chronic homelessness. 92
, abuse by spouse (21%), family conflict (17% conflict with spouse; 12% conflict with parent), and addictions or substance use issues")
69 Exhibit B Reasons for Housing Loss The most common reasons that survey respondents said they became homeless were unsafe housing conditions (22%), abuse by spouse (21%), family conflict (17% conflict with spouse; 12% conflict with parent), and addictions or substance use issues (16%). 93


70 Exhibit B Geography When individuals were asked how long they had lived in the community, the majority indicated they had been living in the City of Kingston for at least one year. 26% of respondents had lived in Kingston for the entirety of their lives. If respondents indicated that they had not always lived in Kingston, they were asked where they moved from. Immigrant and Refugee Status If respondents indicated that they previously lived in a different country, they were asked if they came to Canada as an immigrant or refugee. 3% of respondents indicated they were immigrants, and 1% indicated they had refugee claimant status. 94
71 Exhibit B Sources of Income The most common method through which people experiencing homelessness obtain money is social assistance such as Ontario Works or Ontario Disability Support Program. 78% of survey respondents reported that they rely on these programs, with 40% receiving support from OW and 38% from ODSP. 2% said they had no sources of income whatsoever. 14% said they obtain money through formal employment. It is important to note that some respondents indicated more than one source of income, as represented in the data below. 95


72 Exhibit B Level of Education Of the 98 survey respondents, 58% had completed high school or post-secondary school. Service Usage The programs/and or services most frequently used by people experiencing homelessness in Kingston include emergency shelters and emergency health services. In the past year, 72% of those surveyed had stayed in an emergency shelter at least once, and 65% had been to the Emergency Room. 96
73 Exhibit B Barriers to Housing People who have become homeless face many barriers to obtaining and maintaining affordable permanent housing. Survey respondents were asked what they felt was preventing them from finding a permanent place to live, and could provide as many answers as necessary to represent their situation. The most common responses were overwhelmingly that they did not have enough income and that rents were too high for them to afford. Close to 50% of respondents reported that they were homeless because they did not have enough income to afford rent, 44% because rents were too high to be affordable, and a further 41% indicated that housing was not available. There are a number of factors that could have contributed to these results. It is important to note that neither Ontario Works nor Ontario Disability Support Program (the two most commonly reported sources of income) provides a housing allowance that is adequate to cover the average cost of rent in Kingston. In addition, the rental vacancy rate in Kingston was the lowest in Ontario in 2017 at 0.7%, 15 making it even more difficult for low-income individuals and families to secure affordable permanent housing. A healthy vacancy rate is considered to be around 3%. Women face specific barriers in comparison with the general population of people who are homeless. Over one third of women reported that the reason for their housing loss was domestic abuse inflicted by a spouse or partner. 19% of women lost their housing due to conflict with a spouse or partner, and a further 32% reported unsafe housing conditions. As with the general population, women cited a lack of financial resources and the cost of rent as their most immediate barriers to housing. 15 City of Kingston & County of Frontenac, 2017 Housing & Homelessness Report 97


74 98 Exhibit B

75 Exhibit B Youth-Specific Data and Demographics We know that youth have a unique experience of homelessness, and that their needs are not always met within adult systems. The following survey findings reflect the experiences and demographics of young people between the ages of who are homeless. The majority of youth surveyed on the night of April 11, 2018 were sheltered. 33% were staying in an emergency or domestic violence shelter, 48% were staying in transitional housing, 7% were couch surfing, 7% did not know where they would be sleeping. 4% were unsheltered and sleeping in a public space. 99


76 Exhibit B 33% of surveyed youth were staying in an emergency shelter or domestic violence shelter on the night of April 11, Of these, 50% identify as female, 40% identify as male, and 10% identify as transgender or gender non-conforming. 48% of surveyed youth were staying in transitional housing on the night of April 11, Of these, 62% identify as female, 31% identify as male, and 8% identify as transgender or gender nonconforming. 7% of surveyed youth were couch surfing on the night of April 11, 2018 Of these, 50% identify as female 50% identify as transgender or gender non-conforming 4% of surveyed youth were sleeping in a public space on the night of April 11, 2018 Of these, 100% identify as male 7% of surveyed youth did not know where they would be sleeping on the night of April 11, 2018 Of these, 100% identify as male 100

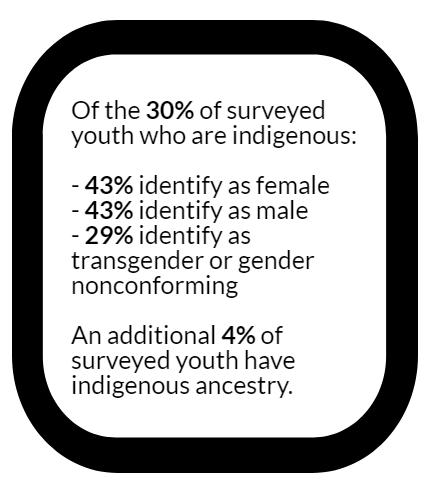
77 101 Exhibit B


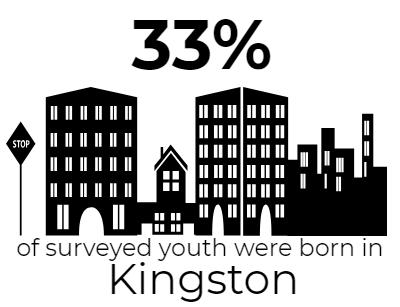

78 102 Exhibit B


79 103 Exhibit B

80 Exhibit B Comparative Data The following charts and graphics provide a comparison between the data collected in Kingston in 2016 and 2018 as a part of the first and second nationally coordinated PiT Counts. 104


81 105 Exhibit B

82 106 Exhibit B

83 107 Exhibit B

84 108 Exhibit B

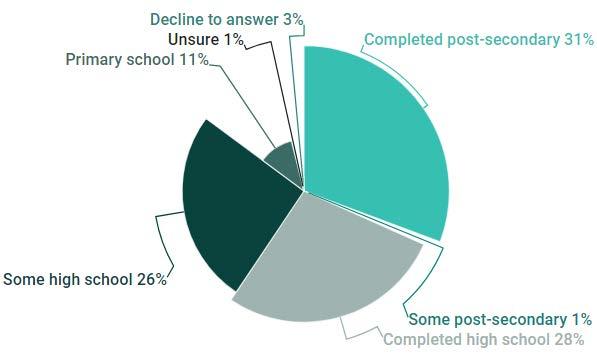
85 109 Exhibit B

86 110 Exhibit B

87 111 Exhibit B
STREET ASSESSMENT STREET ASSESSMENT. results report
 STREET ASSESSMENT 2018 STREET ASSESSMENT results report 2018 Table of Contents Introduction and Highlights... 1 2018 Street Needs Assessment... 1 Overview of Methodology... 1 Key Findings... 3 Overview
National Homelessness Data
 National Homelessness Data Annie Duchesne & Patrick Hunter CAEH Hamilton, ON November 5, 2018 Reaching Home Reaching Home: Canada s Homelessness Strategy will replace the Homelessness Partnering Strategy
Application to stay at Grace Place 10/11
 Intake done by: Applicant Information: Application to stay at Grace Place 10/11 First Name: M.I. Last Name: SSN: DOB: Indicate any other last name you may have received services from the Salvation Army
2016 Coordinated PiT Count
 Overview and Data First Annual Canadian Homelessness Data Sharing Initiative Calgary, Alberta - May 4, 2016 Dr. Patrick Hunter, Policy Analyst Homelessness Partnering Strategy, ESDC Background The PiT
REGINA 2015 HOMELESS COUNT
 REGINA 2015 HOMELESS COUNT FINAL REPORT Prepared by Alina Turner (Principal Researcher, Turner Research & Strategy) and Dagan Harding (Local PIT Coordinator, Regina YMCA ), for the Regina YMCA (July 29,
A Social Profile of the Halton Visible Minority Population
 Halton Social Planning Council and Volunteer Centre A Social Profile of the Halton Visible Minority Population December 2000 Prepared by Ted Hildebrandt Senior Planner Lyn Apgar - Research Associate December
2016 Appointed Boards and Commissions Diversity Survey Report
 2016 Appointed Boards and Commissions Diversity Survey Report November 28, 2016 Neighborhood and Community Relations Department 612-673-3737 www.minneapolismn.gov/ncr Table of Contents Introduction...
Person Completing Form: Agency Completing: Date Form Completed:
 s CoC Program Participant Homelessness Verification Form PART 1: INSTRUCTIONS Complete all fields in Part 2 Complete all relevant fields in Part 3 Attach all supporting documents to this form Maintain
2016 Census: Housing, Immigration and Ethnocultural Diversity, Aboriginal peoples
 October 26, 2017 Backgrounder 2016 Census: Housing, Immigration and Ethnocultural Diversity, Aboriginal peoples The 2016 Census Day was May 10, 2016. On October 25, 2017, Statistics Canada released data
Section/Chapter Title Edmonton Point-in-Time Homeless Count
 Section/Chapter Title 2014 Edmonton Point-in-Time Homeless Count 2014 Edmonton Point-in-Time Homeless Count Page a Acknowledgements The 2014 Edmonton Homeless Count was organized by Homeward Trust under
2016 Edmonton Point in Time Homeless Count Final Report
 2016 Edmonton Point in Time Homeless Count Final Report Summary Edmonton s 2016 Homeless Count occurred on the night of October 19 and during the day on October 20. Approximately 300 volunteers and 40
CENSUS BULLETIN #5 Immigration and ethnocultural diversity Housing Aboriginal peoples
 CENSUS BULLETIN #5 Immigration and ethnocultural diversity Housing Aboriginal peoples October 25, 217 Bulletin Highlights: 86.1 per cent of the Brampton s 216 surveyed population held a Canadian citizenship
Housing needs and preferences of Indigenous people using community resources in Montreal Abridged version
 Housing needs and preferences of Indigenous people using community resources in Montreal Abridged version The full report can be found at http://reseaumtlnetwork.com/network-documents-and-reports/?lang=en
2016 Census Bulletin: Immigration & Ethnic Diversity
 2016 Census Bulletin: Immigration & Ethnic Diversity Kingston, Ontario Census Metropolitan Area (CMA) The 2016 Census Day was May 10, 2016. On October 25, 2017, Statistics Canada released its sixth data
CoC Program Participant Homelessness Verification Form
 PART 1: GENERAL INSTRUCTIONS Instructions: Admitting Agency Name: CoC Program for which Homelessness is Being Certified: Participant Information: Complete all fields in Part 2. Complete all relevant fields
Social and Demographic Trends in Burnaby and Neighbouring Communities 1981 to 2006
 Social and Demographic Trends in and Neighbouring Communities 1981 to 2006 October 2009 Table of Contents October 2009 1 Introduction... 2 2 Population... 3 Population Growth... 3 Age Structure... 4 3
Spryfield Highlights. Household Living Arrangements. The following are highlights from the 2016 Census.
 Highlights The following are highlights from the 2016 Census., as defined for United Way's Action for Neighbourhood Change, had a Census population of 11,700 in 2016. The outline shown to the right, and
Public Service Representation Depends on the Benchmark
 Public Service Representation Depends on the Benchmark One of the hallmarks of a successful multicultural society is the degree to which national institutions, both public and private, reflect the various
City of Kingston Information Report to Council Report Number
 To: From: Resource Staff: of Meeting: May 17, 2016 Subject: Executive Summary: of Kingston Information Report to Council Report Number 16-157 Mayor and Members of Council Lanie Hurdle, Commissioner, Community
City of Kingston Report to Council Information Report Number
 To: From: Resource Staff: City of Kingston Report to Council Information Report Number 17-303 Mayor and Members of Council Lanie Hurdle, Commissioner, Community Services Cheryl Hitchen, Social Policy &
2011 National Household Survey Profile on the Town of Richmond Hill: 1st Release
 2011 National Household Survey Profile on the Town of Richmond Hill: 1st Release Every five years the Government of Canada through Statistics Canada undertakes a nationwide Census. The purpose of the Census
Social Profile of Oakville An Overview
 Social Profile of Oakville An Overview Prepared by Community Development Halton Funding support provided by the United Way of Oakville 2004 Community Development Halton, all rights reserved. Copies of
Changes in the HUD Definition of Homeless
 Changes in the HUD Definition of Homeless HUD has issued a draft regulation to implement changes to the definition of homelessness contained in the Homeless Emergency Assistance and Rapid Transition to
Tracking Trends in Kingston
 Tracking Trends in Photo: 22, Courtesy of City Hall Total Population: 152,358 Population Changes for CMAs, 21 to 26 25 19.2 2 15 1 11.6 9.2 8.9 8.2 6.6 59 5.9 55 5.5 54 5.4 51 5.1 51 5.1 5 5. 46 4.6 3.8
2017 Simcoe County Emergency Shelter Database Analysis. For Period of January 1, 2017 December 31, 2017
 2017 Simcoe County Emergency Shelter Database Analysis For Period of January 1, 2017 December 31, 2017 Prepared by: Victoria Chapman, Research Analyst March 2018 Table of Contents Background... 4 Homelessness
CENSUS RESULTS NATIONAL HOUSEHOLD SURVEY
 2011 CENSUS RESULTS NATIONAL HOUSEHOLD SURVEY INTRODUCTION The inaugural National Household Survey (NHS) was a voluntary survey which replaced the mandatory long-form census questionnaire. The NHS was
Indigenous Housing Strategy Engagement Table A Coordinated Vision for Indigenous Housing. November 14, 2016
 Indigenous Housing Strategy Engagement Table A Coordinated Vision for Indigenous Housing November 14, 2016 The Indigenous Housing Strategy Engagement Table is a collective of Indigenous organizations and
Persistent Inequality
 Canadian Centre for Policy Alternatives Ontario December 2018 Persistent Inequality Ontario s Colour-coded Labour Market Sheila Block and Grace-Edward Galabuzi www.policyalternatives.ca RESEARCH ANALYSIS
FORM 1.1 INDIVIDUAL COMPLAINT Use This Form to File Your Own Complaint
 Use This Form to File Your Own Complaint BC Human Rights Tribunal 1170-605 Robson Street Vancouver BC V6B 5J3 Phone: 604-775-2000 Fax: 604-775-2020 Toll Free: 1-888-440-8844 TTY: 604-775-2021 GENERAL INSTRUCTIONS
City of Kingston Report to Council Report Number Mayor and Members of Council Denis Leger, Commissioner, Corporate and Emergency Services
 To: From: Resource Staff: City of Kingston Report to Council Report Number 18-173 Mayor and Members of Council Denis Leger, Commissioner, Corporate and Emergency Services Construction Services Date of
TO APPLY: Submit application & required documentation to:
 Harmony House Harmony House Transitional Living Program offers homeless pregnant or parenting youth a safe, nurturing place to learn effective parenting skills and essential life skills in a supportive
Juristat Article. The changing profile of adults in custody, 2006/2007. by Avani Babooram
 Component of Statistics Canada Catalogue no. 85-002-X Juristat Juristat Article The changing profile of adults in custody, 2007 by Avani Babooram December 2008 Vol. 28, no. 10 How to obtain more information
Immigration and Ethnocultural Diversity in Quebec
 Immigration and Ethnocultural Diversity in Quebec The National Household Survey (NHS) Regional analysis January 2014 Immigration and Ethnocultural Diversity in Canada was part of the first release of data
Affirmative Action Report
 Affirmative Action Report October 2016 Prepared by: Jessica Holmes, Director, Education Initiatives and Research Adrienne Walters, Program Assistant, Education Initiatives and Research Purpose For purposes
FORM 1.3 COMPLAINT FOR GROUP OR CLASS Use This Form to File a Complaint for a Group or Class of Persons. BC Human Rights Tribunal GENERAL INSTRUCTIONS
 Use This Form to File a Complaint for a Group or Class of Persons BC Human Rights Tribunal 1170-605 Robson Street Vancouver BC V6B 5J3 Phone: 604-775-2000 Fax: 604-775-2020 Toll Free: 1-888-440-8844 TTY:
Roofs for Youth. Discharge Planning and Support for Young People Leaving Detention Pilot Project
 Roofs for Youth Discharge Planning and Support for Young People Leaving Detention Pilot Project INTRODUCTION Partnership Calgary John Howard Society Ø Provides housing, education, and social services to
Elections Alberta Survey of Voters and Non-Voters
 Elections Alberta Survey of Voters and Non-Voters RESEARCH REPORT July 17, 2008 460, 10055 106 St, Edmonton, Alberta T5J 2Y2 Tel: 780.423.0708 Fax: 780.425.0400 www.legermarketing.com 1 SUMMARY AND CONCLUSIONS
Homelessness 101 Under the Safety Net
 Homelessness 101 Under the Safety Net Matias J. Vega, M.D. Medical Director Albuquerque Health Care for the Homeless 505 767-1117 MatiasVega@abqhch.org Definition of Homelessness 1988 Definition Those
2009/ /12 Service Plan
 7200708334343200060888000011230005467200607008094000012303040500009080700060500444400 BUDGET 2009 2030403040500009074030520102020100678883340003432000608880300001123000546770009954000 5000090807000605004444003020101032030403040500009074030000102020010067888334000343200
The Planning & Development Department recommends that Council receive this report for information.
 CORPORATE REPORT NO: R237 COUNCIL DATE: November 19, 2018 REGULAR COUNCIL TO: Mayor & Council DATE: November 15, 2018 FROM: General Manager, Planning & Development FILE: 6600-01 SUBJECT: Surrey Community
2016 Census Bulletin: Education and Labour
 2016 Census Bulletin: Education and Labour Kingston, Ontario Census Metropolitan Area (CMA) The 2016 Census Day was May 10, 2016. In the fall of 2017, Statistics Canada released various data sets from
Aboriginal Communities in Profile: Quinte, Kingston, Rideau Building healthy and vibrant communities
 Aboriginal Communities in Profile: Quinte, Kingston, Rideau Building healthy and vibrant communities The Ontario Trillium Foundation is an agency of the Government of Ontario. Métis Elder photo courtesy
People. Population size and growth. Components of population change
 The social report monitors outcomes for the New Zealand population. This section contains background information on the size and characteristics of the population to provide a context for the indicators
Reproductive Health Program Enrollment Form
 Student ID # Reproductive Health Program Enrollment Form The Reproductive Health (RH) Program pays for birth control and medical services related to reproductive health. We do not discriminate. You can
Mapping VAW Shelters and Transition Houses: INITIAL FINDINGS OF A NATIONAL SURVEY
 Mapping VAW Shelters and Transition Houses: INITIAL FINDINGS OF A NATIONAL SURVEY Survey Background Developing a National Profile of Violence Against Women Shelters and Transition Houses Since their inception
Canada at 150 and the road ahead A view from Census 2016
 Canada at 150 and the road ahead A view from Census 2016 Dr. Doug Norris Senior Vice President and Chief Demographer 2017 Environics Analytics User Conference November 8, 2017 Canada continues to lead
Sector briefing: 2011 Census night homelessness estimates
 Sector briefing: 2011 Census night homelessness estimates Key points 13 November 2012 The number of people identifiable as experiencing homelessness on Census night 2011 increased by 17% from 89,728 people
Your View Counts. In Lanarkshire. August March 2018
 Your View Counts In Lanarkshire August 217 - March 218 Prepared by Analysis and Performance Unit April 218 Your View Counts In Lanarkshire Local Highlighted Priorities: 1. 2. 3. 4. 5. Antisocial Behaviour
Sacramento City and County Continuum of Care GOVERNANCE CHARTER
 2016 Sacramento City and County Continuum of Care GOVERNANCE CHARTER Table of Contents Overview... 3 Part I. Establishment of the CoC Advisory Board... 3 A. Purpose... 3 Part II. Responsibilities of the
3.13. Settlement and Integration Services for Newcomers. Chapter 3 Section. 1.0 Summary. Ministry of Citizenship and Immigration
 Chapter 3 Section 3.13 Ministry of Citizenship and Immigration Settlement and Integration Services for Newcomers Chapter 3 VFM Section 3.13 1.0 Summary In the last five years, more than 510,000 immigrants
Executive Director. Gender Analysis of San Francisco Commissions and Boards
 Emily M. Murase, PhD Executive Director Edwin M. Lee Mayor Gender Analysis of San Francisco Commissions and Boards December 2015 Page 1 Acknowledgements The San Francisco Department on the Status of Women
Shared Housing Services
 SHS Shared Housing Services Shared Housing Services provides affordable, alternative housing solutions to continue and enhance the independence and self-sufficiency of individuals and families To complete
reducing barriers to social inclusion and social cohesion
 In from the Margins, Part II: reducing barriers to social inclusion and social cohesion June 2013 Standing Senate Committee on Social Affairs, Science and Technology The Honourable Kelvin K. Ogilvie, Chair
Ethno-Racial Inequality in Montreal
 Presentation at the Quebec Inter- Centre for Social Statistics Michael Ornstein Institute for Social Research York 1 February 2008 Quantitative and Qualitative Rich description of ethno-racial groups on
Human Trafficking in Canada, Ontario, and Peel
 Peel Institute on Violence Prevention Human Trafficking in Canada, Ontario, and Peel February 2018 PIVP Human Trafficking in Canada, Ontario, and Peel February 2018 Page 1 Contents Introduction. 3 What
people/hectare Ward Toronto
 Bar Chart showing the rate of population growth between the years 2006 and 2016 for the Ward compared to the City of based on the 2006 and data. For more information, please contact Michael Wright at 416-392-7558
NHS Dumfries and Galloway Equality and Diversity Workforce Data Report 2016
 NHS Dumfries and Galloway Equality and Diversity Workforce Data Report 2016 All public sector organisations, including health boards, are required to comply with the Equality Act 2010. Integrated into
The plan can be accessed in its entirety on the DPG website or by clicking HERE.
 The Basics: The Delegate Selection Plan: The Delegate Selection Plan was written in accordance with the Rules and Regulations of the Democratic National Committee (DNC). The plan can be accessed in its
Leadership Rules 2017
 Leadership Rules 2017 1. CANADA ELECTIONS ACT a) All candidates will be subject to the regulations put forth in the Canada Elections Act. 2. CHIEF ELECTORAL OFFICER a) A Chief Electoral Officer (CEO) will
APPLICATION FOR CERTIFICATED SUBSTITUTE EMPLOYMENT
 APPLICATION FOR CERTIFICATED SUBSTITUTE EMPLOYMENT Date: 1. Name: Last First Middle Current Address: Home Telephone: ( ) - Cell Phone: ( ) - E-Mail: Social Security No.: - - Former Name(s) by which records
Scarborough City of Toronto Community Council Area Profiles 2016 Census
 Bar Chart showing the rate of population growth between the years 2006 and 2016 for the Ward compared to the City of based on the 2006 and data. For more information, please contact Michael Wright at 416-392-7558
NEWCOMERS ON BOARD: BASELINE DATA SURVEY RESULTS
 NEWCOMERS ON BOARD: BASELINE DATA SURVEY RESULTS MAY 2016 Yuriko Cowper-Smith* and Caroline Duvieusart-Déry** *Research Shop Project Manager **Knowledge Mobilization Coordinator, Community Engaged Scholarship
Findings of the Household Assessment of Syrian Households in Host Communities. Jarash Governorate. 7 th March 2013
 Geographical Scope / Depth of Data Findings of the Household Assessment of Syrian Households in Host Communities Jarash Governorate 7 th March 213 BACKGROUND The continued crisis in Syria has caused a
Sue King: ANGLICARE Director of Advocacy and Research
 Sue King: ANGLICARE Director of Advocacy and Research WHO IS AT RISK? Refugees Young single mothers Older single women Low income households REFUGEE HOUSING ISSUES Most refugees have experienced poverty,
Telephone Survey. Contents *
 Telephone Survey Contents * Tables... 2 Figures... 2 Introduction... 4 Survey Questionnaire... 4 Sampling Methods... 5 Study Population... 5 Sample Size... 6 Survey Procedures... 6 Data Analysis Method...
North York City of Toronto Community Council Area Profiles 2016 Census
 Bar Chart showing the rate of population growth between the years 2006 and 2016 for the Ward compared to the City of based on the 2006 and data. For more information, please contact Michael Wright at 416-392-7558
CITY OF MISSISSAUGA. Overview 2-1. A. Demographic and Cultural Characteristics
 Portraits of Peel Overview 2-1 A. Demographic and Cultural Characteristics Population: Size, Age and Growth 2-2 Immigrants 2-3 Visible Minorities 2-4 Language 2-5 Religion 2-6 Mobility Status 2-7 B. Household
AVERAGE HOUSEHOLD INCOME $97,637 ($93,586) RENTERS 22% (29%) UNEMPLOYMENT RATE 7% (7%) TAKE TRANSIT TO WORK 15% (15%)
 RENTERS 22% (29%) UNEMPLOYMENT RATE 7% (7%) TAKE TRANSIT TO WORK 15% (15%)") CITY OF COMMUNITY PROFILES 2016 Census Data City of Surrey Statistics WHALLEY CITY CENTRE GUILDFORD NEWTON CLOVERDALE AREA 1,809 ha (32,621 ha) AVERAGE HOUSEHOLD INCOME $97,637 ($93,586) SOUTH POPULATION
CITY OF COMMUNITY PROFILES 2016 Census Data City of Surrey Statistics WHALLEY CITY CENTRE GUILDFORD NEWTON CLOVERDALE AREA 1,809 ha (32,621 ha) AVERAGE HOUSEHOLD INCOME $97,637 ($93,586) SOUTH POPULATION
(Note: These are inititial neighbourhood estimates and are subject to change.) NEI Score. 1,000 Female 52%
 NEI Score. 1,000 Female 52%") 0-4 5-9 10-14 15-19 20-24 25-29 30-34 35-39 40-44 45-49 50-54 55-59 60-64 65-69 70-74 75-79 80-84 85-89 90-94 95-99 100+ 2011 Neighbourhood Demographic Estimates EGLINTON AVE E C P R DON VALLEY PARKWAY
0-4 5-9 10-14 15-19 20-24 25-29 30-34 35-39 40-44 45-49 50-54 55-59 60-64 65-69 70-74 75-79 80-84 85-89 90-94 95-99 100+ 2011 Neighbourhood Demographic Estimates EGLINTON AVE E C P R DON VALLEY PARKWAY
City of Toronto Public Appointments Policy
 City of Toronto Public Appointments Policy Governing Citizen Appointments to City Agencies and Corporations and Other Bodies April 28, 2014 Contact Information: Strategic and Corporate Policy Division
Ward 4 Etobicoke Centre City of Toronto Ward Profiles 2016 Census
 Bar Chart showing the rate of population growth between the years 2006 and 2016 for the Ward compared to the City of based on the 2006 and data. For more information, please contact Michael Wright at 416-392-7558
GOVERNANCE CHARTER OF THE GA-506 MARIETTA/COBB CONTINUUM OF CARE
 GOVERNANCE CHARTER OF THE GA-506 MARIETTA/COBB CONTINUUM OF CARE Organization The name of the Continuum of Care shall be the GA-506 Marietta/Cobb Continuum of Care, hereinafter referred to as the CoC.
Voting at Select Campuses, Friendship Centres and Community Centres, 42nd General Election
 Voting at Select Campuses, Friendship Centres and Community Centres, 42nd General Election Table of Contents Executive Summary... 5 1. Background... 7 1.1. Special Voting Rules... 7 2. Objectives of the
4. How would you describe the area where you live? Would you say you live in...
 Gallup, The Gallup Poll, and CE 11 are trademarks of Gallup, Inc. Copyright 199-000, 008-010 Gallup, Inc. All rights reserved. Knight Foundation Questionnaire 010 1. In what county do you live?. Please
PART 576 EMERGENCY SOLUTIONS GRANTS PROGRAM. 3. The authority citation for 24 CFR part 576 continues to read as follows:
 74 (iii) Lacks the resources or support networks, e.g., family, friends, faith-based or other social networks, to obtain other permanent housing. PART 576 EMERGENCY SOLUTIONS GRANTS PROGRAM 3. The authority
(Note: These are inititial neighbourhood estimates and are subject to change.) 1,000 Female 54%
 1,000 Female 54%") LAWRENCE AVE E 0-4 5-9 10-14 15-19 20-24 25-29 30-34 35-39 40-44 45-49 50-54 55-59 60-64 65-69 70-74 75-79 80-84 85-89 90-94 95-99 100+ 2011 Neighbourhood Demographic Estimates RAILSIDE RD C P R DON RIVER
LAWRENCE AVE E 0-4 5-9 10-14 15-19 20-24 25-29 30-34 35-39 40-44 45-49 50-54 55-59 60-64 65-69 70-74 75-79 80-84 85-89 90-94 95-99 100+ 2011 Neighbourhood Demographic Estimates RAILSIDE RD C P R DON RIVER
May 14, Commission on the Status of Women: Needs Assessment.
 5/20/2014 May 14, 2014 Table of Contents The current and immediate past members of the Broward County Commission on the Status of Women (CSW) expresses deep gratitude and appreciation to the following
If this information is required in an accessible format, please contact ext. 2564
 If this information is required in an accessible format, please contact 1-800-372-1102 ext. 2564 From: Report: Date: Commissioner of Planning and Economic Development #2018-INFO-53 April 13, 2018 Subject:
Justice ACCOUNTABILITY STATEMENT
 BUSINESS PLAN 2000-03 Justice ACCOUNTABILITY STATEMENT This Business Plan for the three years commencing April 1, 2000 was prepared under my direction in accordance with the Government Accountability Act
COMMUNITY PROFILE: Fort St. John, British Columbia Census Subdivision (CSD) PHASE 1 Winter 2018
 PHASE 1 Winter 2018") COMMUNITY PROFILE: Fort St. John, British Columbia Census Subdivision (CSD) PHASE 1 Winter 2018 About the Community Development Institute Established in 2004, the Community Development Institute (CDI)
COMMUNITY PROFILE: Fort St. John, British Columbia Census Subdivision (CSD) PHASE 1 Winter 2018 About the Community Development Institute Established in 2004, the Community Development Institute (CDI)
$58,761 ($93,586) 57% (29%) 8% (7%) 36% (15%)
 57% (29%) 8% (7%) 36% (15%)") CITY OF COMMUNITY PROFILES 2016 Census Data City of Surrey Statistics CITY WHALLEY GUILDFORD FLEETWOOD NEWTON CLOVERDALE AREA 548 ha (32,621 ha) AVERAGE HOUSEHOLD INCOME $58,761 ($93,586) SOUTH POPULATION
CITY OF COMMUNITY PROFILES 2016 Census Data City of Surrey Statistics CITY WHALLEY GUILDFORD FLEETWOOD NEWTON CLOVERDALE AREA 548 ha (32,621 ha) AVERAGE HOUSEHOLD INCOME $58,761 ($93,586) SOUTH POPULATION
Chapter One: people & demographics
 Chapter One: people & demographics The composition of Alberta s population is the foundation for its post-secondary enrolment growth. The population s demographic profile determines the pressure points
Profile of the New Brunswick Labour Force
 Profile of the New Brunswick Labour Force October 213 213 Profile of the New Brunswick Labour Force Province of New Brunswick PO 6, Fredericton NB E3B 5H1 www.gnb.ca 213.11 ISBN 978-1-465-247-1 (Print
CHAIR AND MEMBERS STRATEGIC PRIORITIES AND POLICY COMMITTEE MEETING ON JUNE 25, 2018
 TO: FROM: SUBJECT: CHAIR AND MEMBERS STRATEGIC PRIORITIES AND POLICY COMMITTEE MEETING ON JUNE 25, 2018 SANDRA DATARS BERE MANAGING DIRECTOR, HOUSING, SOCIAL SERVICES AND DEARNESS HOME FREE OF FEAR SERVICES
This report is formatted for double-sided printing.
 Public Opinion Survey on the November 9, 2009 By-elections FINAL REPORT Prepared for Elections Canada February 2010 Phoenix SPI is a Gold Seal Certified Corporate Member of the MRIA 1678 Bank Street, Suite
Standing for office in 2017
 Standing for office in 2017 Analysis of feedback from candidates standing for election to the Northern Ireland Assembly, Scottish council and UK Parliament November 2017 Other formats For information on
CITY CLERK. City of Toronto Plan of Action for the Elimination of Racism and Discrimination
 CITY CLERK Clause embodied in Report No. 3 of the, as adopted by the Council of the City of Toronto at its meeting held on April 14, 15 and 16, 2003. 3 City of Toronto Plan of Action for the Elimination
Volunteer Application Form. Personal Information
 Volunteer Application Form Personal Information Contact Information First Name Surname Address Post code. Home Telephone Mobile Telephone E-mail address Date of Birth Please tell what you doing at the
HUMAN RIGHTS IN CANADA
 HUMAN RIGHTS IN CANADA Canada has laws that protect your human rights. These are called Human Rights Acts. There is one Act for the Federal government and one Act for each province and territory. The Human
Regarding question 1:
 UN Special Rapporteur on adequate housing Office of the High Commissioner for Human Rights Special Procedures Branch, Palais Wilson CH 1211, Geneva Switzerland W I L D E R S P L A D S 8 K DK-1403 C O P
Ward 17 Davenport City of Toronto Ward Profiles 2016 Census
 Bar Chart showing the rate of population growth between the years 2006 and 2016 for the Ward compared to the City of based on the 2006 and data. For more information, please contact Michael Wright at 416-392-7558
2809 University Avenue - Green Bay, WI
 2809 University Avenue - Green Bay, WI 54311 920-884-7360 TENANT SELECTION CRITERIA Revised July 14, 2014 Eligible applicants must meet eligibility income limits with preference given to those eligible
SSRL Evaluation and Impact Assessment Framework
 SSRL Evaluation and Impact Assessment Framework Taking the Pulse of Saskatchewan: Crime and Public Safety in Saskatchewan October 2012 ABOUT THE SSRL The Social Sciences Research Laboratories, or SSRL,
Public Safety Survey
 Public Safety Survey Penticton Area Final Report Rupi Kandola Niki Huitson Irwin Cohen Darryl Plecas School of Criminology and Criminal Justice University College of the Fraser Valley February 2007-1 -
Documenting Chronic Homelessness Final Rule. Coalition for the Homeless of Houston/Harris County
 Documenting Chronic Homelessness Final Rule Coalition for the Homeless of Houston/Harris County Agenda Review Final Rule New Prioritization Updates 3 rd party documentation Q&A Final Rule on Defining Chronically
Youth in Crisis. Characteristics of Homeless Youth Served by Covenant House Alaska. Final Report
 Youth in Crisis Characteristics of Homeless Youth Served by Covenant House Alaska Final Report prepared by: Stephanie Martin Alejandra Villalobos Meléndez Institute of Social and Economic Research University
Alberta Provincial Electoral Divisions
 Alberta Provincial Electoral Divisions Edmonton-Decore Compiled from the 2011 Census of Canada and National Household Survey Introduction This report presents the statistical profile for the Provincial
Private Sponsorship of Refugees (PSR) Program Sponsor a refugee Financial support rules for sponsoring groups
 Program Sponsor a refugee Financial support rules for sponsoring groups") Private Sponsorship of Refugees (PSR) Program Sponsor a refugee Financial support rules for sponsoring groups Overview: The Government of Canada is committed to ensuring that resettled refugees receive
Private Sponsorship of Refugees (PSR) Program Sponsor a refugee Financial support rules for sponsoring groups Overview: The Government of Canada is committed to ensuring that resettled refugees receive
Update to the visible minority classification - a quick overview of the project
 Update to the visible minority classification - a quick overview of the project www.statcan.gc.ca Telling Canada s story in numbers Measuring identity, diversity and inclusion in Canada @ 150 and beyond
Introduction to data on ethnicity
 Introduction to data on ethnicity Deborah Wiltshire, UK Data Service Alita Nandi, Institute for Social and Economic Research 19 November 2015 Can you hear us?? 1 Can you hear us? If Not: Check your volume,