Exposing Media Election Myths
|
|
|
- Godwin Doyle
- 5 years ago
- Views:
Transcription
1 Exposing Media Election Myths 1 There is no evidence of election fraud. 2 Bush 48% approval in 2004 does not indicate he stole the election. 3 Pre-election polls in 2004 did not match the exit polls Election model projection assumptions were wrong. 5 Bush led the 2004 pre-election polls. 6 Exit polls are not random samples. 7 Reluctant Bush Responder (rbr) explains the 2004 exit poll discrepancies. 8 Bush won by increasing his vote share in Democratic strongholds (Urban Legend). 9 Swing vs. Red-shift: No correlation "kills the fraud argument". 10 False Recall explains the 43/37 Bush/Gore returning voter mix in the Final NEP. 11 Exit poll discrepancies were not due to voting machines/methods. 12 The Final National Exit Poll proves that Bush won. 13 Bush won the late voters the early exit polls missed. 14 Mid-term Generic polls are not a good predictor. 15 Hillary and Obama split the popular vote in the primaries. 16 Obama won by 9.5 million votes with a 52.9% vote share.


2 Myth - There is no evidence of election fraud. Fact The average historical Democratic True vote share exceeded the official share by 4.7%.


3 Myth - Bush 48% approval in 2004 does not indicate that he stole the election. Fact - Every incumbent since 1968 over 50% approval won re-election. Fact - Bush was the ONLY incumbent to win with approval below 50%. Fact - Average incumbent approval EXACTLY matched the average True vote (46.5%).


4 Myth pre-election polls did not match the exit polls. Fact - After adjusting for undecided voters, the average of the pre-election state and national polls matched the corresponding unadjusted exit poll.

5 Myth Election Model projection assumptions were wrong. Fact - the base case assumption was that Kerry would win 75% of the undecided vote. Fact - a sensitivity analysis showed that he won with 50%. Fact - Historically challengers have won undecided voters over 80% of the time. Fact - Gallup assigned 90% of undecided voters to Kerry.


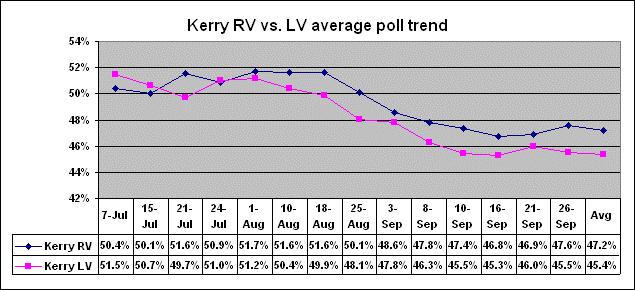
6 Myth - Bush led the pre-election polls. Fact - Kerry led by 1% iin the final pre-election polls; he led by 3% after undecided voters were allocated. Fact - Kerry led Register Voter polls by a higher margin than Likely Voter polls. Fact - Registered Voter pre-election polls were more accurate than LV polls. Fact - Kerry won 57-60% of million new voters.

7
8 Myth - Exit polls are not random samples; the margin of error is high. Fact - National Exit Poll notes indicate voters were randomly sampled.


9 Myth - Reluctant Bush Responder (rbr) explains the exit poll discrepancies Fact - The Final National Exit Poll indicated that returning Bush voters comprised 43% of the electorate and only 37% were Gore voters. Fact - Bush needed 55% of non-responders to match his vote. He had 47% of responders. Fact - Exit poll response was HIGH in strong Bush states and LOW in Kerry states.
. Fact - That was implausible.")
10 Myth - Bush won by increasing his vote share in Democratic strongholds (Urban Legend). Fact - That was implausible. He LOST vote share in rural areas and small towns.
 is incorrect. Fact - In 2000 there were 5.")
11 Myth - Swing vs. Red-shift: No correlation "kills the fraud argument". Fact - Using recorded vote "swing" (change in Bush Vote share from 2000 to 2004) is incorrect. Fact - In 2000 there were 5.4 million net uncounted votes; in 2004, 3.4 million. Fact - From 70-80% of uncounted votes were Gore and Kerry lost votes.


12 Myth - False Recall explains the 43/37 Bush/Gore voter mix in the Final National Exit poll. Fact - This assumes that the recorded vote is the baseline. Fact - Gore won the recorded vote in 2000 by 540,000. Fact - There is no evidence to suggest Gore voters forgot or were motivated to lie. Fact - Retrospective surveys matched the True Vote when total votes CAST were used. Fact - In , the average NES winning margin was 11.43%. The average True Vote winning margin was 10.63%. The average True Vote winning share deviated by 0.40% from NES. The average Democratic True winning share deviated by 0.70%. The average Republican True winning share deviated by 0.46%.
 rates (11%). Fact= Paper ballots had the lowest (2%) rate.")
13 Myth- Exit poll discrepancies were not due to voting machines/methods. Fact - Lever machines had the highest error (WPE) rates (11%). Fact= Paper ballots had the lowest (2%) rate. Fact- Touch screens and optical scanners had a 7% rate.


14 Myth- The Final National Exit Poll proves that Bush won Fact - The Final was FORCED TO MATCH THE RECORDED VOTE. Fact - The 43/37 returning Bush/Gore voter mix was IMPOSSIBLE. Fact - The mix required over 6 million PHANTOM Bush voters Fact - The Final also adjusted corresponding Bush vote shares to implausible levels.

15 Myth - Bush late voters were missed by the early exit polls. Fact - Kerry led 51-48% throughout the National Exit Poll timeline (4pm, 730pm, 1222am). Fact - Kerry won 55% of the final 6 million votes recorded after Election Day. Fact - The unadjusted state exit poll aggregate had Kerry winning by 5%. Fact- The late vote shares matched the exit polls.


16 2006 Midterms Myth - Generic polls are not a good predictor of the Recorded Vote. Fact - That is correct. But they accurately predict the TRUE VOTE. Fact - The Generic 120 pre-election poll trend had the Democrats winning with 56.4%. Fact - The Democrats had 56.4% in the unadjusted exit poll.


17 2008 Primaries Myth - Hillary and Obama were close in the popular vote. Fact - Pre-election and exit polls showed Obama to be the winner in the NH primary. Fact - Super Tuesday exit polls showed Obama to be the clear winner. Fact - Rush Limbaugh called for "Operation Chaos" to get Republicans to cross over and vote for Clinton.
.")
18 2008 Myth - Obama won by 9.5 million votes with a 52.9% share. Fact - Obama won by 22 million assuming 2004 was FRAUDULENT (Kerry won by 52-47%). Fact - Obama won by 17 million assuming ZERO FRAUD (Bush won by 3.0 million).
19
Obama s Support is Broadly Based; McCain Now -10 on the Economy
 ABC NEWS/WASHINGTON POST POLL: ELECTION TRACKING #8 EMBARGOED FOR RELEASE AFTER 5 p.m. Monday, Oct. 27, 2008 Obama s Support is Broadly Based; McCain Now -10 on the Economy With a final full week of campaigning
TUESDAY, MARCH 22, 2016 ELECTORAL COLLEGE VOTES: 11
 ARIZONA E L E C T I O N D A Y : TUESDAY, MARCH 22, 2016 ELECTORAL COLLEGE VOTES: 11 TOTAL POPULATION (2014): 6,731,484 LATINO POPULATION (2014): 2,056,456 Since 2000, Arizona has seen one particularly
First-time voters. Go Big for Obama
 ABC NEWS/WASHINGTON POST POLL: ELECTION TRACKING #2 EMBARGOED FOR RELEASE AFTER 5 p.m. Tuesday, Oct. 21, 2008 First-Time Voters Go Big for Obama First-time voters underscore Barack Obama's organizational
Voting and Elections. CP Political Systems
 Voting and Elections CP Political Systems Pre Chapter Questions Directions: You have 7 minutes to answer the following questions ON YOUR OWN! Write answers only. 1. What are 2 qualifications you have to
Response to the Report Evaluation of Edison/Mitofsky Election System
 US Count Votes' National Election Data Archive Project Response to the Report Evaluation of Edison/Mitofsky Election System 2004 http://exit-poll.net/election-night/evaluationjan192005.pdf Executive Summary
US Count Votes. Study of the 2004 Presidential Election Exit Poll Discrepancies
 US Count Votes Study of the 2004 Presidential Election Exit Poll Discrepancies http://uscountvotes.org/ucvanalysis/us/uscountvotes_re_mitofsky-edison.pdf Response to Edison/Mitofsky Election System 2004
1. A Republican edge in terms of self-described interest in the election. 2. Lower levels of self-described interest among younger and Latino
 2 Academics use political polling as a measure about the viability of survey research can it accurately predict the result of a national election? The answer continues to be yes. There is compelling evidence
Polling and the Ballot: The Venezuelan Referendum By David Rosnick 1
 cepr CENTER FOR ECONOMIC AND POLICY RESEARCH Issue Brief Polling and the Ballot: The Venezuelan Referendum By David Rosnick 1 August 19, 2004 CENTER FOR ECONOMIC AND POLICY RESEARCH 1621 CONNECTICUT AVE.,
Campaign Finance Charges Raise Doubts Among 7% of Clinton Backers FINAL PEW CENTER SURVEY-CLINTON 52%, DOLE 38%, PEROT 9%
 FOR RELEASE: SUNDAY, NOVEMBER 3, 1996, 5:00 P.M. Campaign Finance Charges Raise Doubts Among 7% of Clinton Backers FINAL PEW CENTER SURVEY-CLINTON 52%, DOLE 38%, PEROT 9% FOR FURTHER INFORMATION CONTACT:
Campaigning in General Elections (HAA)
") Campaigning in General Elections (HAA) Once the primary season ends, the candidates who have won their party s nomination shift gears to campaign in the general election. Although the Constitution calls
Campaigning in General Elections (HAA) Once the primary season ends, the candidates who have won their party s nomination shift gears to campaign in the general election. Although the Constitution calls
Elections and Voting Behavior
 Elections and Voting Behavior Running for Office: 4 step process Presidential election process: Nomination caucus/primary national convention general election slate of candidates election held with in
Why The National Popular Vote Bill Is Not A Good Choice
 Why The National Popular Vote Bill Is Not A Good Choice A quick look at the National Popular Vote (NPV) approach gives the impression that it promises a much better result in the Electoral College process.
Nevada Poll Results Tarkanian 39%, Heller 31% (31% undecided) 31% would renominate Heller (51% want someone else, 18% undecided)
 31% would renominate Heller (51% want someone else, 18% undecided)") Nevada Poll Results Tarkanian 39%, Heller 31% (31% undecided) 31% would renominate Heller (51% want someone else, 18% undecided) POLLING METHODOLOGY For this poll, a sample of likely Republican households
Nevada Poll Results Tarkanian 39%, Heller 31% (31% undecided) 31% would renominate Heller (51% want someone else, 18% undecided) POLLING METHODOLOGY For this poll, a sample of likely Republican households
Changes in Party Identification among U.S. Adult Catholics in CARA Polls, % 48% 39% 41% 38% 30% 37% 31%
 The Center for Applied Research in the Apostolate Georgetown University June 20, 2008 Election 08 Forecast: Democrats Have Edge among U.S. Catholics The Catholic electorate will include more than 47 million
Patterns of Poll Movement *
 Patterns of Poll Movement * Public Perspective, forthcoming Christopher Wlezien is Reader in Comparative Government and Fellow of Nuffield College, University of Oxford Robert S. Erikson is a Professor
A Record Shortfall in Personal Popularity Challenges Romney in the Race Ahead
 ABC NEWS/WASHINGTON POST POLL: Favorability #23 EMBARGOED FOR RELEASE AFTER 5 p.m. Monday, April 16, 2012 A Record Shortfall in Personal Popularity Challenges Romney in the Race Ahead Mitt Romney has emerged
Trump, Populism and the Economy
 Libby Cantrill, CFA October 2016 Trump, Populism and the Economy This material contains the current opinions of the manager and such opinions are subject to change without notice. This material has been
DIRECTIVE November 20, All County Boards of Elections Directors, Deputy Directors, and Board Members. Post-Election Audits SUMMARY
 DIRECTIVE 2012-56 November 20, 2012 To: Re: All County Boards of Elections Directors, Deputy Directors, and Board Members Post-Election Audits SUMMARY In 2009, the previous administration entered into
NEWS RELEASE. Poll Shows Tight Races Obama Leads Clinton. Democratic Primary Election Vote Intention for Obama & Clinton
 NEWS RELEASE FOR IMMEDIATE RELEASE: April 18, 2008 Contact: Michael Wolf, Assistant Professor of Political Science, 260-481-6898 Andrew Downs, Assistant Professor of Political Science, 260-481-6691 Poll
Risk-Limiting Audits
 Risk-Limiting Audits Ronald L. Rivest MIT NASEM Future of Voting December 7, 2017 Risk-Limiting Audits (RLAs) Assumptions What do they do? What do they not do? How do RLAs work? Extensions References (Assumption)
Bush Inches Above 50%; First-Timers are a Wildcard
 ABC NEWS POLL: CAMPAIGN TRACKING #14 10/18/04 EMBARGOED FOR RELEASE AFTER 5 p.m. Tuesday, Oct. 19, 2004 Bush Inches Above 50%; First-Timers are a Wildcard Support for George W. Bush has crept above the
2012 Presidential Race Is its Own Perfect Storm
 ABC NEWS/WASHINGTON POST POLL: Election Tracking No. 7 EMBARGOED FOR RELEASE AFTER 12:01 a.m. Monday, Oct. 29, 2012 2012 Presidential Race Is its Own Perfect Storm As it enters its frenetic final week
ELECTION OVERVIEW. + Context: Mood of the Electorate. + Election Results: Why did it happen? + The Future: What does it mean going forward?
 1 ELECTION OVERVIEW + Context: Mood of the Electorate + Election Results: Why did it happen? + The Future: What does it mean going forward? + Appendix: Polling Post-Mortem 2 2 INITIAL HEADLINES + Things
McCain Pushes Back on Attributes But the Dynamic Holds for Obama
 ABC NEWS/WASHINGTON POST POLL: ELECTION TRACKING #1 EMBARGOED FOR RELEASE AFTER 5 p.m. Monday, Oct. 20, 2008 McCain Pushes Back on Attributes But the Dynamic Holds for Obama John McCain has climbed back
VOTING MACHINES AND THE UNDERESTIMATE OF THE BUSH VOTE
 VOTING MACHINES AND THE UNDERESTIMATE OF THE BUSH VOTE VERSION 2 CALTECH/MIT VOTING TECHNOLOGY PROJECT NOVEMBER 11, 2004 1 Voting Machines and the Underestimate of the Bush Vote Summary 1. A series of
Rural America Competitive Bush Problems and Economic Stress Put Rural America in play in 2008
 June 8, 07 Rural America Competitive Bush Problems and Economic Stress Put Rural America in play in 08 To: From: Interested Parties Anna Greenberg, Greenberg Quinlan Rosner William Greener, Greener and
Energized Against Donald Trump, Democrats Reach +14 in the Midterms
 ABC NEWS/WASHINGTON POST POLL: The 2018 Midterms EMBARGOED FOR RELEASE AFTER 6 a.m. Tuesday, Sept. 4, 2018 Energized Against Donald Trump, Democrats Reach +14 in the Midterms With their supporters energized
The Presidential Election. Paul Beck, The Ohio State University Lifelong Learning Institute December 7, 2016
 The Presidential Election Paul Beck, The Ohio State University Lifelong Learning Institute December 7, 2016 1 Introduction: Fundamentals of the 2016 Presidential Contests 2016 presidential results with
FOR RELEASE: TUESDAY, DECEMBER 19 AT 4 PM
 P O L L Interviews with 1,019 adult Americans conducted by telephone by Opinion Research Corporation on December, 2006. The margin of sampling error for results based on the total sample is plus or minus
This journal is published by the American Political Science Association. All rights reserved.
 Article: National Conditions, Strategic Politicians, and U.S. Congressional Elections: Using the Generic Vote to Forecast the 2006 House and Senate Elections Author: Alan I. Abramowitz Issue: October 2006
LESSONS LEARNED FROM THE 2016 ELECTION
 LESSONS LEARNED FROM THE 2016 ELECTION IE 561 Continuous Quality Improvement of Process Fall 2016 Cameron MacKenzie Most of this information comes from the website 538 IE 561 CONTINUOUS QUALITY IMPROVEMENT
THE 2008 ELECTION: 1 DAY TO GO October 31 November 2, 2008
 CBS NEWS POLL For Release: Monday, November 3 rd, 2008 3:00 PM (EST) THE 2008 ELECTION: 1 DAY TO GO October 31 November 2, 2008 On the eve of the 2008 presidential election, the CBS News Poll finds the
Issues vs. the Horse Race
 The Final Hours: Issues vs. the Horse Race Presidential Campaign Watch November 3 rd, 2008 - Is the economy still the key issue of the campaign? - How are the different networks covering the candidates?
The Job of President and the Jobs Model Forecast: Obama for '08?
 Department of Political Science Publications 10-1-2008 The Job of President and the Jobs Model Forecast: Obama for '08? Michael S. Lewis-Beck University of Iowa Charles Tien Copyright 2008 American Political
Latinos and the Mid- term Election
 Fact Sheet Novem ber 27, 2006 Latinos and the 2 0 0 6 Mid- term Election Widely cited findings in the national exit polls suggest Latinos tilted heavily in favor of the Democrats in the 2006 election,
- 1 - Second Exam American Government PSCI Fall, 2001
 Second Exam American Government PSCI 1201-001 Fall, 2001 Instructions: This is a multiple choice exam with 40 questions. Select the one response that best answers the question. True false questions should
Union Voters and Democrats
 POLITICAL MEMO Union Voters and Democrats BY ANNE KIM AND STEFAN HANKIN MAY 2011 Top and union leaders play host this week to prospective 2012 Congressional candidates, highlighting labor s status as a
A Dead Heat and the Electoral College
 A Dead Heat and the Electoral College Robert S. Erikson Department of Political Science Columbia University rse14@columbia.edu Karl Sigman Department of Industrial Engineering and Operations Research sigman@ieor.columbia.edu
RBS SAMPLING FOR EFFICIENT AND ACCURATE TARGETING OF TRUE VOTERS
 Dish RBS SAMPLING FOR EFFICIENT AND ACCURATE TARGETING OF TRUE VOTERS Comcast Patrick Ruffini May 19, 2017 Netflix 1 HOW CAN WE USE VOTER FILES FOR ELECTION SURVEYS? Research Synthesis TRADITIONAL LIKELY
FAU Poll: Hispanics backing Clinton in Key Battleground States of Ohio, Colorado Nevada, North Carolina and Florida.
 FAU Poll: Hispanics backing Clinton in Key Battleground States of Ohio, Colorado Nevada, North Carolina and Florida. A new set of Hispanic battleground state polls by the Business and Economics Polling
Key Factors That Shaped 2018 And A Brief Look Ahead
 Key Factors That Shaped 2018 And A Brief Look Ahead November 2018 Bill McInturff SLIDE 1 Yes, it was all about Trump. SLIDE 2 A midterm record said their vote was a message of support or opposition to
The Electoral College. What is it?, how does it work?, the pros, and the cons
 The Electoral College What is it?, how does it work?, the pros, and the cons What is the Electoral College? n E lec tor al College- A body of electors chosen to elect the President and Vice President of
Campaigns & Elections. US Government POS 2041
 Campaigns & Elections US Government POS 2041 Votes for Women, inspired by Katja Von Garner. http://www.youtube.com/watch?v=lvqnjwk W7gA For Discussion Do you think that democracy is endangered by the
Limit Election Spending Republican Democrat Undecided Protect Free Speech
 To: All Interested Parties From: McLaughlin & Associates Re: Protecting Free Speech will be Important Campaign Issue. Date: March 5, 2010 The generic ballot for Congress favors the Republicans by 7-points
2016: An Election Year to Remember. Ron Elving Senior Washington Editor National Public Radio
 2016: An Election Year to Remember Ron Elving Senior Washington Editor National Public Radio Anger and Anxiety An Election Year to Remember : Ron Elving / NPR FMI / Meat Conference February 22, 2016 Nashville
The 2000 Presidential Election in Louisiana
 University of New Orleans ScholarWorks@UNO Survey Research Center Publications Survey Research Center (UNO Poll) 10-1-2000 The 2000 Presidential Election in Louisiana Susan E. Howell University of New
Forecasting the 2012 U.S. Presidential Election: Should we Have Known Obama Would Win All Along?
 Forecasting the 2012 U.S. Presidential Election: Should we Have Known Obama Would Win All Along? Robert S. Erikson Columbia University Keynote Address IDC Conference on The Presidential Election of 2012:
PENNSYLVANIA: CD01 INCUMBENT POPULAR, BUT RACE IS CLOSE
 Please attribute this information to: Monmouth University Poll West Long Branch, NJ 07764 www.monmouth.edu/polling Follow on Twitter: @MonmouthPoll Released: Monday, 4, Contact: PATRICK MURRAY 732-979-6769
While viewing this PBS Documentary video answer the following questions. 3. Is voting a Right or a Privilege? (Circle the answer)
") ELECTORAL DYSFUNCTION NAME: While viewing this PBS Documentary video answer the following questions. 1. America is at war over V. The fear of voter fraud and concern over limiting voting for Americans
ELECTORAL DYSFUNCTION NAME: While viewing this PBS Documentary video answer the following questions. 1. America is at war over V. The fear of voter fraud and concern over limiting voting for Americans
Growing the Youth Vote
 Greenberg Quinlan Rosner/Democracy Corps Youth for the Win! Growing the Youth Vote www.greenbergresearch.com Washington, DC California 10 G Street, NE Suite 500 Washington, DC 20002 388 Market Street Suite
VoteCastr methodology
 VoteCastr methodology Introduction Going into Election Day, we will have a fairly good idea of which candidate would win each state if everyone voted. However, not everyone votes. The levels of enthusiasm
CHAPTER 11 PUBLIC OPINION AND POLITICAL SOCIALIZATION. Narrative Lecture Outline
 CHAPTER 11 PUBLIC OPINION AND POLITICAL SOCIALIZATION Narrative Lecture Outline Public opinion and polling was front page news and the opening story in November 2000. Television and Web-based news organizations
Voters Divided Over Who Will Win Second Debate
 OCTOBER 15, 2012 Neither Candidate Viewed as Too Personally Critical Voters Divided Over Who Will Win Second Debate FOR FURTHER INFORMATION CONTACT: Andrew Kohut President, Pew Research Center Carroll
In the Margins Political Victory in the Context of Technology Error, Residual Votes, and Incident Reports in 2004
 In the Margins Political Victory in the Context of Technology Error, Residual Votes, and Incident Reports in 2004 Dr. Philip N. Howard Assistant Professor, Department of Communication University of Washington
Swing Voters Criticize Bush on Economy, Support Him on Iraq THREE-IN-TEN VOTERS OPEN TO PERSUASION
 NEWS RELEASE 1150 18 th Street, N.W., Suite 975 Washington, D.C. 20036 Tel (202) 293-3126 Fax (202) 293-2569 FOR IMMEDIATE RELEASE Wednesday, March 3, 2004 FOR FURTHER INFORMATION Andrew Kohut, Director
POLL RESULTS. Page 1 of 6
 Poll Results Trump 44%, Clinton 38% (Others 6%, 12% undecided) Isakson 41%, Barksdale 28% (Buckley 4%, 27% undecided) Isakson re-elect: 36-27% (38% undecided) POLLING METHODOLOGY JMC Analytics and Polling
Polling and Politics. Josh Clinton Abby and Jon Winkelried Chair Vanderbilt University
 Polling and Politics Josh Clinton Abby and Jon Winkelried Chair Vanderbilt University (Too much) Focus on the campaign News coverage much more focused on horserace than policy 3 4 5 Tell me again how you
Supplementary Materials A: Figures for All 7 Surveys Figure S1-A: Distribution of Predicted Probabilities of Voting in Primary Elections
 Supplementary Materials (Online), Supplementary Materials A: Figures for All 7 Surveys Figure S-A: Distribution of Predicted Probabilities of Voting in Primary Elections (continued on next page) UT Republican
POLL RESULTS. Question 1: Do you approve or disapprove of the job performance of President Donald Trump? Approve 46% Disapprove 44% Undecided 10%
 Nebraska Poll Results Trump Approval: 46-44% (10% undecided) Ricketts re-elect 39-42% (19% undecided) Fischer re-elect 35-42% (22% undecided) Arming teachers: 56-25% against (20% undecided) POLLING METHODOLOGY
Electing a President. The Electoral College
 Electing a President The Electoral College The Original Electoral College System Compromise between allowing Congress to choose a chief executive and direct popular election -Allowing Congress goes against
WNBC/Marist Poll Poughkeepsie, NY Phone Fax
 WNBC/Marist Poll Poughkeepsie, NY 12601 Phone 845.575.5050 Fax 845.575.5111 www.maristpoll.marist.edu EMBARGOED FOR RELEASE: Tuesday 6:00 p.m. October 3, 2006 All references must be sourced WNBC/Marist
American Dental Association
 American Dental Association May 2, 2016 Bill McInturff SLIDE 1 Heading into the Election Year SLIDE 2 Direction of country remains strongly negative for over a decade. Right Track Wrong Direction WT 80
Moral Values Take Back Seat to Partisanship and the Economy In 2004 Presidential Election
 Moral Values Take Back Seat to Partisanship and the Economy In 2004 Presidential Election Lawrence R. Jacobs McKnight Land Grant Professor Director, 2004 Elections Project Humphrey Institute University
Preferences in Political Mapping (Measuring, Modeling, and Visualization)
") 1880 1884 1888 1960 1968 2000 1880 1884 1888 1960 1968 2000 1876 1916 1976 2004 Preferences in Political Mapping (Measuring, Modeling, and Visualization) Andrew Gelman Department of Statistics and Department
1880 1884 1888 1960 1968 2000 1880 1884 1888 1960 1968 2000 1876 1916 1976 2004 Preferences in Political Mapping (Measuring, Modeling, and Visualization) Andrew Gelman Department of Statistics and Department
Who Would Have Won Florida If the Recount Had Finished? 1
 Who Would Have Won Florida If the Recount Had Finished? 1 Christopher D. Carroll ccarroll@jhu.edu H. Peyton Young pyoung@jhu.edu Department of Economics Johns Hopkins University v. 4.0, December 22, 2000
MEMORANDUM. Independent Voter Preferences
 MEMORANDUM TO: Interested Parties FROM: Ed Gillespie, Whit Ayres and Leslie Sanchez DATE: November 9, 2010 RE: Post-Election Poll Highlights: Independents Propel Republican Victories in 2010 The 2010 mid-term
Introduction. 1 Freeman study is at: Cal-Tech/MIT study is at
 The United States of Ukraine?: Exit Polls Leave Little Doubt that in a Free and Fair Election John Kerry Would Have Won both the Electoral College and the Popular Vote By Ron Baiman The Free Press (http://freepress.org)
THE PRESIDENTIAL RACE: MIDSUMMER July 7-14, 2008
 CBS NEWS/NEW YORK TIMES POLL For release: Tuesday July 15, 2008 6:30 P.M. EDT THE PRESIDENTIAL RACE: MIDSUMMER July 7-14, 2008 Democrat Barack Obama now holds a six-point edge over his Republican rival
U.S. Catholics split between intent to vote for Kerry and Bush.
 The Center for Applied Research in the Apostolate Georgetown University Monday, April 12, 2004 U.S. Catholics split between intent to vote for Kerry and Bush. In an election year where the first Catholic
Incumbent Support its Lowest Since 94 In a Mine-Strewn Political Environment
 ABC NEWS/WASHINGTON POST POLL: 2010 POLITICS EMBARGOED FOR RELEASE AFTER 12:01 a.m. Wednesday, April 28, 2010 Incumbent Support its Lowest Since 94 In a Mine-Strewn Political Environment Just a third of
1. Amendments impacting Voting. 15th - No Racial Discrimination. 17th - Direct election of senators by citizens, not state legislature appointment
 Exam 6A Notes 1. Amendments impacting Voting 15th - No Racial Discrimination 17th - Direct election of senators by citizens, not state legislature appointment 19th - no sex/gender discrimination (Female
From Straw Polls to Scientific Sampling: The Evolution of Opinion Polling
 Measuring Public Opinion (HA) In 1936, in the depths of the Great Depression, Literary Digest announced that Alfred Landon would decisively defeat Franklin Roosevelt in the upcoming presidential election.
Indicate the answer choice that best completes the statement or answers the question.
 Indicate the answer choice that best completes the statement or answers the question. The Electoral College Process 1. According to the diagram, what is Congress s role in the Electoral College process?
AP US GOVERNMENT & POLITICS UNIT 2 REVIEW
 AP US GOVERNMENT & POLITICS UNIT 2 REVIEW POLITICAL BELIEFS & BEHAVIORS Public Opinion vs. Political Ideology Public opinion: the distribution of the population s beliefs about politics and policy issues.
THE FIELD POLL FOR ADVANCE PUBLICATION BY SUBSCRIBERS ONLY.
 THE FIELD POLL THE INDEPENDENT AND NON-PARTISAN SURVEY OF PUBLIC OPINION ESTABLISHED IN 1947 AS THE CALIFORNIA POLL BY MERVIN FIELD Field Research Corporation 601 California Street, Suite 900 San Francisco,
Please note: additional data sources are referenced throughout this presentation, including national exit polls and NBC/WSJ national survey data.
 Public Opinion Strategies is pleased to present key findings from two national surveys of 800 actual voters conducted on November 6, 2012. These surveys were merged, for a total of 1,600 actual voters
FINAL RESULTS: National Voter Survey Total Sample Size: 2428, Margin of Error: ±2.0% Interview Dates: November 1-4, 2018
 FINAL RESULTS: National Voter Survey Total Sample Size: 2428, Margin of Error: ±2.0% Interview Dates: November 1-4, 2018 Language: English and Spanish Respondents: Likely November 2018 voters in 72 competitive
 LEARNING OBJECTIVES After studying Chapter 10, you should be able to: 1. Explain the functions and unique features of American elections. 2. Describe how American elections have evolved using the presidential
Main idea: Voting systems matter.
 Voting Systems Main idea: Voting systems matter. Electoral College Winner takes all in most states (48/50) (plurality in states) 270/538 electoral votes needed to win (majority) If 270 isn t obtained -
Public Preference for a GOP Congress Marks a New Low in Obama s Approval
 ABC NEWS/WASHINGTON POST POLL: Obama and 2014 Politics EMBARGOED FOR RELEASE AFTER 12:01 a.m. Tuesday, April 29, 2014 Public Preference for a GOP Congress Marks a New Low in Obama s Approval Weary of waiting
Issue Overview: How the U.S. elects its presidents
 Issue Overview: How the U.S. elects its presidents By Bloomberg, adapted by Newsela staff on 09.27.16 Word Count 660 TOP: Voters head to the polls on Super Tuesday during the primaries. Photo by Alex Wong.
Emerson College Poll: Iowa Leaning For Trump 44% to 41%. Grassley, Coasting to a Blowout, Likely to Retain Senate Seat.
 November 4, 2016 Media Contact: Pr. Spencer Kimball Emerson College Polling Advisor Spencer_Kimball@emerson.edu 617-824- 8737 Emerson College Poll: Iowa Leaning For Trump 44% to 41%. Grassley, Coasting
ANOTHER CONGRESSIONAL WAVE ELECTION?
 Date: June 3, 2008 To: From: Friends of Democracy Corps and Greenberg Quinlan Rosner Stan Greenberg, James Carville and Ana Iparraguirre ANOTHER CONGRESSIONAL WAVE ELECTION? Democrats Improve Advantage
Pew Research Center Final Survey POPULAR VOTE A TOSSUP: BUSH 49%, GORE 47%, NADER 4%
 FOR IMMEDIATE RELEASE: Monday, November 6, 2000 FOR FURTHER INFORMATION: Andrew Kohut, Director Pew Research Center Final Survey POPULAR VOTE A TOSSUP: BUSH 49%, GORE 47%, NADER 4% The Pew Research Center
A Majority of Likely Voters Approve of President Trump s Decisions.
 TO: FROM: SUBJECT: COMMITTEE TO DEFEND THE PRESIDENT WPA INTELLIGENCE NATIONAL SURVEY TOP QUESTIONS DATE: JULY 11, 2017 The following memorandum illustrates key findings from a national, policy focused
What is The Probability Your Vote will Make a Difference?
 Berkeley Law From the SelectedWorks of Aaron Edlin 2009 What is The Probability Your Vote will Make a Difference? Andrew Gelman, Columbia University Nate Silver Aaron S. Edlin, University of California,
Florida s District 13 Election in 2006: Can Statistics Tell Us Who Won?
 Florida s District 13 Election in 2006: Can Statistics Tell Us Who Won? By Arlene Ash and John Lamperti Elections seem simple. People go to the polls. They make choices about one or more contests or issues.
The University of Akron Bliss Institute Poll: Baseline for the 2018 Election. Ray C. Bliss Institute of Applied Politics University of Akron
 The University of Akron Bliss Institute Poll: Baseline for the 2018 Election Ray C. Bliss Institute of Applied Politics University of Akron Executive Summary The 2018 University of Akron Bliss Institute
A Journal of Public Opinion & Political Strategy. Missing Voters in the 2012 Election: Not so white, not so Republican
 THE strategist DEMOCRATIC A Journal of Public Opinion & Political Strategy www.thedemocraticstrategist.org A TDS Strategy Memo: Missing White Voters: Round Two of the Debate By Ruy Teixeira and Alan Abramowitz
FOX News/Opinion Dynamics Poll 28 September 06
 FOX News/Opinion Dynamics Poll 28 September 06 Polling was conducted by telephone September 26-27, 2006, in the evenings. The total sample is 900 likely voters (LV) nationwide, with a margin of error of
The Electoral Process STEP BY STEP. the worksheet activity to the class. the answers with the class. (The PowerPoint works well for this.
 Teacher s Guide Time Needed: One class period Materials Needed: Student worksheets Projector Copy Instructions: Reading (2 pages; class set) Activity (3 pages; class set) The Electoral Process Learning
The Cook Political Report 2012 Election Outlook
 The Cook Political Report 2012 Election Outlook Presented by: David Wasserman, U.S. House Editor Southwest Ag Issues Summit September 10, 2012 Email: dwasserman@cookpolitical.com Web: http://www.cookpolitical.com
U.S Presidential Election
 U.S Presidential Election The US has had an elected president since its constitution went into effect in 1789. Unlike in many countries, the Presidential election in the US is rather a year-long process
Texas. SUPER DISTRICT A - FIVE SEATS % 2000 Presidential Vote
 Texas Racial Representation Of the voting population of 6,232,350, 28.7 are Latino and 11.0 are black. Under the current 32-district system, black voters do not make up the majority in any district and
Practice Questions for Exam #2
 Fall 2007 Page 1 Practice Questions for Exam #2 1. Suppose that we have collected a stratified random sample of 1,000 Hispanic adults and 1,000 non-hispanic adults. These respondents are asked whether
President Trump And America s 2020 Presidential Election: An Analytical Framework
 President Trump And America s 2020 Presidential Election: An Analytical Framework March 6, 2019 Trump 2020 Meets Trump 2016 Trump 2020 Is A Stronger Candidate Than Trump 2016 Looking purely at Trump s
REFORMING THE ELECTORAL FORMULA IN PEI: THE CASE FOR DUAL-MEMBER MIXED PROPORTIONAL Sean Graham
 1 REFORMING THE ELECTORAL FORMULA IN PEI: THE CASE FOR DUAL-MEMBER MIXED PROPORTIONAL Sean Graham As a strong advocate for improving the democratic integrity of voting systems, I am very excited that PEI
Possible voting reforms in the United States
 Possible voting reforms in the United States Since the disputed 2000 Presidential election, there have numerous proposals to improve how elections are conducted. While most proposals have attempted to
A positive correlation between turnout and plurality does not refute the rational voter model
 Quality & Quantity 26: 85-93, 1992. 85 O 1992 Kluwer Academic Publishers. Printed in the Netherlands. Note A positive correlation between turnout and plurality does not refute the rational voter model
The Electoral College
 The Electoral College 1 True or False? The candidate with the most votes is elected president. Answer: Not necessarily. Ask Al Gore. 2 The 2000 Election The Popular Vote Al Gore 50,996,039 George W. Bush