PPIC STATEWIDE SURVEY
|
|
|
- Elmer Stevens
- 5 years ago
- Views:
Transcription

1 PPIC STATEWIDE SURVEY SEPTEMBER 2005 Special Survey on Californians and the Initiative Process in collaboration with The James Irvine Foundation Public Policy Institute of California Mark Baldassare Research Director & Survey Director
2 The Public Policy Institute of California (PPIC) is a private operating foundation established in 1994 with an endowment from William R. Hewlett. The Institute is dedicated to improving public policy in California through independent, objective, nonpartisan research. PPIC s research agenda focuses on three program areas: population, economy, and governance and public finance. Studies within these programs are examining the underlying forces shaping California s future, cutting across a wide range of public policy concerns: the California economy, education, employment and income, immigration, infrastructure and urban growth, poverty and welfare, state and local finance, and the well-being of children and families. PPIC was created because three concerned citizens William R. Hewlett, Roger W. Heyns, and Arjay Miller recognized the need for linking objective research to the realities of California public policy. Their goal was to help the state s leaders better understand the intricacies and implications of contemporary issues and make informed public policy decisions when confronted with challenges in the future. PPIC does not take or support positions on any ballot measure or on any local, state, or federal legislation, nor does it endorse, support, or oppose any political parties or candidates for public office. David W. Lyon is founding President and Chief Executive Officer of PPIC. Thomas C. Sutton is Chair of the Board of Directors. Public Policy Institute of California 500 Washington Street, Suite 800 San Francisco, California Telephone: (415) Fax: (415) info@ppic.org
3 Preface The PPIC Statewide Survey series provides policymakers, the media, and the general public with objective, advocacy-free information on the perceptions, opinions, and public policy preferences of California residents. Inaugurated in April 1998, the survey series has generated a database that includes the responses of more than 122,000 Californians. The current survey is the second in a series of special surveys on Californians and the Initiative Process, supported with funding from The James Irvine Foundation. The three pre-election surveys we are conducting in August, September, and October are designed to provide information on Californians attitudes toward the citizens initiative process, their reactions to the special election and its state ballot measures, and the role of government distrust in shaping public opinion about the legislative process, the initiative process, and fiscal and governance reforms. This survey series seeks to raise public awareness, inform decisionmakers, and stimulate public discussion about these issues. On November 8 th, California voters will have the opportunity to participate in a special election. The state ballot will not include candidates but will present eight citizens initiatives on a wide range of topics. The last statewide special election was held in 2003, recalling the governor; and before that, there were three proposition-only special elections in 1973, 1979, and The November 8 th special election provides a unique opportunity to observe how the public views, reacts to, and approaches information-gathering and ballot choices on statewide citizens initiatives. This report presents the responses of 2,004 adult residents throughout the state on a wide range of issues: The November special election, including attitudes toward the election, awareness of election news and specific ballot measures, and voter support and underlying attitudes toward five state ballot measures, including teachers permanent status and dismissal (Proposition 74), state spending and school funding limits (Proposition 76), redistricting (Proposition 77), discounts on prescription drugs (Proposition 78), and prescription drug discounts (Proposition 79). State issues, including overall approval ratings of Governor Schwarzenegger and the state legislature, ratings of the governor and legislature in representing the best interests of the people, perceptions of the state s economy and the effects of increasing gasoline prices, attitudes toward immigrants and immigration policy, perceptions of the role of citizens initiatives, and attitudes toward the use of initiatives in making public policy. National issues, including overall approval ratings for President Bush and his handling of Hurricane Katrina, perceptions of the U.S. economy and the effects of Hurricane Katrina on the national economy and confidence in government, and preferences for national policies on health insurance coverage, discounts on prescription drugs, and various medical ethical issues. The extent to which Californians based on their party affiliation, demographics, race/ethnicity, and region of residence may differ with regard to attitudes toward the initiative process, the November 8 th special election and the specific ballot measures, and governance and fiscal reforms. This is the 59 th PPIC Statewide Survey, which has included a number of special editions on the Central Valley (11/99, 3/01, 4/02, 4/03, 4/04), Los Angeles County (3/03, 3/04, 3/05), Orange County (9/01, 12/02, 12/03, 12/04), San Diego County (7/02), population growth (5/01), land use (11/01, 11/02), housing (11/04), the environment (6/00, 6/02, 7/03, 11/03, 7/04, 7/05), the state budget (6/03, 1/04, 5/04, 1/05, 5/05), and California s future (8/04). Copies of this report may be ordered by (order@ppic.org) or phone ( ). Copies of this and earlier reports are posted on the publications page of the PPIC web site ( For questions about the survey, please contact survey@ppic.org. - i -
4 - ii -
5 Contents Preface Press Release i v Special Election 1 State Issues 7 National Issues 13 Survey Methodology 19 Survey Questions and Results 21 Survey Advisory Committee 27 - iii -
6
7 Press Release Para ver este comunicado de prensa en español, por favor visite nuestra página de internet: SPECIAL SURVEY ON CALIFORNIANS AND THE INITIATIVE PROCESS THE BOTTOM: ARE WE THERE YET? NATURAL DISASTERS, GAS PRICES FUEL ANGST, DISTRUST Special Election, Ballot Propositions Fail to Resonate with Support for Initiative Process, But Many See Room for Improvement SAN FRANCISCO, California, September 29, 2005 Hurricane Katrina and the surging gas prices associated with its aftermath have only aggravated Californians pessimism about economic conditions and the competence of government, according to a new survey released today by the Public Policy Institute of California (PPIC), with funding from The James Irvine Foundation. In light of these broader concerns, the state s looming special election is failing to galvanize voter interest or support. Californians today are feeling equally gloomy about the direction of the nation (34% right direction, 62% wrong direction) and the direction of the state (31% right direction, 60% wrong direction). Economic worries are driving much of this pessimism: Majorities expect bad economic conditions in the nation (63%) and the state (58%) in the next 12 months. Since the beginning of this year, the percentage of residents who expect good economic times in California has declined by a stunning 15 points (from 47% in January to 32% today). The last time state residents expressed such a lack of confidence in the economy? November 2001 during the first year of a significant recession. The post-katrina spike in gas prices has contributed to the decline in consumer confidence: The overwhelming majority of Californians (83%) believe that the price of gasoline will hurt the state s economy in the next six months and 51 percent think it will hurt a great deal. These sentiments recall findings from a 2001 survey early in the electricity crisis when 82 percent of residents said that energy prices would take a toll on the California economy. In terms of their own pocketbooks, more than half (57%) of all residents today say that the run-up in gas prices has caused them financial hardship. The effects are noticed most by Latinos (76%) and least by whites (45%) and are felt more strongly in the Central Valley and Los Angeles (61% each) than in other regions of the state. The mention of gasoline prices as the state s top issue rose sharply from last month (3% to 9%), with jobs and the economy (18%) and education (15%) still leading the pack. The lingering effects of Hurricane Katrina are also evident in Californians anxiety about the national economy. Seventy percent of state residents are either very concerned (30%) or somewhat concerned (40%) that Katrina will cause a nationwide recession. But the effects are not limited to economic issues: The government s response to Katrina has also affected Californians confidence in government to handle other disasters. Half of state residents say they have less confidence now than before Katrina that the government can handle a major terrorist attack (51%) or a major California earthquake (54%). Lackluster Response to Special Election, Ballot Measures With their focus on economic concerns and government response to crises, Californians show little interest in the upcoming special election. see little on the ballot that connects to their current concerns, says PPIC survey director Mark Baldassare. It s a major reason for the lackluster response to the election generally and to the specific measures on the ballot. A majority of likely voters (53%) say - v -
8 Press Release the special election is a bad idea, with only 40 percent calling it a good idea. On this question, there is a sharp partisan divide: While majorities of Democrats (73%) and independents (56%) dislike the idea of the special election, most Republicans support it (63%). Another telling sign of disinterest in the special election? When asked to name the ballot measure that interested them the most, voters top response was don t know (38%) or none (12%). Reflecting this disinterest, none of the measures actively supported by Governor Arnold Schwarzenegger currently enjoys majority support: Teacher tenure (Proposition 74) voters support for this measure which would increase probationary periods for public school teachers has declined by six points since August (from 49% to 43%). One reason for the lack of majority support for this initiative? seem more concerned about teacher retention than poor teacher performance: Half of voters (52%) say keeping good teachers is a big problem, while in August, 36 percent said poor teacher performance was a big problem. Spending and funding limits (Proposition 76) Similar to findings in August, the measure to limit state spending and change school funding requirements still trails by a large margin (63% oppose, 26% support). today are conflicted when asked about strict limits on state spending: 49 percent say it is a good idea and 43 percent a bad idea. In a May survey, likely voters were more supportive of spending limits (62% good idea, 30% bad idea). What changed? Democratic and independent voters have become less supportive of the idea. Redistricting (Proposition 77) More voters continue to oppose (50%) than support (33%) the proposal to have a panel of retired judges rather than lawmakers draw legislative districts. However, 17 percent remain undecided. Despite the lack of majority support for this measure, most voters agree that it is a bad idea for the state legislature and the governor to make decisions about redistricting. In a rare meeting of the minds, Democrats (72%) and Republicans (57%) share this view. Two competing ballot measures both offering proposals for prescription drug discounts also fail to capture the support of a majority of likely voters. Proposition 78 sponsored by a coalition of pharmaceutical companies is backed by 43 percent of voters, while 38 percent are opposed. Proposition 79 sponsored by consumer advocates and unions has the support of 34 percent of likely voters, with 40 percent opposed. There is confusion about the origins of both measures, with only 14 percent of voters able to correctly identify the sponsors of the initiatives in each case. Initiative Process: Californians Ready for (a Little) Change Although they are unhappy with the special election, Californians have not lost their devotion to initiatives. They still think that initiatives (39%) should have more influence than the legislature (32%) or governor (18%) over state policy. And most residents (74%) feel that initiatives raise important policy issues that elected officials have not adequately addressed. But despite their loyalty, 63 percent of Californians think the process needs either major (29%) or minor (34%) changes. Democrats (69%) and independents (64%) are more likely than Republicans (58%), and whites (64%) are somewhat more likely than Latinos (59%), to see a need for change. What do Californians dislike about the initiative process? Many residents believe that special interests have too much control (92%), find the ballot wording for initiatives complicated and confusing (77%), and think there are too many propositions on the state ballot (62%). One reason for Californians steadfast support for the initiative process may be their less-than-flattering assessment of their elected leadership. Currently, 33 percent of Californians approve and 58 percent disapprove of the way Governor Schwarzenegger is handling his job as governor. His ratings today are similar to those of the state legislature (32% approve, 53% disapprove). Fewer Californians today than one year ago say the governor is doing an excellent or good job working for their best interests (from 46% to 28%). voters are slightly more supportive of the governor than are Californians generally: 38 percent approve of his performance in office, while 55 percent disapprove. His ratings were virtually unchanged before and after he announced his reelection plans on September 16 th. - vi -
9 Press Release Universal Health Care, Canadian Drugs Get Thumbs Up By a wide margin, Californians prefer a universal health insurance system in which everyone is covered under a government program over the current system in which most health insurance is provided by employers or purchased privately. Only 34 percent prefer the current system, while 59 percent opt for a universal health care program. Six in 10 residents (63%) also favor guaranteeing health insurance coverage for all citizens, even if it means raising taxes, while only 33 percent oppose this option. Despite the broad support, there is a distinct partisan split: While Democrats (75%) and independents (69%) support guaranteed health insurance coverage for all citizens, most Republicans (57%) are opposed. Although the issue of universal health insurance may divide political parties in California, two issues concerning prescription drug discounts reveal some rare unanimity. Eight in 10 Californians (81%) including Democrats (86%), Republicans (80%), and independents (85%) strongly favor changing the law to allow Americans to buy prescription drugs from pharmacies in Canada if they think they can get a lower price. State residents (80%) are equally supportive of allowing the federal government to negotiate with drug companies to get a lower price on prescription drugs for Medicare recipients. More Key Findings Approval Ratings for President Bush Unchanged (page 13) Similar to his rating in August, 39 percent of Californians say they approve of the way President Bush is doing his job, while 58 percent disapprove. The president receives similar ratings for his handling of the situation caused by Hurricane Katrina (39% approve, 56% disapprove) and for his leadership on the economy (35% approve, 62% disapprove). Put This in Your Pipe (page 18) Most Californians (71%) including large majorities of Democrats (80%), Republicans (65%), and independents (73%) support the legal use of medical marijuana if it is prescribed by a doctor. Right to Die (page 18) A majority of state residents (55%) favor making it legal for doctors to give terminally ill patients the means to end their lives, while 38 percent are opposed. Most liberals (69%) favor such a law, while most conservatives (53%) oppose it. Immigrants Still a Benefit (page 24) Californians continue to see immigrants as a benefit (56%) rather than a burden (36%) to the state. And 60 percent say that illegal immigrants should be permitted to apply for work permits that would authorize them to stay and work in the U.S. About the Survey This survey on the initiative process and special election made possible with funding from The James Irvine Foundation is a special edition of the PPIC Statewide Survey. This is the second in a series of surveys designed to provide information about Californians attitudes toward the state s initiative process and this November s special election. Findings of this survey are based on a telephone survey of 2,004 California adult residents interviewed between September 12 and September 19, Interviews were conducted in English and Spanish. The sampling error for the total sample is +/- 2%. The sampling error for the 1,013 likely voters is +/- 3%. For more information on methodology, see page 19. Mark Baldassare is research director at PPIC, where he holds the Arjay and Frances Fearing Miller Chair in Public Policy. He is founder of the PPIC Statewide Survey, which he has directed since His recent book, A California State of Mind: The Conflicted Voter in a Changing World, is available at PPIC is a private, nonprofit organization dedicated to improving public policy through objective, nonpartisan research on the economic, social, and political issues that affect Californians. The institute was established in 1994 with an endowment from William R. Hewlett. PPIC does not take or support positions on any ballot measure or on any local, state, or federal legislation, nor does it endorse, support, or oppose any political parties or candidates for public office. This report will appear on PPIC s website ( on September 29 th. ### - vii -
10 Proposition 74 Teacher Waiting Period 10 Proposition 76 Spending Limits Percent Yes No Don't know 63 Percent Yes No Don't know Proposition 77 Redistricting Proposition 78 Discounts on Prescriptions Percent Yes No Don't know 38 Percent Yes No Don't know Proposition 79 Prescription Drug Discounts Concern That Katrina Will Cause a Recession Percent 40 Yes No Don't know Percent Adults 40 Very concerned Somew hat concerned Not too concerned Not at all concerned Don't know
11 Voter Interest Special Election As the initiative campaigns take shape, 53 percent of California likely voters say the special election called by Governor Schwarzenegger is a bad idea, while 40 percent of likely voters say it is a good one. Republicans say the special election is a good idea by about a two-to-one margin. Negative opinions about the special election are more pronounced among Democrats (23% good idea, 73% bad idea). A majority of independents (56%) describe the special election as a bad idea. Support for calling the special election is highest in the Other Southern California region (San Diego, Orange, Riverside, and San Bernardino Counties), while those living in the San Francisco Bay Area are more likely to call it a bad idea. During our September survey, the percentage saying the special election is a good idea was at 39 percent before, and 43 percent after, the governor s reelection announcement on September 16 th. views of the special election are highly correlated with their perceptions of the governor. Those who approve of his job performance express positive opinions about the election (78% good idea, 15% bad idea) while those who disapprove are negative about the election (16% good idea, 81% bad idea). About seven in 10 likely voters (69%) are following the news about the special election very closely or fairly closely, similar to the level of attention to election news in August (68%). When likely voters are asked which of the initiatives on the special election ballot most interests them, each of the eight initiatives is mentioned by fewer than 10 percent of voters (for example, 9% for Proposition 74, 8% for Proposition 75, 6% for Proposition 76, 8% for Proposition 77). Twelve percent say that none of the initiatives interests them, and 38 percent say they don t know. Governor Schwarzenegger has called a special election in November 2005 to vote on budget, educational, and governmental reform measures. In general, do you think the special election is a good idea or a bad idea? Only Dem Rep Ind Central Valley SF Bay Area Region Los Angeles Other Southern California Good idea 40% 23% 63% 36% 42% 28% 40% 52% Bad idea Neither (volunteered) Don't know How closely are you following news about the special election on November 8 th? Only Dem Rep Ind Central Valley SF Bay Area Region Los Angeles Other Southern California Very closely 19% 21% 16% 21% 20% 16% 17% 22% Fairly closely Not too closely Not at all closely Don't know
12 Special Election Proposition 74: Teacher Waiting Period and Dismissal One ballot initiative endorsed by the governor, Proposition 74, is supported by 43 percent of likely voters, while 47 percent would vote against it. This measure would increase the probationary period for public school teachers from two to five years and modify the process by which school boards can dismiss a teacher with two consecutive unsatisfactory performance evaluations. Last month, 49 percent of likely voters said they would vote yes and 42 percent said they would vote no on the measure. While six in 10 Democrats would vote no on Proposition 74, six in 10 Republicans would vote yes; independents lean against it (40% yes, 50% no). About four in 10 voters in the San Francisco Bay Area and Los Angeles are in favor of this initiative, while support is higher in the Central Valley (50%) and Other Southern California region (46%). Seventy-two percent of those who approve of the governor s performance would vote yes on Proposition 74, while 66 percent of those who disapprove of his performance say they would vote no. During our September survey, support for Proposition 74 was at 42 percent before and 45 percent immediately after the governor s reelection announcement on September 16 th. Teacher quality is a concern to voters. Half of voters (52%) say keeping good teachers is a big problem, while in August 36 percent said poor teacher performance was a big problem. Those opposing Proposition 74 are more likely than those favoring it to say retaining good teachers is a big problem today (57% to 48%). Proposition 74 is called the Public School Teachers Waiting Period for Permanent Status and Dismissal Initiative If the election were held today, would you vote yes or no on Proposition 74? * Only August 2005 September 2005 Yes 49% 43% No Don't know 9 10 Only Dem Rep Ind Central Valley SF Bay Area Region Los Angeles Other Southern California Yes 43% 28% 64% 40% 50% 42% 39% 46% No Don t know Do you think that retaining good teachers is a big problem, somewhat of a problem, or not much of a problem in California's public schools today? Only Proposition 74 Yes No Big problem 52% 48% 57% Somewhat of a problem Not much of a problem Not at all a problem (volunteered) Don't know * For complete question wording, see question 13 in the survey questionnaire, page
13 Proposition 76: State Spending and School Funding Limits Special Election Proposition 76, endorsed by Governor Schwarzenegger, is supported by 26 percent of likely voters while 63 percent would vote no. This measure would limit state spending to the prior year level plus three years average revenue growth, change the minimum school funding requirements required by Proposition 98, and permit the governor, under some conditions, to reduce budget appropriations at his or her discretion. When asked about Proposition 76 in our August survey, 61 percent said they would vote no, and 28 percent said they would vote yes. During our September survey, support for Proposition 76 was similar before (25%) and after (26%) the governor s reelection announcement. Republicans favor this measure (48% to 41%), while majorities of Democrats (81%) and independents (65%) oppose it. Support for this measure is currently highest in the Other Southern California region. Among those who approve of the governor s performance, 56 percent say they would vote yes, while 85 percent of those who disapprove of his performance say they would vote no. Support for this measure is short of a majority in all racial/ethnic and demographic groups. today are conflicted when asked if it is a good idea or a bad idea to strictly limit the amount of state spending. Those who currently support Proposition 76 are overwhelmingly supportive of limiting spending (88%), but one in three who oppose the measure also think this is a good idea. In our May survey, likely voters supported the idea to limit spending (62% good idea, 30% bad idea). Since then, however, Democratic and independent voters have become less supportive of spending limits. Proposition 76 is called the State Spending and School Funding Limits Initiative Constitutional Amendment If the election were held today, would you vote yes or no on Proposition 76? * Only August 2005 September 2005 Yes 28% 26% No Don't know Only Dem Rep Ind Central Valley SF Bay Area Region Los Angeles Other Southern California Yes 26% 9% 48% 19% 24% 22% 21% 35% No Don t know Do you think it is a good idea or a bad idea to strictly limit the amount of money that state spending could increase each year? Only Proposition 76 Yes No Good idea 49% 88% 32% Bad idea Don't know * For complete question wording, see question 15 in the survey questionnaire, page September 2005
14 Special Election Proposition 77: Redistricting Proposition 77, also endorsed by the governor, is opposed by 50 percent of the voters and supported by 33 percent, while one in six is undecided. This citizens initiative would reassign responsibility for redrawing California s senate, assembly, congressional, and Board of Equalization districts from the governor and state legislature to a three-member panel of retired judges selected by legislative leaders. In August, 34 percent of likely voters said they would vote yes, 49 percent said they would vote no, and 17 percent were undecided. Half of Republicans would vote yes, while two in three Democrats would vote no; independents are also inclined to vote no (27% yes, 54% no). Support is strongest in the Other Southern California area. Those who say they approve of the governor s performance tend to support Proposition 77 (57% yes), while those who disapprove of the governor s performance tend to oppose the measure (65% no). During our September survey, support for Proposition 77 was similar when comparing before (34%) and after (32%) the governor s September 16 th reelection announcement. Those who think the special election is a good idea support Proposition 77 (56% yes), and those who say the election is a bad idea tend to oppose it (67% no). While support for Proposition 77 falls short of a majority, two in three likely voters agree it is a bad idea for the governor and legislature to make the decisions about redistricting. Majorities saying they would vote yes and no on Proposition 77 agree on this point. Republicans (57%) and Democrats (72%) both view gubernatorial and legislative responsibility for redistricting as a bad idea. Proposition 77 is called the Redistricting Initiative Constitutional Amendment If the election were held today, would you vote yes or no on Proposition 77? * Only August 2005 September 2005 Yes 34% 33% No Don't know Only Dem Rep Ind Central Valley SF Bay Area Region Los Angeles Other Southern California Yes 33% 18% 51% 27% 34% 30% 32% 39% No Don t know Do you think it is a good idea or a bad idea for the California legislature and governor to make the decisions about redistricting? Only Proposition 77 Yes No Good idea 22% 37% 14% Bad idea Don't know * For complete question wording, see question 17 in the survey questionnaire, page
15 Proposition 78: Discounts on Prescription Drugs Special Election Propositions 78 and 79 are competing initiatives dealing with prescription drug prices. Proposition 78 is sponsored by a coalition of pharmaceutical companies and would provide for companies to sell prescription medications at a discounted price voluntarily to uninsured Californians with incomes below $58,050 for a family of four. With support falling short of a majority, 43 percent of likely voters say they will vote yes on Proposition 78, while 38 percent say they will vote no, and 19 percent are undecided. Proposition 78 leads by 10 points among Democrats (46% yes, 36% no), while it runs about even among Republicans (41% yes, 40% no) and independents (41% yes, 37% no). Support for this measure declines with age, income and education, and the only demographic group giving the measure majority support is those who have not attended college (53%). Latinos are somewhat more likely than whites to say they would vote yes on Proposition 78 (49% to 42%). There appears to be confusion about the origin of Proposition 78. Only 14 percent of voters are aware that it is being sponsored by the pharmaceutical industry. Another 14 percent incorrectly identify Proposition 78 as being sponsored by consumer advocates and unions who are actually the sponsors of Proposition 79, the competing measure. Fully seven in 10 voters are uncertain about the sponsorship of Proposition 78. Among those who plan to vote yes on Proposition 78, about one in four believes the measure is sponsored by consumer advocates and unions. Among those who plan to vote no on Proposition 78, a similar number, one in four, identify it as being sponsored by pharmaceutical companies. Proposition 78 is called the Discounts on Prescription Drugs Initiative Statute If the election were held today, would you vote yes or no on Proposition 78? * Only Dem Rep Ind Central Valley SF Bay Area Region Los Angeles Other Southern California Yes 43% 46% 41% 41% 42% 41% 43% 42% No Don t know Do you happen to know if the Yes on Proposition 78 campaign is supported by the pharmaceutical industry or by consumer advocates and unions? Only Proposition 78 Yes No Pharmaceutical companies 14% 9% 24% Consumer advocates and unions Both (volunteered) Neither (volunteered) Don't know * For complete question wording, see question 19 in the survey questionnaire, page September 2005
16 Special Election Proposition 79: Prescription Drug Discounts Proposition 79 requires pharmaceutical companies to provide state-negotiated discounts or have their products taken off the Medi-Cal preferred medication list. Thirty-four percent of those surveyed would vote yes on Proposition 79, and 40 percent would vote no, with 26 percent undecided. Proposition 79 is sponsored by consumer advocates and unions and has recently been the target of vote no advertising sponsored by the pharmaceutical industry. It trails among Democrats (34% yes, 43% no) and Republicans (33% yes, 40% no), while independents are evenly divided (36% yes, 36% no). Support falls well short of a majority in all demographic groups. Only 14 percent can identify the sponsors of this measure, while two in three are unsure. About one in four of those supporting Proposition 79 think that consumer groups are its sponsors. Forty-five percent of voters are worried they will not be able to afford prescription drugs. Among those who are worried, 45 percent favor Proposition 78 and 37 percent support Proposition 79. Proposition 79 is called the Prescription Drug Discounts State-Negotiated Rebates Initiative Statute If the election were held today, would you vote yes or no on Proposition 79? * Only Dem Rep Ind Central Valley SF Bay Area Region Los Angeles Other Southern California Yes 34% 34% 33% 36% 28% 33% 36% 39% No Don t know Do you happen to know if the Yes on Proposition 79 campaign is supported by the pharmaceutical industry or by consumer advocates and unions? Only Proposition 79 Yes No Pharmaceutical companies 16% 10% 25% Consumer advocates and unions Both (volunteered) Neither (volunteered) Don't know How worried are you that you won't be able to afford the prescription drugs you need? Only Dem Rep Ind Very worried 21% 29% 14% 19% Somewhat worried Not too worried Not at all worried * For complete question wording, see question 21 in the survey questionnaire, page
17 Governor s Approval Ratings State Issues Approval of Governor Schwarzenegger s overall job-performance has reached a low point for his term in office among all adults (33%), registered voters (35%), and likely voters (38%). Conversely, disapproval of his performance has increased substantially from a year ago among all three groups: all adults (31% to 58%), registered voters (28% to 57%) and likely voters (28% to 55%). Moreover, the governor s decision to run for a second term has had little effect on his ratings. During the September survey, they were similar among all adults before (34% approve, 58% disapprove) and after (33% approve, 57% disapprove) he announced his reelection plans at a San Diego rally on September 16 th. Among political groups, a large majority of Republicans (66%) approve, while a large majority of Democrats (78%) and independents (60%) disapprove, of the governor s performance. In every region of the state, fewer than half of adults approve of his performance, but his approval ratings are lowest in Democratic-leaning Los Angeles (26%) and the San Francisco Bay Area (28%). The governor receives much higher approval ratings from whites (43% approve, 49% disapprove) than from Latinos (18% approve, 73% disapprove), and approval of his performance increases with age, education, and income. Overall, do you approve or disapprove of the way that Arnold Schwarzenegger is handling his job as governor of California? Region Adults Dem Rep Ind Central Valley SF Bay Area Los Angeles Other Southern California Approve 33% 14% 66% 32% 41% 28% 26% 40% 38% Disapprove Don't know When asked to evaluate the governor in terms of working for their best interests, 28 percent of all adults, and 33 percent of likely voters, believe he is doing an excellent or good job, but 40 percent say he is doing a poor job. Again, the ratings reflect a partisan divide: 57 percent of Republicans think he is doing an excellent or good job of working for their interests, compared to only 30 percent of independents and 13 percent of Democrats. Also consistent with the governor s overall ratings, whites (38%) are much more likely than Latinos (14%) to give him excellent or good ratings when it comes to working for their best interests. A year ago, almost half of all adults (46%) and likely voters (48%) rated the governor as excellent or good on this dimension, while two in 10 said he was doing a poor job. How would you rate Governor Schwarzenegger when it comes to working for the best interests of people like you? Region Adults Dem Rep Ind Central Valley SF Bay Area Los Angeles Other Southern California Excellent/Good 28% 13% 57% 30% 36% 24% 21% 36% 33% Fair Poor Don't know
18 State Issues Legislature s Approval Ratings The state legislature also gets low performance ratings from all adults (32% approve, 53% disapprove), registered voters (30% approve, 56% disapprove), and likely voters (28% approve, 60% disapprove). Compared to ratings a year ago, the legislature s approval ratings among all adults have fallen (40% to 32%) and its disapproval ratings have risen (46% to 53%). adults give the legislature and governor similar approval ratings (32% to 33%), but the governor has higher approval ratings among registered voters (35% to 30%) and likely voters (38% to 28%). A majority of residents in all regions of the state say they disapprove of the legislature s performance. Although Democrats control the legislature, only 35 percent of Democrats approve of its performance, compared to 21 percent of Republicans, and 32 percent of independents. These partisan differences in ratings of the legislature are not nearly as strong as the partisan divide over the governor s performance. Apparently, concerns about the state s future relate to feelings about the legislature but attitudes toward the governor do not: The legislature gets low marks from those who think the state is headed in the wrong direction (24% approve, 64% disapprove) and for bad economic times (30% approve, 55% disapprove). However, it gets the same low marks from those who approve of the governor s performance (32% approve, 56% disapprove) as from those who disapprove (33% approve, 53% disapprove). Overall, do you approve or disapprove of the way that the California legislature is handling its job? Region Adults Dem Rep Ind Central Valley SF Bay Area Los Angeles Other Southern California Approve 32% 35% 21% 32% 31% 33% 30% 33% 28% Disapprove Don't know Californians also give the legislature low marks on working for their best interests: 20 percent give it excellent or good ratings while 31 percent rate it poor. Democrats (20%), Republicans (15%), and independents (18%) all give the legislature low ratings on this dimension, and approval ratings are similarly low across the state s regions, racial/ethnic, and demographic groups. A year ago, 20 percent of all adults, and 18 percent of likely voters, rated the legislature as excellent or good when it comes to working for their best interests, while three in 10 said they were doing a poor job. How would you rate the California legislature when it comes to working for the best interests of people like you? Region Adults Dem Rep Ind Central Valley SF Bay Area Los Angeles Other Southern California Excellent/Good 20% 20% 15% 18% 21% 22% 21% 17% 18% Fair Poor Don't know
19 State Issues The Economy A majority of Californians are pessimistic about both the financial future and the general direction of the state and much more pessimistic than they were at the beginning of the year. Nearly six in 10 (58%) believe the state is headed for bad financial times in the next 12 months. Only one in three expect good times financially. This perception is shared by registered voters (32% good times, 58% bad times) and likely voters (33% good times, 57% bad times). Since the beginning of this year, the percentage of residents who think the economy is headed for good economic times has declined by a stunning 15 points. It has declined by 18 points overall from last year. Since January 2004, belief that good times are ahead has dropped from 49 percent to 32 percent, and belief that bad times are coming has increased from 36 percent to 58 percent. Today, solid majorities in all regions of the state and across income and education categories expect bad economic times in the next 12 months. However, pessimism tends to decline slightly with age, education, and income. Perceptions of the economy seem to have a partisan dimension: Republicans (44%) are more likely than Democrats (24%) and independents (35%) to say that good economic times are coming. Analogously, those who approve of Governor Schwarzenegger s and President Bush s performance are more likely than those who disapprove to say that good economic times are ahead. Also pointing to concerns about the state s economy, Californians most often name jobs and the economy (18%) as the top issue facing the people of the state, followed by education and schools (15%) and rising gasoline prices (9%). Mention of gasoline prices rose sharply from last month (3% to 9%). Pessimism extends to the state of the State: 31 percent say it s headed in the right direction, 60 percent in the wrong direction. The pessimism is shared by registered voters (30% right direction, 62% wrong direction) and likely voters (27% right direction, 64% wrong direction). Residents were more optimistic about California at the beginning of the year (46% right direction, 41% wrong direction) and a year ago (47% right direction, 40% wrong direction). Turning to economic conditions in California, do you think that during the next 12 months we will have good times financially or bad times? Region Adults Central Valley SF Bay Area Los Angeles Other Southern California Good times 32% 34% 28% 31% 35% 33% Bad times Don't know Adults January 2004 May 2004 Sept 2004 January 2005 May 2005 Sept 2005 Good times 49% 42% 46% 47% 39% 32% Bad times Don't know September 2005
20 State Issues Gasoline Prices The overwhelming majority of Californians (83%) believe that the price of gasoline will hurt the state s economy in the next six months 51 percent think it will hurt the economy a great deal. These sentiments are similar to findings in our January 2001 survey, early in the electricity crisis, when 82 percent of adults said that energy prices would hurt the California economy a great deal (56%) or somewhat (26%) in the next few years. Belief that gasoline prices will hurt the economy is pervasive across the state s major regions and demographic groups. However, that belief is stronger among lower-income and less-educated residents and stronger among Latinos (66%) than whites (43%). Politics also influence perception of this issue: Democrats and people who disapprove of the job Bush and Schwarzenegger are doing are more likely than Republicans and those who approve of their performances to say gasoline prices will do a great deal of harm to the economy. There is also a strong correlation between assessments of how gasoline prices will affect the economic outlook and trends in pessimism about the current state of the State and the state s economic outlook. Fiftyeight percent of those who say the state is headed in the wrong direction, and 63 percent who expect bad economic times, believe that gasoline prices will hurt the economy a great deal in the next six months. More than half (57%) of all residents also say that the gasoline price increases have caused them financial hardship. Similar trends were evident in our July 2004 survey after another major spike in prices. Californians are not alone: 64 percent of Americans voiced these concerns in an ABC News/Washington Post poll this month. In California, the financial effects of higher gasoline prices are felt most among lower-income residents. Among racial/ethnic groups, the effects are noticed most by Latinos (76%) and least by whites (45%). While evident in all regions, financial hardships are most commonly reported in the Central Valley and Los Angeles. During the next 6 months, do you think the price of gasoline will hurt the California economy or not? (if yes: Do you think it will hurt the California economy a great deal or only somewhat? ) Region Adults Central Valley SF Bay Area Los Angeles Other Southern California Yes, great deal 51% 54% 42% 53% 52% 44% Yes, somewhat No Don't know Have recent price increases in gasoline caused any financial hardship for you or your household? Region Adults Central Valley SF Bay Area Los Angeles Other Southern California Yes, caused hardship 57% 61% 53% 61% 54% 48% No, not caused hardship Don't know
21 Role of Initiatives State Issues Californians are more likely to say the upcoming special election with eight initiatives on the ballot is a bad idea than a good idea. But that doesn t mean they have given up support for the initiative process. They still think that initiatives (39%) should have more influence than the legislature (32%) or governor (18%) over state policy. voters have an even greater preference for initiatives (42%) and less for the governor (16%). Moreover, those who favor initiatives having the most influence on policy are somewhat more likely to call the special election a good idea than a bad idea (48% to 42%). Since a year ago, Californians preference for initiatives (37% to 39%) and the legislature (31% to 32%) is about the same, while support for the governor s influence has declined somewhat (23% to 18%). Preferences today have changed very little since our December 1999 survey (42% initiatives; 30% legislature; 21% governor). Republicans much prefer initiatives (46%) to the legislature (24%) for setting policy, while Democrats and independents prefer the legislature over initiatives. However, Republicans (21%) and independents (20%) are both more likely than Democrats (13%) to believe the governor should have the most influence. Preference for initiatives is stronger among whites (43%) than Latinos (34%) and among women (42%) than men (36%). In California state government today, which of the following would you prefer to have the most influence over public policy the governor, the legislature, or initiatives on the state ballot? Adults Dem Rep Ind The governor 18% 13% 21% 20% 16% The legislature Initiatives on the state ballot Other answer Don't know Despite their support for the use of the initiative process, 63 percent of residents think this process needs either major (29%) or minor changes (34%). Democrats (69%) and independents (64%) are more likely than Republicans (58%), and whites (64%) are somewhat more likely than Latinos (59%) to see a need for change. Even among those who believe initiatives should have the most influence on public policy, six in 10 of all adults think the process needs major or minor changes. Of the adults who say the November special election is a bad idea, 70 percent say changes to the initiative system are needed. Nevertheless, the percentage of residents who say the initiative process is fine the way it is has increased by eight points since last September (21% to 29%). Do you think the citizens' initiative process in California is in need of major changes or minor changes or that it is basically fine the way it is at this time? Adults Dem Rep Ind Major changes 29% 36% 23% 30% 28% Minor changes Fine the way it is Don't know September 2005
22 State Issues Initiative Process Californians clearly see both strengths and flaws in the initiative process. In terms of positive perceptions, 74 percent of adults and 79 percent of likely voters believe that initiatives raise important public policy issues that the governor and state legislature have not adequately addressed, and about one in three strongly agree. This view is held by Democrats (75%), Republicans (78%), and independents (80%) alike and is unchanged from August 2004 (75%). As for negative perceptions, 62 percent of all adults agree that there are too many propositions on the ballot, with 32 percent strongly agreeing, and likely voters holding a similar opinion. Democrats (67%) and independents (67%) are more likely than Republicans (57%), and older adults are more likely than younger adults, to think there are too many propositions on the state ballot. The number of Californians who strongly agree with that position has risen four points since August 2004 (28%). According to nearly eight in 10 adults, the ballot wording for initiatives is often too complicated and confusing. About half of all adults (47%) and 53 percent of likely voters strongly agree. Solid majorities of Democrats (83%), independents (80%), and Republicans (77%) strongly agree or somewhat agree with this statement. The perception of this problem increases with age, education, and income. The percentage who strongly agree has again risen 4 points since August 2004 (43%). Many Californians also think that special interests have a lot (56%) or some (36%) control over the initiative process. The percentage who say a lot has risen 4 points since January Among likely voters, 65 percent say special interests have a lot of control over initiatives. Nevertheless, most adults also think that initiatives generally reflect the views of ordinary Californians (63%), with 19 percent strongly agreeing. The views of likely voters are similar, and most Democrats, (61%), Republicans (68%), and independents (69%) also agree. Adults Dem Rep Ind Citizens' initiatives bring up important public policy issues that the governor and state legislature have not adequately addressed Strongly agree 32% 34% 35% 35% 36% Somewhat agree Somewhat disagree Strongly disagree Don't know Strongly agree There are too many propositions on the state ballot Somewhat agree Somewhat disagree Strongly disagree Don't know The ballot wording for Strongly agree citizens' initiatives is often too complicated Somewhat agree and confusing for voters Somewhat disagree to understand what happens if the initiative Strongly disagree passes Don't know
23 President s Approval Ratings National Issues President Bush s job approval ratings have remained low and unchanged over the past few months. Today, about four in ten adults (39%), registered voters (38%), and likely voters (38%) say they approve of the way he is handling his job as president, while six in 10 in these groups disapprove of his performance. In August, 38 percent approved and 58 percent disapproved of the president s performance. The similar approval ratings for the president before and after Hurricane Katrina stand in stark contrast to his changing approval ratings before and after the September 11 th terrorist attacks. In PPIC Statewide Surveys in 2001, Bush s approval jumped 33 points, from 47 percent in July to 80 percent in November. There continue to be strong partisan and regional differences in the presidential ratings. Bush has high approval ratings from Republicans (73%), while far fewer independents (31%) and Democrats (17%) say they approve of his job performance. Approval ratings are higher in the Central Valley (52%) and the Other Southern California region (46%) than in Los Angeles (33%) and the San Francisco Bay Area (27%). There are no significant differences in his approval ratings across income, age, and racial/ethnic groups. Bush s approval ratings in California are similar to those found in national surveys. A recent CNN/USA Today/Gallup poll shows that 40 percent approve of the way Bush is handling his job. In a similar vein, four in 10 Californians (39%) say they approve of the way Bush is handling the situation caused by Hurricane Katrina nearly six in 10 say they disapprove. Again, there are strong partisan differences, with 73 percent of Republicans expressing approval of the way the president is responding to the hurricane, compared to only 18 percent of Democrats and 34 percent of independents. Such ratings, again, stand in contrast to the president s post-september 11 th ratings: In November 2001, 83 percent of Californians approved of the way Bush was handling terrorism. The California approval ratings of the president s response to Katrina are similar to the approval ratings found among adults nationally (41%) in a recent CNN/USA Today/Gallup poll. When it comes to economic issues, about one in three California adults and likely voters approves of the way Bush is handling the economy, while six in 10 disapprove. There are partisan differences, with 69 percent of Republicans approving of his economic performance compared to fewer Democrats (15%) and independents (28%). Whites (40%) are more likely than Latinos (30%) to approve of Bush s economic performance. The disapproval rating of the president s handling of the economy is higher today (62%) than one year ago (56%) and two years ago (52%). Nationally, a recent CNN/USA Today/Gallup poll found that 35 percent of adults approve of the president s handling of the economy and 63 percent disapprove. Overall, do you approve or disapprove of the way that George W. Bush is handling Adults Dem Rep Ind His job as president of the United States The situation caused by Hurricane Katrina The economy Approve 39% 17% 73% 31% 38% Disapprove Don't know Approve Disapprove Don't know Approve Disapprove Don't know
24 National Issues Overall Mood Californians are feeling equally pessimistic about the direction of the nation (34% right direction, 62% wrong direction) and the direction of their state (31% right direction, 60% wrong direction). The public s outlook with regard to the overall course of the country is more pessimistic than it was at the beginning of this year (43% right direction, 51% wrong direction), one year ago (42% right direction, 54% wrong direction), and in September 2003 (42% right direction, 51% wrong direction). According to a recent CBS News/New York Times survey, adults nationwide are also downbeat about the state of the nation (31% say we re heading in the right direction, while 63% say we re not). There is a strong partisan divide in California: 81 percent of Democrats and 69 percent of independents say the nation is heading the wrong way, while 62 percent of Republicans say we re on the right course. Residents in the Central Valley (45%) and Other Southern California region (41%) are more likely than residents in the San Francisco Bay Area (24%) and Los Angeles County (27%) to say that things in the United States are generally going in the right direction. Residents across age, income, and education groups say the country is going in the wrong direction. Nine in 10 of those who disapprove of the way President Bush is handling his job say the country is headed in the wrong direction. Do you think things in the United States are generally going in the right direction or the wrong direction? Region Adults Dem Rep Ind Central Valley SF Bay Area Los Angeles Other Southern California Right direction 34% 16% 62% 29% 45% 24% 27% 41% 35% Wrong direction Don't know When asked about the economic conditions of the nation over the next 12 months, Californians are as pessimistic as they are about the overall direction of the state and the nation. Six in 10 adults (63%) and likely voters (62%) believe that the nation will encounter bad times financially, while three in 10 think that the country will experience good economic times during the next year. Californians perspectives on the U.S. economy are more negative today than they were in January (48% good times, 43% bad times), a year ago in September 2004 (47% good times, 41% bad times), and two years ago in September 2003 (47% good times, 42% bad times). Democrats (79%) and independents (64%) are far more likely than Republicans (41%) to say that the nation will face bad financial times in the next year. Eight in 10 of those who disapprove of President Bush s economic performance predict a bad economy during the upcoming year. A majority of residents across age, income, and education groups hold a negative view of the nation s economic outlook. Turning to economic conditions, do you think that during the next 12 months the United States will have good times financially or bad times? Adults Dem Rep Ind Good times 30% 15% 52% 28% 30% Bad times Don't know
25 Hurricane Katrina National Issues In the early morning hours of August 29 th, Hurricane Katrina made landfall near the Louisiana- Mississippi border and devastated the cities and towns that lay in its path. However, the effect of this catastrophic storm was not limited to the Gulf Coast as it has broad political and economic ramifications. For example, the effects of Katrina are evident in Californians anxiety about the national economy. Seventy percent of California residents are either very concerned (30%) or somewhat concerned (40%) that Katrina will cause a nationwide recession. Only three in 10 residents are not too concerned (19%) or not at all concerned (10%) about the economic repercussions of the hurricane. Democrats (78%) are more likely than Republicans (52%) or independents (65%) to express concern. In a recent Pew Research Center survey, 80 percent of Americans said they were concerned about Hurricane Katrina causing a recession. How concerned are you that the impact of Hurricane Katrina will cause a nationwide recession? Adults Dem Rep Ind Very concerned 30% 33% 15% 29% 23% Somewhat concerned Not too concerned Not at all concerned Don't know The government s response to Katrina has also affected Californians confidence in government to handle other disasters. Half of Californians say they have less confidence now than before Katrina that the government can handle a major terrorist attack or a major California earthquake. In a recent survey by the Pew Research Center, 42 percent of Americans said they had less confidence in the government s response to terrorist attacks. There are partisan and regional differences on this dimension of confidence. In the aftermath of Katrina, Democrats have less confidence than independents and Republicans in the government s ability to effectively respond to terrorism and earthquakes. Lack of confidence in government response to these disasters is greater among adults living in the San Francisco Bay Area (57% terrorism, 60% earthquakes) and Los Angeles (56% terrorism, 58% earthquakes) than in the Other Southern California region (47% terrorism, 51% earthquakes) and the Central Valley (43% terrorism, 45% earthquakes). Has the government's response to Hurricane Katrina affected your confidence in the government's ability to handle a (if yes: Has it made you more confident or less confident? ) Major Terrorist Attack Major California Earthquake Adults Dem Rep Ind Adults Dem Rep Ind Yes, more confident 5% 3% 2% 6% 3% 5% 4% 4% 5% 4% Yes, less confident No Don't know September 2005
26 National Issues Health Insurance Californians would prefer a universal health insurance system in which everyone is covered under a government program like Medicare over the current system in which most health insurance is provided by employers or purchased privately. While 34 percent prefer the current system, 59 percent would opt for a universal health insurance program. Support for universal health insurance over the current system is nearly identical to that found in our September 2004 survey (60%, 35%). voters also prefer a universal health insurance system, but by a narrower 10-point margin (51%, 41%). Californians preference with regard to health care coverage is similar to that of adults nationwide (62% universal health insurance, 32% current system), according to a 2003 ABC News/Washington Post poll. In California, the current health system s staunchest supporters are Republicans (63%), while Democrats (70%) and independents (61%) prefer a universal health insurance system. More than half of adults in all demographic groups favor universal health insurance; however, support is stronger among Latinos than whites (74%, 51%) and is higher among those with lower incomes and lower education levels. Which would you prefer the current health insurance system in the United States, in which most people get their health insurance from private employers, but some people have no insurance, or a universal health insurance program, in which everyone is covered under a program like Medicare that is run by the government and financed by taxpayers? Adults Dem Rep Ind Under $40,000 Household Income $40,000 to $79,999 $80,000 or more Current system 34% 23% 63% 31% 22% 41% 42% 41% Universal health insurance system Don't know A solid majority of Californians (63%) also favor guaranteeing health insurance coverage for all citizens, even if it means raising taxes, while only 33 percent oppose this option. voters strongly support raising taxes for this purpose (61% favor, 36% oppose). A national survey in August 2005 by the Pew Research Center found similar results (64% favor, 30% oppose). Democrats (75%) and independents (69%) in California strongly favor guaranteed health insurance, even if it increases taxes, while a majority of Republicans (57%) oppose it. At least six in 10 in all demographic groups favor guaranteeing health insurance for everyone, and there are no differences by income, age or education. Latinos (69%) show higher levels of support than whites (60%). Do you favor or oppose the U.S. government guaranteeing health insurance for all citizens, even if it means raising taxes? Adults Dem Rep Ind Under $40,000 Household Income $40,000 to $79,999 $80,000 or more Favor 63% 75% 38% 69% 65% 62% 61% 61% Oppose Don't know
27 Prescription Drug Discounts National Issues While fewer than half of California voters support the two ballot measures involving prescription drug discounts, likely voters (85%) and all adults (81%) strongly favor changing the law to allow Americans to buy prescription drugs from pharmacies in Canada if they think they can get a lower price. Californians support for purchasing prescription drugs from Canada is similar to that found among Americans in general, as reported in a recent Kaiser Family Foundation survey (77% favor, 17% oppose). Support is similar across political groups, with at least eight in 10 Democrats, Republicans, and independents favoring a change in the law so that Americans could buy prescription drugs from Canadian pharmacies. At least seven in ten residents across all regions and demographic groups favor the idea, with support strongest among older, more-educated, and higher-income residents. Whites are more in favor of this proposal than Latinos (86%; 76%). There are high levels of support for allowing Americans to buy prescription drugs from Canada among the likely voters who say they would vote yes or no on the competing drug discount measures on the November ballot that is, Proposition 78 (84% of those who would vote yes, 87% of those who would vote no) and Proposition 79 (89% of those who would vote yes, 85% of those who would vote no). Do you favor or oppose changing the law to allow Americans to buy prescription drugs from pharmacies in Canada if they think they can get a lower price? Age Adults Dem Rep Ind Favor 81% 86% 80% 85% 77% 85% 82% 85% Oppose Don't know Californians show similarly high levels of support for allowing the federal government to negotiate with drug companies to get a lower price on prescription drugs for Medicare recipients. Eight in 10 adults and likely voters (80% each) favor the idea of Congress changing the law to allow such negotiation. Californians show similar levels of support for this proposal as do Americans as a whole, according to a recent Kaiser Family Foundation survey (77% favor, 14% oppose). Support is strong across all political groups; however, Democrats (83%) are slightly more likely than Republicans (75%) or independents (76%) to favor government negotiations with drug companies. Solid majorities in all demographic groups favor the idea of the government negotiating for lower prescription drug prices, with no significant differences across age, education, or racial/ethnic groups. There is strong support for this proposal among likely voters, no matter how they say they would vote on Proposition 78 (84% of those who would vote yes, 75% of those who would vote no) and Proposition 79 (88% of those who would vote yes, 75% of those who would vote no). Do you favor or oppose Congress changing the law to allow the federal government to use its buying power to negotiate with drug companies to try to get a lower price for prescription drugs for people on Medicare? Age Adults Dem Rep Ind Favor 80% 83% 75% 76% 78% 81% 80% 80% Oppose Don't know September 2005
28 National Issues Medical Ethical Issues How do California residents feel about doctors prescribing marijuana use for their patients? While California law states that it is legal for adults to acquire, grow, and use marijuana for prescribed medical purposes, it remains illegal under federal law and may be prosecuted. Seven in ten California adults (71%) and likely voters (77%) support the medical use of marijuana by adults if it is prescribed by their doctors. In an October 2002 national survey by CNN/Time Magazine, 80% favored the use of medical marijuana while 17% opposed it. Majorities of California residents across all demographic, regional, and political groups support the use of doctor-prescribed medical marijuana. However, higher support is found among Democrats (80%) than among Republicans (65%) and independents (73%). Favor is higher among those over age 35 and also rises with education and income; support is similar among men and women. Do you think adults should be allowed to legally use marijuana for medical purposes if their doctors prescribe it, or do you think that marijuana should remain illegal even for medical purposes? Age Adults Dem Rep Ind Should be allowed for medical purposes 71% 80% 65% 73% 66% 74% 71% 77% Should remain illegal even for medical purposes Don't know A medical ethical question that has garnered national attention, and a bill discussed earlier this year by the California Legislature, involves the issue of whether to allow the terminally ill to end their lives. A majority of California adults (55%) favor making it legal for doctors to give terminally ill patients the means to end their lives, while 38 percent are opposed. There is even greater support for this idea among likely voters (62% favor, 32% oppose). Californians are more in favor of permitting this policy than Americans as a whole, according to a recent Pew Research Center survey (51% favor, 40% oppose). While there is majority support across all political groups, independents (64%) and Democrats (63%) are more likely than Republicans (51%) to favor a law allowing doctor-assisted suicide. Liberals (69%) are more in favor of such a law than are moderates (60%), while a majority of conservatives (53%) oppose it. Some regional differences are apparent with respect to this issue: Residents in the San Francisco Bay Area (66%) and Other Southern California region (58%) are more likely to favor this medical practice than residents of Los Angeles (51%) and the Central Valley (44%). Men (59%) are somewhat more likely than women (52%) to favor the right of the terminally ill to end their lives with a doctor s assistance. Favor for this policy increases with age, education, and income. As for racial/ethnic differences, whites are more likely to favor doctor-assisted suicide (66%), while a majority of Latinos are opposed to it (57%). Do you favor or oppose making it legal for doctors to give terminally ill patients the means to end their lives? Age Adults Dem Rep Ind Favor 55% 63% 51% 64% 49% 59% 57% 62% Oppose Don't know
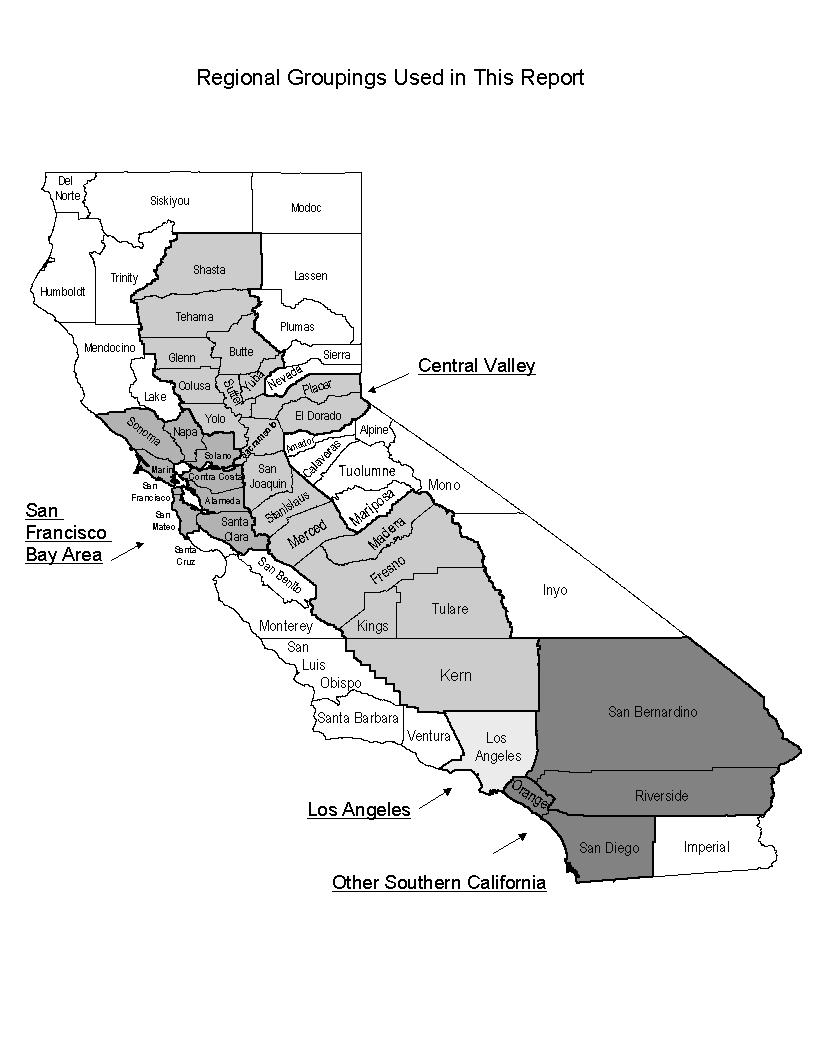
29 Survey Methodology The PPIC Statewide Survey is directed by Mark Baldassare, research director and survey director at the Public Policy Institute of California, with assistance in research and writing from Jennifer Paluch, project manager for this survey, and survey research associates Dean Bonner, Lunna Lopes, Kristy Michaud, and Sonja Petek. The survey was conducted with funding from The James Irvine Foundation and benefited from discussions with program staff, grantees, and others with expertise and interests in the state s initiative process, in addition to regional focus groups with voters, also funded by the foundation; however, the survey methods, questions, and content of the report were solely determined by Mark Baldassare. The findings of this survey are based on a telephone survey of 2,004 California adult residents interviewed between September 12 and September 19, Interviewing took place mostly on weekday and weekend evenings, using a computer-generated random sample of telephone numbers that ensured that both listed and unlisted numbers were called. telephone exchanges in California were eligible for calling. Telephone numbers in the survey sample were called up to six times to increase the likelihood of reaching eligible households. Once a household was reached, an adult respondent (age 18 or older) was randomly chosen for interviewing by using the last birthday method to avoid biases in age and gender. Interviews took an average of 20 minutes to complete. Interviewing was conducted in English or Spanish. Accent on Languages translated the survey into Spanish, and Schulman, Ronca & Bucuvalas, Inc. conducted the telephone interviewing. We used recent U.S. Census and state figures to compare the demographic characteristics of the survey sample with characteristics of California s adult population. The survey sample was closely comparable to the census and state figures. The survey data in this report were statistically weighted to account for any demographic differences. The sampling error for the total sample of 2,004 adults is +/- 2 percent at the 95 percent confidence level. This means that 95 times out of 100, the results will be within 2 percentage points of what they would be if all adults in California were interviewed. The sampling error for subgroups is larger. The sampling error for the 1,572 registered voters is +/- 2.5 percent. The sampling error for the 1,013 likely voters is +/- 3 percent. Sampling error is only one type of error to which surveys are subject. Results may also be affected by factors such as question wording, question order, and survey timing. Throughout the report, we refer to four geographic regions. Central Valley includes Butte, Colusa, El Dorado, Fresno, Glenn, Kern, Kings, Madera, Merced, Placer, Sacramento, San Joaquin, Shasta, Stanislaus, Sutter, Tehama, Tulare, Yolo, and Yuba Counties. SF Bay Area includes Alameda, Contra Costa, Marin, Napa, San Francisco, San Mateo, Santa Clara, Solano, and Sonoma Counties. Los Angeles refers to Los Angeles County, and Other Southern California includes the mostly suburban regions of Orange, Riverside, San Bernardino, and San Diego Counties. These four regions were chosen for analysis because they are major population centers that account for approximately 90 percent of the state population. We present specific results for Latinos because they account for about 30 percent of the state s adult population and constitute one of the fastest growing voter groups. The sample sizes for the African American and Asian subgroups are not large enough for separate statistical analysis. We do compare the opinions of registered Democrats, Republicans, and independents. The independents category includes only those who are registered to vote as decline to state. We contrast opinions about the governor and special election with almost equal samples before and after he announced reelection plans on September 16. We compare PPIC Statewide Survey responses to responses recorded in national surveys conducted by ABC News/Washington Post, CNN/USA Today/Gallup, CBS News/New York Times, CNN/Time Magazine, the Kaiser Family Foundation, and the Pew Research Center. We use earlier PPIC Statewide Surveys to analyze time trends
30
31 PPIC STATEWIDE SURVEY: SPECIAL SURVEY ON CALIFORNIANS AND THE INITIATIVE PROCESS SEPTEMBER 12 19, ,004 CALIFORNIA ADULT RESIDENTS: ENGLISH AND SPANISH MARGIN OF ERROR +/-2% AT 95% CONFIDENCE LEVEL FOR TOTAL SAMPLE 1. First, thinking about the state as a whole, what do you think is the most important issue facing people in California today? [code, don t read] 18% economy, jobs, unemployment 15 education, schools 9 gasoline prices 7 immigration, illegal immigration 6 housing costs, availability 6 state budget, deficit, taxes 4 health care, health costs, HMO reform 3 crimes, gangs 2 environment, pollution 2 government reform 2 population growth, development 2 traffic, transportation 16 other (specify) 8 don t know 2. Overall, do you approve or disapprove of the way that Arnold Schwarzenegger is handling his job as governor of California? 33% approve 58 disapprove 9 don't know 3. How would you rate Governor Schwarzenegger when it comes to working for the best interests of people like you excellent, good, fair, or poor? 9% excellent 19 good 28 fair 40 poor 4 don't know 4. Overall, do you approve or disapprove of the way that the California legislature is handling its job? 32% approve 53 disapprove 15 don't know 5. How would you rate the California legislature when it comes to working for the best interests of people like you excellent, good, fair, or poor? 3% excellent 17 good 45 fair 31 poor 4 don't know 6. Do you think things in California are generally going in the right direction or the wrong direction? 31% right direction 60 wrong direction 9 don't know 7. Turning to economic conditions in California, do you think that during the next 12 months we will have good times financially or bad times? 32% good times 58 bad times 10 don't know 8. During the next 6 months, do you think the price of gasoline will hurt the California economy or not? (if yes: Do you think it will hurt the California economy a great deal or only somewhat?) 51% yes, great deal 32 yes, somewhat 15 no 2 don't know 9. Have recent price increases in gasoline caused any financial hardship for you or your household? 57% yes, caused hardship 42 no, not caused hardship 1 don't know
32 [Responses recorded for questions 10 through 23 are from likely voters only. other responses are from all adults, except where noted.] 10. On another topic, Governor Schwarzenegger has called a special election in November 2005 to vote on budget, educational, and governmental reform measures. In general, do you think the special election is a good idea or a bad idea? 40% good idea 53 bad idea 1 neither (volunteered) 6 don't know 11. How closely are you following news about the special election on November 8 th very closely, fairly closely, not too closely, or not at all closely? 19% very closely 50 fairly closely 23 not too closely 7 not at all closely 1 don't know 12. Which one of the state propositions on the November 8th ballot are you most interested in? [code, don t read] 2% Proposition 73 9 Proposition 74 8 Proposition 75 6 Proposition 76 8 Proposition 77 5 Proposition 78 4 Proposition 79 1 Proposition none of them (volunteered) 4 all equally (volunteered) 3 other answer (specify) 38 don t know Next, we have a few questions to ask you about some of the propositions on the November ballot. [ rotate three blocks of questions randomly: (1) 13, 14 (2) 15, 16 (3) 17, 18 ] 13. Proposition 74 is called the Public School Teachers Waiting Period for Permanent Status and Dismissal Initiative. It increases the probationary period for public school teachers from two years to five years. It modifies the process by which school boards can dismiss a teaching employee who receives two consecutive unsatisfactory performance evaluations. There would be unknown net effects on school districts costs, and costs would vary significantly by district. If the election were held today, would you vote yes or no on Proposition 74? 43% yes 47 no 10 don't know 14. Do you think that retaining good teachers is a big problem, somewhat of a problem, or not much of a problem in California's public schools today? 52% big problem 30 somewhat of a problem 12 not much of a problem 2 not at all a problem (volunteered) 4 don't know 15. Proposition 76 is called the State Spending and School Funding Limits Initiative Constitutional Amendment. It limits state spending to the prior year s level plus three years average revenue growth. It changes state minimum school funding requirements under Proposition 98. It permits the governor, under specified circumstances, to reduce budget appropriations of the governor s choosing. State spending is likely to be reduced relative to current law, due to the additional spending limit and new powers granted to the governor. Reductions could apply to schools and shift costs to other local governments. If the election were held today, would you vote yes or no on Proposition 76? 26% yes 63 no 11 don't know 16. Do you think it is a good idea or a bad idea to strictly limit the amount of money that state spending could increase each year? 49% good idea 43 bad idea 8 don't know
33 17. Proposition 77 is called the Redistricting Initiative Constitutional Amendment. It amends the state Constitution s process for redistricting California s Senate, Assembly, Congressional, and Board of Equalization districts. It requires a three-member panel of retired judges selected by legislative leaders. The one-time state redistricting costs total no more than 1.5 million dollars and county costs are in the range of 1 million dollars. If the election were held today, would you vote yes or no on Proposition 77? 33% yes 50 no 17 don't know 18. Do you think it is a good idea or a bad idea for the California legislature and governor to make the decisions about redistricting? 22% good idea 66 bad idea 12 don't know [rotate two blocks of questions randomly: (1) 19,20 (2) 21, 22] 19. Proposition 78 is called the Discounts on Prescription Drugs Initiative Statute. It establishes a discount prescription drug program for certain low- and moderate-income Californians and authorizes the Department of Health Services to contract with participating pharmacies for discounts and with participating drug manufacturers for rebates. The state costs for administration and outreach are in the millions to low tens-of-millions of dollars annually, and state costs for advance funding of rebates, with unknown, potentially significant, savings for state and county health programs. If the election were held today, would you vote yes or no on Proposition 78? 43% yes 38 no 19 don't know 20. Do you happen to know if the "Yes on Proposition 78" campaign is supported by the pharmaceutical industry or by consumer advocates and unions? 14% pharmaceutical companies 14 consumer advocates and unions 1 both (volunteered) 1 neither (volunteered) 70 don't know 21. Proposition 79 is called the Prescription Drug Discounts State-Negotiated Rebates Initiative Statute. It provides drug discounts to Californians with qualifying incomes funded by state-negotiated drug manufacturer rebates. It prohibits Medi-Cal contracts with manufacturers not providing Medicaid best price. The state costs for administration and outreach is in the low tens-of-millions of dollars annually, with state costs for advance funding of rebates and unknown, potentially significant, net cost savings for Medi-Cal and savings for state and county health programs. If the election were held today, would you vote yes or no on Proposition 79? 34% yes 40 no 26 don't know 22. Do you happen to know if the "Yes on Proposition 79" campaign is supported by the pharmaceutical industry or by consumer advocates and unions? 16% pharmaceutical companies 14 consumer advocates and unions 1 both (volunteered) 1 neither (volunteered) 68 don't know 23. How worried are you that you won't be able to afford the prescription drugs you need very worried, somewhat worried, not too worried, or not at all worried? 21% very worried 24 somewhat worried 25 not too worried 30 not at all worried 0 don t know 24. Changing topics, overall, do you approve or disapprove of the way that George W. Bush is handling his job as president of the United States? 39% approve 58 disapprove 3 don't know [rotate questions 25 and 26] 25. Do you approve or disapprove of the way that George W. Bush is handling the situation caused by Hurricane Katrina? 39% approve 56 disapprove 5 don't know September 2005
34 26. Do you approve or disapprove of the way that George W. Bush is handling the economy? 35% approve 62 disapprove 3 don't know 27. Do you think things in the United States are generally going in the right direction or the wrong direction? 34% right direction 62 wrong direction 4 don't know 28. Turning to economic conditions, do you think that during the next 12 months the United States will have good times financially or bad times? 30% good times 63 bad times 7 don't know 29. How concerned are you that the impact of Hurricane Katrina will cause a nationwide recession very concerned, somewhat concerned, not too concerned, or not at all concerned? 30% very concerned 40 somewhat concerned 19 not too concerned 10 not at all concerned 1 don't know [rotate questions 30 and 31] 30. Has the government's response to Hurricane Katrina affected your confidence in the government's ability to handle a major terrorist attack, or not? (if yes: Has it made you more confident or less confident?) 5% yes, more confident 51 yes, less confident 41 no 3 don't know 31. Has the government's response to Hurricane Katrina affected your confidence in the government's ability to handle a major California earthquake, or not? (if yes: Has it made you more confident or less confident?) 5% yes, more confident 54 yes, less confident 38 no 3 don't know For each of the following please indicate which statement comes closest to your own view even if neither is exactly right. 32. [rotate] (1) Immigrants today are a benefit to California because of their hard work and job skills [or] (2) Immigrants today are a burden to California because they use public services. 56% immigrants are a benefit to California 36 immigrants are a burden to California 8 don't know 33. Should immigrants who are in the U.S. illegally be allowed to apply for work permits which would allow them to stay and work in the United States, or shouldn't they be allowed to do that? 60% should be allowed 38 should not be allowed 2 don't know 34. Which would you prefer [rotate] (1) the current health insurance system in the United States, in which most people get their health insurance from private employers, but some people have no insurance [or] (2) a universal health insurance program, in which everyone is covered under a program like Medicare that is run by the government and financed by taxpayers? 34% current system 59 universal health insurance system 7 don't know 35. Do you favor or oppose the U.S. government guaranteeing health insurance for all citizens, even if it means raising taxes? 63% favor 33 oppose 4 don't know Changing topics [rotate questions 36 and 37] 36. Do you favor or oppose changing the law to allow Americans to buy prescription drugs from pharmacies in Canada if they think they can get a lower price? 81% favor 15 oppose 4 don't know
35 37. Do you favor or oppose Congress changing the law to allow the federal government to use its buying power to negotiate with drug companies to try to get a lower price for prescription drugs for people on Medicare? 80% favor 15 oppose 5 don't know [rotate questions 38 and 39] 38. Do you favor or oppose making it legal for doctors to give terminally ill patients the means to end their lives? 55% favor 38 oppose 7 don't know 39. Do you think adults should be allowed to legally use marijuana for medical purposes if their doctors prescribe it or do you think that marijuana should remain illegal even for medical purposes? 71% should be allowed for medical purposes 26 should remain illegal even for medical purposes 3 don't know 40. On another topic, in California state government today, which of the following would you prefer to have the most influence over public policy: [rotate] (1) the governor, (2) the legislature, [or] (3) initiatives on the state ballot? 18% the governor 32 the legislature 39 initiatives on the state ballot 1 other answer (specify) 10 don't know California uses the direct initiative process, which enables voters to bypass the legislature and have issues put on the ballot as state propositions for voter approval or rejection. 41. Do you think the citizens' initiative process in California is in need of major changes or minor changes or that it is basically fine the way it is at this time? 29% major changes 34 minor changes 29 fine the way it is 8 don't know For the following items, please say if you strongly agree, somewhat agree, somewhat disagree, or strongly disagree. [rotate questions 42 to 45] 42. Citizens' initiatives bring up important public policy issues that the governor and state legislature have not adequately addressed. 32% strongly agree 42 somewhat agree 14 somewhat disagree 5 strongly disagree 7 don't know 43. The ballot wording for citizens' initiatives is often too complicated and confusing for voters to understand what happens if the initiative passes. 47% strongly agree 30 somewhat agree 12 somewhat disagree 6 strongly disagree 5 don't know [question 44 asked of a random half sample of respondents] 44. Citizens' initiatives usually reflect the concerns of average California residents. 19% strongly agree 44 somewhat agree 18 somewhat disagree 12 strongly disagree 7 don't know 45. There are too many propositions on the state ballot. 32% strongly agree 30 somewhat agree 22 somewhat disagree 11 strongly disagree 5 don't know [question 46 asked of a random half sample of respondents] 46. Overall, how much would you say that the initiative process in California today is controlled by special interests a lot, some, or not at all? 56% a lot 36 some 3 not at all 5 don't know September 2005
![47. On another topic, some people are registered to vote and others are not. Are you absolutely certain that you are registered to vote? 79% yes [ask q.48] 21 no [skip to q.50] 48.](/docs-images/83/88905748/images/36-0.jpg "Are you registered as a Democrat, a Republican, another party, or as an independent? 43% Democrat 34 Republican 18 independent 5 another party (specify) [question 49 deleted] 50.")
36 47. On another topic, some people are registered to vote and others are not. Are you absolutely certain that you are registered to vote? 79% yes [ask q.48] 21 no [skip to q.50] 48. Are you registered as a Democrat, a Republican, another party, or as an independent? 43% Democrat 34 Republican 18 independent 5 another party (specify) [question 49 deleted] 50. On another topic, would you consider yourself to be politically: [rotate list as a set, starting from either the top or the bottom; read list] 10% very liberal 21 somewhat liberal 32 middle-of-the-road 23 somewhat conservative 10 very conservative 4 don't know 51. Generally speaking, how much interest would you say you have in politics a great deal, a fair amount, only a little, or none? 22% great deal 45 fair amount 27 only a little 6 none [52-70: background and demographic questions]
PPIC STATEWIDE SURVEY
 PPIC STATEWIDE SURVEY SEPTEMBER 2004 Californians and Their Government Public Policy Institute of California Mark Baldassare Research Director & Survey Director The Public Policy Institute of California
march 2009 Californians their government in collaboration with The James Irvine Foundation Mark Baldassare Dean Bonner Jennifer Paluch Sonja Petek
 march 2009 Californians & their government in collaboration with The James Irvine Foundation Mark Baldassare Dean Bonner Jennifer Paluch Sonja Petek The Public Policy Institute of California is dedicated
David W. Lyon is founding President and Chief Executive Officer of PPIC. Thomas C. Sutton is Chair of the Board of Directors.
 The Public Policy Institute of California (PPIC) is a private operating foundation established in 1994 with an endowment from William R. Hewlett. The Institute is dedicated to improving public policy in
Mark Baldassare is President and Chief Executive Officer of PPIC. Thomas C. Sutton is Chair of the Board of Directors.
 MaY 2008 The Public Policy Institute of California is dedicated to informing and improving public policy in California through independent, objective, nonpartisan research on major economic, social, and
PPIC STATEWIDE SURVEY
 PPIC STATEWIDE SURVEY OCTOBER OBER 2004 Californians and Their Government Public Policy Institute of California Mark Baldassare Research Director & Survey Director The Public Policy Institute of California
Californians. healthy communities. ppic statewide survey FEBRUARY in collaboration with The California Endowment CONTENTS
 ppic statewide survey FEBRUARY 2011 Californians & healthy communities Mark Baldassare Dean Bonner Sonja Petek Nicole Willcoxon CONTENTS About the Survey 2 Press Release 3 Residents Perceptions & Attitudes
Californians. their government. january in collaboration with The James Irvine Foundation
 january 2009 Californians & their government in collaboration with The James Irvine Foundation Mark Baldassare Dean Bonner Jennifer Paluch Sonja Petek The Public Policy Institute of California is dedicated
Californians. their government. ppic statewide survey DECEMBER in collaboration with The James Irvine Foundation CONTENTS
 ppic statewide survey DECEMBER 2010 Californians & their government Mark Baldassare Dean Bonner Sonja Petek Nicole Willcoxon CONTENTS About the Survey 2 Press Release 3 November 2010 Election 6 State and
Californians. population issues. february in collaboration with The William and Flora Hewlett Foundation
 february 2009 Californians & population issues in collaboration with The William and Flora Hewlett Foundation Mark Baldassare Dean Bonner Jennifer Paluch Sonja Petek The Public Policy Institute of California
David W. Lyon is founding President and Chief Executive Officer of PPIC. Thomas C. Sutton is Chair of the Board of Directors.
 The Public Policy Institute of California (PPIC) is a private operating foundation established in 1994 with an endowment from William R. Hewlett. The Institute is dedicated to improving public policy in
Californians. their government. september in collaboration with The James Irvine Foundation
 september 2008 Californians & their government in collaboration with The James Irvine Foundation Mark Baldassare Dean Bonner Jennifer Paluch Sonja Petek The Public Policy Institute of California is dedicated
Californians. their government. ppic state wide surve y SEPTEMBER in collaboration with The James Irvine Foundation
 ppic state wide surve y SEPTEMBER 2014 Californians & their government Mark Baldassare Dean Bonner Renatta DeFever Lunna Lopes Jui Shrestha CONTENTS About the Survey 2 Press Release 3 November 2014 Election
PPIC STATEWIDE SURVEY
 PPIC STATEWIDE SURVEY J ANUAR ARY Y 2006 Special Survey on the California State Budget in collaboration with The James Irvine Foundation Public Policy Institute of California Mark Baldassare Research Director
Californians & Their Government
 PPIC STATEWIDE SURVEY DECEMBER 2018 Californians & Their Government Mark Baldassare Dean Bonner Alyssa Dykman Lunna Lopes CONTENTS Press Release State Post-Election Landscape Federal Post-Election Landscape
Californians. their government. ppic state wide surve y SEPTEMBER supported with funding from The James Irvine Foundation CONTENTS
 ppic state wide surve y SEPTEMBER 2015 Californians & their government Mark Baldassare Dean Bonner David Kordus Lunna Lopes CONTENTS About the Survey 2 Press Release 3 State Government 6 Federal Government
Californians & Their Government
 Californians & Their Government Mark Baldassare Dean Bonner David Kordus Lunna Lopes CONTENTS Press Release 3 State Issues 6 Federal Issues 14 Regional Map 24 Methodology 25 Questionnaire and Results 27
PPIC STATEWIDE SURVEY
 PPIC STATEWIDE SURVEY FEBRU ARY 2006 Californians and the Environment in collaboration with The David and Lucile Packard Foundation Public Policy Institute of California Mark Baldassare Research Director
PUBLIC POLICY INSTITUTE OF CALIFORNIA 500 Washington Street, Suite 800 San Francisco, California phone: fax:
 PUBLIC POLICY INSTITUTE OF CALIFORNIA 500 Washington Street, Suite 800 San Francisco, California 94111 phone: 415.291.4400 fax: 415.291.4401 www.ppic.org survey@ppic.org TABLE OF CONTENTS About the Survey
Californians. their government. ppic state wide surve y JANUARY in collaboration with The James Irvine Foundation CONTENTS
 ppic state wide surve y JANUARY 2014 Californians & their government Mark Baldassare Dean Bonner Sonja Petek Jui Shrestha CONTENTS About the Survey 2 Press Release 3 State Government 6 Federal Government
Californians. their government. ppic state wide surve y MARCH in collaboration with The James Irvine Foundation CONTENTS
 ppic state wide surve y MARCH 2014 Californians & their government Mark Baldassare Dean Bonner Sonja Petek Jui Shrestha CONTENTS About the Survey 2 Press Release 3 State Government 6 Federal Government
TABLE OF CONTENTS. About the Survey 1. Press Release 3. State Issues 7. National Issues 15. Regional Map 24. Methodology 25
 TABLE OF CONTENTS About the Survey 1 Press Release 3 State Issues 7 National Issues 15 Regional Map 24 Methodology 25 Questionnaire and Results 27 ABOUT THE SURVEY The PPIC Statewide Survey provides policymakers,
Californians. their government. ppic state wide surve y JANUARY in collaboration with The James Irvine Foundation CONTENTS
 ppic state wide surve y JANUARY 2013 Californians & their government Mark Baldassare Dean Bonner Sonja Petek Jui Shrestha CONTENTS About the Survey 2 Press Release 3 State Government 6 Federal Government
Californians. their government. ppic state wide surve y MAY in collaboration with The James Irvine Foundation CONTENTS
 ppic state wide surve y MAY 2013 Californians & their government Mark Baldassare Dean Bonner Sonja Petek Jui Shrestha CONTENTS About the Survey 2 Press Release 3 State Government 6 Federal Government 16
Californians. their government. ppic state wide surve y OCTOBER in collaboration with The James Irvine Foundation CONTENTS
 ppic state wide surve y OCTOBER 2012 Californians & their government Mark Baldassare Dean Bonner Sonja Petek Jui Shrestha CONTENTS About the Survey 2 Press Release 3 November 2012 Election 6 State and
As Budget Angst Grows, Californians Take Stock of Fiscal Options And Take Aim at Elected Leaders
 EMBARGOED: Do not publish or broadcast until 10:00 p.m. PDT on Wednesday, March 26. CONTACT: Andrew Hattori, 415/291-4417 Abby Cook, 415/291-4436 Para ver este comunicado de prensa en español, por favor
Californians & Their Government
 Californians & Their Government Mark Baldassare Dean Bonner David Kordus Lunna Lopes CONTENTS Press Release 3 Federal Government 6 State Government 15 Regional Map 22 Methodology 23 Questionnaire and Results
Californians. their government. ppic statewide sur vey J A N U A R Y in collaboration with The James Irvine Foundation CONTENTS
 ppic statewide sur vey J A N U A R Y 2 0 1 0 Californians & their government Mark Baldassare Dean Bonner Sonja Petek Nicole Willcoxon CONTENTS About the Survey 2 Press Release 3 2010 Election Context 6
Californians. their government. ppic statewide survey SEPTEMBER in collaboration with The James Irvine Foundation CONTENTS
 ppic statewide survey SEPTEMBER 2010 Californians & their government Mark Baldassare Dean Bonner Sonja Petek Nicole Willcoxon CONTENTS About the Survey 2 Press Release 3 November 2010 Election 6 State
Californians. their government. ppic state wide surve y MARCH in collaboration with The James Irvine Foundation CONTENTS
 ppic state wide surve y MARCH 2012 Californians & their government Mark Baldassare Dean Bonner Sonja Petek Jui Shrestha CONTENTS About the Survey 2 Press Release 3 2012 Elections 6 State and National Issues
Californians. their government. ppic state wide surve y SEPTEMBER in collaboration with The James Irvine Foundation CONTENTS
 ppic state wide surve y SEPTEMBER 2013 Californians & their government Mark Baldassare Dean Bonner Sonja Petek Jui Shrestha CONTENTS About the Survey 2 Press Release 3 State Government 6 Federal Government
Californians & Their Government
 Californians & Their Government Mark Baldassare Dean Bonner Lunna Lopes CONTENTS Press Release 3 2018 California Election 6 State and National Issues 13 Regional Map 20 Methodology 21 Questionnaire and
PPIC Statewide Survey: Special Survey on Growth
 PPIC Statewide Survey: Special Survey on Growth Mark Baldassare Senior Fellow and Survey Director May 2001 Part of the Growth, Land Use, and Environment Series In Collaboration with The William and Flora
Californians. their government. ppic statewide sur vey. d e c e m b e r in collaboration with The James Irvine Foundation CONTENTS
 ppic statewide sur vey d e c e m b e r 2 0 0 9 Californians & their government Mark Baldassare Dean Bonner Jennifer Paluch Sonja Petek CONTENTS About the Survey 2 Press Release 3 2010 California Election
Californians & Their Government
 Californians & Their Government Mark Baldassare Dean Bonner Alyssa Dykman CONTENTS Press Release 3 2018 California Election 6 State and National Issues 11 Regional Map 20 Methodology 21 Questionnaire and
Californians & Their Government
 Californians & Their Government Mark Baldassare Dean Bonner Alyssa Dykman Lunna Lopes CONTENTS Press Release 3 2018 California Election 6 State and National Issues 12 Regional Map 20 Methodology 21 Questionnaire
PPIC STATEWIDE SURVEY J U N E
 PPIC STATEWIDE SURVEY J U N E 2 0 0 6 Special Survey of the Central in collaboration with the Great Center Public Policy Institute of California Mark Baldassare Research Director & Survey Director The
PPIC Statewide Survey: Californians and Their Government
 PPIC Statewide Survey: Californians and Their Government Mark Baldassare Senior Fellow and Survey Director January 2001 Public Policy Institute of California Preface California is in the midst of tremendous
Californians & the Environment
 Californians & the Environment Mark Baldassare Dean Bonner Alyssa Dykman Lunna Lopes CONTENTS Press Release 3 2018 Election and Environmental Issues 6 Public Perceptions and Policy Preferences 14 Regional
PPIC STATEWIDE SURVEY
 PPIC STATEWIDE SURVEY NOVEMBER 2003 Special Survey on Californians and the Environment in collaboration with The William and Flora Hewlett Foundation The James Irvine Foundation The David and Lucile Packard
PPIC Statewide Survey: Special Survey on Land Use part of the Growth, Land Use, and Environment Series
 PPIC Statewide Survey: Special Survey on Land Use part of the Growth, Land Use, and Environment Series in collaboration with the The William and Flora Hewlett Foundation The James Irvine Foundation The
Coping with Homeland Security in California: Surveys of City Officials and State Residents
 Occasional Papers Coping with Homeland Security in California: Surveys of City Officials and State Residents Mark Baldassare Public Policy Institute of California Christopher Hoene National League of Cities
THE BUSH PRESIDENCY AND THE STATE OF THE UNION January 20-25, 2006
 CBS NEWS/NEW YORK TIMES POLL For release: January 26, 2005 6:30 P.M. THE BUSH PRESIDENCY AND THE STATE OF THE UNION January 20-25, 2006 For the first time in his presidency, George W. Bush will give a
Preface. The characteristics of groups that are shaping the state's elections and policy debates.
 Preface California is now in the midst of historic changes that will profoundly affect the future of the state. To improve understanding of these changes and their effect on the political status quo, PPIC
PPIC Statewide Survey: Californians and Their Government
 PPIC Statewide Survey: Californians and Their Government February 8, 18 Mark Baldassare, Dean Bonner, Alyssa Dykman, Lunna Lopes Supported with funding from the James Irvine Foundation, the California
PPIC Statewide Survey:
 Global California: PPIC Statewide Survey: Perspectives on U.S.-Japan Relations Mark Baldassare Senior Fellow and Survey Director September 2001 Public Policy Institute of California Contents Press Release
Preface. The characteristics of groups that are shaping the state's elections and policy debates.
 Preface California is now in the midst of historic changes that will profoundly affect the future of the state. To improve understanding of these changes and their effect on the political status quo, PPIC
The President, Congress and Deficit Battles April 15-20, 2011
 CBS NEWS/NEW YORK TIMES POLL For release: Thursday, April 21, 2011 6:30pm (EDT) The President, Congress and Deficit Battles April 15-20, 2011 With the possibility of more spending showdowns between President
PPIC Statewide Survey: Californians and Their Government
 PPIC Statewide Survey: ns and Their Government Mark Baldassare Senior Fellow and Survey Director January 2000 Public Policy Institute of The Public Policy Institute of is a private, nonprofit research
AMERICANS VIEWS OF PRESIDENT TRUMP S AGENDA ON HEALTH CARE, IMMIGRATION, AND INFRASTRUCTURE
 AMERICANS VIEWS OF PRESIDENT TRUMP S AGENDA ON HEALTH CARE, IMMIGRATION, AND INFRASTRUCTURE March 2018 1 TABLE OF CONTENTS I. Health Care........... 3 II. Immigration... 7 III. Infrastructure....... 12
PRESIDENT BUSH GAINS ON TERRORISM, NOT ON IRAQ August 17-21, 2006
 CBS NEWS/NEW YORK TIMES POLL For release August 22, 2006 6:30 P.M. EDT PRESIDENT BUSH GAINS ON TERRORISM, NOT ON IRAQ August 17-21, 2006 Concerns about terrorism have risen, but there has been no change
California Ballot Reform Panel Survey Page 1
 CALIFORNIA BALLOT RE FORM PANEL SURVEY 2011-2012 Interview Dates: Wave One: June 14-July 1, 2011 Wave Two: December 15-January 2, 2012 Sample size Wave One: (N=1555) Wave Two: (N=1064) Margin of error
THE FIELD POLL. UCB Contact
 Field Research Corporation 601 California Street, Suite 900, San Francisco, CA 94108-2814 415.392.5763 FAX: 415.434.2541 field.com/fieldpollonline THE FIELD POLL UNIVERSITY OF CALIFORNIA, BERKELEY BERKELEY
THE FIELD POLL. UCB Contact
 Field Research Corporation 601 California St., Ste 900, San Francisco, CA 94108-2814 (415) 392-5763 FAX: (415) 434-2541 field.com/fieldpollonline THE FIELD POLL UNIVERSITY OF CALIFORNIA, BERKELEY BERKELEY
PPIC Statewide Survey Methodology
 PPIC Statewide Survey Methodology Updated February 7, 2018 The PPIC Statewide Survey was inaugurated in 1998 to provide a way for Californians to express their views on important public policy issues.
THE 2004 NATIONAL SURVEY OF LATINOS: POLITICS AND CIVIC PARTICIPATION
 Summary and Chartpack Pew Hispanic Center/Kaiser Family Foundation THE 2004 NATIONAL SURVEY OF LATINOS: POLITICS AND CIVIC PARTICIPATION July 2004 Methodology The Pew Hispanic Center/Kaiser Family Foundation
Grim Views of the Economy, the President and Congress September 10-15, 2011
 CBS NEWS/NEW YORK TIMES POLL For release: Friday, September 16, 2011 6:30 PM EDT Grim Views of the Economy, the President and Congress September 10-15, 2011 72% of Americans think the country is off on
Instituted in 1911, the statewide initiative process was a Progressive Era reform that
 Public Policy Institute of California The California Initiative Process How Democratic Is It? Instituted in 1911, the statewide initiative process was a Progressive Era reform that allowed citizens to
THE ECONOMY, THE DEFICIT, AND THE PRESIDENT July 24-28, 2009
 CBS NEWS/NEW YORK TIMES POLL For Release: Wednesday, July 29, 2009 6:30 pm (EDT) THE ECONOMY, THE DEFICIT, AND THE PRESIDENT July 24-28, 2009 The economy remains the top concern for Americans, but as the
FOURTH ANNUAL IDAHO PUBLIC POLICY SURVEY 2019
 FOURTH ANNUAL IDAHO PUBLIC POLICY SURVEY 2019 ABOUT THE SURVEY The Fourth Annual Idaho Public Policy Survey was conducted December 10th to January 8th and surveyed 1,004 adults currently living in the
FOR RELEASE NOVEMBER 07, 2017
 FOR RELEASE NOVEMBER 07, 2017 FOR MEDIA OR OTHER INQUIRIES: Carroll Doherty, Director of Political Research Jocelyn Kiley, Associate Director, Research Bridget Johnson, Communications Associate 202.419.4372
THE HEALTH CARE BILL, THE PUBLIC OPTION, ABORTION, AND CONGRESS November 13-16, 2009
 CBS NEWS POLL For release: Tuesday, November 17, 2009 6:30 PM (ET) THE HEALTH CARE BILL, THE PUBLIC OPTION, ABORTION, AND CONGRESS November 13-16, 2009 Americans would strongly prefer a health care bill
Millsaps College-Chism Strategies State of the State Survey: Voters Concerned with Low School Funding, Open to Funding Options
 For Immediate Release Contact: John Sewell September 27, 2017 601-974-1019 Millsaps College-Chism Strategies State of the State Survey: Voters Concerned with Low School Funding, Open to Funding Options
Two-to-one voter support for Marijuana Legalization (Prop. 64) and Gun Control (Prop. 63) initiatives.
 and Gun Control (Prop. 63) initiatives.") UC Berkeley IGS Poll Title Two-to-one voter support for Marijuana Legalization (Prop. 64) and Gun Control (Prop. 63) initiatives. Permalink https://escholarship.org/uc/item/51c1h00j Author DiCamillo, Mark
UC Berkeley IGS Poll Title Two-to-one voter support for Marijuana Legalization (Prop. 64) and Gun Control (Prop. 63) initiatives. Permalink https://escholarship.org/uc/item/51c1h00j Author DiCamillo, Mark
POLITICS AND THE PRESIDENT April 6-9, 2006
 CBS NEWS POLL For release: April 10, 2006 6:30 P.M. POLITICS AND THE PRESIDENT April 6-9, 2006 Although President Bush s approval ratings have stopped the downward slide that occurred earlier this year
Weak Ratings Confront Bush Ahead of State of the Union
 ABC NEWS/WASHINGTON POST POLL: BEFORE THE SOTU 1/26/06 EMBARGOED FOR RELEASE AFTER 7 a.m. Sunday, Jan. 29, 2006 Weak Ratings Confront Bush Ahead of State of the Union A weakened George W. Bush faces the
Proposed gas tax repeal backed five to four. Support tied to voter views about the state s high gas prices rather than the condition of its roads
 Jack Citrin Center for Public Opinion Research Institute of Governmental Studies 124-126 Moses Hall University of California, Berkeley Berkeley, CA 94720 Tel: 510-642- 6835 Email: igs@berkeley.edu Release
EMBARGOED. Approval of Bush, GOP Leaders Slips DISENGAGED PUBLIC LEANS AGAINST CHANGING FILIBUSTER RULES
 NEWS Release 1615 L Street, N.W., Suite 700 Washington, D.C. 20036 Tel (202) 419-4350 Fax (202) 419-4399 EMBARGOED FOR RELEASE: MONDAY, MAY 16, 2005, 4:00 P.M. Approval of Bush, GOP Leaders Slips DISENGAGED
THE FIELD POLL. UCB Contact
 Field Research Corporation 601 California Street, Suite 900, San Francisco, CA 94108-2814 415.392.5763 FAX: 415.434.2541 field.com/fieldpollonline THE FIELD POLL UNIVERSITY OF CALIFORNIA, BERKELEY BERKELEY
It s Democrats +8 in Likely Voter Preference, With Trump and Health Care on Center Stage
 ABC NEWS/WASHINGTON POST POLL: The 2018 Midterm Elections EMBARGOED FOR RELEASE AFTER 12:00 a.m. Sunday, Nov. 4, 2018 It s Democrats +8 in Likely Voter Preference, With Trump and Health Care on Center
MEMORANDUM. Independent Voter Preferences
 MEMORANDUM TO: Interested Parties FROM: Ed Gillespie, Whit Ayres and Leslie Sanchez DATE: November 9, 2010 RE: Post-Election Poll Highlights: Independents Propel Republican Victories in 2010 The 2010 mid-term
CONTACT: TIM VERCELLOTTI, Ph.D., (732) , EXT. 285; (919) (cell) CRANKY ELECTORATE STILL GIVES DEMOCRATS THE EDGE
 , EXT. 285; (919) (cell) CRANKY ELECTORATE STILL GIVES DEMOCRATS THE EDGE") - Eagleton Poll EMBARGOED UNTIL 9 A.M. EDT OCT. 25, 2007 Oct. 25, 2007 (Release 163-1) CONTACT: TIM VERCELLOTTI, Ph.D., (732) 932-9384, EXT. 285; (919) 812-3452 (cell) CRANKY ELECTORATE STILL GIVES DEMOCRATS
- Eagleton Poll EMBARGOED UNTIL 9 A.M. EDT OCT. 25, 2007 Oct. 25, 2007 (Release 163-1) CONTACT: TIM VERCELLOTTI, Ph.D., (732) 932-9384, EXT. 285; (919) 812-3452 (cell) CRANKY ELECTORATE STILL GIVES DEMOCRATS
These are the findings from the latest statewide Field Poll completed among 1,003 registered voters in early January.
 THE FIELD POLL THE INDEPENDENT AND NON-PARTISAN SURVEY OF PUBLIC OPINION ESTABLISHED IN 1947 AS THE CALIFORNIA POLL BY MERVIN FIELD Field Research Corporation 601 California Street, Suite 210 San Francisco,
CURRENT ISSUES: THE DEBATE OVER SCHIP AND THE WAR IN IRAQ October 12-16, 2007
 CBS NEWS POLL For release: Wednesday, October 17 th, 2007 6:30 P.M. EDT CURRENT ISSUES: THE DEBATE OVER SCHIP AND THE WAR IN IRAQ October 12-16, 2007 As Democratic leaders in Congress attempt to wrangle
Iraqi Elections, Economic Gains Lift Bush from his Career Lows
 ABC NEWS/WASHINGTON POST POLL: BUSH 12/18/05 EMBARGOED FOR RELEASE AFTER 5 p.m. Monday, Dec. 19, 2005 Iraqi Elections, Economic Gains Lift Bush from his Career Lows The successful elections in Iraq and
Voter turnout in today's California presidential primary election will likely set a record for the lowest ever recorded in the modern era.
 THE FIELD POLL THE INDEPENDENT AND NON-PARTISAN SURVEY OF PUBLIC OPINION ESTABLISHED IN 1947 AS THE CALIFORNIA POLL BY MERVIN FIELD Field Research Corporation 601 California Street, Suite 900 San Francisco,
Ben Tulchin, Corey O Neil and Kiel Brunner; Tulchin Research
 August 26, 2015 To: From: Re: Interested Parties Ben Tulchin, Corey O Neil and Kiel Brunner; Tulchin Research California Statewide Survey Finds Voters Demand More Transparency in Police Misconduct Cases
Hatch Opens Narrow Lead Over Pawlenty
 Hatch Opens Narrow Lead Over Pawlenty Lawrence R. Jacobs Director, Center for the Study of Politics and Governance Humphrey Institute of Public Affairs University of Minnesota Joanne M. Miller Research
THE START OF THE OBAMA PRESIDENCY January 11-15, 2009
 CBS NEWS/NEW YORK TIMES POLL For Release: Saturday, January 17, 2009 2:00 pm EST THE START OF THE OBAMA PRESIDENCY January 11-15, 2009 Amid an economic recession, two wars and with an unpopular outgoing
Despite Hints of Economic Recovery, Optimism s Scarce for the Year Ahead
 ABC NEWS/WASHINGTON POST POLL: THE YEAR AHEAD EMBARGOED FOR RELEASE AFTER 7 a.m. Monday, Dec. 24, 2012 Despite Hints of Economic Recovery, Optimism s Scarce for the Year Ahead With three-quarters of Americans
RECOMMENDED CITATION: Pew Research Center, December, 2016, Low Approval of Trump s Transition but Outlook for His Presidency Improves
 NUMBERS, FACTS AND TRENDS SHAPING THE WORLD FOR RELEASE DECEMBER 8, 2016 FOR MEDIA OR OTHER INQUIRIES: Carroll Doherty, Director of Political Research Jocelyn Kiley, Associate Director, Research Bridget
FOR RELEASE APRIL 26, 2018
 FOR RELEASE APRIL 26, 2018 FOR MEDIA OR OTHER INQUIRIES: Carroll Doherty, Director of Political Research Jocelyn Kiley, Associate Director, Research Bridget Johnson, Communications Associate 202.419.4372
Release # For Publication: Tuesday, September 19, 2017
 Jack Citrin Center for Public Opinion Research Institute of Governmental Studies 124-126 Moses Hall University of California Berkeley, CA 94720 Tel: 510-642- 6835 Email: igs@berkeley.edu Release #2017-16
Critical Insights on Maine TM Tracking Survey ~ Fall 2017 ~
 Critical Insights on Maine TM Tracking Survey ~ Fall 2017 ~ Voters Views on the Economy, Ballot Initiatives, and Other Issues Facing the State of Maine 172 Commercial Street Portland, Maine 04101 Telephone:
Release #2345 Release Date: Tuesday, July 13, 2010
 THE FIELD POLL THE INDEPENDENT AND NON-PARTISAN SURVEY OF PUBLIC OPINION ESTABLISHED IN 1947 AS THE CALIFORNIA POLL BY MERVIN FIELD Field Research Corporation 601 California Street, Suite 900 San Francisco,
Support for Restoring U.S.-Cuba Relations March 11-15, 2016
 CBS NEWS/NEW YORK TIMES POLL For release: Monday, March 21, 2016 7:00 am EDT Support for Restoring U.S.-Cuba Relations March 11-15, 2016 Amid President Barack Obama s historic trip to Cuba, a majority
Voters back compromise on Medicaid expansion, support marijuana reform, minimum wage hike
 February 7, 2018 Voters back compromise on Medicaid expansion, support marijuana reform, minimum wage hike Summary of Key Findings 1. Voters support Medicaid expansion by a small majority overall. While
THE WAR IN IRAQ, THE PRESIDENT AND THE COUNTRY S INFRASTRUCTURE August 8-12, 2007
 CBS NEWS POLL For release: Monday, August 13, 2007 6:30 P.M. EDT THE WAR IN IRAQ, THE PRESIDENT AND THE COUNTRY S INFRASTRUCTURE August 8-12, 2007 Americans today are more willing to credit the surge of
RECOMMENDED CITATION: Pew Research Center, May, 2015, Free Trade Agreements Seen as Good for U.S., But Concerns Persist
 NUMBERS, FACTS AND TRENDS SHAPING THE WORLD FOR RELEASE MAY 27, 2015 FOR FURTHER INFORMATION ON THIS REPORT: Carroll Doherty, Director of Political Research Jocelyn Kiley, Associate Director, Research
Survey of Pennsylvanians on the Issue of Health Care Reform KEY FINDINGS REPORT
 The Morning Call/ Muhlenberg College Institute of Public Opinion Survey of Pennsylvanians on the Issue of Health Care Reform KEY FINDINGS REPORT Release Date November 17, 2009 KEY FINDINGS: 1. As the national
THE FIELD POLL. By Mark DiCamillo, Director, The Field Poll
 THE FIELD POLL THE INDEPENDENT AND NON-PARTISAN SURVEY OF PUBLIC OPINION ESTABLISHED IN 1947 AS THE CALIFORNIA POLL BY MERVIN FIELD Field Research Corporation 601 California Street, Suite 210 San Francisco,
A Harsh Judgment on Davis Clears Schwarzenegger s Way
 CALIFORNIA EXIT POLL: THE RECALL 10/7/03 A Harsh Judgment on Davis Clears Schwarzenegger s Way In the end it was more about Gray Davis than about Arnold Schwarzenegger, and on Davis, the voters judgment
CONGRESS, THE FOLEY FALLOUT AND THE NOVEMBER ELECTIONS October 5 8, 2006
 CBS NEWS/NEW YORK TIMES POLL For release: Monday, October 9, 2006 6:30 P.M. CONGRESS, THE FOLEY FALLOUT AND THE NOVEMBER ELECTIONS October 5 8, 2006 Americans give Republican Congressional leaders terrible
UNEASE OVER THE WAR ON TERRORISM
 September 11, 2005 (Release 155-1) CONTACTS: MURRAY EDELMAN OR TIM VERCELLOTTI Stories based on the survey findings presented in this release and background memo appear in the Sunday, September 11, 2005
THE PEOPLE, THE PRESS & POLITICS 1990 After The Election
 FOR RELEASE: FRIDAY, NOVEMBER 16, 1990 THE PEOPLE, THE PRESS & POLITICS 1990 After The Election FOR FURTHER INFORMATION CONTACT: Donald S. Kellermann, Director Andrew Kohut, Director of Surveys Carol Bowman,
Frustrated with Congress, Americans See More Gridlock July 18-22, 2013
 CBS News Poll For release: Wednesday, July 24, 2013 6:30 PM ET Frustrated with Congress, Americans See More Gridlock July 18-22, 2013 76% of Americans now disapprove of Congress; 59% say they are frustrated
Hurricane Preparedness is Faulted; Fewer Blame Bush for Problems
 ABC NEWS/WASHINGTON POST POLL: KATRINA 9/2/05 EMBARGOED FOR RELEASE AFTER 7 a.m. Sunday, Sept. 4, 2005 Hurricane Preparedness is Faulted; Fewer Blame Bush for Problems Americans are broadly critical of
FOR RELEASE: SUNDAY, OCTOBER 13, 1991, A.M.
 FOR RELEASE: SUNDAY, OCTOBER 13, 1991, A.M. Two In Three Want Candidates To Discuss Economic Issues "DON'T KNOW" LEADS KERREY IN EARLY DEMOCRATIC NOMINATION SWEEPS "Don't Know" leads in the early stages
The Republican Race: Trump Remains on Top He ll Get Things Done February 12-16, 2016
 CBS NEWS POLL For release: Thursday, February 18, 2016 7:00 AM EST The Republican Race: Trump Remains on Top He ll Get Things Done February 12-16, 2016 Donald Trump (35%) continues to hold a commanding
Health Care, Economy, Immigration October 18-21, 2013
 Health Care, Economy, Immigration October 18-21, 2013 CBS NEWS POLL For Release: Tuesday, October 22, 2013 6:30 pm ET More Americans continue to disapprove (51%) than approve of the health care law (43%).
YG Network Congressional District Poll: December Topline Results
 YG Network Congressional District Poll: December 2013 Topline Results Methodology: This YG Network Congressional District Poll was conducted from December 13-17, 2013, among a sample of 1,652 likely voters