Californians. healthy communities. ppic statewide survey FEBRUARY in collaboration with The California Endowment CONTENTS
|
|
|
- Patricia Dixon
- 5 years ago
- Views:
Transcription
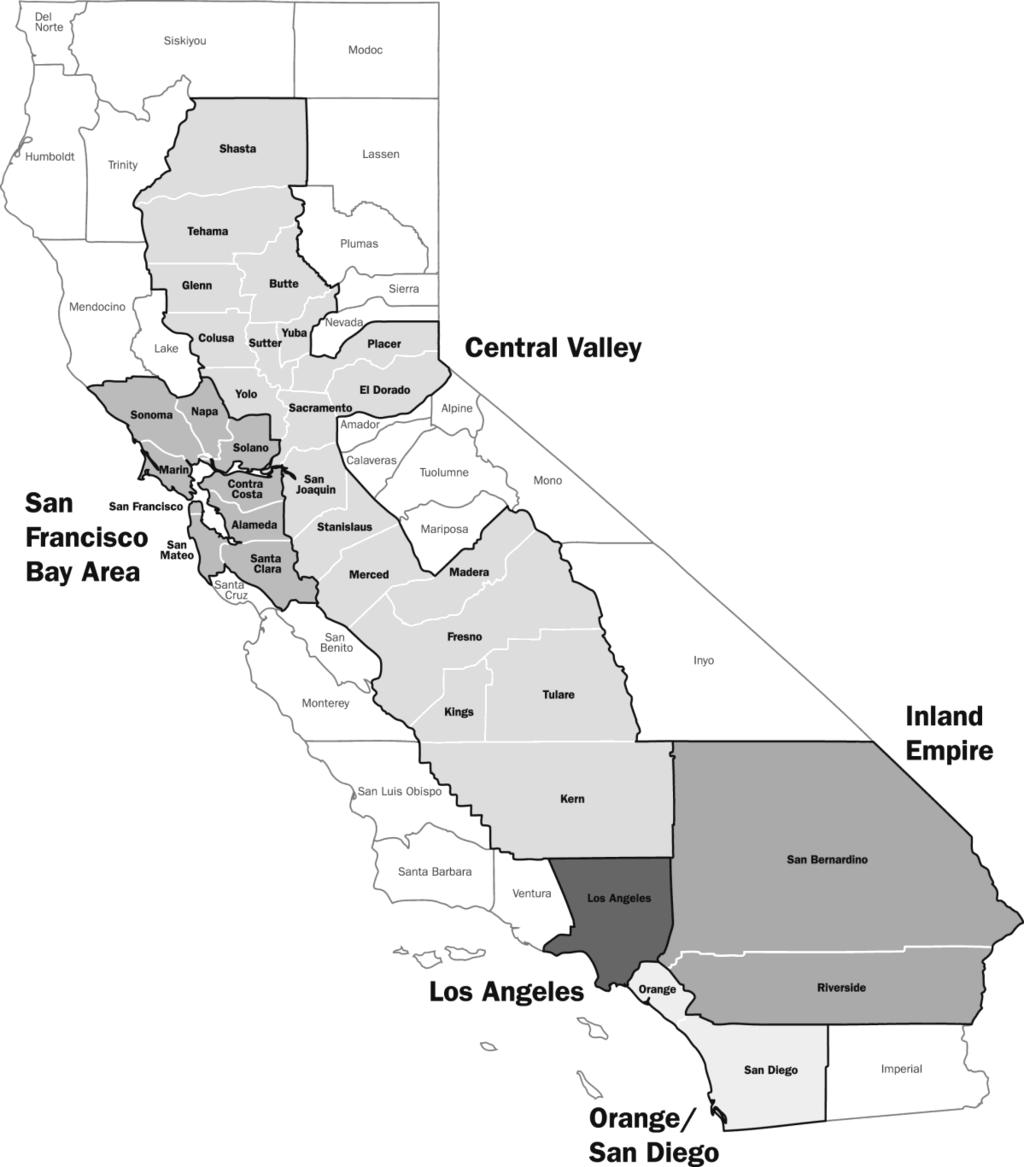
1 ppic statewide survey FEBRUARY 2011 Californians & healthy communities Mark Baldassare Dean Bonner Sonja Petek Nicole Willcoxon CONTENTS About the Survey 2 Press Release 3 Residents Perceptions & Attitudes 6 Healthy Communities & Policy Preferences 16 Regional Map 26 Methodology 27 Questionnaire and Results 29 in collaboration with The California Endowment
2


3 PPIC Statewide Survey Para ver este comunicado de prensa en español, por favor visite nuestra página de internet: http: / / /main /pressreleaseindex.asp SAN FRANCISCO, February 9, 2011 February 2011 Californians and Healthy Communities 3
4 PPIC Statewide Survey February 2011 Californians and Healthy Communities 4
5 PPIC Statewide Survey February 2011 Californians and Healthy Communities 5
6 RESIDENTS PERCEPTIONS & ATTITUDES KEY FINDINGS Californians cite jobs and the economy as the state s top issue and majorities say the state is headed in the wrong direction and bad economic times are ahead. Half (49%) are unsure how to rate Governor Brown s job performance; 34 percent approve and 17 percent disapprove. One in four approve of the legislature. (page 7) National Health Care Reform Law Percent all adults Support Oppose 36 Californians (51%) are slightly more likely than adults nationwide (45%) to support the changes to the national health care system that were enacted last year. Six in 10 think there should be major changes to the state s system. Just over half are very concerned about spending cuts to health and human services. (page 8) A plurality of adults (46%) say their health is excellent (22%) or very good (24%) and 35 percent call their health good; far less say it is only fair (13%) or poor (5%). (page 9) A third say they are very happy with their life today; 47 percent say they are pretty happy, while one in five are not too happy. Happiness and satisfaction with one s quality of life, job, housing situation, and quality of health care rises as income levels increase. (pages 10, 11) Most rate specific local community conditions as good or excellent. Grocery stores and restaurants get the highest ratings, while public schools and roads and sidewalks get the lowest. (pages 12, 13) Six in 10 say unemployment is a big problem in their community. Far fewer consider other issues such as violence and air pollution to be a big problem. The perceived seriousness of these issues varies across regional, racial/ethnic, and other demographic groups. (pages 14, 15) Satisfaction with Quality of Life in Their Local Community Somewhat satisfied 100 Very satisfied Percent all adults Adults nationwide* Under $40, $40,000 $80,000 California adults *ABC News/Washington Post poll, January $80,000 or more Violence and Street Crime in Their Local Community Somewhat of a problem Percent all adults Big problem Asians Blacks Latinos Whites February 2011 Californians and Healthy Communities 6
7 OVERALL MOOD We asked a series of questions about the state of the state, in seeking to understand the broader context for quality-of-life ratings and local community perceptions. Californians continue to mention jobs and the economy (57%) as the most important issue facing the state. Most Californians (54%) expect bad economic times in the next 12 months; 34 percent expect good times. At least half across parties expect bad times, but Republicans (70%) are the most pessimistic (57% independents, 51% Democrats). Most whites (61%), Asians (56%), and blacks (53%) expect bad times, while Latinos are divided (46% good, 44% bad). While at least six in 10 middle-income (household incomes of $40,000 under $80,000) and upper-income residents ($80,000 or more) expect bad times, lower-income residents (under $40,000) are more optimistic (41% good, 47% bad). When it comes to the direction of the state, Californians remain pessimistic, with over half saying wrong direction (55%). Republicans (74%) and independents (58%) say wrong direction, while Democrats are divided (46% right, 42% wrong). Fewer than four in 10 across regions think California is going in the right direction. At least half of whites (60%), blacks (53%), and Latinos (52%) say wrong direction, while Asians are more optimistic (45% right, 39% wrong). Do you think things in California are generally going in the right direction or the wrong direction? All Region Likely Adults Central Valley San Francisco Los Angeles Orange/ San Diego Inland Empire Voters Right direction 34% 31% 39% 34% 34% 29% 32% Wrong direction Don t know Half of Californians (49%) are unsure of how to rate Governor Brown s job performance; 34 percent approve and 17 percent disapprove. Earlier in January, 41 percent approved, 19 percent disapproved, and 39 percent were unsure. Half of Democrats approve of his performance, while others are mostly unsure (Republicans: 26% approve, 28% disapprove, 45% don t know; independents: 33% approve, 16% disapprove, 51% don t know). San Francisco Bay Area residents (43%) are the most likely and Inland Empire residents (24%) the least likely to approve. More than four in 10 across regions and demographic groups are unsure of how to rate the governor s job performance. Californians disapprove of the California Legislature by a two to one margin (52% disapprove, 24% approve); one in four are unsure. Ratings were similar earlier in January. Across parties, Republicans (74%) are the most likely to disapprove, followed by independents (59%) and Democrats (49%). Majorities in the Central Valley (59%), Orange/San Diego Counties (57%), and the Inland Empire (54%) disapprove, while somewhat fewer in the San Francisco Bay Area (48%) and Los Angeles (46%) disapprove. Fewer than four in 10 across demographic groups approve of the legislature. All Adults Party Dem Rep Ind Likely Voters Overall, from what you know so far, do you approve or disapprove of the way that Jerry Brown is handling his job as governor of California? Overall, do you approve or disapprove of the way that the California Legislature is handling its job? Approve 34% 51% 26% 33% 41% Disapprove Don't know Approve Disapprove Don't know February 2011 Californians and Healthy Communities 7
8 HEALTH CARE POLICY Most Californians think the state s health care system is in need of major (59%) or minor changes (24%); fewer (11%) say it is basically fine the way it is. Californians held similar views the last time we asked this question in September Throughout 2007, as discussions to reform the system were underway and before national health care reform was passed, more Californians said major changes were needed. Today, Democrats (62%) and independents (61%) are somewhat more likely than Republicans (53%) to say major changes are needed to the state s health care system. Majorities across regional and demographic groups (between 54% and 64%) hold this view. Residents without health insurance (69%) are more likely than those with health insurance (57%) to say major changes are needed. Do you think California s health care system is in need of major changes or minor changes or that it is basically fine the way it is? Party Dem Rep Ind Likely Voters Major changes 59% 62% 53% 61% 61% Minor changes Fine the way it is Don t know More than eight in 10 Californians are very (53%) or somewhat (31%) concerned that the state s budget gap will cause significant spending cuts to health and human services. Concern was similar in February Across parties today, Democrats (61%) are much more likely than independents (48%) and Republicans (46%) to be very concerned. Lower-income (56%) and middle-income (56%) residents are more likely than upper-income residents (46%) to be very concerned about cuts to health and human services. Women are much more likely than men (60% to 46%) to be very concerned and concern is higher among residents age 35 and older than among younger residents. Blacks (70%) are much more likely than Latinos (55%), Asians (54%), and whites (49%) to express a high level of concern. As you may know, the state government has an annual budget of around $85 billion and currently faces a multibillion dollar gap between spending and revenues. How concerned are you that the state s budget gap will cause significant spending cuts in health and human services? Race/Ethnicity Asians Blacks Latinos Whites Very concerned 53% 54% 70% 55% 49% Somewhat concerned Not too concerned Not at all concerned Don t know Half of Californians (51%) support and 36 percent oppose the changes to the national health care system that were enacted by Congress and the Obama administration last year. Before health care reform passed, about half of Californians expressed support for the proposed changes (51% September 2009, 52% December 2009, 50% March 2010). Californians are slightly more likely than adults nationwide to support health care reform, according to a January ABC News/Washington Post poll (45% support, 50% oppose). In California, Democrats (73%) support the changes, Republicans (73%) oppose them, and independents are divided (48% support, 42% oppose). February 2011 Californians and Healthy Communities 8
9 PERSONAL HEALTH Californians hold fairly positive views of their personal health, with 22 percent saying their health is excellent, 24 percent saying it is very good, and 35 percent saying it is good. Fewer than one in five say their health is only fair (13%) or poor (5%). Adults nationwide provided similar ratings of personal health in a December 2010 Kaiser Family Foundation poll (49% excellent/very good, 31% good, 20% only fair/poor). However, dramatic differences in ratings of personal health occur across some of California s key demographic groups. Across income categories, 70 percent of those in households earning $80,000 or more annually say their health is very good or excellent, compared to 48 percent of middle-income residents and just 31 percent of those in households making less than $40,000. Education level appears tied to health status as well: two in three college graduates (67%) rate their health as very good or excellent, compared to 56 percent of those with some college education and 28 percent of those with a high school education or less. Residents with full-time (53%) or part-time (48%) work are more likely to rate their health as very good or excellent than those who are unemployed and looking for work (39%). Across racial/ethnic groups, a majority of whites (58%) rate their personal health as very good or excellent; fewer than half of Asians (45%), blacks (38%), or Latinos (31%) say the same. Residents born in the United States (54%) are far more likely than naturalized citizens (37%) or immigrants who are not citizens (27%) to say they are in very good or excellent health. The percentage saying their health is very good or excellent declines with age (ages 18 34, 55%; ages 35 54, 47%; ages 55 and older, 37%). Ratings of personal health are highest in Orange/San Diego Counties (54%) and lowest in Los Angeles (41%). Among residents with health insurance 51 percent say their health is excellent or good; among those without health insurance only 31 percent say the same. In general, would you say your health is excellent, very good, good, only fair, or poor? Excellent Very good Good Only fair Poor 22% 24% 35% 13% 5% Age and older Asians Race/Ethnicity Blacks Latinos Whites High school or less Education Some college College graduate Under $40, Household income $40,000 to under $80, $80,000 or more Health insurance Yes No February 2011 Californians and Healthy Communities 9
10 QUALITY OF LIFE When asked about their lives today, nearly eight in 10 Californians say they are very happy (32%) or pretty happy (47%), while one in five are not too happy (20%). According to a January 2010 Pew Research Center poll, 28 percent of adults nationwide reported being very happy, 54 percent said they were pretty happy, and 16 percent said they were not too happy. Differences across demographic groups emerge again on this question. Just 25 percent of lower-income residents say they are very happy, while 31 percent of middle-income and 41 percent of upper-income residents report being very happy. There are stark differences between those with jobs (34% full-time, 29% part-time) and those who are unemployed and looking for work (9%) in saying they are very happy; 41 percent of the unemployed say they are not too happy. Across racial/ethnic groups, whites (37%) are the most likely to say they are very happy, followed by blacks (29%), Latinos (27%), and Asians (25%). One in three U.S.-born citizens (34%) and 30 percent of naturalized citizens say they are very happy; among immigrants who are not citizens, 23 percent are very happy, 35 percent are pretty happy, and 41 percent are not too happy. The percentage saying they are very happy increases somewhat as education levels rise. Among those who have health insurance, 35 percent report being very happy; just 19 percent of the uninsured say the same. Generally, how would you say things are these days in your life are you very happy, pretty happy, or not too happy? Very happy Pretty happy Not too happy 32% 47% 20% Age and older Asians Race/Ethnicity Blacks Latinos Whites High school or less Education Some college College graduate Under $40, Household income $40,000 to under $80, $80,000 or more Health insurance Yes No What about finances? Six in 10 Californians are very (21%) or somewhat (40%) satisfied with their financial situation; fewer are dissatisfied (20% somewhat, 17% very). Most lower-income residents (57%) and nearly half of those with a high school education or less (48%) are dissatisfied. Among the unemployed, 77 percent are dissatisfied; most part-time (52%) and full-time (70%) workers are at least somewhat satisfied. Solid majorities of whites (72%) and Asians (61%) are at least somewhat satisfied with their financial situation, while blacks and Latinos are split between satisfaction and dissatisfaction. February 2011 Californians and Healthy Communities 10
11 QUALITY OF LIFE (CONTINUED) Among Californians who are currently employed, 46 percent are very satisfied and 36 percent are somewhat satisfied with their jobs. About one in five are dissatisfied (10% somewhat, 7% very). Satisfaction increases as income and education levels rise and is far higher among full-time workers (52%) than part-time workers (29%). In terms of their housing situation, eight in 10 are very (46%) or somewhat (34%) satisfied. At least half of upper- and middle-income residents (59%, 50%) are very satisfied, compared to 33 percent of lowerincome residents. College graduates (55%) and those with some college education (52%) are much more likely to be very satisfied than those with a high school education or less (35%). Homeowners are far more satisfied than renters (61% to 28% very satisfied) and those who have lived at their residence at least five years (52% very satisfied) are more satisfied than those who have lived in their homes a shorter time (37%). The percentage who are very satisfied with housing increases with age. Most whites (59%) are very satisfied; fewer than half of blacks (44%), Asians (39%), or Latinos (28%) say the same. Please tell me whether, on the whole, you are very satisfied, somewhat satisfied, somewhat dissatisfied, or very dissatisfied with the following aspects of your life. How about your housing situation? Under $40,000 Household Income $40,000 to under $80,000 $80,000 or more Owners Home Renters Very satisfied 46% 33% 50% 59% 61% 28% Somewhat satisfied Somewhat dissatisfied Very dissatisfied Don t know Three in four Californians are very (40%) or somewhat satisfied (35%) with the quality of health care they receive; 22 percent are dissatisfied. The percentage who are very satisfied rises as income, education, and age increase. Satisfaction is highest among whites (51% very), while fewer blacks (37%), Latinos (30%), and Asians (27%) feel the same. Californians with health insurance are more than three times as likely as the uninsured to be very satisfied with their health care quality (47% to 14%). How about the quality of health care you receive? Household Income Health Insurance Under $40,000 to $80,000 Yes No $40,000 under $80,000 or more Very satisfied 40% 30% 40% 54% 47% 14% Somewhat satisfied Somewhat dissatisfied Very dissatisfied Don t know When asked about the quality of life in their local community, eight in 10 Californians are very (36%) or somewhat (44%) satisfied; 19 percent are dissatisfied. Upper-income residents (53%) are far more likely than middle- and lower-income residents (33%, 26%) to be very satisfied. The percentage who are very satisfied rises as education and age increase. Homeowners are much more likely than renters to be very satisfied (43% to 28%). Across racial/ethnic groups, whites (45%) are more likely to be very satisfied than blacks (32%), Asians (29%), and Latinos (25%). Parents of children age 18 or younger (30%) are less likely to be very satisfied than others (40%) with the quality of life in their local community. February 2011 Californians and Healthy Communities 11
12 RATING LOCAL COMMUNITY CONDITIONS Californians give generally positive evaluations of their local services: majorities give an excellent or good rating to their local grocery stores and restaurants (86%), parks and playgrounds (79%), police protection (78%), medical and health care services (72%), public schools (59%), and roads and sidewalks (54%). However, more Californians give not so good or poor ratings to local public schools (21% not so good, 12% poor) and roads and sidewalks (30% not so good, 16% poor) than to other services. Across parties, regions, and demographic groups, each service gets a positive rating from about half or more residents. Now I'd like to ask how you would rate some of the public services in your local community. For each one, please tell me if you think they are excellent, good, not so good, or poor. How about? Local grocery stores and restaurants Local parks and playgrounds Local police protection Local medical and health care services Local public schools Local roads and sidewalks Excellent 30% 25% 24% 19% 15% 12% Good Not so good Poor Don t know Among the six services residents were asked to rate, local roads and sidewalks receive the lowest rating: 46 percent say they are not so good or poor. Los Angeles residents (50%) are most likely to give negative ratings, followed by Central Valley (48%), San Francisco Bay Area (46%), Inland Empire (43%), and Orange/San Diego Counties (36%) residents. Asians (33%) are the least likely racial/ethnic group to give a low rating; upper-income adults (38%) are less likely than others to say roads are not so good or poor. Local public schools also fare worse than other local services, with one in three Californians saying they are not so good or poor. Negative ratings are given by 36 percent of residents in Los Angeles, 34 percent in the Central Valley, 32 percent in the San Francisco Bay Area, 31 percent in the Inland Empire, and 28 percent in Orange/San Diego Counties. Blacks (43%) are more likely than other racial/ethnic groups to call their local public schools not so good or poor. The views of parents with children age 18 or younger (34% not so good/poor) is similar to those without children (31% not so good/poor). Asked to rate local medical and health care services, 22 percent call them not so good or poor. Among racial/ethnic groups, blacks (37%) rate these services more negatively than Asians (27%), Latinos (27%), and whites (17%). Low marks are more likely among those earning less than $80,000 than among those earning $80,000 or more. As education levels rise, low ratings fall. Adults without health insurance (36%) are far more likely than the insured (19%) to rate medical and health care services poorly. How about? Local roads Local public Local medical and Percent saying not so good/poor and sidewalks schools health care services 46% 33% 22% Asians Race/Ethnicity Blacks Latinos Whites Under $40, Household income $40,000 to under $80, $80,000 or more February 2011 Californians and Healthy Communities 12
13 RATING LOCAL COMMUNITY CONDITIONS (CONTINUED) One in five Californians rate their local police protection as not so good or poor. Less than three in 10 across party, regional, and demographic groups rate it negatively, with some differences. Negative ratings are slightly lower in Orange/San Diego Counties (12%) and the Inland Empire (13%) than elsewhere (18% San Francisco Bay Area, 22% Los Angeles, 24% Central Valley). Across racial/ethnic groups, blacks (29%) are most likely to give negative ratings, while whites (14%) are least likely. Lower-income adults are more likely than those with middle- and upper-incomes to give a low rating. Local parks and playgrounds are also mostly assessed positively, with just 17 percent of residents saying they are not so good or poor; fewer than one in four across regions and demographic groups give parks and playgrounds a low rating. Of the six services surveyed, local grocery stores and restaurants are the least likely to receive negative ratings. Less than one in five across regions and demographic groups have a negative impression of their local grocery stores and restaurants. How about? Local police Local parks Local grocery stores Percent saying not so good/poor protection and playgrounds and restaurants 19% 17% 12% Asians Race/Ethnicity Blacks Latinos Whites Under $40, Household Income $40,000 to under $80, $80,000 or more Half of Californians think the performance of their city (or local) government in solving local problems is excellent (7%) or good (44%); four in 10 call it not so good (30%) or poor (10%). Partisans give similar positive ratings (54% Democrats, 53% Republicans, 52% independents). About half across most demographic groups give an excellent or good rating; ratings are somewhat higher among college graduates (58%), Asians (60%), and upper-income residents (62%). Across racial/ethnic groups, blacks (50%) are most likely to say the performance of their city government is not so good or poor (42% Latinos, 40% whites, 30% Asians). Middle- and lower-income residents (43% each) are more likely than upper-income residents (33%) to give negative ratings. Central Valley residents are fairly divided (48% not so good/poor; 42% excellent/good); in other regions, most give positive ratings. How about the performance of your city (or local) government in solving local problems? Party Dem Rep Ind Likely Voters Excellent 7% 5% 11% 6% 8% Good Not so good Poor Don t know February 2011 Californians and Healthy Communities 13
14 PERCEIVED LOCAL PROBLEMS When it comes to local community problems unemployment stands out, with 59 percent calling it a big problem. Far fewer say other conditions are big problems: violence and street crime (23%); air pollution and other types of environmental pollutants (23%); access to places to safely walk, bike, and get physical exercise (13%); and access to grocery stores and restaurants with healthy food choices (10%). Majorities say unemployment, violence, and air pollution are at least somewhat of a problem, but don t think a lack of places to get physical exercise or a lack of food services with healthy choices are much of a problem. I am going to read you a list of problems other people have told us about. For each, please tell me if you think this is a big problem, somewhat of a problem, or not much of a problem in your local community today. How much of a problem are? Air pollution and other types of environmental pollutants The lack of places to safely walk, bike, and get physical exercise The lack of grocery stores and restaurants with healthy food choices Violence and Unemployment street crime Big problem 59% 23% 23% 13% 10% Somewhat of a problem Not much of a problem Don t know Six in 10 adults and about six in 10 across political parties think unemployment is a big problem in their local communities. Yet the perception that unemployment is a big problem diverges starkly across regional and demographic groups. Seventy-three percent of Central Valley residents call unemployment a big problem, followed by six in 10 in the Inland Empire (62%) and Los Angeles (60%), 56 percent in the San Francisco Bay Area, and half in Orange/San Diego Counties (51%). Across racial/ethnic groups, three in four blacks (76%) and two in three Latinos (67%) call unemployment a big problem, compared to 55 percent of whites and half of Asians. More than six in 10 of those without a college degree (65% high school or less; 62% some college) cite this issue as a big problem, compared to fewer than half of college graduates (47%). The percentage calling unemployment a big problem decreases sharply as income rises. Among those who are unemployed and looking for work 77 percent think this problem is big; 61 percent of part-time workers and 56 percent of full-time workers agree. How much of a problem is unemployment? Household Income $40,000 to Under $40,000 $80,000 or more under $80,000 Big problem 59% 69% 59% 44% Somewhat of a problem Not much of a problem Don t know Far fewer (23%) call violence and street crime a big problem in their local community; 33 percent say this is somewhat of a problem and 43 percent say it is not much of a problem. Partisans hold similar views on the extent of this problem. However, there are differences across regions: a majority in Orange/San Diego Counties (54%) say this issue is not much of a problem, but majorities in all other regions call it at least somewhat of a problem. Central Valley and Los Angeles residents (30% each) are the most likely to say violence is a big problem. Blacks (41%) and Latinos (36%) are far more likely than whites (16%) and Asians (12%) to say violence is a big problem in their local community. The perception that violence is a big problem decreases as income and education levels rise. February 2011 Californians and Healthy Communities 14
15 PERCEIVED LOCAL PROBLEMS (CONTINUED) Twenty-three percent of Californians call air pollution and other environmental pollutants a big problem in their community, 32 percent say this is somewhat of a problem, and 44 percent think it is not much of a problem. Majorities of Democrats (26% big, 34% somewhat) and independents (21% big, 35% somewhat) say air pollution is a problem, while 62 percent of Republicans say it is not much of a problem. Majorities in Los Angeles (67%) and the Central Valley (63%) say it is at least somewhat of a problem; more Orange/San Diego County residents think this issue is not a problem (55%) than a problem (44%), while residents in the other two regions are divided. Across racial/ethnic groups, blacks (41%) are the most likely to say air pollution is a big problem, followed by Latinos (29%), whites (19%), and Asians (16%). How much of a problem are air pollution and other types of environmental pollutants? All Region Adults Central Valley San Francisco Bay Area Los Angeles Orange/ San Diego Inland Empire Big problem 23% 29% 16% 36% 11% 19% Somewhat of a problem Not much of a problem Don t know It is not much of a problem to find safe places in the community to walk, bike, and get physical exercise according to 66 percent of Californians; a third say it is a big (13%) or somewhat of a problem (21%). Strong majorities across parties say it is not much of a problem and at least six in 10 across regions agree. While majorities across demographic groups think access to places to exercise is not much of a problem, disparities are present among groups. Seventy-six percent of Asians and 72 percent of whites say this issue is not much of a problem, compared to slight majorities of blacks (55%) and Latinos (54%). Men (73%) are much more likely than women (59%) to say it is not a problem. College graduates and adults earning $40,000 or more are much more likely than those without a college degree and lowerincome adults to say this issue is not a problem. How much of a problem is the lack of places to safely walk, bike, and get physical exercise? Race/Ethnicity Asians Blacks Latinos Whites Big problem 13% 5% 18% 21% 10% Somewhat of a problem Not much of a problem Don t know 1 1 While 26 percent of Californians believe it is a big (10%) or somewhat of a problem (16%) in their community to find grocery stores and restaurants that offer healthy food choices, an overwhelming majority (73%) say it is not much of a problem. Strong majorities across regions agree; residents of Orange/San Diego Counties and the San Francisco Bay Area (79% each) are the most likely to say it is not a problem while Los Angeles residents (65%) are the least likely to say this. While majorities of whites (84%), Asians (73%), and Latinos (60%) say it is not much of a problem, blacks are divided (49% big or somewhat of a problem, 47% not a problem). Majorities across other demographic groups say it is not much of a problem. Men (78%) are much more likely than women (67%) to say finding healthy choices is not a problem; adults age 35 and older are more likely than younger adults to say it is not a problem. The percentage saying it is not much of a problem rises as education and income levels increase. February 2011 Californians and Healthy Communities 15


16 HEALTHY COMMUNITIES & POLICY PREFERENCES KEY FINDINGS Half of Californians say conditions in their local communities positively affect their health; 34 percent say such conditions don t affect their health at all. (page 17) Factors Contributing to the Overall Health of People in Their Local Community Some 100 A lot 80 At least half of Californians say good jobs, safety from violence, good schools, good air quality, healthy food choices, and safe areas for walking and exercise contribute a lot to the overall health of people in their local community. (pages 18, 19) Percent all adults On disparities in conditions between lowerincome areas and other areas of their region, most adults (58%) say there is far more violence in lower-income areas. They see other disparities as well such as in schools and access to health care but say they are not as great. (pages 20, 21) Majorities say their local governments are not doing enough to improve schools or increase job opportunities, with differences across racial/ethnic groups. Most say local governments are doing the right amount to reduce violence, but blacks and Latinos are much more likely than whites and Asians to say action falls short. (pages 22, 23) Strong majorities say obesity is a very serious public health problem, but there is a partisan divide about who holds the most responsibility for addressing it. About half of Californians would like to lose weight, with 62 percent of those adults saying they are on a program to do so. (page 24) Six in 10 adults say health care services in their local community should give more emphasis to prevention than to treatment. Three in four say universal health coverage for children is very important in preventing illness. (page 25) Percent all adults Percent Saying Obesity Is a Very Serious Public Health Problem in the U.S. Percent all adults 0 Opportunities for Walking, Biking, Physical Exercise Good jobs 41 Under $40,000 Percent saying local government not providing enough 57 Adults nationwide* 36 $40,000 $80,000 Good air quality $80,000 or more California adults *CBS News poll, December 2009 February 2011 Californians and Healthy Communities 16
17 IMPACT OF LOCAL COMMUNITIES ON HEALTH Half of Californians think that the conditions in their local community are having a very (19%) or somewhat (30%) positive effect on their overall health; 14 percent think they have a somewhat (10%) or very negative (4%) effect, while 34 percent say that the conditions in their local community have no effect at all on their health. Across regions, residents of the San Francisco Bay Area (56%), Orange/San Diego Counties (52%), and Los Angeles (50%) are more likely than those in the Central Valley (39%) and the Inland Empire (38%) to say that local community conditions have a positive effect on their health. Asians (57%) are the most likely racial/ethnic group to say their community positively impacts their health, followed by Latinos (51%), whites (45%), and blacks (44%). About half of men, women, and adults across age and income groups think local community conditions have a positive effect on their health. Among Californians who have health insurance, and among those who do not, half hold this view. Among those who are very satisfied with the quality of life in their local community, 62 percent say conditions have a positive effect on their health. Among those who are somewhat satisfied with their local quality of life, 45 percent say conditions have a positive effect. In general, do you think that conditions in your local community are having a positive effect, a negative effect, or no effect at all on your health? (if positive or negative: Would that be very or somewhat?) Race/Ethnicity Asians Blacks Latinos Whites Very positive effect 19% 17% 10% 21% 18% Somewhat positive effect Somewhat negative effect Very negative effect No effect at all Don't know When asked about the term healthy communities, 80 percent of Californians say they understand what it means very (39%) or somewhat well (41%); 17 percent say not very (12%) or not at all well (5%). Across regions, more than seven in 10 say they understand the term very or somewhat well, with Orange/San Diego County residents (84%) the most likely to hold this view followed by residents in the Central Valley (82%), Los Angeles (81%), the San Francisco Bay Area (79%), and the Inland Empire (73%). At least three in four across demographic groups say they understand very or somewhat well what healthy communities means. Four in 10 across education groups say they understand this very well. Some differences emerge across racial/ethnic groups: blacks (59%) are most likely to say they understand this very well, then Latinos (43%), whites (38%), and Asians (28%). If you read or heard somebody talking about healthy communities, how well do you feel that you understand what they mean by those two words? Education High school or less Some college College graduate Very well 39% 39% 39% 39% Somewhat well Not very well Not at all Don't know February 2011 Californians and Healthy Communities 17
18 COMMUNITY FEATURES AND HEALTH Residents were asked the degree to which some specific factors contribute to the overall health of people in their local communities. When asked about good jobs, six in 10 say they contribute a lot (60%) to health and one in four say they contribute some (23%); fewer say they contribute not much (8%) or not at all (6%) to health. Six in 10 across parties believe good jobs contribute a lot to health. San Francisco Bay Area residents (68%) are the most likely to share this view, while those in the Central Valley (55%) are the least likely. Majorities of whites (65%), Latinos (59%), and Asians (57%) think this factor contributes a lot, compared to four in 10 blacks. The percentage saying good jobs contribute a lot increases with education and income; unemployed adults looking for work are less likely than are those who are employed to say good jobs contribute a lot to health. A majority (55%) also view good public schools as an element contributing a lot to the overall health of people in their community. Similar patterns emerge regionally on this issue, with San Francisco Bay Area adults (63%) being the most likely and those in the Central Valley (49%) least likely to hold this view. Again, disparities emerge across racial/ethnic groups: about six in 10 Latinos and Asians and 55 percent of whites think good public schools contribute a lot to people s health, while just 36 percent of blacks agree. Those aged 18 to 54 are more likely than older adults to say good public schools contribute a lot; college graduates and those earning at least $40,000 are more likely than others to agree. How much do good public schools contribute to the overall health of people in your local community today? Education High school or less Some college College graduate A lot 55% 53% 52% 62% Some Not much Not at all Don t know Half of adults think safety from violence and street crime contributes a lot to the overall health of people in their community. Most independents (54%), Democrats (53%), and Republicans (49%) view safety as contributing a lot to health. Once more, San Francisco Bay Area residents (58%) are the most likely to think this feature contributes a lot to health, while those in the Central Valley (42%) are the least likely. On this issue, racial/ethnic groups hold similar views, with at least 47 percent responding that safety from violence contributes a lot to health. Women (54%) are somewhat more likely than men (46%) to hold this view. The percentage saying safety from violence contributes a lot to health rises with income. How much does safety from violence and street crime contribute to the overall health of people in your local community today? Household Income $40,000 to Under $40,000 $80,000 or more under $80,000 A lot 50% 45% 53% 60% Some Not much Not at all Don t know February 2011 Californians and Healthy Communities 18
19 COMMUNITY FEATURES AND HEALTH (CONTINUED) Half of Californians perceive that healthy food choices in local grocery stores and restaurants contribute a lot to the overall health of people in their community. Partisans differ: 56 percent of Democrats say healthy food options contribute a lot to health compared 43 percent of independents and Republicans. San Francisco Bay Area residents (56%) are the most likely and Inland Empire residents (42%) the least likely to say healthy choices contribute a lot. Racial/ethnic differences are not as sharp on this issue as on others: Latinos (54%) are most likely to say it contributes a lot, followed by whites (50%), Asians (45%), and blacks (44%). Women (56%) are much more likely than men (44%) to say healthy food choices contribute a lot. Uninsured adults (60%) are more likely than those without health insurance (40%) to say this. Those with some college (46%) are the least likely education group to say healthy food choices contribute a lot to health. How much do healthy food choices in local grocery stores and restaurants contribute to the overall health of people in your local community today? Education High school or less Some college College graduate A lot 50% 51% 46% 54% Some Not much Not at all Don t know Asked about the extent to which having safe options for walking, biking, and getting exercise contribute to overall health, a majority of adults (54%) say it contributes a lot. Partisans agree on this issue. San Francisco Bay Area and Inland Empire residents (59% each) are the most likely to say it contributes a lot; about half of residents in Los Angeles (53%) and the Central Valley and Orange/San Diego Counties (51% each) say the same. Whites (59%) are the most likely racial/ethnic group to say a lot, followed by Latinos (54%), Asians (50%), and blacks (43%). College graduates are somewhat more likely than non-college graduates to say a lot; lower-income adults (51%) are somewhat less likely than middle- and upper-income (58%, 59%) adults to think safe exercise options contribute a lot to health. How much do safe options for walking, biking, and getting exercise contribute to the overall health of people in your local community today? Household Income $40,000 to Under $40,000 $80,000 or more under $80,000 A lot 54% 51% 58% 59% Some Not much Not at all Don t know Fifty-five percent of adults also see good air quality contributing a lot to overall health. There are some partisan differences, with Democrats (58%) being more likely than Republicans (51%) and independents (47%) to say clean air contributes a lot. Adults across regions hold similar views majorities say good air quality contributes a lot. Similar racial/ethnic disparities emerge on this factor as on others, with fewer than half of blacks (41%) saying that it contributes a lot while majorities of others say it doesn t. At least half across other demographic groups say clean air contributes a lot to overall health. February 2011 Californians and Healthy Communities 19
20 ARE LOWER-INCOME COMMUNITIES DIFFERENT? Most Californians recognize that there are community factors that have a great impact on peoples overall health, and that not all communities are equal. Eight in 10 Californians think that lower-income areas of their region have more violence and street crime than other areas 58 percent say far more and 22 percent say slightly more. Across racial/ethnic groups, whites (63%) are the most likely to say there is far more violence in lower-income areas; Latinos (57%), blacks (51%), and Asians (45%) follow. The perception that lower-income areas experience more violence varies across income groups: 49 percent of those with household incomes under $40,000 say there is far more violence; by comparison, solid majorities of middle- and upper-income (62%, 72%) residents hold this view. Similar trends emerge with education level: 52 percent of those with a high school education or less, 60 percent of those with some college education, and 65 percent of college graduates say the less well-off areas of their region have far more violence than other areas. Six in 10 across political parties say these areas have far more violence. Do you think the lower-income areas of your region have more violence and street crime than the other areas of your region, or not? (if yes: Would you say far more or slightly more?) Race/Ethnicity Asians Blacks Latinos Whites Yes, far more 58% 45% 51% 57% 63% Yes, slightly more No Don't know Six in 10 Californians think people in the lower-income areas of their region have less access to quality health care. Compared to their perceptions of violence, they are much less likely to consider this difference in access to health care a big one 37 percent say people in lower-income areas have far less access and 23 percent say slightly less. One in three (34%) say there is no difference. Majorities across regions and demographic groups say those in lower-income areas have slightly less or far less access to quality health care. Lower-income residents are the most likely across income groups to say there is slightly less or far less access. Nearly half of blacks (48%) and 43 percent of Latinos say people in lowerincome areas have far less access to quality health care; fewer whites (33%) and Asians (27%) agree. Four in 10 whites say there is no difference in access to health care. Across regions, Los Angeles residents (48%) are most likely to say far less access. Democrats (43%) are more likely than independents (33%) and Republicans (25%) to say so; half of Republicans say no difference. Do you think people in the lower-income areas of your region have less access to quality health care than people in the other areas of your region, or not? (if yes: Would you say far less or slightly less?) Race/Ethnicity Asians Blacks Latinos Whites Yes, far less 37% 27% 48% 43% 33% Yes, slightly less No Don't know Most Californians say the lower-income areas of their region have fewer local grocery stores and restaurants offering healthy food choices than other areas of their region 31 percent say far fewer, 24 percent say slightly fewer. Across racial/ethnic groups, most perceive a disparity in the number of stores February 2011 Californians and Healthy Communities 20
21 ARE LOWER-INCOME COMMUNITIES DIFFERENT? (CONTINUED) and restaurants with healthy options, but Latinos (36%) and blacks (35%) are the most likely to say there are far fewer options. Most Republicans (53%) say there is no difference between lower-income and other areas of their region when it comes to healthy food options; majorities of Democrats and independents say otherwise. At least half across income and demographic groups perceive at least a slight disparity. Do you think the lower-income areas of your region have fewer local grocery stores and restaurants that offer healthy food choices than the other areas of your region, or not? (if yes: Would you say far fewer or slightly fewer?) Race/Ethnicity Asians Blacks Latinos Whites Yes, far fewer 31% 21% 35% 36% 30% Yes, slightly fewer No Don't know Six in 10 Californians say the lower-income areas of their regions have far fewer (35%) or slightly fewer (25%) parks, playgrounds, and places to safely walk, bike, and get physical exercise than the other areas of their region. Republicans (46%) are much less likely than independents (61%) and Democrats (67%) to say there is a difference between lower-income and other areas in their region. Majorities across racial/ethnic groups think lower-income areas have fewer places for playing and exercising; blacks (45%) and Latinos (40%) are most likely to say there are far fewer, followed by whites (33%) and Asians (28%). Majorities across income, education, and other demographic groups perceive at least a slight disparity; the percentage declines with age. Do you think the lower-income areas of your region have fewer parks, playgrounds, and places to safely walk, bike, and get physical exercise than the other areas of your region, or not? (if yes: Would you say far fewer or slightly fewer?) Race/Ethnicity Asians Blacks Latinos Whites Yes, far fewer 35% 28% 45% 40% 33% Yes, slightly fewer No Don't know Regarding air quality, one in three Californians say it is far worse (15%) or slightly worse (17%) in the lower-income areas of their region than in other areas. Most Californians (63%) believe the lower-income areas of their region do not have worse air quality; majorities across parties agree, but Republicans (79%) are the most likely to hold this view. Across regions, majorities say there is no difference, but Los Angeles residents (53%) are the least likely to hold this view. At least half across demographic groups say there is no difference, except among blacks, a majority of whom (54%) think air quality is worse in lower-income areas. The share saying air quality is worse in lower-income areas declines as income falls. Six in 10 Californians say the public schools in the lower-income areas of their region are worse than the public schools in other areas of their region 34 percent say far worse, 25 percent slightly worse. Two in three Democrats and independents say schools are slightly or far worse in lower-income areas; 50 percent of Republicans agree. Majorities across demographic groups say schools are worse in the lower-income areas; the percentage holding this view rises with education and income. February 2011 Californians and Healthy Communities 21
22 ROLE OF LOCAL GOVERNMENT A majority of Californians (53%) say their local government is not doing enough to improve the quality of public schools in their community, while 36 percent say local government is doing the right amount; just 5 percent say they are doing too much. Fifty-nine percent of Democrats, 52 percent of independents, and 47 percent of Republicans say efforts fall short. Across racial/ethnic groups, two in three blacks (67%) think their local government is not doing enough to improve local public schools, while fewer Latinos (56%), whites (51%), and Asians (47%) agree. The percentage saying local efforts fall short declines with age (60% 18 34; 52% 35 54; 45% 55 and older); at least half across education and income groups think local government is not doing enough. A majority of parents of public school children (57%) say local governments are not doing enough to improve public school quality. Across regions, Los Angeles residents (58%) are the most likely to say this, followed by those in the San Francisco Bay Area and Central Valley (53% each), Orange/San Diego Counties (50%), and the Inland Empire (46%). Do you think your local government is doing too much, the right amount, or not enough to improve the quality of public schools in your local community? Race/Ethnicity Asians Blacks Latinos Whites Doing too much 5% 3% 4% 10% 2% The right amount Not enough Don't know Californians are less critical of local government when it comes to reducing violence and street crime. Half of Californians (50%) think their local government is doing the right amount to reduce violence and street crime, while 42 percent think it is not doing enough. At least half across parties think their local governments are doing the right amount. Across income groups, a plurality of those with incomes under $40,000 (48%) say local efforts are inadequate, while majorities of middle-income (53%) and upperincome (64%) residents say local governments are doing the right amount to reduce violence. Similarly, the percentage saying not enough is higher among residents with less education (48% high school or less; 41% some college; 32% college graduates). Across racial/ethnic groups, 57 percent of blacks and 50 percent of Latinos say local efforts to reduce violence and street crime are not going far enough; by comparison, 58 percent of whites and 63 percent of Asians say they are doing the right amount. Among those who say violence and street crime are big problems in their local community, 73 percent say local government is not doing enough. Among those who say violence is not much of a problem in their community, 71 percent say their local governments are doing the right amount to reduce it. Do you think your local government is doing too much, the right amount, or not enough to reduce violence and street crime in your local community? Household Income $40,000 to Under $40,000 $80,000 or more under $80,000 Doing too much 6% 10% 3% 1% The right amount Not enough Don't know February 2011 Californians and Healthy Communities 22
23 ROLE OF LOCAL GOVERNMENT (CONTINUED) When it comes to increasing access to healthy foods in their local community, nearly half of Californians (49%) say their local governments are doing the right amount; 37 percent say they are not doing enough. Republicans (60%) are the most likely to say their local governments are doing the right amount, followed by independents (54%) and Democrats (49%). Opinion varies across demographic groups. Most blacks (58%) and Latinos (52%) say their local governments are not doing enough to increase access to healthy foods, while most whites (58%) and Asians (61%) say they are doing the right amount. College graduates (58%) and those with middle (53%) and higher (58%) incomes are more likely than less educated and lower-income residents to say their local governments are doing enough. Residents with health insurance (52%) are much more likely than uninsured residents (37%) to say local government are doing enough. Do you think your local government is doing too much, the right amount, or not enough to increase access to healthy foods in your local community? Household Income $40,000 to Under $40,000 $80,000 or more under $80,000 Doing too much 8% 8% 7% 7% The right amount Not enough Don't know Most Californians (54%) think local efforts to increase opportunities for walking, biking, and physical exercise are adequate; 36 percent say their local government is not doing enough. More than half across parties think their local governments are doing the right amount, but Republicans (64%) are the most likely to say this. About half of blacks (50%) and Latinos (49%) say local efforts fall short, while solid majorities of whites (62%) and Asians (72%) say efforts are adequate. Upper-income residents (68%) are more likely than middle- and lower-income (52%, 48%) residents to say local government is doing the right amount to increase opportunities for physical activity. Across age groups, about 55 percent say local governments are doing the right amount; this perception increases as education increases. Do you think your local government is doing too much, the right amount, or not enough to increase opportunities for walking, biking, and physical exercise in your local community? Race/Ethnicity Asians Blacks Latinos Whites Doing too much 7% 1% 9% 10% 7% The right amount Not enough Don't know When it comes to increasing job opportunities, 68 percent of adults say their local government is not doing enough; just 21 percent say they are doing the right amount. Majorities across parties agree that their local governments are not doing enough, with Democrats (72%) the most likely to express this view. Majorities across demographic groups say local efforts fall short when it comes to job creation, including 88 percent of blacks, 76 percent of Latinos, and 62 percent of both whites and Asians. The share that say local government is not doing enough is higher among those with a high school education or less (74%), those making less than $80,000 (75% under $40,000; 70% $40,000 to under $80,000), and those who are unemployed (83%) or working part-time (76%). February 2011 Californians and Healthy Communities 23
24 OBESITY AND HEALTH Three in four Californians (75%) think obesity is a very serious public health problem. Adults nationwide (57%) were much less likely to express this view in a December 2009 CBS News poll. In California, majorities across political parties say obesity is a very serious problem, but Democrats at 83 percent are the most likely to say this. Strong majorities of Californians across regions and demographic groups agree that obesity is a very serious public health problem. Please tell me how serious a public health problem you think obesity is, that is, people being seriously overweight in this country. Party Dem Rep Ind Likely Voters Very serious 75% 83% 65% 71% 75% Somewhat serious Not very serious Not at all serious Don t know Nearly all Californians (93%) think obesity is something that can be controlled through diet and exercise. In the CBS News poll, results were similar among adults nationwide (89%). At least nine in 10 Californians across regions and demographic groups think obesity can be controlled. Still, there are differing views about who bears the primary responsibility for addressing this issue. Forty-three percent say individuals and families are responsible, just 2 percent say the public and government, and 54 percent say a combination of both is responsible. Opinions are divided along partisan lines: most Democrats (62%) say addressing obesity is both an individual and government responsibility, while most Republicans (63%) say it s an individual responsibility. Majorities across most demographic groups say it s a shared responsibility. A vast majority of Californians (87%) believe that a person s weight can greatly improve their chances for a long and healthy life and another 10 percent say weight can improve those chances a little. More than eight in 10 across parties, regions, and demographic groups agree. So how do Californians feel about their own weight? Forty-eight percent would like to lose weight, 45 percent would like to stay at their current weight, and only 6 percent would like to gain weight. In a November 2010 Gallup poll, adults nationwide were more likely to want to lose weight (54%) than stay at their current weight (39%). In California, between 45 and 50 percent across racial/ethnic groups would like to lose weight. Women would prefer to lose weight rather than stay at their current weight (51% to 43%), while men are divided (45% lose weight, 46% stay at current weight). Younger Californians (50%) would prefer to stay at their current weight, while those age (53%) and 55 and older (54%) want to lose weight. Of those who would like to lose weight, 62 percent say they are trying to do so through some kind of special effort, such as a diet or exercise program. Would you like to lose weight, stay at your current weight, or put on weight? Household Income Gender Under $40,000 to $80,000 $40,000 under $80,000 or more Men Women Lose weight 48% 47% 49% 50% 45% 51% Stay at current weight Put on weight Don't know February 2011 Californians and Healthy Communities 24
25 IMPORTANCE OF PREVENTING ILLNESS AS A POLICY APPROACH When provided a brief description of two approaches to health and sickness ( treatment which seeks to cure sickness and prevention which seeks to prevent sickness ), most Californians (60%) think that health care services in their local communities should give more emphasis to prevention; 13 percent say more emphasis should be given to treatment, while 21 percent say health care services currently have the right balance. Democrats (67%) and independents (63%) are far more likely than Republicans (44%) to prefer a greater emphasis on prevention; 36 percent of Republicans say right balance. Across regions and demographic groups, majorities prefer giving more emphasis to prevention. Most Californians (87%) think health care policies that try to prevent illness play a very (57%) or somewhat (30%) important role in the overall health of residents in their local community. More than three in four across parties, regions, and demographic groups say preventive health policies are very or somewhat important to the health of residents in their community. Democrats (62%) are more likely than independents (54%) or Republicans (45%) to say they are very important. Los Angeles residents (62%) are the most likely and Central Valley residents (53%) the least likely to say very important. Blacks (67%) and Latinos (65%) are somewhat more likely than Asians (56%) and whites (53%), and women (62%) are more likely than men (53%) to say this. Of those who say local health services should give more emphasis to prevention, 62 percent say preventive policies are very important. Do you think that health care policies which seek to prevent illness play a very important, somewhat important, not too important, or not at all important role in the overall health of residents in your local community? Party Dem Rep Ind Likely Voters Very important 57% 62% 45% 54% 57% Somewhat important Not too important Not at all important Don t know Nearly all Californians (91%) say universal children s health coverage is very (76%) or somewhat (15%) important in preventing illness. Across all parties, regions, and demographic groups, more than eight in 10 consider universal children s health coverage to be at least somewhat important in preventing illness. The percentage saying it is very important is much higher among Democrats (86%) than among independents (70%) or Republicans (59%). Blacks (89%) and Latinos (87%) are more likely than Asians (72%) and whites (69%) to say universal children s health coverage is very important in preventing illness. Uninsured residents (86%) are more likely than insured residents (73%) to say very important. The share saying it is very important declines with education and is higher among lower-income residents. How important is universal children s health coverage in preventing illness? Race/Ethnicity Asians Blacks Latinos Whites Very important 76% 72% 89% 87% 69% Somewhat important Not too important Not at all important Don t know February 2011 Californians and Healthy Communities 25
26
Californians & Their Government
 PPIC STATEWIDE SURVEY DECEMBER 2018 Californians & Their Government Mark Baldassare Dean Bonner Alyssa Dykman Lunna Lopes CONTENTS Press Release State Post-Election Landscape Federal Post-Election Landscape
Californians & Their Government
 Californians & Their Government Mark Baldassare Dean Bonner David Kordus Lunna Lopes CONTENTS Press Release 3 Federal Government 6 State Government 15 Regional Map 22 Methodology 23 Questionnaire and Results
Californians. their government. ppic state wide surve y JANUARY in collaboration with The James Irvine Foundation CONTENTS
 ppic state wide surve y JANUARY 2014 Californians & their government Mark Baldassare Dean Bonner Sonja Petek Jui Shrestha CONTENTS About the Survey 2 Press Release 3 State Government 6 Federal Government
Californians. population issues. february in collaboration with The William and Flora Hewlett Foundation
 february 2009 Californians & population issues in collaboration with The William and Flora Hewlett Foundation Mark Baldassare Dean Bonner Jennifer Paluch Sonja Petek The Public Policy Institute of California
Californians. their government. ppic state wide surve y MARCH in collaboration with The James Irvine Foundation CONTENTS
 ppic state wide surve y MARCH 2014 Californians & their government Mark Baldassare Dean Bonner Sonja Petek Jui Shrestha CONTENTS About the Survey 2 Press Release 3 State Government 6 Federal Government
Californians & Their Government
 Californians & Their Government Mark Baldassare Dean Bonner David Kordus Lunna Lopes CONTENTS Press Release 3 State Issues 6 Federal Issues 14 Regional Map 24 Methodology 25 Questionnaire and Results 27
Californians. their government. ppic state wide surve y SEPTEMBER supported with funding from The James Irvine Foundation CONTENTS
 ppic state wide surve y SEPTEMBER 2015 Californians & their government Mark Baldassare Dean Bonner David Kordus Lunna Lopes CONTENTS About the Survey 2 Press Release 3 State Government 6 Federal Government
Californians. their government. ppic state wide surve y SEPTEMBER in collaboration with The James Irvine Foundation
 ppic state wide surve y SEPTEMBER 2014 Californians & their government Mark Baldassare Dean Bonner Renatta DeFever Lunna Lopes Jui Shrestha CONTENTS About the Survey 2 Press Release 3 November 2014 Election
Californians. their government. ppic statewide survey DECEMBER in collaboration with The James Irvine Foundation CONTENTS
 ppic statewide survey DECEMBER 2010 Californians & their government Mark Baldassare Dean Bonner Sonja Petek Nicole Willcoxon CONTENTS About the Survey 2 Press Release 3 November 2010 Election 6 State and
march 2009 Californians their government in collaboration with The James Irvine Foundation Mark Baldassare Dean Bonner Jennifer Paluch Sonja Petek
 march 2009 Californians & their government in collaboration with The James Irvine Foundation Mark Baldassare Dean Bonner Jennifer Paluch Sonja Petek The Public Policy Institute of California is dedicated
Californians & Their Government
 Californians & Their Government Mark Baldassare Dean Bonner Lunna Lopes CONTENTS Press Release 3 2018 California Election 6 State and National Issues 13 Regional Map 20 Methodology 21 Questionnaire and
Californians. their government. ppic state wide surve y MAY in collaboration with The James Irvine Foundation CONTENTS
 ppic state wide surve y MAY 2013 Californians & their government Mark Baldassare Dean Bonner Sonja Petek Jui Shrestha CONTENTS About the Survey 2 Press Release 3 State Government 6 Federal Government 16
Californians. their government. ppic statewide survey SEPTEMBER in collaboration with The James Irvine Foundation CONTENTS
 ppic statewide survey SEPTEMBER 2010 Californians & their government Mark Baldassare Dean Bonner Sonja Petek Nicole Willcoxon CONTENTS About the Survey 2 Press Release 3 November 2010 Election 6 State
Californians. their government. ppic state wide surve y SEPTEMBER in collaboration with The James Irvine Foundation CONTENTS
 ppic state wide surve y SEPTEMBER 2013 Californians & their government Mark Baldassare Dean Bonner Sonja Petek Jui Shrestha CONTENTS About the Survey 2 Press Release 3 State Government 6 Federal Government
Californians. their government. ppic state wide surve y OCTOBER in collaboration with The James Irvine Foundation CONTENTS
 ppic state wide surve y OCTOBER 2012 Californians & their government Mark Baldassare Dean Bonner Sonja Petek Jui Shrestha CONTENTS About the Survey 2 Press Release 3 November 2012 Election 6 State and
Californians. their government. january in collaboration with The James Irvine Foundation
 january 2009 Californians & their government in collaboration with The James Irvine Foundation Mark Baldassare Dean Bonner Jennifer Paluch Sonja Petek The Public Policy Institute of California is dedicated
Californians. their government. ppic state wide surve y JANUARY in collaboration with The James Irvine Foundation CONTENTS
 ppic state wide surve y JANUARY 2013 Californians & their government Mark Baldassare Dean Bonner Sonja Petek Jui Shrestha CONTENTS About the Survey 2 Press Release 3 State Government 6 Federal Government
Californians. their government. ppic statewide sur vey J A N U A R Y in collaboration with The James Irvine Foundation CONTENTS
 ppic statewide sur vey J A N U A R Y 2 0 1 0 Californians & their government Mark Baldassare Dean Bonner Sonja Petek Nicole Willcoxon CONTENTS About the Survey 2 Press Release 3 2010 Election Context 6
Californians. their government. ppic state wide surve y MARCH in collaboration with The James Irvine Foundation CONTENTS
 ppic state wide surve y MARCH 2012 Californians & their government Mark Baldassare Dean Bonner Sonja Petek Jui Shrestha CONTENTS About the Survey 2 Press Release 3 2012 Elections 6 State and National Issues
Californians & the Environment
 Californians & the Environment Mark Baldassare Dean Bonner Alyssa Dykman Lunna Lopes CONTENTS Press Release 3 2018 Election and Environmental Issues 6 Public Perceptions and Policy Preferences 14 Regional
PPIC STATEWIDE SURVEY
 PPIC STATEWIDE SURVEY SEPTEMBER 2004 Californians and Their Government Public Policy Institute of California Mark Baldassare Research Director & Survey Director The Public Policy Institute of California
Californians. their government. ppic statewide sur vey. d e c e m b e r in collaboration with The James Irvine Foundation CONTENTS
 ppic statewide sur vey d e c e m b e r 2 0 0 9 Californians & their government Mark Baldassare Dean Bonner Jennifer Paluch Sonja Petek CONTENTS About the Survey 2 Press Release 3 2010 California Election
Californians & Their Government
 Californians & Their Government Mark Baldassare Dean Bonner Alyssa Dykman Lunna Lopes CONTENTS Press Release 3 2018 California Election 6 State and National Issues 12 Regional Map 20 Methodology 21 Questionnaire
Californians & Their Government
 Californians & Their Government Mark Baldassare Dean Bonner Alyssa Dykman CONTENTS Press Release 3 2018 California Election 6 State and National Issues 11 Regional Map 20 Methodology 21 Questionnaire and
Mark Baldassare is President and Chief Executive Officer of PPIC. Thomas C. Sutton is Chair of the Board of Directors.
 MaY 2008 The Public Policy Institute of California is dedicated to informing and improving public policy in California through independent, objective, nonpartisan research on major economic, social, and
As Budget Angst Grows, Californians Take Stock of Fiscal Options And Take Aim at Elected Leaders
 EMBARGOED: Do not publish or broadcast until 10:00 p.m. PDT on Wednesday, March 26. CONTACT: Andrew Hattori, 415/291-4417 Abby Cook, 415/291-4436 Para ver este comunicado de prensa en español, por favor
PPIC STATEWIDE SURVEY
 PPIC STATEWIDE SURVEY SEPTEMBER 2005 Special Survey on Californians and the Initiative Process in collaboration with The James Irvine Foundation Public Policy Institute of California Mark Baldassare Research
PUBLIC POLICY INSTITUTE OF CALIFORNIA 500 Washington Street, Suite 800 San Francisco, California phone: fax:
 PUBLIC POLICY INSTITUTE OF CALIFORNIA 500 Washington Street, Suite 800 San Francisco, California 94111 phone: 415.291.4400 fax: 415.291.4401 www.ppic.org survey@ppic.org TABLE OF CONTENTS About the Survey
David W. Lyon is founding President and Chief Executive Officer of PPIC. Thomas C. Sutton is Chair of the Board of Directors.
 The Public Policy Institute of California (PPIC) is a private operating foundation established in 1994 with an endowment from William R. Hewlett. The Institute is dedicated to improving public policy in
PPIC STATEWIDE SURVEY
 PPIC STATEWIDE SURVEY OCTOBER OBER 2004 Californians and Their Government Public Policy Institute of California Mark Baldassare Research Director & Survey Director The Public Policy Institute of California
Californians. their government. september in collaboration with The James Irvine Foundation
 september 2008 Californians & their government in collaboration with The James Irvine Foundation Mark Baldassare Dean Bonner Jennifer Paluch Sonja Petek The Public Policy Institute of California is dedicated
PPIC STATEWIDE SURVEY
 PPIC STATEWIDE SURVEY FEBRU ARY 2006 Californians and the Environment in collaboration with The David and Lucile Packard Foundation Public Policy Institute of California Mark Baldassare Research Director
David W. Lyon is founding President and Chief Executive Officer of PPIC. Thomas C. Sutton is Chair of the Board of Directors.
 The Public Policy Institute of California (PPIC) is a private operating foundation established in 1994 with an endowment from William R. Hewlett. The Institute is dedicated to improving public policy in
PPIC STATEWIDE SURVEY
 PPIC STATEWIDE SURVEY NOVEMBER 2003 Special Survey on Californians and the Environment in collaboration with The William and Flora Hewlett Foundation The James Irvine Foundation The David and Lucile Packard
TABLE OF CONTENTS. About the Survey 1. Press Release 3. State Issues 7. National Issues 15. Regional Map 24. Methodology 25
 TABLE OF CONTENTS About the Survey 1 Press Release 3 State Issues 7 National Issues 15 Regional Map 24 Methodology 25 Questionnaire and Results 27 ABOUT THE SURVEY The PPIC Statewide Survey provides policymakers,
PPIC STATEWIDE SURVEY
 PPIC STATEWIDE SURVEY J ANUAR ARY Y 2006 Special Survey on the California State Budget in collaboration with The James Irvine Foundation Public Policy Institute of California Mark Baldassare Research Director
PPIC Statewide Survey Methodology
 PPIC Statewide Survey Methodology Updated February 7, 2018 The PPIC Statewide Survey was inaugurated in 1998 to provide a way for Californians to express their views on important public policy issues.
PPIC Statewide Survey: Special Survey on Land Use part of the Growth, Land Use, and Environment Series
 PPIC Statewide Survey: Special Survey on Land Use part of the Growth, Land Use, and Environment Series in collaboration with the The William and Flora Hewlett Foundation The James Irvine Foundation The
Survey of Pennsylvanians on the Issue of Health Care Reform KEY FINDINGS REPORT
 The Morning Call/ Muhlenberg College Institute of Public Opinion Survey of Pennsylvanians on the Issue of Health Care Reform KEY FINDINGS REPORT Release Date November 17, 2009 KEY FINDINGS: 1. As the national
PPIC STATEWIDE SURVEY J U N E
 PPIC STATEWIDE SURVEY J U N E 2 0 0 6 Special Survey of the Central in collaboration with the Great Center Public Policy Institute of California Mark Baldassare Research Director & Survey Director The
The President, Congress and Deficit Battles April 15-20, 2011
 CBS NEWS/NEW YORK TIMES POLL For release: Thursday, April 21, 2011 6:30pm (EDT) The President, Congress and Deficit Battles April 15-20, 2011 With the possibility of more spending showdowns between President
THE ECONOMY, THE DEFICIT, AND THE PRESIDENT July 24-28, 2009
 CBS NEWS/NEW YORK TIMES POLL For Release: Wednesday, July 29, 2009 6:30 pm (EDT) THE ECONOMY, THE DEFICIT, AND THE PRESIDENT July 24-28, 2009 The economy remains the top concern for Americans, but as the
PPIC Statewide Survey: Californians and Their Government
 PPIC Statewide Survey: Californians and Their Government Mark Baldassare Senior Fellow and Survey Director January 2001 Public Policy Institute of California Preface California is in the midst of tremendous
Release # For Publication: Tuesday, September 19, 2017
 Jack Citrin Center for Public Opinion Research Institute of Governmental Studies 124-126 Moses Hall University of California Berkeley, CA 94720 Tel: 510-642- 6835 Email: igs@berkeley.edu Release #2017-16
Release #2475 Release Date: Wednesday, July 2, 2014 WHILE CALIFORNIANS ARE DISSATISFIED
 THE FIELD POLL THE INDEPENDENT AND NON-PARTISAN SURVEY OF PUBLIC OPINION ESTABLISHED IN 1947 AS THE CALIFORNIA POLL BY MERVIN FIELD Field Research Corporation 601 California Street, Suite 210 San Francisco,
Release #2345 Release Date: Tuesday, July 13, 2010
 THE FIELD POLL THE INDEPENDENT AND NON-PARTISAN SURVEY OF PUBLIC OPINION ESTABLISHED IN 1947 AS THE CALIFORNIA POLL BY MERVIN FIELD Field Research Corporation 601 California Street, Suite 900 San Francisco,
Preface. The characteristics of groups that are shaping the state's elections and policy debates.
 Preface California is now in the midst of historic changes that will profoundly affect the future of the state. To improve understanding of these changes and their effect on the political status quo, PPIC
Coping with Homeland Security in California: Surveys of City Officials and State Residents
 Occasional Papers Coping with Homeland Security in California: Surveys of City Officials and State Residents Mark Baldassare Public Policy Institute of California Christopher Hoene National League of Cities
PPIC Statewide Survey:
 Global California: PPIC Statewide Survey: Perspectives on U.S.-Japan Relations Mark Baldassare Senior Fellow and Survey Director September 2001 Public Policy Institute of California Contents Press Release
PPIC Statewide Survey: Special Survey on Growth
 PPIC Statewide Survey: Special Survey on Growth Mark Baldassare Senior Fellow and Survey Director May 2001 Part of the Growth, Land Use, and Environment Series In Collaboration with The William and Flora
Support for Restoring U.S.-Cuba Relations March 11-15, 2016
 CBS NEWS/NEW YORK TIMES POLL For release: Monday, March 21, 2016 7:00 am EDT Support for Restoring U.S.-Cuba Relations March 11-15, 2016 Amid President Barack Obama s historic trip to Cuba, a majority
Preface. The characteristics of groups that are shaping the state's elections and policy debates.
 Preface California is now in the midst of historic changes that will profoundly affect the future of the state. To improve understanding of these changes and their effect on the political status quo, PPIC
CURRENT ISSUES: THE DEBATE OVER SCHIP AND THE WAR IN IRAQ October 12-16, 2007
 CBS NEWS POLL For release: Wednesday, October 17 th, 2007 6:30 P.M. EDT CURRENT ISSUES: THE DEBATE OVER SCHIP AND THE WAR IN IRAQ October 12-16, 2007 As Democratic leaders in Congress attempt to wrangle
A Harsh Judgment on Davis Clears Schwarzenegger s Way
 CALIFORNIA EXIT POLL: THE RECALL 10/7/03 A Harsh Judgment on Davis Clears Schwarzenegger s Way In the end it was more about Gray Davis than about Arnold Schwarzenegger, and on Davis, the voters judgment
PPIC Statewide Survey: Californians and Their Government
 PPIC Statewide Survey: ns and Their Government Mark Baldassare Senior Fellow and Survey Director January 2000 Public Policy Institute of The Public Policy Institute of is a private, nonprofit research
These are the highlights of the latest Field Poll completed among a random sample of 997 California registered voters.
 THE FIELD POLL THE INDEPENDENT AND NON-PARTISAN SURVEY OF PUBLIC OPINION ESTABLISHED IN 1947 AS THE CALIFORNIA POLL BY MERVIN FIELD Field Research Corporation 601 California Street, Suite 900 San Francisco,
Grim Views of the Economy, the President and Congress September 10-15, 2011
 CBS NEWS/NEW YORK TIMES POLL For release: Friday, September 16, 2011 6:30 PM EDT Grim Views of the Economy, the President and Congress September 10-15, 2011 72% of Americans think the country is off on
AMERICANS VIEWS OF PRESIDENT TRUMP S AGENDA ON HEALTH CARE, IMMIGRATION, AND INFRASTRUCTURE
 AMERICANS VIEWS OF PRESIDENT TRUMP S AGENDA ON HEALTH CARE, IMMIGRATION, AND INFRASTRUCTURE March 2018 1 TABLE OF CONTENTS I. Health Care........... 3 II. Immigration... 7 III. Infrastructure....... 12
THE FIELD POLL. UCB Contact
 Field Research Corporation 601 California Street, Suite 900, San Francisco, CA 94108-2814 415.392.5763 FAX: 415.434.2541 field.com/fieldpollonline THE FIELD POLL UNIVERSITY OF CALIFORNIA, BERKELEY BERKELEY
THE HEALTH CARE BILL, THE PUBLIC OPTION, ABORTION, AND CONGRESS November 13-16, 2009
 CBS NEWS POLL For release: Tuesday, November 17, 2009 6:30 PM (ET) THE HEALTH CARE BILL, THE PUBLIC OPTION, ABORTION, AND CONGRESS November 13-16, 2009 Americans would strongly prefer a health care bill
PPIC Statewide Survey: Californians and Their Government
 PPIC Statewide Survey: Californians and Their Government February 8, 18 Mark Baldassare, Dean Bonner, Alyssa Dykman, Lunna Lopes Supported with funding from the James Irvine Foundation, the California
Proposed gas tax repeal backed five to four. Support tied to voter views about the state s high gas prices rather than the condition of its roads
 Jack Citrin Center for Public Opinion Research Institute of Governmental Studies 124-126 Moses Hall University of California, Berkeley Berkeley, CA 94720 Tel: 510-642- 6835 Email: igs@berkeley.edu Release
It's Still the Economy
 It's Still the Economy County Officials Views on the Economy in 2010 Richard L. Clark, Ph.D Prepared in cooperation with The National Association of Counties Carl Vinson Institute of Government University
These are the findings from the latest statewide Field Poll completed among 1,003 registered voters in early January.
 THE FIELD POLL THE INDEPENDENT AND NON-PARTISAN SURVEY OF PUBLIC OPINION ESTABLISHED IN 1947 AS THE CALIFORNIA POLL BY MERVIN FIELD Field Research Corporation 601 California Street, Suite 210 San Francisco,
THE BUSH PRESIDENCY AND THE STATE OF THE UNION January 20-25, 2006
 CBS NEWS/NEW YORK TIMES POLL For release: January 26, 2005 6:30 P.M. THE BUSH PRESIDENCY AND THE STATE OF THE UNION January 20-25, 2006 For the first time in his presidency, George W. Bush will give a
THE FIELD POLL. UCB Contact
 Field Research Corporation 601 California St., Ste 900, San Francisco, CA 94108-2814 (415) 392-5763 FAX: (415) 434-2541 field.com/fieldpollonline THE FIELD POLL UNIVERSITY OF CALIFORNIA, BERKELEY BERKELEY
PRESIDENT BUSH GAINS ON TERRORISM, NOT ON IRAQ August 17-21, 2006
 CBS NEWS/NEW YORK TIMES POLL For release August 22, 2006 6:30 P.M. EDT PRESIDENT BUSH GAINS ON TERRORISM, NOT ON IRAQ August 17-21, 2006 Concerns about terrorism have risen, but there has been no change
Before the Storm: The Presidential Race October 25-28, 2012
 CBS NEWS/NEW YORK TIMES POLL For release: October 30, 2012 6:30 PM EDT Before the Storm: The Presidential Race October 25-28, 2012 In polling conducted before Hurricane Sandy hit the east coast, the presidential
America s Pre-Inauguration Mood STRONG CONFIDENCE IN OBAMA - COUNTRY SEEN AS LESS POLITICALLY DIVIDED
 NEWS Release 1615 L Street, N.W., Suite 700 Washington, D.C. 20036 Tel (202) 419-4350 Fax (202) 419-4399 FOR IMMEDIATE RELEASE: THURSDAY, January 15, 2009 America s Pre-Inauguration Mood STRONG CONFIDENCE
EVALUATING IRAQ: WHAT S AHEAD? February 8-11, 2007
 CBS NEWS POLL For Release: Monday, February 12, 2007 6:30pm ET EVALUATING IRAQ: WHAT S AHEAD? February 8-11, 2007 Many Americans are pessimistic about what may happen in Iraq two out of three say the fighting
WHERE AMERICA STANDS: ECONOMIC WORRIES PERSIST; DISSATISFACTION WITH WASHINGTON RUNS HIGH May 20-24, 2010
 CBS NEWS POLL For release: May 25, 2010 6:30 PM EDT WHERE AMERICA STANDS: ECONOMIC WORRIES PERSIST; DISSATISFACTION WITH WASHINGTON RUNS HIGH May 20-24, 2010 The latest CBS News Poll finds Americans in
RECOMMENDED CITATION: Pew Research Center, July, 2016, 2016 Campaign: Strong Interest, Widespread Dissatisfaction
 NUMBERS, FACTS AND TRENDS SHAPING THE WORLD FOR RELEASE JULY 07, 2016 FOR MEDIA OR OTHER INQUIRIES: Carroll Doherty, Director of Political Research Jocelyn Kiley, Associate Director, Research Bridget Johnson,
Frustrated with Congress, Americans See More Gridlock July 18-22, 2013
 CBS News Poll For release: Wednesday, July 24, 2013 6:30 PM ET Frustrated with Congress, Americans See More Gridlock July 18-22, 2013 76% of Americans now disapprove of Congress; 59% say they are frustrated
RECOMMENDED CITATION: Pew Research Center, December, 2016, Low Approval of Trump s Transition but Outlook for His Presidency Improves
 NUMBERS, FACTS AND TRENDS SHAPING THE WORLD FOR RELEASE DECEMBER 8, 2016 FOR MEDIA OR OTHER INQUIRIES: Carroll Doherty, Director of Political Research Jocelyn Kiley, Associate Director, Research Bridget
THE FIELD POLL. By Mark DiCamillo, Director, The Field Poll
 THE FIELD POLL THE INDEPENDENT AND NON-PARTISAN SURVEY OF PUBLIC OPINION ESTABLISHED IN 1947 AS THE CALIFORNIA POLL BY MERVIN FIELD Field Research Corporation 601 California Street, Suite 210 San Francisco,
AMERICANS ARE OPTIMISTIC ABOUT BARACK OBAMA S PRESIDENCY AND CABINET CHOICES December 4-8, 2008
 CBS NEWS POLL For release: Tuesday, December 9, 2008 6:30 PM (EST) AMERICANS ARE OPTIMISTIC ABOUT BARACK OBAMA S PRESIDENCY AND CABINET CHOICES December 4-8, 2008 Nine in ten Americans think the U.S. economy
Old National Bank Ball State University HOOSIER SURVEY
 Old National Bank Ball State University HOOSIER SURVEY 2017 Major Findings The Bowen Center for Public Affairs at Ball State University is pleased to partner this year with Old National Bank in presenting
Views of the Economy by Party --- Now / Reps Dems Inds Reps Dems Inds Good 61% 67% 56% 31% 78% 53% Bad
 CBS NEWS POLL For release: Thursday, February 23, 2017 7:00 am EST Optimism on the Economy, Concern About Immigration February 17-21, 2017 Evaluations of the nation s economy are the most positive they
WISCONSIN ECONOMIC SCORECARD
 RESEARCH BRIEF Q4 2013 Joseph Cera, PhD CUIR Survey Center University of Wisconsin Milwaukee WISCONSIN ECONOMIC SCORECARD The Wisconsin Economic Scorecard is a quarterly poll of Wisconsin residents conducted
July 24-28, 2009 N= 1,050
 z POLL July 24-28, 2009 N= 1,050 All trends are from New York Times/CBS News polls unless otherwise noted. An asterisk indicates registered respondents only. 1. Do you approve or disapprove of the way
2013 Texas Lyceum Poll. Executive Summary of Issue Priorities, Attitudes on Transportation, Water, Infrastructure, Education, and Health Care
 2013 of Issue Priorities, Attitudes on Transportation, Water, Infrastructure, Education, and Health Care It may be the economy for the country, but it s education here in Texas. We want to do more on roads,
POLITICS AND THE PRESIDENT April 6-9, 2006
 CBS NEWS POLL For release: April 10, 2006 6:30 P.M. POLITICS AND THE PRESIDENT April 6-9, 2006 Although President Bush s approval ratings have stopped the downward slide that occurred earlier this year
PRESIDENT OBAMA AT ONE YEAR January 14-17, 2010
 CBS NEWS POLL For release: Monday, January 18, 2010 6:30 PM (EST) PRESIDENT OBAMA AT ONE YEAR January 14-17, 2010 President Barack Obama completes his first year in office with his job approval rating
as Philadelphians voice concerns about violent crime and the overall direction of the city.
 PUBLIC OPINION POLL: MAYOR Nutter s ratings improve, but philadelphians worry about crime AND DIRECTION OF THE CITY February 14, 2012 KEY FINDINGS A new public opinion poll commissioned by The Pew Charitable
FOR RELEASE: SUNDAY, OCTOBER 13, 1991, A.M.
 FOR RELEASE: SUNDAY, OCTOBER 13, 1991, A.M. Two In Three Want Candidates To Discuss Economic Issues "DON'T KNOW" LEADS KERREY IN EARLY DEMOCRATIC NOMINATION SWEEPS "Don't Know" leads in the early stages
NUMBERS, FACTS AND TRENDS SHAPING THE WORLD FOR RELEASE OCTOBER 29, 2014 FOR FURTHER INFORMATION ON THIS REPORT:
 NUMBERS, FACTS AND TRENDS SHAPING THE WORLD FOR RELEASE OCTOBER 29, 2014 FOR FURTHER INFORMATION ON THIS REPORT: Mark Hugo Lopez, Director of Hispanic Research Molly Rohal, Communications Associate 202.419.4372
Doubts About China, Concerns About Jobs POST-SEATTLE SUPPORT FOR WTO
 FOR IMMEDIATE RELEASE: Thursday, March 2, 2000 FOR FURTHER INFORMATION: Andrew Kohut, Director Doubts About China, Concerns About Jobs POST-SEATTLE SUPPORT FOR WTO Most Americans continue to support free
SHORT-TERM TROOP INCREASE TO STABILIZE BAGHDAD All Rep Dem Ind Favor 45% 64% 30% 45% Oppose
 CBS NEWS POLL For release: January 8th, 2007 6:30 P.M. EST THE WAR IN IRAQ January 1 3, 2007 Most Americans expect President George W. Bush to change U.S. strategy in the Iraq war a war they continue to
Iraqi Elections, Economic Gains Lift Bush from his Career Lows
 ABC NEWS/WASHINGTON POST POLL: BUSH 12/18/05 EMBARGOED FOR RELEASE AFTER 5 p.m. Monday, Dec. 19, 2005 Iraqi Elections, Economic Gains Lift Bush from his Career Lows The successful elections in Iraq and
Health Care, Economy, Immigration October 18-21, 2013
 Health Care, Economy, Immigration October 18-21, 2013 CBS NEWS POLL For Release: Tuesday, October 22, 2013 6:30 pm ET More Americans continue to disapprove (51%) than approve of the health care law (43%).
Two-Thirds Approve of Transition; Expectations on Economy Pull Back
 ABC NEWS POLL: OBAMA TRANSITION EMBARGOED FOR RELEASE AFTER 3 p.m. Monday, Nov. 24, 2008 Two-Thirds Approve of Transition; Expectations on Economy Pull Back Americans have eased back on their expectations
Marist College Institute for Public Opinion Poughkeepsie, NY Phone Fax
 Marist College Institute for Public Opinion Poughkeepsie, NY 12601 Phone 845.575.5050 Fax 845.575.5111 www.maristpoll.marist.edu High Dissatisfaction with Washington *** Complete Tables for Poll Appended
FOREIGN POLICY AND THE CAMPAIGN September 21-24, 2008
 CBS NEWS POLL For Release: Thursday, September 25, 2008 6:30 PM EDT FOREIGN POLICY AND THE CAMPAIGN September 21-24, 2008 Friday s first presidential debate is still scheduled to focus on foreign policy
Millsaps College-Chism Strategies State of the State Survey: Voters Concerned with Low School Funding, Open to Funding Options
 For Immediate Release Contact: John Sewell September 27, 2017 601-974-1019 Millsaps College-Chism Strategies State of the State Survey: Voters Concerned with Low School Funding, Open to Funding Options
Ben Tulchin, Corey O Neil and Kiel Brunner; Tulchin Research
 August 26, 2015 To: From: Re: Interested Parties Ben Tulchin, Corey O Neil and Kiel Brunner; Tulchin Research California Statewide Survey Finds Voters Demand More Transparency in Police Misconduct Cases
FOURTH ANNUAL IDAHO PUBLIC POLICY SURVEY 2019
 FOURTH ANNUAL IDAHO PUBLIC POLICY SURVEY 2019 ABOUT THE SURVEY The Fourth Annual Idaho Public Policy Survey was conducted December 10th to January 8th and surveyed 1,004 adults currently living in the
Executive Summary of Texans Attitudes toward Immigrants, Immigration, Border Security, Trump s Policy Proposals, and the Political Environment
 2017 of Texans Attitudes toward Immigrants, Immigration, Border Security, Trump s Policy Proposals, and the Political Environment Immigration and Border Security regularly rank at or near the top of the
U.S. VOTERS OPPOSE HEALTH CARE PLAN BY WIDE MARGIN, QUINNIPIAC UNIVERSITY NATIONAL POLL FINDS; VOTERS SAY 3-1, PLAN SHOULD NOT PAY FOR ABORTIONS
 Peter Brown, Assistant Director, Quinnipiac University Polling Institute (203) 535-6203 Rubenstein Associates, Inc. Public Relations Contact: Pat Smith (212) 843-8026 FOR RELEASE: DECEMBER 22, 2009 U.S.
Instituted in 1911, the statewide initiative process was a Progressive Era reform that
 Public Policy Institute of California The California Initiative Process How Democratic Is It? Instituted in 1911, the statewide initiative process was a Progressive Era reform that allowed citizens to
PRESIDENT OBAMA S ADDRESS TO CONGRESS February 24 th, 2009
 CBS NEWS/KNOWLEDGE NETWORKS POLL For release: February 24 th, 2009 FOR IMMEDIATE RELEASE PRESIDENT OBAMA S ADDRESS TO CONGRESS February 24 th, 2009 Americans who watched President Barack Obama s speech