Do You Know Your Data? Measurement Validity in Corruption Research. Angela Hawken and Gerardo L. Munck *
|
|
|
- Eric Hoover
- 5 years ago
- Views:
Transcription
1 Do You Know Your Data? Measurement Validity in Corruption Research Angela Hawken and Gerardo L. Munck * September 19, 2009 Abstract: After making a case that more attention needs to be given to the quality of data on corruption, we analyze and test the validity of data on corruption using the full range of data sets employed in corruption research. First, we show that different classes of sources of data on indicators of corruption, a distinction based on who evaluates a country s level of corruption, rely on different standards to assess corruption and that the difference in standards does not hold consistently across countries. Second, we show that the problem with indicators is simply imported into Transparency International s Corruption Perception Index (CPI) and the World Bank s Control of Corruption Index (CCI). Systematic differences among indicators are disregarded in the selection of indicators used in these indices. And the rule to aggregate indicators further induces bias that undermines the comparability of the CPI and the CCI. The implications of this assessment for the analysis and production of data on corruption are spelled out. * The authors are professors at the School of Public Policy, Pepperdine University, and the School of International Relations, University of Southern California, respectively. Contact s: ahawken@pepperdine.edu, munck@usc.edu. Michelle Isenhouer, Matt Leighty, Matthew C. Piccolo and Matthew Turvey assisted us in the data gathering process. Their work is greatly appreciated.
2 Corruption has been a matter of concern for many centuries. And the nature of the corruption, as well as its causes and consequences, have been explored in numerous empirical studies over the past four decades (Heidenheimer and Johnston 2002). However, an important new element was added to this literature as a result of the production of quantitative data on corruption spanning a considerable number of countries. These data were initially accessible only from commercial risk assessors. But later these data sources were used to construct two publicly available corruption indices: Transparency International s Corruption Perception Index (CPI), which has been published since 1995, and the World Bank s Control of Corruption Index (CCI), made available since And the gradual incorporation of these measures into academic research led to the emergence of a new quantitative, cross-national literature on corruption (for overviews of this literature, see Lambsdorff 2006a and Treisman 2007). This paper focuses on the quality of the data on corruption used in this literature. In section I, we show that the economists who have contributed to this literature have paid little attention to the data on corruption they use in their research, and that this oversight is consequential and unsettling. Different measures of corruption are available and these different measures support different findings. Nonetheless, an established view of the relative validity of different measures of corruption, that substantive researchers could draw on, remains elusive. An evaluation of measures of corruption is critical to a growing literature in economics. The rest of the paper seeks to address this need for a better understanding of available measures of corruption through an analysis of some key methodological decisions involved in the production of indicators of corruption, understood here as simple measures that are commonly used to construct indices, and the production of indices of corruption, that is, compound measures that aggregate multiple indicators. In section II, we focus on indicators of corruption and conduct a simple test to ascertain whether differences in terms of who evaluates a country s level of corruption affects the resulting measures. The result of this test shows that data relying on different classes of sources, a distinction based on the nature of the evaluator, are systematically associated with higher or lower corruption scores and, moreover, that the differences among sources also varies across regions of the world. That is, our analysis shows that current measures of corruption do not provide a basis for ascertaining the level of corruption of countries around the globe with much confidence and uncovers a rather ominous problem: indicators of corruption as a group fail to stand up to a most basic precept of scientific research, that the results of research in this case research focused on measurement do not depend upon who conducts the research. A standard response to questionings of the validity of existing indicators of corruption has been to argue that any problems concerning indicators can essentially be sidestepped by combining multiple indicators. Indeed, this has been the argument explicitly made by index developers. Thus, in section III, we focus on the two main indices of corruption, Transparency International s CPI and the World Bank s CCI, and consider whether these indices overcome the problem revealed in the analysis of indicators. We start by addressing how index developers go about the choice of indicators included in their indices. We show that the distribution of indicators is not balanced across the available classes of sources of data, both over time and across region and that the problem with indicators of corruption is thus simply imported into these indices of corruption and we estimate the impact of relying on different classes of data source. Thereafter, we turn to the choice of aggregation rule used to construct indices, that is, the equation used to combine the values of multiple indicators and to generate a single measure, and we consider whether the problem regarding indicators is solved at this stage in the construction 1
3 of an index through the weighting of indicators. We find that the CCI and the CPI unjustifiably assigns different weights to different indicators and, furthermore, do not use a consistent weighting scheme to measure all countries. And we demonstrate how the choice of aggregation rule induces bias in, and undermines the comparability of, the CCI and CPI data. In short, we show how the development of indices has not solved the problem we uncover at the level of indicators. This analysis of indicators and indices of corruption breaks new ground in that we use data on indicators of corruption that have previously not been publicly scrutinized. Indeed, though the quantitative, cross-national literature on corruption has used, directly or more commonly indirectly (via indices), dozens of indicators over the past fifteen years, the dissemination of the data on these indicators has largely been restricted. And those who have had a privileged access over many years to the full range of indicators on corruption, the developers of the CPI and the CCI, have not done a good job of testing the validity of their indices, let alone offering a useful assessment of existing indicators of corruption. Thus, this paper presents the first tests using the full range of data sets used in corruption research to shed light on the critical issue of the validity of data on corruption (on our data, see Appendix 1). We conclude that the problems with current data on corruption are serious enough to call for a reconsideration and change of standard practices. In a nutshell, data on corruption suffer from a fundamental problem, the fact that different data sets used in quantitative research are routinely associated with different findings, and that the relative validity of different measures of corruption and hence of the different findings is not readily apparent. Thus, after shedding light on where the problems with available data on corruption lie precisely, we offer some thoughts about an elevation of standards regarding the generation of data on corruption and the use of available data on corruption in the quantitative, cross-national literature on corruption. I. Data Quality as a Research Problem The quality of data on corruption used in statistical analyses has not been a major concern of economists. Yet data matters should not be slighted. Indeed, though different data sets frequently lead to different conclusions, analyses of the validity of data on corruption have not offered a basis for relying on certain data sets and not others. Thus, inquiries into the quality of data on corruption constitute an important research frontier that has a direct impact on what can be claimed legitimately as knowledge about the world. I. i. Do Economists Pay Attention to Data? A review of articles published in 19 highly regarded economics journals between 1995 and 2009 offers evidence of the state of the new quantitative, cross-national literature on corruption. 1 A total of 76 articles using quantitative, cross-national data were published and the 1 For the purpose of this review, we constructed a data set on quantitative, cross-national research on corruption by coding 76 articles on 14 variables. The journals were identified by consulting three rankings of economics journals, and the articles were selected by searching for the word corruption in the title, abstract and full text of all articles published between 1995 the year when Mauro s (1995) article, widely seen as the seminal work that launched the quantitative, cross-national literature on corruption, was published and May 2009, the time the search of the 19 journals was conducted. The coding was first carried out independently by the two authors of this paper; subsequently, the results were compared and, in the few cases where there were disagreements, these were discussed until a consensus was reached. An intercoder reliability test was conducted on 8 variables on part of the sample (29 of the 67 articles), and of the 246 coding decisions, there was disagreement on only 7, yielding an intercoder 2
4 number of publications per year has been growing. These articles combine formal modeling and empirical analysis frequently (33% of the articles do so). They treat corruption both as an independent and a dependent variable, though more frequently as an independent variable (64% vs. 41%), 2 including among the correlates of corruption factors such as economic growth, financial and trade policy, political institutions, and democracy. And studies that treat corruption as a dependent variable present sensitivity analyses geared to testing the robustness of their findings to different model specifications routinely (87% of the time). In short, this literature offers a rich discussion of corruption and its correlates that conforms to basic standards regarding theory building and hypothesis testing. The picture is more mixed with regard to the data used in these articles. Authors take advantage of the growing supply of data sets. Indeed, a total of 15 data sets are used and the reliance on multiple data sets has increased. 3 But researchers still do little to check the robustness of their results using more than one data source. Sensitivity analyses in which a hypothesis was tested using more than one data set were provided by only 39% of the reviewed articles. And a closer look reveals a situation that is actually worse. Of the subset of articles that examine the sensitivity of results to alternative measures, 17% tested the robustness of their hypotheses by using different data sources but simultaneously changing the specification of the model, hence not allowing for an assessment of the impact of data sources on results. Moreover, the authors that tested their hypotheses with different data sets frequently (in 27% of these articles) overlooked the fact that different data sets do not necessarily offer independent measures. This is an issue in research on corruption particularly because two commonly used measures Transparency International s Corruption Perception Index (CPI) and the World Bank s Control of Corruption Index (CCI) are polls of polls that draw on many of the same data sources. Hence, these two indices, as well as these two indices and the sources used to construct these indices, are not fully independent. In sum, the quantitative, cross-national literature on corruption has rarely conducted sensitivity analyses that address the impact of the choice of data set. Of the entire set of 76 articles reviewed, only 25 (33%) test their hypotheses using more than one data set while maintaining the specification of their model constant. And 6 of these 25 articles fail to use at least some data sets that are independent. Thus, only 25% of the reviewed articles (19 of the total of 76) conduct sensitivity analyses that both maintain the specification of the model constant and rely on data sets that are partly or fully independently generated. 4 I. ii. Do Data Matters Matter? This relative lack of attention to data matters is not necessarily a problem. Indeed, if efforts to measure corruption have already yielded true and tested measures of corruption or, alternatively, as multiple measures of corruption are available, if different measures yielded the reliability rate of 97%. For the fuller discussion of the data set, see Angela Hawken and Gerardo L. Munck, Data Set on Corruption Research in Economics Journals: Case Selection, Coding and Variable Description, May 28, 2009, available at 2 The total is more than 100% because some articles treat corruption both as an independent and dependent variable. 3 This literature still relies very heavily on three data sets: the commercial Political Risk Services International Country Risk Guide (ICRG), Transparency International s CPI, and the World Bank s CCI, which are used in 58%, 45% and 24% of all articles, respectively. 4 For a sensitivity analysis that stands out in terms of the selection of a variety of independent sources, see Alesina and Weder (2002: 1130); for sensitivity analyses that are exemplary in terms of presenting the results of the analysis, see Brunetti and Weder (2003: 1818) and Fisman, and Gatti (2002: 336, 338). 3

5 same results or we could identify which measure is the most valid one, research could proceed without much discussion about the quality of data. But things are more complicated. Crossnational measures of corruption are riddled with problems, data matters matter, and there is currently no easy way to pick among alternative measures. The problematic nature of measures of corruption is not readily apparent. Two widely used data sets in research on corruption Transparency International s CPI and the World Bank s CCI are very highly correlated. Moreover, the strength of this correlation barely changes if calculated for the period or on a yearly basis, or whether the same set of 87 countries that both indices covered in 2000 are used or all countries included in the indices are considered (given that new countries have been added to these indices over time, in this case the number of countries increases over the years). Indeed, in no case does the correlation between the CPI and the CCI drop below (see Table 1). Such high correlations might be interpreted following a common practice as evidence of the validity of these measures. Thus, one might conclude that any sort of detailed discussion about the data used in quantitative research represents a diversion from more important pursuits. Yet such an interpretation and conclusion is unwarranted for several reasons. Most fundamentally, interpreting correlations between measures as evidence of validity of these measures confuses the concept of validity, a matter concerning the relationship between a concept and its measure and which thus must inevitable calls for references back to the abstract concept that is purportedly being measured, with that of reliability, which focuses on the level of agreement among multiple measures but does not distinguish among reliably correct measures and reliably incorrect measures. In short, consensus is not necessarily indicative of accuracy and the high correlations between the CPI and the CCI by themselves do not establish validity. Moreover, these high correlations are actually misleading. First, the high correlations between the CPI and the CCI are hardly surprising, given that they are not independent data 4
 Executive Opinion Survey, Merchant International Group s Grey Area Dynamics, the World Bank s Country Policy and Institutional Assessments")
6 sources but instead polls of polls that draw on many of the same data sources, such as the Economist Intelligence Unit (EIU) s Country Risk Service, Global Insight s Business Conditions and Risk Indicators, the Institute for Management Development s (IMD) Executive Opinion Survey, Merchant International Group s Grey Area Dynamics, the World Bank s Country Policy and Institutional Assessments (CPIAs), and the World Economic Forum s (WEF) Global Competitiveness Survey. Indeed, of the 22 data sources used by Transparency International to construct the CPI for the 2000, and years, and the 25 sources used by the World Bank to build the CCI over the same years, 13 were used in both indices. And, more specifically, of the total number of datum used to code the 965 country-years used to calculate the correlations reported in Table 1, 36% are shared by both the CPI and the CCI. 5 In short, much of the same underlying data are used to generate the CPI and CCI scores, and hence the assumption underlying common interpretations of the high correlations between the CPI and the CCI that two independent data sets are being compared does not hold. Second, a quite different picture emerges when the focus turns to the data on indicators, that is, the underlying data used to construct indices. The correlations among seven data sources used in constructing the CCI, some of which are also used in the CPI, range from to (see Table 2). In other words, there is a considerable variation in the level of agreement among these sources, which gets hidden in the indices that aggregate multiple sources; the average of these correlations (0.692) means that over 50% of the variance remains unexplained. Thus, though some authors interpret similar numbers in a positive light (Kaufmann, Kraay and Mastruzzi 1999: 7, 31; Alesina and Weder 2002: 1130; Lambsdorff 2006b: 87, 92; 2006c: 6; Treisman 2007: 216), the pattern of correlations among indicators of corruption suggests that the extent of agreement among alternative measures of corruption is frequently exaggerated. 5 Calculations based on information on the data sources used in the CPI and the CCI. For the CPI, the information was retrieved from the Excel sheets with the sources used for each country and each year (Transparency International 2009); for the CCI, the information was reconstructed by consulting the actual data from the underlying sources used to construct the CCI (World Bank 2009a). 5
7 Finally, a third reason why it would be imprudent to simply sidestep any discussion about the data used in quantitative research on corruption is that causal analyses that rely on different data sets produce different results with some regularity. Evidence of this comes from the articles we found in our review of publications in economics journals that, even though not always using independent data sources, do maintain the specification of their model constant and thus permit an assessment of the impact of different data sets. When hypotheses were tested with multiple data sets, the coefficient changes sign in 28% of the tests and the magnitude of the coefficient vary considerably in many of the other cases, and significance level of the coefficients changes (crossing either the 5% or the 10% threshold) in 60% of the tests. 6 Even tests using only the highly correlated Transparency International CPI and the World Bank s CCI lead in some instances to divergent results. This evidence comes from published research in the most prestigious journals in economics. Thus, it seems proper to assume that this is a conservative estimate of the lack of robustness of findings due to changes in the data sets used in the analysis. In sum, researchers on corruption face a quandary. They can currently draw on a multitude of cross-national quantitative data sets on corruption in their analyses, an apparent bonus. Yet the validity of these measures of corruption are not readily apparent and the different measures of corruption lead to differences in the factors that are seen as correlates of corruption. That is, data matters do matter: the choice of data set has a considerable impact on, and raises basic questions about, many findings in the literature. I. iii. Are Some Measures of Corruption More Valid Than Others? The way out of this quandary is to identify which measure is more valid and then to rely on the most credible available data set. This is not a farfetched idea. An assessment of the validity of proposed measures is a central task of the field of measurement methodology (Blalock 1982, Campbell 2001, Boumans 2007). And in recent times there has been a surge of interest in discussing measures of corruption, which has produced many arguments against and in favor of various measures. Yet, for a variety of reasons, the validity of the data on corruption has not been addressed through any sort of rigorous analysis and testing. On the one hand, the producers of data on indicators of corruption, who thus have access to the data, have not had an interest in a public discussion about the methodological strengths and weaknesses of their data, and most of those who have had an interest in a public discussion have not had access to much of the data on indicators on corruption. Specifically, commercial producers of data such as risk assessment agencies have shown a greater interest in selling their data than in participating in a debate about their data. And multilateral development banks, such as the World Bank, have even kept much of their data on corruption secret. Thus, even though a growing number of publications and papers have addressed the validity of various measures of corruption (Arndt and Oman 2006, Sampford et al. 2006, Knack 2007), 7 these assessments have been largely conceptual and have not presented empirical tests to substantiate their usually critical view of the most commonly used measures of corruption. To a considerable extent, the debate about the validity of the measures that have been used over the past fifteen years by economists, either directly or more commonly indirectly (via indices), has been stifled. 6 In 47% of the cases the results were above and below the 5% threshold of significance, and in 37% of the cases the results were above and below the 10% threshold of significance. Since some of the articles include tests of more than one research question, these percentages are based on the total number of research questions that are tested. 7 See also Kurtz and Schrank (2007a, 2007b). Thomas (2007), Iqbal and Shah (2008), Langbein and Knack (2008), and Mehlkop, Graeff and Neumann (2008). 6
8 On the other hand, those who have had a privileged access over many years to the full range of indicators on corruption and who have participated in public discussions about measures of corruption, the developers of the CPI and the CCI, have not done much to shed light on the quality of measures of corruption. These index developers have largely presented the results of tests to defend choices that had been made previously rather than a way to assess the theory guiding the construction of the index. 8 And, most fundamentally, a review of all the methodological papers written by these index developers, starting with the first discussion of the CPI in 1995 and of the CCI in 1999, shows that the tests that were performed are quite weak, frequently confusing the concepts of validity and reliability. Index developers have reported correlations among individual sources of data on the indicators that serve as underlying sources for their indices (Transparency International and Lambsdorff 1997: 11-12; Lambsdorff 2006c: 8, 2007: ; Kaufmann, Kraay and Mastruzzi 1999: 31, 2006: 42). But they have not capitalized on the opportunity to apply some fairly standard methods to detect the presence of bias, and to determine the factors driving any such bias. Rather, inasmuch as tests of a possible evaluator bias have been performed, these tests rely on patently implausible assumptions, such as that one can simply designate a measure as the correct measure of corruption (Kaufmann, Kraay and Mastruzzi 2004: ), 9 or mistake a means to estimate reliability for one to address the core matter of validity and rely solely on correlations among indicators (Kaufmann, Kraay and Mastruzzi 2006: 20-25, 41; 2007a: ; Lambsdorff 2006b: 86-87, 2008: 6). Likewise, index developers have presented the results of some tests directly pertaining to the construction of indices, such as a test of the independence of sources (Kaufmann, Kraay and Mastruzzi 2006: 25-31, 42-44; Lambsdorff 2006c: 6) and the robustness of indices to changes in aggregation rule (Lambsdorff 1999: 18, Kaufmann, Kraay and Mastruzzi 2006: 25, 2007c: 21-22). But the impact of the weights assigned to indicators was tested on an unrepresentative sample and the possible impact of variations in the number of underlying sources was tested in a flawed manner, on a small set of cases selected on the dependent variable and that by design only addresses the impact of a few sources that have a low weight in the index (Kaufmann, Kraay and Mastruzzi 2005: 12-14, 55-57; 2007d: 20-21, 34; 2008: 22, 35). In short, though Transparency International and the World Bank have explained in some detail how they constructed their respective indices, the CPI and CCI, they have fallen short of providing a thorough validation of the data on the indicators of corruption they use as a basic input in their indices and the methodological choices that go into the making of their indices. The lack of transparency in the production of measures of corruption is an ironic, and particularly embarrassing situation, which has impeded a serious assessment of measures of corruption. In particular, the lack of access to the data which raises questions about the use of 8 For example, tests on the robustness of the data to changes in the aggregation rule were apparently performed well after the design of the indices. Though the CPI was released in 1995, the robustness test reported in 1999 seem to have been conducted in response to the appearance of the CCI (Lambsdorff 1999: 18). In turn, though the World Bank s CCI was introduced in 1999, it appears that it was not until 2006 that a robustness test was conducted (Kaufmann, Kraay and Mastruzzi 2006: 25). Indeed, the results of tests presented by the developers of the CPI and the CCI seem like an afterthought rather than part of an open-ended inquiry about the quality of data on corruption. 9 Indeed, if we knew that the correct, unbiased measure of corruption is the World Business Environment Survey, as Kaufmann, Kraay and Mastruzzi (2004: 273) assert, research on corruption would be a lot simpler, in that all other measures could be simply disregarded. Moreover, Kaufmann, Kraay and Mastruzzi s (2006: 7, 12) rationale for creating an index that the combination of multiple sources is a way to reduce measurement error cannot be true. Thus, their test is unrealistic and contradicts other more elaborate parts of their discussion of measurement. 7
9 commercial data sources by index developers as well as by researchers has meant that basic rules of scientific inquiry, such as the enablement of independent researchers to engage in replication exercises and proper validation tests, have not been followed. But, fortunately, this impediment to research has been considerably reduced with the online publication by the World Bank of much of the underlying data used to construct the CCI, including data only available commercially previously, in late This welcome decision by the World Bank has made it possible for us to construct a data set that includes most of the underlying data used by construct the CCI over the period (see Appendix 1). And, using this data set, we were able to conduct a thorough and exhaustive range of tests of the data on corruption. Indeed, the recent availability of these data has put us in a position to offer, as far as we know, the first independent empirical assessment of the nearly full range of indicators used in corruption research as well as of the two most popular corruption indices. There are some limitations imposed on our analysis due to the continued lack of availability of data. Some of the data generated by multilateral development banks and used in constructing the CCI are still not available, a handicap that somewhat restricts the analysis of the CCI. More importantly, since Transparency International still does not release the underlying data it relies on to construct the CPI, this index can not be scrutinized appropriately and a full comparison of the two main indices on corruption, Transparency International s CPI and the World Bank s CCI, is precluded. Moreover, due to space constraints, we are only able to focus on two methodological choices: 1) regarding the class of source used to generate data on indicators, that is, a distinction based on who evaluates a country s level of corruption; and 2) regarding the aggregation rule used to construct indices, that is, how multiple indicators are combined to generate a single measure. Yet, as we show, this analysis is particularly revealing of the impact these choices have on the measures that are produced and raises fundamental questions about the validity of both indicators and indices of corruption. II. Indicators and Classes of Sources The quantitative, cross-national literature on corruption has been made possible, first and foremost, due to the production of a variety of indicators on corruption, that is, simple measures in contrast to compound measures that aggregate multiple indicators. Such indicators have been used regularly in research on corruption since the mid-1990s and are a necessary input in indices. And their number is high; for the purpose of the empirical analysis in this section, we actually draw on 23 distinct indicators that cover 210 countries and territories over 9 years (1996, 1998, 2000, and ) (for the list of indicators, see the note in Table 3). But they have not been analyzed and/or compared empirically in much depth. Thus, we start our evaluation of data on corruption by considering a set of indicators that are routinely interpreted as measures of corruption. One central methodological difference in the way that data on different indicators are generated concerns who evaluates a country s level of corruption. After all, all of the indicators we consider rely on responses to questions by evaluators and, using characteristics of the evaluator as the criterion of classification, it is possible to distinguish among five classes of sources of data on indicators of corruption, those that rely on i) expert ratings by a commercial risk assessment agency, ii) expert ratings by an NGO, iii) expert ratings by a multilateral development bank (MDB), iv) surveys of business executives, and v) surveys of the mass public. It is important therefore to test whether characteristics of the evaluator are irrelevant to the results of the measurement process, a basic principle of scientific measurement, or, alternatively, 8

10 whether there are grounds for arguing that a variable feature of the measurement instruments their reliance on different evaluators as opposed to actual differences in corruption, drives variation in measures of corruption. 10 As a first step to see if the choice of who is the evaluator has an impact on the resulting measures of corruption, we conducted a comparison of global means of pairs of cases (countryyears) for which indicators of two source classes are available. This is a simple test. And the results support a strong conclusion (see Table 3). Different classes of sources yield measures that vary significantly in terms of their strictness, that is, whether they tend to generate higher or lower estimates of the level of corruption in countries around the world nearly without failure. Specifically, only the data generated by expert ratings by MDBs and surveys of the mass public are indistinguishable. 10 The view in the literature on this question has been ambiguous. Though some authors have played down the divergence among measures of corruption produced by different classes of sources (Treisman 2000: 412, Kaufmann, Kraay and Mastruzzi 2007a: ), others have noted the difference between classes of sources, emphasizing in particularly the contrast between common citizens and other respondents (Razafindrakoto and Roubaud , Kurtz and Schrank 2007b: 566). 9
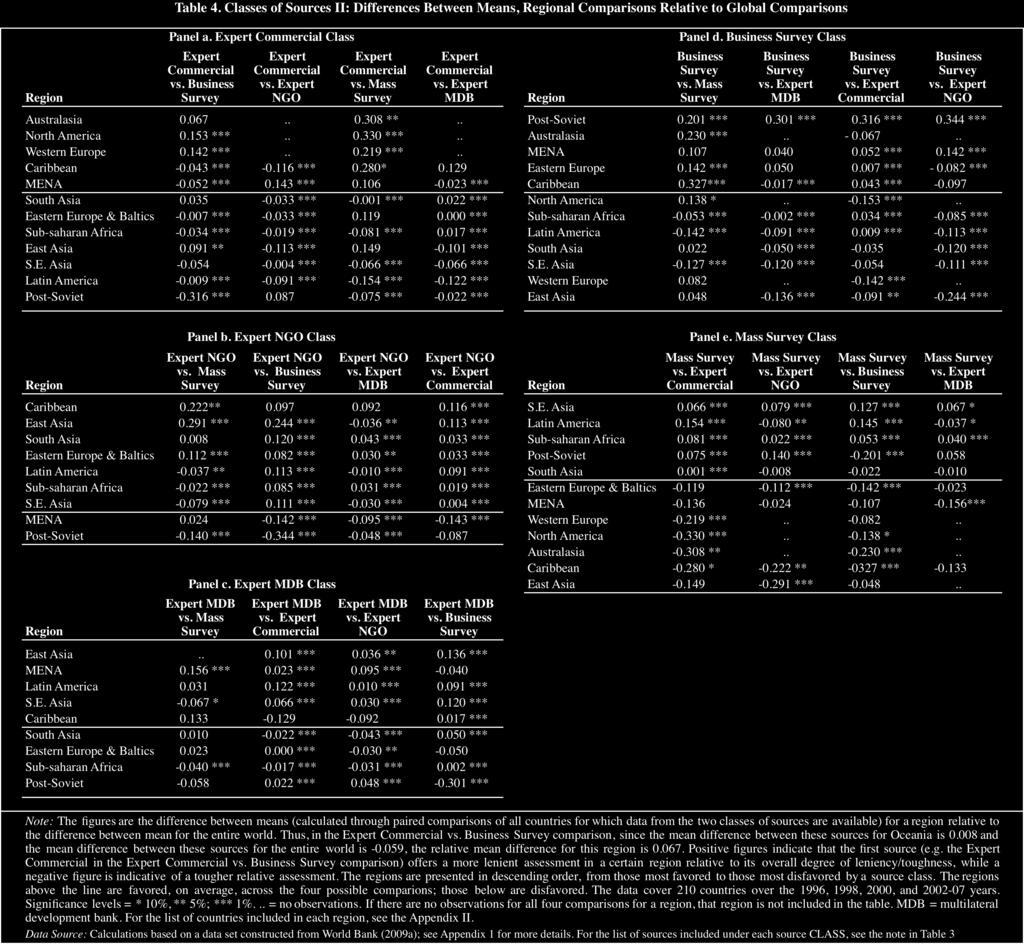
11 But the finding is even stronger. The relationship among the five classes of sources actually follows a highly structured pattern, whereby the source classes can be ordered, in descending order of strictness, as follows: Expert Commercial > Expert NGO > Business Survey > Expert MDB = Mass Survey This is a striking pattern, which certainly does not seem consistent with random measurement error. Indeed, such a pattern is evidence that who conducts the assessment of a country s level of corruption makes a difference, that some evaluators are distinguishably stricter than others and, vice versa, that some evaluators are more lenient stricter than others. Different evaluators have, in general, different standards. To gain a sense of the magnitude of the difference that can be interpreted as systematic measurement error, it is useful to compare the level of variability that is attributable to these different classes of evaluators as opposed to subjective measures in general, that is, measures that rely on judgments made by people in response to certain questions. It could very well be the case that all subjective measures are highly unreliable, and hence that these differences though indicating a problem in the measurement of corruption are suggestive of random error. Yet the evidence is not very encouraging. A reasonable estimate of the level of variation that can be expected from subjective measures of corruption is between 1.5 and 3.0% of the overall variation in an indicator scale. 11 In contrast, the differences in these data on corruption, again relative to the overall variation in the indicator scales, reaches as high as 14.7% in the case of the global comparison between expert ratings by commercial risk assessment agencies and the expert ratings by MDBs (see Table 3). That is, the differences in the corruption scores of different source classes are not minor. To further understand the possible impact of the methodology of measurement on the measures that are generated we next considered whether the difference in standards across evaluators hold consistently across countries. To assess the consistency of differences among evaluators, we compared the regional means relative to the global mean of each class of source, seeking to ascertain whether any class of source assesses any region according to stricter or more lenient standards than it treats all cases in the world on average. And, again, the results of the empirical analysis were revealing (see Table 4). 11 This baseline figure was calculated by comparing the mean values on 16 governance variables (one of them being corruption) for 2005 that were coded by expert raters of three multilateral development banks (the World Bank, the African Development Bank, and the Asian Development Bank) using a common set of guidelines (the CPIA framework). For the framework, see World Bank (2005); the data are drawn from ADB (2006: 13), AfDB (2006: Table 1), and World Bank (2006). Through this comparison, we are able to hold the class of respondent constant and hence assess the range of variability that might be due solely to the fact that measures are assigned by experts, as well as to consider whether subjective measures of corruption are different from subjective measures of other governance indicators. The overall difference between the mean of the scores assigned both by the World Bank and the African Development Bank on the 15 variables (excluding corruption) was 1.3% (p = 0.000, N = 585), with the World Bank assigning the lower scores on average. The difference between scores assigned both by the World Bank and the Asian Development Bank on the 16 variables was 2.2% (p = 0.000, N = 285), the lower mean corresponding again to the World Bank. The overall difference between the mean of the scores of the corruption variable was 3.0% (p = 0.032, N = 39) when the coding was done by the World Bank and the African Development Bank, and 2.2% (p = 0.135, N = 19) when the coding was done by the World Bank and the Asian Development Bank. Thus, it seems that a band of variability between 1.5 and 3.0% in mean values might be expected from subjective measures. 10
12 11
13 The regional comparisons are quite complex. No single overriding pattern emerges, in the sense that all source classes penalize or favor certain regions (though the post-soviet region and East Asia do stand out in this regard). But within each source class, there is some evidence that standards applied by evaluators differ from region to region. Specifically, expert ratings by commercial risk assessment agencies are relatively favorable in their assessments of countries in Australasia (Australia and New Zealand), North America (USA and Canada) and Western Europe, on the one hand, and relatively unfavorable in their assessments of post-soviet countries (Russia and other ex- USSR countries), Latin America, and South East Asia. Expert ratings by NGOs favor the Caribbean, South Asia, and Eastern Europe and the Baltics across the board and disfavor post-soviet countries. And expert ratings by MDBs favor East Asia and Latin America but do not disfavor any region across the board. In contrast to ratings by experts of different sorts, surveys of business executives favor post-soviet countries and the countries of the Middle East and North Africa (MENA) and disfavor South Asia, South East Asia, and East Asia. And, again in contrast to ratings by experts, surveys of the mass public favor South East Asia and sub-saharan Africa, and, disfavor East Asia, the Caribbean, Australasia, North America, and Western Europe. In short, different classes of sources show considerable differences in terms of how they assess different regions of the world, each seeing different regions either in a more positive or a more negative light. 12 Recapitulating, the answer to the question, Does the evaluator make a difference? must be answered affirmatively. As the analysis of indicators shows, a substantial amount of the variation in reported levels of corruption is not attributable to variation in actual corruption or to random measurement error but, rather, is driven by the choice of evaluator and hence is an artifact of the method selected to measure corruption. Different evaluators use different standards in evaluating levels of corruption and, complicating matters further, the difference in standards across evaluators does not hold consistently across countries. 13 As a result, if someone was not happy with the way some indicator depicted the level of corruption in a certain country, this person could search among the many existing and generally considered reputable indicators until they found an indicator that offered a measure more to their liking. Moreover, the basis for stating that disagreements among evaluators can be adjudicated, by arguing that some indicators are more valid than others and hence that the conclusions drawn from these indicators are more credible, is far from apparent. An inescapable conclusion is that the measurement of corruption looks like a fairly arbitrary business. III. Indices and Aggregation Procedures One response to concerns about the quality of indicators on corruption has taken the form of the construction of indices that combine many of these indicators. The argument, briefly, is that, by combining the indicators, the measurement error of the individual indicators is reduced. 14 Whatever the problems with indicators on corruption might be, at least it would follow that indices on corruption would clearly be preferable and should be given greater credibility compared to indicators 12 A comparison of source classes over time also reveals substantial changes in the difference between mean scores of different classes of sources. 13 For works that underline and explore the possible biases of respondents, see Lall (2001: ), Van De Walle (2006: ), Kurtz and Schrank (2007a: ), and Iqbal and Shah (2008: 20-25). On the impact of possible sampling biases, within the context of each source, see Kurtz and Schrank (2007a: 542). 14 This argument is made, unsurprisingly, by the developers of indices. For example, the developers of the CCI state that aggregate indicators can provide more precise measures of governance than individual indicators (Kaufmann, Kraay and Zoido-Lobatón 2002: 6; see also Kaufmann, Kraay and Mastruzzi 2006: 7, 12)). On the rationale offered for the CPI, see Lambsdorff (2006b: 91; 2006c: 10). 12
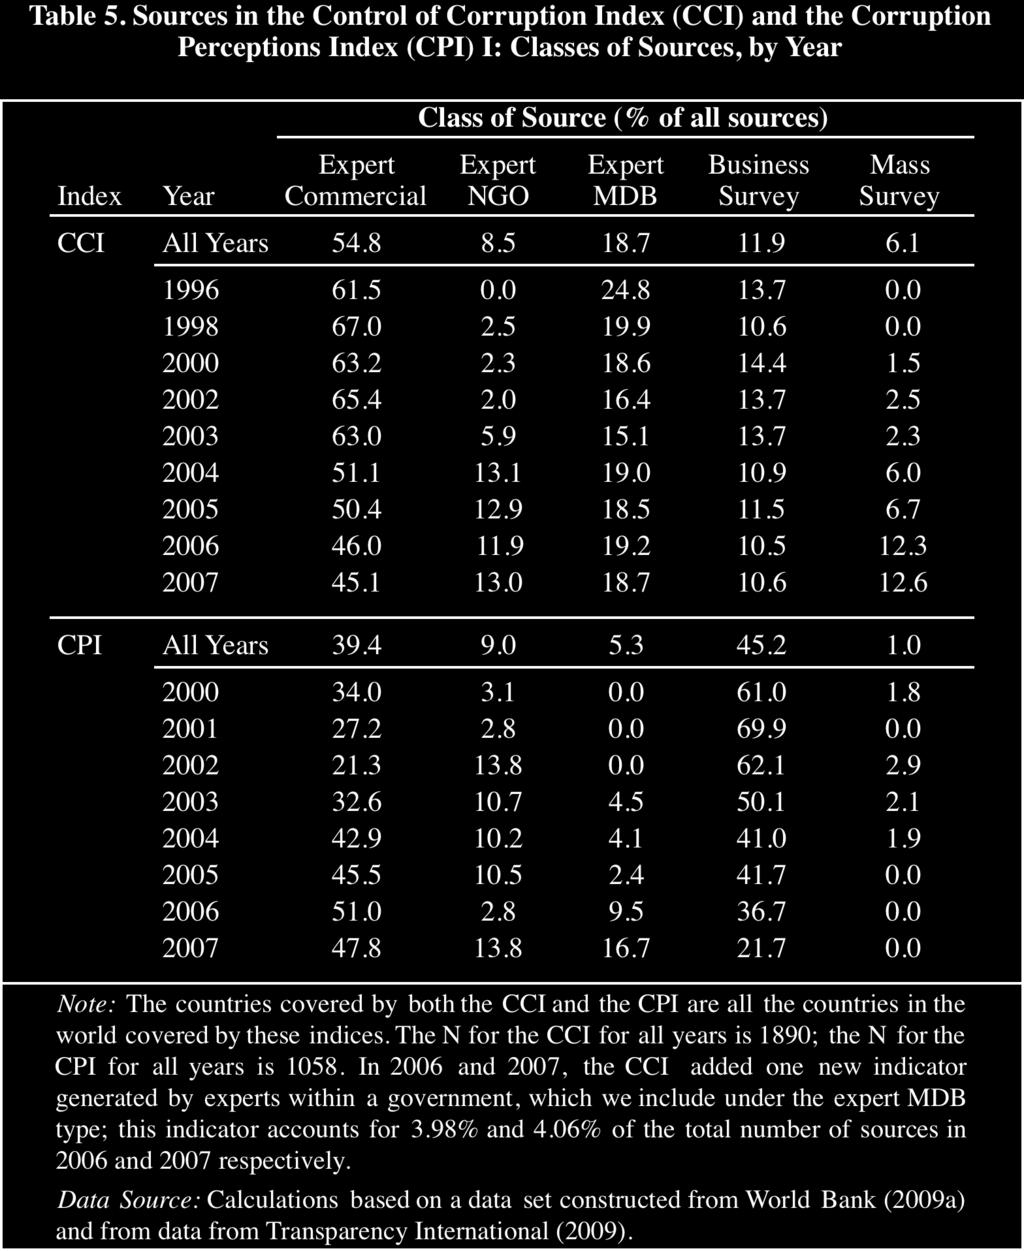
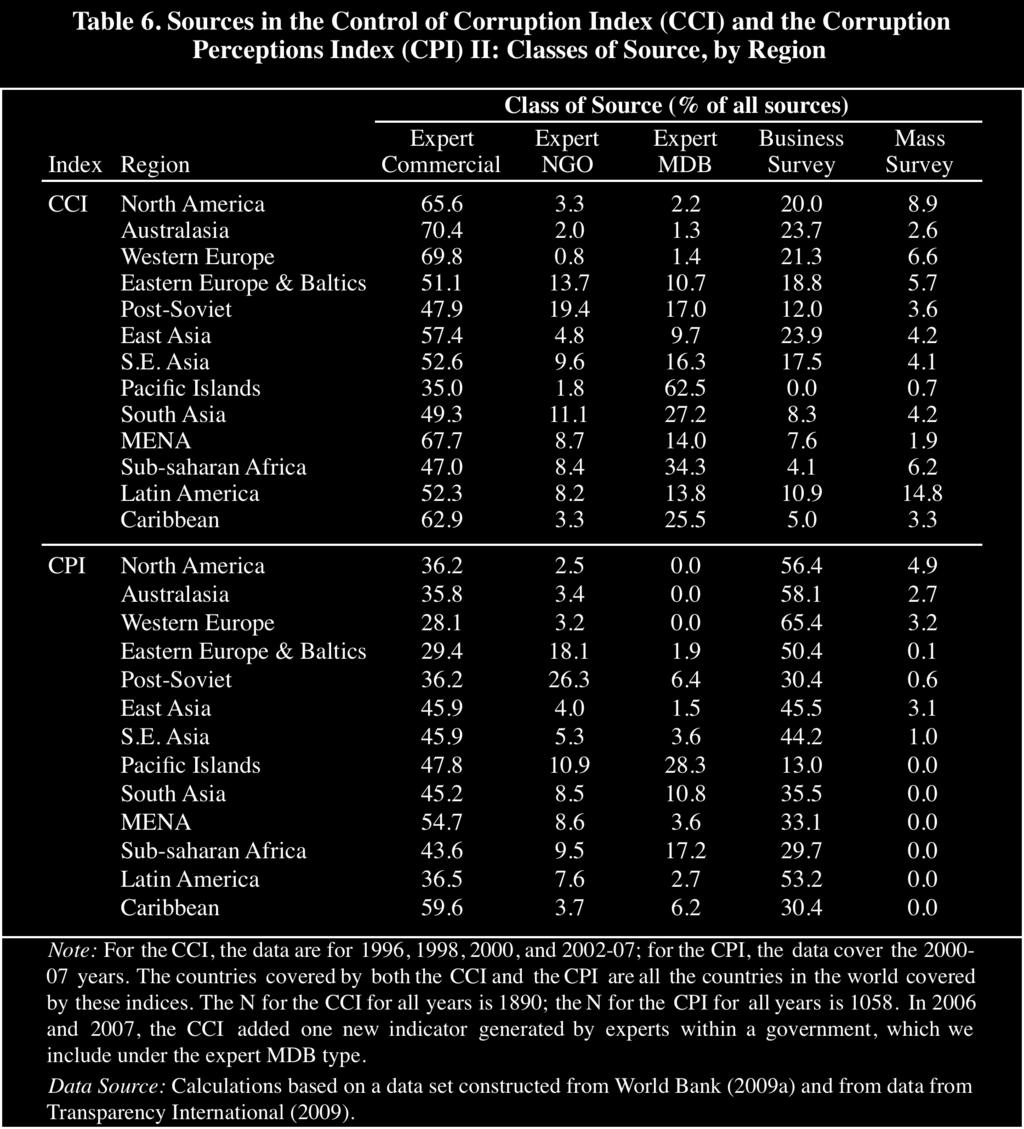
14 on corruption. But the cancelling out of errors does not follow automatically simply because individual indicators are combined. This benefit hinges on the assumptions that the error in the indicators is random as opposed to systematic and independent across sources. And if these assumptions do not hold, the problems with individual indicators could simply be carried over to an index or even exacerbated, if the true signal in the available indicators is drowned out because the indicators with the greatest error are given greater weight. Indeed, to assess the quality of corruption indices, it is necessary to evaluate two key choices that go into the making of an index: i) the choice of indicators, that is, what indicators are combined in an index, and ii) the choice of aggregation rule, that is, the equation used to combine the values of all the indicators into one single value. Thus, in what follows we study the two main indices of corruption used in the literature the World Bank s CCI and Transparency International s CPI and consider whether the developers of these indices get around the problem with indicators of corruption through their choice of indicators and aggregation rule. III. i. The Choice of Indicators Both the CCI and the CPI are constructed on the basis of a large number of sources that provide data on indicators, in recent years adding up to roughly two dozen in the case of the CCI (Kaufmann, Kraay and Mastruzzi 2008: 78) and about one dozen in the case of the CPI (Lambsdorff 2008: 2, 12-13). In general terms, the criterion of selection of data sources used by the developers of the CCI is to rely on as many data sources as possible (Kaufmann, Kraay and Mastruzzi 2008: 4), even when they might not be measures of corruption proper; in contrast, the developer of the CPI is more selective, paying more attention to whether the sources actually measure corruption as opposed to some associated questions (Lambsdorff 2007: ). Nonetheless, a major concern for the developers of both the CCI and the CPI is to cover most of countries of the world and to rely on multiple sources on each country, 15 and for this reason the selection of data sources is driven largely by considerations of convenience, that is, whether data sources covering different countries are available. The consequences of this sampling of data sources largely by convenience are troubling. As the distribution of the classes of sources over time (see Table 5) and across regions of the world (see Table 6) shows, there is a striking lack of balance in the proportion of different classes of sources used in both the CCI and the CPI. First, there is considerable variation in terms of the percentage of each class of source used on average by each index. In the CCI, the expert ratings by commercial risk agencies are the dominant class of source; in the CPI, the expert ratings by commercial risk agencies and the surveys of business executives practically overwhelm the other three classes of sources (see the rows for All Years in Table 5). Second, there is considerable variation in terms of the reliance by each index on different classes of sources over time. In the CCI, the relative number of expert ratings by commercial risk agencies declines markedly over time, as does the expert ratings by MDBs, while the relative number of expert ratings by NGOs and surveys of the mass public increases; in the CPI, the relative number of surveys of business executives declines very markedly over time, while the relative number of expert ratings by commercial risk agencies and the expert ratings by NGOs and MDBs increases (see Table 5). Third, the relative number of different classes of sources varies considerably on average, that is, over all the years considered, across regions (see Table 6). 15 Though the CPI uses, as a rule, at least three sources on each country (Lambsdorff 2008: 9), the CCI includes a country even if only one source is available (Kaufmann, Kraay and Mastruzzi 2008: 17). However, the number of countries included in the CCI with only one source is small. 13

15 14

16 This lack of a balanced distribution with regard to different classes of sources, both over time and across region, raises questions about the comparability of the CCI and the CPI as measures of corruption, whether for the purposes of longitudinal or cross-sectional analysis. After all, the sources used in constructing these indices are largely the same ones as those discussed in the previous section. And, as one would expect in light of the systematic differences in the evaluation of corruption offered by different classes of sources (see Tables 3 and 4 above), indices that use those indicators as input data are not very robust to changes in the choice of data sources. Indeed, a test based on all the indicators used in the CCI and that compares pairs of indices that are generated by averaging, on the one hand, all the indicators of a certain class of data source and, on the other hand, all the indicators of all the remaining source classes, confirms the previous evidence about the divergent standards of different evaluators (see Table 7). Indices based on different classes of data sources diverge in terms of their level of strictness, display considerable spread around their mean values and, a matter of particular concern for the CPI, given that it relies solely on the information concerning the rank of countries provided by indicators (Lambsdorff 2008: 6), vary considerably in terms of the ranking of countries. Thus, unless these indices introduce a balancing of the distribution of indicators across source classes through the way they address the second key choice in the construction of an index the choice of aggregation rule a matter to which we turn next, indices of corruptions would not get around the problem we detected earlier with existing indicators of corruption but instead would simply import those problems into the indices. 15
17 III. ii. The Choice of Aggregation Rule Beyond choosing indicators, the construction of an index involves the aggregation of the selected indicators, a task that calls for decisions to be addressed in light of existing theory and empirical tests on three key questions: (1) what is the form of the function between the values being aggregated and the aggregate value? (2) what is the relationship among the values being aggregated? and (3) what weight is assigned to the values being aggregated? 16 In response to the first two questions, the developers of both the CCI and the CPI opt for a linear and additive aggregation rule. This is a standard default option, which largely makes sense in this context. In particular, since the developers of the CCI and the CPI posit that each indicator they aggregate is simply a different measure of the same concept, as opposed to say a part of a whole, the use of an additive aggregation rule is a relatively uncontentious matter. Interestingly, however, the developers of the CCI and the CPI part ways on the question about how to weigh each indicator. The CPI uses a simple average of all the indicators used for each country year and thus assigns equal weight to each of the available indicators (Lambsdorff 2006b: 97). In contrast, the CCI first relies on the unobserved component model to assign variable weights to all the available indicators used m the CCI and then, after this weighting of indicators has been carried out, proceeds by averaging of the values of all the available indicators (Kaufmann, Kraay and Mastruzzi (2008: ). This is a nontrivial difference in aggregation rule. Moreover, since the question of the weights assigned to each indicator is particularly crucial, in that it is directly connected to the problem of the divergent assessments offered by different evaluators, it deserves further discussion. Unfortunately, both weighting scheme have some major flaws. The choice of averaging used directly in the CPI and after a weighting of the indicators in the CCI simply sidesteps the fact that different classes of sources of data on indicators vary systematically offering stricter or more lenient evaluations of the same countries (see Tables 3 and 4) and treats different classes of sources as though they were interchangeable. Moreover, by allowing the sheer availability of indicators to drive the weight of each indicator, a factor that varies considerably over time and across countries (see Table 5 and 6), an element of ad hocness is introduced. As a result, variation in the value of the CCI and the CPI will inevitably be due, in part, to a nonrandom factor, whether the distribution of classes of sources for a particular country-years tilts more toward stricter or lenient sources. The conscious choice of assigning variable weights to indicators made by the developers of the CCI is equally problematic. Since this weighing relies on the unobserved component model, the determination of weights is data- driven as opposed to being theory-driven. Nonetheless, this model inescapably relies on certain assumptions. And these assumptions are questionable. First, the unobserved component model assumes that the indicators that are analyzed offer independent measures, a dubious assumption in the context of the measurement of corruption. 17 Second, and more fundamentally, this model assumes that more highly correlated 16 The construction of the CPI and CCI involves some other, more technical decisions. For a full discussion of aggregation procedures, see Lambsdorff (2006b: 88-97; 2008: 6-8) on the CPI, and Kaufmann, Kraay and Mastruzzi (2004: , 2008: 13-16, ) on the CCI. 17 The independence of different measures is important because the unobserved component model assumes that the error terms of the indicators are not correlated. There is anecdotal evidence that suggests that there is contamination across indicators because the evaluators used to generate data on certain indicators are influenced by the data on other indicators (Arndt and Oman 2006: 65-66, Galtung 2006: 116, Knack 2007: ). For a defense of the independence of different indicators, see Kaufmann, Kraay and Mastruzzi (2006: 19-31, 42-44; 2007c: 16-20); see also Lambsdorff (2007: 245). 16
18 indicators should be assigned a greater weight because such indicators offer truer values. But such an assumption relies on the most basic of measurement mistakes, passing off a test of the reliability of data as a test of validity or, in other words, consensus for truth. The flawed reasoning of the developers of the CCI, it should be emphasized, has costs. Indeed, the reliance on the unobserved component model to assign variable weights to different indicators actually adds to the problems the CCI shares with the CPI due to their common choice to aggregate through averaging. In effect, the classes of indicators that are more available are also more highly correlated, 18 and hence are assigned a greater weight. And this procedure is highly consequential: the weights thus assigned to indicators range, for the same year, from to ! (World Bank 2009b). Thus, the CCI compounds the lack of balance in the weighting of different source classes that is due to the averaging of available indicators and makes the value of the CCI even more dependent on the variable availability of certain classes of indicators. In short, due to this second weighting decision, the lack of balance across source classes is greater in the case of the CCI than the CPI. To ascertain the impact of the aggregation rule used by the CCI and the CPI and, more specifically, to isolate variation in the values of the CCI and the CPI that is due solely to the variable weights they assign to different classes of sources, that is, to an artifact of the method used to generate the measures, we devised the following test. First, we used the data on countryyears for which indicators of all five classes of sources are available to calculate an average value for indicators of each class of source. 19 Second, we used information about what indicators were used by the CCI and the CPI for each country-year, 20 and we input in each data point that used an indicator of a certain class the corresponding average value previously calculated. Third, using the new data for each indicator, we used the CCI s and the CPI s aggregation rule to calculate the value of these indices. In this way, we arrived at values for two indices that, by holding the values of each class of indicator constant, only differed in terms of the weight assigned to each indicator. In other words, for the sake of this test, we posited that according to each class of data source all countries have the same level of corruption, so that any variability in the value of an index can be directly and unequivocally attributed to a choice about the weight that was assigned to different classes of indicators. 18 As Table 5 shows, the most frequently used classes of sources in the CCI are, in descending order, the expert ratings by commercial risk assessment agencies, the expert ratings by MDBs, the surveys of business executives, the expert ratings by NGOs, and the surveys of the mass public. In turn, the average level of correlation between any single indicator of a certain class of source and all other indicators, a gauge of the level of agreement among indicators, is as follows: expert ratings by commercial risk assessment agencies = 0.552, expert ratings by MDBs = 0.425, surveys of business executives = 0.526, expert ratings by NGOs = 0.373, and surveys of the mass public = Thus, to a large extent, the most frequently used classes of sources are also more highly correlated. Correlations were calculated for all 25 indicators used in the CCI (World Bank 2009a). See Appendix 1 for the classification of indicators into different classes of sources (for the purpose of this test, the data by the Institutional Profiles Database was combined with the expert ratings by MDBs indicators). 19 The average values for each class of indicator was calculated by first computing an average across indicators of a certain class for every country-year and then averaging the values for each indicator class across all country-years. These values are as follows: expert ratings by commercial risk assessment agencies = 0.35, surveys of business executives = 0.44, expert ratings by MDBs = 0.48, expert ratings by NGOs = 0.50, and surveys of the mass public = These values were calculated using all 25 indicators used in the CCI (World Bank 2009a) and an N of 250. For our classification of indicators into different classes of sources, see Appendix 1 (the one exception is that for the purpose of this test, the data from the Institutional Profiles Database was combined with the expert ratings by MDBs). 20 For the CCI, the years covered are 1996, 1998, 2000, and ; for the CPI, The number of countries varies, reaching a maximum of 210 per year for the CCI and 180 per year for the CPI. 17

19 The results of this test are not surprising but still very telling. A comparison of the means of the different indices shows that differences in weighting schemes are not irrelevant. The mean values of indices using the CCI s and the CPI s aggregation scheme, as would be expected from the relatively larger weight they assigned to evaluators that are stricter on average (see Tables 3 and 5), are significantly lower than the mean value of an index that assigns an equal weight to the five different classes of sources identified in this paper (see Table 8). 21 Of course, the lower means could be the more accurate measure. But, in the absence of firm evidence that certain classes of sources are more valid than others probably the most reasonable assumption to make given the current state of knowledge regarding the measurement of corruption there is no theoretical reason to give certain classes of sources more weight than others. 22 Thus, this result shows that the values of the CPI, and even more so those of the CCI, diverge from the most reasonable choice of aggregation rule we can currently make The mean value of an index is simply the average of the values of the five classes of sources. 22 This point has been made by Knack (2007: ). 23 The deleterious impact of the CCI s reliance on the unobserved component model in particular is obvious when an index using the full CCI weighting is compared to an index that averages the values of the indicators used by the CCI and hence drops the extra weighting introduced via the unobserved component model. The index with a simple weighting has an average of 0.405, standard deviation of 0.032, a minimum deviation from the mean of and a maximum deviation from the mean of In other words, by aggregating indicators using the unobserved component model the CCI is more unbalanced than if indicators were aggregated using a simple averaging formula. 18
20 The information on the spread of the values of the CCI and the CPI around their means is even more striking, in that it relies on a purely methodological baseline. Given the design of our test, and the fact that the indicator values for every country is exactly the same, if the weights assigned to the indicators was consistently applied to every country (regardless of whether these weights are not equal across classes of sources), all countries would end up with the same scores. And this is indeed what happens with the index based on the equal weighting of the five classes of indicators: the standard deviation is 0.000, and the minimum and maximum values do not deviate from the mean value. But the indices calculated using the CCI s and the CPI s aggregation rules diverge considerably from their mean values. In other words, a significant part of the variation in the CCI and the CPI is solely due to the lack of a consistent weighing scheme and has nothing to do with variation in levels of corruption in the real world. These methodological errors are not innocent. For example, though the mean values of the CCI and CPI in this test should remain constant over time, the index using the CCI s weights points to a reduction in the level of corruption, from in 1998 to in 2006, while the index using the CPI s weights shows an increase in the level of corruption, from in 2002 to in In turn, the lack of a consistent weighing scheme on the part of the CCI and the CPI leads to systematic fictitious differences across the main world regions, the magnitude of these differences being larger in the case of the index using the CCI s weights (see Figures 1 and 2). In short, the choice of aggregation rule used by the CCI and the CPI lacks a solid theoretical justification it seems to be driven above all by the desire to cover the largest number of countries possible and induces bias in the CCI and CPI data that seriously undermines their comparability Both difference of means are significant at a level. The N for the index with CCI weights is 182 per year; for the index with CPI weights the N is 80 per year. 25 It may seem surprising that a test reported by the developers of the CCI shows that the values of the CCI are robust to changes in aggregation rule and, specifically, that an index using the aggregation rule chosen for the CCI is very highly correlated to one that gives equal weight to different classes of sources. Specifically, Kaufmann, Kraay and Mastruzzi (2007c: 21-22) report correlations for all six World Governance Indicators, of which the Control of Corruption Index is one, and state that the correlation between an index using their aggregation rule and one that weights each class of indicator equally is approximately But a simple analysis of correlations does not constitute an adequate test of the impact of these different aggregation rules on the data on corruption provided by the World Bank or Transparency International for a simple reason. An index that gives equal weight to different classes of sources must, perforce, be limited to those countries on which indicators of all source classes are available. And precisely because indicators of all source classes are available for these countries, the weight of each of the indicators will be more balanced in these countries than in the countries that are not used in the correlational analysis. In short, such a test has to rely on a subset of cases that is not representative of the entire population, and hence does not offer an adequate estimate of the impact of different aggregation rules on the CCI or CPI data. 19
 Note: This graphic shows the methods-induced deviations in corruption scores that result from")
21 Figure 1. Regional Variation in Methods-induced Bias I: The World Bank s Control of Corruption Index (CCI) Note: This graphic shows the methods-induced deviations in corruption scores that result from differences across countries in the weighting of indicators. To illustrate these methods-induced deviations in corruption scores, we begin by assuming that the corruption experience in all countries is homogenous and assigning each country the same score for any indicator of the same class of source. These scores are the actual mean value of indicator of a certain class for all countries that have indicators of all five classes of sources. We then calculate the CCI index score for each country, using the indicator weights provided by the World Bank. The heavy dashed line indicates the mean score across all countries. If there were no methods-induced deviations in scores, there would be no variation across countries, and all scores would align on the heavy dashed line, which represents the global mean of Deviations from this mean show how much a country s score is shifted upward or downward due to the weighting of indicators. Countries with deviations that fall above the mean line benefit from methods-induced improvements to their corruption scores; countries that fall below the mean line, suffer a methods-induced decrease in their corruption scores. These box plots show that the size of the methods-induced deviations in corruption scores differs by region. For a list of the countries included in each region, see Appendix 2. Source: Authors' calculations based a data set constructed from World Bank (2009a). 20

22 Figure 2. Regional Variation in Methods-induced Bias II: Transparency International s Corruption Perception Index (CPI) Note: See the explanatory note in Figure 1. The heavy dashed line indicates the mean score across all countries. If there were no methods-induced deviations in scores, there would be no variation across countries, and all scores would align on the heavy dashed line, which represents the global mean of Source: Authors' calculations based a data set constructed from World Bank (2009a) and information about sources from Transparency International (2009). IV. Implications for Future Research Efforts to measure corruption, and especially to develop cross-national data sets of broad scope, are unquestionably welcome and laudable. Corruption is a key problem that directly undermines democracy and good government. And part and parcel of the challenge of understanding the nature of corruption, as well as its causes and consequences, is the development of measures of corruption. Thus, it is always worth remembering that having some data, even if of poor quality, is a less grave problem than having no data at all. Yet the current 21
23 availability of multiple indicators and a few indices on corruption has given rise to a new problem, that different measurement methodologies produce different measures of corruption and, as shown, that a substantial amount of the variation in reported levels of corruption is an artifact of the methodologies used to generate the data as opposed to variation in actual levels of corruption. This is a sobering conclusion, which has several implications both for data users and producers. For users of data, the most generic advice that can be offered is that, in light of the finding that the choice of data set has a considerable impact on the results of quantitative, crossnational studies on corruption, researchers need to pay more attention to data matters. That is, researchers need to be aware of the stakes involved in the choice of their measures and know enough about the different available data sets so as to avoid the default position that using any available data set simply on grounds of convenience is good enough. Indeed, every researcher would do well to ask him or herself, before advancing very far in their empirical analysis, Do you know your data? More specifically, this paper has implications for researchers seeking to navigate their way through the maze of available corruption measures. Our analysis does not provide a sufficiently clear basis for distinguishing the relative validity of the multiple proposed measures and thus arguing unequivocally that researchers should opt for one measure over others. To produce a ranking of measures, further information is needed, such as the results of intercoder reliability tests for the indicators that use expert rating; the criteria of selection of respondents, response rates and levels of disagreement among survey respondents; and the underlying data used in the indices. And it is unclear whether all of this information was collected and, if so, whether the data producers will ever make them publicly available. Nonetheless, some conclusions relevant to the use of measures of corruption deserve to be highlighted. First, with regard to indicators of corruption, the fact that different evaluators use different standards in evaluating levels of corruption and that the difference in standards across evaluators does not hold consistently across countries is an indication that, the considerable efforts put into developing cross-national measures of corruption notwithstanding, the measurement of corruption remains a dicey enterprise. Users of the indicators of corruption should take note that, at least for some purposes, it may be premature to rely on the indicators of corruption analyzed in this paper and that, when using these data sources, researchers should be very caution in drawing any strong conclusions. At the very least, it is crucial that researchers recognize the need for sensitivity analyses geared to testing the robustness of their findings to different measures and make such tests a standard element in their analyses along with tests that address alternative specifications of the causal model. Moreover, in conducting such sensitivity analyses, it is key to stress that the data sets included in such an analysis should be independent, a criterion that can more credibly be met by using at least two of the five different classes of sources of data on indicators identified in this paper, that is, expert ratings by commercial risk assessment agencies, by NGOs and by MDBs, and surveys of business executives and the mass public. Second, though combining indicators to generate an index can reduce the measurement error associated with indicators, the problem with indicators on corruption that measures of corruption vary according to who is the evaluator is simply imported into the Transparency International s CPI and the World Bank s CCI. Thus, these indices do not solve the problem of corruption indicators and are not obviously preferable to them. Indeed, it is important not to be fooled by the CCI s reported error estimates (Kaufmann, Kraay and Mastruzzi 2008: 1-2, 17). 22
24 Such estimates depend on questionable assumptions that the indicators that are combined are independent and, in the case of the CCI, that more highly correlated indicators more closely approximate the true value and ignore other sources of measurement error such as whether the indicators actually measure corruption as opposed to some extraneous concept and whether the choice of indicators introduces any bias in the way variation is tracked over time and across countries. In other words, the CPI and the CCI give a false sense of precision and their flaws greatly compromise their usefulness, as some critics have pointed out, for the purposes of either time-series analysis (Arndt and Oman 2006: 61, 67-69, Knack 2007: ) or cross-sectional analysis (Arndt and Oman 2006: 60, Iqbal and Shah 2008: 35-39). Regarding these problems, it is hard to say whether the CPI or the CCI is less problematic. Overall, the developer of the CPI demonstrates greater awareness than the developers of the CCI about issues of validity. 26 In particular, the CPI s indicators were more clearly selected in light of the need to measure corruption and avoid the surreptitious inclusion of extraneous factors and thus the CPI is conceptually sounder than the CCI (compare Lambsdorff 2007: to Kaufmann, Kraay and Mastruzzi 2007d: 75). Moreover, the CPI relies less on technical fixes and uses a less problematic weighting scheme, and the developer of the CPI is more upfront about the limitations of this index. 27 But both the CPI and the CCI suffer from major methodological weaknesses and were not appropriately validated by their developers. And, since Transparency International continues not to make their underlying data public, a major drawback of the CPI, independent researchers are unable to conduct tests on the CPI and carry out a full comparison between the CPI and the CCI. A sensitivity analysis using both the CPI and the CCI, it bears stressing, is not a real check against these problems, in that both indices use many of the same indicators and hence are not really independent measures of corruption (indeed, the shortcomings of sensitivity analyses that use one of these indices and one of the indicators included in the selected index should also be recognized). Thus, researchers must weight the convenience of ready accessibility to data on a large number of countries undoubtedly the big selling point of the CPI and the CCI against the important flaws of these measures. At the same, data users should not cling to a rigid distinction between data producers and data users, and rest content with restricting their options to a choice among existing measures. Indeed, it is important to recognize that efforts to generate new measures and to improve the quality of data on corruption is an integral part of research on corruption. One relatively easy way to improve on the available measures of corruption is to develop a better index on the basis of the available data on indicators. The value of the CPI and the CCI lies primarily in their underlying data, which have not been produced by the index developers, and these two indices have probably outlived their usefulness, having helped to trigger a debate about the measurement of corruption that has uncovered many weaknesses in these indices as well as yielded several proposals to improve on these indices. Specifically, a clear advance would be made by generating an index that better tackles the two key methodological choices addressed in this 26 Indeed, even when critics of the developers of the CCI have pointed out their failure to clearly distinguish these two concepts (Kurtz and Schrank 2007b: 564), their response does not even acknowledge the point (Kaufmann, Kraay and Mastruzzi 2007b). Nonetheless, the developer of the CPI also confuses the concepts of validity and reliability quite often. An illustrative example is when Lambsdorff (2006b: 87), after considering the correlation among various indicators, states that The validity of the sources is mutually confirmed. 27 For example, the developer of the CPI, Lambsdorff (2006b: 83-84) admits that the CPI is not well suited for overtime comparisons. In contrast, the developers of the CCI reject out of hand the value of any criticism of the CCI (Kaufmann, Kraay and Mastruzzi 2007c, Kaufmann and Kraay 2008: 21-22). 23
25 paper the choice of indicators and aggregation rule and that is based on choices guided both by theory and tests. Such an index would perforce be narrower than the CPI and the CCI in terms of empirical scope, given that one of the key problems that needs to be avoided is the varying number of sources and the lack of balance among different classes of sources used for each country. Yet empirical scope is not everything. Indeed, at this point it would be preferable to test theories about the causes and consequences of corruption with a smaller N than is provided by the CPI and the CCI but with greater certainty that the data are more valid. A more burdensome task concerns the generation of data on new indicators. In this regard, a key thrust in the literature on the measurement of corruption has been the need to develop objective or hard measures as opposed to the subjective or soft measures of corruption based on evaluators that are used in indices such as the CPI and the CCI. The distinction between objective and subjective measures of corruption is relevant, in that research has shown that these two classes of measures produce divergent assessments (Donchev and Ujhelyi 2008, Mocan 2008, Olken 2009). Moreover, one clear advantage of objective measures is that they get around a potential critique of subjective measures, that evaluators assess the level of corruption in a country based on suspected causes and consequences of corruption, such as poverty and economic growth, instead of the much harder to obtain observables about corruption itself. 28 Thus, the steps taken to develop objective, experience-based measures of corruption by a number of researchers (Di Tella and Schargrodsky 2003, Reinikka and Svensson 2004, Golden and Picci 2005, Hsieh and Moretti 2006, Olken 2007) is a welcome development. The embrace of objective measures of corruption should not be overstated, however. On the one hand, the prospects of such an approach to the measurement of corruption should not be exaggerated. In particular, it is important to recognize that the development of such measures for the purpose of cross-national comparison is a daunting task. On the other hand, it is critical not to underestimate the potential of subjective measures of corruption. The contrast between objective and subjective measures is frequently overdone, and subjective measures are essentially equated with perceptions of corruption. But this view is not justified. So-called subjective measures may tap solely into perception, but they can also be carefully grounded in observables and even meet the basic criteria of replicability. Thus, future research on corruption will probably be best served by various classes of measures of corruption and by judiciously pooling the information from these different measures. 29 In short, corruption is a notoriously hard-to-measure concept and, even though efforts to measure corruption cross-nationally have made important strides, the measurement of corruption remains a key challenge. Research on corruption should recognize that work on the measurement of corruption is still at an early stage, be cautious in drawing conclusions from the available data sets, and not proceed as though the frontiers of research on corruption only involve matters of 28 This problem has been labeled the halo effect in the literature on the measurement of corruption (Glaeser et al. 2004: 276, Kurtz and Schrank 2007a: 543, 2007b: 567). 29 To improve the quality of subjective measures, greater attention has to be given to the way in which questionnaires are written and administered. Questions should focus more on specifics and actual observations. Moreover, it is important not to ask people about things they really do not know about (for example, asking common citizens about grand corruption seems like an invitation to speculation) and to do more to tap into the knowledge of people who do have useful information (for example, by posing questions to people who work within government ministries). For an example of data gathered through a survey of ministries administered in Georgia, see Hawken and Kulick (2006). For an instrument, designed for Afghanistan, that uses a survey of ministries, and combines it with other sources of information, see Angela and Munck (2008). Finally, for an instrument to generate crossnational measures using different sources of information, see Hawken and Munck (forthcoming). 24
 account of John Snow s success in demonstrating, in the 1850s,")
26 theory building and hypothesis testing. Indeed, in thinking about research on corruption, it is quite appropriate to recall the moral of statistician David Freedman s (1991) account of John Snow s success in demonstrating, in the 1850s, that cholera was a waterborne infectious disease. In a nutshell, as Freedman (1991: 298) argued, Snow s success was not due to technical fixes but rather, among other factors, to the amount of shoe leather Snow was willing to use to get the data. 25
. 2006. The African Development Bank s 2005 Country Performance Assessment.")
27 References ADB (Asian Development Bank) Annual Report on ADB s Country Performance Assessment Exercise. Available at: Performance-Assessment-Exercise/default.asp AfDB (African Development Bank) The African Development Bank s 2005 Country Performance Assessment. A Summary of the AfDB 2005 CPIA Ratings Scores. Available at: Alesina, Alberto, and Beatrice Weder Do Corrupt Governments Receive Less Foreign Aid? American Economic Review Vol. 92, Nº 4: Arndt, Christiane, and Charles Oman Uses and Abuses of Governance Indicators (Paris: OECD Development Centre Studies). Blalock, Hubert M Conceptualization and Measurement in the Social Sciences (Beverly Hills, Cal.: Sage). Boumans, Marcel (ed.) Measurement in Economics: A Handbook (London, Elsevier). 26
Corruption and quality of public institutions: evidence from Generalized Method of Moment
 Document de travail de la série Etudes et Documents E 2008.13 Corruption and quality of public institutions: evidence from Generalized Method of Moment Gbewopo Attila 1 University Clermont I, CERDI-CNRS
The Worldwide Governance Indicators Project: Answering the Critics
 The Worldwide Governance Indicators Project: Answering the Critics Daniel Kaufmann, Aart Kraay, and Massimo Mastruzzi 1 The World Bank February 2007 Abstract: The Worldwide Governance Indicators, reporting
Rethinking the Causes of Corruption: Perceived Corruption, Measurement Bias, and Cultural Illusion
 Chin. Polit. Sci. Rev. (2016) 1:268 302 DOI 10.1007/s41111-016-0024-0 ORIGINAL ARTICLE Rethinking the Causes of Corruption: Perceived Corruption, Measurement Bias, and Cultural Illusion Ning He 1 Received:
Examining the Relationship Between Media Freedom and Corruption Using Elite and Public Opinion Measures
 Examining the Relationship Between Media Freedom and Corruption Using Elite and Public Opinion Measures By Lee B. Becker University of Georgia, USA (lbbecker@uga.edu) Teresa K. Naab Hochschule für Musik,
Measuring Corruption: Myths and Realities
 Measuring Corruption: Myths and Realities Daniel Kaufmann, Aart Kraay, and Massimo Mastruzzi, TheWorld Bank Draft, May 1 st, 2006 There is renewed interest in the World Bank, and among aid donors and aid
The interaction effect of economic freedom and democracy on corruption: A panel cross-country analysis
 The interaction effect of economic freedom and democracy on corruption: A panel cross-country analysis Author Saha, Shrabani, Gounder, Rukmani, Su, Jen-Je Published 2009 Journal Title Economics Letters
The UK Policy Agendas Project Media Dataset Research Note: The Times (London)
") Shaun Bevan The UK Policy Agendas Project Media Dataset Research Note: The Times (London) 19-09-2011 Politics is a complex system of interactions and reactions from within and outside of government. One
Shaun Bevan The UK Policy Agendas Project Media Dataset Research Note: The Times (London) 19-09-2011 Politics is a complex system of interactions and reactions from within and outside of government. One
Defining Accountability
 Defining By Andreas P. Kyriacou Associate Professor of Economics, University of Girona (Spain). Background paper prepared for Aids International (AAI) workshop on May 12-13, 2008, Stockholm. I. Introduction
Economic growth and its determinants in countries in transition
 Economic growth and its determinants in countries in transition Abstract Msc. (C.) Kestrim Avdimetaj University Haxhi Zeka of Kosovo Msc. Mensur Morina University College Fama of Kosovo Main purpose of
Comparing the Data Sets
 Comparing the Data Sets Online Appendix to Accompany "Rival Strategies of Validation: Tools for Evaluating Measures of Democracy" Jason Seawright and David Collier Comparative Political Studies 47, No.
Governance and growth go together. Growth of GDP per capita, (%) 10
 10") Introduction M easuring governance The breakup of the Soviet Union and the emergence of democracies in many developing countries have increased interest in governance. Good governance, strong institutions,
Introduction M easuring governance The breakup of the Soviet Union and the emergence of democracies in many developing countries have increased interest in governance. Good governance, strong institutions,
Bachelorproject 2 The Complexity of Compliance: Why do member states fail to comply with EU directives?
 Bachelorproject 2 The Complexity of Compliance: Why do member states fail to comply with EU directives? Authors: Garth Vissers & Simone Zwiers University of Utrecht, 2009 Introduction The European Union
Immigrant Employment and Earnings Growth in Canada and the U.S.: Evidence from Longitudinal data
 Immigrant Employment and Earnings Growth in Canada and the U.S.: Evidence from Longitudinal data Neeraj Kaushal, Columbia University Yao Lu, Columbia University Nicole Denier, McGill University Julia Wang,
Online Appendix for Redistricting and the Causal Impact of Race on Voter Turnout
 Online Appendix for Redistricting and the Causal Impact of Race on Voter Turnout Bernard L. Fraga Contents Appendix A Details of Estimation Strategy 1 A.1 Hypotheses.....................................
Learning from Small Subsamples without Cherry Picking: The Case of Non-Citizen Registration and Voting
 Learning from Small Subsamples without Cherry Picking: The Case of Non-Citizen Registration and Voting Jesse Richman Old Dominion University jrichman@odu.edu David C. Earnest Old Dominion University, and
Journals in the Discipline: A Report on a New Survey of American Political Scientists
 THE PROFESSION Journals in the Discipline: A Report on a New Survey of American Political Scientists James C. Garand, Louisiana State University Micheal W. Giles, Emory University long with books, scholarly
Chapter 6 Online Appendix. general these issues do not cause significant problems for our analysis in this chapter. One
 Chapter 6 Online Appendix Potential shortcomings of SF-ratio analysis Using SF-ratios to understand strategic behavior is not without potential problems, but in general these issues do not cause significant
Incumbency as a Source of Spillover Effects in Mixed Electoral Systems: Evidence from a Regression-Discontinuity Design.
 Incumbency as a Source of Spillover Effects in Mixed Electoral Systems: Evidence from a Regression-Discontinuity Design Forthcoming, Electoral Studies Web Supplement Jens Hainmueller Holger Lutz Kern September
PROJECTING THE LABOUR SUPPLY TO 2024
 PROJECTING THE LABOUR SUPPLY TO 2024 Charles Simkins Helen Suzman Professor of Political Economy School of Economic and Business Sciences University of the Witwatersrand May 2008 centre for poverty employment
The Transparency International
 The Transparency International Corruption Perceptions Index 1999 Framework Document Dr. Johann Graf Lambsdorff on behalf of Transparency International, October 1999 1. The Methodology 1.1 Introduction
1. The Relationship Between Party Control, Latino CVAP and the Passage of Bills Benefitting Immigrants
 The Ideological and Electoral Determinants of Laws Targeting Undocumented Migrants in the U.S. States Online Appendix In this additional methodological appendix I present some alternative model specifications
GOVERNANCE RETURNS TO EDUCATION: DO EXPECTED YEARS OF SCHOOLING PREDICT QUALITY OF GOVERNANCE?
 GOVERNANCE RETURNS TO EDUCATION: DO EXPECTED YEARS OF SCHOOLING PREDICT QUALITY OF GOVERNANCE? A Thesis submitted to the Faculty of the Graduate School of Arts and Sciences of Georgetown University in
The 2017 TRACE Matrix Bribery Risk Matrix
 The 2017 TRACE Matrix Bribery Risk Matrix Methodology Report Corruption is notoriously difficult to measure. Even defining it can be a challenge, beyond the standard formula of using public position for
University of Groningen. Corruption and governance around the world Seldadyo, H.
 University of Groningen Corruption and governance around the world Seldadyo, H. IMPORTANT NOTE: You are advised to consult the publisher's version (publisher's PDF) if you wish to cite from it. Please
Overview. Main Findings. The Global Weighted Average has also been steady in the last quarter, and is now recorded at 6.62 percent.
 This Report reflects the latest trends observed in the data published in September. Remittance Prices Worldwide is available at http://remittanceprices.worldbank.org Overview The Remittance Prices Worldwide*
Immigration and Multiculturalism: Views from a Multicultural Prairie City
 Immigration and Multiculturalism: Views from a Multicultural Prairie City Paul Gingrich Department of Sociology and Social Studies University of Regina Paper presented at the annual meeting of the Canadian
THE DETERMINANTS OF CORRUPTION: CROSS-COUNTRY-PANEL-DATA ANALYSIS
 bs_bs_banner The Developing Economies 50, no. 4 (December 2012): 311 33 THE DETERMINANTS OF CORRUPTION: CROSS-COUNTRY-PANEL-DATA ANALYSIS Nasr G. ElBAHNASAWY 1 and Charles F. REVIER 2 1 Department of Economics,
PRESS STATEMENT ON THE RELEASE OF THE CORRUPTION PERCEPTIONS INDEX (CPI) 2015
 2015") GHANA INTEGRITY INITIATIVE (GII) Local Chapter of Transparency International PRESS STATEMENT ON THE RELEASE OF THE CORRUPTION PERCEPTIONS INDEX (CPI) 2015 Accra, 27 January, 2016 Transparency International,
GHANA INTEGRITY INITIATIVE (GII) Local Chapter of Transparency International PRESS STATEMENT ON THE RELEASE OF THE CORRUPTION PERCEPTIONS INDEX (CPI) 2015 Accra, 27 January, 2016 Transparency International,
Perceptions of Corruption in Mass Publics
 Perceptions of Corruption in Mass Publics Sören Holmberg QoG WORKING PAPER SERIES 2009:24 THE QUALITY OF GOVERNMENT INSTITUTE Department of Political Science University of Gothenburg Box 711 SE 405 30
LABOUR-MARKET INTEGRATION OF IMMIGRANTS IN OECD-COUNTRIES: WHAT EXPLANATIONS FIT THE DATA?
 LABOUR-MARKET INTEGRATION OF IMMIGRANTS IN OECD-COUNTRIES: WHAT EXPLANATIONS FIT THE DATA? By Andreas Bergh (PhD) Associate Professor in Economics at Lund University and the Research Institute of Industrial
DU PhD in Home Science
 DU PhD in Home Science Topic:- DU_J18_PHD_HS 1) Electronic journal usually have the following features: i. HTML/ PDF formats ii. Part of bibliographic databases iii. Can be accessed by payment only iv.
GALLUP World Bank Group Global Poll Executive Summary. Prepared by:
 GALLUP 2008 World Bank Group Global Poll Executive Summary Prepared by: October 2008 The Gallup Organization 901 F Street N.W. Washington D.C., 20004 (202) 715-3030 Prepared for: The World Bank 1818 H
REMITTANCE PRICES WORLDWIDE
 REMITTANCE PRICES WORLDWIDE THE WORLD BANK PAYMENT SYSTEMS DEVELOPMENT GROUP FINANCIAL AND PRIVATE SECTOR DEVELOPMENT VICE PRESIDENCY ISSUE NO. 3 NOVEMBER, 2011 AN ANALYSIS OF TRENDS IN THE AVERAGE TOTAL
Imagine Canada s Sector Monitor
 Imagine Canada s Sector Monitor David Lasby, Director, Research & Evaluation Emily Cordeaux, Coordinator, Research & Evaluation IN THIS REPORT Introduction... 1 Highlights... 2 How many charities engage
THE PROVINCIAL AUDITOR AND THE ADMINISTRATIVE JUSTICE SYSTEM
 THE ADMINISTRATIVE JUSTICE WORKING GROUP THE PROVINCIAL AUDITOR AND THE ADMINISTRATIVE JUSTICE SYSTEM This paper has been written in response to a concern amongst members of the Administrative Justice
Case Study: Get out the Vote
 Case Study: Get out the Vote Do Phone Calls to Encourage Voting Work? Why Randomize? This case study is based on Comparing Experimental and Matching Methods Using a Large-Scale Field Experiment on Voter
Setting User Charges for Public Services: Policies and Practice at the Asian Development Bank
 ERD Technical Note No. 9 Setting User Charges for Public Services: Policies and Practice at the Asian Development Bank David Dole December 2003 David Dole is an Economist in the Economic Analysis and Operations
SHOULD THE UNITED STATES WORRY ABOUT LARGE, FAST-GROWING ECONOMIES?
 Chapter Six SHOULD THE UNITED STATES WORRY ABOUT LARGE, FAST-GROWING ECONOMIES? This report represents an initial investigation into the relationship between economic growth and military expenditures for
Iowa Voting Series, Paper 6: An Examination of Iowa Absentee Voting Since 2000
 Department of Political Science Publications 5-1-2014 Iowa Voting Series, Paper 6: An Examination of Iowa Absentee Voting Since 2000 Timothy M. Hagle University of Iowa 2014 Timothy M. Hagle Comments This
A positive correlation between turnout and plurality does not refute the rational voter model
 Quality & Quantity 26: 85-93, 1992. 85 O 1992 Kluwer Academic Publishers. Printed in the Netherlands. Note A positive correlation between turnout and plurality does not refute the rational voter model
Corruption in Empirical Research - A Review
 Corruption in Empirical Research - A Review by Dr. Johann Graf Lambsdorff (jlambsd@uni-passau.de) November, 1999 Also published as a Transparency International Working Paper Abstract Data on the perceived
REVIEW OF FOUNDATIONS OF HUMAN SOCIALITY: ECONOMIC EXPERIMENTS AND ETHNOGRAPHIC EVIDENCE FROM FIFTEEN SMALL-SCALE SOCIETIES
 REVIEW OF FOUNDATIONS OF HUMAN SOCIALITY: ECONOMIC EXPERIMENTS AND ETHNOGRAPHIC EVIDENCE FROM FIFTEEN SMALL-SCALE SOCIETIES ANITA JOWITT This book is not written by lawyers or written with legal policy
Preliminary Effects of Oversampling on the National Crime Victimization Survey
 Preliminary Effects of Oversampling on the National Crime Victimization Survey Katrina Washington, Barbara Blass and Karen King U.S. Census Bureau, Washington D.C. 20233 Note: This report is released to
APPENDIX TO MILITARY ALLIANCES AND PUBLIC SUPPORT FOR WAR TABLE OF CONTENTS I. YOUGOV SURVEY: QUESTIONS... 3
 APPENDIX TO MILITARY ALLIANCES AND PUBLIC SUPPORT FOR WAR TABLE OF CONTENTS I. YOUGOV SURVEY: QUESTIONS... 3 RANDOMIZED TREATMENTS... 3 TEXT OF THE EXPERIMENT... 4 ATTITUDINAL CONTROLS... 10 DEMOGRAPHIC
Differences in National IQs behind the Eurozone Debt Crisis?
 3 Differences in National IQs behind the Eurozone Debt Crisis? Tatu Vanhanen * Department of Political Science, University of Helsinki The purpose of this article is to explore the causes of the European
More and more corruption?
 1 Validity of the CPI, Passau 23-25 June 2005 DIES OECONOMICUS VI 23-25 June 2005 University of Passau Organized by Transparency International Germany and the Passau University On the occasion of 10 years
Panel 3 New Metrics for Assessing Human Rights and How These Metrics Relate to Development and Governance
 Panel 3 New Metrics for Assessing Human Rights and How These Metrics Relate to Development and Governance David Cingranelli, Professor of Political Science, SUNY Binghamton CIRI Human Rights Data Project
College Voting in the 2018 Midterms: A Survey of US College Students. (Medium)
") College Voting in the 2018 Midterms: A Survey of US College Students (Medium) 1 Overview: An online survey of 3,633 current college students was conducted using College Reaction s national polling infrastructure
College Voting in the 2018 Midterms: A Survey of US College Students (Medium) 1 Overview: An online survey of 3,633 current college students was conducted using College Reaction s national polling infrastructure
Measuring the Shadow Economy of Bangladesh, India, Pakistan, and Sri Lanka ( )
") Measuring the Shadow Economy of Bangladesh, India, Pakistan, and Sri Lanka (1995-2014) M. Kabir Hassan Blake Rayfield Makeen Huda Corresponding Author M. Kabir Hassan, Ph.D. 2016 IDB Laureate in Islamic
Measuring the Shadow Economy of Bangladesh, India, Pakistan, and Sri Lanka (1995-2014) M. Kabir Hassan Blake Rayfield Makeen Huda Corresponding Author M. Kabir Hassan, Ph.D. 2016 IDB Laureate in Islamic
CALTECH/MIT VOTING TECHNOLOGY PROJECT A
 CALTECH/MIT VOTING TECHNOLOGY PROJECT A multi-disciplinary, collaborative project of the California Institute of Technology Pasadena, California 91125 and the Massachusetts Institute of Technology Cambridge,
Corruption Perceptions Index 2011 Full Source Description. Sources included in the CPI 2011:
 Corruption Perceptions Index 2011 Sources included in the CPI 2011: 1. African Development Bank Governance Ratings 2010 2. Asian Development Bank Country Performance Assessment 2010 3. Bertelsmann Foundation
Telephone Survey. Contents *
 Telephone Survey Contents * Tables... 2 Figures... 2 Introduction... 4 Survey Questionnaire... 4 Sampling Methods... 5 Study Population... 5 Sample Size... 6 Survey Procedures... 6 Data Analysis Method...
Non-Voted Ballots and Discrimination in Florida
 Non-Voted Ballots and Discrimination in Florida John R. Lott, Jr. School of Law Yale University 127 Wall Street New Haven, CT 06511 (203) 432-2366 john.lott@yale.edu revised July 15, 2001 * This paper
Introduction Why Don t Electoral Rules Have the Same Effects in All Countries?
 Introduction Why Don t Electoral Rules Have the Same Effects in All Countries? In the early 1990s, Japan and Russia each adopted a very similar version of a mixed-member electoral system. In the form used
Guidelines for Performance Auditing
 Guidelines for Performance Auditing 2 Preface The Guidelines for Performance Auditing are based on the Auditing Standards for the Office of the Auditor General. The guidelines shall be used as the foundation
Mapping Policy Preferences with Uncertainty: Measuring and Correcting Error in Comparative Manifesto Project Estimates *
 Mapping Policy Preferences with Uncertainty: Measuring and Correcting Error in Comparative Manifesto Project Estimates * Kenneth Benoit Michael Laver Slava Mikhailov Trinity College Dublin New York University
Chapter 1 Introduction and Goals
 Chapter 1 Introduction and Goals The literature on residential segregation is one of the oldest empirical research traditions in sociology and has long been a core topic in the study of social stratification
Thornbury Township Police Services Survey: Initial Data Analyses and Key Findings
 Thornbury Township Police Services Survey: Initial Data Analyses and Key Findings 1160 McDermott Drive, Suite 101, West Chester, PA 19383 Phone: 610-425-7448, E-Mail: lbernotsky@wcupa.edu April 2012 2
The Impact of Democracy and Press Freedom on Corruption: Conditionality Matters
 The Impact of Democracy and Press Freedom on Corruption: Conditionality Matters Christine Kalenborn Christian Lessmann CESIFO WORKING PAPER NO. 3917 CATEGORY 2: PUBLIC CHOICE AUGUST 2012 An electronic
Can information that raises voter expectations improve accountability?
 Can information that raises voter expectations improve accountability? A field experiment in Mali Jessica Gottlieb Stanford University, Political Science May 8, 2012 Overview Motivation: Preliminary studies
KNOW THY DATA AND HOW TO ANALYSE THEM! STATISTICAL AD- VICE AND RECOMMENDATIONS
 KNOW THY DATA AND HOW TO ANALYSE THEM! STATISTICAL AD- VICE AND RECOMMENDATIONS Ian Budge Essex University March 2013 Introducing the Manifesto Estimates MPDb - the MAPOR database and
Revealing the true cost of financial crime Focus on the Middle East and North Africa
 Revealing the true cost of financial crime Focus on the Middle East and North Africa What s hiding in the shadows? In March 2018, Thomson Reuters commissioned a global survey to better understand the true
Corruption and business procedures: an empirical investigation
 Corruption and business procedures: an empirical investigation S. Roy*, Department of Economics, High Point University, High Point, NC - 27262, USA. Email: sroy@highpoint.edu Abstract We implement OLS,
The Nation Brand Index perspectives on South Africa s global reputation. Brand South Africa Research Note. By: Dr Petrus de Kock
 Brand South Africa Research Note The Nation Brand Index perspectives on South Africa s global reputation By: Dr Petrus de Kock 18 November 2015 Contents Introduction Findings from the 2015 Nation Brand
Findings. Measuring Corruption: Myths and Realities. April Public Disclosure Authorized Poverty Reduction and Economic Management
 Poverty Reduction and Economic Management 39603 273 April 2007 Findings reports on ongoing operational, economic, and sector work carried out by the World Bank and its member governments in the Africa
Benchmarks for text analysis: A response to Budge and Pennings
 Electoral Studies 26 (2007) 130e135 www.elsevier.com/locate/electstud Benchmarks for text analysis: A response to Budge and Pennings Kenneth Benoit a,, Michael Laver b a Department of Political Science,
Research Note: Toward an Integrated Model of Concept Formation
 Kristen A. Harkness Princeton University February 2, 2011 Research Note: Toward an Integrated Model of Concept Formation The process of thinking inevitably begins with a qualitative (natural) language,
This article provides a brief overview of an
 ELECTION LAW JOURNAL Volume 12, Number 1, 2013 # Mary Ann Liebert, Inc. DOI: 10.1089/elj.2013.1215 The Carter Center and Election Observation: An Obligations-Based Approach for Assessing Elections David
Governance Indicators:
 WPS4370 Policy Research Working Paper 4370 Governance Indicators: Where Are We, Where Should We Be Going? Daniel Kaufmann Aart Kraay The World Bank World Bank Institute Global Governance Group and Development
Reanalysis: Are coups good for democracy?
 681908RAP0010.1177/2053168016681908Research & PoliticsMiller research-article2016 Research Note Reanalysis: Are coups good for democracy? Research and Politics October-December 2016: 1 5 The Author(s)
Whither Corruption? A Quantitative Survey of the Literature on Corruption and Growth
 DISCUSSION PAPER SERIES IZA DP No. 5334 Whither Corruption? A Quantitative Survey of the Literature on Corruption and Growth Nauro F. Campos Ralitza Dimova Ahmad Saleh November 2010 Forschungsinstitut
A Statistical Analysis of the Guatemalan National Police Archive: Searching for Documentation of Human Rights Abuses
 A Statistical Analysis of the Guatemalan National Police Archive: Searching for Documentation of Human Rights Abuses Megan Price, Tamy Guberek, Daniel Guzmán, Paul Zador and Gary Shapiro Abstract This
Remittance Prices Worldwide Issue n. 19, September 2016
 An analysis of trends in cost of remittance services Remittance Prices Worldwide Issue n. 19, September This Report reflects the latest trends observed in the data published in September. Remittance Prices
Daniel Kaufmann, Brookings Institution
 Corruption in transition: reflections & implications from governance empirics Daniel Kaufmann, Brookings Institution Presentation at the opening plenary session on Measurement & Consequences of Corruption
LONG RUN GROWTH, CONVERGENCE AND FACTOR PRICES
 LONG RUN GROWTH, CONVERGENCE AND FACTOR PRICES By Bart Verspagen* Second draft, July 1998 * Eindhoven University of Technology, Faculty of Technology Management, and MERIT, University of Maastricht. Email:
The National Citizen Survey
 CITY OF SARASOTA, FLORIDA 2008 3005 30th Street 777 North Capitol Street NE, Suite 500 Boulder, CO 80301 Washington, DC 20002 ww.n-r-c.com 303-444-7863 www.icma.org 202-289-ICMA P U B L I C S A F E T Y
A COMPARISON BETWEEN TWO DATASETS
 A COMPARISON BETWEEN TWO DATASETS Bachelor Thesis by S.F. Simmelink s1143611 sophiesimmelink@live.nl Internationale Betrekkingen en Organisaties Universiteit Leiden 9 June 2016 Prof. dr. G.A. Irwin Word
Executive summary 2013:2
 Executive summary Why study corruption in Sweden? The fact that Sweden does well in international corruption surveys cannot be taken to imply that corruption does not exist or that corruption is not a
Governance Matters V: Aggregate and Individual Governance Indicators for
 Governance Matters V: Aggregate and Individual Governance Indicators for 1996-2005 Daniel Kaufmann, Aart Kraay, and Massimo Mastruzzi The World Bank September 2006 Abstract: This paper reports on the latest
A Comment on Measuring Economic Freedom: A Comparison of Two Major Sources
 The Journal of Private Enterprise 31(3), 2016, 69 91 A Comment on Measuring Economic Freedom: A Comparison of Two Major Sources Ryan H. Murphy Southern Methodist University Abstract Do social scientists
And for such other and further relief as to this Court may deem just and proper.
 SUPERIOR COURT OF THE STATE OF NEW YORK COUNTY OF NIAGARA: CRIMINAL TERM THE PEOPLE OF THE STATE OF NEW YORK Indictment 2015-041 VS. DAVID SMITH NOTICE OF MOTION Defendant SIRS/MADAMES: PLEASE TAKE NOTICE,
Immigrant Legalization
 Technical Appendices Immigrant Legalization Assessing the Labor Market Effects Laura Hill Magnus Lofstrom Joseph Hayes Contents Appendix A. Data from the 2003 New Immigrant Survey Appendix B. Measuring
A Report on the Social Network Battery in the 1998 American National Election Study Pilot Study. Robert Huckfeldt Ronald Lake Indiana University
 A Report on the Social Network Battery in the 1998 American National Election Study Pilot Study Robert Huckfeldt Ronald Lake Indiana University January 2000 The 1998 Pilot Study of the American National
Framework Document 2002
 Background Paper to the 2002 Corruption Perceptions Index Framework Document 2002 The Corruption Perceptions Index is a composite index. The data used this year were compiled between 2000 and 2002. Comparisons
Economic and Social Council
 United Nations Economic and Social Council Distr.: General 27 December 2001 E/CN.3/2002/27 Original: English Statistical Commission Thirty-third session 5-8 March 2002 Item 7 (f) of the provisional agenda*
The impact of corruption upon economic growth in the U.E. countries
 The impact of corruption upon economic growth in the U.E. countries MIHAI DANIEL ROMAN mihai.roman@ase.ro MADALINA ECATERINA ANDREICA National Scientific Research Institute for Labour and Social Protection
Patterns of Housing Voucher Use Revisited: Segregation and Section 8 Using Updated Data and More Precise Comparison Groups, 2013
 Patterns of Housing Voucher Use Revisited: Segregation and Section 8 Using Updated Data and More Precise Comparison Groups, 2013 Molly W. Metzger, Assistant Professor, Washington University in St. Louis
We the Stakeholders: The Power of Representation beyond Borders? Clara Brandi
 REVIEW Clara Brandi We the Stakeholders: The Power of Representation beyond Borders? Terry Macdonald, Global Stakeholder Democracy. Power and Representation Beyond Liberal States, Oxford, Oxford University
Evidence-Based Policy Planning for the Leon County Detention Center: Population Trends and Forecasts
 Evidence-Based Policy Planning for the Leon County Detention Center: Population Trends and Forecasts Prepared for the Leon County Sheriff s Office January 2018 Authors J.W. Andrew Ranson William D. Bales
Human Rights in Canada-Asia Relations
 Human Rights in Canada-Asia Relations January 2012 Table of Contents Key Findings 3 Detailed Findings 12 Current State of Human Rights in Asia 13 Canada s Role on Human Rights in Asia 20 Attitudes Towards
ECON 450 Development Economics
 ECON 450 Development Economics Long-Run Causes of Comparative Economic Development Institutions University of Illinois at Urbana-Champaign Summer 2017 Outline 1 Introduction 2 3 The Korean Case The Korean
World Powers in the 21 st Century
 World Powers in the st Century The Results of a Representative Survey in,,,,,,, the, and the United States Berlin, June 2, 2006 CONTENTS FOREWORD... 1 OBJECTIVES AND CONTENTS...6 2 EXECUTION AND METHODOLOGY...8
Appendix for Citizen Preferences and Public Goods: Comparing. Preferences for Foreign Aid and Government Programs in Uganda
 Appendix for Citizen Preferences and Public Goods: Comparing Preferences for Foreign Aid and Government Programs in Uganda Helen V. Milner, Daniel L. Nielson, and Michael G. Findley Contents Appendix for
Talking of rogue aid: Mirror, mirror on the wall. Tatjana Chahoud
 Talking of rogue aid: Mirror, mirror on the wall Tatjana Chahoud Talking of rogue aid: Mirror, mirror on the wall Tatjana Chahoud Bonn, June 2007 1 Talking of rogue aid: Mirror, mirror on the wall...
STUDY OF PRIVATE SECTOR PERCEPTIONS OF CORRUPTION
 STUDY OF PRIVATE SECTOR PERCEPTIONS OF CORRUPTION This sur vey is made possible by the generous suppor t of Global Af fairs Canada. The Asia Foundation and the Sant Maral Foundation have implemented the
Visa Entry to the United Kingdom The Entry Clearance Operation
 Visa Entry to the United Kingdom The Entry Clearance Operation REPORT BY THE COMPTROLLER AND AUDITOR GENERAL HC 367 Session 2003-2004: 17 June 2004 LONDON: The Stationery Office 10.75 Ordered by the House
7 ETHNIC PARITY IN INCOME SUPPORT
 7 ETHNIC PARITY IN INCOME SUPPORT Summary of findings For customers who, in 2003, had a Work Focused Interview as part of an IS claim: There is evidence, for Ethnic Minorities overall, of a significant
Analyzing Racial Disparities in Traffic Stops Statistics from the Texas Department of Public Safety
 Analyzing Racial Disparities in Traffic Stops Statistics from the Texas Department of Public Safety Frank R. Baumgartner, Leah Christiani, and Kevin Roach 1 University of North Carolina at Chapel Hill
Benefit levels and US immigrants welfare receipts
 1 Benefit levels and US immigrants welfare receipts 1970 1990 by Joakim Ruist Department of Economics University of Gothenburg Box 640 40530 Gothenburg, Sweden joakim.ruist@economics.gu.se telephone: +46
The evolution of the EU anticorruption
 DEVELOPING AN EU COMPETENCE IN MEASURING CORRUPTION Policy Brief No. 27, November 2010 The evolution of the EU anticorruption agenda The problem of corruption has been occupying the minds of policy makers,