Refugees Vulnerability Study Kakuma, Kenya
|
|
|
- Barbra O’Neal’
- 5 years ago
- Views:
Transcription
1 Refugees Vulnerability Study Kakuma, Kenya
2 May 2016 Refugees Vulnerability Study, Kakuma, Kenya Dr. Helen Guyatt, Flavia Della Rosa, Jenny Spencer Kimetrica P.O. Box 1327, Village Market Nairobi, Kenya Tel: +254 (020) Garden Centre, Suite A-368 Broomfield, CO Tel:
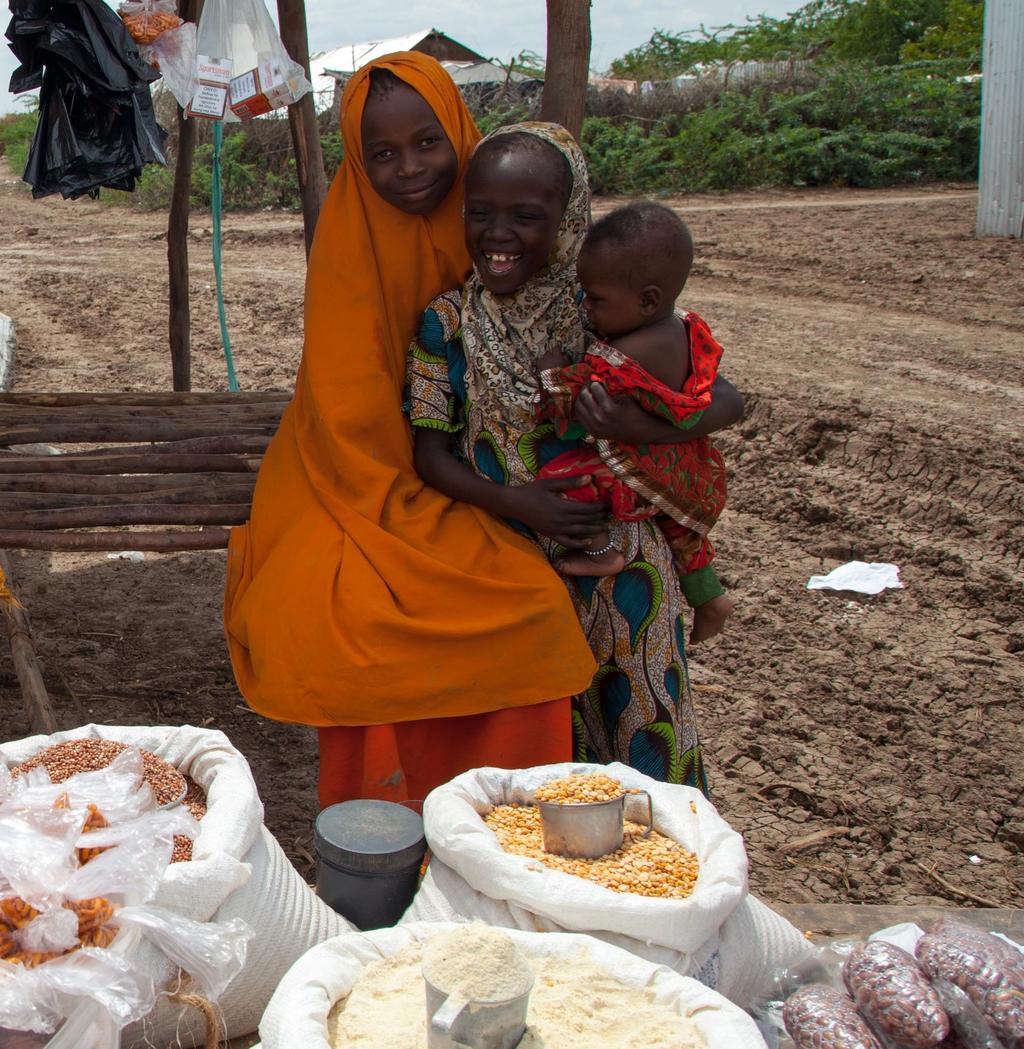
3 ACKNOWLEDGEMENTS The Refugee Vulnerability Study in Kakuma Refugee Camp was commissioned by the Kenya country offices of the UN World Food Programme (WFP), UN High Commissioner for Refugees (UNHCR) and their partners in Kakuma Refugee Camp. It is the result of the inputs from and hard work of a number of individuals and organisations. First, we would like to extend our gratitude to the study s Technical Steering Committee, particularly its chairperson, Yvonne Forsen for her coordination and facilitation efforts. We would also like to thank the key informants, listed in this study s accompanying scoping report (Guyatt, 2015), who volunteered their time to offer insights on refugee livelihoods. This study would not have been possible without the support of a number of Kimetrica staff. In particular, we would like to thank Dr. Eric Nussbaumer for his analytical contribution to the proxy means testing and community based targeting correlations. We wish to acknowledge the hard work of the survey team, led by Mehari Belachew; coordinated by Perry Ndila Muthoka, Cecilia Thiga, Christine Njogu and Constant Wanyonyi; and including the Kenyan and refugee data collection team and interpreters. In addition, we would like to recognise Sophie Turnbull for her support to the community based targeting exercise and focus group discussions. Finally, we wish to express our gratitude to the many refugees who volunteered their time to help us learn about the lives and livelihoods of the refugees throughout the camp. Cover photo: Dr. Helen Guyatt
4 ACRONYMS AAHI Action Africa Help International DR Congo Democratic Republic of Congo DRC Danish Refugee Council FSOM Food Security and Outcome Monitoring HI Handicap International IOM International Organization for Migration IRC International Rescue Committee JRS Jesuit Refugee Service LSMS Living Standard and Measurement Surveys LWF Lutheran World Federation NFI Non-Food Item NGO Non-governmental organisation NRC Norwegian Refugee Council OLS Ordinary Least Squares SMOTE Synthetic Minority Over-sampling Technique (SMOTE) TSC Technical Steering Committee UNHCR United Nations High Commissioner for Refugees WFP World Food Programme
5 CONTENTS Executive summary Introduction The household survey Definition of a household and multiple ration cards Household characteristics of the sample population Livelihood activities and income Income sources Livelihood opportunities Activities and employment Loans, credit and savings groups Skills and training Social networks Physical networks Quantitative data on food insecurity and socio-economic vulnerability Food insecurity Food consumption patterns Food Consumption Score Dietary Diversity Score Coping Strategies Index Socio-economic vulnerability and poverty Expenditure on food items (purchased food) Expenditure on in-stock and own production Expenditure on consumable NFIs Expenditure for durable NFIs Total expenditure/capita/day on food and NFIs compared to the minimum baskets Socio-economic proxies Wealth assets...37
6 4.3.2 Use of electricity and other expensive items Age-dependency ratio and earning potential Crowding index Vulnerable household profiles: Unraveling the myths Female-headed households Households with a disabled or elderly member, or a disabled or elderly head Households with and without business and employment Household size Household size More detailed examination of household size Year of arrival Targeting Targeting in or out Inclusion and exclusion errors Cost analysis Targeting approaches Categorical Targeting Proxy Means Testing Self-targeting Community-Based Targeting Conclusions and recommendations...68 Bibliography...72 Annex 1. Details of the household sampling and results...74 Annex 2. Community-based Targeting and Focus Group Discussions...78 Annex 3. Income results...84 Annex 4. Food security definitions, calculations and results...89 Annex 5. The minimum basket and cash equivalent consumption expenditure assumptions...95 Annex 6. Cash equivalent consumption expenditure results Annex 7. Socio-economic proxy results
7 Annex 8. Profiles by household type Annex 9: Categorical targeting Annex 10. Regression analysis for Proxy Means Testing Annex 11. Community-based Targeting results
8 TABLES Table 1: General Household Characteristics by Sub-camp...10 Table 2: General Household Characteristics by Country of Origin...12 Table 3: Inclusion and Exclusion Errors for Proxy Means Testing Models...59 Table A1: Households Sampled per Block...75 Table A2: Comparison of Key Household Characteristics between Vulnerability Household Survey and UNHCR Statistics Dated 9 September Table A3: The Participants of the 12 Focus Group Discussions...82 Table A4: Sources of Household Income Last Month...84 Table A5: Number of Income Sources...85 Table A6: Sources of Business Start-Up Funds...86 Table A7: Loans Taken in Last Month...87 Table A8: Debts Owed in Last Month...88 Table A9: Percentage of Households Consuming More Diverse Diets (Groups)...89 Table A10: Food Groups and Nutrient Value Scores for Calculation of Food Consumption Score and Dietary Diversity Score...90 Table A11: Food Consumption Score Groups and Scores...91 Table A12: Dietary Diversity Groups and Scores...92 Table A13: Coping Strategies Indices...94 Table A14: Minimum Food Basket Calculations (WFP, 2015)...95 Table A15: Minimum Essential NFI Basket Calculations from UNHCR...95 Table A16: Unit Prices and Quantities for the Food Items Purchased over Past Week Used to Value In-stock and Own Production...98 Table A17: Household Consumption Expenditure per Day on Purchased Food (Proportions). 101 Table A18: Household Consumption Expenditure per Day on Purchased Food (Means) Table A19: Household Consumption Expenditure per Day on Food In-stock Estimated in Terms of Cash Equivalent Table A20: Household Consumption Expenditure per Day on Own Production Food Estimated in Terms of Cash Equivalent Table A21: Household Consumption Expenditure per Day on Non-gifted Consumable NFIs (Proportions)
9 Table A22: Household Consumption Expenditure per Day on Non-gifted Consumable NFIs (Means) Table A23: Household Consumption Expenditure per Day on Non-gifted Durable NFIs (Proportions) Table A24: Household Consumption Expenditure per Day on Non-gifted Durable NFIs (Means) Table A25: Total Household Cash Equivalent Consumption Expenditure/capita/day (Proportions) Table A26: Total Household Cash Equivalent Consumption Expenditure per Day (Means) Table A27: Percentage of Non-vulnerable Households Based on a Range of Vulnerability Thresholds Table A28: Five Main Wealth Assets: TV, Bicycle, Wheelbarrow, Table, Solar Panels, and Two of the Five Table A29: Other Wealth Assets: Generator, Satellite Dish, Goats, Chickens or Ducks Table A30: Consumption of Electricity, Private School, Domestic Help, Entertainment, Toiletries, Travel or Transport Table A31: Dependency Ratios Table A32: Earning Potential Table A33: Crowding Indexes Table A34: Household Profiles by Gender of Head of Household Table A35: Household Profiles for Households with an Elderly/Disabled Member or Head of Household Table A36: Household Profiles for Households with and without Business/Employment Table A37: Household Profiles for Households of Different Sizes Table A38: Household Profiles for Households with Different Years of Arrival Table A39: The Effectiveness of Different Categorical Targeting Options, Using Minimal Essential Basket Cut-off of 77 Ksh/capita/day (Can Provide for Own Food and NFIs) Table A40: Effectiveness of Different Categorical Targeting Options Using Kenya Poverty Line Cut-off of 125 Ksh/capita/day Table A41: Effectiveness of Different Categorical Targeting Options Using Essential Food Basket of 62 Ksh/capita/day (Can Provide Own Food) Table A42: The Effectiveness of Different Categorical Targeting Options Using Essential NFI Basket and Half of Essential Food Basket: 46 Ksh/capita/day
10 Table A43: The Effectiveness of Different Categorical Targeting Options Using Half of Essential Food Basket: 31 Ksh/capita/day (Can Provide ½ of Own Food) Table A44: The Effectiveness of Different Categorical Targeting Options Using Essential NFI Basket: 15 Ksh/capita/day (Can Provide Own NFIs) Table A45: Variables for Proxy Means Testing Table A46: Inclusion and Exclusion Errors for Proxy Means Testing Using Comprehensive Dataset Table A47: Inclusion and Exclusion Errors for Proxy Means Testing Using Robust Dataset Table A48: Characteristics of the Community Leaders Interviewed Table A49: Country of Origin of Blocks Table A50: Community Leaders Knowledge of and Interaction with the Sampled Households Table A51: Community Leaders Knowledge of and Interaction with the Sampled Households for Different Countries of Origin Table A52: Remittance and Employment Characteristics of Sampled Households Table A53: Remittance and Employment Characteristics of Sampled Households by Country of Origin of the Block Table A54: Households Identified as Having Employment and Remittances by the Household Survey and/or Community Leaders, for the Households in Blocks That Can Rank Everyone That They Know Table A55: Households Identified as Not Being Able to Survive in the Absence of Assistance, per the Household Survey and/or Community Leaders, for the Households in Blocks That Can Rank Everyone That They Know Table A56: Rank Correlation Coefficients Aggregated up to Zone Level Table A57: Rank Correlation Coefficients Aggregated up to the Sub-camp Level
11 FIGURES Figure 1: The Location of the 2,000 Households Sampled across Kakuma Refugee Camp... 6 Figure 2: Proportion of Households from each Country of Origin by Sub-camp...11 Figure 3: Distribution of New Arrivals by Country of Origin and Sub-camp...13 Figure 4: Years since Arrival in the Camp (By Main Country of Origin)...13 Figure 5: Sources of Income, of those Reporting Earning Income over Past Month...16 Figure 6: Proportion of Households Sampled Reporting Income by Source...17 Figure 7: Minimum, Median and Maximum Income per Month by Source...18 Figure 8: Distribution of Income per Household over the Previous Month by Source...20 Figure 9: Main Livelihood Activity before Arrival...21 Figure 10: Households Consuming a Limited Diet...27 Figure 11: Food Consumption Score Results by Country of Origin...28 Figure 12: Median Monthly Expenditures per Capita on Consumable NFIs...32 Figure 13: Contribution of Each Item to Total Consumable NFI Expenditure in the Camp...33 Figure 14: Median Expenditures per Capita by Durable NFIs...34 Figure 15: Contribution of Each Item to Total Durable NFI Expenditure in the Camp...35 Figure 16: Demographics by Gender of Head of Household...41 Figure 17: Vulnerability by Gender of Head of Household...42 Figure 18: Vulnerability of Households with and without an Elderly or Disabled Head of Household...43 Figure 19: Demographics by Business Ownership...43 Figure 20: Vulnerability by Business and Employment...45 Figure 21: Comparison of Household Size 1 and the Full Sample...47 Figure 22: Sub-camp Composition of Household Size Groups...48 Figure 23: Vulnerability Measures by Household Size...49 Figure 24: Demographics by Year of Arrival...50 Figure 25: Vulnerability by Arrival Group...51 Figure 26: Profiles of Vulnerable and Non-vulnerable Households...52
12 Figure 27: Summary of Community Leaders Rankings of Household Employment and Remittances...63 Figure A1: The Proportion of Households from each Country of Origin According to (1a) Our Household Sample and (B) UNHCR Database...77 Figure A2: Predicted Vs Actual Cash Equivalent Consumption Expenditure/capita/day in Ksh from OLS Regression with Comprehensive Explanatory Variable List Figure A3: Predicted Vs Actual Cash Equivalent Consumption Expenditure/capita/day in Ksh from OLS Regression with Robust Explanatory Variable List Figure A4: Frequency Histogram of the Ranking Correlations on a Block Level Figure A5: Frequency Histogram of Correlation Coefficient from Rankings by Both Block Leader and Chair Lady Figure A6: Frequency Histogram of Correlation Coefficient from Rankings by Block Leader Figure A7: Frequency Histogram of Correlation Coefficient from Rankings by Chair Lady
13 EXECUTIVE SUMMARY Kakuma Refugee Camp is one of the longest lasting humanitarian settlements in sub-saharan Africa and one of the largest refugee camps in the world. In response to recent reductions in funding for the Kenyan refugee operation, increased global competition for funds, and a common belief that not all refugees in such protracted situations have the same humanitarian assistance needs, the World Food Programme (WFP) and United Nations High Commissioner for Refugees (UNHCR) commissioned Kimetrica to undertake a vulnerability study among refugees in Kakuma Camp. The main aims were to fill knowledge gaps regarding refugee livelihoods and the level and differences of vulnerability in refugee households, as well as to explore the feasibility of delivering more differentiated assistance and to identify the mechanisms that would need to be put in place to do so. Specifically, the study was meant to determine whether a permanent targeting mechanism could be put in place or whether obvious ways of prioritising assistance exist when resources are tight. To complete the study, Kimetrica carried out three phases of fieldwork: an initial scoping study, a 2,000 household survey and a follow-up mission to explore the feasibility of various targeting mechanisms. The household survey covered 13,378 refugees distributed across each of the 126 administrative blocks in the camp. Designed to be statistically representative at the subcamp level, with 500 households sampled in each of the four sub-camps (Kakuma 1, 2, 3 and 4), it is one of the most comprehensive studies on the livelihoods, wealth and vulnerability of the Kakuma refugee population. LIVELIHOODS AND INCOME SOURCES Many households either farmed or reared livestock before arriving in the camp. Unlike other refugee camps where agriculture and livestock rearing can be major livelihoods, the restrictions on livestock ownership and the scarcity of water limit these activities in Kakuma. Legal constraints on other livelihood opportunities, a small customer base (mostly refugees themselves) and the remoteness of the camp result in a challenging environment for business operations. The only major external cash flows into the camp are via remittances and incentive work. Although 10 percent of households reported receiving cash income from employment, 8.2 percent from a business and 6.0 percent from remittances, the value of earnings are low. Very few households (only 2.9 percent) earn more than the Kenyan minimum wage of 10,000 Ksh per month. SOCIO-ECONOMIC VULNERABILITY The socio-economic vulnerability of households was measured as the non-gifted household cash equivalent consumption expenditure on food and non-food items (NFIs) per capita per day, following the global Living Standard and Measurement Surveys (LSMS). This measure reflects effective purchasing power and corresponds with the units of estimation of the minimum consumption basket. The median cash equivalent consumption expenditure was 7.4 Ksh per capita per day. This was below 4 Ksh for households in Kakuma 4, South Sudanese and new 1
14 arrivals, and 16 Ksh for Somalis and 18 Ksh for Ethiopian refugees. Although not all households in the camp have the same level of vulnerability, only a small proportion (4.2 percent) would be able to sustain themselves without any assistance (valued at 77 Ksh/capita/day for a healthy food basket and essential NFIs). In addition to completely eliminating assistance, four scenarios were explored to identify whether households would be able to support themselves with some level of reduced assistance. Given current income and expenditure patterns, only 5.7 percent could cover all their food needs, 9.1 percent half food and all NFIs, 15 percent half food and 31 percent all NFI needs from their own resources. TARGETING From focus group discussions with community leaders, there was a general sense that refugees are all the same, and any form of reduced assistance to certain groups (herein referred to as targeting out) would be generally opposed by the majority of the camp population. Rather, community leaders suggested that the general population should continue to receive the same amount of assistance, and vulnerable groups should receive more (hereafter referred to as targeting in). Four targeting mechanisms community-based targeting, categorical targeting, proxy means testing and self-targeting were explored for both targeting in and targeting out options and compared to the status quo of blanket assistance (inclusion error of 4.2 percent (proportion of households selected for assistance that do not require it) and exclusion error of 0 percent (proportion of households that need assistance that are excluded)). Community-based targeting relies on the knowledge of community leaders to identify households that do not need assistance. However, in Kakuma Camp, leaders knowledge of the households in their blocks is far below the level needed for this targeting strategy to work properly. Even for households they knew, community leaders were not able to accurately distinguish between households that do and do not need assistance. As such, communitybased targeting would not be an effective targeting technique in Kakuma Camp. The simplest and most common method of targeting, categorical targeting relies on using a household characteristic to identify a group for targeting in or out. Of the categories tested, only targeting out of households with a business from all or part of the assistance resulted in errors considered acceptable by WFP standards (inclusion error of 2.9 percent and exclusion error of 6.9 percent for full reduction in assistance). Proxy means testing can be seen as an extension to categorical targeting and involves using regression analysis on several household characteristics to identify vulnerables and nonvulnerables. After testing several models on multiple datasets and against varying thresholds, the Extremely Randomised Trees model, a machine learning model, produced the best results (inclusion error of 1.6 percent and exclusion error of 4.3 percent using a set of 12 household characteristics against a threshold of a full reduction in assistance). Although both mechanisms offer errors considered acceptable by WFP, the continuation of blanket coverage is preferable, as it complies with the do no harm principle, tends to minimise overall errors and has no costs of implementation. 2
15 Together with continuation of blanket coverage, allowing refugees the option to self-target out of assistance by offering incentives to business owners or increasing incentive pay could be explored further. ADDITIONAL FINDINGS In addition to addressing the primary objectives of the study, this research revealed several unexpected findings. First, unless a household updates its status on the UNHCR database voluntarily, the ration card received upon arrival to the camp remains the unit for which all assistance is delivered and all statistics are reported. However, the reality is that after arrival, many ration cards join together to form larger family units. This has implications for the UNHCR demographic statistics, and a household census should be conducted to update the database. Second, several groups that are typically perceived as vulnerable are not necessarily as vulnerable as previously expected, or vice versa. For instance, while households with a disabled member or head are traditionally considered to be more vulnerable than the average population, their median cash equivalent consumption expenditure is actually higher than the sample median. Household size 1s are also typically perceived as a vulnerable group. However, the median cash equivalent consumption expenditure for household size 1 is more than twice the average. Similarly, three times more household size 1s would be able to support themselves in the absence of food and NFI assistance than the average household. A more detailed analysis of household size suggests that vulnerability actually increases as households get larger, such that households with more than 10 members are most vulnerable. Finally, there is a common conception that there is a negative linear relationship between vulnerability and year of arrival; that is, households that have arrived recently are most vulnerable, while households that have been resident in the camp longest should be able to support themselves. However, the results suggest that vulnerability may follow more of a U shaped curve; although recent arrivals demonstrate the highest levels of vulnerability, households that have been resident in the camp for a medium term (between 6 20 years) appear to have lower levels of vulnerability than the most long-term residents. CONCLUSIONS AND FUTURE RESEARCH The findings from this study support the continuation of blanket coverage of assistance in Kakuma Refugee Camp. Furthermore, unless there is a major change in policy that would give refugees greater freedom to own livestock or to move freely to establish businesses and livelihoods outside of the camp, these refugees will continue to need high levels of assistance. Given the unique context of the camp (restrictions mentioned above, the harsh climate of Turkana, the remote location of the camp and the protracted nature of the settlement), this recommendation does not necessarily preclude the possibility that targeting may be an effective strategy in other refugee settings. 3
16 Although both the household survey and the community-based targeting exercise included questions on remittances, still little is known about this sensitive, but important, income source that contributes roughly one-third of the cash income to the camp s economy. We suggest an updated and focused review of the sizes, sources, uses and mechanisms for transfer of remittances in the context of refugee camps as an expansion of, and update to, Professor Oka s previous work in this area. 4
17 1 INTRODUCTION The scoping report conducted for the first phase of this study into understanding the vulnerability profiles and livelihood opportunities in the Kakuma Refugee Camp involved a mixed method approach including a review of the literature, stakeholder interviews, focus group discussions and semi-structured interviews with refugees and quantitative analysis of secondary data (Guyatt, 2015). This exercise provided qualitative and quantitative contextual background information related to the context of this study, an understanding of how to sample for the household survey and relevant questions that should be addressed in the household survey. Importantly, it highlighted key legal constraints that refugees in Kakuma face that can severely restrict their ability to access livelihood opportunities and prevent them from becoming selfsufficient. For example, although refugees in Nairobi can request a Class M work permit, those in Kakuma cannot apply for work permits, only alien cards and business licenses, where applicable. Similarly, Kakuma refugees are only allowed to travel for business purposes and to do so requires a movement pass, which allows them to exit the camp for a maximum of 30 days (Republic of Kenya, 2006). As a final example, although many of the refugees in Kakuma were pastoralists before arriving in the camp, grazing animals outside the confines of the camp is forbidden (Jamal, 2000). The aim of this second phase was to use the information collected in the scoping exercise and the results of the household survey to provide the three main deliverables: 1. Investigation into the types of livelihood activities households are currently engaged with, their sustainability and the legal aspects for expanding these. 2. Precise quantitative data on of the levels of socio-economic vulnerability in refugee households using standard, internationally recognised measures of poverty and vulnerability, including the ability of households to pay for necessities, and the reasons behind these differences. 3. Assess possible approaches to targeting and the feasibility, appropriateness, cost, benefits and potential risks (including political and security implications and inclusion/exclusion errors) of different targeting methodologies. These three issues will now be addressed in turn, following some details on the household survey itself. 5

18 2 THE HOUSEHOLD SURVEY A total of 2,000 households (500 in each of the four sub-camps Kakuma 1, 2, 3 and 4) were interviewed during the months of November and December The sample size was designed to capture the major heterogeneities in household characteristics and to enable a vulnerability profile of consumption and expenditure patterns across the camps to be established. It was derived through calculations based on several potential drivers to socioeconomic vulnerability (see Annex 1). This covered a population of 13,378 people, 63 percent of which were children (<18 years of age). The current camp population in November was estimated to be 182,986 (UNHCR, 2015), so this survey represented approximately 7.3 percent of the camp. All of the 126 administrative blocks in the camp were sampled, making this one of the most comprehensive studies on the livelihoods, wealth and vulnerability of the Kakuma refugee population. The 2,000 households sampled across the camp are shown in Figure 1. Figure 1: The Location of the 2,000 Households Sampled across Kakuma Refugee Camp There were more blocks in Kakuma 1 (42) and Kakuma 3 (39) than in Kakuma 2 (19) and Kakuma 4 (26), so the number of households sampled per block in each sub-camp were adjusted accordingly (see Table A1, Annex 1). Households were randomly sampled within each 6
19 block, and representatives from each country of origin (Somalia, South Sudan, Sudan, Ethiopia, Rwanda, Burundi, Uganda and the Democratic Republic of the Congo (DR Congo)) were interviewed. This covered a total of 87 languages, the most common being Nuer, followed by Somali and then Dinka. Concurrent with the start of the survey, UNHCR permanently relocated 4 blocks from Kakuma 2 to Kakuma 3 due to safety issues linked to their location and an associated risk of flooding. These households were provided with tents for their new locations. The relocation did not interfere with the data collection process. However, for the purposes of the sampling and analysis, these households are assumed to be in Kakuma 2, as their behaviour and livelihoods reported in the survey relate to their residence in this camp. The leaders of each block were revisited in January 2016 to quantitatively test a communitybased targeting methodology and to collect qualitative data from focus group discussions. The focus group discussions focused on the feasibility of different targeting approaches and options for expanding livelihoods, including resettlement elsewhere in Turkana and improved access to credit or loans. The tools and approach for this are summarised in Annex DEFINITION OF A HOUSEHOLD AND MULTIPLE RATION CARDS Ration cards are administered on arrival to the camp, and unless a household s status is updated voluntarily onto the UNHCR database, these remain the unit for which all assistance is delivered and all statistics are reported. However, the reality is that after joining the camp, many ration cards join together to form larger family units. Following standard practice, our definition of a household was those that eat and sleep together. The difference in household definitions has important implications on all household level statistics, from demographics to measures of vulnerability. Our sampling of the Kakuma refugee population showed that more than a quarter (27 percent) of the 2,000 sampled households had more than one ration card. As a result, the 2,000 households we sampled actually correspond to 2,838 ration cards. Seventeen individuals did not have a ration card but had joined a sampled household. The joining together of ration cards into larger family units was more common in Kakuma 1 (36 percent) than Kakuma 4 (17 percent), presumably as households in Kakuma 1 tend to have been resident in the camp for longer and have had more time for groups of family members that have been separated to arrive at the camp and join up. Based on the prevalence of households with multiple ration cards throughout the camp, we conducted additional analysis, to the extent possible, at the ration card level and found that nearly half (48 percent) of all of the ration cards sampled in our survey had joined with at least one additional card. 1 1 For the sake of clarity, in reporting statistics in this section, we will refer to measures with units based on the UNHCR definition as ration cards and to measures with units based on the definition of those eating and sleeping together as households. 7
20 An important implication of the joining up of ration cards is that the characteristics of the households sampled are different from those in the UNHCR database with respect to the head of household characteristics and household size (see Table A2, Annex 1). The percentage of child-headed households and household size 1 are markedly lower in the survey than in the UNHCR database. Only 1.2 percent of sampled households were child-headed compared to 7.6 percent in the database, and only 5.1 percent were a household living by themselves compared to 33 percent as defined by UNHCR. This illustrates the fact that many registered household size 1s and child-headed households are joining up with other ration card holders. In fact, in our survey, 82 percent of ration card size 1s had joined up with other ration cards. Of the 167 childheaded ration cards, 85 percent had joined up with other households. In addition, 51 percent of male-headed ration cards joined up with other households in the survey. Interestingly, although we also observe that 45 percent of female-headed ration cards 2 joined up with other households, the overall percentage of female-headed households remains roughly the same whether using our household definition or the ration card definition. This is likely due to the fact that many of the adult female-headed ration cards who are joining up tend to join with other adult female-headed ration cards (34 percent) and/or have adopted children (3.9 percent), meaning that they remain the head of household. Further investigation into the characteristics of those households with more than one ration card showed that there are a range of different family unit combinations. Nearly half of ration card size 1s are young adult males (46 percent are males aged between 18 and 29) who either join other family members or join up with each other to share resources and live together. Across our sample, it was also common for child-headed ration cards to join up (85 percent). Although 51 percent of these joined ration cards with an adult male head and 44 percent joined ration cards with an adult female, the remaining 5.6 percent (representing 8 ration cards) of childheaded ration cards joined together. Box 1 provides some examples of common cases in which ration cards joined up to form larger family units, captured as households in our sample. This definitional issue is not just one of semantics, as households have recently been targeted for assistance based on the demographics recorded on the UNHCR biodata (thus, following our terminology above, at the ration card level). For instance, UNHCR reported that they often target female-headed households with NFIs, and the relative food allocations (in-kind and cash transfers) were recently differentiated according to ration card size. From November 2015, ration card size 1 received 500 Ksh from the Bamba Chakula scheme compared with 300 Ksh per beneficiary for ration card size 2 and 200 Ksh per beneficiary for all other household sizes. In terms of the overall food ration, only ration card sizes 1 and 2 were receiving the full ration in November Ration card size 3s received 85 percent and household sizes 4+ experienced a 30 percent reduction. 2 Note: Our definition of female-headed households includes child-headed households that are headed by a female. 8
21 Box 1: Frequently Observed Ration Card Groupings Case Study 1: Ration card size 1 1. One household in Kakuma 3 consists of eleven young single men, aged between 20 and 28. Between them, they have nine ration cards. The individual reported as head of household is a 23-year-old male who shares a ration card with his brother. A second ration card consists of one of the head of household s brothers as well as an unrelated 23-year-old. A third ration card is held by another of the head of household s brothers (ration card size 1). The remaining ration cards are all ration card size 1. One is held by an other relative; the rest are not related to the head of household. The household reportedly arrived from Sudan in 2013, but because country of origin and year of arrival were collected at the household level and not at the ration card level, it is not certain that all of the ration cards arrived at this time and from the same country. 2. A household in Kakuma 1 consists of four ration card size 1s. All are males aged between 27 and 41. None of them are related. One is single while the others have been separated from their wives. The household reportedly arrived in 2013 from Ethiopia, although it is not certain that this is true for all four individuals or just for the person reporting to be the head of household. 3. A household in Kakuma 2 consists of three brothers, aged between 23 and 29. The household reportedly arrived in 2000 from Sudan. However, given that each brother is on his own ration card, it is quite possible that they arrived at different times. Case Study 2: Child-headed ration cards 1. A household in Kakuma 1 consists of three ration cards that have joined together. The individual identified as the head of household is a 21-year-old lady who arrived from Sudan in She shares a ration card with her two children, aged 2 and 6, and another relative, aged 14. The other two ration cards that have joined her are relatives. One is a 19-year-old ration card size 1. The other is a child-headed ration card, consisting of four individuals, aged between 15 and A household in Kakuma 2 also consists of three ration cards that have joined up. The primary ration card is a family unit that arrived in 2013 from South Sudan. The head of household is a 27-year old married lady whose husband is not resident in Kakuma Camp. However, two of her in-laws (widowed women, aged 45 and 65) and three of her children (ages 2, 5 and 9) share her ration card. She has taken in two young women, ages 15 and 18, each of whom has her own ration card. Case Study 3: Female-headed ration cards 1. A household in Kakuma 2 consists of seven members and two ration cards. A 30-year-old male ration card size 1 is described as the head of household. The other ration card consists of his wife and six children, aged between 2 and 12. Although the second ration card would be considered as a female-headed household on the UNHCR biodata, in our survey, the household is identified as a male-headed household since they all sleep and eat together, operating as a family unit. The household is described in the survey as having arrived from DR Congo in However, it is likely that the wife and children arrived at a different time than the husband, which resulted in them being on separate ration cards. 2. A household in Kakuma 1 consists of five members of a nuclear family from Ethiopia. However, the family has two ration cards. The husband and two children, a 2-year-old and a new-born, are listed on one, while the wife and another child, aged 3, are listed on the other. Again, while the survey indicates that they arrived in 2009, it is likely that they arrived at different times, each acquiring a separate ration card upon arrival, and were later re-united. 9
22 2.2 HOUSEHOLD CHARACTERISTICS OF THE SAMPLE POPULATION Most of the respondents were the head of household (80 percent; see Table 1). Given that most households consist of multiple ration cards, household sizes can be large, with up to 30 members (average 6.7, median 6). A fifth of all households had transferred from Dadaab, and most of these (54 percent) reside in Kakuma 3. There are a number of other key robust characteristics of households that may be important variables in the analysis. The first is the location of the household. Each of the four sub-camps in Kakuma Refugee Camp is markedly distinct in its geography, population density and market opportunities. The sub-camps are numbered according to the order in which they were opened, with Kakuma 1 being the oldest sub-camp and Kakuma 4 the newest. There are marked differences between the sub-camps, with Kakuma 4 being particularly notable. Its residents have the smallest social networks, measured as the proportion of households with friends or relatives either resettled (8.2 percent) or living outside the camp in Kenya (10 percent). Similarly, it has the lowest mobile phone ownership (56 percent). Only 35 percent of its households have a fenced property compared to 83 percent of households in Kakuma 1. Interestingly, a quarter of households in Kakuma 4 grew their own vegetables, though almost exclusively for their own consumption. Table 1: General Household Characteristics by Sub-camp Variables Household composition Social networks Proportion of households with head of household as respondent K1 (n=500) K2 (n=500) K3 (n=500) K4 (n=500) Total (n=2000) 81% 74% 70% 93% 80% Mean household size (maximum) 7.3 (30) 6.8 (18) 6.9 (18) 5.8 (24) 6.7 (30) Proportion of households with more than one ration card Proportion of households transferred from Dadaab 36% 30% 23% 17% 27% 13% 25% 44% 0.2% 21% Proportion with friends or relatives resettled 23% 19% 19% 8.2% 17% Proportion with friends or relatives outside the camp in Kenya 16% 16% 16% 10% 14% Common household characteristics Proportion of households with a fence around their property Proportion of households who grow veg. (Sell veg.) 83% 71% 71% 35% 65% 8.2% (2.0%) 16% (1.8%) 16% (1.4%) 24% (1.4%) 16% (1.7%) Proportion of households with a mobile phone 83% 86% 81% 56% 77% The second important variable is country of origin. The survey sampled the eight main countries of origin in the camp: South Sudan (46 percent), Somalia (33 percent), Sudan (4.9 percent), DR Congo (7.5 percent), Ethiopia (4.1 percent), Burundi (3.7 percent), Rwanda (0.2 percent) and 10
, suggesting that when households join up,")

. Comparatively, Kakuma 2 had representatives from all of the major groups; the demographic composition being 50 percent Somali, 17 percent")

23 Uganda (0.3 percent). This was similar to the country of origin profile from the UNHCR database (see Figure A1, Annex 1), suggesting that when households join up, they join with households from the same country of origin. However, the distribution of countries of origin varies markedly across the four sub-camps. For example, 91 percent of households in Kakuma 4 were South Sudanese and none (at least in our sample) were Somali or Ethiopian (see Figure 2). Comparatively, Kakuma 2 had representatives from all of the major groups; the demographic composition being 50 percent Somali, 17 percent South Sudanese, 14 percent Congolese (DR Congo), 8.2 percent Ethiopian, 6.0 percent Burundian, 3.8 percent Sudanese and 0.2 percent each Ugandan and Rwandan. Given the small proportion of Ugandans and Rwandans in the camp, it is notable that the survey captured households from both countries. However, given the small sample size from each, even after combining them into an other category, statistics for this group cannot be considered representative. Figure 2: Proportion of Households from each Country of Origin by Sub-camp 11
24 Preliminary household characteristics also varied by country of origin (see Table 2). Somalis and Ethiopians had most access to livelihood opportunities through friends and relatives resettled, and within Kenya, as well as access to mobile phones. Households from Burundi showed markedly different characteristics than those from other countries of origin, as only 10 percent had multiple ration cards (suggesting families tend to arrive together and few join up with other family units). Burundians also have the fewest relatives or friends resettled abroad or living elsewhere in Kenya. Far more households from Burundi grow their own vegetables (nearly half) compared to the rest of the households. Table 2: General Household Characteristics by Country of Origin Household composition Social networks Common household characteristics Variables Proportion of households with more than one ration card Mean household size (maximum) Proportion of households transferred from Dadaab Proportion with friends or relatives resettled Proportion with friends or relatives outside the camp in Kenya Proportion of households with a fence around their property Proportion of households who grow vegetables (sell vegetables) Proportion of households with a mobile phone Somalia (n=666) South Sudan (n=923) Sudan (n=97) Ethiopia (n=82) Burundi (n=73) DR Congo (n=150) Other (n=9) 27% 25% 39% 32% 10% 31% 33% 7.0 (22) 6.8 (25) 6.2 (30) 5.7 (12) 4.8 (11) 6.7 (28) 4.1 (11) 58% 0.5% 1.0% 24% 0.0% 0.0% 0.0% 30% 11% 13% 16% 6.8% 7.3% 22% 25% 10% 9.3% 16% 1.4% 5.3% 0.0% 87% 49% 74% 83% 40% 64% 89% 5.9% (0.9%) 19% (1.6%) 16% (2.1%) 10% (0.0%) 47% (6.8%) 29% (3.3%) 22% (0.0%) 93% 64% 71% 87% 67% 85% 78% The other key robust variable is the year of arrival. This is important, as it reflects how long refugees have been resident in the camp, and therefore how long they have had to establish a livelihood. In most of the analysis, we explore the differences between those who arrived in 2014 or 2015, which we deem recent arrivals and those that arrived before However, in Section 5.5, we conduct a more disaggregated analysis of arrival status. Year of arrival is closely related to country of origin and sub-camp (see Figure 3). For example, 70 percent of households that arrived since 2014 reside in Kakuma 4. Similarly, year of arrival is reflective of the status of recent and on-going conflicts in the region, as 58 percent of South Sudanese, 27 percent of Burundians, 26 percent of Sudanese, 16 percent of Congolese, 11 percent of Ethiopians and 1.7 percent of Somalis living in the camp are new arrivals (in other words they arrived from 2014 onwards) 12

25 Figure 3: Distribution of New Arrivals by Country of Origin and Sub-camp Some refugees have been resident in the camp since it opened in Figure 4 illustrates the frequency distribution of the sampled households duration in the camp. Although some households have been resident in the camp for over 20 years, this proportion is small (2.4 percent) and most (79 percent) are South Sudanese. Eighty-five percent have resided in the camp for 10 years or less and more than half of the households currently in the camp arrived in the past five years. Most recent arrivals (again, those that arrived in the past two years) were from South Sudan. Most Somalis (57 percent) entered the camp in Most Ethiopians (43 percent) arrived during the period , with an additional wave of 29 percent in Most of those from Sudan (65 percent) arrived in the last five years ( ). Figure 4: Years since Arrival in the Camp (By Main Country of Origin) 13
26 The data on livelihood activities and income (Section 3) and vulnerability (Section 4) will be disaggregated by these three main variables sub-camp, country of origin and arrival status. Section 5 will explore the livelihoods, income and vulnerability of specific sub-groups: femaleand male-headed households, households with a disabled or elderly member or head of household, households with and without business and employment, as well as offer disaggregation by household size and a more detailed exploration of arrival status. 14
27 3 LIVELIHOOD ACTIVITIES AND INCOME This section addresses the first deliverable, an investigation into the types of livelihood activities that households are currently engaged with. This is complemented by the data collected on income over the past month. The stakeholder interviews, focus group discussions and the review of the literature and secondary data during the scoping exercise provided some useful insights into the livelihood and income opportunities available to the refugee population in Kakuma. One of the key researchers in this area has been Professor Oka, who published a number of papers documenting the sources and availability of cash for refugees in the camp over a period of five seasons between 2008 and 2011 (Oka, 2011; 2014). Through interviews with traders, retailers and refugees, he established that 56 percent of cash used by refugees came from remittances, 19 percent from employment in the commercial sector or relief agencies and 25 percent from the sale of relief packages on the black market. A more recent survey of income and livelihoods in 2012 suggested that the main source of income was from employment or business (90 percent) (Ochieng, 2013). Only 3 percent of households reported having no income, and 44 percent reported earning 5,000 Ksh or more per month. However, this was based on a sample of 139 refugee households and it is uncertain how representative this was of the entire camp population. Furthermore, there have been marked changes in the composition and number of refugees in the camp over the last three years since this survey took place, and its applicability to Kakuma in 2015 is questionable. Unlike other refugee camps where agriculture and livestock rearing can be major livelihoods (UNHCR/WFP, 2012), the restrictions on livestock ownership and the scarcity of water limit these activities in Kakuma. During the scoping exercise, households reported that despite repeated attempts at growing vegetables in their gardens, they often failed. The household survey found that 16 percent of households in the camp grow vegetables, but only 1.7 percent of households sell vegetables as a source of cash income. A Somali Block Leader from Kakuma 2 (between years old, arrived >10 years ago) also suggested that horticulture does not offer extensive market opportunities, as households would not be able to sell their produce because everyone would be growing the same vegetables. The sub-camp that offers the best opportunities for horticulture is Kakuma 4, as it has more land available to households. However, it also suffers from more intense water shortages. In general, when considering farming and animal husbandry as potentially livelihoods, both the scarcity of natural resources and the existing tension with the host community are limiting factors. During the focus group discussions, the issue of security, particularly with regards to women collecting firewood, was repeatedly mentioned. Given that it has been well established that agricultural production can promote self-sufficiency and local integration (Betts, 2004), one might expect that resettlement to another area in Turkana, where refugees could engage in agricultural activities, to be welcomed. However, concerns were raised during the focus group discussions about how feasible it would be to undertake sustainable and significant agricultural production elsewhere in Turkana, given the low productivity of the land and water problems. 15

28 3.1 INCOME SOURCES Income sources are important determinants of the sustainability of a household s the cash flow. The interviews with key stakeholders and refugees during the scoping exercise showed that there are opportunities for refugees to earn money in the camp through running a business, by working for a non-governmental organisation (NGO) as an incentive worker and via skilled and unskilled jobs around the camp. Although some wage rates for incentive and casual workers were available, it was unclear how important this source of income was in the camp and how many refugees obtained income from this. However, anecdotal evidence suggests that wages paid to incentive workers vary substantially depending on the organisation. Another important source of income was thought to be resale of the food ration, and although this is thought to be undertaken by 10 percent of households, the exact amounts cashed in are uncertain. The opportunity to earn income from outside the camp are extremely limited, and although remittances have been thought to be an important contributor to household income for refugees, the precise amounts and importance are unclear. In the household survey, households were asked about their sources of income over the past 30 days. We begin by looking at the total income across all households surveyed, which was 3,284,610 Ksh 3 for the previous month. Of this, the three main sources were gifts outside the camp (remittances, 29 percent), regular employment (36 percent) and from running a business (20 percent) (Figure 5; Table A4, Annex 3). Reselling the ration and selling other items together constituted only 3.5 percent, while petty jobs was 8.4 percent and gifts within the camp was 4.1 percent. Figure 5: Sources of Income, of those Reporting Earning Income over Past Month 3 Fifty-eight households reported having a business but the value of their income from the business was not recorded. Similarly, 38 households reported having employment, but the income from employment was not recorded. To calculate the value of business and employment income across the camp, we interpolated the value of income for these 96 households by using the median income reported by those households with each source (5,000 Ksh for employment and 3,000 for business). 16

29 We then explored income at the household level. Although the total income listed above may seem high, it is very unevenly distributed within the camp. In fact, 68 percent of households reported not receiving any income. Of the remaining 32 percent reporting some level of income, only 8.0 percent received income from at least two sources (see Table A5, Annex 3). Examining each source individually 4, we found that only 10 percent of all households received income from employment, only 6.0 percent of households stated that they received remittances from abroad or outside the camp and only 8.2 percent of households ran a business (see Figure 6). While re-selling the ration is quite common (9.6 percent), it is not a lucrative opportunity (see Figure 7). Looking at the country of origin bands for each source in Figure 6 primarily shows the country of origin composition of the sample. For instance, of course most sources are primarily comprised of Somalis and South Sudanese, as these were the most heavily sampled countries of origin. However, comparing the country of origin bands across sources reveals some interesting observations (further disaggregation is also available in Table A4, Annex 3). For instance, a notably high proportion of Congolese reported income from employment (31 percent). Remittances are particularly common among Somalis (12 percent) compared to other ethnic groups (<5 percent of Ethiopians, Sudanese, South Sudanese, Congolese and Burundians). Business is particularly common among Burundians (18 percent), Ethiopians (16 percent), and Somalis (15 percent) compared to 8.2 percent of Sudanese, 6.0 percent of Congolese, and only 2.2 percent of South Sudanese. Reselling the ration was the most common source of income for South Sudanese. Figure 6: Proportion of Households Sampled Reporting Income by Source 4 There were 96 households who had reported receiving income from employment or business but who did not give the amounts received. In the previous analysis that assessed the contribution of different income sources to overall camp income, the household median for those with data was applied. However, in the following detailed analysis these 96 households are excluded as missing data. 17
30 Only 2.4 percent of those that arrived in the last two years reported a value of cash income from employment compared to 10 percent of those arriving before Again, only 2.4 percent of new arrivals reported a value of cash income from business compared to 8.3 percent of earlier arrivals. As can be seen from Figure 7, the range of incomes was wide, with some receiving as little as 20 Ksh per month (usually from resale of the food ration) and others as much as 88,000 Ksh from a combination of sources. Only 8.9 percent of those with an income (only 2.9 percent of the total sample) received >10,000 Ksh cash income per month. The income sources earning households the greatest amount of income on average were employment and remittances (both offering median incomes of 5,000 Ksh per month) and businesses (median income of 3,000 Ksh per month). Still, the range of incomes earned from these sources was large, with employment earnings ranging from 100 to 58,000 Ksh, remittance income from 50 to 54,000 Ksh and business earnings from 200 to 30,000 Ksh. Figure 7: Minimum, Median and Maximum Income per Month by Source Figure 8 shows the full distribution of incomes during the previous month from business (Figure 8a), employment (Figure 8b) and remittances (Figure 8c). All are highly skewed, with most households earning small amounts and a few households earning very large amounts. For example, of those households reporting income from a business in the last month (125 households), only six of them (4.8 percent of those with a business; percent of all households) earned more than 10,000 Ksh. Of these, four were Somali, though the highest earning household was a Sudanese that had arrived in 2011 and was living in Kakuma 3 and had earned 30,000 in the last month. Similarly, only 10 of the 149 households that reported earning income from employment reported earnings of at least 10,000 Ksh (6.7 percent of those 18
31 with employment; percent of all households). The top two earners were one household (Sudanese, arrived in 2012, living in Kakuma 3) that reported an employment income of 38,400 Ksh and another (South Sudanese, arrived in 2004, living in Kakuma 2) with an income of 58,000 Ksh. Remittance income followed a similar pattern, with only 3 of the 119 remittance recipients (2.5 percent of those with a remittance income; percent of all households) receiving more than 20,000 Ksh over the past month. All of these were Somali. One was living in Kakuma 1 while two were living in Kakuma 2. One was a recent arrival. This wide variation in cash received from a business or from remittances suggests that targeting out based on this criterion would not work well. (a) From a business 5 (b) From employment 6 5 Thirty-eight households that reported having a business did not report earning an income from a business in the last month. 6 Fifty-eight households that reported having work did not report earning an income from employment in the last month. 19
32 (c) From remittances Figure 8: Distribution of Income per Household over the Previous Month by Source The wide variation in business income is also supported by income data sourced from the 198 traders in the Bamba Chakula programme, which started in August Although the median average monthly income for Bamba Chakula traders was approximately 65,000 in November 2015 and 204,000 in December 2015 (mean of 86,000 and 290,000 respectively), this ranged from as little as 150 Ksh to nearly 3,500,000 Ksh. Of the top 10 earners over the period November December 2015 (earning more than 990,000 Ksh across November and December), detailed demographic data were available for nine. Seven were male, though their nationalities were surprisingly diverse: three Somali; three Sudanese; and one each Burundian, Ethiopian and Kenyan. They represent trade across the camp, with three trading in Kakuma 1, four trading in Kakuma 3 and one each trading in Kakuma 2 and Kakuma 4. It is important to note that the household survey income information was recorded for the month prior to the interview date. In most settings, this would be an accurate measure of regular monthly income. However, in the refugee camp where many employment opportunities are irregular and receipt of remittances can be highly seasonal (for example, corresponding with certain festivals or holidays), these figures cannot be relied on to be representative of regular income sources. In fact, this issue was raised during the focus group discussions, in which community leaders stated that remittances and other forms of income, such as casual employment, are not stable and regular enough to guarantee a household s survival for extended periods of time. 20
.")
33 3.2 LIVELIHOOD OPPORTUNITIES ACTIVITIES AND EMPLOYMENT Although more than 50 percent of households are likely to have been involved in some sort of agriculture or pastoralism, before they arrived in Kakuma Refugee camp, 48 percent of households reporting either farming or livestock rearing as their previous primary source of livelihood (see Figure 9). These activities were reported by 60 percent of Burundians, 56 percent of South Sudanese, 54 percent of Sudanese and 52 percent of Congolese. This compares to only 35 percent of Somali and 42 percent of Ethiopian households. There were no major differences between those arriving before and after Figure 9: Main Livelihood Activity before Arrival Given the scarcity of land and water as well as the legal constraints to livestock ownership, farming and livestock rearing are both unlikely to be livelihood possibilities for those now in the camps. Community leaders raised this as a specific issue in the focus group discussions held in January 2016 (see Annex 2). Most community leaders did not believe that people would be willing to relocate elsewhere in Turkana, even if offered land and agricultural inputs for free, mostly. Their rationale was that farming cannot be considered to be a sustainable activity anywhere in Turkana due to the harsh climatic conditions, where agriculture is dependent on irrigation. After farming, the other high frequency previous livelihood was unskilled labour (22 percent). Only 8.0 percent of households had previously been in business. The countries with the highest proportions of people with businesses prior to arrival were Somalis (13 percent), Congolese (12 percent) and Burundians (10 percent), compared with Ethiopians (6.1 percent); South Sudanese (4.8 percent); and Sudanese, Rwandans and Ugandans (0.0 percent). There were no significant differences in prior business ownership between new arrivals and longer term residents. Interestingly, business was also reported to be a current livelihood activity by 8.2 percent of households, although only about one fifth of these (21 percent) had stated that this was their previous source of income before they arrived in the camp. Unsurprisingly, most of the 21
34 households that currently have businesses (94 percent) are in Kakuma 1, 2 and 3, and most (91 percent) arrived before Of those in our household survey with a business and details on the type of activity, 7 most were shops/kiosks/hawkers (85 percent), but others included services such as barbers, boda boda drivers and tailors. Most were not jointly owned (85 percent) and over half had been in operation for only one year or less. Only 5.7 percent of businesses (9 households in the sample) reported employing staff. Only 17 percent reported paying rent, the value of which ranged from 300 Ksh to 20,000 Ksh per month. Most business owners started with savings they had earned in the camp (45 percent), while 25 percent started with a loan (in some case this entailed receiving the goods on credit and repaying the value once they were sold; see Table A6, Annex 3). About a fifth (19 percent) started their businesses with gifted funds. However, this varied markedly by sub-camp, with most Kakuma 1 and 3 business owners relying on savings earned in the camp (64 percent and 50 percent, respectively), compared to most Kakuma 2 business owners, who relied on loans (50 percent) and gifts (26 percent). Of the nine businesses reporting details in Kakuma 4, start-up funds tended to come from gifts (three businesses) and savings (two from before arriving in camp, two earned in camp). Savings earned in the camp was the most common start-up funding source for businesses from all countries of origin, though loans were a particularly notable source for Somalis (32 percent) and accessed by about one-quarter of Ethiopian and Burundian business owners (although the sample sizes for each were quite small, with 13 business owners from each country). As expected, it appears that longer term residents are able to rely more on savings earned in the camp than new arrivals (46 percent compared with 33 percent). Importantly, across the 157 households, only four started their business by selling assistance (ration or Bamba Chakula) or assets. Sixteen percent of households reported having at least one person in the household that was employed. Of these, 5.7 percent had more than one person employed. However, when reviewing the data, it appears that this low percentage of employment may be related to how the question was phrased ( How many in the household have work (incentive, regular employment, business or casual employment) ). In fact, the proportion of employment may be higher, as 44 percent of those who reported having a business and 7.7 percent of those who reported receiving income from employment reported not having work. By triangulating across variables (those reporting having someone employed, having a business and earning income from employment), we estimate that approximately 20 percent of households had at least one person employed (which we use for the remainder of the analysis on employment). We highlight this discrepancy to illustrate the potential flaws of self-reported employment and income data. Difficulties in income enumeration are part of the rationale for relying on consumption data as a proxy indicator for socio-economic vulnerability. 7 Although 163 households reported having a business, this analysis is based on 157 households, as 6 households had a business but did not give further details about the business. 22
35 3.2.2 LOANS, CREDIT AND SAVINGS GROUPS An important constraint to having a business was reported to be the lack of access to credit and start-up capital. While some NGOs working in the camp facilitate the formation of savings groups and provide some start-up capital at no interest, this type of support is not made readily available to all refugees. As a participant in the focus group discussion during the scoping exercise explained, if you just give small amounts of cash it will just be eaten (Somali male, Kakuma 1, long-term resident), raising the issue that loan amounts need to be sufficient to create a livelihood otherwise they will just be spent on food. According to the household survey, 11 percent of households reported having borrowed money over the previous month (see Table A7, Annex 3). Although the amounts borrowed varied widely, from as little as 50 Ksh to as much as 100,000 Ksh, the values tended to be fairly low, with roughly a quarter of borrowers borrowing 1,000 Ksh or less and 85 percent borrowing 10,000 Ksh or less. Taking loans is most common among Somalis (19 percent); it is also fairly prevalent among Burundians (12 percent) and Ethiopians (11 percent). Most households that borrowed money resided in Kakuma 2 (41 percent), although borrowers were dispersed through all of the sub-camps (27 percent in Kakuma 1 and 16 percent each in Kakuma 3 and Kakuma 4). Very few (only 17 percent) of those taking loans were recent arrivals. Perhaps surprisingly, only 16 percent of those that borrowed in the last month also reported owning a business. There is a correlation between the amount borrowed and certain household characteristics. For instance, all but four of the 32 households (88 percent) that had borrowed more than 10,000 Ksh were Somali, only one was a recent arrival, only one lived outside of Kakuma 1 and 2, and 11 (roughly one-third) had a business. Conversely, of the 49 households that had borrowed 1,000 Ksh or less, only 39 percent were Somali (another 39 percent were South Sudanese), one-third were recent arrivals, over half were from Kakuma 3 and 4, and only four (8.2 percent) had a business. Only two households had borrowed more than 50,000 Ksh. A Somali general store owner in Kakuma 2, who had arrived prior to 2000, had borrowed 60,000 Ksh, and a Somali tailor from Kakuma 1 who had arrived in 2011 had borrowed 100,000 Ksh. The general store owner had already been in business for nine months and the tailor had been in business for nearly three years, and both had started their businesses with loans and were thus familiar with taking on debt. Only 4.6 percent of households reported owing debts in the last month, ranging from 100 Ksh to 40,000 Ksh, with a median value of 3,000 Ksh (see Table A8, Annex 3). Of the households with debts, most (43 percent) resided in Kakuma 1 compared with about a quarter each in Kakuma 2 and 4, and only 10 percent in Kakuma 3. Only 4.2 percent of South Sudanese and 4.4 percent of Somalis owed debts compared with 12 percent of Burundians. There was no marked difference between newly arrived households and longer term residents. The community leaders interviewed during the focus group discussions expressed a general dissatisfaction with the existing loan systems available to refugees. Loans are currently given to savings groups of five people by Action Africa Help International (AAHI). The credit is provided through Equity Bank after a mandatory business training. The loans are interest-free and have a 23
36 grace period of two months. The Danish Refugee Council (DRC) also provides grants to set up businesses to groups across all of the sub-camps, but with the specific intention of targeting Kakuma 4. DRC also has a women and girls empowerment programme in Kakuma 4, whereby groups of women are trained on group savings, loans and entrepreneurship and are then given a grant of 30,000 Ksh per group. Across all sub-camps, community leaders argued that the system of group loans is inadequate. The community leaders agreed that a system of individual loans would be more appropriate for the needs of refugees. During the focus group discussions, community leaders were also asked about the existence of informal loans in the camp. Across all of the sub-camps, particularly in Kakuma 4, block leaders reported that refugees do not loan to each other, no one has a way to repay these loans SKILLS AND TRAINING Based on initial findings from the focus group discussions and interviews in the scoping exercise, the language barrier seemed to be the major constraint for refugees trying to engage in employment with NGOs. Although most organisations employ local translators to expand their outreach, this remains a significant barrier for vocational training courses and affects newly arrived refugees more than other groups. From the household survey, 67 percent of households reported that they had at least one member who could speak English. This was relatively stable across sub-camps, though notably higher in Kakuma 1 (79 percent) and lower in Kakuma 3 (59 percent). However, there is a marked difference across countries of origin. Having an Englishspeaking member was quite common among Sudanese (93 percent), Ugandans/Rwandans (89 percent) and South Sudanese (71 percent). Few Burundian households (34 percent) have an English-speaking member. There is also interesting heterogeneity among arrival groups, with roughly two-thirds of those arriving in the last 10 years speaking English compared with 81 percent of those arriving years ago and up to 90 percent of those arriving more than 20 years ago. Across all individuals represented in the survey, 28 percent are English speaking. This is strongly correlated with age, as 58 percent of youth aged speak English compared with 80 percent of year olds and 8.5 percent of year olds. It is also more common for men (36 percent) than women (20 percent) and, as expected, for youth attending school (32 percent of school attendees under age 18 compared with 1.2 percent of school attendees under age 18). Of course, the standard of this English was not evaluated, and experience in the field suggests that even when people report being able to speak English, their fluency is in fact very limited. During the scoping exercise it was discovered that many NGOs provide vocational training courses. For example, Don Bosco provides vocational training in carpentry, welding, motormechanics, tailoring, plumbing, electrical work, masonry and dress-making, as well as secretarial, computer and English courses. Other organisations that provide vocational training include the Lutheran World Federation (LWF), DRC and the Norwegian Refugee Council (NRC). Very few adults (6.3 percent) reported receiving vocational training since their arrival at the camp. Training was most common in Kakuma 1 (8.6 percent) and least common in Kakuma 3 (3.4 percent). Of the 126 households that received training, participation is highest for 24
37 Congolese (19 percent) and Rwandan/Ugandans (17 percent; four of the 24 sampled households), but notably low for South Sudanese (5.6 percent) and Somalis (3.4 percent). Participation in vocational training is slightly but not notably higher for longer term residents (6.7 percent) compared with new arrivals (5.2 percent). Training in technical skills such as mechanics, welding, plumbing, carpentry, electrical or masonry was low (1.3 percent). There does appear to be a correlation between vocational training and the ability to speak English, with 10 percent of English speaking adults completing vocational training compared to only 3.7 percent of non-english speaking adults. Most adults (89 percent) in the sample stated they had no skill or trade SOCIAL NETWORKS The social networks available to a household can have an important impact on its livelihood opportunities. Relatives and friends resettled overseas or resident in other parts of Kenya can provide financial support to start or expand businesses, and friends and relatives in the camp can help both financially and by providing job opportunities. As shown in Table 1 and Table 2, it was evident that few households had these support networks outside of the camp, and that these tended to be highest among Somalis, followed by Ethiopians, and lowest in Kakuma 4. The proportion of households with friends and relatives within the camp was also only 38 percent. This was lowest in Kakuma 3 (30 percent) and highest in Kakuma 1 (45 percent), and was higher for the countries with greater representation in the camp (Somalis, South Sudanese and Sudanese at around 40 percent), compared with those with less representation (<20 percent for Ethiopians and Burundians). All three types of social networks (inside the camp, in Kenya and abroad) were higher for households that had resided in the camp for some time than for new arrivals PHYSICAL NETWORKS One of the most obvious physical barriers to livelihood opportunities is related to location. At the broadest level, this is evident in the remote location of Turkana. At a more local level, this is evident in the analysis by sub-camp, as households in Kakuma 4 and Kakuma 3 are isolated from the business opportunities in Kakuma 1 and Kakuma 2. The largest and most established markets are located in Kakuma 1 ( Mogadishu, the Ethiopian market and Hong Kong ). Kakuma 2, 3 and 4 have smaller markets (Fuji market in Kakuma 2; the Liz Ahua market and the market by the security office in Kakuma 3; and the market in Zone 1 for Kakuma 4). Employment opportunities for refugees and access to services also depend on the physical location of NGO offices. For example, Don Bosco, the Jesuit Refugee Service (JRS), Handicap International (HI) and the International Rescue Committee (IRC), among others, have offices in Kakuma 1; The International Organization for Migration (IOM) is located in Kakuma 2; the reception centre managed by LWF is in Kakuma 3; and DRC has an office in Kakuma 4. Even though incentive workers are purposefully chosen from throughout the camp, those living in Kakuma 4 have a long way to travel to the NGO offices. This problem is exacerbated by the cost of travel: a boda boda trip from Kakuma 4 to Kakuma 1 costs 150 Ksh, while one from Kakuma 2 to Kakuma 1 costs 100 Ksh. 25
38 4 QUANTITATIVE DATA ON FOOD INSECURITY AND SOCIO-ECONOMIC VULNERABILITY This section addresses food insecurity and socio-economic vulnerability of households in terms of consumption expenditure for both food and NFIs. In our total study population of 2,000 households, 14 households were missing information on food consumption. Call-backs to these households were not successful because they had either left the camp, travelled to Nairobi or were away from their households. For this reason, the sample sizes for food consumption and related variables (Food Consumption Score, Dietary Diversity Score, consumption expenditure on purchased food, cash equivalent consumption expenditure of food from in-stock and own production, and total cash equivalent consumption expenditure) has been reduced to 494 in Kakuma 2, 496 in Kakuma 3 and 496 in Kakuma 4 (Kakuma 1 remains at 500). 4.1 FOOD INSECURITY We measure food security in terms of indicators specifically related to food consumption or coping with food stress, and estimate the Food Consumption Score, Dietary Diversity Score and Coping Strategy Index (see Annex 4). Before addressing each in turn, we first describe the food consumption patterns of the population and the data collected FOOD CONSUMPTION PATTERNS Households were asked whether they had consumed a range of 52 food items 8 covering the main food groups (cereals, pulses, fruit, vegetables, meat/fish/eggs, dairy, sugar and oil) over the previous week. The quantities and units for each item were recorded from four sources (purchased, in-stock, own production and gifted). Gifted here included assistance as in-kind or the Bamba Chakula cash assistance. In the case of purchased food items, the amount spent was also given. In the past week, 51 percent of households consumed nothing beyond the items included in the following list: maize, sorghum, wheat flour, rice, porridge, green grams, other pulses, onions, milk products, sugar, and oils and fats. This is a highly limited diet with no fruit and no vegetables aside from onions. As shown in Figure 10, this limited diet is most prevalent among households in Kakuma 4 (78 percent), South Sudanese (72 percent) and Sudanese (60 percent), and new arrivals (72 percent). 8 Maize, sorghum, millet, wheat flour, rice, pasta, bread, porridge, other cereals, potatoes, cassava, other root crops, beans, cow peas, pigeon peas, green grams, other pulses, carrots, pumpkin, other orange vegetables, sukuma, spinach, cabbage, other green leafy vegetables, tomatoes, onions, other vegetables, mangos, bananas, papaya, apples, other fruits, goats, camel, beef, chicken, other meat, liver, kidney, tilapia, omena, tinned tuna, other fish, eggs, fresh goat milk, fresh camel milk, processed milk, powdered milk, other milk products, sugar, oils/fats/butter, and salt. 26
.")
39 Figure 10: Households Consuming a Limited Diet The remaining 49 percent of the population were consuming at least one other food item (see Table A9, Annex 4). For example, 16 percent reported consuming animal proteins (goat, camel, beef, chicken, other meat, liver, kidney, tilapia, omena, tinned tuna, other fish or eggs). However, this varied substantially according to sub-camp, country of origin and arrival status, with only 2.6 percent of Kakuma 4 households, 4.3 percent of South Sudanese and 3.8 percent of new arrivals consuming animal proteins. Goat was the most popular animal protein although it was only consumed by 5.7 percent of households. While 28 percent of households consumed vegetables other than onions (though, again, fewer among Kakuma 4 residents, South Sudanese and new arrivals), the majority were consuming tomatoes (19 percent of households). No other vegetable was consumed by more than 7 percent of households. Fruit consumption was notably low across the whole camp only 1.1 percent reported consuming any fruit at all over the previous week FOOD CONSUMPTION SCORE The Food Consumption Score is based on the frequency of consumption for 15 food groups over a 7 day recall period (see Table A10, Annex 4). Details on the calculation are given in Annex 4.2. Overall, 42 percent of the camp had acceptable food consumption, leaving the majority of households (59%) with either poor or borderline consumption (see Table A11, Annex 4). The food consumption scores did not vary substantially by sub-camp. They differed only slightly for year of arrival, with more households that arrived prior 2014 having an acceptable score (45 percent compared to 37 percent of new arrivals) and more new arrivals with borderline scores (37 percent compared to 30 percent of longer term residents). The interesting 27

40 variation was by country of origin, with Somalis clearly doing better than households from other countries of origin (see Figure 11). Figure 11: Food Consumption Score Results by Country of Origin More detailed analysis by gender of head of household, disability status, business ownership and employment and household size can be found in Section 5 and in Annex DIETARY DIVERSITY SCORE The average Dietary Diversity Score is calculated as indicated in Annex 4.3. It reflects the number of food groups out of a total of seven (sugar not included) that have been consumed over the previous week (see Table A10, Annex 4). The mean dietary diversity score for all households in the camp was only 3.1 (see Table A12, Annex 4). Across the sample, 89 percent of households had a low dietary diversity score (<4.5). As was observed with the food consumption score, the lowest levels of dietary diversity were observed for Kakuma 4 (98 percent low dietary diversity score), South Sudan (96 percent low dietary diversity score) and new arrivals (97 percent low dietary diversity score). Disaggregations for gender of head of household, disability status, business ownership and employment and household size in Section 5 and in Annex COPING STRATEGIES INDEX The Coping Strategies Index measures how households cope when faced with food shortages or lack of money to purchase food. Households are asked how many times in the previous seven days they: relied on less preferred and/or less expensive food; borrowed food or relied on help from a friend or relative; reduced the number of meals eaten per day; reduced the size of meals; and/or reduced the quantity of food consumed by adults/mothers to ensure that children had enough to eat. Seventy-nine percent of households reported using at least one of these coping strategies at least one time in the week prior to the interviews and thus faced a food shortage. The average coping strategies index across the refugee camp was 18 (see Table A13, Annex 4). It was 28
41 highest in Kakuma 2 and 4 (both reporting 19), for Burundians (21) and South Sudanese (20), and for new arrivals (19). 4.2 SOCIO-ECONOMIC VULNERABILITY AND POVERTY The study covers both food and non-food consumption, and therefore poverty is the main household metric. This is defined and measured following the global LSMS standards, using household consumption expenditure data, expressed in per capita terms. The World Bank calculates a poverty line below which people are considered to be poor. Poverty lines vary from country to country, depending on relative prices, societal norms and values and political factors. Extreme poverty lines define a state in which households are not able to meet basic needs for survival, are chronically hungry, unable to access healthcare, lack the amenities of safe drinking water and sanitation, cannot afford education for some or all of their children and perhaps lack rudimentary shelter and basic articles of clothing (Sachs, 2005). For several years, the internationally accepted poverty line was $1 a day at 2005 purchasing power parity. This was then revised in 2008 to $1.25 a day at 2005 purchasing power parity (Ravallion et al., 2008), and again in October 2015 to $1.90 using 2011 prices (World Bank, 2015). Poverty is normally defined in terms of some survival criteria, such as the amount of income necessary to acquire a minimum food calorie intake, a minimum basket of consumer goods or a level of individual welfare or utility needed to live a basic life (Wagle, 2002). Measuring poverty in the context of refugee camps presents some complexities. For example, many items are provided for free (for example, schooling, housing, part of the food basket and health services), and the value of these goods and services needs to be imputed. Moreover, there are complexities in defining a poverty line in cash terms, as markets are distorted, with extremely inflated prices for some goods and deflated prices for others. This analysis focuses on whether households could support themselves in the absence of assistance. As such, the Technical Steering Committee (TSC) for this study requested that we focus on non-gifted cash equivalent consumption expenditure. This value includes expenditure on consumable and durable NFIs 9, consumption expenditure on purchased food and the cash equivalent consumption expenditure on in-stock and own-produced food. It excludes consumption of items received as gifts or assistance, such as in-kind assistance as well as items purchased using Bamba Chakula. This choice was made because the non-gifted cash equivalent consumption expenditure reflects true purchasing power, or the opportunity cost of cash availability. The TSC further requested that we express this per capita, as this is how the minimum consumption basket is estimated. The methods used to calculate cash equivalent consumption expenditure per capita per day are more fully outlined in Annex 5.2. Although these nuances underlying the definitions of cash equivalent consumption expenditure, consumption expenditure and true expenditure should be 9 Following standard LSMS methods, items and services typically consumed within a month are classified as a consumable NFI whereas those with longer-lasting benefits are classified as a durable NFI. 29
42 kept in mind, for the sake of brevity, we refer to all of these as simply expenditure in the remainder of the report EXPENDITURE ON FOOD ITEMS (PURCHASED FOOD) Forty-eight percent of households had not spent any cash on food over the past week. This varied markedly depending on household characteristics, with 74 percent of households living in Kakuma 4 spending nothing on food compared to less than half of households from the other three sub-camps. Similarly, more than two-thirds of South Sudanese spent nothing, followed by roughly half of the Burundians and Sudanese. Only one-third of Congolese and one-quarter of Somalis and Ethiopians had not spent any cash on food during the previous week. In terms of arrival status, a much higher percentage (70 percent) of new arrivals spent no cash on food in the last week compared to those that had arrived prior to 2014 (37 percent) (see Table A17, Annex 6). For households purchasing food, the median cash expenditure was 9.3 Ksh/capita/day. This varied by household characteristics, with households spending the most being in Kakuma 1 (13 Ksh), Ethiopians (14 Ksh) and refugees that had resided in the camp since before 2014 (11 Ksh). Those spending the least, with 4.9 Ksh/capita/day were Kakuma 4 (4.9 Ksh/capita/day) and South Sudanese. New arrivals spent 5.4 Ksh/capita/day. The average cash expenditure on food was highly skewed, with a few households spending significant amounts of money but most spending little (Table A18, Annex 6). For example, one Somali family in Kakuma 1 spent 689 Ksh/capita/day nearly 75 times the median value. Although this seems quite high, it is important that only 0.7 percent of households spent more than 100 Ksh/capita/day on food. In fact, 75 percent spent 10 Ksh or less. Most low spending households were reliant on staple foods such as maize (96 percent), sorghum (87 percent), oils/fats/butter (82 percent), porridge (69 percent), other pulses (43 percent), sugar (32 percent), green grams (31 percent) and so on EXPENDITURE ON IN-STOCK AND OWN PRODUCTION The value of the in-stock and own production quantities consumed was estimated and converted to a cash equivalent. If the household had also purchased the item in addition to instock or own production, then the purchased price was used for the estimation of the cash equivalent. If not, the median price per unit, calculated across all households purchasing the item, was applied. Annex 5.3, including Table A16, provides further details on in-stock and own production consumption, as well as the cash equivalent estimation. Only a few households consumed food items from in-stock (5.3 percent) (see Table A20, Annex 6). For those with own-stock consumption, the median expenditure on in-stock food was 5.2 Ksh/capita/day. Although it may be possible that the in-stock items had been previously received as a gift or from purchase, and thus that there is a risk of double-counting, the prevalence and value are so low that the effect would only be slight. 30
43 Comparatively, only 4.5 percent of households had consumed any food items from their own production. For these households, the median expenditure on these items was very low, at just 1.3 Ksh/capita/day. Own production was comparatively quite high for households from Burundi (19 percent) and DR Congo (11 percent) EXPENDITURE ON CONSUMABLE NFIS Households were asked to record their purchase of consumable NFIs from a list of 19 items 10 over the previous month (30 days). The items correspond to the major consumable NFIs identified during the scoping exercise. The most common consumable NFI expenditures were on cooking fuel and charcoal, electricity, loan repayments, airtime, and mobile phone charging. Even though households receive firewood from UNHCR as part of their assistance package, 40 percent still purchase additional fuel. Similarly, even though households should be receiving one bar of soap per person at every food distribution, 30 percent purchased soap and detergents. These findings suggest that either the amounts provided with the distribution are not sufficient or that household preferences are not reflected in the items included in the distribution. Overall, 9.2%, of households had not spent anything on consumable NFIs over the past month (see Table A21, Annex 6). This varied markedly depending on household characteristics, with 19 percent of households living in Kakuma 4, 15 percent of South Sudanese and 17 percent of new arrivals spending nothing on these. This compared with only 4.4 percent of those in Kakuma 2, 2.9 percent of Somalis and 5.5 percent of longer term residents. For those purchasing NFIs, monthly spending varied markedly by item. Items such as soap or milling costs, which are consumed by many, are typically inexpensive, compared to more infrequent expenditure items such as school fees, medical expenses, domestic help and fuel/diesel (see Figure 12). 10 Soap and other detergents, candles and matches, electricity, mobile phone charging, cooking fuel/charcoal, milling costs, phone calls and airtime, water, school fees, toiletries, travel or transport, haircuts, fuel/diesel, domestic help, entertainment, drugs or medical expenses, loan repayments, gifts or loans to other people, other non-food expenditure. 31
44 Figure 12: Median Monthly Expenditures per Capita on Consumable NFIs For households that did purchase consumable NFIs, the median expenditure was 2.4 Ksh/capita/day (see Table A22, Annex 6). This was below 3.5 Ksh for all sub-camps and arrival groups, but exhibited variation by country of origin (7.5 Ksh for Ethiopians and 4.5 Ksh for Congolese). Interestingly, although it cannot be statistically representative due to the small sample size, households from Rwanda and Uganda reportedly spent a median of 16 Ksh/capita/day on consumable NFIs. Overall, only 1.9 percent of households spent more than 50 Ksh compared with 85 percent spending 10 Ksh or less (Table A21, Annex 6). The contribution of each item to the total consumable NFI expenditure of all sampled households over the previous month showed that even though some items were very expensive (for example, gifts and loans to others, school fees, domestic help, fuel/diesel), because of the 32
. Figure 13: Contribution of Each Item to Total Consumable NFI Expenditure in the Camp 4.2.")
45 high frequency of purchase, it was the low cost items such as cooking fuel/charcoal, phone calls and airtime, mobile phone charging, milling, soap and other detergents that constituted the majority of household expenditure (see Figure 13). Figure 13: Contribution of Each Item to Total Consumable NFI Expenditure in the Camp EXPENDITURE FOR DURABLE NFIS Households were also asked to record their purchase of durable NFIs from a list of 12 items 11 over the previous year (365 days). The items correspond to the major durable NFIs identified during the scoping exercise, the most common being clothing and footwear, mobile phones, shelter and housing materials, and chairs and beds. Over half of the sampled households had not spent anything on durable NFIs over the previous year (see Table A23, Annex 6). This varied by household characteristics, with 68 percent of households living in Kakuma 4, 68 percent of South Sudanese, 66 percent of Burundians and 69 percent of new arrivals spending nothing. This compared with 46 percent of those in Kakuma 2, 43 percent of Somalis and 42 percent of Congolese, and 50 percent of longer term residents. For those purchasing NFIs, the amounts varied markedly by item. Household furniture such as tables and chairs cost the least while electrical appliances such as refrigerators, solar panels and TVs cost the most (see Figure 14). 11 Table, chairs, beds, other furniture, TV, solar panels, fridge, mobile phones, other appliances, clothing and footwear, shelter and housing materials, other items. 33
46 Figure 14: Median Expenditures per Capita by Durable NFIs The median expenditure was 1.8 Ksh/capita/day, with a maximum of 88 Ksh (see Table A24, Annex 6). The median expenditure was highest in Kakuma 1 (2.1 Ksh) but exhibited the most variation among countries of origin, with Ethiopians purchasing a median of 2.9 Ksh/capita/day followed by Sudanese at 2.6 Ksh. Again it is interesting, although not statistically representative, that households from Rwanda and Uganda reportedly spent a median of 5.3 Ksh/capita/day on durable NFIs. Overall, only 0.3 percent of households spent more than 50 Ksh/capita/day on durable NFIs compared with 97 percent spending 10 Ksh or less (Table A23, Annex 6). The contribution of each item to total durable NFI expenditure in the camp (see Figure 15), showed that the mid-value items of clothing and footwear and mobile phones constituted nearly two-thirds of household expenditure. 34

47 Figure 15: Contribution of Each Item to Total Durable NFI Expenditure in the Camp TOTAL EXPENDITURE/CAPITA/DAY ON FOOD AND NFIS COMPARED TO THE MINIMUM BASKETS Again, the total household expenditure/capita/day includes the following: purchased food (see Section 4.2.1), food from in-stock or own production (see Section 4.2.2), consumable NFIs (see Section 4.2.3) and durable NFIs (see Section 4.2.4). Of the total expenditure/capita/day of all households sampled, 56 percent was on food, 35 percent on consumable NFIs and 9.2 percent on durable NFIs. In contrast, the average percentage share of expenditure/capita/day from food per household was 63%. While 45 percent of households spent nothing on food, most households spent something on NFIs. When considered together, only 6.8 percent of the households had no expenditure (see Table A25, Annex 6). The rest of the households total expenditure/capita/day ranges from 0.02 to 1260 Ksh. As expected, it is highly skewed, with a mean of 19 and median of 7.4 (see Table A26, Annex 6). It varies widely by sub-camp, country of origin and arrival status, from 3.7 Ksh for households in Kakuma 1, from South Sudan and new arrivals to 11 for households in Kakuma 2, 16 for Somalis, 18 for Ethiopians and 10 for households arriving before The per capita per day cost of a healthy food basket for December 2015 was estimated at 62 Ksh (see Table A14 and Table A15, Annex 5.1 for the calculations). The cost of an essential NFI basket was estimated at 15 Ksh. Summing the two, the total cost of the NFI and food basket amounts to Ksh 77/capita/day. We take this as our socio-economic vulnerability or poverty line, with households spending less considered vulnerable - unable to support themselves in the absence of food and NFI assistance - and those spending more, not vulnerable --- able to support themselves with no food and NFI assistance. Based on this threshold, only 4.2 percent of households in the sample (and by extension, in Kakuma Refugee Camp) are not vulnerable (see Table A27, Annex 6). As expected, this varies 35
48 by sub-camp (7.6 percent in Kakuma 1 compared to 1.8 percent in Kakuma 3 and 4), country of origin (lowest for the South Sudanese at 1.2 percent, followed by Sudanese at 2.1 percent and Congolese at 2.7 percent, and highest for Ethiopians at 15 percent) and arrival status (1.9 percent for refugees arriving since 2014). If the Kenyan poverty threshold of 125 Ksh is applied, then only 1.7 percent of surveyed households are not vulnerable. When disaggregated by country of origin, all of the Sudanese and Congolese are considered vulnerable at this threshold. In addition to considering this minimum basket for food and NFIs, we also explored the proportion of households that would be able to support themselves with different levels of reduced assistance. Four scenarios of partial reductions in assistance were considered: (1) households are not vulnerable if they can provide for their food (vulnerability threshold of 62 Ksh; assistance would consist of NFIs only); (2) households are not vulnerable if they can provide for half of their food and all of their NFIs (vulnerability threshold of 46 Ksh; assistance would be half food only); (3) households are not vulnerable if they can provide for half of their food (vulnerability threshold of 31 Ksh and assistance would be half food and all NFIs); and (4) households are not vulnerable if they can provide for their NFIs (vulnerability threshold is 15 Ksh and assistance would be food only). The results from this analysis are detailed in Table A27 (Annex 6). To summarise, as the vulnerability threshold is reduced (representing increased levels of assistance and decreased levels of self-reliance) the proportion of households considered as not vulnerable according to the respective cut-off increases. This means that at a high threshold, more households are considered vulnerable and fewer could support themselves. Conversely, the lower the threshold, the fewer households are considered to be vulnerable and more could provide for themselves at the given level. However, importantly, the changes are minimal. For instance, if food assistance were cut by half, households would need to provide their own NFIs and half of their own food. At this threshold, valued at 46 Ksh, only 9.1 percent of households would be able to survive. If only NFI assistance were removed (households would need to find enough money to cover the minimum basket of 15 Ksh), still only 31 percent of households would be able to survive. The differences by sub-camp, country of origin and arrival status are similar for all of the different levels, with only 14 percent of residents in Kakuma 4 being able to afford 15 Ksh/capita/day (NFIs), only 2.4 percent being able to afford 46 Ksh/capita/day (half food and NFIs) and only 2.0 percent being able to afford 62 Ksh/capita/day (to cover their food). 4.3 SOCIO-ECONOMIC PROXIES There are a number of proxies that could be used to reflect vulnerability, assessed here as consumption expenditure. In addition to income, which has already been addressed in Section 3, these include wealth assets; use of electricity or purchase of other expensive items; and demographic-based indicators such as age-dependency ratios, earning potential and crowding indexes. The detailed analysis on socio-economic proxies for the households sampled is presented in Annex 7 and the main results are addressed here. 36
49 4.3.1 WEALTH ASSETS We have already noted that 77 percent of households had a mobile phone, and that this was lowest in Kakuma 4 (56%) (see Table 1). Other traditional wealth assets related to house or livestock ownership are not necessarily relevant to this refugee population. During the scoping exercise, we noted a limited list of five items that reflected household wealth in Kakuma Camp: possession of a TV, a bicycle, a wheelbarrow, a dining table and solar panels. Even with these relatively low value items, 70 percent of households possessed none of these assets. Only 13 percent possessed a TV, 4.4 percent owned a bicycle, 4.2 percent possessed a solar panel, 10 percent owned a wheelbarrow and 16 percent owned a table (see Table A28, Annex 7). Only 12 percent of households possessed two or more of these assets, and most of these were in Kakuma 1 (34 percent) and Kakuma 2 (37 percent). Very few were in Kakuma 4 (4.5 percent). Asset ownership was particularly high among Somalis and Congolese (23 percent of each country of origin owning at least two out of these five items) and Ethiopians (21 percent), but very low among Sudanese (6.2 percent) and South Sudanese (2.3 percent). The vast majority of those owning at least two of these assets had arrived prior to 2014 (95 percent). In the sample of 2000 households, only 4 households (0.2 percent) possessed a generator, and 27 households (1.4 percent) owned a satellite dish (see Table A29, Annex 7). Goats were owned by seven households (0.4 percent), but 9.3 percent of households had one or more ducks and/or chickens (see Table A29, Annex 7). Those owning chickens or ducks were fairly evenly distributed across all camps apart from low numbers in Kakuma 4 (2.4 percent). A very high proportion of Congolese (31 percent) and Rwandans/Ugandans (33 percent 12 ) reported owning chickens and ducks (31 percent). As with the other wealth assets, it was more common for those that arrived in Kakuma before 2014 to own chickens and ducks (12 percent) USE OF ELECTRICITY AND OTHER EXPENSIVE ITEMS Overall, 21 percent of households reported having a source of electricity, with usage highest in Kakuma 1 (31 percent), for Somalis and Ethiopians (46 47 percent) and for those arriving before 2014 (30 percent). It was lowest in Kakuma 4 (0.8 percent), for South Sudanese (1.8 percent) and for new arrivals (2.4 percent, see Table A30, Annex 7). During the scoping exercise, it was observed that having a source of electricity was indicative of having some disposable income, as most households received this from solar panels (12 percent of those with electricity) and community generators (85 percent of those with electricity and 18 percent of the total households surveyed). For those purchasing electricity (15 percent of the total population), monthly costs ran between 5 and 3,000 Ksh per month, with a median monthly cost of 1,000 Ksh. Other expensive items, the purchase of which could be seen to indicate wealth include school fees and domestic help. Only 3.1 percent of households with children under 18 put them in 12 This cannot be considered statistically representative due to small sample size. 37
50 private schooling, and, as noted previously in Section 4.2.3, few households spend on luxury items such as domestic help (2.1 percent, see Table A30) AGE-DEPENDENCY RATIO AND EARNING POTENTIAL The dependency ratio indicates the number of dependents (ages 0 14 and 65+) per working age household member (ages 15 64). As such, a dependency ratio greater than 1 means that there are more dependents than working age household members. Of the households with at least one working age member (1,994 households), the median dependency ratio was 1.2 dependents for every working age household member (see Table A31, Annex 7). This means that on average, most households have more dependents than working adults. This ratio varied by sub-camp (1.0 in Kakuma 1 and Kakuma 2, 1.3 in Kakuma 3, and 1.5 in Kakuma 4) and country of origin (1 for Somalia and Ethiopia, 1.5 for South Sudan and 0.5 for Sudan). This suggests that households from Sudan have on average twice as many working adults as dependents. We took a ratio of 2.0 to reflect a vulnerability threshold proxy whereby those with more than twice as many dependents as working adults were vulnerable. Overall, two-thirds of the households in the sample fall beneath the threshold ratio of 2.0 (73 percent Kakuma 1 and Kakuma 2, 63 percent Kakuma 3, 58 percent Kakuma 4; 71 percent Somalia, 60 percent South Sudan, 84 percent Sudan, 80 percent Ethiopia, 68 percent Burundi; 61 percent new arrivals, 70 percent longer residents), meaning that they are not vulnerable according to this measure. Households were also classified based on their earning potential. The idea is that to have earning potential, there must be at least one adult who does not need to care for young children or disabled/elderly members in the household and who is therefore available to work. Overall, 84 percent of households were identified as having earning potential (see Table A32, Annex 7). Again, this varied substantially by sub-camp (notably low in Kakuma 4 at only 70 percent), country of origin (particularly low for South Sudan at 76 percent but high for Congolese at 92 percent) and arrival status (74 percent for new arrivals compared with 88 percent for longer residents). Overall, 9.4 percent of households had more than two children under five years of age (again see Table 32, Annex 7). This was notably high in Kakuma 3 (12 percent) and particularly low for Sudanese (5.2%) and Burundians (6.9 percent) compared with the other groups. The differences by arrival status were not substantial CROWDING INDEX Crowding indexes reflect how much living space a household occupies, with the assumption that the greater the crowding, the poorer the household. We estimated two crowding indices for the households for which we had data (n=1989): the number of beds per capita and the number of sleeping rooms per capita. The smaller the crowding index, the greater the crowding. The median number of beds per capita across all households was 0.57, which means that most beds are shared by two people (see Table A33, Annex 7). This crowding index was highest in Kakuma 4 (median 0.67), suggesting there were more beds per capita in this sub-camp, and 38
51 less crowding. Households from Sudan also had less crowding (ratio of 0.75 beds per capita) than households from other countries, as did new arrivals (0.67 beds per capita). Across the sample, 27 percent of households had at least one bed for every person (beds per capita crowding index >=1), ranging from 21 percent in Kakuma 2 to 35 percent in Kakuma 4, from 24 percent of Somalis to 41 percent of Sudanese, 13 and from 24 percent for residents arriving before 2014 to 32 percent for new arrivals. The median number of sleeping rooms per capita was 0.25, meaning that on average, household members sleep four to a room (again see Table A33, Annex 7). There was not substantial variation across sub-camps, although crowding is slightly higher in Kakuma 1 and for the South Sudanese (five to a room) than in the other sub-camps and for Somalis, Sudanese and Ethiopians (four to a room). Across the sample, 15 percent of households slept two or fewer people per room (12 percent in Kakuma 1, 16 percent in Kakuma 2, 13 percent in Kakuma 3 and 21 percent in Kakuma 4). There was large variation across countries of origin, with 15 percent of Somalis, 14 percent of South Sudanese and 13 percent of Congolese sleeping two or less to a room, compared with 23 percent of Sudanese, 24 percent of Ethiopians and 21 percent of Burundians. The differences by arrival status were not notable. These crowding indexes work well as a measure of vulnerability if the land is owned or rented by the household. However, although there is some unofficial renting of plots in the more established parts of the camp where land is hard to come by, the refugees coming into the camp are essentially given a plot onto which to build their house. Therefore, these crowding indexes may not be applicable to this setting percent of Rwandans/Ugandans is not necessarily representative given the small sample size. 39
52 5 VULNERABLE HOUSEHOLD PROFILES: UNRAVELING THE MYTHS The analysis above for livelihoods and income (see Section 3) and socio-economic vulnerability (see Section 4.2) focused on dissecting key variables by sub-camp, country of origin and arrival status. As has been seen, those households that have less opportunities for livelihoods and income, more food insecurity, less consumption expenditure and lower wealth assets tend to be living in Kakuma 4, originate from South Sudan and have arrived recently (from 2014). However, there are other household groups that may be of interest in relation to their levels of vulnerability. Especially pertinent are those that are traditionally considered vulnerable, 14 such as female-headed households, households with a disabled or elderly member, and those that are currently being targeted for additional assistance, such as household size 1, as well as those that are traditionally considered to not be vulnerable, particularly households without a business or employment. In addition to these four household types, we will provide a more detailed exploration of household size and arrival status groups. 5.1 FEMALE-HEADED HOUSEHOLDS The proportion of households in the sample that were headed by a female and those headed by a male are quite similar. However, the gender of the head of household has a substantial bearing on the outcomes of nearly all variables measured by the household survey (see Table A34, Annex 8), with female headed households exhibiting greater vulnerability along nearly every metric. As Figure 16 shows, more than twice the number of female-headed households are from South Sudan than male-headed households. Similarly, far fewer households with a female head are from Somalia and DR Congo than those with a male head (26 percent compared with 41 percent for Somalia and 3 percent compared with 12 percent for DR Congo). Given the correlation between country of origin, sub-camp and arrival status, the proportion of femaleheaded households living in Kakuma 4 is also higher (32 percent compared with 18 percent for male-headed households). In addition, more households headed by females are recent arrivals than those headed by males (41 percent compared with 23 percent). However, there are not substantial differences between the social networks (friends/relatives in the camp, in Kenya or resettled abroad) of these two groups. 14 Although child-headed households are traditionally considered vulnerable, their low prevalence (1.2%, n=23) does not enable robust analysis. 40

, and vocational training is much less common among members of their households (7.")

53 Figure 16: Demographics by Gender of Head of Household Differences in ability to earn are very large. Only 70 percent of female-headed households have earning potential compared to 97 percent of male-headed households. Households headed by females are also at disadvantaged in terms of their skills and experience. Far fewer have a member that speaks English (62 percent compared to 72 percent of male-headed households), and vocational training is much less common among members of their households (7.7 percent compared with 18 percent for male-headed households). Only 11 percent of households with a female head have at least one member with a trade or skill compared with 32 percent of those headed by a male. Only 4.6 percent of households headed be a female have a business compared with 11 percent of those with a male head, and only 11 percent of households headed be a female are employed compared to 29 percent of those with a male head. Female-headed households are also more vulnerable vis-à-vis all measures of wealth assets. For example, mobile phone ownership is about 12 percent lower for female-headed households (70 percent compared with 82%) and only 16 percent of them have electricity compared with 26 percent of male-headed households. Generally, female-headed households are less food secure than male-headed households, with 92 percent having a low Dietary Diversity Score compared with 86 percent of male-headed households, and 51 percent spending nothing on food compared to 39 percent of male-headed households. However, more female-headed households grow their own vegetables. In terms of food consumption scores, for households headed by a female, the mean is 32 (borderline), and 27 percent can be categorised as poor (between 0 and 21). Comparatively, for households headed by a male, the mean is 35 (the maximum score in the borderline range), and 24 percent can be classified as poor. The measure of vulnerability used by this study, daily expenditure/capita, aligns with the conclusions of these other variables in classifying female-headed households as significantly worse off than male-headed households (see Figure 17). On average, the share of expenditure/capita/day from food is slightly greater for female-headed households (65%) than male-headed households (61 percent). 41

. Demographically, these households are more aligned with groups that are traditionally perceived as less vulnerable.")
54 Figure 17: Vulnerability by Gender of Head of Household 5.2 HOUSEHOLDS WITH A DISABLED OR ELDERLY MEMBER, OR A DISABLED OR ELDERLY HEAD Compared with female-headed households, which are clearly vulnerable along nearly all metrics, evidence suggests that households with a disabled or elderly member, or a disabled or elderly head of household, are not necessarily worse off and, according to many measures, are actually better off than average (see Table A35, Annex 8). Demographically, these households are more aligned with groups that are traditionally perceived as less vulnerable. For instance, compared to the average, more households with a disabled or elderly member (or head of household) are male-headed and Somali, reside in subcamps 1 and 2, and are longer term residents, having arrived before As a result, their vulnerability, as measured by proxies and our gold standard consumption expenditure, is higher than average, rather than being lower. Households with a disabled/elderly member or head of household have higher earning potential than average household. Similarly, 4 7 percent more of these households have a business and about 3 percent more are employed than the average household. They also have more wealth assets (for example, 6 8 percent more have a mobile phone, and 5 7 percent more have two of the five key wealth assets explored by this study 15 ). Significantly, percent more have electricity than the average. The dietary diversity scores and food consumption scores of these households are at least equivalent to, and in some cases higher than, the average and fewer households have low dietary diversity scores and poor food consumption scores than the sample average (see Table A35, Annex 8 for more details). Compared to the median consumption expenditure of 6.4 Ksh/capita/day for all households, households with a disabled/elderly member consume a median of 6.7 Ksh/capita/day, and those with a disabled/elderly head of household consume a median of 8.1 Ksh/capita/day (see Figure 18). When considering the percentage vulnerable, the most significant differences from average are observed for disabled/elderly head of household rather than households with a disabled/elderly member. On average, the share of expenditure/capita/day from food is lower for 15 For each range, the lower value is for households with a disabled or elderly member and the higher value is for households with a disabled or elderly head of household. 42

.")
. Comparatively, nearly half of households without businesses are South Sudanese and only 31 percent are Somali.")

 and far more are from DR Congo (15 percent).")

55 households with a disabled member (60 percent) and head of household (56%) than the total sample (63 percent). Figure 18: Vulnerability of Households with and without an Elderly or Disabled Head of Household 5.3 HOUSEHOLDS WITH AND WITHOUT BUSINESS AND EMPLOYMENT For all metrics, households with a business and households with at least one member employed 16 differ substantially from those without (again, see Table A36, Annex 8). In terms of demographics, 61 percent of households with businesses are Somali and only 12 percent are South Sudanese (see Figure 19). Comparatively, nearly half of households without businesses are South Sudanese and only 31 percent are Somali. Only 6 percent of business owners live in Kakuma 4 compared with 27 percent of non-business owners, and 9 percent are recent arrivals compared with 34 percent of non-business owners. These demographic breakdowns are similar for households with and without employment. However, a smaller proportion of households with employment are Somali (52%) and far more are from DR Congo (15 percent). Since households with businesses represent a subset of households with employment, we can infer that out of all employment opportunities, Somalis tend to own businesses while Congolese tend to have employment from sources other than business. Figure 19: Demographics by Business Ownership 16 Note that households with a business represent a subset of households with employment. As such, all households with a business are considered as having employment. 43
56 Households with businesses and/or employment tend to have greater social networks than those without. Most notably, 31 percent of those with businesses have friends or relatives that have been resettled in the US or Europe compared to 16 percent of those without. This difference is 27 percent for households with at least one member employed compared to 15 percent for households with no employment. These more robust social networks are important, as 19 percent of business owners reported that the funds they used to start their business were given to them as a gift (see Section 3.2). As expected, households with businesses and employment perform better alongside metrics related to the ability to earn an income. However, the high prevalence of the earning potential indicator for households with no business (83 percent) and no employment (81 percent) suggests that many households have the ability to work but are not employed, illustrating the vast unemployment and large pool of available labour in the camp. While the prevalence of English fluency is 5.4 percent higher for business owners than nonbusiness owners, it is 10 percent higher for households with employment than for those without. Similarly, while having vocational training is only 3.7 percent more common among business owners than non-business owners, it is 12 percent more common among employed than nonemployed. These differences are also evident when comparing prevalence of trades or skills: 44 percent of business owners report having a trade or skill compared to 20 percent of nonbusiness owners, 47 percent of households with employment and 15 percent of households without employment. These differences are likely due to the prerequisites for incentive staff positions. Again, households with businesses and employment are better off than those without in terms of wealth assets, although perhaps not to the extent expected. For example, although the prevalence of mobile phone ownership is higher by percent and the prevalence of electricity is greater by 35 42% for households with businesses and employment compared to those without, there are still households with businesses and employment that do not have mobile phones and electricity. Although 6 percent fewer business owners and employed households grow their own vegetables than non-business owners and those without employment, the dietary diversity of that have businesses and employment is higher than those that do not. For example, only 63 percent of households that own a business have a low Dietary Diversity Score compared to 91 percent of non-business owners. Similarly, only 72 percent of households with at least one employed member have a low Dietary Diversity Score compared to 93 percent of households without employment. Similarly, households with busineses and employment have higher average Food Consumption Scores (49 and 44, respectively) than those that do not (32 and 31, respectively. The same is true with respect to households classified as having poor food consumption (8.0 percent for households with a business and 15 percent for those with employment compared to 27 percent and 28 percent for those without). 44

 of business owners and 14 percent of those employed are not vulnerable at the minimum food and NFI basket threshold of 77 Ksh/capita/day compared to 2.")
57 In terms of the vulnerability measure employed by this study, there are large differences between those with and without businesses/employment (see Figure 20). For instance, households with a business consume 31 Ksh/capita/day and those with employment, 23 Ksh. This compares to only 5.5 Ksh/capita/day for those without a business and 4.2 Ksh for those without employment. A fifth (19 percent) of business owners and 14 percent of those employed are not vulnerable at the minimum food and NFI basket threshold of 77 Ksh/capita/day compared to 2.9 percent of non-business owners and 1.6 percent of the unemployed. While this is a large difference, these values are still quite low, implying over 80 percent of business owners and households with employment are vulnerable. As such, targeting out businesses and employed households from assistance would result in large exclusion errors, as discussed in more detail in Section 6. Even at the 46 Ksh vulnerability threshold (a level representing a cut in food assistance by half, compared to the 77 Ksh representing a elimination of all food and NFI assistance), about two-thirds of business owners and three-quarters of employed households are vulnerable. On average, the percentage share of expenditure/capita/day on food is lower for households with a business (60 percent) and employment (59 percent) than for the average household (63 percent). Figure 20: Vulnerability by Business and Employment 5.4 HOUSEHOLD SIZE The Bamba Chakula programme recently targeted household size 1 to receive more cash than larger household sizes. To explore whether this targeting accurately reflects true vulnerability of households based on size, we explored many of the key variables in relation to four householdsize groups: household size 1, household size 2 5, household size 6 10 and household size >10. Results on vulnerability for each of the household sizes are mixed, depending on the set of variables explored. Table A37 in Annex 8 provides details on each of these groups. Below, we offer a brief summary of household size 1 and then explore broader trends related to household size HOUSEHOLD SIZE 1 Most (81%) of household size 1 are male, although, importantly, one-fifth are female. The proportion of Somalis is lower among household size 1 than in the total sample, and this is compensated for by a higher proportion of Sudanese and Ethiopians. Notably, 42 percent of household size 1 reside in Kakuma 4 compared to only 14 percent in Kakuma 1, 25 percent in Kakuma 2 and 20 percent in Kakuma 3. Similarly, 42 percent are new arrivals compared to 32 45
58 percent of the total sample. The proportion of household size 1 that are youth (18 28 years old) is more than double that of the average population (59 percent compared to 26 percent). Household size 1 tend to have more friends and relatives in the camp than larger households (about 48 percent compared to 38 percent camp-wide), but know fewer people who have been resettled to the US or Europe (13 percent compared to 17%). This suggests that they may be more adept in managing their way inside the camp but have less opportunity to receive financial assistance in the form of remittances from abroad. Evidence for vulnerability based on income opportunities is mixed. Slightly more household size 1 have received vocational training (16 percent) than the total sample (13 percent); however, fewer speak English (60 percent) than the average (67 percent). Perhaps surprisingly, only 4.9 percent of household size 1 own businesses and 16 percent have employment), both of which are lower than the comparative proportions in the total sample (8.2 percent for businesses and 20 percent for employment). If wealth assets and food security are considered as proxies for vulnerability status, then household size 1 are clearly the most vulnerable group, as they fall far behind the average in all categories. However, based on the vulnerability measure employed by this study, daily expenditure/capita/day, household size 1 as a group are decidedly less vulnerable than all other household sizes. The median expenditure/capita/day is 15.6 compared to only 6.4 across the sample, 15 percent of household size 1 are not vulnerable based on the 77 Ksh threshold compared with only 4.2 percent of the whole sample, and 28 percent are not vulnerable based on the 46 Ksh threshold compared with only 9.1 percent of the sample as a whole. For household size 1, 58 percent of the expenditure/capita/day comes from food compared to an average of 63 percent for the whole sample. Figure 21 shows how household size 1s compare to the full sample with respect to a range of variables. It depicts how, compared to the total sample, there are more household size 1s that are: in Kakuma 4, new arrivals, male-headed, youth-headed and have friends and relatives in the camp. It also shows that household size 1s appear to be more vulnerable than other household sizes when looking at the proxies of: businesses and employment, wealth assets, access to electricity, low Dietary Diversity Score and 0 food expenditures. However, according to the vulnerability thresholds, household size 1s are much less vulnerable than the average household. 46

59 Figure 21: Comparison of Household Size 1 and the Full Sample MORE DETAILED EXAMINATION OF HOUSEHOLD SIZE This inconsistency in vulnerability classification of household size 1 depending on the metric used warrants a more detailed investigation into broader household size trends (again see Table A37, Annex 8). To simplify the analysis, we will refer to the four household size groups for household size 1, household size 2 5, household size 6 10 and household sizes >10 as groups A, B, C and D, respectively. In terms of country of origin, the proportion of South Sudanese is roughly equivalent across household sizes. However, the proportion of Somalis increases notably with household size, with Somalis constituting only 23 percent of group A and 28 percent of the group B population, compared to 37 percent of group C and 36 percent of group D. While Somalis tend to have larger household sizes, the opposite is true for Ethiopians, who constitute 8.8 percent of group A, 4.9 percent of group B, 3.6 percent of group C and only 2 percent of group D. Larger household sizes can be found in Kakuma 1 or 2, while smaller household sizes tend to reside in K4 (see Figure 22). Smaller household sizes tend to have arrived more recently (42 percent of group A, 38 percent of group B and 27 percent of group C, although the trend is slightly reversed for the largest households, 29 percent of whom are recent arrivals). This may be due to the fact that new arrivals have not yet had the chance to join up into larger household units. 47
; however, for the other household size groups, the proportions are around 50%.")


60 Figure 22: Sub-camp Composition of Household Size Groups Gender and age of the head of household show distinct correlations with household size. As previously discussed, household size 1 are overwhelmingly male-headed households (81 percent); however, for the other household size groups, the proportions are around 50%. The proportion of youth-headed households decreases dramatically with household size (59 percent of group A, 41 percent of group B, 15 percent of group C and 13 percent of group D). Both are fairly indicative of expected trends. In terms of ability to earn, most variables seem to suggest that larger households are better off. For instance, with the exception of group A, earning potential and English proficiency are strongly positively correlated with household size (see Table A37, Annex 8 for details). For all household size groups, the same positive relationship is evident for business ownership and employment. As an example, 4.9 percent of households in group A, 6.8 percent of those in group B, 8.5 percent of those in group C and 12 percent of those in group D have a business. However, it is important to bear in mind that in larger households, any earnings must be shared among more members, so the per capita impact of these variables may actually be lower for larger households. The same idea is true for wealth assets and behaviours, with bicycle ownership, TV ownership, ownership of two of the five wealth assets, access to electricity, and purchase of luxury items all increasing with household size. When it comes to food insecurity, the proportion of households with a low Dietary Diversity Score decreases with household size, suggesting that larger households are less vulnerable. However, when looking at the mean Food Consumption Score, percentage with a low Food Consumption Score and the percentage of households with zero expenditure on food, the trend is not as clear or linear. For instance, household size 1 have a distinctively lower average Food Consumption Score (29) than other household sizes (33-34), although importantly this still falls in the borderline range. The proportion of households with a poor Food Consumption Score and with zero expenditure on food decreases with household size (again suggesting that smaller households are more vulnerable), except for the largest sized households. Indeed, nearly the same proportion of group D households have poor food consumption (32 percent) as group A households (33 percent). Similarly, sixty percent of group A, 48 percent of group B, and 40 percent of group C have zero expenditure on food compared with 48 percent of the largest households (group D). 48
.")


61 These trends are interesting because they are quite contrary to the conclusions drawn when looking at this study s vulnerability measure, expenditure/capita/day, which clearly suggests that vulnerability increases with household size (see Figure 23). Further investigation into the composition of total expenditure by household size reveals that the average share of food expenditure is slightly lower for household size 1 than that for other household sizes. This means that household size 1 tend to spend a slightly higher amount on NFIs than on food, when compared with other households. Figure 23: Vulnerability Measures by Household Size Therefore, while many proxy variables seem to suggest that smaller households are indeed more vulnerable, looking directly at expenditure/capita/day shows that this might not be the case and that, in fact, the opposite may hold true. These findings support the recent decision to halt targeting of the Bamba Chakula program based on household size. 5.5 YEAR OF ARRIVAL A final myth is that new arrivals are particularly vulnerable while those that have been in the camp for the longest duration are far better off and should be able to support themselves. Here (and in Table A38, Annex 8), we explore arrival status in more detail, disaggregating households into five groups based on their year of arrival. To simplify the explanation of the analysis, we will refer to these as groups 1, 2, 3, 4 and 5, as follows. Group 1 comprises those that arrived in the past two years ( , deemed recent arrivals throughout the rest of the report), group 2 comprises those that arrived 3 5 years ago ( ), group 3 households arrived 6 10 years ago ( ), group 4 households arrived years ago ( ), and Group 5 comprises those that arrived more than 20 years ago (before 1995), essentially arriving at the camp s inception. The demographics show that very recent and more established households tend to be femaleheaded households and from South Sudan, whereas households that have been resident for a medium term (groups 3 and 4) tend to be from Somalia (see Figure 24). This trend among countries of origin largely reflects the history of the main conflicts in the region. Given that the sub-camps have been established chronologically, those that arrived earliest tend to live in Kakuma 1, whereas the most recent arrivals tend to live in Kakuma 4. 49
. Vulnerability is greatest for new arrivals and decreases as duration in the camp begins to increase.")


62 Figure 24: Demographics by Year of Arrival In general, most vulnerability proxy indicators tend to follow a U shaped curve when compared with duration in camp (this is inverse U shaped for variables that are related to non-vulnerability, such as business and employment). Vulnerability is greatest for new arrivals and decreases as duration in the camp begins to increase. However, for most variables, this trend reverses at some point, and vulnerability begins to increase again, for those that have been in the camp the longest. As such, the idea that households that have been resident in the camp the longest are the least vulnerable is a myth. The turning point varies depending on the variable. For instance, business ownership and employment both peak for households in group 4. Most other proxy indicators related to social networks, wealth assets and wealth-related behaviours, and food security that we explored followed a similar trend, with households seeming to become better off the longer they stay in the camp, up to a point (generally for households in group 3 or 4), when it reverses. However, it is not clear whether this is a real effect, as the group 5 sample size was very small (only 48 households) compared to 631 in group 1, 438 in group 2, 630 in group 3 and 253 in group 4. The expenditure/capita/day variable used to define vulnerability in this study follows suit, as shown by Figure 25. There are two important anomalies. First, the mean percentage share of expenditure/capita/day from food decreases as duration in camp increases, and is much lower for the most established residents (group 5, 53 percent) than the rest (63 percent). This means that group 5 residents consume a much greater share of NFIs compared to most other households. Second, at the 77 Ksh vulnerability threshold, 10 percent of households arriving before 1995 (group 5) are not vulnerable, suggesting that the most established residents are, in fact, much better off than the rest. Importantly, we see that the same 10 percent are considered as not vulnerable in reference to the 46 Ksh threshold. This shows the limitation of the small sample size for the group that had arrived prior to As such, we recommend that if any action were to be taken based on year of arrival, more detailed analysis, with more representative sample sizes from each arrival group, as well as additional research on the ideal classification of groups, should be done. 50

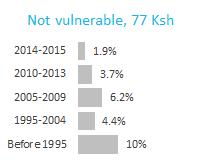
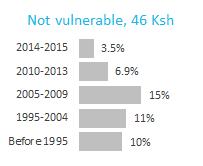
63 Figure 25: Vulnerability by Arrival Group 51
64 6 TARGETING The major impetus of this study was to capture information on whether targeting would be a practical, feasible and cost-effective approach to delivering assistance in the face of limited resources. The estimates of household expenditure/capita/day calculated here will serve as our gold standard measure of vulnerability. Households can be ranked according to their absolute expenditure/capita/day or classified as vulnerable or not vulnerable, based on applying one of the thresholds identified above to the household s expenditure/capita/day. As found in Section 4.2.5, very few households (4.2 percent) have an expenditure/capita/day greater than the minimum basket to cover food and NFIs (77 Ksh). As explored in the other sections, even though there are some groups of households that are more likely to be more vulnerable than others, there is no one single household characteristic that could be used to identify vulnerable or non-vulnerable groups with 100 percent certainty. For example, Figure 26 offers summary profiles of vulnerable and non-vulnerable households. Figure 26: Profiles of Vulnerable and Non-vulnerable Households 6.1 TARGETING IN OR OUT The traditional approach to targeting is to identify individuals or households who should receive assistance or an intervention ( targeting in ). This works well when it is relatively easy to identify those who should receive additional help. However, in some cases, it may be easier to identify those households that do not need the assistance or intervention ( targeting out ). This 52
65 becomes even more practical if this percentage is small. This study shows that in Kakuma Refugee Camp, the percentage of households who are vulnerable based on our classification is very high, and there are no simple characteristics that easily define this group. In contrast, the number of those that are not vulnerable is small, and there do appear to be some household characteristics that may be able to define these groups. Therefore, in considering the targeting approaches below, we will consider options for both targeting in and targeting out. 6.2 INCLUSION AND EXCLUSION ERRORS Inclusion and exclusion errors result from using any targeting approach in allocating assistance or another intervention. An exclusion error is the proportion of those that are eligible for assistance but who are excluded from receiving it as a result of inaccurate targeting. It is sometimes referred to as the undercoverage rate and, for a targeting in approach, is calculated as the false negatives divided by the false negatives and true positives. In other words, it would be the vulnerables that were not identified to receive additional assistance by the targeting divided by all vulnerables. An inclusion error is the proportion of those selected to receive assistance who are not eligible for it. It is sometimes referred to as the leakage rate. For a targeting in approach, the inclusion error would be the false positives divided by false positives and true positives. In our study, this would be the non-vulnerables identified to receive additional assistance by the targeting mechanism divided by all targeted households). To summarise, exclusion errors are the percentage of households not receiving assistance when they need it, whereas inclusion errors are the percentage of households that are included in receiving assistance when they do not need it. Obviously, the aim is to minimise both of these errors; however, a reduction in one usually results in an increase in the other. For this reason, many decision-makers opt to minimise one over the other. For example, if the non-receipt of assistance is life-threatening, then the aim would be to minimise exclusion errors. In contrast, if exclusion is unlikely to result in harm and limited resources are the major concern, the aim may be to opt to minimise inclusion errors and thus unnecessary delivery of assistance. WFP has a standard threshold for both inclusion and exclusion errors of 10%. We will therefore use this as our minimum acceptable rates when evaluating the different targeting approaches. As a base case, we will consider that given that 4.2 percent of the population were identified as not vulnerable based on a minimum basket of 77 Ksh, current assistance results in a zero percent exclusion rate and a 4.2 percent inclusion rate. 6.3 COST ANALYSIS Given the limitations on cost data availability, the cost analysis is based on a crude comparison between expected costs of implementing the targeting approach to the entire camp and the expected savings from the reduction in the number of beneficiaries receiving assistance. 53
66 The cost of targeting will vary depending on the approach. The most expensive would be repeating the current survey in order to do a means testing of the entire camp. This cost is likely to be prohibitive. Assuming a population of 7,352 households in the camp that sleep and eat together 17 and a cost of 10,000 Ksh (USD100) per household, this would translate into 274 million Ksh. The next most expensive approach would be a proxy means testing whereby a shorter survey was undertaken that did not consider consumption expenditure but other household characteristics as proxies for vulnerability. This would be expected to cost at least half that of the means testing (about 137 million Ksh) if it collected a range of vulnerability proxies 18. A household census that just took details on a few characteristics for categorical targeting or key demographics 19 for proxy means testing could cost as little as 500 Ksh per household (14 million Ksh). A categorical targeting approach based on existing information such as location would not incur any surveying costs. The community-based targeting approach would, relatively simply, involve interviewing community leaders of each block. At a cost of around 20,000 Ksh per block, this would total 2.5 million Ksh, cheaper than all the others. But how does this compare with potential savings? Since there is marked uncertainty in the value of reducing food and NFI assistance per beneficiary, we have costed this as the price of the healthy food basket and essential NFIs (77 Ksh/capita/day) plus an extra 20 percent for delivery costs, resulting in a total estimated savings of 92 Ksh/capita/day. If in the best case scenario we were able to identify all those not vulnerable, we would target out 4.2 percent of the households in the camp (1,149 households or 7,685 people), which could translate into a cost savings of up to 707,020 Ksh per day (or 258 million Ksh over one year). If this was only for the food basket (62 Ksh/capita/day plus 20 percent delivery costs, for a total of 74 Ksh/capita/day), the savings would be reduced to 207 million Ksh per year. However, these estimates assume perfect targeting, with no inclusion and no exclusion errors. In reality, the actual savings would depend on the targeting approach employed and the associated inclusion/exclusion errors. Furthermore, these are only estimates, as the actual cost per beneficiary (recurrent costs) was not available from the current accounting systems. We were given a direct operational cost per beneficiary for food assistance for 2015 of $145 per beneficiary (40 Ksh per day), which would only translate into a cost saving of 112 million Ksh, half that predicted using the food basket and an extra delivery cost. Regardless, all of these cost estimates suggest that the savings would not outweigh the costs of a means testing survey in the first year. 17 Based on the household definition in this survey (those that sleep and eat together) and the average household size in our survey (6.69) and an assumed population size of 182, Such as the variables included in the comprehensive dataset used for proxy means testing in Section and Annex 10.1 (sub-camp, zone, block, country of origin, year of arrival, household size, social networks in the camp/in Kenya/resettled abroad, dependency ratio, gender of head of household, number of children in household, age of head of household, presence of disabled/elderly household members, number of ration cards, electricity, mobile phone, TV, wheelbarrow, bicycle, table, number of sleeping rooms, business/employment, etc.). 19 Such as location, country of origin, year of arrival, household size, gender and age of head of household, number of children/dependents, and presence of elderly/disabled members. 54
67 Further to the initial survey costs, given the dynamic nature of the refugee population and changing circumstances, it would also be important to consider the additional costs of monitoring and evaluation and continual cross-checking for the following years. The costs above consider a one-off fixed survey cost. In a worst case scenario, continued monitoring could cost the same amount on a yearly basis. As a best case scenario, it could cost about half as much, again on a yearly basis. We accept that these cost figures are crude, but they are sufficient to highlight comparative differences between targeting options and potential cost savings. Given the poor performance of the targeting approaches and the feedback from the focus group discussions, which will be discussed below, a more detailed cost analysis would not add significantly to the conclusions that are being drawn. 6.4 TARGETING APPROACHES There are a wealth of different targeting approaches, and the aim of this study was to consider all of them at some level. While this was done, as we present each, it will be clear that there are some approaches that are clearly not appropriate for this setting, and any analysis of these will be minimal. This section will cover categorical targeting, proxy means testing targeting, community-based targeting and self-targeting. To set the context for evaluating these approaches, it is important to bear in mind that the current approach of delivering food and NFI assistance to all households in the camp (our base case) comes with an inclusion error of 4.2 percent (the percentage of non-vulnerable households in the camp) and an exclusion error of 0 percent (as all households are targeted). According to WFP standards, these are well within acceptable limits and furthermore follow the do no harm principle, as no vulnerables are excluded. In addition to the 77 Ksh cut-off for whether households could afford to provide the full basket for food and NFIs for themselves (that is, whether they could survive without any assistance), the other vulnerability thresholds outlined in Section which would reflect a reduction in assistance were also explored CATEGORICAL TARGETING This is the simplest and probably the most commonly employed method of targeting and relies on using some categorical variable or household characteristic to identify the group for targeting in or out. A category could be a simple characteristic such as female-headed households (for targeting in) or households with a business (for targeting out). Importantly, this category should be easy to assess. If it is based on the location of the household (sometimes referred to as geographical targeting), then this can be done without visiting the households. If it is done on a less easily identifiable category, then some form of household questionnaire may be needed unless the relevant information is already held within a database or registration system. As outlined in Section 6.3, the costs of a household census could be relatively low, in the region of 14 million Ksh. It is our understanding that UNHCR will be conducting a household census shortly, to which targeting criteria could be easily added at little additional cost. 55
68 However, given that there were no categories which clearly defined households that were vulnerable or not vulnerable (see Section 4.3, Section 5 and Figure 26), one would expect the effectiveness of this approach to be low. Annex 9 provides the exclusion and inclusion errors which would arise from categorical targeting based on a range of categories and each of the different levels of reductions in assistance (vulnerability thresholds). The following demographic categories considered as reflecting those that are vulnerable were assessed: female-headed household, new arrivals, refugees from South Sudan and refugees in Kakuma 4. Taking the full minimum basket cut-off (77 Ksh), all of these have very low inclusion errors, as they would result in few false positives (targeting in assistance to those who are not vulnerable) (see Table A39, Annex 9). However, the exclusion errors are high (50 74%) because of the large number of households that would be excluded even though they are vulnerable (false negatives). Changing the vulnerability threshold does not significantly change these high exclusion errors, and, importantly, as the threshold decreases to the lowest threshold of 15 Ksh, the inclusion errors increase (see Tables A40 to A44, Annex 9). For example, targeting female-headed households with a half food ration and no NFIs (vulnerability threshold of 46 Ksh) would result in an exclusion error of 49 percent and an inclusion error of 5.6 percent (see Table A42, Annex 9). A targeting out approach whereby one selects those with a business (thus effectively targeting those with no business) provides different results. Taking the full minimum basket cut-off (77 Ksh), the exclusion error is only 6.9 percent, due to the low number of households with businesses (n=163). This would be considered to be an acceptable error according to WFP standards, and taken in context with the low inclusion error (2.9 percent), may be considered as an acceptable approach. However, a number of points need to be made. First, if this approach was applied at scale to the entire camp (27,352 households), about 25,109 households would be targeted (no business). However, 1,887 households who need assistance would be left out and 793 households who do not need assistance would be included unnecessarily. This would not comply with the do no harm principle, as approximately 12,624 vulnerable people would be left without food or essential NFIs. A reduction in the amount the households would be expected to contribute for food and NFIs reduces the exclusion error, but increases the inclusion errors beyond the acceptable WFP standards. For example, targeting households with businesses out of NFI assistance alone (vulnerability cut-off of 15 Ksh) would reduce the exclusion error to 4.1 percent but increase the inclusion error to 27 percent (see Table A44, Annex 9). Obviously, as summarised in Section 6.3, there would be cost implications of reducing the assistance delivered. However, given the exclusion rates, this may not even be considered as an acceptable option. There is no reason why the categorical approach must be constrained to just one variable. Annex 9 also summarises results when more than one category is used. Combining variables decreases exclusion errors and increases inclusion errors for options related to targeting in based on head of household characteristics or location. However, the effects are minimal, and neither would have acceptable exclusion errors. In the case of targeting out households with a 56
69 business or incentive worker, the exclusion errors increase, as more vulnerables are excluded from receiving assistance. The focus group discussions with community leaders suggested that geographical targeting by sub-camp would not be an option. For example, when presented with the possibility of providing assistance only in Kakuma 3 and 4, no community leader thought that this was a feasible or acceptable strategy. In Kakuma 3, a Congolese Chair Lady (age group 25 34, long-term resident) explained that this targeting approach would bring about insecurity for the refugees living in these two sub-camps. This opinion was shared by a South Sudanese Chair Lady from Kakuma 4 (age group 25 34, new arrival), who also believed that this type of geographical targeting would bring about tension between the residents of Kakuma 1 and 2 and those of Kakuma 3 and 4. Furthermore, although there was acceptance that some households, such as female-headed households, are more vulnerable than others, the suggestion was that these households needed more assistance in addition to what they were already receiving. Community leaders objected to the idea of further reductions for all refugees, even if vulnerable households were then targeted in for special assistance. For example, community leaders in Kakuma 2, Zone 1 suggested that the general food distribution should be the same for all, and vulnerable groups should then receive additional support in some other form. They suggested that this arrangement would prevent conflict and would bring peace to Kakuma. Community leaders in Kakuma 4, Zone 2 were initially completely averse to the concept of targeting, suggesting that all refugees should receive the same amount of assistance. However, after explanation of funding constraints and after discussion among themselves, they later agreed that all child-headed and other vulnerable groups should receive more assistance (South Sudanese female, age unknown, new arrival; and South Sudanese female, age group 25 34, long-term resident) PROXY MEANS TESTING Proxy means testing extends the idea of categorical targeting to consider a range of variables that may be used as proxies for vulnerability. These variables traditionally include information on household characteristics related to wealth and income. Using the data we have available from the household survey, we evaluated whether such an approach would work in this setting. Proxy means testing involves running a regression or machine learning model to estimate the vulnerability of a household from a select set of household characteristics (parameters). We selected two sets of parameters. The first was a comprehensive list of 23 parameters from the household survey, including binary (for example, bicycle ownership, business or employed), continuous (crowding index, number of children) and categorical (sub-camp, country of origin) (see Table A45, Annex 10 for details). Parameters were chosen that seemed to have a strong logical influence over expenditure/capita/day, and selected to minimise co-linearity between parameters. For example, if two variables described similar information or were highly correlated, such as country of origin and transferred from Dadaab, only one was selected. The working dataset for the modelling was 1,969 households due to households missing information on food consumption (14), crowding index (11) and dependency ratio (6), although, importantly, none of these represented non-vulnerable households. 57
70 The second set of parameters was a shorter list of 12 observable demographic variables that households would not be inclined to alter in an effort to change their perceived vulnerability status (again see Table A45, Annex 10). This working dataset was 1,980 households due to missing information on food consumption (14) and dependency ratio (6). To determine the best approach for proxy means testing with the given parameters, several models were developed and tested. The models fall within two categories: regression and classification models. Regression models rely on the continuous form of the non-gifted expenditure/capita/day variable and are commonly used in proxy means testing analysis. The challenge with using regression models for this dataset was that the majority of the parameters are binary or categorical, and it is difficult to estimate a continuous variable based on binary and categorical input data. For this reason, we also tested classification models, which represent the non-gifted expenditure/capita/day variable in a binary form. Rather than estimating the value of expenditure/capita/day, these models estimated whether or not the expenditure/capita/day would fall above or below a given threshold. We conducted each classification model using binary variables representing all vulnerability thresholds covered in Section (77 Ksh, 62 Ksh, 46 Ksh, 31 Ksh and 15 Ksh). While classification models are better suited for binary and categorical input data than regression models, they present a challenge in this particular context in that the binary data in this study are highly skewed (very few households are not vulnerable while most are very vulnerable). For these reasons, we tested both types of models, regression and classification. Our modelling philosophy was to start with a simple model to determine a baseline of performance and then to build in complexity. The Ordinary Least Squares (OLS) and the Logistic Regression represent the simple models for the regression and classification types, respectively. One should note that even though Logistic Regression has the term regression, it is a classification model. The Elastic Net model and Extremely Random Trees model (Geurts et al, 2006) represent more complex models for the regression and classification types, respectively. For more information on how we handled the skewness of the binary data in the classification models, why we selected these particular four models, and how we trained and tested the models, see Annex 10. The results from fitting the models are outlined in Tables A46 and A47 in Annex Table 3 summarises the inclusion and exclusion errors that would occur under each model, dataset and vulnerability threshold, with shaded cells denoting inclusion and exclusion errors that fall within the range deemed acceptable by WFP (10 percent). None of the models perform acceptably at the 31 Ksh or 15 Ksh thresholds. The logistic regression model does not work for any of the thresholds. The cells with the lightest shading denote models that do not work effectively for targeting, as they classify all, or almost all, of the households as vulnerable (exclusion errors of close to 0 58
71 percent, see Figure A2 and A3 in addition to Tables A46 and A47, all in Annex 10.3). This tends to occur with the OLS and Elastic Net models, likely because using binary and categorical input variables to predict the continuous expenditure/capita/day variable skews the results towards predicting households to be vulnerable. The cells with the darkest shading denote the models with the best overall performance, with each inclusion and exclusion error below 5 percent. Although the OLS and Elastic Net models produce errors acceptable to WFP at the 62 Ksh and 46 Ksh thresholds, the Extremely Randomised Trees model offers the best overall performance in terms of inclusion and exclusion errors, and can be employed at more thresholds (77 Ksh, 62 Ksh and 46 Ksh) and with both datasets. Table 3: Inclusion and Exclusion Errors for Proxy Means Testing Models 77 Ksh 62 Ksh 46 Ksh 31 Ksh 15 Ksh OLS Comprehensive dataset Elastic Net Logistic Regression Extremely Randomised Trees OLS Limited dataset of observable characteristics Elastic Net Logistic Regression Extremely Randomised Trees Legend for Table 3: Models with unacceptable performance per WFP limits (at least one error is >10%) Models that do not work (classify almost all households as vulnerable) Models with acceptable performance per WFP limits (each error is <10%) Best performing models (each error is <5%) If proxy means testing were to be pursued as a targeting option, the best choice of model would depend on several factors. One would be whether it is preferable to reduce the overall errors or to reduce a particular error over another. For instance, if several model options are within the 10 percent acceptability range, is it preferable to save more money with higher exclusion errors or to ensure that fewer households who need assistance are excluded? Furthermore, to what 59
72 extent would assistance be reduced, and what data are feasible to collect? For instance, if assistance were to be reduced by 77 Ksh (full removal of food and NFI assistance) or 62 Ksh (removal of all food assistance), then the Extremely Random Trees model is the only model that would work. Similarly, although the comprehensive dataset offers lower errors, it includes many variables that households might be inclined to falsely adjust if the households were to identify that their responses to these variables were having an effect on the level of assistance that they were receiving. As such, a more limited dataset based on observable factors may be preferable despite the higher errors. Cost considerations may also tend towards a lighter data collection instrument that would inform the variables in the limited dataset. In either of these cases, the Extremely Random Trees model would likely be the best choice. Although the Extremely Random Trees model seems to work quite well, even the models with the best fit come with exclusion errors, meaning that some number of households that need assistance would be excluded. Given that we expect households to adapt to a targeting mechanism based on the comprehensive variable list and that the 77 Ksh basket is the largest reasonable reduction in assistance, we will take, for example, the Extremely Random Trees model for the limited dataset at the 77 Ksh threshold. This is one of the best performing models in terms of overall inclusion and exclusion errors. However, the exclusion error of 4.8 percent is even larger than the inclusion error in the base case of continued blanket assistance. This means that more households that need assistance would be excluded under the targeting approach than there are households currently receiving assistance that do not need it. At the same time, under the Extremely Random Trees proxy means testing, still 2 percent of households that do not require assistance in order to meet their minimum consumption basket would be receiving it. This is only about 2.2 percent less than the base case. In sum, to adopt this approach would be a clear value statement that the money saved by the donors is more important than minimising the number of excluded vulnerables. Furthermore, the costs of conducting a complete household census to inform the targeting, even using a light data collection instrument for the limited dataset, would be very high. There would also be the added costs of regular monitoring to consider. Based on this assessment, we do not find any of the proxy means testing models to be a better alternative than the current practice of blanket coverage SELF-TARGETING Self-targeting in for assistance usually requires that households make a case for their inclusion in the targeting approach. This can involve registering and completion of forms, usually a lengthy process that is encouraged to ward off those that that do not really need assistance. It is often combined with some sort of checking system (for example, by community leaders) or means testing to verify a household s inclusion. Given that such a high percentage of households are vulnerable, such a process of self-targeting in is likely to be very expensive and time-consuming in the setting of Kakuma Camp. However, self-targeting out may be an option, although it is only likely to work if incentives are offered. These incentives could involve other types of assistance to support livelihoods such as 60
73 access to micro-credit, travel permits or specific training. Of course, these would bring their own costs, and this would only be cost-efficient if the costs for these other forms of assistance were less than the cost of providing food and NFIs. Self-targeting out was discussed in the focus group discussions and most community leaders doubted that refugees would voluntarily give up or even reduce their ration in exchange for other types of support. However, a number of different incentives were discussed. First, the possibility of self-targeting out those who own a business was discussed. There was consensus among community leaders in different sub-camps that business profits are generally too low to guarantee survival without regular assistance, and that, in reality, business earnings only complementary the assistance received. This is partly attributed to the fact that the Kakuma is a fairly closed economy, and businesses are not able to sell their goods outside the refugee camp where profits would be higher. When presented with the possibility of having an incubation period, whereby refugees would continue to receive assistance as they set up and established their business, community leaders from Kakuma 3, Zone 3 still maintained that households with businesses would not opt out of receiving assistance (Congolese female, age group 25 34, long-term resident; South Sudanese male, age group 55 64, long-term resident). The possibility of households with businesses receiving travel passes as an incentive was also discussed, but no community leader thought this would work. Second, community leaders were asked whether refugees would opt out of receiving assistance if they were offered a loan to set up a business. As discussed in Section 3.2.2, loans are currently given to groups by AAHI. All community leaders agreed that loans should be given to individuals instead. In Kakuma 2, Zone 2, a Somali Block Leader (age group 25 34, long-term resident) stated that loans would make people self-sustainable only if they were allowed to leave Kakuma, which is not possible given the laws of the Government of Kenya. Similarly, a Somali Chair Lady from Kakuma 3, Zone 2 (age group 35 44, long-term resident), argued that people would only consider giving up assistance if they were given a grant and were allowed to move to Nairobi. The third self-targeting mechanism that was explored was the provision of land to refugees in exchange for a reduction or elimination of assistance. Generally speaking, the residents of Kakuma 1 and 2 are the most unlikely to voluntarily relocate elsewhere in Turkana, and only the South Sudanese from Kakuma 4 said they would consider this as an option. One Somali Block Leader from Kakuma 3, Zone 2 (age group 35 44, long-term resident) mentioned that if given the appropriate resources (for example, seeds, tools), people might be willing to forego part of their food ration. However, most community leaders believed that people would not give up their assistance in exchange for a piece of land nearby due to the harsh climatic conditions in Turkana and the issue of insecurity and conflict with the host community. One Chair Lady from Kakuma 2, Zone 2, mentioned that land could be used as a self-targeting mechanism only if refugees were allowed to relocate to a location with rain, not irrigation (Congolese, age group 35 44, long-term resident). When presented with the suggestion that the location be nearby, elsewhere in Turkana, she laughed. A South Sudanese Block Leader from Kakuma 1, Zone 3 61
74 (age group 35 44, long-term resident), stated, We are not coming to Kenya for land: when the civil in South Sudan will end, we will go back...we are not interested in land. Based on these interviews, it is unlikely that the possibility of land would serve as an effective incentive for households to self-target out of assistance, at least in the Kakuma Refugee Camp setting. Finally, self-targeting out of incentive workers was explored. During the focus group discussions, it was discussed whether incentive workers and their families would be willing to forego part or all of their assistance in exchange for an increase in incentive pay. There was agreement among community leaders that this could work, but to do so, their contractual conditions would have to be improved to become more stable. Another issue raised was that different organisations pay different rates for the same jobs, so these would have to be standardised across the camp to avoid creating competition between refugees. An important point that came out of the focus group discussions was that refugees associate their refugee status with the provision of health services. There was preoccupation that if refugees were to give up part or all of their assistance, they would no longer be entitled to receive these additional benefits. As such, if refugees were to opt out of receiving assistance through one of these methods, it is strongly recommended that health services continue to be made available and that this be clearly communicated to them. Similarly, there seemed to be some level of concern regarding how opting out of assistance would affect their status as refugees. As a South Sudanese Chair Lady (age group 25 34, long-term resident) mentioned, If you are a refugee, you know you must have your card. Another concern raised several times was that if people were targeted out or volunteered not to receive assistance but were later deprived of their main source of income (for example, due to a discontinued contract as an incentive worker), they might not be able to revert to their previous assistance package due to slow and inefficient registration procedures. This perceived inflexibility of the system seemed to be one of the main reasons why community leaders thought that targeting assistance (both self-targeting and targeting by the implementing agencies) would not work COMMUNITY-BASED TARGETING The evaluation of a community-based targeting approach necessitated additional fieldwork that was undertaken in January The approach was tested using block level community leaders (both Block Leaders and Chair Ladies, where possible) and the list of surveyed households sampled from the corresponding blocks. In total, 123 out of the 126 blocks were tested. The leaders from the three missing blocks (in Kakuma 1, 2 and 4) were either unreachable or engaged in other activities. Overall, both the Block Leader and Chair Lady were present for 38 percent of the block interviews. Only one respondent was available for the remaining 62%; three-quarters of which were conducted with the Block Leader and the remaining one-quarter with the Chair Lady. Most of the respondents were from Somalia (40 percent) and South Sudan (41 percent), but representatives from all countries of origin except Rwanda were interviewed. They covered a 62
 followed by Somalia (33 percent).")
75 range of ages (20 66 years old), duration in the blocks (1 25 years) and duration in their positions as Chair Lady or Block Leader (just a few days to up to 12 years). Interestingly, the majority of respondents in Kakuma 1 were from South Sudan (47 percent) followed by Somalia (33 percent). Most respondents in Kakuma 2 and 3 were from Somalia (67 percent and 60 percent, respectively), and, as expected, the majority of respondents in Kakuma 4 were from South Sudan (97 percent). More details are given in Annex Community knowledge The success of community-based targeting is highly dependent on leaders having an intimate knowledge of their communities. Unfortunately, in Kakuma Refugee Camp, this knowledge varied widely (see Table A50, Annex 11). For example, of the 123 blocks tested, the interviewee(s) from 13 blocks (11 percent) demonstrated extremely poor knowledge of the sampled households, knowing no more than half of them. Comparatively, only about half of the community leaders reported knowing more than 90 percent of the sampled households. In itself, this probably precludes community-based targeting from being a feasible targeting strategy. If the respondents did not know the household, the interviewers moved on to the next sampled household. If the respondents did know the household, the remainder of the relationship and ranking questions were asked for that household. In only 5 percent of the blocks did at least one of the respondents report having any business ties with at least one of the sampled households (10 percent in Kakuma 1). In one-third of the blocks, at least one of the respondents had family ties with at least one of the sampled households (44 percent in Kakuma 4) (see Table A50, Annex 11) Business/employment Community leaders rankings of household remittances and business/employment situations can be summarised into three categories (see Figure 27). The community leaders were either: certain that all of households in the block did not have cash income from the relevant source, uncertain for at least one of the sampled households in the block, or certain about the comparative level of cash income from the source and able to rank all of the households. Figure 27: Summary of Community Leaders Rankings of Household Employment and Remittances 63
76 The vast majority (93 percent) of community leaders reported knowing the business/employment situation for the households sampled in their blocks. None of the sampled households were reportedly employed in 16 percent of the blocks. In 76 percent of the blocks, employment was known with certainty, and the community leaders were able to give a comparative ranking. There was uncertainty regarding the remaining 7 percent. Differences between sub-camps and countries of origin 20 may be related and are explored in greater detail in Tables A52 and 53, Annex 11. The pattern for remittances was quite different. Nearly half (45 percent) of the blocks were uncertain whether at least one of the sampled households in their block received remittances (see Table A52 and A53, Annex 11). Community leaders expressed that a large component of this uncertainty was because money received from friends and relatives abroad is a very personal matter and is easily kept secret. One-third (32 percent) were certain that none of the sampled households in their block received remittances. The remaining 24 percent knew whether or not all of the sampled households in their block received remittances, were able to identify at least one that received remittances and were able to rank all the households. Again, there was substantial variation by country of origin and sub-camp, and details can be found in Annex 11. Selecting only those blocks where respondents were certain of all of their sampled households employment (115 blocks representing 1,520 households) and remittances (68 blocks representing 942 households), an attempt was made to look at how closely the community leaders responses tallied with the results from the household survey (see Table A54, Annex 11). In line with the larger household sample of 2,000 households, in this smaller sample, 20 percent of households were identified by the household survey as having employment. As such, the smaller sample size does not eliminate a biased share of employed or unemployed from the larger sample. Although the smaller sample does not match quite as closely in terms of remittances, as 4.4 percent were identified as receiving remittances by the household survey compared to 6.0 percent of those in the larger sample, the difference is not large enough to be concerning. Of the households represented in the employment sample, 31 percent were identified by at least one of the two sources as having a business or other employment. Of these, 40 percent were identified only by the household survey and 32 percent were identified only by the community leaders, with the remaining 27 percent were identified by both. This does not offer evidence of a particularly good correlation between data sources and provide further evidence against community-based targeting as an effective targeting strategy in this context. The correlation is even worse for households with remittances. Of the 942 households represented in the restricted remittance sample, 16 percent were identified as having remittances by at least one 20 Country of origin of the blocks is defined as the country of origin of the Block Leader or Chair Lady that was interviewed. In the few instances in which the Block Leader and Chair Lady were both interviewed but were from different blocks, the Block Leader s country of origin was selected in order to reflect common gendered power dynamics. See Table A49, Annex 11 for a disaggregation of block-level country of origin by sub-camp. 64
77 source. Of these, the vast majority (72 percent) were identified by the community-based targeting exercise alone. Twenty percent were identified only by the household survey, and only the remaining 7.5 percent were identified by both. It is not clear which data source most accurately reflects reality, but it may suggest that community leaders are better placed to offer more accurate information about household remittances than the households themselves. Very little is known about remittance inflows to refugee camps. While Professor Oka s work explored this in detail, an update to reflect the current context is an important area of future research Vulnerability At the end of the interview, after the ranking exercise, community representatives were asked whether any of the sampled households in their block would be able to survive in the absence of assistance (considered as not vulnerable) (Table A55, Annex 11). Across the 1,599 households represented by the Block Leaders that both responded to this question and had consumption expenditure data from the household survey, 10 percent were identified as not vulnerable by at least one source. Most (44 percent) of these were in Kakuma 1, 29 percent were in Kakuma 2, 22 percent were in Kakuma 3 and only 4.3 percent were in Kakuma 4. Sixty-two percent were Somali and 17 percent were South Sudanese. Following the remittance findings, the majority (61 percent) of these were identified only by the community leaders. A large share was identified only by the household survey (35 percent), with only the remaining 4.3 percent identified by both sources. The subgroup with the largest share of non-vulnerables identified by both sources was Kakuma 1, at 8.3 percent. These findings again highlight the poor applicability of a community-based targeting methodology to the Kakuma camp context. Finally, the question was expended to ask whether any of the households residing in the block as a whole, beyond those that had been sampled in the survey, would be able to survive without assistance. Across 123 blocks, 37 percent were able to identify at least one household in their block that could support themselves in the absence of assistance. This varied markedly by subcamp, with 54 percent of blocks in Kakuma 1 and 39 percent of those in Kakuma 2 and 3 compared to only 8 percent of those in Kakuma 4. By country of origin, 46 percent of Somali blocks identified at least one household in the entire block that could survive without assistance, compared with only 24 percent of South Sudanese blocks. The most commonly cited criteria for identifying these households were remittances, businesses and incentive work Correlations between household rankings from community-based targeting exercise and expenditure/capita/day from household survey In order to compare the rankings of the households given by the community leaders with the actual rankings as determined by expenditure/capita, we calculated a Spearman correlation coefficient for each block. A correlation coefficient of 1.0 indicates that the community leaders ranked the households exactly as they are ranked by expenditure/capita. A correlation coefficient of 1.0 indicates that the community leaders ranked households exactly opposite of the rankings given by expenditure/capita. A coefficient of 0.0 indicates that there is no correlation. Spearman correlation coefficients of 0.8 and above are considered to represent very strong relationships. The correlation coefficients were calculated on a block level for 114 of the 123 blocks that were interviewed, as they were not calculated for blocks for which community 65
78 leaders did not provide differential rankings. The coefficients were also aggregated to the zone and sub-camp levels. For more information on the methodology and the considerations made when aggregating the correlation coefficients see Annex The distribution of correlation coefficients was quite wide, ranging from 1.0 to 0.97 (see Figure A4, Annex 11.4). This suggests that some community leaders know the households in their block quite well, while others are not at all able to give an accurate assessment of their vulnerability. Of the 114 community leader rankings used in the analysis, 42 (more than onethird) had negative correlations. The largest frequency of correlations occur between 0.1 and 0.5. Only three community leaders rankings had very strong correlations (>=0.8) with the actual rank given by expenditure/capita. When aggregated to the zone level, the best performing zone (Kakuma 1, Zone 3) had what would be considered a strong correlation (0.558). However, when aggregated to the sub-camp level, this was diluted by the poor correlations of other zones. All sub-camps had a weak to non-existent correlation. Taken together, these findings indicate very poor performance of a community-based targeting methodology Focus group discussions The possibility of using a community-based targeting approach was discussed during the focus group discussions. Community leaders in most of the focus group discussions argued that assistance should not be cut any further, and that there were no (or in some cases only very few) households that could survive without assistance. Rather than adopting a targeting out approach, the leaders asked our researchers if it was possible to revert to the bi-weekly distribution of food as opposed to the current monthly distribution, as the assistance provided was not enough. Even in zones that have some wealthier households, community leaders said they would not feel comfortable identifying them because of the possible repercussions (for example, complaints, insecurity, being ostracised by the community and so on). However, they would be willing to identify the most vulnerable households to be targeted in with additional assistance, as this would be appreciated by the community. This point was made in multiple focus group discussions, including those held in Kakuma 1, Zones 3 and 4, and Kakuma 2, Zones 1 and 2. In terms of targeting in with additional assistance, the community leaders listed those groups that they would identify as being most vulnerable. For example, during the Kakuma 1, Zone 1 focus group discussion, an Ethiopian Block Leader (age group 25 34, long-term resident), stated that the most vulnerable groups who should receive more assistance and could be identified by community leaders were widows, orphans, unaccompanied minors, single mothers, elderly people and sick people with chronic diseases. Similarly, a Congolese Chair Lady (age group 35 44, long-term resident) from Kakuma 2, Zone 2, stated that targeting in could be done with the assistance of community leaders who could identify the vulnerable households, namely those with special needs, widows, orphans and foster children. During the community-based targeting testing, it also emerged that there is some informal redistribution of food assistance in the camp. For instance, during the fieldwork, our researchers 66
79 discovered that some communities, such as Dinkas from South Sudan, share their food and eat as a community. In addition, a Somali Block Leader (age group 25 34, long-term resident) from Kakuma 1, Zone 1, explained that some wealthier households redistribute part or all of their ration to more vulnerable households. This is important, as targeting them out would eliminate this informal redistribution, trickling down to have adverse effects on vulnerable households. 67
80 7 CONCLUSIONS AND RECOMMENDATIONS Given the harsh environment, restrictions on movement, lack of access to viable arable land and other restrictions on economic activity, very few refugees have been able to diversify their incomes to the extent that they could meet a significant proportion of their basic needs from their own resources. This is despite major investments in vocational training and incomegenerating activities in the last two decades. Without greater economic integration, the opportunities for targeting will remain limited. Recommendation 1. Full assistance should continue to be provided to all refugees, although incentives to encourage self-targeting out could be explored. Only 4.2 percent of Kakuma refugee households are not vulnerable, based on our definition that they could afford a minimum healthy food basket and essential NFIs valued at 77 Ksh/capita/day. The current approach of delivering food and NFI assistance to all households in the camp therefore comes with an inclusion error of 4.2 percent (percentage of non-vulnerable households in the camp) and an exclusion error of 0 percent (as all households are targeted). According to WFP standards, these are within acceptable limits and furthermore follow the do no harm principle, as no vulnerable households are excluded. In addition, to identify and target out 4.2 percent would probably be more costly than including them. The effectiveness of community-based targeting using community leaders is extremely poor, both in terms of ranking the wealth status of households surveyed in their block and in directly identifying those who could survive in the absence of assistance. Only 55 percent of the community leaders interviewed knew more than 90 percent of the surveyed households in their blocks, and only 2.6 percent were able to adequately rank households with a correlation coefficient greater than 0.8. Categorical targeting and proxy means testing would not be in line with a do no harm principle. Although some of the options explored for categorical targeting and proxy means testing using a limited dataset could reduce the inclusion error to as low as 2.0 percent, this is at the expense of the exclusion error, which would increase to 4.8 percent, suggesting that over one thousand households that need assistance could be excluded if the programme were upscaled. This is the best-case scenario for the limited dataset, for which we believe households would not be inclined to adjust their responses, and it is based on a machine learning model and elimination of all assistance. If the aim is to reduce rather than completely eliminate all assistance, then although the proportion of non-vulnerable households increases as the vulnerability threshold decreases, only 30 percent could afford the minimal input of 15 Ksh/capita/day to cover their own NFIs. Furthermore, none of the categorical targeting or proxy means testing targeting approaches explored would be able to target effectively (with acceptable errors) for such minor reductions in assistance. The lowest threshold explored for which any targeting mechanism would produce acceptable errors (<10 percent) is 46 Ksh/capita/day, which represents a 68
81 reduction in food assistance by half. Even for this threshold, the combined errors are much higher than that for a continuation of the status quo (blanket coverage of assistance). The only remaining approach is self-targeting out. This was not explored directly, but discussions with Block Leaders suggested that while land provided elsewhere in Turkana would not be an effective incentive strategy, offering incentives for business owners (such as individual loans or travel passes) or an increase in pay for incentive workers might be of interest to some households. However, the primary request expressed during focus group discussions was for freedom of movement and lifting of restrictions on working in Kenya. Given that these restrictions are outside the control of WFP and UNHCR, they will likely remain a barrier to any opportunities for creating independence of the refugee population. Refugees are highly risk averse. For any attempt at self-targeting out to be effective, the process of re-registration must work smoothly, such that if a household that has opted out loses its livelihood, its members can begin receiving their ration without delay. Recommendation 2. UNHCR should undertake a household census across the entire camp in order to update the household statistics in its database. This corrected data will facilitate better planning for UNHCR and partners, and could result in savings in resources. During the scoping exercise, we noted that some households had moved from the locations on the UNHCR database. Perhaps even more importantly, when undertaking the survey, it became apparent that the household definition used by UNHCR (based on ration cards allocated to households upon arrival), and therefore the unit for which routine statistics are reported, is different from the traditional demographic definition (individuals that eat and sleep together). This is due to the fact that many ration cards join up after arriving at the camp to form larger household units. The ration card definition underestimates the average household size and overestimates the proportion of household size 1s and child-headed households. Our study suggests that only 1 percent of households are child-headed and 5 percent are household size 1, compared to 8 percent and 33 percent, respectively, as reported by UNHCR. A census update is particularly critical if any assistance is to be targeted, based on demographic data contained in the UNHCR database. Recommendation 3. Household size 1 should not be targeted for special assistance, as they are less vulnerable than households with more members. Groups traditionally perceived as vulnerable should be verified by the data before they receive preferential treatment. In addition to the above, the study found that household size 1 are not particularly vulnerable and, in fact, are the least vulnerable household size group. As such, we recommend halting the targeting of food assistance based on household size. A detailed analysis revealed that there are several common misconceptions about groups traditionally perceived as vulnerable. While female-headed households are indeed more vulnerable than male-headed households, households with a disabled member or head of household are, in fact, better off than average. Similarly, vulnerability actually increases with 69
82 household size, with households having more than 10 members being the most vulnerable group. Finally, households having resided in the camp since its inception are commonly perceived as having had the opportunity to establish the strongest foothold in the camp, to have the most employment opportunities and to be the least vulnerable. However, this is not the case, household vulnerability follows an inverse U-shaped correlation as duration in camp increases. Recommendation 4. A needs assessment should be undertaken to understand the vocational training requirements of the population and to explore livelihoods that could be enabled within the camp such as businesses or other employment opportunities. Few households reported having any members that had received any vocational training (13%), with only 6 percent of all adults having participated in vocational training. If refugees are to be encouraged to support themselves outside of their traditional livelihoods such as farming, this needs to be expanded. English is an important factor enabling access to existing vocational training opportunities (10 percent of English-speaking adults have accessed vocational training compared to 4 percent of non-english speaking adults). To ensure that vocational training is more widely accessible, English language courses should be offered, and the possibility of offering vocational training in multiple languages should be explored. Any further research on businesses and/or employment should consider the fact that businesses and the employed are not homogenous groups, and a more nuanced classification of business/employment types is recommended. Having a household member employed or in business does not guarantee an adequate income, as many households are involved in quite informal business types such as hawking (selling tea or mandazis). This is quite different from the traditional view that households with businesses are more skilled and have more lucrative opportunities. Income from business and employment are both highly skewed, suggesting that neither is sufficient to alleviate a household from poverty. This is supported by the vulnerability analysis, as 81 percent of households with a business and 86 percent of households with employment would not be able to survive without assistance equivalent to the minimum food and NFI basket. Recommendation 5. NGO and donor organisations should work together to identify a common pay scale for incentive staff. Focus group discussions revealed that incentive staff with similar jobs receive differential wages that depend on the donor or NGO they work for, and this can create tension. Particularly if self-targeting out is an option given to incentive staff, organisations must work towards standardising rates paid for similar jobs and providing more stable contracts. Recommendation 6. Future research should be conducted on remittances. 70
83 Although both the household survey and the community-based targeting exercise included questions on remittances, little is known about this sensitive, but important, income source that contributes roughly one-third of the cash income to the camp s economy. We suggest an updated and focused review of the sizes, sources, uses and mechanisms for transfer of remittances in the context of refugee camps as an expansion of, and update to, Professor Oka s previous work in this area. Conclusion Despite the fact that the findings of this study support the continuation of blanket coverage of assistance in Kakuma Refugee Camp, it has given important insight into household livelihoods, household size dynamics and other vulnerability myths, perspectives of refugees and the current state of the UNHCR database. Given that there has not been extensive work conducted in this area, there may be a tendency to apply the findings from this study to other refugee camps. It is important to keep in mind that, given the unique context of the camp (restrictions on livelihoods including animal ownership, movement and legally sanctioned employment; the harsh climate of Turkana and remote location of the camp; and the protracted nature of the settlement), these findings do not necessarily preclude the possibility that targeting may be an effective strategy in other refugee settings. 71
84 BIBLIOGRAPHY Betts, A. (2004), International cooperation and the targeting of development assistance for refugee solutions: Lessons from the 1980s. Working Paper No. 107, UNHCR, Geneva (2004). Breiman, L. (2001), Random forests. Machine Learning, 45(1), Geurts, P., Ernst, D. and Wehenkel, L. (2006), Extremely randomized trees. Machine Learning, 63(1), Guyatt, H. (2015), Refugee Vulnerability Study: Kakuma, Kenya. Inception Report. Report prepared for WFP and UNHCR. November Jamal, A. (2000). Minimum standards and essential needs in a protracted refugee situation. A review of the UNHCR programme in Kakuma, Kenya, EPAU Evaluation Report EPAU/2000/05, UNHCR, Geneva, McBride, L. and Nichols, A. (2015), Improved poverty targeting through machine learning: An application to the USAID Poverty Assessment Tools. Ochieng, E. (2013), Promoting life skills and livelihoods in Kakuma, Kenya, Market Analysis Study for the Swiss Development Cooperation (SDC). July Oka, R. (2011), Unlikely cities in the desert: The informal economy as causal agent for permanent "urban" sustainability in Kakuma Refugee Camp, Kenya, Urban Anthropology and Studies of Cultural Systems and World Economic Development, 40 (3), Oka, R. (2014), Coping with the refugee wait: The role of consumption, normalcy, and dignity in Refugee lives at Kakuma Refugee Camp, Kenya, American Anthropologist, 116 (1), Ravallion, M., Chen, S. and Sangraula, P. (2008), Dollar a day revisited, World Bank Policy Research Working Paper Republic of Kenya (2006). The Refugee Act. Sachs, J. (2005), The end of poverty: Economic possibilities of our time, Penguin, New York. UNHCR/WFP (2012), Joint UNHCR/WFP impact evaluation of food assistance to refugees in protracted situations in Chad, summary evaluation report for EB 1 (2013). UNHCR (2015), Kakuma operational update: 29 October 11 November. Wagle, U. (2002), Rethinking poverty: Definition and measurement, UNESCO. 72
85 WFP (2015), Food security and outcomes monitoring: Refugees operation, December WFP (n.d.), Technical guidance for WFP s consolidated approach for reporting indicators for food security (CARI). World Bank (2015). FAQs: Global poverty line update, Retrieved from: March
86 ANNEX 1. DETAILS OF THE HOUSEHOLD SAMPLING AND RESULTS 1.1 SAMPLING The scoping exercise (Guyatt, 2015) provided important information on key determinants of integration into the camp, broader livelihood systems and access to incomes, the diversity of wealth proxies across the refugee population and the sub-camps, and other key groups that could serve as vulnerability proxies, such as child-headed households and households with a disabled person. This understanding was used to inform the sampling strategy. The sample size was designed to capture the major heterogeneities in household characteristics and enable a vulnerability profile of consumption and expenditure patterns across the camps to be established. As such, it was based on figures from the UNHCR data registration database, which allowed for prediction of the number of different household types that would be sampled under different sampling scenarios thereby ensuring that a sufficient number of each group would be sampled. As each sub-camp is distinct in its refugee profile and access to income and livelihood opportunities, the first level of sampling was at the sub-camp. The sample size for each subcamp was selected to ensure confidence in any proportion estimate reflecting socio-economic status. Based on the standard formula 21, this required 400 households in each sub-camp (totalling 1,600 households over the entire camp). However, a sample size of 1,600 would not ensure that all of the different household types would meet the criteria necessary for estimation of a proportion. Instead, some countries of origin and vulnerable groups would not have large enough representation such as to meet the minimum sample size of 400. As such, an additional 100 households were added for each subcamp, for a total of 500 households per sub-camp, or 2,000 households in total. This allowed for greater capture of minority vulnerable groups to provide statistical confidence in very high true proportions. The second level of sampling was at the block level to ensure geographical spread and facilitate in-the-field sampling, given that blocks tend to be composed of similar CoOs and are governed by community block leaders. Table A1 provides a summary of the number of households sampled per block in each sub-camp. The number sampled depended on the number of blocks in each sub-camp so that the total sampled was The minimum sample size required to have 95 percent confidence in the estimation of a proportion has the standard formula: n = (Z2 P(1 P))/e2 where Z = value from standard normal distribution corresponding to desired confidence level (Z=1.96 for 95 percent CI); P is expected true proportion and e is desired precision (half desired CI width) (here assumed to be 0.05). In order to attain 95 percent confidence in any proportion one needs a sample size of 386 (equivalent to the worst case scenario of a true prevalence of 0.5), decreasing to 289 for true proportions <=0.25 and >=0.75, and 196 for proportions <=0.15 and >=
87 Table A1: Households Sampled per Block Sub-camp Number of blocks Number of households sampled by block Total households sampled Kakuma Kakuma Kakuma Kakuma The initial plan was to randomly sample from the UNHCR database. However, under field testing the database was found to have major limitations. First, households listed in a given block could not be located in the field, usually because they had moved and the database had not been updated. Second, the database contained many blocks that did not exist in the field, most probably as data entry errors. As a result it was decided to implement the random sampling directly in the field. A random walk sampling procedure was employed to identify the households to be interviewed in each block. 75
88 1.2 HOUSEHOLD CHARACTERISTICS Table A2 summarises the differences between key head of household characteristics of the 2,000 sampled households in the vulnerability survey (where a household was considered to be one that ate and slept together) and the UNHCR household that equates to a ration card. The table also provides an estimate of how the survey results may have differed if the household was instead defined by ration card. This was determined by first identifying the ration card of the head of household. For the remaining ration cards within a household, the eldest member of the ration card was assigned as head of ration card. Table A2: Comparison of Key Household Characteristics between Vulnerability Household Survey and UNHCR Statistics Dated 9 September 2015 Kakuma 1 Kakuma 2 Kakuma 3 Kakuma 4 Total UNHCR database 48% 40% 44% 56% 47% Femaleheaded households 22 Survey (our household definition) 54% 37% 40% 62% 48% Survey (if assume ration card is a household) 51% 43% 42% 58% 49% UNHCR database 6.7% 5.9% 8.2% 11% 7.6% Child-headed households Survey (our household definition) 0.6% 0.0% 0.0% 4.0% 1.2% Survey (if assume ration card is a household) 10% 3.4% 2.4% 6.3% 5.9% UNHCR database 48% 47% 39% 30% 33% Household size 1s Survey (our household definition) 2.8% 5.0% 4.0% 8.6% 5.1% Survey (if assume ration card is a household) 28% 21% 18% 17% 22% 22 Note: Both calculations from the survey include child-headed households. According to the survey definition of a household, 1.5 percent of male-headed households were also headed by children compared to 0.8 percent of female-headed households. According to the ration card definition of a household, 7.6 percent of male-headed households were also headed by children compared to 4.1 percent of female-headed households. 76


89 Figure A1 shows the proportion of households from each country of origin in our survey compared to the UNHCR database. They are similar, suggesting that ration card holders tend to join up with others from the same country of origin to operate as functioning households. Figure A1: The Proportion of Households from each Country of Origin According to (1a) Our Household Sample and (B) UNHCR Database 77
90 ANNEX 2. COMMUNITY-BASED TARGETING AND FOCUS GROUP DISCUSSIONS In January 2015, a team went back to Kakuma to meet with community leaders to test the community-based targeting approach and to undertake focus group discussions addressing the feasibility of different targeting mechanisms (including community-based targeting, categorical targeting and self-targeting) and the different livelihood options available to refugees in the camp. 2.1 QUESTIONNAIRE FOR THE COMMUNITY-BASED TARGETING EXERCISE WITH COMMUNITY LEADERS The questionnaire was administered to community leaders of 123 of the 126 blocks. Efforts were made to interview both community leaders together. However, due to the time constraints and other commitments of the leaders (including mandatory meetings with UNHCR during the first week of the fieldwork and the food distribution during the second week), it was not always possible to interview them together, and the community-based targeting was then only tested with one representative. For each block, details of the interviewees were taken (name, age, sex, country of origin, year of arrival in the camp, duration in the block (years), position, and duration in this position (years)), as well as the approximate number of households in the block. The questionnaire was set up on a spreadsheet and was administered using a tablet. It included a list of sampled households for each block and, more specifically, the following information for each of the 2,000 households: name of household head, country of origin, year of arrival in the camp and household size. The questionnaire was administered by one Kimetrica staff member per block with the assistance of interpreters. During the first four days of fieldwork, an average of 12 blocks were covered per day by four Kimetrica staff, in addition to three focus group discussions per day. Once the focus group discussions were completed, an average of 14 community-based targeting questionnaires were administered per day by two staff. In each block, after obtaining the basic details described above, the community leaders were shown the list of sampled households (on a printed sheet of paper). The leaders were first asked whether they knew each household. If they did not know the households or did not know them well enough to compare to other households, then no other information was collected. Both the Block Leader and Chair Lady were then asked how long they had known a household for (years), how often they interacted with this particular household or household member (on a daily, weekly, bi-weekly, monthly basis or less frequently) and whether they had business or family ties with any of them. The community leaders were then asked to jointly rank the households according to different criteria (wealth assets, remittances, business or employment income, and overall wealth and 78
91 income), on the condition that at least one of them knew the household. The ranking exercises were done using cards, with each household written on a separate card. This system allowed the community leaders to easily compare all the households. Households for which a specific criterion was not relevant (for example, households that did not receive any remittances or that did not have any household members employed) were excluded from the ranking and were given a 0. Following these ranking exercises, the leaders were asked whether any of the households listed would be able to support themselves in the absence of assistance (in-kind and in cash). Finally, both the Block Leader and the Chair Lady were asked whether there were any households in the entire block that could survive without assistance, and if yes how many would these be and how they could be identified. The entire questionnaire took between 30 minutes and one hour, depending on the number of sampled households in that block and whether both community leaders were present. 2.2 FOCUS GROUP DISCUSSIONS WITH COMMUNITY LEADERS The focus group discussions with community leaders were undertaken after the communitybased targeting questionnaire to avoid influencing their responses. One focus group discussion was held for each zone of Kakuma, for a total of 12 zones across the whole camp, with blocks within the zone selected at random. The focus group discussions focused on two main issues targeting and livelihoods and lasted between 45 minutes to an hour. Efforts were made to ensure diversity in the country of origin representation and gender balance among focus group discussion participants. At the beginning of the discussion, an attendance sheet was passed around collecting information including name, sex, age, country of origin, location in the camp, position and telephone number. A brief introduction was provided: We have asked you to come today as we would like your input into a discussion on targeting assistance based on household needs and more generally on livelihoods. In the context of decreasing funding and the recent ration cuts, we would like to understand whether it would be possible to identify households which do not require as much assistance as others (or none at all) or that might prefer to receive a different kind of assistance. We feel that as nominated leaders of your community, you are in an ideal position to provide important insights on this issue. We will limit the discussion to 30 minutes to avoid taking up too much of your time. The following key questions were then presented to the group. A maximum of 10 minutes was spent on any one question. For each response, the respondent was asked for name and country of origin. Targeting out via community-based targeting: 79
92 If we want to target out households from receiving assistance, what criteria would you use to determine who those households would be (can prompt with different criteria: wealth assets, income, remittances, owning a business)? Do you feel that you would be able to identify those households who do not need assistance? If targeting out was adopted using this method, what possible conflicts might occur? Targeting out via categorical targeting: What would happen if only those households in Kakuma 3 and Kakuma 4 were to receive assistance? Would people move to these areas? What type of conflicts might occur? What would happen if certain vulnerable groups, such as household size 1s or femaleheaded households, were to receive more assistance than others? Targeting out via self-selection ( opting out ): Are there households in your block that would prefer to receive other support rather than NFIs or food assistance? What kind of support? (If they don t immediately respond, can prompt with: Micro-credit? Training?) Many households were farmers before they arrived in the camp. How do you think this livelihood could be promoted? Would households prefer to not receive assistance in return for land for agriculture (perhaps in a new camp)? What are the constraints? Would households forego assistance (food rations or NFIs) to be ensured either a permanent minimum salary position with an NGO or an official business licence with no added costs or something else? Do you think that people would volunteer to not receive assistance so that others could receive more? What could be done to motivate them? In general, what types of households do you think would opt out in exchange for any other type of support? Young people? Those with a business? The loan system is an important income: Who provides these? How do they work? What are the interest rates and repayment conditions? Who can access these? Summary Do you think that self-targeting or community-based targeting would work? How would they best work or why would they not? (Would households redistribute on their own?) Table A3 summarises the main characteristics of the focus group discussion participants. In total, 76 people participated in the focus group discussions, comprising Block Leaders, Chair Ladies and some members of the community (block security officers or block secretaries). The average number of focus group discussion participants was 6.3. Of the 76 participants, 32 were females (42%) and 44 were males (58%). Overall, Somalis and South Sudanese were equally represented and accounted for the greatest proportion of all participants (38%), Congolese were the second largest group (11%), followed by Ethiopians and Sudanese (both 5%) and finally Burundians (3%). The participants ages ranged between 20 and 64 years. There was a mixture of arrival status, with 21 percent of participants (for which the year of arrival was known) arriving 80
93 after 2013, 67 percent of participants arriving between 2002 and 2012, and 11 percent arriving in the 1990s. 81
94 Table A3: The Participants of the 12 Focus Group Discussions Focus group discussion # Sub-camp Zone Block Country of origin Sex Age Year of arrival Somalia M Ethiopia F Ethiopia M Ethiopia M Somalia F Somalia F Somalia M South Sudan F South Sudan M Somalia M Somalia F 21 missing* South Sudan M South Sudan M South Sudan F South Sudan M Sudan M South Sudan F South Sudan F Sudan M South Sudan M Sudan M DR Congo M DR Congo M South Sudan F South Sudan F Somalia M Somalia M Somalia F Somalia F Ethiopia M Somalia F Somalia M Somalia M DR Congo M Somalia F DR Congo F Burundi M 28 missing* 82
95 DR Congo F Somalia M Somalia F DR Congo M Somalia M Somalia M Somalia F Somalia F Somalia F Somalia M Somalia M 26 missing* Somalia F 52 missing* Burundi F Somalia M Somalia M 64 missing* Somalia F Somalia M Somalia M 45 missing* South Sudan M Sudan M DR Congo F DR Congo F South Sudan M South Sudan M South Sudan F South Sudan M South Sudan F South Sudan M South Sudan M South Sudan F South Sudan M South Sudan F South Sudan F unknown South Sudan M South Sudan M South Sudan M South Sudan M South Sudan F South Sudan F *Note: Participants whose year of arrival was marked as missing* did not participate in the community-based targeting exercise and their year of arrival was thus not captured. 83
96 ANNEX 3. INCOME RESULTS Households were asked about their sources of income over the previous 30 days. Table A4 shows the percentage of households that reported receiving any income (about one-third of all households), as well as the percentage reporting income from each source. Table A4: Sources of Household Income Last Month Sample size 23 Rec d income Gift from rel/ friends inside the camp Gift from rel/ friends outside the camp Reselling food ration Selling other items Small jobs (petty trading) Employment Business Total 2,000 32% 2.0% 6.0% 10% 1.9% 8.0% 10% 8.2% K % 1.2% 7.8% 11% 2.8% 7.6% 13% 9.2% Subcamp K % 2.6% 7.6% 5.4% 1.2% 6.2% 8.0% 6.3% K % 2.0% 4.8% 8.4% 0.8% 15% 6.9% 8.3% K % 2.0% 3.6% 13% 2.8% 3.4% 2.6% 1.8% Somalia % 2.7% 12% 7.7% 1.7% 12% 13% 15% South Sudan % 1.4% 3.4% 11% 2.4% 3.7% 4.3% 2.2% Country of origin Sudan 97 30% 4.1% 2.1% 13% 2.1% 5.2% 10% 8.2% Ethiopia 82 37% 2.4% 4.9% 12% 1.2% 8.5% 11% 16% Burundi 73 42% 0.0% 0.0% 8.2% 1.4% 16% 12% 18% DR Congo % 1.3% 0.7% 8.0% 0.7% 15% 31% 6.0% Other 9 56% 0.0% 11% 11% 0.0% 11% 44% 11% Year of arrival <2014 1,369 36% 2.3% 6.9% 8.1% 1.8% 10% 10% 8.3% % 1.3% 3.8% 13% 2.2% 4.0% 2.4% 2.4% 23 Fifty-eight households did not identify whether they received cash from employment, reducing the total sample size to 1942 households. The sample sizes for the various sub-camps were reduced to 491 for K1, 464 for K2, 492 for K3 and 495 for K4. country of origin sample sizes were reduced to 641 for Somalia, 914 for South Sudan, 96 for Sudan, 79 for Ethiopia, 72 for Burundi, 132 for DR Congo and eight for Other. The year of arrival sample sizes were reduced to 1317 for <2014 and 625 for >=2014. Similarly, 38 households did not identify whether they received cash from business, reducing the total sample size to 1962 households. The sample sizes for the various sub-camps were reduced to 492 for K1, 476 for K2, 495 for K3 and 499 for K4. country of origin sample sizes were reduced to 639 for Somalia, 921 for South Sudan, 95 for Sudan, 78 for Ethiopia, 72 for Burundi, 148 for DR Congo and Other remained at 9. The year of arrival sample sizes were reduced to 1331 for <2014 and 631 for >=
97 Of the one-third of households that reported receiving any income, three-quarters receive income from only one of the aforementioned sources, while the other quarter received income from two or more sources (see Table A5). Table A5: Number of Income Sources 24 Sample size Total 2,000 68% 24% 8.0% K % 29% 11% Sub-camp K % 19% 9.0% K % 31% 7.0% K % 18% 5.4% Somalia % 33% 11% South Sudan % 16% 4.6% Sudan 97 70% 20% 10% Country of origin Ethiopia 82 63% 26% 11% Burundi 73 58% 34% 8.2% DR Congo % 29% 10% Other 9 44% 33% 22% Year of arrival <2014 1,369 64% 27% 9.3% % 18% 5.1% 24 Due to rounding, values may not add up to precisely 100 percent. 85
98 As shown in Table A6, nearly half of all businesses were started with savings earned in the camp, although a substantial portion were started with loans (25%) and gifts (19%). Table A6: Sources of Business Start-Up Funds Sample size Savings before came to camp Savings earned in camp Loan Gifts Sell ration or Bamba Chakula Sell assets None Total % 45% 25% 19% 1.9% 0.6% 0.6% K % 64% 14% 14% 6.0% 0.0% 0.0% Subcamp K % 27% 50% 15% 0.0% 1.9% 0.0% K % 50% 13% 26% 0.0% 0.0% 0.0% K4 9 22% 22% 11% 33% 0.0% 0.0% 11% Somalia % 41% 32% 22% 0.0% 0.0% 0.0% South Sudan 18 11% 50% 11% 22% 5.6% 0.0% 0.0% Sudan 8 0.0% 63% 13% 13% 13% 0.0% 0.0% Country of origin Ethiopia 13 15% 46% 23% 15% 0.0% 0.0% 0.0% Burundi % 54% 23% 7.7% 0.0% 7.7% 7.7% DR Congo 9 22% 56% 0.0% 11% 11% 0.0% 0.0% Other 1 0.0% 0.0% 100% 0.0% 0.0% 0.0% 0.0% Year of arrival < % 33% 25% 25% 0.0% 0.0% 8.3% % 46% 26% 19% 2.1% 0.7% 0.0% 86
99 Only about one-tenth of households reported having taken a loan in the past month (see Table A7). Borrowing was particularly high among households in Kakuma 2 and among Somalis. The amount borrowed ranged from 50 to 100,000 Ksh, with a median value of 4,000. Table A7: Loans Taken in Last Month Sample size Took loan in last month If taken, amount Mean Median Min Max Total 2,000 11% 6,987 4, ,000 K % 10,021 5, ,000 Subcamp K % 8,173 2, ,000 K % 3,352 2, ,000 K % 2,574 4, ,000 Somalia % 9,034 5, ,000 South Sudan % 3,280 2, ,000 Sudan % 1,980 1, ,000 Country of origin Ethiopia 82 11% 11,313 5, ,000 Burundi 73 12% 1,672 1, ,000 DR Congo % 6,625 4,500 1,000 22,000 Other 9 11% 5,000 5,000 5,000 5,000 Year of arrival <2014 1,369 13% 7,941 5, , % 2,427 2, ,000 87
100 Few households (only 4.6%) reported owing debts in the last month, though the proportion of Burundians was relatively high at 12 percent (see Table A8). The amount owed ranged from 100 to 40,000 Ksh, with a median value of 3,000. Table A8: Debts Owed in Last Month Sample size Owed a debt last month If owed, amount Mean Median Min Max Total 2, % 4,773 3, ,000 K % 5,707 4, ,000 Sub-camp K % 4,574 4, ,000 K % 7,889 6, ,000 K % 1, ,000 Somalia % 7,262 4, ,000 South Sudan % 2,804 2, ,000 Sudan % 3,700 1, ,000 Country of origin Ethiopia % 10,300 8, ,000 Burundi 73 12% 3,169 2, ,000 DR Congo % 1,790 1, ,000 Other 9 11% 5,000 5,000 5,000 5,000 Year of arrival <2014 1, % 5,400 4, , % 2, ,000 88
101 ANNEX 4. FOOD SECURITY DEFINITIONS, CALCULATIONS AND RESULTS 4.1 FOOD CONSUMPTION PATTERNS Only about half of the households surveyed consume any foods outside of a subsistence diet (maize, sorghum, wheat flour, rice, porridge, green grams, other pulses, onion, milk products, sugar and/or oils and fats). Table A9 shows the percentage of households consuming other foods. Table A9: Percentage of Households Consuming More Diverse Diets (Groups) Food groups Cereals, roots and tubers other than maize, sorghum, wheat flour, rice, porridge (millet, pasta, bread, other cereals, potatoes, cassava, or other root crops) Pulses other than green grams and other pulses (beans, cow peas, or pigeon peas) Vegetables other than onion (carrot, pumpkin, other orange vegetables, sukuma, spinach, cabbage, other green leafy vegetables, tomatoes, other vegetables) Fruits (mango, banana, papaya, apple, other fruits) Animal proteins (goat, camel, beef, chicken, other meat, liver, kidney, tilapia, omena, tinned tuna, other fish, eggs) Percentage consuming (n=1986) 27% 17% 28% 1.1% 16% Proportion by sub-camp 35% K1 34% K2 31% K3 8.3% K4 24% K1 19% K2 16% K3 8.9% K4 41% K1 28% K2 32% K3 10% K4 2.4% K1 1.6% K2 0.0% K3 0.4% K4 26% K1 21% K2 17% K3 2.6% K4 Proportion by country of origin 49% Somalia 12% S Sudan 19% Sudan 52% Ethiopia 21% Burundi 21% DR Congo 22% Other 22% Somalia 13% S Sudan 18% Sudan 17% Ethiopia 30% Burundi 17% DR Congo 22% Other 47% Somalia 11% S Sudan 21% Sudan 46% Ethiopia 36% Burundi 37% DR Congo 33% Other 2.1% Somalia 0.4% S Sudan 0.0% Sudan 1.2% Ethiopia 1.4% Burundi 1.4% DR Congo 0.0% Other 31% Somalia 4.3% S Sudan 11% Sudan 17% Ethiopia 11% Burundi 33% DR Congo 22% Other Proportion by arrival status 34% before % new arrivals 20% before % new arrivals 35% before % new arrivals 1.5% before % new arrivals 23% before % new arrivals 89
102 4.2 FOOD CONSUMPTION SCORE The Food Consumption Score is calculated as the sum of the frequency of consumption (number of days) for each of the 16 food groups in the last seven days weighted by a factor based on the nutrient density of each food group. The 16 food groups and corresponding weights given for their nutrient value are given in Table A10. The consumption of proteins such as meat and eggs have a higher nutrient value than vegetables and fruit. The scores are used to assign households into groups of poor Food Consumption Score (between 0 and 21), borderline Food Consumption Score (between ) and acceptable Food Consumption Score (more than 35). This classification follows WFP standards (WFP, n.d.). Table A10: Food Groups and Nutrient Value Scores for Calculation of Food Consumption Score and Dietary Diversity Score Weight used for Food Consumption Score (nutrient value) Food groups used for Food Consumption Score Food groups used for Dietary Diversity Score 2 Cereals and grain 2 Roots and tubers 1. Cereals, roots, and tubers 3 Legumes / nuts 2. Pulses and legumes 1 Orange vegetables (vegetables rich in Vitamin A) 1 Green leafy vegetables 3. Vegetables 1 Other vegetables 1 Orange fruits (Fruits rich in Vitamin A) 1 Other fruits 4. Fruits 4 Meat 4 4 Fish / Shellfish Liver, kidney, heart and / or other organ meats 5. Meats, fish and seafood, and eggs 4 Eggs 4 Milk and other dairy products 6. Dairy products 0.5 Oil / fat / butter 7. Oils and fats 0.5 Sugar, or sweet Not considered 0 Condiments / Spices Not considered 90
103 Table A11 summarises the results of the food consumption score analysis. While most households have an acceptable Food Consumption Score (42%), roughly a quarter have a poor Food Consumption Score. There is notable variation among countries of origin, with over half of Somalis in the acceptable range and nearly one-third of South Sudanese scoring as poor. Table A11: Food Consumption Score Groups and Scores Food Consumption Score group Food Consumption Score score Sample size Poor (0 21) Borderline ( ) Acceptable (>35) Mean Median Min Max Total 1,986 26% 32% 42% K % 33% 44% Sub-camp K % 27% 45% K % 31% 40% K % 37% 41% Somalia % 26% 56% South Sudan % 36% 33% Sudan 96 28% 32% 40% Country of origin Ethiopia 82 29% 28% 43% Burundi 73 26% 33% 41% DR Congo % 34% 43% Other 9 33% 33% 33% Year of arrival <2014 1,360 25% 30% 45% % 37% 37% DIETARY DIVERSITY SCORE The Dietary Diversity Score is calculated as the number of different food groups consumed in the previous week out of a total of seven. The seven food groups are listed in Table A10. If a household consumes at least one item from each food group over the previous week they score a 7 (that is, all groups were consumed from). The Dietary Diversity Score can also be used to group households into those with a low dietary diversity (<4.5), a medium dietary diversity (between 4.5 6) and an acceptable dietary diversity (>6). Different thresholds can be used and 91
104 the range of food groups can also be extended. The approach used here follows the one used by WFP (Y. Forsen, personal communication, 18 December 2015). The Household Dietary Diversity Score developed by FANTA 25 is typically calculated based on data collected for a 24-hour recall period. However, other valid recall timeframes include the past three days, seven days, or even a month in some cases 26. We selected a seven-day timeframe. Table A12 shows the prevalence of each dietary diversity score group as well as summary statistics on dietary diversity scores. Low dietary diversity scores are most prevalent for all sub-camps, countries of origin and arrival groups. Dietary diversity scores are lowest for households in K4, South Sudanese and new arrivals. Table A12: Dietary Diversity Groups and Scores Dietary Diversity Score group Dietary Diversity Score score Sample size Low (<4.5) Medium (4.5 6) Acceptable (>6) Mean Median Min Max Total 1,986 89% 11% 0.3% K % 18% 0.4% Sub-camp K % 12% 0.6% K % 13% 0.0% K % 2.4% 0.0% Somalia % 20% 0.6% South Sudan % 3.9% 0.0% Sudan 96 89% 11% 0.0% Country of origin Ethiopia 82 88% 12% 0.0% Burundi 73 90% 8.2% 1.4% DR Congo % 16% 0.0% Other 9 89% 11% 0.0% Year of arrival <2014 1,360 85% 15% 0.4% % 3.4% 0.0% This document can be found at: Diversity Score_v2_Sep06_0.pdf 26 Please refer to this website for further details: 92
105 4.4 COPING STRATEGIES INDEX The standard Coping Strategies Index calculations consider two types of coping strategies used in the previous seven days, those related to consumption and those related to livelihoods (see Table A13). Consumption-related coping strategies address how many days in the previous week that households relied on less preferred and/or less expensive food; borrowed food or relied on help from a friend or relative; reduced the number of meals eaten per day; reduced the size of meals; and/or reduced the quantity of food consumed by adults/mothers to ensure that children had enough to eat. The consumption-related Coping Strategies Index is calculated by weighting more severe coping strategies more heavily (here, we weight reduced portion sizes by 2 and reduced quantities consumed by adults by 3, following the Kenya DHS syntax (Y. Forsen, personal communication, 12 January 2016). Livelihood coping strategies consider whether households have engaged in any coping behaviours in the previous week. Each coping behaviour is categorised as stressed (sold household assets/goods, sent household members to eat elsewhere, purchased food on credit or borrowed food, or borrowed money), crisis (sold productive assets/transport, removed children from school) or emergency (begged, sold last female animals, engaged in illegal income activity). Households are grouped according to their most severe strategy. Households not engaging in any of these activities are considered as food secure. According to the livelihood Coping Strategies Index, about half of households are food secure, 33 percent are under stress, 1.6 percent are in crisis and 13 percent are in an emergency status (see Table A13). 93
106 Table A13: Coping Strategies Indices Livelihood coping strategies Consumption coping strategies Sample size Food secure Stress Crisis Emergency Mean Median Min Max Total 2,000 52% 33% 1.6% 13% K % 41% 3.0% 12% Sub-camp K % 45% 0.4% 22% K % 20% 0.4% 10% K % 27% 2.4% 10% Somalia % 39% 1.7% 14% South Sudan % 29% 2.0% 12% Sudan 97 68% 25% 0.0% 7.2% Country of origin Ethiopia 82 35% 46% 1.2% 17% Burundi 73 48% 32% 0.0% 21% DR Congo % 31% 0.0% 20% Other 9 67% 22% 11% 0.0% Year of arrival <2014 1,369 48% 36% 1.3% 15% % 26% 2.1% 11%
107 ANNEX 5. THE MINIMUM BASKET AND CASH EQUIVALENT CONSUMPTION EXPENDITURE ASSUMPTIONS 5.1 THE COST OF A MINIMUM BASKET (FOOD AND ESSENTIAL NFIs) The minimum food basket is calculated monthly by the Food Security and Outcome Monitoring (FSOM) market survey. The last survey was in December 2015, and the daily minimum cost of a healthy food basket per capita was estimated at Ksh 62 (WFP, 2015). This is based on the food requirements listed in Table A14, and the associated market prices. The price of the food basket has not changed significantly over the past year, with costs in May and September 2015 of Ksh 60 and 62, respectively. Table A14: Minimum Food Basket Calculations (WFP, 2015) Maize Dried beans Fresh milk Vegetable oil Sugar Onion Tomato Total g/capita/day Kcal/capita/day Price per kg (Ksh) Price/capita/day (Ksh) There is no standard minimum essential NFI basket. However, UNHCR provided us with a list of essential NFIs that are provided to refugees (excluding tents, which are returned), their unit cost per capita or per household, and some estimates of life expectancy or replacement frequency. Based on this and some assumptions on average household size, we estimated that the daily per capita essential NFI basket is Ksh 7.6 (see Table A15). Table A15: Minimum Essential NFI Basket Calculations from UNHCR Essential NFI Unit Estimated Unit Cost Unit cost in Ksh (1 $:100Kshs) Frequency Distribution Cost per person per day (Ksh) Woollen blankets pc $ Yearly 0.79 Kitchen sets pc $ Every 2 years 0.93 Mosquito nets pc $ Every 2 years lt Rigid plastic Jeri cans pc $ Every 6 months 1.37 Soap (250g) pc $ Monthly 3.62 Synthetic sleeping mats pc $ Yearly 0.33 Total Based on $22.50 per set to a household and assumed 3.3 per UNHCR household (Guyatt, 2015). 95
108 After consultation with the TSC, it was decided to include other essential NFIs, which are sometimes routinely administered to the refugees by other agencies. Firewood, for example, is also supplied to refugee households and should be part of this essential basket. This is currently provided by Lokado at 10 kg per capita per month. This was valued at 70 Ksh, which translates into Ksh 2.30 per day. It was also agreed that clothing, sanitary pads for women, mobile air-time and candles/matches should be included. The minimum requirement of clothes per capita per year was estimated at 600 Ksh (1.64 Ksh per day), mobile air-time at 50 Ksh per capita per month (1.64 Ksh per day), matches and candles at 30 Ksh per capita per month (1 Ksh per day) and monthly sanitary pads at 120 Ksh per pack per month. Assuming these are for yearold women (26 percent of the survey population), this translates into a daily per capita cost of 1.03 Ksh. This brings to the total essential NFI basket to and the total basket for NFIs and food to Ksh 77.03/capita/day. For ease of analysis, and since the lowest denominator for transactions is the Ksh, this value was rounded to Ksh 77 per day. 5.2 CASH EQUIVALENT CONSUMPTION EXPENDITURE ASSUMPTIONS The standard LSMS include in their cash equivalent consumption expenditure valuation the quantities consumed for non-purchased items such as from own stock, own production or gifted. The consensus between the TSC and researchers was that because this study was interested in the purchasing power of the households, the value of gifted items would not be considered in estimating the vulnerability metric, cash equivalent consumption expenditure per capita per day. In the context of Kakuma Refugee Camp, assistance consists of multiple forms and comprises a large portion of the economy. As such, it is important to note that any changes in assistance will quickly ripple through the local economy, likely resulting in extensive indirect effects, which should ideally be mapped out in advance. Each point of crossover between assistance and the cash economy was identified and defined as gifted or purchased for the purposes of clarity in enumeration through to analysis. For example, any items purchased with Bamba Chakula were considered as gifted. Conversely, any items purchased with money earned from re-selling the food ration were classified as purchased. Items acquired through barter were recorded as the value of the item. Once the food and NFI data had been cleaned and own production and in-stock food had been valued, the items for each consumption type and source (purchased food, own production food, in-stock food, purchased consumable NFIs and purchased durable NFIs) were summed for each household and merged with the household level database. The three food consumption variables were summed to calculate the total non-gifted cash equivalent consumption expenditure/household/week on food items. This was then divided by seven days to calculate the per day variable, and then by the number of household members to calculate the per capita variable, ultimately resulting in the total non-gifted cash equivalent consumption expenditure/capita/day on food. Similarly, the expenditure/household/week on consumable NFIs and durable NFIs were converted to per capita per day terms by dividing by 30 days and 365 days, respectively, as well as the number of household members. Total nongifted cash equivalent consumption expenditure/capita/day was calculated by summing these resulting variables: cash equivalent consumption expenditure/capita/day for food and expenditure/capita/day for consumable and durable NFIs. Because 14 households were missing 96
109 food consumption data, the final cash equivalent consumption expenditure/capita/day variable consists of a sample size of 1,986 households. The vulnerability binary variables were generated by comparing the cash equivalent consumption expenditure/capita/day to each given vulnerability threshold. For example, for the minimum food and NFI basket valued at 77 Ksh, a binary variable was generated such that it was equal to 0 if the household s cash equivalent consumption expenditure/capita/day was less than 77 Ksh and 1 if the household s cash equivalent consumption expenditure/capita/day was at least 77 Ksh. 5.3 THE CASH VALUE OF IN-STOCK AND OWN PRODUCTION FOOD To value the cash equivalent of in-stock and own production food we applied the purchase price if the households had also purchased some quantity of the item. This was rare, and in most cases we applied the median price per a given food and unit from the households that had purchased items. Overall, only 9.3 percent of households consumed from in-stock or own production. For own production, the types of items reported were restricted to vegetables (four categories: sukuma, beans, other vegetables and other green leafy vegetables) and chicken and eggs. For in-stock, the food items list was more extensive and included beans, camel, carrot, cassava, chicken, goat, green grams, maize, oils/fats/butter, onion, other cereals, other green leafy vegetables, other meat, other milk products, other pulses, other vegetables, pasta, porridge, powdered milk, processed milk, rice, sorghum, sugar, tomato and wheat flour compared to the 52 food items that were listed. Table A16 summarises the median unit prices for items purchased. 97
110 Table A16: Unit Prices and Quantities for the Food Items Purchased over Past Week Used to Value In-stock and Own Production 28 Food group Food item Number of households with both quantity and price data Percentage with both quantity and price data (n=1986) Units Mean SD Med Min Max FSOM price data (WFP, 2015) Maize % kg Sorghum % kg Millet 6 0.3% kg Cereals Wheat flour % kg Rice % kg Pasta % kg Porridge % kg Other cereals 5 0.3% kg Potatoes % kg Roots Cassava 4 0.2% kg Other root crops 1 0.1% kg Beans % kg Pulses Orange vegetables Cow peas 6 0.3% kg Green grams Other pulses % kg % kg Carrot % kg Sukuma % kg Green leafy vegetables Other green leafy veg. bunch % kg bunch Note that the households consuming in-stock or own production cassava, sukuma (kg), camel (kg), processed milk (kg and item) and most of those consuming in-stock or own production beans had also purchased these items in the previous week. As such, the median values in the table were not used to calculate the in-stock or own production values. 98
111 item other Tomato % kg Other vegetables other Onion % kg , Other veg % bunch Orange fruits Mango 1 0.1% item Papaya 1 0.1% kg Goat % kg , Camel % kg , Meat bunch item Chicken % other Other meat % kg Eggs Eggs % item Processed milk % kg 1, , , (fresh) litre Milk item Powdered milk Other milk products % kg , % kg Sugar Sugar % kg Oils, fats and butter Oils, fats, butter % litre (per kg) 29 Given uncertainty about the other unit, we assumed that the household had consumed one chicken. Due to the fact that no chickens had been purchased, we relied on knowledge gained from the field work to approximate the cost of one chicken at 400 Ksh. 99
112 ANNEX 6. CASH EQUIVALENT CONSUMPTION EXPENDITURE RESULTS The total cash equivalent consumption expenditure for a household comprises food over the previous week (both purchased and cash equivalent value of food in-stock and own production), consumable NFIs over the previous month and durable NFIs over the previous year. This annex summarises these variables in relation to sub-camp, country of origin and arrival status. Table A17 summarises the proportions of households with daily consumption expenditure on purchased food greater than 100 Ksh pc and less than or equal to 10 Ksh pc and Table A18 the average values. The cash equivalent consumption expenditure for in-stock and own production are summarised in Table A19 and Table A20, respectively. The proportions of households with daily consumption expenditure on non-gifted NFIs greater than a given threshold are in Table A21 (consumable NFIs) and Table A23 (durable NFIs) and Table A22 and Table A24, the average values. The total daily household consumption expenditure (sum of food purchased, instock, own production, consumable and durable NFIs) is summarised in Table A25 and Table A26, and the proportions not vulnerable given the range of thresholds in Table A
113 Table A17: Household Consumption Expenditure per Day on Purchased Food (Proportions) Sample size Households with zero > 100 Ksh per capita <=10 Ksh per capita # % # % # % Total 1, % % 1,488 75% K % 8 1.6% % Sub-camp K % 4 0.8% % K % 1 0.2% % K % 1 0.2% % Somalia % 8 1.2% % South Sudan % 1 0.1% % Sudan % 0 0.0% 72 75% Country of origin Ethiopia % 4 4.9% 41 50% Burundi % 0 0.0% 59 81% DR Congo % 1 0.7% 99 67% Other % 0 0.0% 8 89% Year of arrival <2014 1, % % % % 3 0.5% % 101
114 Table A18: Household Consumption Expenditure per Day on Purchased Food (Means) Sample size Per household purchasing Per capita for households purchasing Mean Med Min Max Mean Med Min Max Total 1, , K , Subcamp K , K K Somalia , South Sudan Country of origin Sudan Ethiopia Burundi DR Congo , Other Year of arrival <2014 1, ,
115 Table A19: Household Consumption Expenditure per Day on Food In-stock Estimated in Terms of Cash Equivalent Sample size Zero Per household Per capita # % Mean Med Min Max Mean Med Min Max Total 1,986 1,881 95% K % Subcamp K % K % K % Somalia % South Sudan % Sudan % Country of origin Ethiopia % Burundi % DR Congo % Other % Year of arrival <2014 1,360 1,297 95% %
116 Table A20: Household Consumption Expenditure per Day on Own Production Food Estimated in Terms of Cash Equivalent Sample size Households with zero Per household Per capita # % Mean Med Min Max Mean Med Min Max Total 1,986 1,897 96% K % Subcamp K % K % K % Somalia % South Sudan % Sudan % Country of origin Ethiopia % Burundi % DR Congo % Other % Year of arrival <2014 1,360 1,303 96% %
117 Table A21: Household Consumption Expenditure per Day on Non-gifted Consumable NFIs (Proportions) Sample size Households with zero > 50 Ksh per capita <=10 Ksh per capita # % # % # % Total 2, % % 1,699 85% K % % % Sub-camp K % % % K % 7 1.4% % K % 3 0.6% % Somalia % % % South Sudan % 6 0.7% % Sudan % 0 0.0% 86 89% Country of origin Ethiopia % 4 4.9% 53 65% Burundi % 3 4.1% 64 88% DR Congo % 0 0.0% % Other % 1 11% 4 44% Year of arrival <2014 1, % % 1,112 81% % 3 0.5% % 105
118 Table A22: Household Consumption Expenditure per Day on Non-gifted Consumable NFIs (Means) Sample size Per household purchasing Per capita for households purchasing Mean Med Min Max Mean Med Min Max Total 2, , K Subcamp K , K K Somalia , South Sudan Sudan Country of origin Ethiopia Burundi DR Congo Other Year of arrival <2014 1, ,
119 Table A23: Household Consumption Expenditure per Day on Non-gifted Durable NFIs (Proportions) Sample size Households with zero > 50 Ksh per capita <=10 Ksh per capita # % # % # % Total 2,000 1,125 56% 6 0.3% 1,936 97% K % 3 0.6% % Sub-camp K % 0 0.0% % K % 1 0.2% % K % 2 0.4% % Somalia % 3 0.5% % South Sudan % 1 0.1% % Sudan % 0 0.0% 95 98% Country of origin Ethiopia % 0 0.0% 74 90% Burundi % 1 1.4% 68 93% DR Congo % 0 0.0% % Other % 1 11% 8 89% Year of arrival <2014 1, % 4 0.3% 1,321 96% % 2 0.3% % 107
120 Table A24: Household Consumption Expenditure per Day on Non-gifted Durable NFIs (Means) Sample size Per household purchasing Per capita for households purchasing Mean Med Min Max Mean Med Min Max Total 2, K Subcamp K K K Somalia South Sudan Sudan Country of origin Ethiopia Burundi DR Congo Other Year of arrival <2014 1,
121 Table A25: Total Household Cash Equivalent Consumption Expenditure/capita/day (Proportions) Sample size Households with zero > 100 Ksh <=10 Ksh # % # % # % Total 1, % % 1,195 60% K % % % Sub-camp K % % % K % 5 1.0% % K % 8 1.6% % Somalia % % % South Sudan % 9 1.0% % Sudan % 1 1.0% 54 56% Country of origin Ethiopia % 7 8.5% 25 30% Burundi % 4 5.5% 47 64% DR Congo % 3 2.0% 68 46% Other % 1 11% 3 33% Year of arrival <2014 1, % % % % % % 109
122 Table A26: Total Household Cash Equivalent Consumption Expenditure per Day (Means) Sample size Per household consuming Per capita for households consuming Mean Med Min Max Mean Med Min Max Total 1, , ,260 K , ,260 Subcamp K , K , K Somalia , ,260 South Sudan , Sudan Country of origin Ethiopia , Burundi DR Congo , Other Year of arrival <2014 1, , ,
123 Table A27: Percentage of Non-vulnerable Households Based on a Range of Vulnerability Thresholds Sample size Kenya poverty line (125 Ksh) Total basket of 77 Ksh Only food (62 Ksh) NFI and half food (46 Ksh) Only half food (31 Ksh) Only NFI (15 Ksh) Total 1, % 4.2% 5.7% 9.1% 15% 31% K % 7.6% 9.8% 17% 26% 41% Subcamp K % 5.5% 7.9% 11% 19% 39% K % 1.8% 2.8% 5.8% 12% 28% K % 1.8% 2.0% 2.4% 4.6% 14% Somalia % 7.3% 11% 17% 27% 50% South Sudan % 1.2% 1.3% 1.9% 4.4% 12% Sudan % 2.1% 3.1% 6.3% 9% 31% Country of origin Ethiopia % 15% 15% 28% 35% 57% Burundi % 6.8% 6.8% 9.6% 14% 27% DR Congo % 2.7% 4.7% 9.5% 22% 43% Other 9 11% 11% 11% 22% 33% 56% Year of arrival <2014 1, % 5.2% 7.1% 12% 20% 38% % 1.9% 2.6% 3.5% 5.6% 14% 111
124 ANNEX 7. SOCIO-ECONOMIC PROXY RESULTS This annex provides details on a number of proxies that could be used to reflect vulnerability, assessed here as consumption expenditure. One of these is wealth assets. Traditional wealth assets related to house or livestock ownership are not necessarily relevant to this refugee population. During the scoping exercise, we noted a limited list of five items that reflected wealth within a household: possession of a TV, a bicycle, a wheelbarrow, a dining table and solar panels. Ownership of these is fairly low, with only 12 percent of the sample owning at least two of them (Table A28). Table A28: Five Main Wealth Assets: TV, Bicycle, Wheelbarrow, Table, Solar Panels, and Two of the Five Sample size TV Bicycle Wheelbarrow Table Solar panels At least two out of five Total 2,000 13% 4.4% 10% 16% 4.2% 12% K % 3.8% 17% 22% 3.4% 17% Sub-camp K % 5.4% 13% 22% 7.2% 18% K % 6.6% 11% 13% 4.6% 12% K4 2, % 1.6% 1.0% 8.6% 1.6% 2.2% Somalia % 7.2% 23% 19% 4.5% 23% South Sudan % 1.6% 2.4% 10% 1.5% 2.3% Sudan % 7.2% 4.1% 23% 3.1% 6.2% Country of origin Ethiopia 82 29% 7.3% 17% 23% 3.7% 21% Burundi % 6.9% 4.1% 11% 6.9% 8.2% DR Congo % 2.7% 6.0% 37% 18% 23% Other 9 22% 22% 11% 33% 22% 33% Year of arrival <2014 1,369 18% 5.8% 14% 20% 5.6% 17% % 1.3% 2.2% 8.6% 1.1% 1.9% 112
125 The survey also asked about other wealth assets, such as a generator, satellite dish and animal ownership (goats and chickens/ducks). Nearly 10 percent of the sample reported owning chickens or ducks; this was particularly high among Congolese (31 percent). However ownership of generators, satellite dishes and goats was very low (Table A29). Table A29: Other Wealth Assets: Generator, Satellite Dish, Goats, Chickens or Ducks Sample size Generator Satellite dish Goats Chickens or ducks Total 2, % 1.4% 0.4% 9.3% K % 0.6% 0.4% 12% Sub-camp K % 2.4% 0.6% 11% K % 2.4% 0.4% 12% K4 2, % 0.0% 0.0% 2.4% Somalia % 2.3% 0.6% 11% South Sudan % 0.1% 0.1% 5.1% Sudan % 2.1% 0.0% 4.1% Country of origin Ethiopia % 3.7% 0.0% 3.7% Burundi % 0.0% 1.4% 8.2% DR Congo % 4.0% 0.7% 31% Other 9 0.0% 0.0% 0.0% 33% Year of arrival < % 2.0% 0.5% 12% % 0.0% 0.0% 3.0% 113
126 Another proxy that could be used for vulnerability is the purchase of expensive and/or nonessential items. While about one-fifth of households have electricity, consumption of other expensive items are less common (Table A30). Fewer than 10 percent reported consuming travel or transport or toiletries. Fewer than five percent reported sending their children to private school or hiring domestic help, and only 5 households reported spending on entertainment in the previous month. Table A30: Consumption of Electricity, Private School, Domestic Help, Entertainment, Toiletries, Travel or Transport Sample size Electricity Private school Domestic help Entertainment Toiletries Travel or transport Total 2,000 21% 3.1% 2.1% 0.3% 6.5% 8.9% K % 9.2% 5.4% 0.2% 16% 7.0% Sub-camp K % 1.0% 1.6% 0.2% 1.0% 12% K % 1.0% 1.2% 0.4% 4.8% 16% K % 1.2% 0.0% 0.2% 3.6% 0.8% Somalia % 4.1% 5.3% 0.2% 4.7% 18% South Sudan % 3.0% 0.1% 0.2% 6.8% 1.7% Sudan % 3.1% 1.0% 0.0% 12% 9.3% Country of origin Ethiopia 82 46% 2.4% 1.2% 0.0% 2.4% 3.7% Burundi 73 11% 1.4% 1.4% 1.4% 4.1% 5.5% DR Congo % 0.7% 1.3% 0.7% 11% 14% Other 9 33% 0.0% 0.0% 0.0% 11% 33% Year of arrival <2014 1,369 30% 3.9% 2.8% 0.3% 7.7% 12% % 1.4% 0.3% 0.2% 3.8% 1.7% 114
127 Demographic ratios can also be used to proxy vulnerability. The age-dependency ratio was calculated as the number of dependents (less than 15 years of age or greater than 64 years of age) divided by the number of working age members (ages 15 64) in the household. A ratio greater than 1 indicates there are more dependents than working age household members. Across the sample, only six households (0.3 percent) did not have any working age members. This was lower than the percentage of child-headed households (1.2 percent) because a dependent age cut-off of 15 years was assumed following the United Nations Department of Economic and Social Affairs indicator methodology, 30 while a child is considered to be anyone less than 18 years of age. For this reason, the sample size for statistics on the dependency ratio is 1,994 rather than the full 2,000 (Table A31). The median dependency ratio was 1.2 dependents for every working age household member. Table A31: Dependency Ratios Sample size Mean Med Min Max Percentage with <2 Total 1, % K % Sub-camp K % K % K % Somalia % South Sudan % Sudan % Country of origin Ethiopia % Burundi % DR Congo % Other % Year of arrival <2014 1, % % 30 See 115
128 A second demographic ratio that can proxy vulnerability is earning potential. To have earning potential, there must be at least one adult who does not need to care for young children or disabled/elderly members in the household, and who is available to work. In this way, the following household types were classified as having earning potential: household size 1 (unless they were child-headed or elderly headed), household size 1 or more with at least one working age member and no dependents (under 15 or over 64 years of age) or disabled members, and household size 2 or more with at least two working age members. Overall, 84 percent of households were identified as having earning potential (see Table A32). Table A32: Earning Potential Sample size Earning potential Percentage with >2 children under 5 years of age Total 2,000 84% 9.4% K % 8.8% Sub-camp K % 8.6% K % 12% K % 8.0% Somalia % 10% South Sudan % 9.1% Sudan 97 91% 5.2% Country of origin Ethiopia 82 89% 9.8% Burundi 73 84% 6.9% DR Congo % 11% Other 9 100% 11% Year of arrival <2014 1,369 88% 9.6% % 9.0% 116
129 Crowding indexes reflect how much living space a household occupies, with the assumption that the greater the crowding, the poorer the household. We estimated two crowding indices for the households for which we had data (n=1989): the number of beds per capita and the number of sleeping rooms per capita (Table A33). The smaller the crowding index, the greater the crowding. Across the sample, 27 percent of households had at least one bed for every person (beds per capita crowding index >=1), and 15 percent of households slept two or fewer people per room (sleeping rooms per capita crowding index >=0.5). Table A33: Crowding Indexes Beds per capita Sleeping rooms per capita Sample size Mean Med Min Max Percentage >=1 Mean Med Min Max Percentage >=0.5 Total 1, % % K % % Subcamp K % % K % % K % % Somalia % % South Sudan % % Sudan % % Country of origin Ethiopia % % Burundi % % DR Congo % % Other % % Year of arrival <2014 1, % % % % 117
130 ANNEX 8. PROFILES BY HOUSEHOLD TYPE This annex summarises the profiles of subgroups traditionally considered as either vulnerable (female-headed households, households with an elderly or disabled member or head of household, household size 1, recent arrivals) or not (or less) vulnerable (households with businesses or employment, long-term residents). Table A34 explores dynamics related to the gender of the head of household, Table A35 examines households with a disabled or elderly member and a subclass of this group: households with a disabled or elderly head of household. Table A36 offers the profiles of households with and without business and employment. Profiles of households of different size groupings are outlined in Table A37, and a more detailed analysis of dynamics related to year of arrival is provided in Table A38. Each of these tables provides the detailed analysis to support the profiles highlighted in Section 5 of the report. For each subgroup, a summary of demographics; physical and social networks; skills, experience and income; wealth assets; food insecurity; and our gold standard on total expenditure/capita/day, represented in both continuous and binary form, are provided. 118
131 Table A34: Household Profiles by Gender of Head of Household Total Male Female Sample size 31 2,000 1, Male-headed 51% 100% 0.0% South Sudanese 46% 30% 63% Somali 33% 41% 26% Demographics Ethiopian 4.1% 4.8% 3.4% Youth-headed (18 28 years) 26% 27% 24% No earning potential 16% 3.1% 30% Age-dependency ratio >=2 33% 23% 44% Physical network Reside in Kakuma 1or 2 50% 52% 48% Reside in Kakuma 4 25% 18% 32% Arrived before % 77% 59% Social network In camp 38% 40% 36% In Kenya 14% 15% 14% Resettled in US or Europe 17% 19% 16% Originally farmers 43% 39% 48% At least one member is English speaking 67% 72% 62% Skills, experience and employment At least one member has vocational training 13% 18.4% 7.7% At least one member has a trade or skill 22% 32% 11% Business 8.2% 11% 4.6% Employment 20% 29% 11% 31 Sample sizes are slightly lower for age dependency ratio (Total=1,994, Male=1,026, Female=968) and for Dietary Diversity Score and expenditure-related variables (Total=1,986, Male=1,018, Female=968). They are significantly lower for mean share of expenditure/capita/day on food (Total=1,098, Male=619, Female=479), which looks only at households that had any spending on food. 119
132 Bicycle ownership 4.4% 6.8% 1.8% Mobile phone ownership 77% 82% 70% Wealth assets and access to electricity TV ownership 13% 16.9% 8.0% Two out of five wealth assets (bicycle, TV, wheelbarrow, dining table and solar panels) 12% 17.2% 6.8% Electricity 21% 26% 16% Mean Dietary Diversity Score Low Dietary Diversity Score 89% 86% 92% Food insecurity Mean Food Consumption Score Poor Food Consumption Score 26% 24% 27% Percentage with zero expenditure on food 45% 39% 51% Percentage that grow their own vegetables 16% 13% 19% Median expenditure/capita/day Min expenditure/capita/day Consumption expenditure Max expenditure/capita/day Mean percentage share of expenditure/capita/day on food (for those >0) 63% 61% 65% Vulnerable (>77 Ksh) 96% 94% 98% Vulnerable (>46 Ksh) 91% 88% 94% 120
133 Table A35: Household Profiles for Households with an Elderly/Disabled Member or Head of Household Total Disabled or elderly member Disabled or elderly head of household Sample size 32 2, Male-headed 51% 54% 58% South Sudanese 46% 38% 33% Somali 33% 48% 54% Demographics Ethiopian 4.1% 2.9% 3.6% Youth-headed (18 28 years) 26% 11% 7.1% No earning potential 16% 11% 14% Age-dependency ratio >=2 33% 24% 19% Physical network Reside in Kakuma 1or 2 50% 55% 59% Reside in Kakuma 4 25% 16% 12% Arrived before % 77% 83% Social network In camp 38% 37% 41% In Kenya 14% 17% 20% Resettled in US or Europe 17% 21% 26% Originally farmers 43% 47% 46% At least one member is English speaking 67% 73% 73% Skills, experience and employment At least one member has vocational training 13% 14% 12% At least one member has a trade or skill 22% 26% 27% Business 8.2% 12% 15% Employment 20% 23% 23% 32 Sample sizes are slightly lower for age dependency ratio (Total=1,994, Disabled or elderly member=345, Disabled or elderly head of household=165) and for Dietary Diversity Score and consumption expenditure (Total=1,986, Disabled or elderly member=346, Disabled or elderly head of household=168). They are significantly lower for mean share of expenditure/capita/day on food (Total=1,098, Disabled or elderly member=217, Disabled or elderly head of household=110), which looks only at households that had any spending on food. 121
134 Bicycle ownership 4.4% 6.3% 7.1% Mobile phone ownership 77% 83% 85% Wealth assets and access to electricity TV ownership 13% 16% 17% Two out of five wealth assets (bicycle, TV, wheelbarrow, dining table and solar panels) 12% 17% 19% Electricity 21% 31% 36% Mean Dietary Diversity Score Low Dietary Diversity Score 89% 87% 85% Food insecurity Mean Food Consumption Score Poor Food Consumption Score 26% 24% 24% Percentage with zero expenditure on food Percentage that grow their own vegetables 45% 37% 35% 16% 16% 15% Median expenditure/capita/day Min expenditure/capita/day Consumption expenditure Max expenditure/capita/day 1, Mean percentage share of expenditure/capita/day on food (for those >0) 63% 60% 56% Vulnerable (>77 Ksh) 96% 96% 94% Vulnerable (>46 Ksh) 91% 90% 86% 122
135 Table A36: Household Profiles for Households with and without Business/Employment Total No Business Business No employment Employment Sample size 33 2,000 1, , Male-headed 51% 49% 72% 46% 73% South Sudanese 46% 49% 12% 54% 15% Somali 33% 31% 61% 28% 52% Demographics Ethiopian 4.1% 3.8% 8.0% 3.5% 6.6% Youth-headed (18 28 years) 26% 27% 10% 28% 18% No earning potential 16% 17% 4% 19% 5% Age-dependency ratio >=2 33% 34% 20% 36% 22% Physical network Reside in Kakuma 1or 2 50% 49% 66% 46% 67% Reside in Kakuma 4 25% 27% 6% 30% 7% Arrived before % 66% 91% 63% 91% Social network In camp 38% 37% 42% 37% 43% In Kenya 14% 14% 21% 12% 22% Resettled in US or Europe 17% 16% 31% 15% 27% Originally farmers 43% 44% 35% 45% 37% Skills, experience and employment At least one member is English speaking At least one member has vocational training At least one member has a trade or skill 67% 67% 72% 65% 75% 13% 13% 17% 11% 23% 22% 20% 44% 15% 47% Business 8.2% 0% 100% 0% 40% 33 Sample sizes are slightly lower for age dependency ratio (Total=1,994, No business=1,831, Business=163, No employment=1,587, Employment=407) for Dietary Diversity Score and expenditure-related variables (Total=1,986, No business=1,823, Business=163, No employment=1,580, Employment=406). They are significantly lower for mean share of expenditure/capita/day on food (Total=1,098, No business=951, Business=147, No employment=757, Employment=341), which looks only at households that had any spending on food. 123
136 Employment 20% 13% 100% 0% 100% Bicycle ownership 4.4% 3.7% 11.7% 2.5% 11.6% Mobile phone ownership 77% 75% 97% 72% 96% Wealth assets and access to electricity TV ownership 13% 11% 34% 8.0% 30.5% Two out of five wealth assets (bicycle, TV, wheelbarrow, dining table and solar panels) 12% 10% 36% 7.3% 31.2% Electricity 21% 18% 60% 14% 49% Food insecurity Consumption expenditure Mean Dietary Diversity Score Low Dietary Diversity Score Mean Food Consumption Score Poor Food Consumption Score Percentage with zero expenditure on food Percentage that grow their own vegetables Median expenditure/capita/day Min expenditure/capita/day Max expenditure/capita/day Mean percentage share of expenditure/capita/day on food (for those >0) % 91% 63% 93% 72% % 27% 8.0% 28% 15% 45% 48% 10% 52% 16% 16% 17% 11% 17% 11% ,260 1, ,260 63% 63% 60% 65% 59% Vulnerable (>77 Ksh) 96% 97% 81% 98% 86% Vulnerable (>46 Ksh) 91% 93% 68% 95% 76% 124
137 Table A37: Household Profiles for Households of Different Sizes Total >10 Sample size 34 For most variables 2, Male-headed 51% 81% 47% 51% 53% South Sudanese 46% 46% 47% 45% 50% Somali 33% 23% 28% 37% 36% Demographics Ethiopian 4.1% 8.8% 4.9% 3.6% 2.0% Youth-headed (18 28 years) 26% 59% 41% 15% 13% No earning potential 16% 11% 34% 8.7% 0.0% Age-dependency ratio >=2 33% 0.0% 27% 43% 23% Physical network Reside in Kakuma 1or 2 50% 38% 46% 53% 55% Reside in Kakuma 4 25% 42% 32% 20% 17% Arrived before % 58% 62% 73% 71% Social network In camp 38% 48% 35% 38% 41% In Kenya 14% 16% 14% 15% 13% Resettled in US or Europe 17% 13% 17% 19% 17% Originally farmers 43% 17% 42% 47% 45% Skills, experience and income At least one member is English speaking At least one member has vocational training 67% 60% 54% 72% 89% 13% 16% 12% 13% 15% At least one member has a trade or skill 22% 23% 19% 23% 24% Has a business 8.2% 4.9% 6.8% 8.5% 12% 34 Sample sizes are slightly lower for age dependency ratio (Total=1,994, household size 1=101, household size 2 5=677, household size 6 10=971, household size >10=245) for Dietary Diversity Score and expenditure variables (Total=1,986, household size 1=101, household size 2 5=680, household size 6 10=961, household size >10=244). They are significantly lower for mean share of expenditure/capita/day on food (Total=1,098, household size 1=40, household size 2 5=355, household size 6 10=575, household size >10=128), which looks only at households that had any spending on food. 125
138 Has employment 20% 16% 18% 21% 25% Bicycle ownership 4.4% 2.0% 2.8% 5.3% 6.1% Mobile phone ownership 77% 71% 69% 79% 90% Wealth assets and access to electricity TV ownership 13% 3.9% 10% 15% 16% Two out of five wealth assets (bicycle, TV, wheelbarrow, dining table and solar panels) 12% 4.9% 8.2% 14% 19% Electricity 21% 10% 17% 24% 27% Mean Dietary Diversity Score Low Dietary Diversity Score 89% 94% 90% 88% 86% Food insecurity Mean Food Consumption Score Poor Food Consumption Score 26% 33% 26% 23% 32% Percentage with zero expenditure on food Percentage that grow their own vegetables 45% 60% 48% 40% 48% 16% 7.8% 16% 17% 17% Median expenditure/capita/day Min expenditure/capita/day Consumption expenditure Max expenditure/capita/day 1,260 1, Mean percentage share of expenditure/capita/day on food (for those >0) 63% 58% 63% 63% 65% Vulnerable (>77 Ksh) 96% 85% 94% 97% 99% Vulnerable (>46 Ksh) 91% 72% 87% 95% 96% 126
139 Table A38: Household Profiles for Households with Different Years of Arrival Total Last 2 years 3-5 years 6-10 years years >20 years Sample size 35 2, Male-headed 51% 37% 55% 62% 57% 40% South Sudanese 46% 85% 47% 8% 36% 79% Somali 33% 1.7% 13% 72% 55% 10% Demographics Ethiopian 4.1% 1.4% 4.8% 7.1% 2.0% 4.2% Youth-headed (18 28 years) 26% 39% 29% 15% 16% 2.1% No earning potential 16% 26% 15% 11% 10% 4.2% Age-dependency ratio >=2 33% 39% 34% 32% 21% 17% Physical network Reside in Kakuma 1or 2 50% 17% 61% 62% 74% 96% Reside in Kakuma 4 25% 70% 11% 1.1% 1.6% 2.1% Arrived before % 0.0% 100% 100% 100% 100% Social network In camp 38% 37% 32% 35% 55% 48% In Kenya 14% 10% 8.7% 20% 20% 17% Resettled in US or Europe 17% 10% 11% 20% 36% 29% Originally farmers 43% 42% 51% 37% 47% 52% Skills, experience and employment At least one member is English speaking At least one member has vocational training At least one member has a trade or skill 67% 64% 65% 65% 81% 90% 13% 11% 12% 13% 16% 35% 22% 11% 25% 28% 27% 27% Has a business 8.2% 2.4% 7.3% 13% 12% 8.3% Has employment 20% 5.9% 18% 33% 29% 27% 35 Sample sizes are slightly lower for age dependency ratio (Total=1,994, last 2 years=631, 2 5 years=434, 6 10 years=628, years=253, >20 years=48) for Dietary Diversity Score and expenditure variables (Total=1,986, last 2 years=626, 3 5 years=433, 6 10 years=626, years=253, >20 years=48). They are significantly lower for mean share of expenditure/capita/day on food (Total=1,098, last 2 years=215, 3 5 years=227, 6 10 years=447, years=180, >20 years=29), which looks only at households that had any spending on food. 127
140 Bicycle ownership 4.4% 1.3% 4.1% 6.5% 6.7% 6.3% Mobile phone ownership 77% 62% 73% 90% 85% 85% Wealth assets and access to electricity TV ownership 13% 1.4% 9.4% 24% 19% 8.3% Two out of five wealth assets (bicycle, TV, wheelbarrow, dining table and solar panels) 12% 1.9% 10% 20% 21% 13% Electricity 21% 2.4% 14% 43% 29% 15% Mean Dietary Diversity Score Low Dietary Diversity Score 89% 97% 92% 82% 80% 88% Food insecurity Mean Food Consumption Score Poor Food Consumption Score 26% 26% 33% 22% 21% 26% Percentage with zero expenditure on food Percentage that grow their own vegetables 45% 66% 48% 29% 29% 40% 16% 23% 23% 9.1% 4.4% 15% Median expenditure/capita/day Min expenditure/capita/day Consumption expenditure Max expenditure/capita/day 1, , Mean share of expenditure/capita/day on food (for those >0) 63% 65% 65% 62% 62% 53% Vulnerable (>77 Ksh) 96% 98% 96% 94% 96% 90% Vulnerable (>46 Ksh) 91% 96% 93% 85% 89% 90% 128
141 ANNEX 9: CATEGORICAL TARGETING This annex summarises the analysis for the categorical targeting in terms of inclusion and exclusion errors. A range of single-variable targeting examples are considered including femaleheaded households, new arrivals, South Sudanese, households in Kakuma 4 and those with no business. Multiple-variable targeting examples that are considered include female, disabled, child or elderly head of household; households in Kakuma 3 or 4; female-headed households with no business; and households with no business and no incentive workers. Each table in this annex shows these categorical targeting examples according to different vulnerability thresholds: Table A39 addresses the 77 Ksh cut-off, Table A40 summarises the 125 Ksh cut-off, Table A41 addresses the 62 Ksh threshold, Table A42 summarises the 46 Ksh threshold, Table A43 addresses the 31 Ksh cut-off and Table A44 summarises the 15 Ksh threshold. Values in red identify targeting options that produce inclusion and exclusion errors considered acceptable by WFP. Table A39: The Effectiveness of Different Categorical Targeting Options, Using Minimal Essential Basket Cut-off of 77 Ksh/capita/day (Can Provide for Own Food and NFIs) True vulnerable n=1903 Of total households n=1986 Target examples Female-headed households households targeted Number of false positives Inclusion error Number of false negatives Exclusion error % % New arrivals % 1,289 68% One category South Sudanese % % Kakuma % 1,416 74% No business % % Target in female, disabled, child or elderly head of households % % Multiple categories Target in K3 and K4 only % % Target in female-headed households that do not have a business Target out households with a business or an incentive worker % 1,035 53% 1, % % 129
142 Table A40: Effectiveness of Different Categorical Targeting Options Using Kenya Poverty Line Cut-off of 125 Ksh/capita/day True vulnerable n=1952 of total households n=1986 Target examples household s targeted Number of false positives Inclusion error Number of false negatives Exclusion error Female-headed households % % New arrivals % 1,334 68% One category South Sudanese % 1,042 53% Kakuma % 1,461 75% No business 1, % % Target in female, disabled, child or elderly head of households 1, % % Multiple categories Target in K3 and K4 only % % Target in female-headed households that do not have a business Target out households with a business or an incentive worker % 1,035 53% 1, % % Table A41: Effectiveness of Different Categorical Targeting Options Using Essential Food Basket of 62 Ksh/capita/day (Can Provide Own Food) True vulnerable n=1873 of total households n=1986 Target examples household s targeted Number of false positives Inclusion error Number of false negatives Exclusion error Female-headed households % % New arrivals % 1,264 67% One category South Sudanese % % Kakuma % 1,388 74% No business 1, % % Target in female, disabled, child or elderly head of households 1, % % Multiple categories Target in K3 and K4 only % % Target in female-headed households that do not have a business Target out households with a business or an incentive worker % % 1, % % 130
143 Table A42: The Effectiveness of Different Categorical Targeting Options Using Essential NFI Basket and Half of Essential Food Basket: 46 Ksh/capita/day True vulnerable n=1806 Of total households n=1986 Target examples Female-headed households households targeted Number of false positives Inclusion error Number of false negatives Exclusion error % % New arrivals % 1,201 67% One category South Sudanese % % Kakuma % 1,321 73% No business 1, % % Target in female, disabled, child or elderly head of households 1, % % Multiple categories Target in K3 and K4 only % % Target in female-headed households that do not have a business Target out households with a business or an incentive worker % % 1, % % Table A43: The Effectiveness of Different Categorical Targeting Options Using Half of Essential Food Basket: 31 Ksh/capita/day (Can Provide ½ of Own Food) True vulnerable n=1682 Of total households n=1986 Target examples Female-headed households households targeted Number of false positives Inclusion error Number of false negatives Exclusion error % % New arrivals % 1,091 65% One category South Sudanese % % Kakuma % 1,209 72% No business 1, % % Target in female, disabled, child or elderly head of households 1, % % Multiple categories Target in K3 and K4 only % % Target in female-headed households that do not have a business Target out households with a business or an incentive worker % % 1, % % 131
144 Table A44: The Effectiveness of Different Categorical Targeting Options Using Essential NFI Basket: 15 Ksh/capita/day (Can Provide Own NFIs) True vulnerable n= Of total households n=1986 Target examples Female-headed households households targeted Number of false positives Inclusion error Number of false negatives Exclusion error % % New arrivals % % One category South Sudanese % % Kakuma % % No business 1, % % Target in female, disabled, child or elderly head of households 1, % % Multiple categories Target in K3 and K4 only % % Target in female-headed households that do not have a business Target out households with a business or an incentive worker % % 1, % % 132
145 ANNEX 10. REGRESSION ANALYSIS FOR PROXY MEANS TESTING 10.1 THE VARIABLES The proxy means testing was tested using two variable lists. The first list was chosen to include variables that were thought to indicate the wealth or working potential of a family. Variable selection was done to reduce co-linearity between variables. If two variables could potentially represent the same piece of information only one of them was selected. For example, only one variable was selected between the two variables: country of origin and transferred from Dadaab, as 99 percent of households that transferred from Dadaab are either Somali or Ethiopian. Colinearity should be avoided in a multiple regression model because it causes erratic changes in the coefficient estimates in response to small changes in the model or data. We considered that some of the variables or questions from this first list could possibly be misrepresented by the interviewee and difficult to verify by the interviewer. Therefore, a second, more succinct list was developed that could be more easily be verified by the enumerator. Although the reduction in variables reduces the predictive power of the models, the ability to easily verify the answers makes this reduction worth the cost. Table A45 shows the complete list of variables used in the first variable list along with the variable type. It also indicates which variables are included in the reduced list. 133
146 Table A45: Variables for Proxy Means Testing Variable description Variable type Variable included in the second dataset (robust variables) Sub-camp Categorical Yes Zone Categorical Yes Block Categorical Yes country of origin Categorical Yes Recent arrival Binary Yes household size Continuous Yes Do you have friends or relatives inside the camp living in another household? Do you have friends or relatives that have resettled in US or Europe? Do you have friends or relatives that live outside the camp elsewhere in Kenya? Number of dependents (<15 or >64 years old) / working age population in household Binary Binary Binary Continuous No No No Yes Gender of head of household Binary Yes Number of children in household (<18 years old) Continuous Yes Child-headed household Binary Yes Household has at least one disabled member Binary Yes Household has at least one elderly member Binary Yes Number of ration cards held by household Continuous No Does household have electricity? Binary No Does household own at least one mobile phone? Binary No Does household own a TV? Binary No Does household own a bicycle? Binary No Does household own a wheelbarrow? Binary No Does household own a table? Binary No Crowding index: Number of sleeping rooms per capita Continuous No Household has a business and / or is employed Binary No 134
147 10.2 THE MODELS We explore several types of models to determine the best method for predicting vulnerable households. The response variable (expenditure/capita/day) in binary form (classifying households as vulnerable/not vulnerable against a given threshold value) is highly skewed, with few non-vulnerable households compared to a majority of vulnerables. For example, when considering the 77 Ksh vulnerability threshold, only 83 (4.2%) of households are not vulnerable compared to 1,886 (96%) vulnerables (see Table A27, Annex 7 for details on the other thresholds). We addressed this issue in several ways. First, we built a set of regression models, which were based on the continuous values of the response variable, which is not skewed. We constructed two regression models: Ordinary Least Squares (OLS) and an Elastic Net. We chose one simple, standard regression model, OLS, and one more complicated regression model, Elastic Net. Our modelling philosophy is to start with a simple model to determine a baseline of performance and then to build in complexity. The OLS regression is one of the most commonly used regression models. It fits a linear model by minimising the residual sum of squares between the observed responses in a dataset and the responses predicted by the linear approximation. The Elastic Net model is a more complicated model that allows for regularisation, which helps prevent over-fitting during the training of the model. It is a linear regression that employs a regularisation term, which linearly combines the and penalties. The regularisation, or loss function, allows the model to remove the influence of parameters that overly complicate the model by reducing or zeroing their coefficients. Compared to a standard OLS model, the Elastic Net allows us to better determine which parameters have more of an influence in the response variable. We also selected two classification models, in which the response variable is binary (households are classified as vulnerable or not vulnerable by comparing their cash equivalent consumption expenditure/capita/day to a given threshold). The two models we explored were the Logistic Regression and Extremely Randomised Tree Classifier models. We selected a simple and more complex classification model that was similar to the regression models. Logistic Regression is a simple model in which the probabilities of the response taking on a particular value is modelled. As with the Elastic Net model, the Logistic Regression employs a regularisation term that utilises the penalty in order to reduce the influence of parameters that overly complicate the model. The Extremely Random Trees model (Geurts et al, 2006) is an ensemble method that builds numerous weak learner decision trees and averages the results. In a decision tree, an input is entered at the top and as it traverses down the tree the data get bucketed into smaller and smaller sets. The Extremely Random Trees is an extension of the Random Forest model (L. Breiman, 2001). The main difference between these two models is that Extremely Random Trees has an additional level of randomness (the splits in the decision trees). This extra layer of 135
148 randomness trickles up to the ensemble to make mistakes in the weak learners less correlated to each other. As mentioned, OLS is the most commonly used model for proxy means testing. This is not necessarily because it provides the best fit and lowest errors, but largely due to analysts familiarity with it. However, more advanced models have been done. For example, our choice to test the Extremely Random Trees model follows the application of the Random Forest model to the USAID poverty assessment tools (McBride and Nichols, 2015). For the binary prediction of vulnerable or not, we utilise the method of Synthetic Minority Oversampling Technique (SMOTE) with Tomek links. The SMOTE algorithm over-samples the minority class by creating synthetic examples. This helps balance the dataset by creating synthetic data points based off of nearest neighbours. In order to calculate the performance of each of the models, we split the data into a training and testing set using a stratified k-fold method with three folds. The approach divides all the samples into groups (called folds), and the model is trained on all but one fold each run (the remaining fold being used for testing the model). The approach is repeated until all folds are tested. Before training and testing the Elastic Net and Logistic Regression model we normalised all the data using the standard score or z-scores. Using the z-scores both centres and scales the data. This can be important for linear regression models for several reasons. Centring the explanatory variables causes them to have a mean of 0. This gives the linear model s intercept term the interpretation of the expected value of the response variable when the explanatory values are set to their means. Otherwise, the intercept is the expected value of response variable when the explanatory variables are set to 0, which may not be realistic. The z-score scales the data by the standard deviation. Scaling is done so that scale of one feature does not overwhelm the model and mask the other explanatory variables. It is not necessary to normalise the data for the Extremely Random Trees model, because they do not rely on convergence and numerical precision for training. In addition, in Extremely Randomised Trees models there is no analogous regression coefficient THE RESULTS The models were run with several configurations including the complete variable list and the robust variable list. Within both variables sets, several cut-offs for cash equivalent consumption expenditure/capita/day are considered (77, 62, 46, 31 and 15 Ksh) COMPREHENSIVE DATASET: SUMMARY Table A46 shows the inclusion and exclusion errors for each of the four models and each of the vulnerability thresholds, using the comprehensive dataset. Following the categorical targeting results, models with errors that are acceptable to WFP are marked in red. 136
149 Table A46: Inclusion and Exclusion Errors for Proxy Means Testing Using Comprehensive Dataset Poverty line = 77 Ksh OLS Elastic Net Logistic Regression Extremely Randomised Trees True positives 1,869 1,876 1,642 1,837 False positives True negatives False negatives Inclusion error 3.5% 3.9% 0.3% 0.4% Exclusion error 0.9% 0.5% 13% 2.8% Poverty line = 62 Ksh OLS Elastic Net Logistic Regression Extremely Randomised Trees True positives 1,788 1,810 1,557 1,756 False positives True negatives False negatives Inclusion error 3.9% 4.5% 0.8% 1.6% Exclusion error 3.7% 2.5% 16% 5.4% Poverty line = 46 Ksh OLS Elastic Net Logistic Regression Extremely Randomised Trees True positives 1,630 1,648 1,497 1,657 False positives True negatives False negatives Inclusion error 4.7% 5.2% 1.9% 3.1% Exclusion error 8.8% 7.8% 16% 7.3% Poverty line = 31 Ksh OLS Elastic Net Logistic Regression Extremely Randomised Trees True positives 1,383 1,416 1,315 1,468 False positives True negatives
150 False negatives Inclusion error 6.1% 6.4% 6.1% 6.9% Exclusion error 17% 15% 21% 12% Poverty line = 15 Ksh OLS Elastic Net Logistic Regression Extremely Randomised Trees True positives ,015 1,093 False positives True negatives False negatives Inclusion error 13% 12% 17% 16% Exclusion error 31% 30% 26% 20% 138
151 ROBUST DATASET: SUMMARY Table A47 shows the inclusion and exclusion errors for each of the four models and each of the poverty thresholds, using the limited dataset of observable characteristics. Table A47: Inclusion and Exclusion Errors for Proxy Means Testing Using Robust Dataset Poverty line = 77 Ksh OLS Elastic Net Logistic Regression Extremely Randomised Trees True positives 1,897 1,897 1,436 1,806 False positives True negatives False negatives Inclusion error 4.2% 4.2% 2.0% 2.0% Exclusion error 0.0% 0.0% 24% 4.8% Poverty line = 62 Ksh OLS Elastic Net Logistic Regression Extremely Randomised Trees True positives 1,868 1,868 1,450 1,771 False positives True negatives False negatives Inclusion error 5.7% 5.7% 2.1% 2.9% Exclusion error 0.0% 0.0% 22% 5.2% Poverty line = 46 Ksh OLS Elastic Net Logistic Regression Extremely Randomised Trees True positives 1,773 1,782 1,342 1,631 False positives True negatives False negatives Inclusion error 8.3% 8.8% 4.2% 4.7% Exclusion error 1.5% 0.9% 25% 9.3% Poverty line = 31 Ksh OLS Elastic Net Logistic Regression Extremely Randomised Trees 139
152 True positives 1,455 1,521 1,166 1,454 False positives True negatives False negatives Inclusion error 9.6% 11% 7.8% 9.2% Exclusion error 13% 9.3% 30% 13% Poverty line = 15 Ksh OLS Elastic Net Logistic Regression Extremely Randomised Trees True positives ,037 False positives True negatives False negatives Inclusion error 13% 12% 19% 18% Exclusion error 49% 50% 28% 25% PROXY MEANS TESTING PREDICTIONS: REGRESSION MODELS Figures A2 A3 chart actual household expenditure/capita/day against that predicted by the regression models. As OLS are the most familiar models their results are presented. Figure A2 shows the results of the OLS regression on the comprehensive dataset while Figure A3 shows the results of the OLS regression on the robust dataset. The figures demonstrate that this problem is ill suited for a linear regression. This is understandable since many of the explanatory variables are either binary or categorical. It is difficult to predict a continuous value when the explanatory variables are binary or categorical; however, this type of model was attempted to deal with the imbalance of the response variable. 140


153 Figure A2: Predicted Vs Actual Cash Equivalent Consumption Expenditure/capita/day in Ksh from OLS Regression with Comprehensive Explanatory Variable List Figure A3: Predicted Vs Actual Cash Equivalent Consumption Expenditure/capita/day in Ksh from OLS Regression with Robust Explanatory Variable List 141
154 ANNEX 11. COMMUNITY-BASED TARGETING RESULTS 11.1 THE INTERVIEWEES The testing of community-based targeting was undertaken in January Block Leaders and Chair Ladies were asked to participate in wealth, ranking households in their block that were sampled in the household survey. In total, 123 out of the 126 blocks were tested. The three remaining blocks (Kakuma 1, Zone 4, Block 4; Kakuma 2, Zone 1, Block 6; and Kakuma 4, Zone 3, Block 4) did not participate in the exercise despite repeated attempts to contact them. The Block Leader from Kakuma 1, Zone 4, Block 4, was employed by UNHCR and was called for a security meeting during the interview, while the Chair Lady was never reached due to her phone being unavailable. The Chair Lady of Kakuma 2, Zone 1, Block 6, was in Nairobi, while the Block Leader was unreachable. Finally, the missing Block Leader and Chair Lady from Kakuma 4, Zone 3, Block 4, did not have a mobile telephone, so attempts were made to physically locate them in their block, without success. The community leaders were asked how long they had known each sampled household from their block and whether they had any business or family ties with any of the household members. The community leaders were then asked to rank the households according to four criteria (wealth assets, business income, remittance income and overall wealth/wellbeing) and finally to classify whether each household would be able to support itself in the absence of assistance. Community leaders were also asked about the number of households in their block, to estimate how many of these would be able to survive in the absence of assistance, and, if any households were identified, the criteria they used in selecting the surviving households. The average duration for the interview was about one hour, though it was longer in Kakuma 2, which had a larger number of households per block. On average, the interview duration was shorter in Kakuma 4, as the ranking exercise moved more quickly since community leaders reported few of the sampled households as having remittances, assets or employment. A small number of households were excluded from the ranking either because they had been replacements to the database for duplicates identified at this stage (n=12), or the household was the Block Leader or Chair Lady and the respondents did not feel comfortable ranking them (n=8), or the household had since left the camp (n=4). Only 38 percent of blocks were tested by both the Block Leader and the Chair Lady, the remaining blocks by the Block Leader alone (46%) or the Chair Lady alone (15%). The characteristics of the community leaders interviewed are summarised in Table A48. Most of the community leaders that were interviewed were from Somalia (40%) or South Sudan (41%), but this varied by sub-camp. In Kakuma 4, all respondents were from South Sudan, except for one Ethiopian Chair Lady. In contrast, in Kakuma 1, although the majority were from Somalia or South Sudan (81 percent), there were respondents from Sudan, DR Congo, Ethiopia and Uganda. Although the average age of the respondents was 33 years, the ages ranged from 20 to 62 years of age. There was also wide variation in how long the respondents had been living in the block and how long they had been in their position of Chair Lady or Block Leader. However, the duration in the block was less for Kakuma 4, and the median time in the position was 0.7 years. 142
155 Table A48: Characteristics of the Community Leaders Interviewed Kakuma 1 Kakuma 2 Kakuma 3 Kakuma 4 Total Number of blocks Number of respondents Blocks with Block N Leader and Chair % 39% 33% 41% 36% 38% Lady Blocks with Block Leader only Blocks with Chair Lady only Respondent country of origin Somali N % N % N (Block Leader, Chair Lady) % 22 54% 3 7% 19 (11, 8) 33% 8 44% 4 22% 16 (9, 7) 67% 15 38% 8 21% 33 (20, 13) 60% 12 48% 4 16% 0 (0, 0) 0% 57 46% 19 15% 68 (40, 28) 40% South Sudan N (Block Leader, Chair Lady) % 27 (17, 10) 47% 2 (2, 0) 8.3% 8 (6, 2) 15% 33 (21, 12) 97% 70 (46, 24) 41% Sudan N (Block Leader, Chair Lady) % 4 (4, 0) 7% 1 (1, 0) 4.2% 4 (3, 1) 7.3% 0 (0, 0) 0% 9 (8, 1) 5.3% DR Congo N (Block Leader, Chair Lady) % 2 (2, 0) 4% 3 (1, 2) 13% 6 (2, 4) 11% 0 (0, 0) 0% 11 (5, 6) 6.5% Ethiopia N (Block Leader, Chair Lady) % 4 (3, 1) 7% 1 (1, 0) 4.2% 0 (0, 0) 0% 1 (0, 1) 2.9% 6 (4, 2) 3.5% Uganda N (Block Leader, Chair Lady) % 1 (1, 0) 2% 0 (0, 0) 0% 0 (0, 0) 0% 0 (0, 0) 0% 1 (1, 0) 0.6% Burundi Age All respondents N (Block Leader, Chair Lady) % Mean; median (range) 0 (0, 0) 0% 32; 30 (22 62) 1 (0, 1) 4.2% 32; 31 (20 50) 4 (0, 4) 7.3% 36; 35 (20 66) 0 (0, 0) 0% 31; 30 (21 58) 36 5 (0, 5) 2.9% 33; 32 (20 66) Block Leader Mean; median (range) 32; 31 (22 62) 30; 30 (21 50) 39; 36 (20 66) 33; 31 (23 58) 34; 32 (20 66) Chair Lady Years in block All respondents Mean; median (range) Mean; median (range) 33; 30 (22 56) 8.8; 7 (1 25) 36; 35 (20 45) 7.9; 7 (1 21) 33; 32 (20 48) 6; 6.5 (1 15) 30; 29 (21 39) 2; 2 (1.5 3) 33 (31; 20 56) 6.4; 5.5 (1 25) Block Leader Mean; median (range) 9.3; 7.5 (2 24) 8.1; 6 (1 21) 6.3; 7 (2 15) 2.1; 2 (2 3) 6.8; 6 (1 24) Chair Lady Mean; median (range) 7.6; 6 (1 25) 7.7; 7 (3 18) 5.7; 5.5 (1 14) 2.0; 2 ( ) 5.8; 5 (1 25) Years in position 37 All respondents Mean; median (range) 1.8; 0.75 (0.4 12) 1.6; 0.7 (0.3 8) 1.5; 0.7 (0.2 7) 1.1; 0.7 (0.01 3) 1.5; 0.7 ( ) Block Leader Mean; median (range) 1.9; 0.7 (0.4 12) 1.5; 0.8 (0.3 4) 1.9; 0.7 (0.2 7) 1.2; 0.75 (0.3 3) 1.7; 0.7 (0.2 12) Chair Lady Mean; median (range) 1.4; 1 (0.5 4) 1.7; 0.7 (0.3 8) 1.1; 0.6 (0.3 5) 0.9; 0.67 (0.01 2) 1.3; 0.7 (0.01 8) 36 n=33 because there was one missing age 37 The Chair Lady and Block Leader from one of the blocks in Kakuma 4 had recently left the camp to return to South Sudan. The Acting Chair Lady had therefore assumed her position only a few days before the community-based targeting exercise, bringing the minimum duration in the block down to 0.01 years. 143
156 For community-based targeting analysis disaggregated by country of origin, country of origin was defined as the country of origin of the Block Leader or Chair Lady that was interviewed (Table A49). In the few instances in which the Block Leader and Chair Lady were both interviewed but were from different blocks, the Block Leader s country of origin was selected in order to reflect common gendered power dynamics. Table A49: Country of Origin of Blocks 38 K1 K2 K3 K4 Sample Size Burundi 0% 0% 3% 0% DR Congo 5% 17% 8% 0% Ethiopia 7% 6% 0% 4% Somalia 32% 61% 62% 0% South Sudan 44% 11% 18% 96% Sudan 10% 6% 10% 0% Uganda 2% 0% 0% 0% 38 If both the Block Leader and Chair Lady from a given block were interviewed, but they were from different blocks, the Block Leader s country of origin was selected. This determination was made to reflect common gendered power dynamics. 144
157 11.2 KNOWLEDGE AND INTERACTIONS The respondent(s) for each block were asked a series of questions related to their knowledge of the households sampled in their block and their interaction and connections with the households. This information was disaggregated by sub-camp (Table A50) and country of origin (Table A51). Table A50: Community Leaders Knowledge of and Interaction with the Sampled Households Kakuma 1 Kakuma 2 Kakuma 3 Kakuma 4 Total Knowledge: Sample size Percentage of blocks where >50% of households were known Percentage of blocks where >75% of households were known Percentage of blocks where >90% of households were known Percentage of blocks where all households were known 85% 94% 82% 88% 86% 68% 94% 67% 80% 74% 51% 67% 54% 56% 55% 37% 56% 36% 40% 40% mean Percentage of households known by the respondents in each block median range Length known and frequency of interaction: Sample size Percentage of respondents knowing the households known to them for at least two years 32% 63% 45% 32% 41% mean Years respondents have known households 39 median range Percentage of respondents interacting with households known to them at least once a week 30% 38% 58% 88% 52% Business or family ties: Sample size Blocks where respondents had any business ties with any of their households 9.8% 0.0% 2.6% 4.0% 4.9% Blocks where respondents had any family ties with any of their households 29% 27% 36% 44% 34% 39 Note: these are means of means, medians of medians, minimum of minimums and maximum of maximums. 145
158 Table A51: Community Leaders Knowledge of and Interaction with the Sampled Households for Different Countries of Origin Somalia South Sudan Other Knowledge: Percentage of blocks where more than 50% of households were known Percentage of blocks where more than 75% of households were known Percentage of blocks where more than 90% of households were known Percentage of blocks where all households were known Sample size % 86% 71% 81% 75% 58% 56% 57% 50% 42% 41% 33% mean Percentage of households known by the respondents in each block median range (23, 100) (5.6, 100) (8.3, 100) Length known: Percentage of respondents that have known all of the households for two or more years Sample size % 35% 34% mean Years respondents have known the households 40 median range (0.04, 39) (0, 37) (0.08, 31) Frequency of Interaction: Percentage of respondents that interact with the households at least once a week Sample size % 65% 44% For the 123 blocks tested, the respondents knew at least one of the households on the list. There were 13 blocks (11%) where the interviewee(s) did not know at least 50 percent of the households. The respondents for most blocks (91/123, 74 percent of blocks) knew more than 75 percent of the households on the list, but only 55 percent (68/123) knew more than 90%. The information on interactions and rankings were only collected for households where at least one of the respondents knew the household. 40 Note: these are means of means, medians of medians, minimum of minimums and maximum of maximums. 146
159 11.3 EMPLOYMENT (INCLUDING BUSINESSES), REMITTANCES AND VULNERABILITY The respondents were then asked to rank the households with respect to employment (including businesses) and remittances. Only those households known to at least one respondent in the block were included (n=1,604). Table A52 summarises the information from the respondents overall and by sub-camp, and Table A53 by country of origin of the block (where if there were two respondents with a different country of origin, the country of origin of the Block Leader was taken). The camp with the highest proportion of Block Leaders that were certain that none of the sampled households in their block had employment was in Kakuma 1 (22%), followed by Kakuma 4 (20%) (See Table A52). While at first this seems surprising, it may be a reflection of the correlation between country of origin of the community leaders 41 and sub-camp, as nearly half of the Kakuma 1 blocks and nearly all of the Kakuma 4 blocks were led by South Sudanese (see Table A49). Indeed, 26 percent of blocks led by South Sudanese were certain that their households were unemployed compared with only 4 percent of blocks led by Somalis (see Table A53). An analysis by sub-camp shows that the greatest degree of uncertainty about remittances was in Kakuma 1 (56 percent of blocks unable or unwilling to reveal remittance information) (Table A52). Blocks in Kakuma 2 and 3 were also quite uncertain, but those in Kakuma 4 seemed to express the greatest degree of certainty about whether or not households were receiving remittances. For Kakuma 2, 3 and 4, of those that were certain, about half were reported to receive no remittances, compared to 73 percent for Kakuma 1. It is not clear how this might be related to the community leaders country of origin. Unlike that expressed through the disaggregation by sub-camp, the proportion of blocks that knew remittance statuses for all households and could rank them was fairly consistent across countries of origin (roughly onequarter) (see Table A53). Of the rest, Somali leaders were more uncertain (or were unwilling to reveal information) about household remittances (60%), compared to 30 percent of South Sudanese leaders and 46 percent of leaders from other countries of origin. As such, almost half of the South Sudanese leaders stated with certainty that none of the households in their blocks receive remittances (47%), compared with only 17 percent of the Sudanese leaders and 29 percent of leaders from countries of origin. 41 For the analysis by country of origin, if both the Block Leader and Chair Lady responded but had different countries of origin, the country of origin of the block leader was taken. 147
160 Table A52: Remittance and Employment Characteristics of Sampled Households Kakuma 1 Kakuma 2 Kakuma 3 Kakuma 4 Total Sample Size Remittances: Blocks where respondents stated all households had none Blocks where respondents stated they were uncertain of some or all household remittances Blocks where respondents stated they knew all household remittances and could rank 32% 28% 26% 44% 32% 56% 50% 49% 16% 45% 12% 22% 26% 40% 24% Employment (incl. Business): Blocks where respondents stated all households had none 22% 17% 7.7% 20% 16% Blocks where respondents stated they were uncertain of some or all household employment Blocks where respondents stated they knew all household employment and could rank 9.8% 5.6% 7.7% 0% 6.5% 68% 78% 85% 80% 77% Do not need assistance: Blocks with household not needing assistance in sample Estimated percentage of all households known Blocks with household not needing assistance in block 32% 39% 21% 0% 23% 13% 6.3% 7.5% 0% 6.6% 54% 39% 39% 8% 37% 148
161 Table A53: Remittance and Employment Characteristics of Sampled Households by Country of Origin of the Block Somalia South Sudan Other Sample Size Remittances: Blocks where respondents stated all households had none Blocks where respondents stated they were uncertain of some or all household remittances Blocks where respondents stated they knew all household remittances and could rank 17% 47% 29% 60% 29% 46% 23% 24% 25% Employment (incl. Business): Blocks where respondents stated all households had none Blocks where respondents stated they were uncertain of some or all household employment Blocks where respondents stated they knew all household employment and could rank 4.2% 26% 21% 6.3% 3.9% 13% 90% 71% 67% Do not need assistance: Blocks with household not needing assistance in sample 31% 9.8% 33% Estimated percentage of all households known 11% 2.2% 6.8% Blocks with household not needing assistance in block 46% 24% 50% It should be noted that the definition of the business/employment variable differed between the two sources. The household questionnaire asked households to report incentive, regular employment, business or casual employment. Comparatively, given the aim of maximising the dispersion among households for the ranking exercise, the scope of business/employment was greater in the community-based targeting interview, as households were probed to report even the most minor income, such as selling tea or mandazis. Of the households represented in the employment sample of 1,520 households, 31 percent were identified by at least one of the two sources as having a business or other employment. Of these, 40 percent were identified only by the household survey and 32 percent were identified only by the community leaders, while the remaining 27 percent were identified by both. Given that the scope of the employment variable was more narrowly defined, it is rather surprising that more households were identified by the household survey. The subgroups with the greatest degree of overlap between data sources were Kakuma 1 (33 percent of those identified by at least one data source were identified by both) and other countries of origin (not from Somalia or South Sudan, 34%). The subgroup with the poorest degree of overlap was Kakuma 4 (22%). For all subgroups except Kakuma 4 and South Sudan, the household survey identified more households with employment than the 149
162 community-based targeting exercise. Overall, these findings do not offer evidence of a particularly good correlation between data sources, and provide further evidence against community-based targeting as an effective targeting strategy in this context. The correlation is even worse for households with remittances. Of the 942 households represented in the restricted remittance sample, 16 percent of households were identified as having remittances by at least one source. Of these, the vast majority (72%) were identified by the community-based targeting exercise alone. Twenty percent were identified only by the household survey, and only the remaining 7.5 percent were identified by both. Upon disaggregation, most subgroups exhibit the same trend, with the overlap between data sources being highest in Kakuma 4 at 11%. It is not clear which data source most accurately reflects reality, although given the likelihood that that many households lied about their remittance income on the household survey, it may suggest that community leaders are better placed to offer more accurate information about household remittances than the households themselves. Very little is known about remittance inflows to refugee camps. While Professor Oka s work explored this in detail, an update to reflect the current context is an important area of future research. 150
163 Table A54: Households Identified as Having Employment and Remittances by the Household Survey and/or Community Leaders, for the Households in Blocks That Can Rank Everyone That They Know Sample Size Overall 1,520 Percent identified by at least 1 source 31% (465) Of those identified by at least one source, % identified by: Both 27% (127) Only household survey 40% (187) Only block 32% (151) K % (140) 33% (46) 38% (53) 29% (41) K % (147) 27% (39) 48% (71) 25% (37) Business and or employment K3 356 K % (127) 13% (51) 24% (31) 22% (11) 39% (49) 27% (14) 37% (47) 51% (26) Somalia % (256) 25% (63) 43% (110) 32% (83) South Sudan % (87) 25% (22) 29% (25) 46% (40) Other % (122) 34% (42) 43% (52) 23% (28) Overall % (147) 7.5% (11) 20% (30) 72% (106) K % (15) 6.7% (1) 47% (7) 47% (7) K % (70) 5.7% (4) 14% (10) 80% (56) Remittances K3 202 K % (35) 8.0% (27) 8.6% (3) 11% (3) 23% (8) 19% (5) 69% (24) 70% (19) Somalia % (88) 9.1% (8) 17% (15) 74% (65) South Sudan % (40) 7.5% (3) 28% (11) 65% (26) Other % (19) 0.0% (0) 21% (4) 79% (15) 151
164 Table A55: Households Identified as Not Being Able to Survive in the Absence of Assistance, per the Household Survey and/or Community Leaders, for the Households in Blocks That Can Rank Everyone That They Know Sample size % identified by at least 1 source Of those identified by at least one source, % identified by: Both Only household survey Only block Overall 1,599 10% (162) 4.3% (7) 35% (56) 61% (99) K % (72) 8.3% (6) 31% (22) 61% (44) K % (47) 2.1% (1) 43% (20) 55% (26) K % (36) 0.0% (0) 19% (7) 81% (29) K % (7) 0.0% (0) 100% (7) 0.0% (0) Somalia % (100) 5.0% (5) 32% (32) 63% (63) South Sudan % (27) 3.7% (1) 30% (8) 67% (18) Other % (35) 2.9% (1) 46% (16) 51% (18) 11.4 CORRELATION OF COMMUNITY LEADER RANKING WITH RANKING BY NON-GIFTED EXPENDITURE/CAPITA/DAY A Spearman correlation coefficient between the community leader ranking and the actual rankings determined from expenditure/capita/day were estimated for each block. The Spearman correlation coefficient is defined as the Pearson correlation coefficient between ranked variables. The Pearson correlation coefficient is given as: where, and are the mean values of the community leader rankings and the expenditure/capita/day rankings and and are the individual household rankings. Individual blocks are under the auspice of a community leader, therefore the rankings and ranking correlations are on a block level. Figure A4 shows a histogram of the distribution of ranking correlation coefficients for the blocks in which community leaders were able to provide differential rankings (n=114). 152


165 Figure A4: Frequency Histogram of the Ranking Correlations on a Block Level Careful consideration must be made when aggregating the ranking correlation coefficients. It is not possible to simply sum or average the block ranking correlation coefficients to calculate zone and sub-camp level values. The Fisher Z transformation needs to be applied to transform the coefficient to an additive quantity; however, this suffers from the property of being undefined when the coefficient is 1.0. We can calculate the aggregated correlation coefficient by using the original equation for the Pearson correlation coefficient in the form: where is the individual block and is the individual household. Using this formula we can aggregate up to the zone and sub-camp level. Table A56 summarises the values for aggregating by zone and Table A57 the aggregation by sub-camp. 153
166 Table A56: Rank Correlation Coefficients Aggregated up to Zone Level Aggregate location sub-camp zone Spearman s correlation coefficient Table A57: Rank Correlation Coefficients Aggregated up to the Sub-camp Level Aggregate location sub-camp Spearman s correlation coefficient There are two different community leaders that can contribute to the rankings of households. This leads to three separate scenarios for ranking: rankings done by Block Leader only, rankings done by Chair Lady only, rankings done by both Chair Lady and Block Leaders. The following figures show each individual scenario. Figure A5, A6 and A7 show the frequency histograms for the correlation coefficients from rankings by Block Leader and Chair Lady, Block Leader and Chair Lady, respectively. 154


167 Figure A5: Frequency Histogram of Correlation Coefficient from Rankings by Both Block Leader and Chair Lady Figure A6: Frequency Histogram of Correlation Coefficient from Rankings by Block Leader 155

168 Figure A7: Frequency Histogram of Correlation Coefficient from Rankings by Chair Lady The above figures demonstrate that the Block Leaders tend to have better knowledge of the rankings of households. Although the rankings done by Block Leaders have a higher number of individuals who had strong correlation, the rankings down by both Block Leaders and Chair Ladies is less disperse and tends to be higher in overall correlation COMMUNITY-BASED TARGETING CHALLENGES A few challenges were encountered during the community-based targeting exercises. One of these was related to the community leaders knowledge of the sampled households and the way these households had identified themselves during the household survey. At times, the community leaders were not sure of the head of household s real name, as they normally identified them with nicknames. In other cases, the sampled households had only provided one of their names, and it was therefore impossible for community leaders to state with certainty whether they knew that specific family. This was particularly problematic for common names in large blocks. In these cases, community leaders were urged to counter check the additional information provided (the household s year of arrival, country of origin and size). If the community leaders were still not able to recognise the household, the household was marked as unknown. A related challenge was that community leaders often looked through the list of sampled households and said they knew all of them. The standard procedure was to then ask questions for each of the sampled households. This exercise often revealed that the community leaders 156
Kakuma Refugee Camp: Household Vulnerability Study
 Kakuma Refugee Camp: Household Vulnerability Study Dr. Helen Guyatt Flavia Della Rosa Jenny Spencer Dr. Eric Nussbaumer Perry Muthoka Mehari Belachew Acknowledgements Commissioned by WFP, UNHCR and partners
VULNERABILITY STUDY IN KAKUMA CAMP
 EXECUTIVE BRIEF VULNERABILITY STUDY IN KAKUMA CAMP In September 2015, the World Food Programme (WFP) and the United Nations High Commissioner for Refugees (UNHCR) commissioned Kimetrica to undertake an
Design of an Impact Study to Evaluate the Scaling up of the WFP Voucher Scheme
 Design of an Impact Study to Evaluate the Scaling up of the WFP Voucher Scheme Dr. Helen Guyatt, Head of Research helen.guyatt@kimetrica.com www.kimetrica.com Develop a set of analytical tools: To inform
FOOD SECURITY AND OUTCOMES MONITORING REFUGEES OPERATION
 Highlights The yearly anthropometric survey in Kakuma was conducted in November with a Global Acute Malnutrition (GAM) rate of 11.4% among children less than 5 years of age. This is a deterioration compared
WFP SAFE Project in Kenya
 WFP SAFE Project in Kenya Project Summary Report June 2013 This report briefly summarises WFP s Safe Access to Firewood and alternative Energy (SAFE) project in Kenya. SAFE background In 2007, the Inter-Agency
EASTERN SUDAN FOOD SECURITY MONITORING
 EASTERN SUDAN FOOD SECURITY MONITORING KASSALA STATE, ROUND 1 JULY 2010 Highlights Round 1 of the FSMS in was carried out at the peak of the lean season. The food security situation in the urban and rural
Somali refugees arriving at UNHCR s transit center in Ethiopia. Djibouti Eritrea Ethiopia Kenya Somalia Uganda. 58 UNHCR Global Appeal
 Somali refugees arriving at UNHCR s transit center in Ethiopia. Djibouti Eritrea Ethiopia Kenya Somalia Uganda 58 UNHCR Global Appeal 2010 11 East and Horn of Africa Working environment UNHCR The situation
Uganda s Self-Reliance Model: Does it Work?
 RSC Research in Brief 11, January 2019 Uganda s Self-Reliance Model: Does it Work? Key Points Uganda gives refugees the right to work and freedom of movement through its self-reliance model. The model
The World Food Programme (WFP) Jordan FOOD SECURITY OUTCOME MONITORING (FSOM) Quarter 4 (Q4) 2016: Summary Report
 Jordan FOOD SECURITY OUTCOME MONITORING (FSOM) Quarter 4 (Q4) 2016: Summary Report") The World Food Programme (WFP) Jordan FOOD SECURITY OUTCOME MONITORING (FSOM) Quarter 4 (Q4) 26: Summary Report Quarter 4 (Q4) 26: Summary Report KEY FINDINGS: The food security situation has overall worsened
The World Food Programme (WFP) Jordan FOOD SECURITY OUTCOME MONITORING (FSOM) Quarter 4 (Q4) 26: Summary Report Quarter 4 (Q4) 26: Summary Report KEY FINDINGS: The food security situation has overall worsened
Legal and Structural Barriers to Livelihoods for Refugees
 Legal and Structural Barriers to Livelihoods for Refugees Housekeeping Please feel free to send questions as the panelists are presenting: there will be a Q&A at the end of the webinar. Use the Q&A feature
Supporting Livelihoods in Azraq Refugee Camp
 Supporting Livelihoods in Azraq Refugee Camp A preliminary evaluation of the livelihood and psychological impacts of the IBV scheme in Azraq Refugee Camp, Jordan JULY 2017 Danish Refugee Council Jordan
Under-five chronic malnutrition rate is critical (43%) and acute malnutrition rate is high (9%) with some areas above the critical thresholds.
 and acute malnutrition rate is high (9%) with some areas above the critical thresholds.") May 2014 Fighting Hunger Worldwide Democratic Republic of Congo: is economic recovery benefiting the vulnerable? Special Focus DRC DRC Economic growth has been moderately high in DRC over the last decade,
May 2014 Fighting Hunger Worldwide Democratic Republic of Congo: is economic recovery benefiting the vulnerable? Special Focus DRC DRC Economic growth has been moderately high in DRC over the last decade,
Poverty profile and social protection strategy for the mountainous regions of Western Nepal
 October 2014 Karnali Employment Programme Technical Assistance Poverty profile and social protection strategy for the mountainous regions of Western Nepal Policy Note Introduction This policy note presents
Quick and Dirty Livelihoods Survey, Kakuma Refugee Camp FIRST DRAFT
 UNIVERSITY OF CAMBRIDGE 1/1 shelterproject.org report title Quick and Dirty Livelihoods Survey, Kakuma Refugee Camp FIRST DRAFT date published July 2003 who undertook the work Jon Fowler jon@shelterproject.org
The Role of Migration and Income Diversification in Protecting Households from Food Insecurity in Southwest Ethiopia
 The Role of Migration and Income Diversification in Protecting Households from Food Insecurity in Southwest Ethiopia David P. Lindstrom Population Studies and Training Center, Brown University Craig Hadley
II. Roma Poverty and Welfare in Serbia and Montenegro
 II. Poverty and Welfare in Serbia and Montenegro 10. Poverty has many dimensions including income poverty and non-income poverty, with non-income poverty affecting for example an individual s education,
The World Food Programme (WFP) Jordan FOOD SECURITY OUTCOME MONITORING (FSOM) Quarter 3 (Q3) 2017: Summary Report
 Jordan FOOD SECURITY OUTCOME MONITORING (FSOM) Quarter 3 (Q3) 2017: Summary Report") The World Food Programme (WFP) Jordan FOOD SECURITY OUTCOME MONITORING (FSOM) KEY FINDINGS: Food consumption improved amongst Syrian refugee households in quarter 3 (Q3), for both WFP general food assistance
The World Food Programme (WFP) Jordan FOOD SECURITY OUTCOME MONITORING (FSOM) KEY FINDINGS: Food consumption improved amongst Syrian refugee households in quarter 3 (Q3), for both WFP general food assistance
Main Findings. WFP Food Security Monitoring System (FSMS) West Darfur State. Round 10 (May 2011)
 West Darfur State. Round 10 (May 2011)") WFP Food Security Monitoring System (FSMS) Round 1 (May 11) West Darfur State Main Findings Data collection was carried out in May 11, which corresponds to the pre hunger season and all the sentinel sites
WFP Food Security Monitoring System (FSMS) Round 1 (May 11) West Darfur State Main Findings Data collection was carried out in May 11, which corresponds to the pre hunger season and all the sentinel sites
The commissioning organisations:
 Term of Reference Evaluation of the Cash-Transfer-programming: Improving the economical relations between the local host communities and refugees in Dadaab, Kenya 1) Introduction Diakonie Katastrophenhilfe
JUBA - SOUTH SUDAN FEBRUARY 2014
 FACTSHEET #1: UN HOUSE JUBA - SOUTH SUDAN FEBRUARY 2014 CONTEXT This fact sheet presents the key findings of a recent REACH assessment in the UN House Protection of Civilians (PoC) area. The motivations
PATHWAYS TO RESILIENCE: TRANSFORMING SYRIAN REFUGEE CAMPS INTO SELF-SUSTAINING SETTLEMENTS
 PATHWAYS TO RESILIENCE: TRANSFORMING SYRIAN REFUGEE CAMPS INTO SELF-SUSTAINING SETTLEMENTS FEASIBILITY STUDY FOR RESILIENCE-BUILDING IN SYRIAN REFUGEE CAMPS AND THEIR NEIGHBOURING HOST COMMUNITIES IN THE
FOOD ASSISTANCE TO. Refugees. Refugee Operations faces a significant funding shortfall
 OCTOBER 2016 FOOD ASSISTANCE TO Refugees Refugee Operations faces a significant funding shortfall World Food Programme NEWSLETTER WFP/Daniel Dyssel IN THIS ISSUE Refugee Operations faces a significant
Kenya. Main objectives. Working environment. Recent developments. Total requirements: USD 35,068,412
 Main objectives Ensure that appropriate standards of asylum, treatment, safety and security are met and maintained for refugees. Pursue a comprehensive durable solutions strategy with an emphasis on voluntary
Returning Home: Post-Conflict Livelihoods in Northern Uganda. Extended Abstract
 Returning Home: Post-Conflict Livelihoods in Northern Uganda Kim Lehrer Extended Abstract Wars and civil conflicts have substantial destructive impacts. In addition to the direct consequences, conflicts
KENYA KAKUMA OPERATIONAL UPDATE
 KEY FIGURES 169,203 The camp population as at 12 th April 2017. The figure is inclusive of Kalobeyei population. 5,407 Total number of South Sudanese new arrivals registered in 2017. KENYA KAKUMA OPERATIONAL
United Nations High Commissioner for Refugees (UNHCR) (May 2013 April 2014)
 (May 2013 April 2014)") United Nations High Commissioner for Refugees (UNHCR) (May 2013 April 2014) UNHCR s support to New Partnership for Africa s Development (NEPAD) Planning and Coordinating Agency Operational highlights In
United Nations High Commissioner for Refugees (UNHCR) (May 2013 April 2014) UNHCR s support to New Partnership for Africa s Development (NEPAD) Planning and Coordinating Agency Operational highlights In
UNHCR ACTIVITIES FINANCED BY VOLUNTARY FUNDS: REPORT FOR AND PROPOSED PROGRAMMES AND BUDGET FOR 1996 PART I. AFRICA. Section 11 - Kenya
 UNITED NATIONS A General Assembly Distr. GENERAL A/AC.96/846/Part I/11 17 July 1995 Original: ENGLISH EXECUTIVE COMMITTEE OF THE HIGH COMMISSIONER S PROGRAMME Forty-sixth session UNHCR ACTIVITIES FINANCED
Did you sleep here last night? The impact of the household definition in sample surveys: a Tanzanian case study.
 Did you sleep here last night? The impact of the household definition in sample surveys: a Tanzanian case study. Tiziana Leone, LSE Ernestina Coast, LSE Sara Randall, UCL Abstract Household sample surveys
Targeting in a National Social Safety Net Programme. WFP Turkey
 Targeting in a National Social Safety Net Programme WFP Turkey Emergency Social Safety Net Background EU funded nationwide assistance programme to refugees in Turkey Registration: Ministry of Interior
KAWEMPE I NEIGHBORHOOD PROFILE Urban community assessment Kampala, Uganda - July 2018
 KAWEMPE I NEIGHBORHOOD PROFILE Urban community assessment Kampala, Uganda - July 8 CONTEXT Surrounded by countries facing political instability, Uganda is the primary destination for refugees from South
Vulnerability Assessment Framework
 Vulnerability Assessment Framework JORDAN RESPONSE PLAN Key findings June 2015 Developed under an interagency steering committee, including 5 NGOs, 5 UN agencies, BPRM and ECHO Refugees Outside of Camps
GENDER FACTS AND FIGURES URBAN NORTH WEST SOMALIA JUNE 2011
 GENDER FACTS AND FIGURES URBAN NORTH WEST SOMALIA JUNE 2011 Overview In November-December 2010, FSNAU and partners successfully piloted food security urban survey in five towns of the North West of Somalia
KISENYI III NEIGHBORHOOD PROFILE Urban community assessment Kampala, Uganda - July 2018
 KISENYI III NEIGHBORHOOD PROFILE Urban community assessment Kampala, Uganda - July 8 CONTEXT Surrounded by countries facing political instability, Uganda is the primary destination for refugees from South
Rapid Household Economy Analysis, Bidibidi Refugee Settlement, Yumbe District, Uganda
 Rapid Household Economy Analysis, Bidibidi Refugee Settlement, Yumbe District, Uganda Household Economy Analysis (HEA) Assessment conducted by DanChurchAid-DCA and Save the Children, February 2017 Report
INFORMATION NOTES SUMMARY OF EVALUATION RECOMMENDATIONS AND MANAGEMENT RESPONSE PRO KENYA
 Executive Board Second Regular Session Rome, 17-19 May 2000 INFORMATION NOTES SUMMARY OF EVALUATION RECOMMENDATIONS AND MANAGEMENT RESPONSE PRO KENYA 4961.04 E This document should be read in conjunction
UNHCR/ Samuel Otieno CASH FOR SHELTER IN KENYA A FIELD EXPERIENCE. Providing Safe Homes to Refugees and Supporting Local Markets
 UNHCR/ Samuel Otieno CASH FOR SHELTER IN KENYA A FIELD EXPERIENCE Providing Safe Homes to Refugees and Supporting Local Markets UNHCR/Antonia Paradela SUMMARY In north-western Kenya, UNHCR provides 730
BANQUE AFRICAINE DE DEVELOPPEMENT
 BANQUE AFRICAINE DE DEVELOPPEMENT Publication autorisée Publication autorisée KENYA: PROPOSAL FOR AN EMERGENCY HUMANITARIAN ASSISTANCE TO POPULATION AFFECTED BY DROUGHT AND FAMINE* LIST OF ACRONYMS AND
Children and Youth Bulge: Challenges of a Young Refugee Population in the East and Horn of Africa
 Children and Youth Bulge: Challenges of a Young Refugee Population in the East and Horn of Africa Introduction: The East and Horn of Africa is one of the biggest refugee-hosting regions in the world, with
REMITTANCE TRANSFERS TO ARMENIA: PRELIMINARY SURVEY DATA ANALYSIS
 REMITTANCE TRANSFERS TO ARMENIA: PRELIMINARY SURVEY DATA ANALYSIS microreport# 117 SEPTEMBER 2008 This publication was produced for review by the United States Agency for International Development. It
Supporting Kakuma s Refugee Traders
 Supporting Kakuma s Refugee Traders The Importance of Business Documentation in an Informal Economy August 2018 Contents In appreciation The Norwegian Refugee Council (NRC) and the International Human
KENYA. The majority of the refugees and asylum-seekers in Kenya live in designated camps. Overcrowded
 KENYA ThepeopleofconcerntoUNHCRinKenyainclude refugees, asylum-seekers, internally displaced persons (IDPs) and stateless people. Some activities also extend to members of host communities. The majority
Call for Research Proposals to Assess the Economic Impact of Refugees on host and/or regional economies
 Call for Research Proposals to Assess the Economic Impact of Refugees on host and/or regional economies Background: There is very limited work to date on the economic impact of refugees on host and/or
REFUGEES ECHO FACTSHEET. Humanitarian situation. Key messages. Facts & Figures. Page 1 of 5
 ECHO FACTSHEET REFUGEES Facts & Figures 45.2 million people are forcibly displaced. Worldwide: 15.4 million refugees, 28.8 million internally displaced, 937 000 seeking asylum. Largest sources of refugees:
Economic and Social Council
 United Nations Economic and Social Council Distr.: General 27 December 2001 E/CN.3/2002/27 Original: English Statistical Commission Thirty-third session 5-8 March 2002 Item 7 (f) of the provisional agenda*
UNDERSTANDING THE NEEDS OF URBAN REFUGEES AND HOST COMMUNITIES RESIDING IN VULNERABLE NEIGHBORHOODS OF KAMPALA
 KAMPALA PROFILE UNDERSTANDING THE NEEDS OF URBAN REFUGEES AND HOST COMMUNITIES RESIDING IN VULNERABLE NEIGHBORHOODS OF KAMPALA A multisector analysis of the dynamics of supply and access to basic services
Smart practices that enhance resilience of migrants Kenya
 Smart practices that enhance resilience of migrants Kenya 1 P a g e COUNTRY CONTEXT Kenya is a point of origin, transit and destination for different categories of vulnerable migrants. Kenya is a source
ARMENIA COMPREHENSIVE FOOD SECURITY, VULNERABILITY ANALYSIS (CFSVA) UPDATE 2017
 UPDATE 2017") ARMENIA COMPREHENSIVE FOOD SECURITY, VULNERABILITY ANALYSIS (CFSVA) UPDATE 2017 SOCIO-ECONOMIC TRENDS The Armenia Comprehensive Food Security, Vulnerability Analysis (CFSVA) Update presents the current
ARMENIA COMPREHENSIVE FOOD SECURITY, VULNERABILITY ANALYSIS (CFSVA) UPDATE 2017 SOCIO-ECONOMIC TRENDS The Armenia Comprehensive Food Security, Vulnerability Analysis (CFSVA) Update presents the current
Ethiopia. Main objectives. Planning figures. Total requirements: USD 13,679,942
 Main objectives Promote the voluntary repatriation of 25,000 Sudanese refugees. Promote the voluntary repatriation of residual Somali refugees to north-west Somaliland and facilitate dispersal from the
Irregular Migration in Sub-Saharan Africa: Causes and Consequences of Young Adult Migration from Southern Ethiopia to South Africa.
 Extended Abstract Irregular Migration in Sub-Saharan Africa: Causes and Consequences of Young Adult Migration from Southern Ethiopia to South Africa. 1. Introduction Teshome D. Kanko 1, Charles H. Teller
Dadaab intentions and cross-border movement monitoring Dhobley district, Somalia and Dadaab Refugee Complex, Kenya, November 2018
 Dhobley district, Somalia and Dadaab Refugee Complex, Kenya, November 2018 Background As of October 2018, a total of 208,550 1 mostly Somali refugees reside in Dadaab camps. Since May 2017, REACH has worked
Household Vulnerability and Population Mobility in Southwestern Ethiopia
 Household Vulnerability and Population Mobility in Southwestern Ethiopia David P. Lindstrom Heather F. Randell Population Studies and Training Center & Department of Sociology, Brown University David_Lindstrom@brown.edu
Accessing Home. Refugee Returns to Towns and Cities: Experiences from Côte d Ivoire and Rwanda. Church World Service, New York
 Accessing Home Refugee Returns to Towns and Cities: Experiences from Côte d Ivoire and Rwanda Church World Service, New York December 2016 Contents Executive Summary... 2 Policy Context for Urban Returns...
UNDP UNHCR Transitional Solutions Initiative (TSI) Joint Programme
 Joint Programme") UNITED NATIONS DEVELOPMENT PROGRAMME UNITED NATIONS HIGH COMMISSIONER FOR REFUGEES UNDP UNHCR Transitional Solutions Initiative (TSI) Joint Programme DEVELOPMENT PARTNER BRIEF, NOVEMBER 2013 CONTEXT During
UNITED NATIONS DEVELOPMENT PROGRAMME UNITED NATIONS HIGH COMMISSIONER FOR REFUGEES UNDP UNHCR Transitional Solutions Initiative (TSI) Joint Programme DEVELOPMENT PARTNER BRIEF, NOVEMBER 2013 CONTEXT During
PROJECT BUDGET REVISION FOR APPROVAL BY THE REGIONAL DIRECTOR
 PROJECT BUDGET REVISION FOR APPROVAL BY THE REGIONAL DIRECTOR 5) To: Initials In Date Out Date Reason for Delay Regional Director 4) Through: Initials In Date Out Date Reason for Delay Programme Adviser,
Table of Contents GLOBAL ANALISIS. Main Findings 6 Introduction 10. Better data for better aid by Norman Green 19
 Table of Contents Main Findings 6 Introduction 10 GLOBAL ANALISIS Chapter I: Sources, Methods, And Data Quality 14 Better data for better aid by Norman Green 19 Chapter II: Population Levels And Trends
ETHIOPIA. Working environment. Planning figures for Ethiopia. The context
 ETHIOPIA Working environment The context The past two years have seen the refugee population in Ethiopia nearly double. This is due to the influx of more than 100,000 Somalis into the Dollo Ado region,
Refugee Economies. in Kenya. Alexander Betts Naohiko Omata Olivier Sterck
 Refugee Economies in Kenya Alexander Betts Naohiko Omata Olivier Sterck Credit: N. Omata 2 Refugee Economies in Kenya Contents Executive summary 4 1. Introduction 6 2. Methodology 10 11 12 3. Economic
Horn of Africa Situation Report No. 19 January 2013 Djibouti, Ethiopia, Kenya, Somalia, South Sudan
 Horn of Africa Situation Report No. 19 January 2013 Djibouti, Ethiopia, Kenya, Somalia, South Sudan AT A GLANCE Conditions across the Horn of Africa have improved, however a crisis food security situation
Pathways to graduation: is graduation from social safety net support possible and why? Evidence from sub-saharan Africa
 Pathways to graduation: is graduation from social safety net support possible and why? Evidence from sub-saharan Africa Silvio Daidone Food and Agriculture Organization Luca Pellerano Oxford Policy Management
KENYA KAKUMA OPERATIONAL UPDATE 1 ST 15 TH FEBRUARY 2017 HIGHLIGHTS
 KENYA KAKUMA OPERATIONAL UPDATE 1 ST 15 TH FEBRUARY 2017 HIGHLIGHTS KEY FIGURES 162,863 The camp population as at 15 th February 2017. The figure is inclusive of Kalobeyei population. 1187 Number of South
Household Income and Expenditure Survey Methodology 2013 Workers Camps
 Household Income and Expenditure Survey Methodology 2013 Workers Camps 1 Content Introduction 3 Target community: 4 Survey geographical coverage: 4 Sampling method: 4 Survey variables: 5 Survey Questionnaires:
COMMUNITY CENTRES AND SOCIAL COHESION
 COMMUNITY CENTRES AND SOCIAL COHESION JORDAN DECEMBER 2017 Danish Refugee Council Jordan Office 14 Al Basra Street, Um Othaina P.O Box 940289 Amman, 11194 Jordan +962 6 55 36 303 www.drc.dk The Danish
REGIONAL QUARTERLY UPDATE: 3RP ACHIEVEMENTS DECEMBER 2017
 REGIONAL QUARTERLY UPDATE: 3RP ACHIEVEMENTS DECEMBER These dashboards reflect selected regional sectoral indicators on the humanitarian and resilience responses of more than 240 partners involved in the
Kenya. Ensure safe and dignified asylum for all asylumseekers. Working environment. Main objectives. Impact. The context
 Impact Over 240,000 refugees in camps and urban areas enjoyed asylum. Some 8,293 new asylum-seekers (4,344 Sudanese, 3,949 Somalis) and other nationalities found refuge in. UNHCR assisted 800 refugees,
12%* DEMOCRATIC REPUBLIC OF THE CONGO 46,500. Refugee. Refugee camp. Refugee crossing. Refugee locations. Assisted returns in 2018
 BURUNDI - Regional RRP 2018 Mid Year Report January - June 2018 2018 RESPONSE 394,778 BURUNDIAN REFUGEES US$ 391M REQUIREMENTS IN 2018 12%* FUNDING RECEIVED (17 JULY 2018) 27 RRRP PARTNERS INVOLVED REGIONAL
KENYA KAKUMA OPERATIONAL UPDATE 24 th 30 th JULY 2014 HIGHLIGHTS
 KEY FIGURES 41,450 Asylum seekers received through Nadapal border point since influx began in December 2013. 853 Unaccompanied minors registered by UNHCR since influx began 12 Litres of water provided
HIGHLIGHTS DJIBOUTI INTER-AGENCY UPDATE FOR THE RESPONSE TO THE YEMEN SITUATION #38 7,002. 2,945 Registered females.
 DJIBOUTI INTER-AGENCY UPDATE FOR THE RESPONSE TO THE YEMEN SITUATION #38 31 March 2016 HIGHLIGHTS KEY FIGURES 7,002 According to the latest available statistics from IOM and the Djibouti government, 33,340
Findings of the Household Assessment of Syrian Households in Host Communities. Jarash Governorate. 7 th March 2013
 Geographical Scope / Depth of Data Findings of the Household Assessment of Syrian Households in Host Communities Jarash Governorate 7 th March 213 BACKGROUND The continued crisis in Syria has caused a
Internally. PEople displaced
 Internally displaced people evicted from Shabelle settlement in Bosasso, Somalia, relocate to the outskirts of town. A child helps his family to rebuild a shelter made of carton boxes. Internally PEople
HOUSEHOLD LEVEL WELFARE IMPACTS
 CHAPTER 4 HOUSEHOLD LEVEL WELFARE IMPACTS The household level analysis of Cambodia uses the national household dataset, the Cambodia Socio Economic Survey (CSES) 1 of 2004. The CSES 2004 survey covers
Shock and Poverty in Sub-Saharan Africa: The Case of Burkina Faso (Report on Pre-Research in 2006)
") Shock and Poverty in Sub-Saharan Africa: The Case of Burkina Faso (Report on Pre-Research in 2006) Takeshi Sakurai (Policy Research Institute) Introduction Risk is the major cause of poverty in Sub-Saharan
Shock and Poverty in Sub-Saharan Africa: The Case of Burkina Faso (Report on Pre-Research in 2006) Takeshi Sakurai (Policy Research Institute) Introduction Risk is the major cause of poverty in Sub-Saharan
Characteristics of the Ethnographic Sample of First- and Second-Generation Latin American Immigrants in the New York to Philadelphia Urban Corridor
 Table 2.1 Characteristics of the Ethnographic Sample of First- and Second-Generation Latin American Immigrants in the New York to Philadelphia Urban Corridor Characteristic Females Males Total Region of
KENYA. Overview. Operational highlights
 KENYA 2013 GLOBAL REPORT UNHCR s presence 2013 Number of offices 4 Total personnel 447 International staff 65 National staff 337 JPOs 6 UN Volunteers 39 Overview Operational highlights The Governments
Above-average use of food-related coping continued for households in Anbar (20%) and Ninewa (18%) and declined by 11 percent in Salah Al-Din.
 and Ninewa (18%) and declined by 11 percent in Salah Al-Din.") Fighting hunger worldwide Bulletin 11 October 2015 IRAQ October 2015: Food security indicators continue to be poor in Anbar and Ninewa governorates, and for IDPs Highlights Food consumption indicators
Fighting hunger worldwide Bulletin 11 October 2015 IRAQ October 2015: Food security indicators continue to be poor in Anbar and Ninewa governorates, and for IDPs Highlights Food consumption indicators
FOOD SECURITY OUTCOME MONITORING : SYRIAN REFUGEES IN JORDAN
 FOOD SECURITY OUTCOME MONITORING : SYRIAN REFUGEES IN JORDAN TERMS OF REFERENCE- DRAFT NOVEMBER 2015 SUMMARY As the Syrian refugee crisis enters its fifth year, rates of external assistance have begun
Refugee Protection Situation Report Volume 2, Issue No.9 of 2018 Period: 1 st August 31 st August Date: 17 th September, 2018
 Refugee Protection Situation Report Volume 2, Issue No.9 of 2018 Period: 1 st August 31 st August Date: 17 th September, 2018 Introduction This report focuses on refugees and asylum seekers protection
statistical yearbook 2008
 united nations high commissioner for refugees statistical yearbook 2008 Trends in Displacement, Protection and Solutions Somali refugees in Hagadera Camp, Dadaab, Kenya. UNHCR/ E. Hockstein UNHCR The UN
FOOD ASSISTANCE TO. Refugees
 FOOD ASSISTANCE TO Refugees World Food Programme NEWSLETTER JUNE 2016 WFP/Martin Karimi WFP provides full food basket in cash for refugees moving to Kalobeyei IN THIS ISSUE WFP provides full food basket
Not Ready to Return: IDP Movement Intentions in Borno State NIGERIA
 Not Ready to Return: IDP Movement Intentions in Borno State NIGERIA REPORT SEPTEMBER 2017 Not Ready to Return: IDP Movement Intentions in Borno State September 2017 About REACH REACH is a joint initiative
Working with the internally displaced
 Working with the internally displaced The number of people who have been displaced within their own countries as a result of armed conflict has grown substantially over the past decade, and now stands
Addressing Human Trafficking, Kidnapping and Smuggling of Persons in Sudan MID-YEAR REPORT JANUARY-JUNE 2017
 Addressing Human Trafficking, Kidnapping and Smuggling of Persons in Sudan MID-YEAR REPORT JANUARY-JUNE 2017 1 Sudan is at the centre of the East African migration route towards North Africa and Europe.
2015 Accountability Framework DRC-DDG Horn of Africa & Yemen DRC-KENYA
 May 2015 2015 Accountability Framework DRC-DDG Horn of Africa & Yemen DRC-KENYA This accountability framework summarizes DRC s commitments to our stakeholders in Kenya that are additional to DRC s global
Persons of concern. provided with food. UNHCR s voluntary repatriation operationtosouthernsudan,whichbeganin2006, continued in 2008.
 Economic growth rates in Uganda are high and well above the average of sub-saharan Africa. Nonetheless, infrastructure constraints, economic problems in the northern part of the country and the persistence
Impact of FilmAid Programs in Kakuma, Kenya. Final Report
 Impact of FilmAid Programs in Kakuma, Kenya Final Report January 29, 2007 Katharine Lee MA, MPH Principal Investigator Paul Bolton MBBS, DTMH, MPH, MSc Applied Mental Health Group Center for International
Facts and Figures: Migra;on in the East African Community
 Facts and Figures: Migra;on in the East African Community In mid-2015, there were 217,360 refugees and 24,157 asylum seekers origina?ng from Burundi, and 78,948 IDPs. UNHCR announced that the number of
THE WAGES OF WAR: How donors and NGOs can build upon the adaptations Syrians have made in the midst of war
 THE WAGES OF WAR: How donors and NGOs can build upon the adaptations Syrians have made in the midst of war FEBRUARY 2018 The scale of death and suffering in Syria is monumental. What began as a series
Syrian Refugee Crisis:
 Syrian Refugee Crisis: Rapid Assessment Amman, Jordan July 2012 A Syrian refugee child receives a meal from the U.N. World Food Programme at his temporary home in the Jordanian city of Al Ramtha, near
The Sudan Consortium African and International Civil Society Action for Sudan. Sudan Public Opinion Poll Khartoum State
 The Sudan Consortium African and International Civil Society Action for Sudan Sudan Public Opinion Poll Khartoum State April 2015 1 Table of Contents 1. Introduction... 3 1.1 Background... 3 1.2 Sample
RWANDA. Overview. Working environment
 RWANDA 2014-2015 GLOBAL APPEAL UNHCR s planned presence 2014 Number of offices 5 Total personnel 111 International staff 27 National staff 65 UN Volunteers 14 Others 5 Overview Working environment Rwanda
INTERNATIONAL JOURNAL of RESEARCH GRANTHAALAYAH A knowledge Repository
 ASSESSING INCOME GENERATION ACTIVITIES IN WEST AND CENTRAL DARFUR STATES Dr. Badreldin Mohamed Ahmed Abdulrahman 1, Dr. Tarig Ibrahim Mohamed Abdelmalik 2 1 Department of Economics, Faculty of Economics
Vulnerability Assessment Framework
 Jordan Vulnerability Assessment Framework 7 Population Survey Report SECTOR VULNERABILITY REVIEW An overview of the socio-economic vulnerabilities of Syrian refugees residing amongst the Jordanian host
WINGS Women s Income Generation Support Program. Northern Uganda
 WINGS Women s Income Generation Support Program Northern Uganda Promoting Recovery after War: Micro-enterprises for Vulnerable Women? SAIS International Development Washington, DC, 26th March 2012 By Francesca
133% 65+ years 1% % years 14% 544% 0-2 years 5%
 +59A 41% +50A 50% Multi-Sector Needs Assessment - July 2018 Background and Methodology An estimated 723,000 Rohingya refugees have fled violence in Myanmar s Rakhine state since August 25, 2017 1. Most
OCHA Regional Office for Central and East Africa
 Displaced Populations Report 1 J a n u a r y J u n e 2 0 0 7, I S S U E 1 United Nations Office for the Coordination of Humanitarian Affairs Major Findings By mid-2007, the IDP population in the CEA region
Refugee Protection Situation Report Volume 2, Issue No.11 of 2018 Period: 1 st October 31 st October Date: 15 th November, 2018
 Refugee Protection Situation Report Volume 2, Issue No.11 of 2018 Period: 1 st October 31 st October Date: 15 th November, 2018 Introduction This report focuses on refugees and asylum seekers protection
BWAISE II NEIGHBORHOOD PROFILE Urban community assessment Kampala, Uganda - July 2018
 BWAISE II NEIGHBORHOOD PROFILE Urban community assessment Kampala, Uganda - July 8 CONTEXT Surrounded by countries facing political instability, Uganda is the primary destination for refugees from South
Definitions. Banks in Uganda licensed and regulated by Bank of Uganda.
 i ii Acronyms AWRS Annual Workers Remittance Survey BOP Balance of Payments BOU Bank of Uganda EA Enumeration Area FEA Foreign Exchange Act 2004 GDP Gross Domestic Product HH Household MTO Money Transfer
Microfinance for Syrian Refugees: The Lebanese and Jordanian Market December 2017
 Microfinance for Syrian Refugees: The Lebanese and Jordanian Market December 2017 Since fighting broke out in 2011, more than 1.6 million Syrians have fled to Lebanon and Jordan. With no end of the fighting
Office of the United Nations High Commissioner for Refugees (UNHCR) (May 2012 until April 2013)
 (May 2012 until April 2013)") Office of the United Nations High Commissioner for Refugees (UNHCR) (May 2012 until April 2013) UNHCR support to NEPAD Planning and Coordinating Authority (NPCA) Operational highlights: In 2011, UNHCR
Office of the United Nations High Commissioner for Refugees (UNHCR) (May 2012 until April 2013) UNHCR support to NEPAD Planning and Coordinating Authority (NPCA) Operational highlights: In 2011, UNHCR
CONGOLESE SITUATION RESPONDING TO THE NEEDS OF DISPLACED CONGOLESE AND REFUGEES
 CONGOLESE SITUATION RESPONDING TO THE NEEDS OF DISPLACED CONGOLESE AND REFUGEES ANNEX - UGANDA Supplementary Appeal January - December 2018 Uganda Map of the area covered by this appeal 2 UNHCR / February,