An Index of inter-industry wage inequality by Nathalie Scholl: A Reply
|
|
|
- Camron Copeland
- 5 years ago
- Views:
Transcription
1 An Index of inter-industry wage inequality by Nathalie Scholl: A Reply James Galbraith Jaehee Choi Amin Shams University of Texas Inequality Project Working Paper #74 October 26, 2017 Abstract Using methods similar to the ones developed by the University of Texas Inequality Project (UTIP), Scholl (2017) has produced a data set that measures inter-industry inequality of wages. In this paper, we review her analysis and show that a major source of differences between her measures and those of UTIP arises from the treatment of the raw UNIDO Industrial Statistics data. First, UTIP adjusts industrial categories to avoid distortions arising from country-specific reclassification of industries in many countries between 1969 and Second, we pay special attention to coding errors and other data anomalies at the level of industry payrolls or employment, which can have dramatic effects on the between-groups component of Theil s T statistic. Correcting for these small problems produces significantly lower signal-to-noise ratios in UTIP measures compared to Scholl s. Moreover, we find that the UTIP-UNIDO series does a good job of capturing the dynamics of other available income inequality measures, hence the claim that there is no relationship between inter-industry inequalities and household income inequalities is contradicted by our evidence. JEL Classification: D30, J30, J31, O15 Keywords: Theil statistics, Gini coefficient, income inequality, manufacturing pay inequality The authors thank Nathalie Scholl for sharing her measures of inter-industry inequality of manufacturing wages, and for cordial correspondence on these issues over some months. LBJ School of Public Affairs, University of Texas at Austin. galbraith@mail.utexas.edu McCombs School of Business, UT-Austin
2 1 Introduction Nathalie Scholl (2017) has produced a data set of her own to measure inter-industry inequality of wages actually, of average payroll per employee. She uses methods similar to ours, as developed by the University of Texas Inequality Project over the years, and specifically as published as the UTIP-UNIDO data set of between-industry pay inequality measures. She has concluded from her comparisons that her data set is not a good instrument for broader measures of inequality, such as measures of income inequality by households. This is all very well. But it supports no inference about the quality of our data set or whether our data set is a useful instrument for broader inequality measures. Our purpose in this reply is to distinguish Scholl s work from our own. This distinction may be muddied for some readers by this sentence on page 2 of her paper: The estimates suggest that the association between the Theil index of manufacturing and income inequality is neither very stable, nor strong enough to postulate an economically meaningful link between the two concepts, By the estimates Scholl is referring to the relationship between her index and a set of broader measures of income inequality. By the Theil index she is referring to her calculations, not to ours, although ours is also a Theil index of inequality in manufacturing pay. By using the word concepts, she makes an extrapolation from her particular index to the general relationship between a betweenindustries measure of inequality in average payrolls and broader measures of inequality. This extrapolation is unjustified. The weak (or indeed, absent) relationship is a feature of her particular index alone. In this paper, we review her analysis and show that a major source of differences between her measures and those of UTIP arises from the treatment of the raw UNIDO Industrial Statistics data. In the next section, we describe this process in greater detail. As in any empirical work, any extreme changes in the raw data deserve special attention. In the third section, we discuss an issue raised by Scholl, concerning the measurement of inequalities within sectors. We then discuss a final issue, namely the relationship between our measures and more general measures of income inequality, in the fourth section. An appendix provides further detail on the data adjustments we made in the course of calculating our between-groups inequality measures from the raw UNIDO Industrial Statistics, and a country-by-country graphical comparison of our measures with those of Scholl, for those countries where there are significant discrepancies between her measurements and our own. 1
3 2 Main sources of difference between Scholl and UTIP measures A comparison of Scholl s measures with our own shows that in the cases where her measures differ significantly from ours, the differences can often be traced to highly erratic and per se improbable movements of her measures. Examples include Australia, Austria, Belgium, Botswana, Bulgaria, Estonia, Germany, Haiti, Hong Kong, Jamaica, Jordan, Kenya, Luxembourg, the Netherlands, New Zealand, Norway, Uganda, the UK, the USA and Yemen, as shown in Figures A10-A38 in the appendix to this reply. These problems in Scholl s data arise from quality issues in the published versions of the UNIDO Industrial Statistics. Although that data set is a valuable and generally reliable compilation of consistent industrial data supplied by many member states to UNIDO under a common accounting scheme, it suffers from occasional missing entries in the underlying reporting of employment or payrolls, and from some apparent recording errors, such as extra digits and misplaced decimal points. The between-groups component of Theil s T statistic is extremely sensitive to these small problems, which show up as spikes, jumps or plateaus in the resulting inequality series, far out of line with the normal historical development. The likely instances of these problems are easy to spot, although locating typos in the mass of underlying payroll/employment data can be a challenge. We worked carefully to inspect the source data and to clean apparent recording errors and minor omissions from our measures. Our approach to omissions is quite simple, usually a matter of taking an average across a missing year or two, for either payroll or employment (or both). Errors introduced by this and similar adjustments are likely to be small, since manufacturing is a continuous activity that rarely (if ever) drops to zero in a year and rebounds in the next; nor do payrolls jump ten-fold and then fall back. Correcting for these small problems generates a characteristically smooth(er) historical series, where major changes are often associated with clear-cut historical events (such as wars, revolutions, economic crises). This appears to be a major source of difference between the two data sets. Evidence for this difference is a lower level of the coefficients of variation through time in UTIP series compared with Scholl s, and the fact that the UTIP series show no statistical difference in those coefficients, as between series which are highly correlated with Scholl s and those that are not. In Scholl s data, due to the erratic behavior of some of her series, these coefficients are significantly higher for series that exhibit low correlation with the UTIP series. Table A1 in the appendix gives the details. There is also a problem of changes in the category schemes, which occur from time to time as new sectors (such as information technologies) emerge and are accounted 2
4 for separately in industrial data. We approached the problem of changing category schemes by careful recombination of sectors (reuniting mother and daughter sectors) so as to preserve consistency over time. Scholl generally favors either curtailing the data series or dropping the new sectors, both of which entail information loss and also distortion, reducing the comparability of measures across countries and through time. In the appendix, we provide examples of how recombining mother and daughter sectors preserves historical continuity in the data and provide the rationale for our procedure (see Figures A1-A9 and Table A1). Scholl correctly states that these differences in approach to categorization are not the main thing that sets her data set apart from ours. The main thing is the erratic behavior of her series, as compared with ours, in the specific cases where the correlation between the two series is low. In other cases, discrepancies are due to short time series in the Scholl measures, relative to ours; such are the cases of Portugal and Eritrea, for instance. Short coverage in Scholl s data is due to the fact that while we have been calculating these series for years, including from older versions of the UNIDO Industrial Statistics, Scholl had access only to the most recent release. The UNIDO data are not revised over time, so there is usually no reason to recalculate older inequality measures when the data set is updated. Nor is there any reason to discard older measures, merely because the underlying data may not be included in a new release. 3 Inequality Within-Sectors : A Red Herring Scholl makes an effort to show the importance of inequality within sectors. Based on her calculations, she argues that inequality within a sector often moves in the opposite direction from inequality measured between sectors, thus obviating the usefulness of the latter as an instrument for broader inequality measures. To be clear, her measure of inequality within a given (say, 3-digit) sector is not a measure of individual pay in sector; it is, rather, also a measure of inequality between-sectors, but measured at the 4-digit level within the 3- digit classification. There are two distinct issues here. One is whether the level of inequality reported in a Theil measure is affected by the degree of disaggregation. The answer is that it is: the more finely divided the group structure, the more inequality one observes. Put another way, inequality measured across any particular group structure is merely a lower-bound for the inequality of the population encompassed by the groups. This is a point everyone working with this sort of data understands; to divide any group into sub-groups is to move inequality from within-group, where it is not observed, to between-groups where it is. 3
5 The other issue the issue under discussion here is whether the movement of inequality measured over time between a coarsely-divided set of groups is a good estimate of the movement of inequality measured between groups divided more finely. This question is examined in Conceição and Galbraith (2000) and Conceição, Galbraith, and Bradford (2001), who show that this is the case. Indeed with industrial classifications little information is gained by considering lower-level groups, since the dynamics of the Theil index are preserved at various levels of aggregation. The essence of this issue is the nature of a classification scheme. Industrial classifications in particular are a type of filing system; they are based on a priori categories specified for historical, political and economic reasons. If the classification were entirely at random, a lower-level (more disaggregated) grouping would give more detail, but no more information than the higher level (less disaggregated) classification. In fact the situation is generally different: lower-level groupings (say, 3-digit groups inside a 2-digit group, 4-digit groups inside 3-digit groups) are more similar than the parent groups, and so breaking them out adds progressively less to our knowledge of the whole distribution. As a practical matter, beyond a certain (and quite early) point in the process of disaggregation, the return does not justify the cost. We have worked on this question with fine classifications in the United States (Conceição, Galbraith, and Bradford 2001). In that reliable data environment, before the shift from SIC to NAICS codes, we showed that movement of inequality at the 2-digit level was essentially identical to movement calculated from 3- or 4-digit classifications. Scholl finds many cases where finer categorizations yield inequality measures that are uncorrelated, over time, to the inequalities found by the coarser disaggregation. The question, then, is why is this the case? The apparent answer is that in international data the more finely disaggregated data are simply erratic and unreliable, and the problems that we have labored over in the case of relatively-highly-aggregated groups, namely empty cells and coding errors, are multiplied by the larger number of groups involved. After the SIC-to-NAICS shift, even US data became problematic at lower levels of aggregation, for instance at the 3-digit level and beyond. The reclassification issue aside, there are also many sudden category changes made at the lower level. These changes were often not documented, and we could find out about them only by making repeated inquiries to the Bureau of Economic Analysis. In international data, while in principle it is possible to work with lower level industries to obtain inequality within a 2-digit or 3-digit sector, it would require a tremendous investment of time and resources to go over individual countries at the 3- or 4-digit industry levels, in order to find and treat coding errors and other anomalies. In practice it would be almost impossible to account for any 4
6 extreme changes in Theil values without close cooperation from the statistics offices of individual countries. Given limited resources, we do not believe there is a pay-off from attempting to refine the international inequality measures in this way. 4 Manufacturing Wage Inequality and Household Income Inequality: How Close Are They? Finally, the question of comparability between the concepts of inequality in average payroll measured across manufacturing and inequality in (say) household incomes must be addressed. We have often encountered reasonable skepticism on this point, since manufacturing employment is often just a small fraction of total employment, and wage income only part of total income. Entire sectors, from finance to farming, and not to mention the informal economy, are absent from our source data. How can a measure of inequalities between coarsely-divided manufacturing sectors act as an effective instrument for the inequality of a proper random sample of households? The answer is in four parts. First, as discussed above, the movement of inequalities between groups is an effective proxy for the movement of inequalities within those same groups; this is the property of self-similarity at different scales, familiar to students of fractal geometry. (It is also the reason why photographs of coarse and fine resolution may nevertheless show the same objects.) Second, manufacturing is not isolated from agriculture, services, or finance; it stands in a particular relationship to those other sectors, and an increase in the inequality within manufacturing will generally reflect an increase in the gap between manufacturing and agriculture, or manufacturing and services, or manufacturing and finance. Third, manufacturing tends to be the active element in the movement of income distributions; if one isolates peasant farming or low-wage services, you find that the inequalities within those sectors are low. It is not a surprise; there are by definition no rich peasants. The fourth part of the answer is that the correspondence doesn t always work. In some countries notably the United States capital incomes loom large in the income data but are not captured at all by manufacturing pay. In others, de-industrialization can flatten manufacturing pay while overall inequality rises. One has to be careful but this caveat applies to any form of empirical investigation. Our assessment of the actual match between our Theil measures and broader inequality measures can be presented in two ways. One is a statistical summary, which shows that our data do in fact match reasonably well with broader measures of economic inequality. This 5
7 summary is presented in Table 1. Using our measures rather than Scholl s, we replicated her Table 4, in which she argues that her index does not have any substantive relationships with overall inequality measures from major global data sets such as the World Income Inequality Database (WIID), the Luxembourg Income Study (LIS), and EU Statistics on Income and Living Conditions (EU SILC). Table 1 exactly matches Scholl s Table 4, but with very different results. 1 Our measures do have statistically-significant relationships to the major income inequality datasets, and the coefficient magnitude is ten-fold greater than for Scholl. The strength of statistical significance decreases for LIS, SILC, and OECD samples; these data have smaller time and geographical coverage and thus smaller sample sizes. To be sure, the magnitude of the effect of a move in the Theil statistic on a Gini coefficient is quite small; for instance, with respect to the WIID, a one percent increase in the Theil index corresponds to a rise in the Gini of just 0.05%. The reasons for this are two-fold: first that the Theil index between large groups is quite volatile, with changes of ten percent or more not unusual, and doublings not unheard-of. Second, the Gini coefficient is by definition bounded between zero and unity, and in practice largely limited to a small part (say, a fifth) of that range for any given country. Thus a doubling of our Theil index would lead to an increase in a Gini of 0.4 to 0.42, but the latter is not an inconsiderable amount. Table 1: UTIP-UNIDO as compared to other data sets Note: We do not have control variables such as urban population share and WIID dummies in our regression, but this would not substantially change the results. Scholl expresses a further reservation (2017, p. 34) about the incorporation of cross- 1. For the purposes of this replication we used the 2005 version of our data. 6
8 country variance into our estimates of the relationship between Theil and Gini measures. Suffice to say, the test of the estimating equation is whether the resulting estimate for gross household income inequality is consistent with the evidence from other sources. We have examined this proposition directly and in detail, and while there are, to be sure, some imperfections, we believe the record speaks for itself. To effect this examination we made a detailed, country-by-country comparison of our EHII estimate with the full range of reported inequality measures. We have done this by first using our Theil measure of inter-industry payroll inequalities as the building block along with the ratio of manufacturing employment to population in a simple model of gross household income inequality, calibrated to an external data set of sample-based measures and controlling for the basic conceptual categories: households or persons, income or consumption, gross or net of tax. We then used the regression coefficients to generate a large data set of estimated household income inequality measures in Ginicoefficient format, the EHII data set which is in wide use. The EHII numbers can then be compared directly to measures of income inequality from the survey literature. We have carried out this exercise for over thirty countries, in an extensive survey published by the World Bank (Galbraith et al. 2016b; Galbraith et al. 2016a). This shows that our very simple model to translate manufacturing pay inequality into gross household income inequality corresponds well with available survey measures in many countries. An example chosen because the correlation between our measure and Scholl s is actually negative is Germany, shown in Figure 1. In this case, our equation yields a Gini estimate that tracks the available survey literature for household gross income inequality to within a Gini point, give or take, over thirty years. Market income inequality measures are uniformly higher, and disposable income inequality measures are uniformly lower than the measurements of gross income inequality; however the trends in all three data types are broadly similar. 7
9 Figure 1: Diverse measures of income inequality for Germany Note: The black line is the EHII estimate from UTIP for gross income inequality. The blue line is the one available direct measure of gross household income inequality for Germany. The dotted black line is the EHII estimate for East Germany (DDR). There are no perfect measures of inequality, and our data set, like all data sets in this area, is a work in progress. But a conclusion drawn by Scholl from her data set to the general applicability of the Theil method applied to manufacturing data is plainly invalid. It is quite easy to check whether one can calculate a reasonable estimate of household income inequality from inequalities across sectors in manufacturing pay, and it turns out that the answer is, yes you can. 8
10 References Conceição, Pedro, and James K Galbraith Constructing Long and Dense Time-series of Inequality Using the Theil Index. Eastern Economic Journal 26 (1): Conceição, Pedro, James K Galbraith, and Peter Bradford The Theil Index in Sequences of Nested and Hierarchic Grouping Structures: Implications for the Measurement of Inequality through Time, with Data Aggregated at Different Levels of Industrial Classification. Eastern Economic Journal 27 (4): Galbraith, James K, Jaehee Choi, Béatrice Halbach, Aleksandra Malinowska, and Wenjie Zhang. 2016a. A Comparison of Major World Inequality Data Sets: LIS, OECD, EU- SILC, WDI, and EHII. In Income inequality around the world, Emerald Group Publishing Limited. Galbraith, James K, Béatrice Halbach, Aleksandra Malinowska, Amin Shams, and Wenjie Zhang. 2016b. The UTIP Global Inequality Data Sets : Updates, Revisions and Quality Checks. In Inequality and growth, ed. Ove Grandstrand, Also appearing as: The UTIP Global Inequality Data Sets, : Updates, Revisions and Quality Checks in Joseph E. Stiglitz and Martin Guzman, eds., Contemporary Issues in Microeconomics, Basingstoke: Palgrave Macmillan, 2016, pp Basingstoke: Palgrave MacMillan. Scholl, Nathalie An Index of Inter-industry Wage Inequality: Trends, Comparisons, and Robustness. Technical report. Courant Research Centre: Poverty, Equity and Growth- Discussion Papers. UNIDO. United Nations International Development Organization Industrial Statistics Database. Various years.
11 Appendix: Detailed Notes on Updating the UTIP-UNIDO Data Set We updated the UTIP-UNIDO data based on the 2012 version of the INDSTAT2 database as well as the 2005 version of the UTIP-UNIDO data. We have made two types of adjustments. One of them involves re-combining sectors that become separated by the introduction of new industrial categories. The other involves the treatment of missing observations and coding errors. The treatment of missing sectors has a limited effect on the calculated Theil index, as Scholl (2017) confirms. However, among different options, we do a more careful treatment of the missing sectors based on the information reported by the UNIDO on sectors that are combined over time. In this way, we exploit all the information available and do not miss any data point, as opposed to Scholl, who drops either sectors or country-year observations when facing a missing sector. Our time-series data is still consistent within each country because the number of sectors for each country does not change over time. Whether the resulting Theil measures are comparable across countries is another question, especially when there are some differences in the number of categories used for different countries. The correspondence of the derivative EHII measures to sample-based measures of gross household income inequalities suggests that this is not a major issue for advanced or transition countries; it may however contribute to underestimates of inequality in certain developing-country cases. The second type of adjustment deals with coding errors and other forms of noise in the UNIDO INDSTAT data. Here we compared the calculated data based on the INDSTAT 2012 version (which covers data up to 2008) against the 2005 version of the UTIP-UNIDO data, country-by-country. The data using the 2012 version shows noise and errors even for the data that is already covered in UTIP-UNIDO 2005 version. We replace the new data with the old UTIP-UNIDO data whenever the new data is noisy, taking into account the difference in levels of inequality calculated in the two data sets. Specific examples of such treatment are discussed later. The reason that the data using the INDSTAT 2012 are different from UTIP-UNIDO 2005 can be either of two possibilities. Either, a) The INDSTAT data quality used to be good, but they have changed the data, or reproduced it poorly, in a way that the data points before 2005 were sometimes deteriorated in later releases; or b) that the INDSTAT data were of poor quality beforehand, but were corrected in later releases. There is no evidence that earlier data have been upgraded, and our implicit assumption is that option a) is the case. 10
 start from 1990 and are missing before, while the rest of the sectors start as early as 1963.")
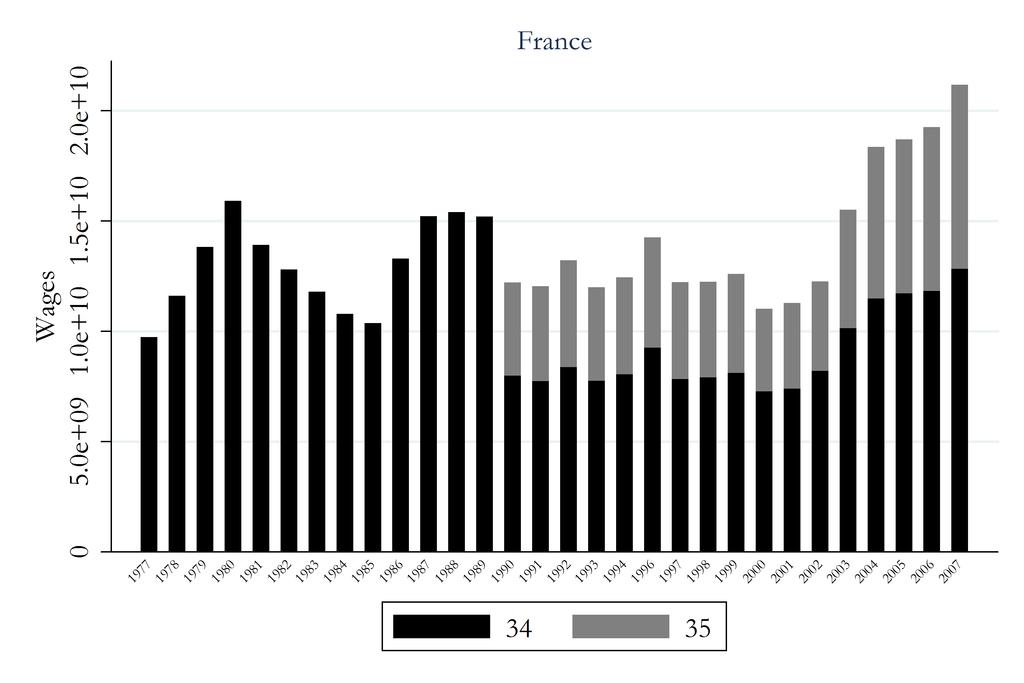
12 A1 Missing Sectors and Re-groupings The data for certain sectors of the economy in certain countries are only reported in certain years and are missing in other years. For example, in Canada, data for sector #35 (Other transport equipment) start from 1990 and are missing before, while the rest of the sectors start as early as In order to keep the time-series of Theil index consistent over time, we need to keep the number of industries fixed within each country. So an option could be to drop sector 35 for Canada in the entire sample period. Another option is to drop the country-year observations that have a missing sector, which means dropping observations before 1990 for Canada. These are the two options considered in Scholl, called long and short versions respectively. However, both of these treatments result in losing information and endangering the accuracy of the data as shown below. An alternative solution used in the UTIP-UNIDO data utilizes the information on sector combinations issued by UNIDO. Certain countries in certain years report the data for a combination of the sectors, which is clearly flagged in the INDSTAT data. For example, it is reported that the data for sector 35 in Canada was combined with sector 34 (Motor vehicles, trailers, semi-trailers) before The graph below shows the number of employees in sectors 34 and 35 in Canada over time, and clearly confirms such a pattern. Figure A1 11
13 The number of employees reported in sector 34 (the blue bars) drops from more than 200,000 in 1989 to around 120,000 in The reason is that the data were reported as a combination of sectors 34 and 35 before 1990, but separately after. Simply dropping sector 35, as done in Scholl (2017), suddenly reduces the weight of transportation equipment in the economy significantly and makes the data inconsistent before and after What we do in UTIP-UNIDO is to aggregate both the number of employees and wages for sectors 34 and 35 for Canada over the entire sample. The graph below shows a similar pattern for the aggregate wages in the two sectors. Figure A2 The following graphs show a few other countries with the same pattern: 12
14 Figure A3 Figure A4 13

15 Figure A5 Figure A6 14

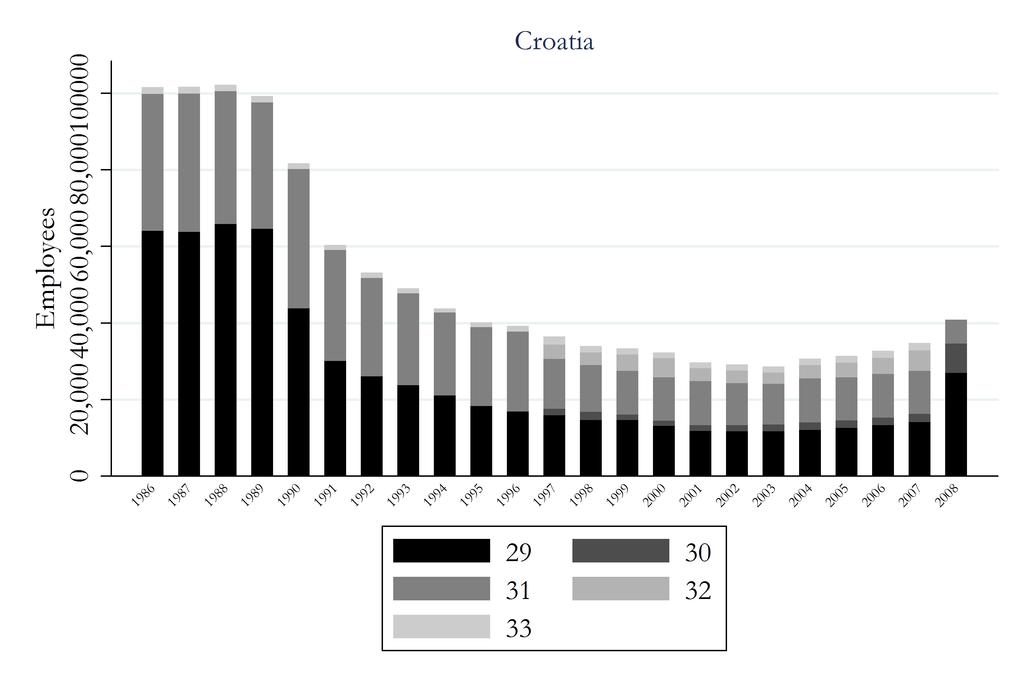
16 Although the majority of the sector combinations in the data are of a similar pattern, there exist more complicated cases as well. Suppose that sectors A and B are combined before 2000 for a certain country, and sectors B and C are combined at some point after In a very few cases the number of combined sectors can go up to 8 industries. Such cases mostly happen for sectors 27 to 35. The graphs below shows such examples: Figure A7 15

17 Figure A8 Figure A9 16
18 Note that mapping of combined sectors to the reported sectors can vary, depending on how the combination of sectors change in different version of the UNIDO database. But there is a very logical framework behind the combinations that makes the classification uniquely and systematically replicable: whenever two or more sectors are combined in part of the sample, one has to combine their information for the entire sample. A2 Adjustments for Coding Errors and Other Noise An accurate treatment of the combined sectors, while crucial, leads to a limited improvement in the data. There are other forms of noise and errors in the data that need treatment. To show how such noise can affect the quality of the estimated Theil index, we start with a comparison of UTIP-UNIDO data with Scholl s data. Table 3.A.2 of Scholl reports the mean and standard deviation of her calculated (between-groups component of the) Theil index for each country, as well as the correlation of her index with the UTIP-UNIDO data for each country. Most countries have a high correlation between the two datasets, however, there are also several countries with low or even negative correlations. We will argue here that the low correlation for some of these countries is caused by inadequate treatment of noise and errors in Scholl s data. We divide the countries into those with high correlation between the two datasets, with correlation of higher than 0.9, and those with correlation of less than 0.9. We show below that the low correlation for certain countries is caused by high noise in Scholl s data for those countries. First, for each country, we look at the coefficient of covariation measure, created by dividing the standard deviation of the Theil index on to the average of the Theil index for that country. The measure shows the precision of the data and reflects the inverse of signal-to-noise ratio. We then test whether this measure is different for low correlation countries than high correlation countries in both datasets. If the coefficient of covariation is higher for low correlation countries than high correlation countries in Scholl s data, we can argue that the low correlation is caused by a high noise for those countries in her data. Table A.1 below, Panel A, shows that countries that have low correlation between UTIP- UNIDO and Scholl have systematically higher coefficient of covariation, meaning that they have lower signal-to-noise ratio. The results are highly statistically and economically significant and are robust to limiting the sample to countries with at least 10 or 20 years of data. For example, the results show that among countries with at least 20 years of data in Scholl s sample, coefficient of variation for countries with a low correlation with UTIP data is around 74% while it is 50% for high correlation countries. The difference is statistically 17
19 significant with a t-stat of -3.19, which is impressive given the small sample size. So the estimations for low correlation countries are systematically different in Scholl s data. Panel B shows the same exercise using the UTIP-UNIDO data. As opposed to Scholl s data, there is no significant difference between the coefficient of variation for low and high correlation countries in UTIP data. The two panels together suggest that the quality of UTIP-UNIDO data is consistent across different countries while there are countries in Scholl s data with a high level of noise, which also results in a low correlation with the UTIP- UNIDO data. The low correlation between the two data sets for certain countries is caused because the low correlation countries are systematically noisier than high correlation countries in Scholl data, but not in UTIP data. Table A1 Note: Coefficient of Variation and the Correlation between the Two Datasets. This table shows the results of a t-test of the coefficient of variation between countries with high correlation in UTIP-UNIDO and Scholl data (correlation > 0.9) and those with low correlation. Coefficient of variation for each country is calculated as 100 times the standard deviation of the time-series of Theil index divided by the average Theil index for that country. The data on average and standard deviation of the Theil index in Scholl data are from Table 3.A.2. Below we show examples of noise in Scholl s data. The 30 countries selected are from 18
20 Table 3.A.3. and have a correlation less than 0.8 between the Scholl measures and the UTIP-UNIDO measures of industrial pay inequality. Figure A10 19
21 Figure A11 20
22 Figure A12 21
23 Figure A13 22
24 Figure A14 23
25 Figure A15 24
26 Figure A16 25
27 Figure A17 26
28 Figure A18 Figure A19 27
29 Figure A20 28
30 Figure A21 29
31 Figure A22 30
32 Figure A23 31
33 Figure A24 32
34 Figure A25 33
35 Figure A26 34
36 Figure A27 35
37 Figure A28 36
38 Figure A29 37
39 Figure A30 38
40 Figure A31 39
41 Figure A32 40
42 Figure A33 41
43 Figure A34 42
44 Figure A35 43
45 Figure A36 44
46 Figure A37 45
47 Figure A38 46
Improving the accuracy of outbound tourism statistics with mobile positioning data
 1 (11) Improving the accuracy of outbound tourism statistics with mobile positioning data Survey response rates are declining at an alarming rate globally. Statisticians have traditionally used imputing
A Global Perspective on Socioeconomic Differences in Learning Outcomes
 2009/ED/EFA/MRT/PI/19 Background paper prepared for the Education for All Global Monitoring Report 2009 Overcoming Inequality: why governance matters A Global Perspective on Socioeconomic Differences in
Poverty Reduction and Economic Growth: The Asian Experience Peter Warr
 Poverty Reduction and Economic Growth: The Asian Experience Peter Warr Abstract. The Asian experience of poverty reduction has varied widely. Over recent decades the economies of East and Southeast Asia
Is the Great Gatsby Curve Robust?
 Comment on Corak (2013) Bradley J. Setzler 1 Presented to Economics 350 Department of Economics University of Chicago setzler@uchicago.edu January 15, 2014 1 Thanks to James Heckman for many helpful comments.
Employment Outlook 2017
 Annexes Chapter 3. How technology and globalisation are transforming the labour market Employment Outlook 2017 TABLE OF CONTENTS ANNEX 3.A3 ADDITIONAL EVIDENCE ON POLARISATION BY REGION... 1 ANNEX 3.A4
Appendix to Sectoral Economies
 Appendix to Sectoral Economies Rafaela Dancygier and Michael Donnelly June 18, 2012 1. Details About the Sectoral Data used in this Article Table A1: Availability of NACE classifications by country of
Trends in inequality worldwide (Gini coefficients)
") Section 2 Impact of trade on income inequality As described above, it has been theoretically and empirically proved that the progress of globalization as represented by trade brings benefits in the form
Section 2 Impact of trade on income inequality As described above, it has been theoretically and empirically proved that the progress of globalization as represented by trade brings benefits in the form
Gender preference and age at arrival among Asian immigrant women to the US
 Gender preference and age at arrival among Asian immigrant women to the US Ben Ost a and Eva Dziadula b a Department of Economics, University of Illinois at Chicago, 601 South Morgan UH718 M/C144 Chicago,
Income inequality the overall (EU) perspective and the case of Swedish agriculture. Martin Nordin
 perspective and the case of Swedish agriculture. Martin Nordin") Income inequality the overall (EU) perspective and the case of Swedish agriculture Martin Nordin Background Fact: i) Income inequality has increased largely since the 1970s ii) High-skilled sectors and
Income inequality the overall (EU) perspective and the case of Swedish agriculture Martin Nordin Background Fact: i) Income inequality has increased largely since the 1970s ii) High-skilled sectors and
THE COFFEES OF THE SECRETARY-GENERAL JAMES K. GALBRAITH
 THE COFFEES OF THE SECRETARY-GENERAL JAMES K. GALBRAITH 18 June 2010 THE COFFEES OF THE SECRETARY-GENERAL Bringing New Perspectives to the OECD Secretary-General s Speech Writing and Intelligence Outreach
Volume 35, Issue 1. An examination of the effect of immigration on income inequality: A Gini index approach
 Volume 35, Issue 1 An examination of the effect of immigration on income inequality: A Gini index approach Brian Hibbs Indiana University South Bend Gihoon Hong Indiana University South Bend Abstract This
Widening of Inequality in Japan: Its Implications
 Widening of Inequality in Japan: Its Implications Jun Saito, Senior Research Fellow Japan Center for Economic Research December 11, 2017 Is inequality widening in Japan? Since the publication of Thomas
Analysing Economic and Financial Power of Different Countries at the End of the Twentieth Century
 Modern Economy, 212, 3, 25-29 http://dx.doi.org/1.4236/me.212.3228 Published Online March 212 (http://www.scirp.org/journal/me) Analysing Economic and Financial Power of Different Countries at the End
Direction of trade and wage inequality
 This article was downloaded by: [California State University Fullerton], [Sherif Khalifa] On: 15 May 2014, At: 17:25 Publisher: Routledge Informa Ltd Registered in England and Wales Registered Number:
Regional inequality and the impact of EU integration processes. Martin Heidenreich
 Regional inequality and the impact of EU integration processes Martin Heidenreich Table of Contents 1. Income inequality in the EU between and within nations 2. Patterns of regional inequality and its
Estimating the foreign-born population on a current basis. Georges Lemaitre and Cécile Thoreau
 Estimating the foreign-born population on a current basis Georges Lemaitre and Cécile Thoreau Organisation for Economic Co-operation and Development December 26 1 Introduction For many OECD countries,
I AIMS AND BACKGROUND
 The Economic and Social Review, pp xxx xxx To Weight or Not To Weight? A Statistical Analysis of How Weights Affect the Reliability of the Quarterly National Household Survey for Immigration Research in
The Trade Liberalization Effects of Regional Trade Agreements* Volker Nitsch Free University Berlin. Daniel M. Sturm. University of Munich
 December 2, 2005 The Trade Liberalization Effects of Regional Trade Agreements* Volker Nitsch Free University Berlin Daniel M. Sturm University of Munich and CEPR Abstract Recent research suggests that
The 2017 TRACE Matrix Bribery Risk Matrix
 The 2017 TRACE Matrix Bribery Risk Matrix Methodology Report Corruption is notoriously difficult to measure. Even defining it can be a challenge, beyond the standard formula of using public position for
Table A.2 reports the complete set of estimates of equation (1). We distinguish between personal
. We distinguish between personal") Akay, Bargain and Zimmermann Online Appendix 40 A. Online Appendix A.1. Descriptive Statistics Figure A.1 about here Table A.1 about here A.2. Detailed SWB Estimates Table A.2 reports the complete set
Akay, Bargain and Zimmermann Online Appendix 40 A. Online Appendix A.1. Descriptive Statistics Figure A.1 about here Table A.1 about here A.2. Detailed SWB Estimates Table A.2 reports the complete set
Earnings Mobility and Inequality in Europe
 Earnings Mobility and Inequality in Europe Ronald Bachmann Peggy David Sandra Schaffner EU-LFS and EU-SILC: 2nd European User Conference Mannheim March 31 - April 1, 2011 Introduction Motivation Motivation
GDP - AN INDICATOR OF PROSPERITY OR A MISLEADING ONE? CRIVEANU MARIA MAGDALENA, PHD STUDENT, UNIVERSITATEA DIN CRAIOVA, ROMANIA
 GDP - AN INDICATOR OF PROSPERITY OR A MISLEADING ONE? CRIVEANU MARIA MAGDALENA, PHD STUDENT, UNIVERSITATEA DIN CRAIOVA, ROMANIA mag_da64 @yahoo.com Abstract The paper presents a comparative analysis of
Online Appendix. Capital Account Opening and Wage Inequality. Mauricio Larrain Columbia University. October 2014
 Online Appendix Capital Account Opening and Wage Inequality Mauricio Larrain Columbia University October 2014 A.1 Additional summary statistics Tables 1 and 2 in the main text report summary statistics
Educated Preferences: Explaining Attitudes Toward Immigration In Europe. Jens Hainmueller and Michael J. Hiscox. Last revised: December 2005
 Educated Preferences: Explaining Attitudes Toward Immigration In Jens Hainmueller and Michael J. Hiscox Last revised: December 2005 Supplement III: Detailed Results for Different Cutoff points of the Dependent
Networks and Innovation: Accounting for Structural and Institutional Sources of Recombination in Brokerage Triads
 1 Online Appendix for Networks and Innovation: Accounting for Structural and Institutional Sources of Recombination in Brokerage Triads Sarath Balachandran Exequiel Hernandez This appendix presents a descriptive
STATISTICS BRIEF URBAN PUBLIC TRANSPORT IN THE 21 ST CENTURY
 STATISTICS BRIEF URBAN PUBLIC TRANSPORT IN THE 21 ST CENTURY This Statistics Brief is an abridged version of the extensive report, Urban Public Transport in the 21 st Century, available on the UITP MyLibrary
Integration of data from different sources: Unemployment
 Integration of data from different sources: Unemployment by I. Chernyshev* 1. Introduction Recently, the ILO Bureau of Statistics began to study the use of unemployment data from different sources. The
Inclusive global growth: a framework to think about the post-2015 agenda
 Inclusive global growth: a framework to think about the post-215 agenda François Bourguignon Paris School of Economics Angus Maddison Lecture, Oecd, Paris, April 213 1 Outline 1) Inclusion and exclusion
RESEARCH NOTE The effect of public opinion on social policy generosity
 Socio-Economic Review (2009) 7, 727 740 Advance Access publication June 28, 2009 doi:10.1093/ser/mwp014 RESEARCH NOTE The effect of public opinion on social policy generosity Lane Kenworthy * Department
Inclusion and Gender Equality in China
 Inclusion and Gender Equality in China 12 June 2017 Disclaimer: The views expressed in this publication are those of the authors and do not necessarily reflect the views and policies of the Asian Development
Endogenous antitrust: cross-country evidence on the impact of competition-enhancing policies on productivity
 Preliminary version Do not cite without authors permission Comments welcome Endogenous antitrust: cross-country evidence on the impact of competition-enhancing policies on productivity Joan-Ramon Borrell
Mapping Policy Preferences with Uncertainty: Measuring and Correcting Error in Comparative Manifesto Project Estimates *
 Mapping Policy Preferences with Uncertainty: Measuring and Correcting Error in Comparative Manifesto Project Estimates * Kenneth Benoit Michael Laver Slava Mikhailov Trinity College Dublin New York University
The Cultural Origin of Saving Behaviour. Joan Costa Font, LSE Paola Giuliano, UCLA Berkay Ozcan*, LSE
 The Cultural Origin of Saving Behaviour Joan Costa Font, LSE Paola Giuliano, UCLA Berkay Ozcan*, LSE Household Saving Rates Source: OECD National Accounts Statistics: National Accounts at a Glance Background
The WTO Trade Effect and Political Uncertainty: Evidence from Chinese Exports
 Abstract: The WTO Trade Effect and Political Uncertainty: Evidence from Chinese Exports Yingting Yi* KU Leuven (Preliminary and incomplete; comments are welcome) This paper investigates whether WTO promotes
LABOUR-MARKET INTEGRATION OF IMMIGRANTS IN OECD-COUNTRIES: WHAT EXPLANATIONS FIT THE DATA?
 LABOUR-MARKET INTEGRATION OF IMMIGRANTS IN OECD-COUNTRIES: WHAT EXPLANATIONS FIT THE DATA? By Andreas Bergh (PhD) Associate Professor in Economics at Lund University and the Research Institute of Industrial
IMF research links declining labour share to weakened worker bargaining power. ACTU Economic Briefing Note, August 2018
 IMF research links declining labour share to weakened worker bargaining power ACTU Economic Briefing Note, August 2018 Authorised by S. McManus, ACTU, 365 Queen St, Melbourne 3000. ACTU D No. 172/2018
Rewriting the Rules of the Market Economy to Achieve Shared Prosperity. Joseph E. Stiglitz New York June 2016
 Rewriting the Rules of the Market Economy to Achieve Shared Prosperity Joseph E. Stiglitz New York June 2016 Enormous growth in inequality Especially in US, and countries that have followed US model Multiple
CALTECH/MIT VOTING TECHNOLOGY PROJECT A
 CALTECH/MIT VOTING TECHNOLOGY PROJECT A multi-disciplinary, collaborative project of the California Institute of Technology Pasadena, California 91125 and the Massachusetts Institute of Technology Cambridge,
Why Does Birthplace Matter So Much? Sorting, Learning and Geography
 SERC DISCUSSION PAPER 190 Why Does Birthplace Matter So Much? Sorting, Learning and Geography Clément Bosquet (University of Cergy-Pontoise and SERC, LSE) Henry G. Overman (London School of Economics,
Does Learning to Add up Add up? Lant Pritchett Presentation to Growth Commission October 19, 2007
 Does Learning to Add up Add up? Lant Pritchett Presentation to Growth Commission October 19, 2007 Five Issues, Some with Evidence I) Why aggregate data at all? II) Education and long-run growth: Can Jones
CO3.6: Percentage of immigrant children and their educational outcomes
 CO3.6: Percentage of immigrant children and their educational outcomes Definitions and methodology This indicator presents estimates of the proportion of children with immigrant background as well as their
This refers to the discretionary clause where a Member State decides to examine an application even if such examination is not its responsibility.
 2.6. Dublin Information collected by Eurostat is the only comprehensive publicly available statistical data source that can be used to analyse and learn about the functioning of Dublin system in Europe.
Voter Turnout, Income Inequality, and Redistribution. Henning Finseraas PhD student Norwegian Social Research
 Voter Turnout, Income Inequality, and Redistribution Henning Finseraas PhD student Norwegian Social Research hfi@nova.no Introduction Motivation Robin Hood paradox No robust effect of voter turnout on
Standard Note: SN/SG/6077 Last updated: 25 April 2014 Author: Oliver Hawkins Section Social and General Statistics
 Migration Statistics Standard Note: SN/SG/6077 Last updated: 25 April 2014 Author: Oliver Hawkins Section Social and General Statistics The number of people migrating to the UK has been greater than the
Skill Classification Does Matter: Estimating the Relationship Between Trade Flows and Wage Inequality
 Skill Classification Does Matter: Estimating the Relationship Between Trade Flows and Wage Inequality By Kristin Forbes* M.I.T.-Sloan School of Management and NBER First version: April 1998 This version:
LONG RUN GROWTH, CONVERGENCE AND FACTOR PRICES
 LONG RUN GROWTH, CONVERGENCE AND FACTOR PRICES By Bart Verspagen* Second draft, July 1998 * Eindhoven University of Technology, Faculty of Technology Management, and MERIT, University of Maastricht. Email:
GLOBALIZATION AND THE GREAT U-TURN: INCOME INEQUALITY TRENDS IN 16 OECD COUNTRIES. Arthur S. Alderson
 GLOBALIZATION AND THE GREAT U-TURN: INCOME INEQUALITY TRENDS IN 16 OECD COUNTRIES by Arthur S. Alderson Department of Sociology Indiana University Bloomington Email aralders@indiana.edu & François Nielsen
Welfare State and Local Government: the Impact of Decentralization on Well-Being
 Welfare State and Local Government: the Impact of Decentralization on Well-Being Paolo Addis, Alessandra Coli, and Barbara Pacini (University of Pisa) Discussant Anindita Sengupta Associate Professor of
EUROPEAN UNION CITIZENSHIP
 Flash Eurobarometer EUROPEAN UNION CITIZENSHIP REPORT Fieldwork: November 2012 Publication: February 2013 This survey has been requested by the European Commission, Directorate-General Justice and co-ordinated
EU Ornamental Fish Import & Export Statistics 2017 (Third Countries & Intra-EU Community trade)
") ORNAMENTAL AQUATIC TRADE ASSOCIATION LTD. "The Voice of the Ornamental Fish Industry" 1 st Floor Office Suite, Wessex House 40 Station Road, Westbury, Wiltshire United Kingdom BA13 3JN T: +44 (0)1373 301353
ORNAMENTAL AQUATIC TRADE ASSOCIATION LTD. "The Voice of the Ornamental Fish Industry" 1 st Floor Office Suite, Wessex House 40 Station Road, Westbury, Wiltshire United Kingdom BA13 3JN T: +44 (0)1373 301353
The Transmission of Economic Status and Inequality: U.S. Mexico in Comparative Perspective
 The Students We Share: New Research from Mexico and the United States Mexico City January, 2010 The Transmission of Economic Status and Inequality: U.S. Mexico in Comparative Perspective René M. Zenteno
Statistical Analysis of Corruption Perception Index across countries
 Statistical Analysis of Corruption Perception Index across countries AMDA Project Summary Report (Under the guidance of Prof Malay Bhattacharya) Group 3 Anit Suri 1511007 Avishek Biswas 1511013 Diwakar
Urban income inequality in China revisited,
 Urban income inequality in China revisited, 1988-2002 Sylvie Démurger, Martin Fournier, Shi Li To cite this version: Sylvie Démurger, Martin Fournier, Shi Li. Urban income inequality in China revisited,
GLOBALISATION AND WAGE INEQUALITIES,
 GLOBALISATION AND WAGE INEQUALITIES, 1870 1970 IDS WORKING PAPER 73 Edward Anderson SUMMARY This paper studies the impact of globalisation on wage inequality in eight now-developed countries during the
Response to the Evaluation Panel s Critique of Poverty Mapping
 Response to the Evaluation Panel s Critique of Poverty Mapping Peter Lanjouw and Martin Ravallion 1 World Bank, October 2006 The Evaluation of World Bank Research (hereafter the Report) focuses some of
Online Appendices for Moving to Opportunity
 Online Appendices for Moving to Opportunity Chapter 2 A. Labor mobility costs Table 1: Domestic labor mobility costs with standard errors: 10 sectors Lao PDR Indonesia Vietnam Philippines Agriculture,
Labour Market Reform, Rural Migration and Income Inequality in China -- A Dynamic General Equilibrium Analysis
 Labour Market Reform, Rural Migration and Income Inequality in China -- A Dynamic General Equilibrium Analysis Yinhua Mai And Xiujian Peng Centre of Policy Studies Monash University Australia April 2011
International migration data as input for population projections
 WP 20 24 June 2010 UNITED NATIONS STATISTICAL COMMISSION and ECONOMIC COMMISSION FOR EUROPE STATISTICAL OFFICE OF THE EUROPEAN UNION (EUROSTAT) CONFERENCE OF EUROPEAN STATISTICIANS Joint Eurostat/UNECE
The globalization of inequality
 The globalization of inequality François Bourguignon Paris School of Economics Public lecture, Canberra, May 2013 1 "In a human society in the process of unification inequality between nations acquires
Volume 30, Issue 1. Corruption and financial sector performance: A cross-country analysis
 Volume 30, Issue 1 Corruption and financial sector performance: A cross-country analysis Naved Ahmad Institute of Business Administration (IBA), Karachi Shahid Ali Institute of Business Administration
Residual Wage Inequality: A Re-examination* Thomas Lemieux University of British Columbia. June Abstract
 Residual Wage Inequality: A Re-examination* Thomas Lemieux University of British Columbia June 2003 Abstract The standard view in the literature on wage inequality is that within-group, or residual, wage
Sampling Equilibrium, with an Application to Strategic Voting Martin J. Osborne 1 and Ariel Rubinstein 2 September 12th, 2002.
 Sampling Equilibrium, with an Application to Strategic Voting Martin J. Osborne 1 and Ariel Rubinstein 2 September 12th, 2002 Abstract We suggest an equilibrium concept for a strategic model with a large
All s Well That Ends Well: A Reply to Oneal, Barbieri & Peters*
 2003 Journal of Peace Research, vol. 40, no. 6, 2003, pp. 727 732 Sage Publications (London, Thousand Oaks, CA and New Delhi) www.sagepublications.com [0022-3433(200311)40:6; 727 732; 038292] All s Well
Online Appendix: The Effect of Education on Civic and Political Engagement in Non-Consolidated Democracies: Evidence from Nigeria
 Online Appendix: The Effect of Education on Civic and Political Engagement in Non-Consolidated Democracies: Evidence from Nigeria Horacio Larreguy John Marshall May 2016 1 Missionary schools Figure A1:
FOREIGN FIRMS AND INDONESIAN MANUFACTURING WAGES: AN ANALYSIS WITH PANEL DATA
 FOREIGN FIRMS AND INDONESIAN MANUFACTURING WAGES: AN ANALYSIS WITH PANEL DATA by Robert E. Lipsey & Fredrik Sjöholm Working Paper 166 December 2002 Postal address: P.O. Box 6501, S-113 83 Stockholm, Sweden.
Determinants of the Trade Balance in Industrialized Countries
 Determinants of the Trade Balance in Industrialized Countries Martin Falk FIW workshop foreign direct investment Wien, 16 Oktober 2008 Motivation large and persistent trade deficits USA, Greece, Portugal,
Estimates of International Migration for United States Natives
 Estimates of International Migration for United States Natives Christopher Dick, Eric B. Jensen, and David M. Armstrong United States Census Bureau christopher.dick@census.gov, eric.b.jensen@census.gov,
Gender pay gap in public services: an initial report
 Introduction This report 1 examines the gender pay gap, the difference between what men and women earn, in public services. Drawing on figures from both Eurostat, the statistical office of the European
Was Kuznets right? New evidence on the relationship between structural transformation and inequality
 Global Development Institute Working Paper Series 2018-027 May 2018 Was Kuznets right? New evidence on the relationship between structural transformation and inequality Cinar Baymul 1 l Kunal Sen 2 1 Honorary
Small Employers, Large Employers and the Skill Premium
 Small Employers, Large Employers and the Skill Premium January 2016 Damir Stijepic Johannes Gutenberg University, Mainz Abstract I document the comovement of the skill premium with the differential employer
ESTIMATING INCOME INEQUALITY IN PAKISTAN: HIES TO AHMED RAZA CHEEMA AND MAQBOOL H. SIAL 26
 ESTIMATING INCOME INEQUALITY IN PAKISTAN: HIES 1992-93 TO 2007-08 Abstract AHMED RAZA CHEEMA AND MAQBOOL H. SIAL 26 This study estimates Gini coefficient, Generalized Entropy and Atkinson s Indices in
Immigrant-native wage gaps in time series: Complementarities or composition effects?
 Immigrant-native wage gaps in time series: Complementarities or composition effects? Joakim Ruist Department of Economics University of Gothenburg Box 640 405 30 Gothenburg, Sweden joakim.ruist@economics.gu.se
The Changing Relationship between Fertility and Economic Development: Evidence from 256 Sub-National European Regions Between 1996 to 2010
 The Changing Relationship between Fertility and Economic Development: Evidence from 256 Sub-National European Regions Between 996 to 2 Authors: Jonathan Fox, Freie Universitaet; Sebastian Klüsener MPIDR;
Do the immigrants take our jobs?
 Do the immigrants take our jobs? Håvard Hungnes Lien, Eurostat Background, hypothesis for testing, methodology, data sources A recurrent claim in the public debate is that 1) immigration leads to higher
The European emergency number 112
 Flash Eurobarometer The European emergency number 112 REPORT Fieldwork: December 2011 Publication: February 2012 Flash Eurobarometer TNS political & social This survey has been requested by the Directorate-General
Differences in National IQs behind the Eurozone Debt Crisis?
 3 Differences in National IQs behind the Eurozone Debt Crisis? Tatu Vanhanen * Department of Political Science, University of Helsinki The purpose of this article is to explore the causes of the European
A2 Economics. Standard of Living and Economic Progress. tutor2u Supporting Teachers: Inspiring Students. Economics Revision Focus: 2004
 Supporting Teachers: Inspiring Students Economics Revision Focus: 2004 A2 Economics Standard of Living and Economic Progress tutor2u (www.tutor2u.net) is the leading free online resource for Economics,
INCREASED OPPORTUNITY TO MOVE UP THE ECONOMIC LADDER? EARNINGS MOBILITY IN EU:
 INCREASED OPPORTUNITY TO MOVE UP THE ECONOMIC LADDER? EARNINGS MOBILITY IN EU: 994-2 Denisa Sologon Cathal O Donoghue Work in Progress July 29 Working Paper MGSoG/29/WP3 Maastricht Graduate School of Governance
Context Indicator 17: Population density
 3.2. Socio-economic situation of rural areas 3.2.1. Predominantly rural regions are more densely populated in the EU-N12 than in the EU-15 Context Indicator 17: Population density In 2011, predominantly
LANDMARKS ON THE EVOLUTION OF E-COMMERCE IN THE EUROPEAN UNION
 Studies and Scientific Researches. Economics Edition, No 21, 215 http://sceco.ub.ro LANDMARKS ON THE EVOLUTION OF E-COMMERCE IN THE EUROPEAN UNION Laura Cătălina Ţimiraş Vasile Alecsandri University of
Household Inequality and Remittances in Rural Thailand: A Lifecycle Perspective
 Household Inequality and Remittances in Rural Thailand: A Lifecycle Perspective Richard Disney*, Andy McKay + & C. Rashaad Shabab + *Institute of Fiscal Studies, University of Sussex and University College,
FOREIGN TRADE AND FDI AS MAIN FACTORS OF GROWTH IN THE EU 1
 1. FOREIGN TRADE AND FDI AS MAIN FACTORS OF GROWTH IN THE EU 1 Lucian-Liviu ALBU 2 Abstract In the last decade, a number of empirical studies tried to highlight a strong correlation among foreign trade,
Flash Eurobarometer 430. Summary. European Union Citizenship
 European Union Citizenship Survey requested by the European Commission, Directorate-General for Justice and Consumers and co-ordinated by the Directorate-General for Communication This document does not
Application of PPP exchange rates for the measurement and analysis of regional and global inequality and poverty
 Application of PPP exchange rates for the measurement and analysis of regional and global inequality and poverty D.S. Prasada Rao The University of Queensland, Brisbane, Australia d.rao@uq.edu.au Abstract
Immigrant Employment and Earnings Growth in Canada and the U.S.: Evidence from Longitudinal data
 Immigrant Employment and Earnings Growth in Canada and the U.S.: Evidence from Longitudinal data Neeraj Kaushal, Columbia University Yao Lu, Columbia University Nicole Denier, McGill University Julia Wang,
Growth and Migration to a Third Country: The Case of Korean Migrants in Latin America
 JOURNAL OF INTERNATIONAL AND AREA STUDIES Volume 23, Number 2, 2016, pp.77-87 77 Growth and Migration to a Third Country: The Case of Korean Migrants in Latin America Chong-Sup Kim and Eunsuk Lee* This
5A. Wage Structures in the Electronics Industry. Benjamin A. Campbell and Vincent M. Valvano
 5A.1 Introduction 5A. Wage Structures in the Electronics Industry Benjamin A. Campbell and Vincent M. Valvano Over the past 2 years, wage inequality in the U.S. economy has increased rapidly. In this chapter,
REPORT FROM THE COMMISSION TO THE EUROPEAN PARLIAMENT AND THE COUNCIL
 EUROPEAN COMMISSION Brussels, 6.3.2017 COM(2017) 112 final REPORT FROM THE COMMISSION TO THE EUROPEAN PARLIAMENT AND THE COUNCIL ON THE APPLICATION BY THE MEMBER STATES OF COUNCIL DIRECTIVE 95/50/EC ON
Regional and Sectoral Economic Studies
 PRODUCTION BY SECTOR IN THE EUROPEAN UNION: ANALISYS OF FRANCE, GERMANY, ITALY, SPAIN, POLAND AND THE UNITED KINGDOM, 2000-2005 GUISAN, M.C. * AGUAYO, E. Abstract: We analyze the evolution of sectoral
Economic and Social Council
 United Nations Economic and Social Council Distr.: General 16 March 2012 ECE/CES/2012/7 Original: English Economic Commission for Europe Conference of European Statisticians Sixtieth plenary session Paris,
Benefit levels and US immigrants welfare receipts
 1 Benefit levels and US immigrants welfare receipts 1970 1990 by Joakim Ruist Department of Economics University of Gothenburg Box 640 40530 Gothenburg, Sweden joakim.ruist@economics.gu.se telephone: +46
Economic Freedom and Transparency in Latin America:
 Economic Freedom and Transparency in Latin America: Measuring Corruption Power Parity (CPP) Second Report by Pedro Isern This report is divided in two parts: firstly, it relates the index of economic freedom
The Pull Factors of Female Immigration
 Martin 1 The Pull Factors of Female Immigration Julie Martin Abstract What are the pull factors of immigration into OECD countries? Does it differ by gender? I argue that different types of social spending
Comparison on the Developmental Trends Between Chinese Students Studying Abroad and Foreign Students Studying in China
 34 Journal of International Students Peer-Reviewed Article ISSN: 2162-3104 Print/ ISSN: 2166-3750 Online Volume 4, Issue 1 (2014), pp. 34-47 Journal of International Students http://jistudents.org/ Comparison
Household Income inequality in Ghana: a decomposition analysis
 Household Income inequality in Ghana: a decomposition analysis Jacob Novignon 1 Department of Economics, University of Ibadan, Ibadan-Nigeria Email: nonjake@gmail.com Mobile: +233242586462 and Genevieve
EXAMINATION 3 VERSION B "Wage Structure, Mobility, and Discrimination" April 19, 2018
 William M. Boal Signature: Printed name: EXAMINATION 3 VERSION B "Wage Structure, Mobility, and Discrimination" April 19, 2018 INSTRUCTIONS: This exam is closed-book, closed-notes. Simple calculators are
Volume 36, Issue 1. Impact of remittances on poverty: an analysis of data from a set of developing countries
 Volume 6, Issue 1 Impact of remittances on poverty: an analysis of data from a set of developing countries Basanta K Pradhan Institute of Economic Growth, Delhi Malvika Mahesh Institute of Economic Growth,
Commission on Growth and Development Cognitive Skills and Economic Development
 Commission on Growth and Development Cognitive Skills and Economic Development Eric A. Hanushek Stanford University in conjunction with Ludger Wößmann University of Munich and Ifo Institute Overview 1.
Corruption and business procedures: an empirical investigation
 Corruption and business procedures: an empirical investigation S. Roy*, Department of Economics, High Point University, High Point, NC - 27262, USA. Email: sroy@highpoint.edu Abstract We implement OLS,
Ethnic Diversity and Perceptions of Government Performance
 Ethnic Diversity and Perceptions of Government Performance PRELIMINARY WORK - PLEASE DO NOT CITE Ken Jackson August 8, 2012 Abstract Governing a diverse community is a difficult task, often made more difficult