Survey Results Summary
|
|
|
- Mae Floyd
- 5 years ago
- Views:
Transcription


1 Survey Results Summary January 28, 2014 FINAL

.")
2 Introduction As part of the Public Outreach Task for VTrans 2040, an online survey was designed and administered to residents of the Commonwealth. The purpose of the survey was to gather public input and assist the Study Team in identifying transportation deficiencies, opportunities and locations for potential improvement. The survey was available online from July 21, 2014 to October 15, 2014 through Links to the survey were provided through the VTrans website, the VTrans Facebook page, as well as promotional cards (shown below). Interim results were reported to the MMWG in August 2014 and were used to identify underrepresented areas of the Commonwealth. Facebook boosts were used to help market the survey to specific demographic groups, such as Millennials (age 20 34). The MMWG agency representatives were also instrumental in distributing and promoting the survey. For example, the Department of Motor Vehicles (DMV) helped market the survey to DMVs in those underrepresented areas. Between July and October, a total of 2,932 responses were received from the online survey. 1 Double sided VTrans2040 business cards (front on the left) were distributed throughout the Commonwealth at places such as transit stops. Survey Design and Administration The online survey was designed to take approximately 10 minutes to complete. Although the majority of questions were designed in multiple choice format, respondents were provided an opportunity to identify specific locations and concerns regarding transportation challenges and opportunities in several open ended questions. When the survey closed, data was downloaded from the website and imported into Microsoft Excel, which was used to manage and process the responses. Data variables were then assigned to create tabular and graphical output of survey results. 1 Note: The survey respondents were not randomly sampled. The survey was available to the total population through the VTrans website and was promoted by VDOT from August to October The survey was not intended to be statistically significant, and none of the results are claimed to be statistically significant. 2 P age
.")
 from the Accomack Northampton PDC (7 responses), the Northern Neck PDC (8 responses), the")
3 Geographic Distribution The response locations were geocoded by zip code and subsequently aggregated to the Planning District Commission (PDC) level in order to analyze results across larger sample sizes. The geographic distribution of respondents mirrors Virginia s populous areas. There were also 79 responses from zip codes in neighboring states (including the District). Figure 1 illustrates the survey response locations and population by PDC. FIGURE 1: GEOGRAPHIC DISTRIBUTION OF RESPONDENTS Note: there were particularly small sample sizes (responses) from the Accomack Northampton PDC (7 responses), the Northern Neck PDC (8 responses), the Commonwealth Regional Council (19 responses), and the West Piedmont PDC (19 responses). The Northern Virginia PDC accounted for 34.8% of all survey respondents, which is somewhat higher than the PDC s share (28.2%) of Virginia s population. Meanwhile, Hampton Roads PDC only accounted for 10.0% of all survey respondents, despite representing 20.1% of the Commonwealth s population. Some PDCs, such as Mount Rodgers, Roanoke, and Richmond Regional, were overrepresented, while others were underrepresented (e.g., Cumberland, Northern Neck, Accomack Northampton). 3 P age
4 Figure 2 shows the survey respondents relative to the PDC population and provides insight into over/underrepresented PDCs in the survey. FIGURE 2: SHARES OF SURVEY RESPONDENTS AND POPULATION BY PDC 40.0% 35.0% 30.0% 25.0% 20.0% 15.0% 10.0% 5.0% 0.0% Percent of Respondents Percent of Population Demographic Profile Respondents were asked to provide their zip code for geographic coding, as well as demographic information including: birth year, gender, income, race, and employment status. Over 80.0% of survey respondents were White/Caucasian and employed full time. Average age for respondents was 47 years old, and the average weighted income was $87,300. Figure 3 illustrates the respondent profile for this survey, along with statewide averages for comparison. 4 P age
.")
 accounted for the second largest respondent group, representing approximately one third (30.0%) of all survey respondents.")
 and the Silent Generation (69 and older) represented small shares of the survey respondents, at 0.6% and 5.0%, respectively.")
5 FIGURE 3: RESPONDENT PROFILE Sources: Employment, 2012 ACS 1 Year Estimates for Work Status, 35 hours or more a week of the working age population (16 years and older). Figure 4 shows the generational split of survey respondents and Commonwealth population (over 14 since the survey respondents were as young as 14). While Baby Boomers (age 50 68) account for approximately 28.5% of the Commonwealth s population, the generation represented almost half (42.5%) of the total respondents. Generation X (age 35 49, 25.6% of all Virginians over 14) accounted for the second largest respondent group, representing approximately one third (30.0%) of all survey respondents. Millennials (age 20 34) were slightly unrepresented in the survey, representing 21.9% of all respondents (they account for 25.9% of Virginians over 14). Finally, Generation Z (19 and younger) and the Silent Generation (69 and older) represented small shares of the survey respondents, at 0.6% and 5.0%, respectively. Together, these generations comprise 19.9% of the Commonwealth s population over 14. This generational segmentation helps inform us that the survey responses are heavily weighted towards those between the ages of 35 and P age
6 FIGURE 4: SHARE OF SURVEY RESPONDENTS AND SHARE OF COMMONWEALTH POPULATION BY GENERATION 45.0% 42.5% 40.0% 35.0% Percent Share 30.0% 25.0% 20.0% 21.9% 30.0% 25.9% 25.6% 28.5% 15.0% 10.0% 5.0% 0.0% 0.6% 8.3% Generation Z (19 and younger) Millennials (20 34) Generation X (35 49) Baby Boomers (50 68) 5.0% 11.6% Silent (69 and older) Share of Survey Respondents Share of Commonwealth Population (over 14) Source: Survey response data and the American Community Survey (ACS), Population over 14 was used since that represented the survey respondent group Baby Boomers (age 50 68) represented almost half of the total respondents (they account for 28.5% of Virginians over 14 years). Generation X, the second largest respondent group, represented approximately one third of all survey respondents (they account for 25.6% of Virginians over 14). Meanwhile, Millennials were slightly unrepresented in the survey, representing 21.9% of all respondents (they account for 25.9% of Virginians over 14). How Virginia Commutes and How They Want to Commute The survey also asks Virginians how they currently commute to work or school. It is difficult to compare the survey s commuting statistics to statewide averages since the U.S. Census American Community Survey (ACS) segments the various transportation modes differently. As a basis of comparison, the 2013 ACS indicates that 77.4% of Virginians drive alone to work. Only 55.0% of survey respondents (n=1,798) indicated that they drive alone as their primary way to commute to work/school. According to the ACS, approximately 9.4% of Virginians carpool to work, which is comparable to the share of survey respondents who reported that they drive with passengers (6.3%) or carpool/vanpool (3.3%). The survey results show that approximately 3.8% of commuters primarily walk to work or school, marginally higher than the ACS estimate of 2.5%. Meanwhile, the ACS groups those commuting via bicycle, taxicab, and motorcycle. Together these modes account for only 1.8% of Virginia commuters. Approximately 9.0% of survey respondents (n=292) stated that they primarily commute via bicycle evidently much higher than the share of state commuters. Similarly, the share of 6 P age


, rail (27.0%, n=755), and walking (26.0%, n=709). When asked what prevents them from using this choice mode, the top three answers were: not available (48.0%, n=1,329), not accessible (43.")
7 survey respondents who primarily take bus or rail (13.4%) is much higher than the ACS commuting estimates for public transportation (4.4% of commuters). The survey results ultimately suggest that single occupancy drivers are underrepresented in the survey, while bicycle and transit commuters are overrepresented an important distinction to keep in mind when evaluating commuting and lifestyle preferences (addressed later). Figure 5 illustrates the primary mode of commute to work or school for all respondents across all modes. FIGURE 5: PRIMARY MODE FOR COMMUTE TO WORK OR SCHOOL The survey also asked respondents how you would like to travel to work or school if you had the choice. It is important to note that respondents could select multiple choices for this question. Nearly 32.0% of respondents (n=888) selected bicycle. This was closely followed by driving alone (31.0%, n=846), rail (27.0%, n=755), and walking (26.0%, n=709). When asked what prevents them from using this choice mode, the top three answers were: not available (48.0%, n=1,329), not accessible (43.0%, n=1,181), and time limitations (42.0%, n=1,164). Table 1 compares how respondents primarily commute to how they want to commute. The percent difference, shown in column four, suggests an increased interest in all commuting modes except for single occupancy vehicle (driving alone). 7 P age
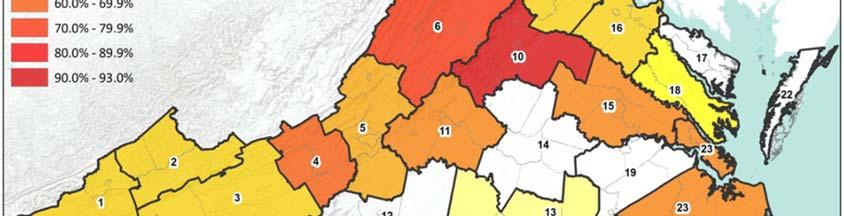
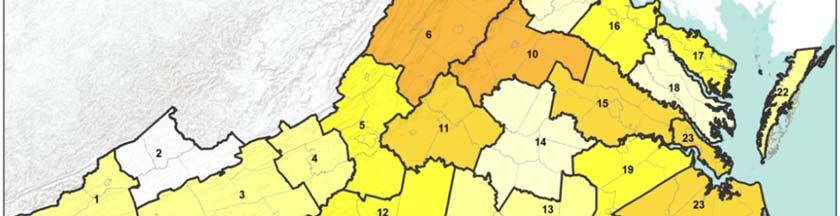
8 TABLE 1: HOW VIRGINIA COMMUTES VS. HOW VIRGINIA WANTS TO COMMUTE Commute to Work and/or School How You Commute [1] How You WANT to Commute [2] Change Drive Alone 55% 31% 25% Drive with Passengers 6% 14% 8% Carpool/Vanpool 3% 12% 9% Taxi 1% 1% 1% Bicycle 9% 32% 22% Walk 4% 26% 22% Bus 7% 21% 14% Rail (e.g. VRE, the TIDE, Amtrak) 6% 27% 21% Ferry 0% 3% 3% Online (or from home) 4% 13% 10% Not Applicable 3% 4% 1% Other (e.g., skateboard, kayak) 1% 3% 2% [1] Percentages may not total 100% due to rounding [2] Respondents could select multiple choices for this question, which explains why cumulative percentages exceed 100% [3] Note: rounding errors may exist A large portion of Millennials (44.0%, n=254), Gen X ers (37.0%, n=288), and Boomers (26.0%, n=288) would bike to work if they had the choice. Time (Millennials) and availability of supporting infrastructure (Gen X and Boomers) are reasons why they can t bike to work. In contrast, Generation Z and Silent generations want to drive alone to work or school (n=16 and 32, respectively). The following map series (Figure 6 Figure 11) compare how PDC respondents currently commute (driving alone, rail/bus, and bicycling/walking) to how they want to commute. In several PDCs (Northern Shenandoah Valley, Middle Peninsula, Crater, Commonwealth, and Hampton Roads), over 70.0% of respondents currently drive alone to work or school, yet only 30.0% to 40.0% state that they want to drive alone to work or school (Figure 6 and Figure 7). As shown in Figure 8 and Figure 9, respondents expressed a significant interest in commuting via bus or rail. Over 50.0% of respondents would like to commute via bus/rail in seven (7) of the PDCs (primarily those located in the Urban Crescent). The percentage of each PDC population who currently commute by bicycling or walking is illustrated in Figure 10. Those who want to commute by bicycling or walking is illustrated in Figure 11. As evident in the map, there is a general interest in bicycling or walking to work/school. Thomas Jefferson PDC, which includes the City of Charlottesville, has the highest percentage of those surveyed that currently bike or walk to work or school (33.0%) and who want to bike or walk to work or school (93.0%). While it would be interesting to compare generational commuting preferences by geography (PDC), the sample sizes are typically much too small. 8 P age

9 FIGURE 6: PRIMARILY DRIVE ALONE TO WORK OR SCHOOL FIGURE 7: WANT TO DRIVE ALONE TO WORK OR SCHOOL 9 P age


10 FIGURE 8: PRIMARILY COMMUTE BY BUS OR RAIL TO WORK OR SCHOOL FIGURE 9: WANT TO COMMUTE BY BUS OR RAIL TO WORK OR SCHOOL 10 P age


11 FIGURE 10: PRIMARILY COMMUTE BY BICYCLING OR WALKING TO WORK OR SCHOOL FIGURE 11: WANT TO COMMUTE BY BICYCLING OR WALKING TO WORK OR SCHOOL 11 P age
12 Commute Times and Satisfaction Respondents were asked about the length of their commute and their degree of satisfaction with their existing commute. Generally, respondents are SATISFIED with their commutes. However, several PDCs stand out as exceptions, including: Rappahannock, Thomas Jefferson, Northern Virginia, and Lenowisco. Meanwhile, 22.0% (n=614) of respondents spend over 60 minutes commuting to work or school daily; while 21% (n=579) spend 15 to 30 minutes. Of those who spend over 60 minutes commuting to work or school, 62.0% (n=380) are not at all satisfied, or only slightly satisfied, with their commute. Of those who spend minutes commuting to work or school, 71.0% (n=381) are very satisfied or extremely satisfied with their commute. Table 2 displays commute time as compared to commute satisfaction. The yellow highlighted fields indicate the highest percentages in each travel time group. TABLE 2: COMMUTE TIMES TO/FROM WORK AND SCHOOL On a TYPICAL DAY, how much TIME do you spend traveling to and from work and/or school? Answer Options 5 to 15 minutes 15 to 30 minutes 30 to 45 minutes 45 to 60 minutes Over 60 minutes Always Work/ Class at Home Not at all satisfied 2 0% 13 2% 38 8% 39 14% % 0 0% Slightly satisfied 10 2% 30 5% 70 16% 62 18% % 0 0% Somewhat satisfied 27 6% % % % % 3 6% Very satisfied % % 52 34% 77 20% 53 9% 12 24% Extremely satisfied % % 31 7% 10 3% 17 3% 26 52% Unsure/Not Applicable 3 1% 0 0% 4 1% 2 0% 6 1% 9 18% 12 P age


13 Figure 13 shows commute satisfaction, specifically the percentage of respondents by PDC who are very satisfied or extremely satisfied with their commutes. In the majority of PDCs, over 30% of respondents are very satisfied or extremely satisfied with their commutes. FIGURE 13: COMMUTE SATISFACTION Leisure Travel Respondents were asked to what level traffic congestion influences leisure travel. Findings show that traffic congestion plays a significant role in leisure trip planning, especially in the urban crescent. Over 48.0% (n=1,321) of survey respondents said that traffic congestion often or always influences their leisure destination choices. Figure 14 illustrates the percent of respondents, by PDC, whose leisure trip choices are often or always influenced by traffic congestion. Respondents were also asked an open ended question regarding how congestion influences their leisure trips. Top answers included: utilizing an alternative route, avoiding peak travel times and days, and/or selecting a different destination. 13 P age

14 FIGURE 14: IMPACT OF TRAFFIC CONGESTION ON LEISURE TRIP PLANNING Where Virginians Live and Where They Want to Live With respect to community types, the survey asked respondents to identify where they live now, where they would currently like to live, and where they would like to live in the next years. Respondents generally show an increasing interest in downtown urban living and rural/small town living; and a diminishing interest in city neighborhood and suburban living. For example, 30.0% of respondents (n=812) currently live in suburban neighborhoods, 16.0% (434) currently want to live in suburban neighborhoods, and only 11.0% (n=301) want to live in suburban neighborhoods in the next years. Conversely, an increasing share of survey respondents prefer downtown/city center living (8.0% live there now, 18.0% want to live there now, and 19.0% want to live there in years). Respondents express increased interest in rural and small town living, as well. 14 P age
15 TABLE 3: LIVING PREFERENCES Downtown/City Center Within walking distance of offices, shops and restaurants City Neighborhood Mostly residential Suburban Center A few minutes from offices, shops and restaurants Suburban Neighborhood Mostly residential Where do you live now? Where do you want to live now? Where do you want to live in the FUTURE (10 20 Years)? % Change from where respondents currently Live to where they want to live in the future (10 20 Years) 214 8% % % 11% % % % 4% % % % 2% % % % 19% Small Town or Village 249 9% % % 6% Rural Countryside % % % 3% Unsure/Not Applicable 33 1% 68 3% 157 6% 5% From a younger generational perspective, Millennial respondents generally exhibit similar preferences to those shown in Table 3 (above). The respondents typically express increasing interest in downtown/city living (17.0% live there now, 21.0% want to live there in years) and stable interest in city neighborhood living (no change). The Millennial respondents also show diminishing interest in suburban living, particularly in suburban neighborhood living (24.0% live there now, 14.0% want to live there in the future). The Millennial respondents do not express a substantial increased interest in small town or village living, but appear increasingly interested in living in the rural countryside (8.0% live there now, 15.0% want to live there in years). The following maps (Figure 14 Figure 17) focus on the future, showing the percent of respondents who want to live in a rural area/small town, a suburb, and an urban area years from now. The living preferences above were grouped in this fashion (small town/rural, suburban, urban) in order to maintain large enough sample sizes across the PDC geographies. The results suggest a sustained interest in a rural/small town living (Figure 14). Every PDC, except one (Northern Virginia), has a significant share (over 30.0%) of respondents who wish to live in rural/small town settings in the next years. It should be noted, however, that some PDCs show a diminishing interest in rural/small town living (Figure 15). In Figure 15, the negative values (shown in blue) suggest that a smaller share of respondents wish to live in a rural area/small town, than the share currently living in rural areas/small towns. The Richmond Regional PDC is the only PDC where over one third (32.7%) of respondents indicated a desire to live in the suburbs in the next years (Figure 16). The highest percentages of 15 P age
16 those desiring to live in an urban setting (Figure 17) are found in the following PDCs: Shenandoah (46.0%), Northern Virginia (44.0%), and Thomas Jefferson (42.0%). Central While it would be interesting to compare generational living preferences by geography (PDC), the sample sizes are typically much too small. 16 P age


17 FIGURE 14: PERCENT OF RESPONDENTS BY PDC WHO WANT TO LIVE IN A RURAL AREA/SMALL TOWN FIGURE 15: RURAL/SMALL TOWN PREFERENCES FUTURE VS. NOW 17 P age


18 FIGURE 16: PERCENT OF RESPONDENTS BY PDC WHO WANT TO LIVE IN A SUBURB IN FUTURE FIGURE 17: PERCENT OF RESPONDENTS BY PDC WHO WANT TO LIVE IN AN URBAN SETTING IN FUTURE 18 P age
19 Virginia s Greatest Transportation Challenge Respondents were asked what they think Virginia s greatest transportation challenge will be in the next 10 years. Traffic congestion (35.7%, n=948), and aging or deteriorating infrastructure (31.4%, n=833), were chosen as the top two transportation challenges, followed by insufficient public transportation (16.3%, n=433). Figure 12 shows the response distribution. FIGURE 12: VIRGINIA S GREATEST TRANSPORTATION CHALLENGES IN THE NEXT TEN YEARS 40.0% 35.0% 30.0% 31.4% 35.7% 25.0% 20.0% 15.0% 16.3% 10.0% 5.0% 0.0% 1.7% 1.2% 1.2% 2.7% 0.5% 3.8% 0.2% Traffic congestion was identified as the primary challenge for all generations, but Boomers who ranked congestion a close secondary concern (34%, n=379). The percentage of age groups who selected traffic congestion as the primary challenge is as follows: Generation Z (38%, n=6), Millennials (39%, n=224), Gen X ers (35%, n=276), Silent (35%, n=46). Boomers identified aging and deteriorating infrastructure as the primary challenge (36%, n=399). Gen X ers (34%, n=265) and the Silent generation (32%, n=42) identified aging and deteriorating infrastructure as a close secondary challenge. Millennials identified insufficient public transportation as the secondary challenge (23%, n=130), while Generation Z identified parking availability (31%, n=5). As shown in Figure 13, most PDCs (12 of 18) identified aging and deteriorating infrastructure as the most pressing transportation challenge in the next decade. Traffic congestion was identified as the top transportation challenge in five PDCs all of which are located in either the Northern Virginia region or the Hampton Roads region. The high response numbers in these areas (accounting for 53.0% of this question s survey responses) explain why traffic congestion was cited as the most pressing challenge (35.7%, n=948). For example, 49.2% (n=399) of respondents in the Northern Virginia PDC identified 19 P age
20 traffic congestion as the top transportation challenge in the next ten years. Meanwhile, respondents in the Thomas Jefferson PDC collectively identified insufficient public transportation as the top transportation challenge (31.3%, n=26), followed closely by traffic congestion (28.9%, n=24). FIGURE 13: GREATEST TRANSPORTATION CHALLENGE IN THE NEXT TEN YEARS BY PDC 20 P age
21 Focus on Transportation In addition to identifying transportation challenges, the survey asked what Virginia should focus on with regards to transportation in the next 10 years. A high percentage of respondents (26.7%) believe Virginia should focus on maintaining existing infrastructure (n=710). Investing in local public transportation (18.3%, n=486), and investing in bicycle and pedestrian networks and facilities (14.9%, n=396) ranked second and third, respectively. Figure 14 shows the response distribution. FIGURE 14: TRANSPORTATION FOCUS AREAS IN NEXT 10 YEARS 30.0% 25.0% 26.7% 20.0% 15.0% 12.8% 18.3% 14.9% 10.0% 5.0% 1.8% 7.4% 1.2% 3.3% 2.2% 0.5% 6.6% 4.3% 0.0% The need to maintain our existing infrastructure was identified as the top transportation focus area for Gen X ers (26%, n=205), Boomers (34%, n=377), and the Silent generation (34%, n=45). Generation Z is focused on new transportation technology (25%, n=4), while Millennials are focused on investing in local public transportation (26%, n=151). Generation X (17%, n=130) and Boomers (13%, n=146) identified investing in local public transportation as a secondary focus area. As shown in Figure 15, the need to maintain our existing infrastructure was identified as the top transportation focus area in the vast majority of PCDs (17 of the 19 PDCs with sample sizes over 20). The Northern Virginia PDC and George Washington PDC were the only exceptions. In the Northern Virginia PDC, 25.6% (n=213) of respondents identified local public transportation as the top focus area, which was followed closely by investing in bicycle and pedestrian networks and facilities (23.1%, n=192). 21 P age

.")

22 In the George Washington PDC, new roads was the top focus area (29.5%, n=31), followed by maintaining existing infrastructure (19.2%, n=20). FIGURE 15: PRIMARY TRANSPORTATION FOCUS AREA IN THE NEXT TEN YEARS BY PDC 22 P age
 below helps visualize some of the most frequently cited responses, while Figure 17 shows examples of some of the specific comments.")
23 Governor for the Day Virginians were asked what they would do for transportation if they were Governor for the day. Over 1,700 individuals responded. The word cloud (Figure 16) below helps visualize some of the most frequently cited responses, while Figure 17 shows examples of some of the specific comments. FIGURE 16: WORD CLOUD SUMMARY OF GOVERNOR FOR A DAY RESPONSES FIGURE 17: EXAMPLES OF COMMENTS RECEIVED FOR GOVERNOR FOR A DAY QUESTION Promote public transportation and the need for options such as Metro, low fare taxis, and safe bus routes. Repair aging roads & bridges. They were never intended for the current amount of traffic, much less the increasing amount in the near future. I would raise gas taxes and institute a congestion charge for city centers and use proceeds to fund increased public transportation and develop plans for increased pedestrian and bike paths/lanes. I would install safe bike/ped infrastructure in cities to promote alternative transportation, which would reduce congestion and reduce bike/ped accidents with cars. Add more lanes to areas that are affected most during rush hour/weekends. 23 P age
City of Surrey. Preface. Labour Force Fact Sheet
 City of Labour Force Fact Sheet Preface Statistics Canada conducts its Census of Population every five years with the most recent census having occurred in 2006. The Census provides information on the
2013 Texas Lyceum Poll. Executive Summary of Issue Priorities, Attitudes on Transportation, Water, Infrastructure, Education, and Health Care
 2013 of Issue Priorities, Attitudes on Transportation, Water, Infrastructure, Education, and Health Care It may be the economy for the country, but it s education here in Texas. We want to do more on roads,
Streetcar Community Attitudes Survey - Community Development and Transportation Principles
 PREPARED FOR: CITY OF LAKE OSWEGO Streetcar Community Attitudes Survey - Community Development and Transportation Principles October 2011 PREPARED BY: DHM RESEARCH (503) 220-0575 203 SW Pine St., Portland,
NOVEMBER visioning survey results
 NOVEMBER 2016 visioning survey results 2 Denveright SECTION 1 SURVEY INTRODUCTION OVERVIEW Our community is undertaking an effort that builds upon our successes and proud traditions to design the future
Greater Washington Transportation Issues Survey
 4/16/2016 Greater Washington Transportation Issues Survey April 18, 2016 Conducted December 1-5, 2015 1 Greater Washington Transportation Issues Survey Page 1 Survey Overview The Northern Virginia Transportation
City of Bellingham Residential Survey 2013
 APPENDICES City of Bellingham Residential Survey 2013 January 2014 Pamela Jull, PhD Rachel Williams, MA Joyce Prigot, PhD Carol Lavoie P.O. Box 1193 1116 Key Street Suite 203 Bellingham, Washington 98227
MONTEREY - SALINAS TRANSIT
 MONTEREY - SALINAS TRANSIT MARINA AREA SERVICE STUDY FINAL REPORT SEPTEMBER 2009 1. EXECUTIVE SUMMARY 01 2. CUSTOMER SURVEY ANALYSIS 05 3. COMMUNITY SURVEY ANALYSIS 35 TABLE OF CONTENTS 4. CSUMB SURVEY
CUP - City User Population Research
 CUP - City User Population Research 2003-2013 Key insights from a decade of CUP surveys Contents Background... 2 Methodology... 2 Executive Summary... 3 Glossary of Terms... 4 Key Insights All City Users...
DATA JUNE 29, 2011 COMMUTING IN THE 21 ST CENTURY. Alan E. Pisarski
 DATA JUNE 29, 2011 COMMUTING IN THE 21 ST CENTURY The Starting Point what is the goal? TODAY IN TRANSPORTATION WE ARE BLESSED WITH LOFTY GOALS TO STIR OUR SOULS! The Starting Point what is the goal? TODAY
Mobility 2045 Supported Goals. Public Benefits of the Transportation System
 Mobility 2045 Supported Goals Ensure all communities are provided access to the regional transportation system and planning process. Encourage livable communities which support sustainability and economic
Background. Response Rate and Age Profile of Respondents. Community Facilities and Amenities. Transport Issues. Employment and Employment Land Issues
 Background Response Rate and Age Profile of Respondents Community Facilities and Amenities Transport Issues Employment and Employment Land Issues Housing and Housing Land Issues Telecommunications Tourism
thinking: BRIEFING 36 Travel to work patterns in Greater Manchester RELEASE DATE: August 2014
 thinking: BRIEFING 36 Travel to work patterns in Greater Manchester RELEASE DATE: August 2014 Please direct any questions or comments regarding this paper to: New Economy Tel: 0161 237 4409 E-mail: mike.doocey@neweconomymanchester.com
OCT 13, 2011 COMMUTING IN THE 21 ST CENTURY
 METRO BOARD OF DIRECTORS OCT 13, 2011 COMMUTING IN THE 21 ST CENTURY WHERE WE RE AT SOME BASICS ABOUT CURRENT NATIONAL COMMUTING BEHAVIOR COMMUTING & TRANSPORTATION ALL TRANSPORT COMMUTING S ROLE COMMUTING
BLUE STAR HIGHWAY COMMUNITY OPINION SURVEY REPORT
 BLUE STAR HIGHWAY COMMUNITY OPINION SURVEY REPORT MAY 2011 BLUE STAR HIGHWAY: DOUGLAS COMMUNITY OPINION SURVEY On March 1st, 2011 the Douglas Advisory Committee and the City of Douglas issued opinion surveys
Post-Secondary Education, Training and Labour April New Brunswick Analysis 2016 Census Topic: Journey to Work
 Post-Secondary Education, Training and Labour April 2018 2016 Census Topic: Journey to Work Contents General Information... 2 Section 1 Place of Work... 2 1.1 Overview... 2 1.1 Sub-Provincial... 3 Section
A PRIMER ON UNITED STATES VOTING BEHAVIOR
 BOB LOEVY Department Of Political Science at Colorado College A PRIMER ON UNITED STATES VOTING BEHAVIOR Based on the Statewide Partisan Average (SPA) 1 THE STATEWIDE PARTISAN AVERAGE Measures Democratic
Baseline Survey Results
 3 Baseline Survey Results RETHINKING I-94 2017 Baseline Survey Key Takeaways Rabbit Prepared for MnDOT, Rethinking I-94 Key Considerations Trend comparisons across both years (2016 and 2017) need to be
UTS:IPPG Project Team. Project Director: Associate Professor Roberta Ryan, Director IPPG. Project Manager: Catherine Hastings, Research Officer
 IPPG Project Team Project Director: Associate Professor Roberta Ryan, Director IPPG Project Manager: Catherine Hastings, Research Officer Research Assistance: Theresa Alvarez, Research Assistant Acknowledgements
FOR RELEASE MARCH 20, 2018
 FOR RELEASE MARCH 20, 2018 FOR MEDIA OR OTHER INQUIRIES: Carroll Doherty, Director of Political Research Jocelyn Kiley, Associate Director, Research Olivia O Hea, Communications Assistant 202.419.4372
Summary of the U.S. Census Bureau s 2018 State-Level Population Estimate for Massachusetts
 Summary of the U.S. Census Bureau s 2018 State-Level Population Estimate for Massachusetts Prepared by: Population Estimates Program For Release December 19, 2018 On December 19, 2018, the U.S. Census
CITY USER PROFILE 15 ADELAIDE CITY COUNCIL RESEARCH REPORT
 CITY USER PROFILE 15 ADELAIDE CITY COUNCIL RESEARCH REPORT CONTENTS What is the City User Profile and why do we do it? p. 03 How is CUP data collected? p. 03 What are some of the key findings from CUP
Urban Transportation Center, UIC. Abstract
 J.G. Berman Siim SööS ööt Susumu Kudo Urban Transportation Center, UIC Abstract The poster models and analyzes travel behavior by race and ethnicity in Lake County, Illinois, an early test site of the
2017 Citizen Survey of Police Surveys Citizen Survey Introduction 1
 Citizen Survey Introduction 1 Table of Contents 2017 Citizen Survey Introduction... 3 Respondents Profile... 4 Key Questions for 2017... 6 Key Questions Five Year Comparison... 10 Citizens Contact with
Summary of At-Border Data Collection Results
 Summary of At-Border Data Collection Results Economic and Air Quality/Climate Impacts of Delays at the Border San Diego, CA December 8, 2017 1 Contents Introduction... 4 Overview of the Study Area... 4
\8;2\-3 AN EXECUTIVE SUMMARY COMMUTING IN TEXAS: PATTERNS AND TRENDS. L~, t~ 1821summary. TxDOT/Uni.
 TxDOT/Uni. 1821summary \8;2\-3 COMMUTING IN TEXAS: PATTERNS AND TRENDS AN EXECUTIVE SUMMARY L~,----------------------t~ Disclaimer The contents of this report reflect the views of the author who is responsible
For whom the city? Housing and locational preferences in New Zealand
 Chapter 2 For whom the city? Housing and locational preferences in New Zealand Nick Preval, Ralph Chapman & Philippa Howden-Chapman New Zealand was once famously described as the quarter-acre pavlova paradise,
Working Overtime: Long Commutes and Rent-burden in the Washington Metropolitan Region
 Working Overtime: Long Commutes and Rent-burden in the Washington Metropolitan Region By Kathryn Howell, PhD Research Associate George Mason University School of Public Policy Center for Regional Analysis
Infrastructure. Making infrastructure investment relevant again
 Infrastructure Making infrastructure investment relevant again 3 Infrastructure 4 Educating the public 7 Align priorities 10 Rethink messaging 13 Organize constituencies 14 Broaden funding & oversight
Foreign American Community Survey. April 2011
 Foreign Population 2005-2009 American Community Survey April 2011 Department of Community Planning, Housing and Development Planning Division Planning Research and Analysis Team Arlington Vision Arlington
14. General functions, powers and duties of department. Effective: April 1, 2005
 14. General functions, powers and duties of department Effective: April 1, 2005 The department, by or through the commissioner or his duly authorized officer or employee, shall have the following general
Community Organizations
 Community Organizations Letter FW155 Associated Students of Highline College, Ruth Krizan Page 1 Response to Comment LC9-1 Sound Transit has a formal process for naming stations that occurs during final
Differences and Common Ground: Urban and Rural Minnesota
 Differences and Common Ground: Urban and Rural Minnesota Findings from the 2017 Ground Level Survey of Minnesotans APM Research Lab, January 2018 Introduction Urban and rural residents of Minnesota have
2. Challenges and Opportunities for Sheffield to 2034
 2. T he future presents many opportunities for Sheffield, yet there are also a number of challenges our city is facing. Sheffield is widely connected to the rest of the country and the world and, therefore,
The Journey-to-Work in the Context of Daily Travel For the Census Data for Transportation Planning Conference
 The Journey-to-Work in the Context of Daily Travel For the Census Data for Transportation Planning Conference Nancy McGuckin Travel Behavior Analyst and Nandu Srinivasan Cambridge Systematics 1 Executive
City of Surrey. Labour Force Fact Sheet. Preface
 City of Preface Every five years, Statistics Canada conducts a Census of Population in order to develop a statistical portrait of Canada and its people. The most recent Census was conducted in May 2011.
Differences and Common Ground: Urban and Rural Minnesota
 Differences and Common Ground: Urban and Rural Minnesota Findings from the MPR News APM Research Lab 2017 Ground Level Survey of Minnesotans APM Research Lab, February 2018 Introduction Urban and rural
I-35W Bridge Collapse: Travel Impacts and Adjustment Strategies
 I-35W Bridge Collapse: Travel Impacts and Adjustment Strategies Nebiyou Tilahun David Levinson Abstract On August 1 st, 2007, the I-35W bridge crossing the Mississippi river collapsed. In addition to the
Chapter 1: The Demographics of McLennan County
 Chapter 1: The Demographics of McLennan County General Population Since 2000, the Texas population has grown by more than 2.7 million residents (approximately 15%), bringing the total population of the
7 Willow Street, Suite 200 Annapolis, Maryland (410) Fax: (410)
 Fax: (410)") To: From: 7 Willow Street, Suite 200 Annapolis, Maryland 21401 (410) 280-2000 Fax: (410) 280-3400 www.opinionworks.com Kimberly Golden Brandt, Director of Smart Growth Maryland Preservation Maryland Steve
To: From: 7 Willow Street, Suite 200 Annapolis, Maryland 21401 (410) 280-2000 Fax: (410) 280-3400 www.opinionworks.com Kimberly Golden Brandt, Director of Smart Growth Maryland Preservation Maryland Steve
An in-depth examination of North Carolina voter attitudes on important current issues
 An in-depth examination of North Carolina voter attitudes on important current issues Registered Voters in North Carolina August 25-30, 2018 1 Contents Contents Key Survey Insights... 3 Satisfaction with
The State of Rural Minnesota, 2019
 P.O. Box 3185 Mankato, MN 56002-3185 (507)934-7700 www.ruralmn.org The State of Rural Minnesota, 2019 January 2019 By Kelly Asche, Research Associate Each year, the Center for Rural Policy and Development
In abusiness Review article nine years ago, we. Has Suburbanization Diminished the Importance of Access to Center City?
 Why Don't Banks Take Stock? Mitchell Berlin Has Suburbanization Diminished the Importance of Access to Center City? Richard Voith* In abusiness Review article nine years ago, we examined the role that
2016 Appointed Boards and Commissions Diversity Survey Report
 2016 Appointed Boards and Commissions Diversity Survey Report November 28, 2016 Neighborhood and Community Relations Department 612-673-3737 www.minneapolismn.gov/ncr Table of Contents Introduction...
Telephone Survey of Mill Valley Voters Municipal Services Tax Measure Survey Report June 2016
 Telephone Survey of Mill Valley Voters Municipal Services Tax Measure Survey Report June 2016 Presented to: City Council of Mill Valley June 6, 2016 Methodology Live telephone survey of a representative
THE BRAIN GAIN: 2015 UPDATE. How the Region s Shifting Demographics Favor the Lower Manhattan Business District
 THE BRAIN GAIN: 2015 UPDATE How the Region s Shifting Demographics Favor the Lower Manhattan Business District 2015 UPDATE THE BRAIN GAIN: How the Region s Shifting Demographics Favor the Lower Manhattan
A Regional Transportation Plan for the Meramec Region
 A Regional Transportation Plan for the Meramec Region Including: Crawford, Dent, Gasconade, Maries, Osage, Phelps, Pulaski and Washington Counties June 2014 Completed by: Meramec Regional Planning Commission
A Demographic Profile
 Seventh-day Adventists in North America A Demographic Profile North American Division Secretariat Demographic Survey By Monte Sahlin and Paul Richardson November 2008 Introduction This report provides
THE STATE OF TRANSPORT OPINION POLL SOUTH AFRICA: A FOUR-YEAR REVIEW ( )
") THE STATE OF TRANSPORT OPINION POLL SOUTH AFRICA: A FOUR-YEAR REVIEW (2012-2015) G Heyns and R Luke* University of Johannesburg, PO Box 524, Johannesburg, 2006 Tel: 011 5594952; Email: gjheyns@uj.ac.za
THE STATE OF TRANSPORT OPINION POLL SOUTH AFRICA: A FOUR-YEAR REVIEW (2012-2015) G Heyns and R Luke* University of Johannesburg, PO Box 524, Johannesburg, 2006 Tel: 011 5594952; Email: gjheyns@uj.ac.za
Marist College Institute for Public Opinion Poughkeepsie, NY Phone Fax
 Marist College Institute for Public Opinion Poughkeepsie, NY 12601 Phone 845.575.5050 Fax 845.575.5111 www.maristpoll.marist.edu NY1/YNN-Marist Poll Cuomo Popular One Year after Election as Governor ***
Statistics Update For County Cavan
 Social Inclusion Unit November 2013 Key Figures for Cavan Population 73,183 Population change 14.3% Statistics Update For County Cavan Census 2011 Shows How Cavan is Changing Population living in 70% rural
2017 Surrey Roads Survey JANUARY 2018
 2017 Surrey Roads Survey JANUARY 2018 In Partnership with BUSINESSINSURREY.COM Surrey Board of Trade WHO WE ARE The Surrey Board of Trade supports, promotes, and advocates for commercial and industrial
NVTC LEGISLATIVE AND POLICY COMMITTEE MEETING THURSDAY, JANUARY 3, 2019
 NVTC LEGISLATIVE AND POLICY COMMITTEE MEETING THURSDAY, JANUARY 3, 2019 Please Note Location: NVTC Office Suite #620 2300 Wilson Blvd, Arlington, VA 22201 5:30 P.M. AGENDA 1. Summary of the October 4,
I 5 South Multimodal Corridor Study. Appendix B. Issue Statement
 I 5 South Multimodal Corridor Study Appendix B I-5 SOUTH MULTIMODAL CORRIDOR STUDY ISSUE STATEMENT JUNE 5, 2009 PROJECT DESCRIPTION The goal of the Interstate 5 (I-5) South Multimodal Corridor Study is
Citizen Opinion Survey
 Citizen Opinion Survey EXECUTIVE SUMMARY Conducted for Sarasota County Dr. Susan A. MacManus Department of Government and International Affairs University of South Florida Tampa, Florida EXECUTIVE SUMMARY
Americans Want a Direct Say in Government: Survey Results in All 50 States on Initiative & Referendum
 Americans Want a Direct Say in Government: Survey Results in All 50 States on Initiative & Referendum 2050 Old Bridge Road Suite 103 Lake Ridge, VA 22192 (703) 492-1776 www.citizensincharge.org www.citizensinchargefoundation.org
By Richard EZIKE, Ph.D.
 By Richard EZIKE, Ph.D. Table of COntents Overview CONSEQUENCES OF TRANSPORTATIOn INEQUITY Tackling Transportation Inequity by Increasing Access Case Studies THE SHARING ECONOMY Recommendations //3 //5
Changing Cities: What s Next for Charlotte?
 Changing Cities: What s Next for Charlotte? Santiago Pinto Senior Policy Economist The views expressed in this presentation are those of the speaker and do not necessarily represent the views of the Federal
UC Berkeley Earlier Faculty Research
 UC Berkeley Earlier Faculty Research Title The car, immigrants and poverty: implications for immigrant earnings and job access Permalink https://escholarship.org/uc/item/6bh7m91q Authors Clark, William
Project Update: September 2018 Public Outreach Executive Summary
 Project Update: September 2018 Public Outreach Executive Summary Overview Sound Transit developed and analyzed initial route and station concepts for the Tacoma Dome Link Extension (TDLE) project. In September
Appendix B: Input Survey Results
 Appendix B: Input Survey Results Introduction As part of the public participation process, a Public Input Survey and Student Input Survey were created to gather community and student input. The public
SAN FRANCISCO MUNICIPAL TRANSPORTATION AGENCY
 THIS PRINT COVERS CALENDAR ITEM NO. : 10.6 DIVISION: Sustainable Streets BRIEF DESCRIPTION: SAN FRANCISCO MUNICIPAL TRANSPORTATION AGENCY Amend the Transportation Code, Division II, regarding Residential
ENVIRONMENTALLY SUSTAINABLE TRANSPORT IN PHNOM PENH, CAMBODIA
 Asian Mayors Policy Dialogue ENVIRONMENTALLY SUSTAINABLE TRANSPORT IN PHNOM PENH, CAMBODIA April 23-24, 2007, Kyoto, Japan Presented by H.E. MANN CHHOEURN, Vice Governor of Phnom Penh, Cambodia KINGDOM
METHODOLOGY: Regional leaders are now left to come up with a new plan for the future of transportation in the Lower Mainland.
 Page 1 of 13 Metro Vancouver transit referendum: Who voted yes, who voted no, and what will it mean for the region? Despite their defeat, yes voters were more likely to say holding the transit plebiscite
RMIT University, Melbourne, 3001, Australia for correspondence: Abstract
 Australasian Transport Research Forum 2017 Proceedings 27 29 November 2017, Auckland, New Zealand Publication website: http://www.atrf.info Interactions between residential relocation and commute patterns
Corporate. Report COUNCIL DATE: April 28, 2008 NO: R071 REGULAR COUNCIL. TO: Mayor & Council DATE: April 28, 2008
 Corporate NO: R071 Report COUNCIL DATE: April 28, 2008 REGULAR COUNCIL TO: Mayor & Council DATE: April 28, 2008 FROM: General Manager, Planning and Development FILE: 6600-01 SUBJECT: 2006 Census Information
APTA Local Priority Message Testing Results. October 30, 2013
 APTA Local Priority Message Testing Results October 30, 2013 Objectives Understand the messaging needs of local public transportation systems Develop an overall messaging strategy and specific message
3.1 HISTORIC AND FORECASTED POPULATION FIGURES
 SECTION 3: COMMUNITY PROFILE This section contains an overview of demographic characteristics which are applicable to the analysis of Vaughan s parks, recreation, and library facilities. Identifying who
KEY FINDINGS FROM THE 2016 EAST METRO PULSE SURVEY
 EAST METRO PULSE KEY FINDINGS FROM THE 2016 EAST METRO PULSE SURVEY ABOUT THE SAINT PAUL FOUNDATION The Saint Paul Foundation is a community foundation with more than 75 years of history in investing in
Travel Behavior of Hispanic Immigrants in Southern California
 Travel Behavior of Hispanic Immigrants in Southern California - Scenario Analysis of Future Immigrants Growth from a Parcel-Based Sketch Planning Model Hsi-Hwa Hu, Simon Choi, Frank Wen Research, Analysis
Meanwhile, the foreign-born population accounted for the remaining 39 percent of the decline in household growth in
 3 Demographic Drivers Since the Great Recession, fewer young adults are forming new households and fewer immigrants are coming to the United States. As a result, the pace of household growth is unusually
Rural Virginia: Issues and Opportunities
 Rural Virginia: Issues and Opportunities Sometimes a picture truly is worth a thousand words. This presentation is a companion piece to the final report of the Rural Virginia Prosperity Commission (RVPC)
APPENDIX B. Environmental Justice Evaluation
 Appendix B. Environmental Justice Evaluation 1 APPENDIX B. Environmental Justice Evaluation Introduction The U.S. Department of Transportation has issued a final order on Environmental Justice. This final
How s Life in Belgium?
 How s Life in Belgium? November 2017 Relative to other countries, Belgium performs above or close to the OECD average across the different wellbeing dimensions. Household net adjusted disposable income
STRENGTHENING RURAL CANADA: Fewer & Older: Population and Demographic Crossroads in Rural Saskatchewan. An Executive Summary
 STRENGTHENING RURAL CANADA: Fewer & Older: Population and Demographic Crossroads in Rural Saskatchewan An Executive Summary This paper has been prepared for the Strengthening Rural Canada initiative by:
Regional Trends in the Domestic Migration of Minnesota s Young People
 HOUSE RESEARCH & STATE DEMOGRAPHIC CENTER A Changing Minnesota Sean Williams, House Research Susan Brower, Minnesota State Demographic Center September 2018 Regional Trends in the Domestic Migration of
Trump Effect plays in Virginia governor s race, but Confederate statues may raise a Robert E. Lee Effect
 September 26, 2017 Trump Effect plays in Virginia governor s race, but Confederate statues may raise a Robert E. Lee Effect Summary of Key Findings 1. Overall, 39% of voters say President Trump is a factor
Vermonters Awareness of and Attitudes Toward Sprawl Development in 2002
 Vermonters Awareness of and Attitudes Toward Sprawl Development in 2002 Written by Thomas P. DeSisto, Data Research Specialist Introduction In recent years sprawl has been viewed by a number of Vermont
City of Janesville Police Department 2015 Community Survey
 City of Janesville Police Department 2015 Community Survey Presentation and Data Analysis Conducted by: UW-Whitewater Center for Political Science & Public Policy Research Susan M. Johnson, Ph.D. and Jolly
Executive Summary. $3 trillion. $100 million. $50 billion. The Northeast Corridor Rail Network. The Northeast Corridor Region and Economy
 Executive Summary Report Purpose The Northeast Corridor and the American Economy responds to a Congressional mandate established in the Passenger Rail Investment and Improvement Act of 008, commonly referred
The Brookings Institution
 The Brookings Institution Metropolitan Policy Program Bruce Katz, Director Understanding Regional Dynamics: Implications for Social and Economic Justice Understanding Regional Dynamics: Implications for
Summary of the U.S. Census Bureau s 2015 State-Level Population Estimate for Massachusetts
 Summary of the U.S. Census Bureau s 2015 State-Level Population Estimate for Massachusetts Prepared by: Population Estimates Program For Release December 22, 2015 On December 22, 2015, the U.S. Census
ANNUAL SURVEY REPORT: ARMENIA
 ANNUAL SURVEY REPORT: ARMENIA 2 nd Wave (Spring 2017) OPEN Neighbourhood Communicating for a stronger partnership: connecting with citizens across the Eastern Neighbourhood June 2017 ANNUAL SURVEY REPORT,
The Brookings Institution Metropolitan Policy Program Robert Puentes, Fellow
 The Brookings Institution Metropolitan Policy Program Robert Puentes, Fellow Caution: Challenges Ahead A Review of New Urban Demographics and Impacts on Transportation Eno Foundation Forum on the Future
Environmental Justice Methodology Technical Memorandum
 Appendix D Environmental Justice Methodology I-290 Eisenhower Expressway Cook County, Illinois Prepared For: Illinois Department of Transportation Prepared By: WSP Parsons Brinckerhoff September 2016 This
William & Mary Law School 2011 Virginia Redistricting Competition
 William & Mary Law School 2011 Virginia Redistricting Competition U.S. Congressional General Themes Our team created this map with the goal of improving the way communities of interest ongressional districts
Assessment of Demographic & Community Data Updates & Revisions
 Assessment of Demographic & Community Data Updates & Revisions Scott Langen, Director of Operations McNair Business Development Inc. P: 306-790-1894 F: 306-789-7630 E: slangen@mcnair.ca October 30, 2013
Cook County Health Strategic Planning Landscape
 Cook County Health Strategic Planning Landscape Terry Mason, MD COO Cook County Department of Public Health December 21, 2018 1 Cook County Population Change 2000-2010* U.S. Census 2000 population 2010
Title VI Review: Service and Facility Standards Monitoring
 Title VI Review: Service and Facility Standards Monitoring Prepared by SRF Consulting Group, Inc. SRF No. 7709 Table of Contents Executive Summary...5 Technical Analysis of Service Standards... 5 Additional
Release of 2006 Census results Labour Force, Education, Place of Work and Mode of Transportation
 Backgrounder Release of 2006 Census results Labour Force, Education, Place of Work and Mode of Transportation On March 4, 2008 Statistics Canada released further results from the 2006 census focusing on
Home in America: Immigrants and Housing Demand
 Home in America: Immigrants and Housing Demand ULI Minnesota /Regional Council of Mayors 9 th Annual Housing Summit July 18, 2017 Lisa Sturtevant, PhD Senior Visiting Fellow ULI Terwilliger Center for
Paid Patronage in Philadelphia:
 Paid Patronage in Philadelphia: Migratory Trends and Growth Factors A Patron Behavior Study by for Engage 2020 Research Into Action Report September 21, 2009 Table of Contents Synopsis.... 3 Background...
Planning for the Silver Tsunami:
 Planning for the Silver Tsunami: The Shifting Age Profile of the Commonwealth and Its Implications for Workforce Development H e n r y Renski A NEW DEMOGRAPHIC MODEL PROJECTS A CONTINUING, LONG-TERM SLOWING
The National Citizen Survey
 CITY OF SARASOTA, FLORIDA 2008 3005 30th Street 777 North Capitol Street NE, Suite 500 Boulder, CO 80301 Washington, DC 20002 ww.n-r-c.com 303-444-7863 www.icma.org 202-289-ICMA P U B L I C S A F E T Y
Life in Hampton Roads Report
 1 Social Science Research Center, Old Dominion University Life in Hampton Roads Report The Sixth Annual Life in Hampton Roads Survey Report Compiled by Steve Parker, Jane Close, Dr. Randy Gainey, and Dr.
ATTACHMENT: 4 REPORT TO GENERAL PLAN 2040 STEERING COMMITTEE
 MEETING DATE: March 14, 2018 AGENDA ITEM: 5.B ATTACHMENT: 4 REPORT TO GENERAL PLAN 2040 STEERING COMMITTEE Subject: Responses to Eight Questions Visioning Exercise EXECUTIVE SUMMARY At the February 14,
Geographic Origin Segmentation
 Geographic Origin Segmentation Six major geographic segments of nonresident business and pleasure motorists traveling in Idaho emerged from the database. These segments include travelers from the areas
Telephone Survey. Contents *
 Telephone Survey Contents * Tables... 2 Figures... 2 Introduction... 4 Survey Questionnaire... 4 Sampling Methods... 5 Study Population... 5 Sample Size... 6 Survey Procedures... 6 Data Analysis Method...
Chapter One: people & demographics
 Chapter One: people & demographics The composition of Alberta s population is the foundation for its post-secondary enrolment growth. The population s demographic profile determines the pressure points
Leaving the Good Life: Predicting Migration Intentions of Rural Nebraskans
 University of Nebraska - Lincoln DigitalCommons@University of Nebraska - Lincoln Publications from the Center for Applied Rural Innovation (CARI) CARI: Center for Applied Rural Innovation November 1998
ANNUAL SURVEY REPORT: REGIONAL OVERVIEW
 ANNUAL SURVEY REPORT: REGIONAL OVERVIEW 2nd Wave (Spring 2017) OPEN Neighbourhood Communicating for a stronger partnership: connecting with citizens across the Eastern Neighbourhood June 2017 TABLE OF