City of Janesville Police Department 2015 Community Survey
|
|
|
- Delilah Barrett
- 5 years ago
- Views:
Transcription
1 City of Janesville Police Department 2015 Community Survey Presentation and Data Analysis Conducted by: UW-Whitewater Center for Political Science & Public Policy Research Susan M. Johnson, Ph.D. and Jolly A. Emrey, Ph.D., Directors Brittany Gonzales, Research Assistant
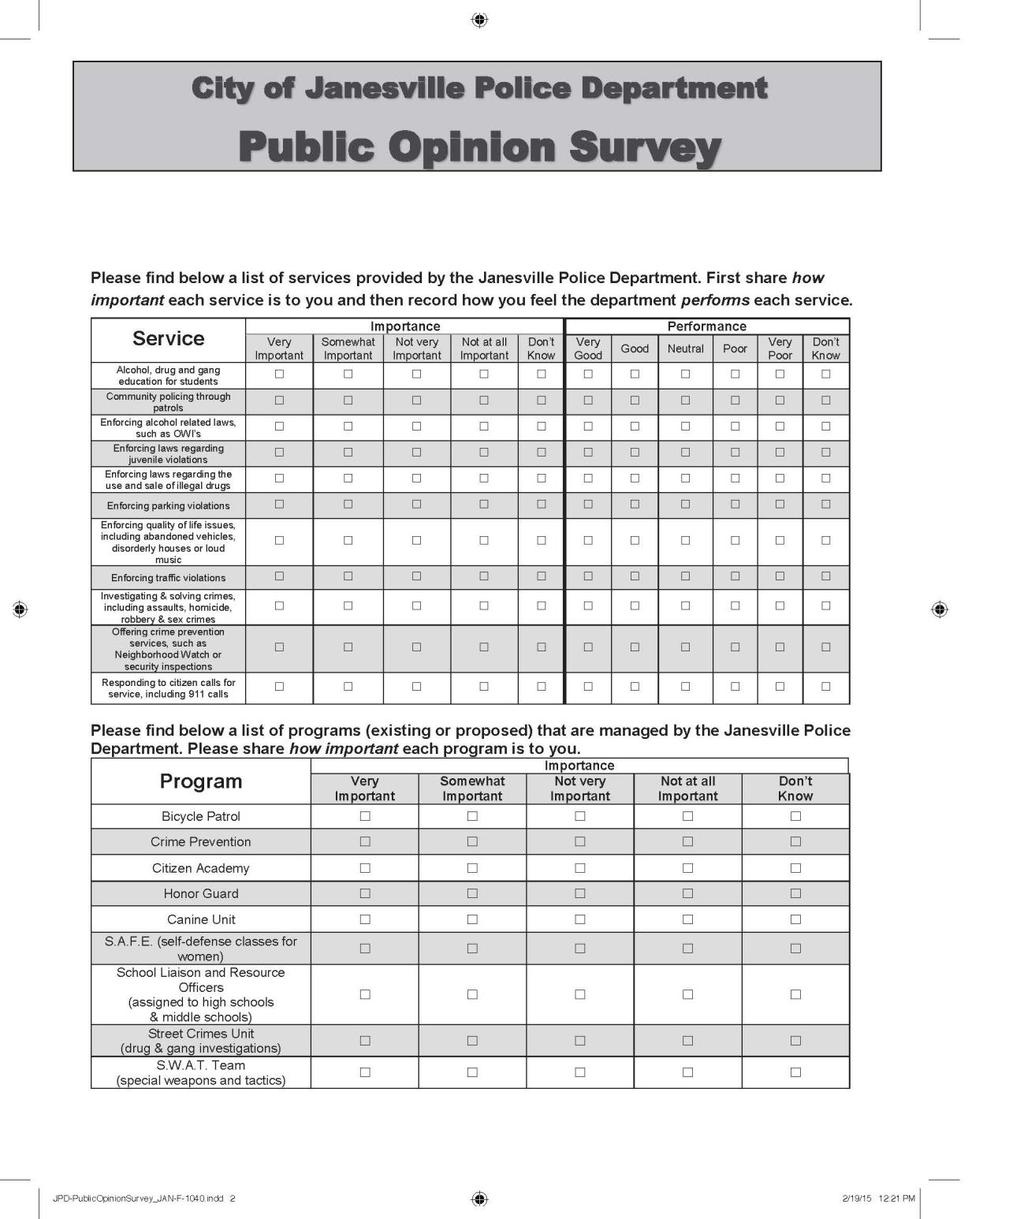
2 Table of Contents EXECUTIVE SUMMARY INTRODUCTION METHODOLOGY SURVEY RESULTS QUALITY OF LIFE IN JANESVILLE PERCEPTIONS OF SAFETY IN JANESVILLE IMPORTANCE OF SERVICES PERFORMANCE OF SERVICES IMPORTANCE OF EXISTING AND PROPOSED PROGRAMS LEVEL OF COMFORT WITH DEPARTMENT AND STAFF PERCEPTIONS OF SAFETY BY PATROL AREA LEVEL OF COMFORT BY PATROL AREA OPEN-ENDED QUESTIONS CONCLUSION APPENDIX A: SURVEY INSTRUMENT APPENDIX B: WEIGHTED DATED & DEMOGRAPHIC PROFILE APPENDIX C: PATROL AREA MAP
3 CITY OF JANESVILLE POLICE DEPARTMENT Community Survey EXECUTIVE SUMMARY The City of Janesville Police Department Community Survey was designed to assess citizen perceptions and attitudes about policing and police services throughout the city. The findings discussed in this report clearly indicate that Janesville residents generally felt safe and were satisfied with the services provided by the Janesville Police Department. In order to look more closely at how safe Janesville residents feel in different areas of the city, a subset of the data were also analyzed by patrol area. While perceptions of safety were high across the city, there were some patrol areas where residents felt safer than in others. Notable findings include: 80% of residents are satisfied or very satisfied with the quality of life in Janesville. Residents find Janesville to be a safe place to live, work and recreate with strong majorities in most categories responding that they feel safe or very safe. Three-quarters or more of residents felt that investigating/solving crimes, responding to calls for service, enforcing drug laws, drug, alcohol, and gang education and enforcing alcohol laws were important or very important. A majority of residents reported that the department performance was good or very good in regard to community policing with patrols, enforcing alcohol laws, enforcing traffic laws, investigating/solving crimes, and responding to calls for service. 85% indicated that they were comfortable or very comfortable approaching a member of the department with close to half of respondents feeling very comfortable. Residents in Patrol Area 8 indicated the strongest perceptions of safety across all conditions compared with the other patrol areas, but residents in all patrol areas reported feeling safe. 2
4 While there are issues that merit additional attention by the department, in general, Janesville residents are satisfied with the services and programs provided by the police department and feel safe in their communities. 3
5 INTRODUCTION The City of Janesville Police Department Community Survey was designed to assess citizen perceptions and attitudes about policing and police services throughout the city. The same survey was administered in 2009 allowing comparisons with the 2015 version. The survey instrument was created by the Janesville Police Department with input from the UW-Whitewater Center for Political Science and Public Policy Research (CPSPPR). Approximately five-thousand copies of the survey instrument were mailed to residents who live in Janesville's eight police patrol areas. The surveys were returned postage-paid to the Janesville Police Department and delivered to the UW-Whitewater CPSPPR for data entry and data analysis, results of which can be found in subsequent sections of this report. Understanding citizen perceptions of policing is critically important to local law enforcement agencies for a variety of reasons. First, law enforcement agencies across the nation have implemented an initiative directed by the United States Department of Justice (D.O.J.) to change their policing methodologies. During the 1960s through the 1980s much of policing was conducted by patrol car, driving through neighborhoods and patrol areas or districts. This method proved over time to create an impersonal approach to policing and a disconnect between the citizens, neighborhoods, local police and their departments. In many cities it adversely affected relationships between law enforcement and those that they sought to serve and protect. In attempt to remedy this problem, Community Oriented Policing Services (COPS) was created in 1994 as an initiative with its own department in the D.O.J. Its programs have been implemented in cities throughout the nation in order to re-establish a more personalized approach to policing. 1 The City of Janesville Police Department has instituted a number of community oriented policing practices in accordance with this initiative over the years and continues to review these programs as well as introduce new ones as appropriate. 1 The Office of Community Policing Services (COPS) was created through the Violent Crime Control and Enforcement Act of 1994 and has been an agency within the Department of Justice since that time. The COPS office provides information on community policing practices to local law enforcement agencies as well as grant opportunities to help fund local law enforcement programs and operations. 4
6 Second, it is important to get feedback from the community a police department serves in order to evaluate fully how well its services are meeting the city's needs. One means for determining citizen satisfaction is to anonymously survey members of the community. The survey instrument used in this study was designed to assess, as comprehensively as possible, citizen views of the Janesville Police Department and the relative safety of the community. It included questions that addressed perceptions of personal safety under a variety conditions and in a number of settings. It also included a question that addressed the level of comfort respondents had approaching police department officers and department staff. The survey was also constructed to ascertain how well Janesville's citizens believe the Janesville Police Department is meeting the community's policing needs. A number of questions were asked to determine citizen knowledge of existing services and programs provided by the department and follow-up questions allowed respondents to rate how well the department is administering these services and programs. In addition, the survey provided respondents with the opportunity to express their opinions about proposed services and programs that may be offered in the future. Finally, the survey gave respondents the opportunity to identify what they perceive to be the most important policing issues today and over the next five years, any changes they would like to see made in the department, and to identify any additional services or programs they would like to see provided by the department. It is worth noting that the citizen satisfaction survey and the department climate survey were both conducted shortly after two very high profile deaths involving police and minorities in New York City and Ferguson, Missouri. Because of these events, and subsequent incidents since involving law enforcement and minorities in other parts of the nation, trust in law enforcement has been eroded. Morale within police departments has also declined. While there has been a substantial gap between African American and White perceptions about police (trust and fairness) for decades, the City of Janesville reports a very high degree of trust with its police 5
7 department that is even greater than what is reported for national averages since Michael Brown s death in Ferguson, Missouri. 2 Janesville, Wisconsin is a city with a population of 63, The Janesville Police Department has divided the city into eight separate patrol areas. The patrol areas are somewhat distinct with respect to characteristics. Some are primarily residential, whereas others are a mix of residential and business. In addition, some patrol areas have greater concentrations of business (retail and manufacturing). The Janesville Police Department has numerous community policing efforts including, but not limited to: Permanent patrol area assignments so officers can connect with citizens Coordinated meetings with central city neighborhoods for neighborhood planning and problem-solving Bicycle and foot patrols in central city neighborhoods; and bicycle patrols on the city's trail system A self-defense program for women Officer assignments to Janesville Public Schools Collaboration with adult and juvenile probation Collaboration with code enforcement Collaboration with citizens on graffiti abatement The following section provides a discussion of the data collection and methodology. 2 A recent Gallup Poll, July 2015, indicated that confidence in police has declined greatly. Fifty-seven percent of whites responding indicated that they had confidence in law enforcement with thirty percent of blacks responding similarly. Although public opinion polls have always reported a gap between whites and blacks regarding issues of trust and treatment, attitudes of both whites and blacks about law enforcement have been negatively affected since Ferguson US Census 6
8 METHODOLOGY Sampling Method The City of Janesville Police Department Community Survey was administered through the mail in early Responses were returned to the police department, postage-paid. The data entry and analysis were conducted by the UW-Whitewater Center for Political Science and Public Policy Research. The survey was conducted using a non-random sample selection of 5,370 addresses from a total possible database of 21,479. A systematic sampling technique employing Modulo Arithmetic 4 was used to pull the addresses for the questionnaire mailing. These addresses were drawn from the city s property assessor s database of parcels within the Janesville city limits. It should be noted that the addresses in this database were those of the property, and not the property owner. Therefore, renters as well as homeowners were included in the mailing. 4 The parcel numbers were drawn sequentially from each square mile of the City. This ensured that all areas of the city had proportionate representation based on the residential parcels within each geographic area. Of the 5,370 surveys mailed, 1,165 were returned resulting in a response rate of 22 percent. This is a strong response rate for a mail administered survey that provided no incentive for completion other than postage-paid. On average, the response rate range for surveys conducted through the mail is between five and twenty-one percent; and significantly higher for surveys that include some kind of monetary incentive for completion. The fact that the survey was postage paid may have helped boost the return rate. 5 4 Although this is a non-random sample, the sampling technique used is not uncommon for survey research of limited populations and is generally considered to be appropriate and reliable. 5 A copy of the survey instrument may be found in Appendix A. 7
9 Likert Scaling The survey instrument included 45 closed-ended questions and three open-ended questions. Most of the closed-ended questions were presented in a matrix and required respondents to record their attitudes and opinions using a Likert scale. For example, responses to closed-ended questions about personal safety, and safety in Janesville public schools had the following possible range: "very safe", "safe", "neutral", "unsafe", "very unsafe", and "don't know". With respect to opinions about the importance of specific programs and services, and the police department's performance/delivery of these programs and services the scale included: "very important", "somewhat important", "not very important", "not at all important", "don't know"; and "very good", "good", "neutral", "poor", "very poor", and "don't know". The value to using Likert or similar scaling is that it provides responses to questions that are unambiguous, which is important for data analysis and interpretation. It should be noted here that most Likert scale question formats do not include "don't know" categories, but this response category was included in this survey. It is an appropriate modification to the traditional Likert scale for this instrument since the survey was designed to capture citizen knowledge of services and programs as well as their feelings about the delivery of these services and programs. In addition, "don't know" mitigates against "forced responses" such as "neutral" when a respondent truly has little or no knowledge about something and "neutral" does not accurately capture ignorance as much as it might imply ambivalence or indifference. Analysis Each completed survey was given a unique survey identification number. These numbers were included in the dataset to provide an identifier for each survey entered, or each "case". The unit of analysis was the individual survey or the responses to the survey instrument questions. Responses to the survey questions were coded by assigning numerical values to each response category on the Likert scale. The statistical analyses were descriptive and included frequencies 8
10 of responses to the individual survey questions, as well as bivariate 6 analyses under certain conditions. All analyses of the data were conducted using SPSS (Statistical Package for the Social Sciences). Weighting of the "Age" Variable in the Data After analyzing the demographic profile of the respondents we found that the survey respondents skewed toward older persons in the city's population. To provide a greater distribution of responses across this variable, the data were "normed" for the variable "age" by weighting it according to the city's age distribution in the 2010 U.S. Census Survey. (See Appendix B for more detail and comparisons.) 6 Bivariate analysis examines the relationship between two variables simultaneously. For example, the correlation between respondents and their opinions regarding safety in their patrol areas can be determined using bivariate analysis. 9
11 FINDINGS QUALITY OF LIFE IN JANESVILLE How satisfied are you with your quality of life in Janesville? The first question residents were asked measured overall satisfaction with their quality of life in Janesville. Eighty percent of residents reported being satisfied or very satisfied with their quality of life. Of that group, 20 percent were very satisfied. Thirteen percent indicated they were neutral on the question and only seven percent responded that they were unsatisfied or very unsatisfied. (Please see Figure and Table 1 for full results.) While this represents a three percent decline from 2009 in those who indicated they were satisfied or very satisfied, these results still show a high level of satisfaction with the quality of life in Janesville. 10
12 Figure 1. How satisfied are you with your quality of life in Janesville? 13% 6% 1% 20% Very Satisfied Satisfied Neutral Unsatisfied Very Unsatisfied 60% Table 1: Quality of Life in Janesville Satisfaction Percent Very Satisfied 20% Satisfied 60% Neutral 13% Unsatisfied 6% Very Unsatisfied 1% 11
13 PERCEPTIONS OF SAFETY IN JANESVILLE How safe do you feel in Janesville? Respondents were asked to indicate how safe they felt in Janesville under a wide-range of circumstances. (Please see Figure and Table 2 for full results. 7 ) Overall, these findings suggest that residents find Janesville to be a safe place to live, work and recreate with strong majorities in most categories responding that they feel safe or very safe. As is shown in Table 2 the only items where the percent of residents who felt unsafe exceeded 10 percent had to do with walking in or out of their neighborhood at night. For all of the other items, including walking in and out of their neighborhood during the day, driving, shopping, and being in city parks, over 70 percent reported feeling safe. The 2015 results are similar to those in A few notable differences included the fact that people were more likely to say they felt very safe walking around outside their neighborhood during the day now than they did in 2009 (22% to 9%) and walking around their own neighborhood at night (21% to 11%). In both years the only item where a large number of people reported feeling unsafe was walking outside of their neighborhood at night. 7 The response categories safe and very safe were combined into one variable in the figure. The same was done with unsafe and very unsafe. The don t know variable was also excluded from the figure. The table includes all categories in their original format. 12
14 Figure 2. How safe do you feel under the following conditions? 100% 90% 80% 70% 60% 50% "Safe" and "Very Safe" "Neutral" "Unsafe" and "Very Unsafe" 40% 30% 20% 10% 0% Note: The Don t Know Category is excluded from this graph. Table 2: Safety in Janesville Conditions Very Safe Safe Neutral Unsafe Very Unsafe Don't Know 1 Walking in Neighborhood: Day 66% 29% 3% 2% <1% Walking in Neighborhood: Night 21% 45% 18% 13% 2% <1% 3 Walking Out of Neighborhood: Day 22% 51% 18% 8% <1% <1% 4 Walking Out of Neighborhood: Night 3% 24% 35% 27% 8% 3% 5 Public Schools 27% 43% 14% 4% <1% 17% 6 Shopping 39% 53% 8% 1% <1% <1% 7 Driving: Day 53% 39% 5% 3% 1% Driving: Night 28% 51% 14% 5% 1% <1% 9 Your Workplace 44% 33% 11% 3% <1% 9% 10 City Parks 22% 56% 16% 3% <1% 4% 13
15 IMPORTANCE OF SERVICES How important are certain services provided by the Janesville Police Department? Given that the Police Department provides many services, respondents were asked to rate both the importance of these services as well as how well they felt the Department performed these services. In regard to importance, a few trends emerged in the data. (Please see Figure and Table 3 for full results. 8 ) While residents felt strongly that all services were important, there were some where threequarters or more of respondents indicated that they were very important. These included investigating/solving crimes, responding to calls for service, enforcing drug laws, drug, alcohol, and gang education and enforcing alcohol laws. A majority also found community policing with patrols and enforcing juvenile laws as very important. Other items such as enforcing quality of life issues, enforcing traffic laws, and crime prevention services were also seen as important but responses were more likely to be split between very important and somewhat important. Fifty four percent of residents responded that enforcing parking laws were not very important or not important at all. In 2009, this item also had limited support with 44 percent saying that enforcing parking laws was not very important. Enforcing traffic laws also had less support in 2009 with 20 percent saying it wasn t important. One item where there was significant difference would be in regard to the importance of enforcing juvenile laws. In 2009, 15 percent said that these were not very important while in 2015 only four percent said the same. 8 The response categories somewhat important and very important were combined into one variable in the figure. The same was done with not very important and not at all important. The don t know variable was also excluded from the figure. The table includes all categories in their original format. 14
16 Figure 3: Importance of Services 100% 90% 80% 70% 60% 50% 40% 30% 20% "Very Important" and "Somewhat Important" "Not Very Important" and "Not at All Important" 10% 0% Note: The Don t Know Category is excluded from this graph. Table 3: Importance of Services Services Very Somewhat Not Very Not at All Don't Know Important Important Important Important 1 Alcohol, Drug, Gang Education 75% 18% 2% <1% 4% 2 Community Policing w/ Patrols 65% 32% 2% <1% 1% 3 Enforcing Alcohol Laws 74% 23% 2% <1% 1% 4 Enforcing Juvenile Laws 58% 36% 4% <1% 2% 5 Enforcing Drug Laws 79% 17% 2% 1% <1% 6 Enforcing Parking Laws 11% 33% 40% 14% 2% 7 Enforcing Quality of Life Issues 30% 51% 15% 2% 2% 8 Enforcing Traffic Laws 34% 52% 13% 1% <1% 9 Investigating/Solving Crimes 96% 2% <1% --- 1% 10 Crime Prevention Services 48% 43% 6% 1% 1% 11 Responding to Calls for Service 92% 6% <1% --- 2% 15
17 PERFORMANCE OF SERVICES How well does the Janesville Police Department perform certain services? In addition to asking residents what services they felt were important, they were also asked to evaluate the performance of the Janesville Police Department on how well it provided those services. (Please see Figure and Table 4 for full results.) A majority of residents reported that the department performance was good or very good in regard to community policing with patrols, enforcing alcohol laws, enforcing traffic laws, investigating/solving crimes, and responding to calls for service. Just over 40 percent positively evaluated alcohol, drug and gang education, enforcing juvenile laws, enforcing quality of life issues, and crime prevention services. The item with the least support was enforcing parking laws. Only 35 percent evaluated this positively. However, the fact that a majority of respondents felt that parking law enforcement was not very important, may be driving this evaluation. There were no items where more than 14 percent evaluated performance as poor or very poor. When looking at how these evaluations compared to 2009, it is important to highlight the fact that on several of the items the department s performance was evaluated more positively in There was a 10 percent or greater increase in the percent who evaluated the following services positively: Community policing, enforcing juvenile laws, enforcing drug laws, enforcing parking laws, enforcing quality of life issues, enforcing traffic laws, and responding to calls for service. It is important to note that on each item roughly one quarter to one half of respondents were either neutral or indicated they don t know how well the Department performs. This suggests that many respondents may be unfamiliar with the activities of the Department and/or have no experience with services they were asked to evaluate. However, it is interesting that in 2009 there were some items where close to 75 percent indicated they were neutral or unfamiliar. This suggests that the department has done a better job educating residents about its programs and may have increased citizen interaction with the department through them. 16
18 Figure 4: Performance of Services 100% 90% 80% 70% 60% 50% "Very Good" and "Good" "Neutral" "Poor" and "Very Poor" "Don't Know" 40% 30% 20% 10% 0% Table 4: Performance of Services Conditions Very Good Good Neutral Poor Very Poor Don't Know 1 Alcohol, Drug, Gang Education 11% 32% 14% 4% 2% 37% 2 Community Policing w/ Patrols 14% 45% 20% 6% 2% 13% 3 Enforcing Alcohol Laws 18% 42% 14% 6% 3% 17% 4 Enforcing Juvenile Laws 11% 33% 15% 7% 4% 30% 5 Enforcing Drug Laws 17% 36% 12% 9% 5% 20% 6 Enforcing Parking Laws 8% 27% 30% 6% 3% 26% 7 Enforcing Quality of Life Issues 10% 36% 23% 9% 4% 18% 8 Enforcing Traffic Laws 15% 44% 18% 7% 3% 13% 9 Investigating/Solving Crimes 20% 37% 13% 3% 3% 23% 10 Crime Prevention Services 10% 31% 23% 6% 3% 27% 11 Responding to Calls for Service 28% 38% 9% 3% 2% 19% 17
19 IMPORTANCE OF EXISTING AND PROPOSED PROGRAMS How important are the existing or proposed programs managed by the Janesville Police Department? The Police Department was interested in learning which of its existing or proposed programs were seen as important by Janesville residents. The survey asked respondents to evaluate the importance of 12 different programs including Citizen Academy, National Night Out, the S.W.A.T. team, and Responding to 911 calls. (Please see Figure and Table 5 for full results 9.) Not surprisingly, responding to 911 calls was deemed very important by 92 percent of residents. Eighty percent or more agreed that two other items, crime prevention and the street crimes unit, were very important. The other services where a majority (over 60 percent) replied that they were very important were the canine unit, school liaison officers, and S.W.A.T. Team. Other programs such as bike patrol, S.A.F.E., and National Night Out, showed strong support, but less than the ones discussed above. The programs that received the least support, Citizen Academy, Honor Guard, and Youth Explorer, were also the programs that the highest percent (approximately one third) of respondents reported they were least familiar with. Not surprisingly, residents prioritize services they see as directly reactive to criminal activity or crime prevention. There was a 10 percent or greater increase in relative importance of several services from 2009 to These include bike patrol, citizen academy, honor guard, national night out and youth explorer. Interestingly the percent of residents who reported that the S.W.A.T. Team was very important increased from 34 percent to 61 percent. 9 The response categories somewhat important and very important were combined into one variable in the figure. The same was done with not very important and not at all important. The don t know variable was included in this figure because the percent of respondents indicating they were unable to evaluate was relatively high for each condition. The table includes all categories in their original format. 18
20 Figure 5. How important do you believe the following programs/services are? 100% 90% 80% 70% 60% 50% 40% "Very Important" and "Somewhat Important" "Not Very Important" and "Not at All Important" "Don't Know" 30% 20% 10% 0% Table 5: Importance of Services Programs Very Important Somewhat Not Very Not at All Don't Know Important Important Important 1 Bike Patrol 18% 52% 20% 6% 4% 2 Crime Prevention 80% 18% <1% <1% 1% 3 Citizen Academy 8% 29% 23% 5% 35% 4 Honor Guard 9% 33% 18% 5% 35% 5 Canine Unit 62% 31% 4% <1% 3% 6 S.A.F.E. 45% 43% 7% 3% 2% 7 School Liaison Officers 63% 29% 4% 2% 2% 8 Street Crimes Unit 85% 14% <1% <1% 1% 9 S.W.A.T. Team 61% 30% 5% 2% 1% 10 National Night Out 25% 38% 15% 6% 16% 11 Youth Explorer 19% 32% 14% 4% 31% 12 Responding to % 6% 1% --- 1% 19
21 LEVEL OF COMFORT How comfortable do you feel approaching police department officers and office staff? Janesville residents reported that they are quite comfortable approaching Department Officers and Office Staff. Eighty five percent indicated that they were comfortable or very comfortable doing so with close to half of respondents feeling very comfortable. Conversely only a small number, seven percent, felt uncomfortable or very uncomfortable doing the same. While the percent of residents who felt comfortable or very comfortable approaching department members declined five percent from 2009, the percent who felt very comfortable actually increased from 36 percent to 47 percent. (Please see Figure and Table 6 for full results.) 20
22 Figure 6. How comfortable do you feel approaching police department officers and office staff? 8% 4% 3% Very Comfortable Comfortable Neutral Uncomfortable Very Uncomfortable 38% 47% Table 6: Comfort Approaching Officers and Staff Comfort Level Percent Very Comfortable 47% Comfortable 38% Neutral 8% Uncomfortable 4% Very Uncomfortable 3% 21
23 PERCEPTIONS OF SAFETY BY PATROL AREA How safe do you feel in Janesville? (By Patrol Area) In order to look more closely at how safe Janesville residents feel in different areas of the city, the data originally presented and discussed in figure and table two were divided by patrol area. Some conditions presented and discussed in that section lend themselves to a breakdown by patrol area and others do not. Therefore, the discussion below will address a subset of the conditions. The conditions included are (1) walking in your neighborhood during the day; (2) walking in your neighborhood at night; (3) city schools 10 ; (4) driving during the day 11 ; and (5) driving at night 12. The findings discussed on the following pages suggest that there are many similarities across Patrol Areas in Janesville and that most residents feel relatively safe. Residents in Patrol Area 8 indicated the strongest perceptions of safety across all conditions compared with the other patrol areas. Additionally, residents in Patrol Areas 1, 2, 4, 5, and 7 felt very safe. Those respondents living in Patrol Areas 3 and 6 also indicated that they feel relatively safe, but less safe than those in the areas listed above. Please see Appendix C for a map of the City s patrol areas. 10 It is assumed that people would be most familiar with the schools in their area so this item was included in the discussion by patrol area. However, peoples perceptions about safety in schools may come from other sources and their evaluation of safety in schools might be broader. 11 This variable may not reflect driving in each patrol area per se, but since people would be leaving home and returning home feelings of safety might vary by the patrol area a person drives in the most. 12 This variable may not reflect driving in each patrol area per se, but since people would be leaving home and returning home feelings of safety might vary by patrol area a person drives in the most. 22
24 PERCEPTIONS OF SAFETY BY PATROL AREA How safe do you feel in Janesville? (Patrol Area 1) Responses from residents in Patrol Area 1 are very similar to the overall attitudes of survey respondents regarding feelings of personal safety. (Please see Figure and Table 7 for full results.) A majority of residents in this patrol area responded that they felt "very safe" or "safe" under all conditions except for "walking out of neighborhood at night." 13 The most notable difference between the responses overall and those living in Patrol Area 1 can be found when asked about "safety in Janesville public schools." Compared to the Janesville residents overall, 89 percent of Patrol Area 1 respondents indicated that they perceive Janesville Public Schools as "very safe" or "safe" compared to 70 percent of all respondents. As with residents overall those living in Patrol Area 1 feel much safer walking during the day, in general, and walking during the day in their own neighborhoods specifically. This becomes more evident when compared with walking at night. However, it is also noteworthy that residents in Patrol Area 1 feel as safe walking at night in their own neighborhood as they do walking during the day outside of their neighborhood. In fact, in this patrol area respondents indicated that they feel most "unsafe" when they are walking out of their neighborhood at night (29%). 13 It is worth noting that 45% of residents in Patrol Area 1 responded that they were "neutral" with respect to walking out of their neighborhood at night. 23
25 Figure 7: Patrol Area 1 How safe do you feel under the following conditions? 100% 90% 80% 70% 60% 50% 40% "Very Safe" and "Safe" "Neutral" "Unsafe" and "Very Unsafe" 30% 20% 10% 0% Note: The Don t Know Category is excluded from this graph. Table 7: Patrol Area 1 Conditions Very Safe Safe Neutral Unsafe Very Don't Know Unsafe 1 Walking in Neighborhood: Day 62% 30% 5% 3% Walking in Neighborhood: Night 16% 57% 13% 11% 3% Walking Out of Neighborhood: Day 17% 59% 17% 7% Walking Out of Neighborhood: Night 1% 21% 45% 23% 6% 4% 5 How safe are Janesville Public Schools 67% 22% % 6 Shopping 32% 57% 8% 3% Driving: Day 40% 47% 6% 3% 4% Driving: Night 30% 39% 21% 10% Your Workplace 36% 43% 18% 2% --- 1% 10 City Parks 18% 52% 18% 7% --- 5% 24
26 PERCEPTIONS OF SAFETY BY PATROL AREA How safe do you feel in Janesville? (Patrol Area 2) A majority of respondents from Patrol Area 2 also expressed that they feel "very safe" or "safe" under all circumstances except for "walking out of neighborhood at night." (Please see Figure and Table 8 for full results). In fact, compared with overall respondents, those in Patrol Area 2 were less likely to express feeling "unsafe" or "very unsafe" under any of the conditions listed (again, with the exception of walking out of their neighborhood at night). Thirty-seven percent of residents in Patrol Area 2 indicated that they felt unsafe walking at night out of their neighborhood, while 41 percent indicated that they were neutral about this condition. This finding is comparable to the survey respondents' overall perceptions of safety and walking at night with some marginal differences. 25
27 Figure 8: Patrol Area 2 How safe do you feel under the following conditions? 100% 90% 80% 70% 60% 50% 40% 30% "Very Safe" and "Safe" "Neutral" "Unsafe" and "Very Unsafe" 20% 10% 0% Note: The Don t Know Category is excluded from this graph. Table 8: Patrol Area 2 Conditions Very Safe Safe Neutral Unsafe Very Unsafe Don't Know 1 Walking in Neighborhood: Day 80% 19% % Walking in Neighborhood: Night 30% 49% 17% 3% 1% Walking Out of Neighborhood: Day 16% 55% 23% 5% 1% Walking Out of Neighborhood: Night 4% 17% 41% 33% 4% 1% 5 How safe are Janesville Public Schools 9% 73% 9% % 6 Shopping 36% 56% 7% --- 1% Driving: Day 66% 23% 9% --- 2% Driving: Night 38% 41% 15% 4% 2% Your Workplace 36% 32% 13% 3% % 10 City Parks 31% 43% 20% 2% --- 4% 26
28 PERCEPTIONS OF SAFETY BY PATROL AREA How safe do you feel in Janesville? (Patrol Area 3) When we examine responses from those who reside in Patrol Area 3, we find that a majority or greater feel "very safe" or "safe" under most all circumstances. (Please see Figure and Table 9 for full results). Similar to respondents overall, and respondents in the two previously discussed patrol areas, perceptions of safety declined significantly when asked about "walking out of neighborhood at night." Only 21 percent of respondents in this patrol area feel safe walking out of their own neighborhood at night, while almost two-thirds indicated that they felt "unsafe" or "very unsafe". Moreover, only slightly more respondents (26%) indicated that they feel some degree of safety when walking at night in their own neighborhoods. Thirty three percent of respondents indicated that they feel "unsafe" walking at night in their own neighborhood. In addition, we found respondents from this area more likely to express some concern about driving during the day and at night. Eighteen percent responded that they felt "unsafe" or "very unsafe" driving during the day, and 16 percent indicated that they felt unsafe driving at night. These findings differ with overall responses where less than ten percent of respondents indicated they felt "unsafe" or "very unsafe" when driving under any condition. 27
29 Figure 9: Patrol Area 3 How safe do you feel under the following conditions? 100% 90% 80% 70% 60% 50% "Very Safe" and "Safe" "Neutral" "Unsafe" and "Very Unsafe" 40% 30% 20% 10% 0% Note: The Don t Know Category is excluded from this graph. Table 9: Patrol Area 3 Conditions Very Safe Safe Neutral Unsafe Very Unsafe Don't Know 1 Walking in Neighborhood: Day 33% 67% Walking in Neighborhood: Night 13% 13% 41% 33% Walking Out of Neighborhood: Day 15% 42% 22% 21% Walking Out of Neighborhood: Night % 15% 36% 28% How safe are Janesville Public Schools % 45% Shopping 27% 68% 5% Driving: Day 36% 46% % 3% Driving: Night 19% 59% 6% 16% Your Workplace 31% 46% 12% % 10 City Parks 12% 61% 12% % 28
30 PERCEPTIONS OF SAFETY BY PATROL AREA How safe do you feel in Janesville? (Patrol Area 4) Once again, a majority of respondents in Patrol Area 4 indicate a high perception of safety under most conditions. (Please see Figure and Table 10 for full results.) However, similar to respondents in Patrol Area 3, residents in this area indicated that they do not feel as safe walking outside of their neighborhood at night, or walking at night in their own neighborhoods. Twenty-seven percent of respondents indicated that they do not feel safe walking in their own neighborhoods at night while 40% responded they feel unsafe walking outside of their neighborhood at night. In addition, 11 percent of respondents in this patrol area indicated that they feel unsafe walking outside of their own neighborhood during the day. 29
31 Figure 10: Patrol Area 4 How safe do you feel under the following conditions? 100% 90% 80% 70% 60% 50% 40% "Very Safe" and "Safe" "Neutral" "Unsafe" and "Very Unsafe" 30% 20% 10% 0% Note: The Don t Know Category is excluded from this graph. Table 10: Patrol Area 4 Conditions Very Safe Safe Neutral Unsafe Very Unsafe Don't Know 1 Walking in Neighborhood: Day 61% 20% 15% 4% Walking in Neighborhood: Night 19% 42% 12% 22% 5% Walking Out of Neighborhood: Day 27% 45% 15% 11% --- 2% 4 Walking Out of Neighborhood: Night 7% 28% 22% 33% 7% 3% 5 How safe are Janesville Public Schools 50% 8% 42% Shopping 37% 45% 16% 2% Driving: Day 53% 43% 3% --- 1% Driving: Night 36% 49% 11% 3% 1% Your Workplace 65% 17% 6% 5% --- 7% 10 City Parks 20% 58% 17% 5%
32 PERCEPTIONS OF SAFETY BY PATROL AREA How safe do you feel in Janesville? (Patrol Area 5) Residents in Patrol Area 5 who responded to the survey also indicated that they feel safe under most conditions. As with respondents overall, they are most likely to feel unsafe when walking at night. Seventeen percent of respondents indicated that they feel unsafe when walking at night in their own neighborhoods while 24 percent indicated that they feel unsafe walking at night outside of their neighborhood. 14 Perceptions about safety in Janesville Public Schools were notably different from other areas previously discussed and overall perceptions of public school safety. Seventeen percent of respondents in this patrol area indicated that they thought Janesville Public Schools are "unsafe." However, it should be noted that over two-thirds (69%) believed the schools to be a safe place. 14 "Unsafe" and "Very Unsafe" have been collapsed in this analysis. Only five percent of respondents indicated that they felt "very unsafe" walking at night out of their own neighborhood. 31
33 Figure 11: Patrol Area 5 How safe do you feel under the following conditions? 100% 90% 80% 70% 60% 50% 40% "Very Safe" and "Safe" "Neutral" "Unsafe" and "Very Unsafe" 30% 20% 10% 0% Table 11: Patrol Area 5 Note: The Don t Know Category is excluded from this graph. Conditions Very Safe Safe Neutral Unsafe Very Unsafe Don't Know 1 Walking in Neighborhood: Day 57% 38% --- 5% Walking in Neighborhood: Night 19% 52% 10% 17% --- 2% 3 Walking Out of Neighborhood: Day 22% 61% 17% Walking Out of Neighborhood: Night 2% 33% 41% 19% 5% How Safe are Janesville Public Schools 17% 52% 7% 17% --- 7% 6 Shopping 29% 60% 12% Driving: Day 46% 46% --- 8% Driving: Night 24% 60% 10% 6% Your Workplace 39% 39% 10% % 10 City Parks 19% 48% 33%
34 PERCEPTIONS OF SAFETY BY PATROL AREA How safe do you feel in Janesville? (Patrol Area 6) Respondents to the survey from Patrol Area 6 indicated that they generally feel safe in Janesville under most conditions. 15 As with residents in other areas, those who live in this patrol area did respond that they feel less safe walking outside of their neighborhood at night, and walking within their own neighborhood at night. For example, only thirty-eight percent of respondents stated that they feel safe walking in their own neighborhood at night, while significantly fewer (27%) stated that they feel safe walking outside of their own neighborhood at night. About the same proportion of residents in this area indicated that they feel unsafe or very unsafe walking in or outside of their own neighborhood after dark (27% and 26% respectively). 15 The results from Patrol Area 6 should be interpreted very cautiously. This area had a substantially lower response rate than the others in this survey. In fact, the total number of survey responses from Patrol Area 6 was 17. There was also some variation in responses to individual questions. The responses are reported here because it is important to include these data for purposes of transparency; however, given the very low number of responses the analysts chose not to weight the data for Patrol Area 6 and use the raw data instead in the cross-tabulations by area and perceptions of safety and in the cross-tabulation by area and level of comfort approaching Janesville Police Department Officers and Staff. 33
35 Figure 12: Patrol Area 6 How safe do you feel under the following conditions? 100% 90% 80% 70% 60% 50% 40% "Very Safe" and "Safe" "Neutral" "Unsafe" and "Very Unsafe" 30% 20% 10% 0% Note: The Don t Know Category is excluded from this graph. Table 12: Patrol Area 6 Conditions Very Safe Safe Neutral Unsafe Very Unsafe Don't Know 1 Walking in Neighborhood: Day 44% 37% 19% Walking in Neighborhood: Night 19% 19% 25% 25% 12% Walking Out of Neighborhood: Day 18% 56% 26% Walking Out of Neighborhood: Night 7% 20% 33% 20% 6% 13% 5 How Safe are Janesville Public Schools 31% 44% 6% 6% % 6 Shopping 38% 56% % 7 Driving: Day 50% 38% 12% Driving: Night 13% 53% 27% % 9 Your Workplace 27% 46% 18% 9% City Parks 13% 53% 20% --- 7% 6% 34
36 PERCEPTIONS OF SAFETY BY PATROL AREA How safe do you feel in Janesville? (Patrol Area 7) Respondents from Patrol Area 7 indicated a very high perception of safety across all questions asked except for walking at night and, to a much lesser degree, safety in the workplace. (Please see Figure and Table 13 for full results). Ten percent of respondents felt "unsafe" in the workplace. Overall, less than four percent of survey respondents indicated the same. With respect to the variables "walking in neighborhood at night" and "walking outside of neighborhood at night", 13 percent of respondents in this patrol area indicated that they feel unsafe in their own neighborhood, and 23 percent indicated the same when walking at night outside of their neighborhood. 35
37 Figure 13: Patrol Area 7 How safe do you feel under the following conditions? 100% 90% 80% 70% 60% 50% "Very Safe" and "Safe" "Neutral" "Unsafe" and "Very Unsafe" 40% 30% 20% 10% 0% Note: The Don t Know Category is excluded from this graph. Table 13: Patrol Area 7 Conditions Very Safe Safe Neutral Unsafe Very Unsafe Don't Know 1 Walking in Neighborhood: Day 71% 29% Walking in Neighborhood: Night 16% 54% 17% 13% Walking Out of Neighborhood: Day 22% 49% 24% 5% Walking Out of Neighborhood: Night 6% 22% 46% 17% 6% 3% 5 How safe are Janesville Public Schools 8% 67% 17% % 6 Shopping 42% 53% 5% Driving: Day 49% 37% 8% 6% Driving: Night 27% 53% 12% 8% Your Workplace 41% 35% 4% 10% --- 9% 10 City Parks 17% 74% 9%
38 PERCEPTIONS OF SAFETY BY PATROL AREA How safe do you feel in Janesville? (Patrol Area 8) Residents in Patrol Area 8 indicated the strongest perceptions of safety across all conditions compared with the other patrol areas. (Please see Figure and Table 14 for full results). However, some of these differences are only marginal. Some striking differences can be found when we look at "walking in own neighborhood at night." Unlike previously discussed patrol areas (e.g., areas 1, 3, 4, 5, 6, and 7), only eight percent of respondents from this patrol area feel "unsafe" when walking at night in their own neighborhood. Responses were more similar to previous areas discussed and overall findings when asked about perceptions of safety walking out of neighborhood at night. Thirty-two percent of respondents in Patrol Area 8 indicated that they felt safe walking at night outside of their own neighborhood and almost the same percentage (31) responded they feel unsafe walking at night outside of their own neighborhood. This is comparable to the overall findings and to findings in other patrol areas Again, "Unsafe" and "Very Unsafe" have been collapsed when discussing this finding. 37
39 Figure 14: Patrol Area 8 How safe do you feel under the following conditions? 100% 90% 80% 70% 60% "Very Safe" and "Safe" "Neutral" 50% 40% "Unsafe" and "Very Unsafe" 30% 20% 10% 0% Note: The Don t Know Category is excluded from this graph. Table 14: Patrol Area 8 Conditions Very Safe Safe Neutral Unsafe Very Unsafe Don't Know 1 Walking in Neighborhood: Day 73% 25% 2% <1% Walking in Neighborhood: Night 29% 50% 13% 8% Walking Out of Neighborhood: Day 29% 47% 17% 7% <1% Walking Out of Neighborhood: Night 3% 29% 35% 24% 7% 2% 5 How Safe are Janesville Public Schools 13% 63% 6% % 6 Shopping 45% 51% 3% 1% Driving: Day 54% 41% 5% <1% Driving: Night 30% 52% 15% 3% <1% Your Workplace 54% 29% 6% 2% --- 9% 10 City Parks 30% 55% 11% 3% <1% 1% 38
40 LEVEL OF COMFORT BY PATROL AREA As previously reported, citizens in the City of Janesville feel very comfortable approaching officers and staff. Overall, three-quarters of respondents to this question on the survey indicated that they felt a strong degree of comfort approaching members of the department. Examining responses across patrol areas we find very similar results. (Please see Figure and Table 15). Patrol Areas 3 and 8 reported the most comfort approaching officers and staff (97% and 92% respectively). The remaining patrol areas reported levels of comfort ranging between 74 and 87 percent. All areas, however, did include a proportion of discomfort with approaching Janesville Police Department Officers and Staff. For example, 14 percent of respondents in Patrol Area 5 felt uncomfortable, 12 percent in Patrol Area 1 felt uncomfortable, and 11 percent in Patrol Area 4 responded the same For this discussion the categories "Uncomfortable" and "Very Uncomfortable" have been collapsed. 39
41 Figure 15: Comfort Approaching Police Officers and Staff 100% 90% 80% 70% 60% 50% 40% 30% 20% Very Comfortable Comfortable Neutral Uncomfortable Very Uncomfortable 10% 0% Patrol Area 1 Patrol Area 2 Patrol Area 3 Patrol Area 4 Patrol Area 5 Patrol Area 6 Patrol Area 7 Patrol Area 8 Table 15: Comfort Approaching Police Officers and Staff Patrol Area Very Comfortable Comfortable Neutral Uncomfortable Very Uncomfortable Patrol Area 1 52% 30% 6% 6% 6% Patrol Area 2 36% 47% 10% 6% --- Patrol Area 3 46% 51% --- 3% --- Patrol Area 4 44% 38% 7% 11% --- Patrol Area 5 45% 29% 12% 10% 4% Patrol Area 6 53% 29% 13% 2% 3% Patrol Area 7 56% 31% 8% 3% 2% Patrol Area 8 53% 36% 7% 2% <1% 40
42 OPEN-ENDED QUESTIONS What do you think will be the two biggest problems that the Janesville Police Department will face within the next five years? Respondents were asked to identify what they believed to be the two biggest problems facing the Janesville Police Department over the next five years. The two most often cited problems by residents were issues and crimes related to substance abuse (including alcohol abuse) and issues and crimes related to gang activity. In addition to these concerns, respondents identified property crimes as an important persistent issue, followed by violent crime, and budgetary issues (this included Police Department and City budget concerns). Juvenile crime and traffic crimes were also mentioned but with much less frequency than those above. There were also a number of unique problems or individual specific problems mentioned such as a malfunctioning stoplight etc., If you could change one thing about the Janesville Police Department what would it be? Responses to the final two open-ended questions were much more idiosyncratic and difficult to quantify. However, with respect to "change one thing" a number of respondents indicated that there should either be more police officers in the department, and/or more gender and racial/ethnic diversity in the police department. Several respondents wrote that "nothing needed to be changed" or that "the department is doing a good job." Some continued to note concerns with biggest problems (e.g., drug or gang related activities and crimes) in their responses to changing one thing about the department. It should also be noted that several respondents expressed concern about public perceptions of the police given recent incidents nationally (Ferguson, MO, etc.,) that have cast policing in a bad light. 41
43 What additional programs or services would you like the Janesville Police Department to provide? Once again we found a lot of variation in responses to the question, "what additional programs or services would you like the Janesville Police Department to provide?" While several respondents indicated that they would like to see more programs initiated to handle drug and gang criminal activity, a number of responses were very specific to individual needs. For example, programs for women and personal safety, more education at elementary and secondary schools with respect to drug and alcohol awareness, and more interaction with the community in general (or with specific projects). We also find that many responded with their compliments to the department. Several noted that they thought the department was already doing a good/great job or that they couldn't think anything because of the programs and services the department already provides. 42
44 CONCLUSION Generally, Janesville residents find that the city provides a good quality of life and that it is a safe place to live, work, and play. These findings are consistent with the findings in 2009 and fairly consistent across patrol areas. Residents are satisfied with the services that the Janesville Police Department offers and with the delivery of those services. One area where residents note that there is room for improvement is with respect to communication of services and programs offered by the department. Additionally, residents state that they would like to see greater interaction between the department and community. Residents would also like to see programs directed at teens and young children expanded. As was the case in 2009, residents see substance abuse, including alcohol, as an important community problem. Some residents commented that they would like to see more gender and racial diversity in the department staff and officers. In addition to addressing the citizen concerns mentioned above, it is important for the department to work with community leaders in Patrol Area 6 to develop strategies to gain more comprehensive feedback from its residents. While there are areas where the public recommended more attention the general sentiment is quite positive. Overall, this community survey reaffirmed the support that residents showed the department in 2009 and in some areas demonstrated stronger support than found in the earlier survey. 43

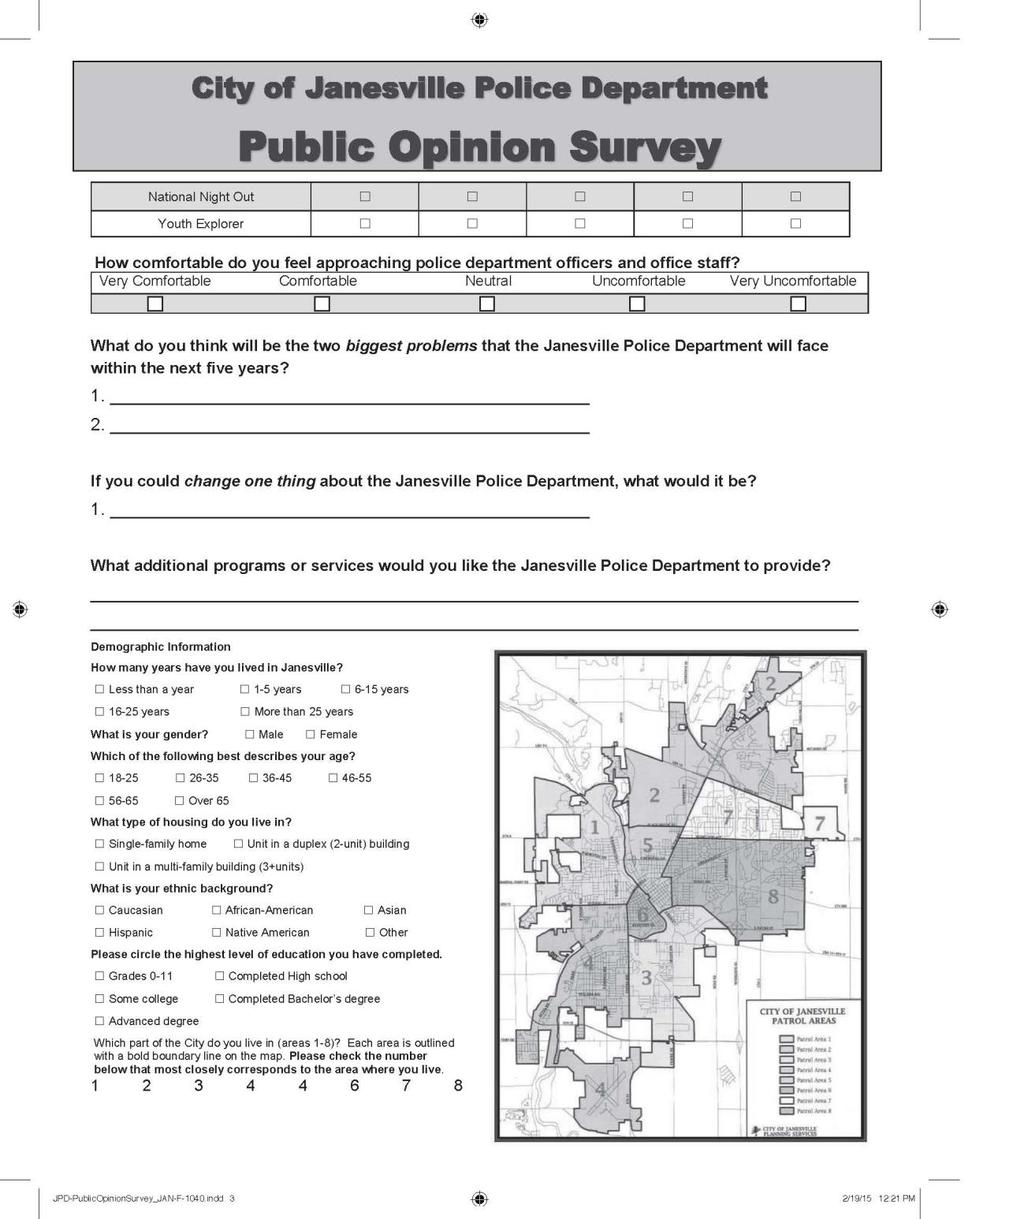
45 APPENDIX A. SURVEY INSTRUMENT 44
46 45
47 46
48 47
49 APPENDIX B. WEIGHTED DATED & DEMOGRAPHIC PROFILE Overall Demographic Profile of Respondents (Unweighted and Weighted) Age Over 65 Unweighted 1% 7% 10% 18% 22% 42% Weighted 11% 26% 27% 21% 8% 7% Gender Male Female Unweighted 46% 54% Weighted 41% 59% Race/ Ethnicity African- Caucasian American Asian Hispanic/ Latino Native American Other Unweighted 97% <1% <1% <1% 1% <1% Weighted 95% <1% 1% 2% 1% <1% Grades H.S. Some Bach. Post- Education 0-11 Diploma College Degree Bacc. Unweighted 2% 28% 29% 22% 19% Weighted <1% 17% 28% 31% 23% Years Living Less than More Janesville 1 yr than 25 Unweighted 1% 6% 13% 12% 68% Weighted 1% 12% 19% 21% 47% Single Unit in Unit in Housing Family Duplex Multi Unweighted 91% 8% 1% Weighted 93% 7% <1% Patrol Area Unweighted 15% 14% 5% 12% 7% 2% 15% 30% Weighted 13% 14% 6% 14% 8% 1% 16% 28% Note: The data were weighted by the variable "age" using the City of Janesville Population estimate for 2010 from the U.S. Census Bureau. 48

50 APPENDIX C. PATROL AREA MAP 49
Vancouver Police Community Policing Assessment Report Residential Survey Results NRG Research Group
 Vancouver Police Community Policing Assessment Report Residential Survey Results 2017 NRG Research Group www.nrgresearchgroup.com April 2, 2018 1 Page 2 TABLE OF CONTENTS A. EXECUTIVE SUMMARY 3 B. SURVEY
R Eagleton Institute of Politics Center for Public Interest Polling
 2002 SURVEY OF NEW BRUNSWICK RESIDENTS Conducted for: Conducted by: R Eagleton Institute of Politics Center for Public Interest Polling Data Collection: May 2002 02-02 EXECUTIVE SUMMARY TABLE OF CONTENTS
Community Perception Survey
 Building Relationships of Trust Community Perception Survey Thank you for participating in this short survey. Your contribution will help us improve our service to the community and make us more effective
EXECUTIVE SUMMARY: CITY OF BELLINGHAM RESIDENTIAL SURVEY REPORT
 EXECUTIVE SUMMARY: CITY OF BELLINGHAM RESIDENTIAL SURVEY REPORT CENTER FOR ECONOMIC AND BUSINESS RESEARCH February 21, 2017 Prepared for The City of Bellingham Author(s) Isabel Vassiliadis Hart Hodges,
BLUE STAR HIGHWAY COMMUNITY OPINION SURVEY REPORT
 BLUE STAR HIGHWAY COMMUNITY OPINION SURVEY REPORT MAY 2011 BLUE STAR HIGHWAY: DOUGLAS COMMUNITY OPINION SURVEY On March 1st, 2011 the Douglas Advisory Committee and the City of Douglas issued opinion surveys
ANNUAL SURVEY REPORT: BELARUS
 ANNUAL SURVEY REPORT: BELARUS 2 nd Wave (Spring 2017) OPEN Neighbourhood Communicating for a stronger partnership: connecting with citizens across the Eastern Neighbourhood June 2017 1/44 TABLE OF CONTENTS
Public Safety Survey
 Public Safety Survey Penticton Area Final Report Rupi Kandola Niki Huitson Irwin Cohen Darryl Plecas School of Criminology and Criminal Justice University College of the Fraser Valley February 2007-1 -
2017 Citizen Satisfaction Survey City of Shawnee, Kansas
 2017 Citizen Satisfaction Survey City of Shawnee, Kansas Presented by March 2017 ETC Institute A National Leader in Market Research for Local Governmental Organizations helping city and county governments
Regional Municipality of Wood Buffalo 2014 RCMP and Bylaw Services Citizen Telephone Survey Final Report
 Regional Municipality of Wood Buffalo 2014 RCMP and Bylaw Services Citizen Telephone Survey Final Report December 19, 2014 TABLE OF CONTENTS 1.0 SUMMARY OF FINDINGS 3 2.0 PROJECT BACKGROUND 8 3.0 METHODOLOGY
PUBLIC SURVEY 2015 Report Presentation
 PUBLIC SURVEY 2015 Report Presentation Public Survey on the Ottawa Police Service Presentation, September 28, 2015 Objectives and Methodology Objectives and Methodology Context and Objectives The Ottawa
Public Safety Survey
 Public Safety Survey Terrace Area Final Report Rocky Sharma Niki Huitson Irwin Cohen Darryl Plecas School of Criminology and Criminal Justice University College of the Fraser Valley February 2007-1 - Terrace
QUALITY OF LIFE QUALITY OF LIFE SURVEY 2016 Executive Summary and Research Design
 QUALITY OF LIFE QUALITY OF LIFE SURVEY 2016 Executive Summary and Research Design Quality of Life Survey 2016 Executive Summary and Research Design A joint project between the following New Zealand councils
PERSPECTIVES ON CRIME AND POLICING IN KENTVILLE, NOVA SCOTIA, 1997: A SURVEY OF RESIDENTS AND BUSINESS OPERATORS
 PERSPECTIVES ON CRIME AND POLICING IN KENTVILLE, NOVA SCOTIA, 1997: A SURVEY OF RESIDENTS AND BUSINESS OPERATORS Anthony Thomson Acadia University and Mark Mander Kentville Police Service MAY, 1997 I.
Communitypolicingfirstnationsa pproachestopublicsafetypractici ngtrustandcommunitypridemoha
 Communitypolicingfirstnationsa pproachestopublicsafetypractici ngtrustandcommunitypridemoha Public Safety Consultation Project: Community Perspectives on Policing and Crime within the Mohawk wkwayoflifefghjklzxcvbnmqwpri
City of Bellingham Residential Survey 2013
 APPENDICES City of Bellingham Residential Survey 2013 January 2014 Pamela Jull, PhD Rachel Williams, MA Joyce Prigot, PhD Carol Lavoie P.O. Box 1193 1116 Key Street Suite 203 Bellingham, Washington 98227
Vancouver Police Community Policing Assessment Report
 Vancouver Police Community Policing Assessment Report Residential Survey Results FINAL DRAFT NRG Research Group Adam Di Paula & Richard Elias www.nrgresearchgroup.com 3/17/2009 VPD Community Policing Report
General Survey 2015 Winnipeg Police Service A Culture of Safety for All
 General Survey 2015 Winnipeg Police Service A Culture of Safety for All THE WINNIPEG POLICE SERVICE GENERAL SURVEY, 2015 The 2015 Winnipeg Police Service public opinion survey was conducted between September
Thornbury Township Police Services Survey: Initial Data Analyses and Key Findings
 Thornbury Township Police Services Survey: Initial Data Analyses and Key Findings 1160 McDermott Drive, Suite 101, West Chester, PA 19383 Phone: 610-425-7448, E-Mail: lbernotsky@wcupa.edu April 2012 2
ANNUAL SURVEY REPORT: ARMENIA
 ANNUAL SURVEY REPORT: ARMENIA 2 nd Wave (Spring 2017) OPEN Neighbourhood Communicating for a stronger partnership: connecting with citizens across the Eastern Neighbourhood June 2017 ANNUAL SURVEY REPORT,
Op Data, 2001: Red Hook, Brooklyn
 Research A Public/Private Partnership with the New York State Unified Court System Op Data, 2001: Red Hook, Brooklyn Community Assessment and Perceptions of Quality of Life, Safety and Services Written
The City of Cape Coral, Florida
 PO Box 150027 Cape Coral, FL 33915 T: (239) 574-0447 F: (239) 574-0452 www.capegov.org The City of Cape Coral, Florida 2007 The National Citizen Survey National Research Center, Inc. 3005 30 th St. Boulder,
Public Attitudes Survey Bulletin
 An Garda Síochána Public Attitudes Survey Bulletin 218 Research conducted by This bulletin presents high level findings from the third quarter of the Public Attitudes Survey conducted between July and
ANNUAL SURVEY REPORT: AZERBAIJAN
 ANNUAL SURVEY REPORT: AZERBAIJAN 2 nd Wave (Spring 2017) OPEN Neighbourhood Communicating for a stronger partnership: connecting with citizens across the Eastern Neighbourhood June 2017 TABLE OF CONTENTS
Community perceptions of migrants and immigration. D e c e m b e r
 Community perceptions of migrants and immigration D e c e m b e r 0 1 OBJECTIVES AND SUMMARY OBJECTIVES The purpose of this research is to build an evidence base and track community attitudes towards migrants
Rural Pulse 2016 RURAL PULSE RESEARCH. Rural/Urban Findings June 2016
 Rural Pulse 2016 RURAL PULSE RESEARCH Rural/Urban Findings June 2016 Contents Executive Summary Project Goals and Objectives 9 Methodology 10 Demographics 12 Research Findings 17 Appendix Prepared by Russell
Young Voters in the 2010 Elections
 Young Voters in the 2010 Elections By CIRCLE Staff November 9, 2010 This CIRCLE fact sheet summarizes important findings from the 2010 National House Exit Polls conducted by Edison Research. The respondents
The 2016 Minnesota Crime Victimization Survey
 The 2016 Minnesota Crime Victimization Survey Executive Summary and Overview: August 2017 Funded by the Bureau of Justice Statistics Grant Number 2015-BJ-CX-K020 The opinions, findings, and conclusions
Edmonton Police Service 2011 Citizen Survey
 Edmonton Police Service 2011 Citizen Survey May 2012 2012 Edmonton Police Service First Published 2012 Edmonton Police Service 9620 103A Avenue Edmonton, Alberta T5H 0H7 CANADA Phone (780) 421-3333 Fax
2017 Citizen Survey of Police Surveys Citizen Survey Introduction 1
 Citizen Survey Introduction 1 Table of Contents 2017 Citizen Survey Introduction... 3 Respondents Profile... 4 Key Questions for 2017... 6 Key Questions Five Year Comparison... 10 Citizens Contact with
NOVEMBER visioning survey results
 NOVEMBER 2016 visioning survey results 2 Denveright SECTION 1 SURVEY INTRODUCTION OVERVIEW Our community is undertaking an effort that builds upon our successes and proud traditions to design the future
PUBLIC CONTACT WITH AND PERCEPTIONS REGARDING POLICE IN PORTLAND, OREGON 2013
 PUBLIC CONTACT WITH AND PERCEPTIONS REGARDING POLICE IN PORTLAND, OREGON 2013 Brian Renauer, Ph.D. Kimberly Kahn, Ph.D. Kris Henning, Ph.D. Portland Police Bureau Liaison Greg Stewart, MS, Sgt. Criminal
MEREDITH COLLEGE POLL September 18-22, 2016
 Women in politics and law enforcement With approximately three weeks until Election Day and the possibility that Democrat Hillary Clinton will be elected as the first woman president in our nation s history,
IIRC Stakeholder Feedback Survey
 IIRC Stakeholder Feedback Survey The Survey Summary of approach The IIRC Stakeholder Feedback Survey was sent on 25 May 2016 to around 10,000 stakeholders taken from the IIRC s central database. It was
Motivations and Barriers: Exploring Voting Behaviour in British Columbia
 Motivations and Barriers: Exploring Voting Behaviour in British Columbia January 2010 BC STATS Page i Revised April 21st, 2010 Executive Summary Building on the Post-Election Voter/Non-Voter Satisfaction
Deliberative Polling for Summit Public Schools. Voting Rights and Being Informed REPORT 1
 Deliberative Polling for Summit Public Schools Voting Rights and Being Informed REPORT 1 1 This report was prepared by the students of COMM138/CSRE38 held Winter 2016. The class and the Deliberative Polling
The National Citizen Survey
 CITY OF SARASOTA, FLORIDA 2008 3005 30th Street 777 North Capitol Street NE, Suite 500 Boulder, CO 80301 Washington, DC 20002 ww.n-r-c.com 303-444-7863 www.icma.org 202-289-ICMA P U B L I C S A F E T Y
Neighborhood Problems and Quality of Life
 Survey Research Unit School of Public Affairs Baruch College / CUNY 1 Bernard Baruch Way New York, NY 10010 Neighborhood Problems and Quality of Life A survey conducted in collaboration with November 2004
Social Indicators and Trends 2014
 Social Indicators and Trends 214 Healthy City for All Targets By 225: increase Vancouver residents sense of belonging by 1 per cent. By 225: increase Vancouver residents sense of safety by 1 per cent.
Telephone Survey. Contents *
 Telephone Survey Contents * Tables... 2 Figures... 2 Introduction... 4 Survey Questionnaire... 4 Sampling Methods... 5 Study Population... 5 Sample Size... 6 Survey Procedures... 6 Data Analysis Method...
WISCONSIN ECONOMIC SCORECARD
 RESEARCH BRIEF Q1 2014 Joseph Cera, PhD CUIR Survey Center University of Wisconsin Milwaukee WISCONSIN ECONOMIC SCORECARD The Wisconsin Economic Scorecard is a quarterly poll of Wisconsin residents conducted
The Sudan Consortium African and International Civil Society Action for Sudan. Sudan Public Opinion Poll Khartoum State
 The Sudan Consortium African and International Civil Society Action for Sudan Sudan Public Opinion Poll Khartoum State April 2015 1 Table of Contents 1. Introduction... 3 1.1 Background... 3 1.2 Sample
Citizen Opinion Survey
 Citizen Opinion Survey EXECUTIVE SUMMARY Conducted for Sarasota County Dr. Susan A. MacManus Department of Government and International Affairs University of South Florida Tampa, Florida EXECUTIVE SUMMARY
Californians. healthy communities. ppic statewide survey FEBRUARY in collaboration with The California Endowment CONTENTS
 ppic statewide survey FEBRUARY 2011 Californians & healthy communities Mark Baldassare Dean Bonner Sonja Petek Nicole Willcoxon CONTENTS About the Survey 2 Press Release 3 Residents Perceptions & Attitudes
UTS:IPPG Project Team. Project Director: Associate Professor Roberta Ryan, Director IPPG. Project Manager: Catherine Hastings, Research Officer
 IPPG Project Team Project Director: Associate Professor Roberta Ryan, Director IPPG Project Manager: Catherine Hastings, Research Officer Research Assistance: Theresa Alvarez, Research Assistant Acknowledgements
Special Eurobarometer 469. Report
 Integration of immigrants in the European Union Survey requested by the European Commission, Directorate-General for Migration and Home Affairs and co-ordinated by the Directorate-General for Communication
Public Attitudes Survey Bulletin
 An Garda Síochána Public Attitudes Survey Bulletin 218 Research conducted by This bulletin presents high level findings from the second quarter of the Public Attitudes Survey conducted between April and
Miami Township Resident Perception Survey
 Miami Township Resident Perception Survey Center for Urban & Public Affairs Wright State University 3640 Colonel Glenn Hwy Dayton, OH 45435 (937) 775-3725 Table of Contents Table of Figures... ii Introduction...
Outcome Evaluation Safe Passage Home--Oakland
 I. Background Outcome Evaluation Safe Passage Home--Oakland Oakland s Safe Passage represents the confluence of several different movements focusing on child health and safety in East Oakland, a low-income,
Community Perceptions of Policing in Pasadena
 Community Perceptions of Policing in Pasadena Lisa M. Graziano, PhD School of Criminal Justice and Criminalistics California State University, Los Angeles 5151 State University Drive Los Angeles, California
Executive Summary of Texans Attitudes toward Immigrants, Immigration, Border Security, Trump s Policy Proposals, and the Political Environment
 2017 of Texans Attitudes toward Immigrants, Immigration, Border Security, Trump s Policy Proposals, and the Political Environment Immigration and Border Security regularly rank at or near the top of the
LOUISVILLE METRO POLICE DEPARTMENT
 LOUISVILLE METRO POLICE DEPARTMENT CITIZENS ATTITUDE SURVEY Deborah G. Keeling, Ph.D. Kristin M. Swartz, Ph.D. Department of Justice Administration University of Louisville April 2014 INTRODUCTION It is
NAZI VICTIMS NOW RESIDING IN THE UNITED STATES: FINDINGS FROM THE NATIONAL JEWISH POPULATION SURVEY A UNITED JEWISH COMMUNITIES REPORT
 NAZI VICTIMS NOW RESIDING IN THE UNITED STATES: FINDINGS FROM THE NATIONAL JEWISH POPULATION SURVEY 2000-01 A UNITED JEWISH COMMUNITIES REPORT December, 2003 INTRODUCTION This April marked the fifty-eighth
Elections Alberta Survey of Voters and Non-Voters
 Elections Alberta Survey of Voters and Non-Voters RESEARCH REPORT July 17, 2008 460, 10055 106 St, Edmonton, Alberta T5J 2Y2 Tel: 780.423.0708 Fax: 780.425.0400 www.legermarketing.com 1 SUMMARY AND CONCLUSIONS
ANNUAL SURVEY REPORT: REGIONAL OVERVIEW
 ANNUAL SURVEY REPORT: REGIONAL OVERVIEW 2nd Wave (Spring 2017) OPEN Neighbourhood Communicating for a stronger partnership: connecting with citizens across the Eastern Neighbourhood June 2017 TABLE OF
Progressives in Alberta
 Progressives in Alberta Public opinion on policy, political leaders, and the province s political identity Conducted for Progress Alberta Report prepared by David Coletto, PhD Methodology This study was
Police Firearms Survey
 Police Firearms Survey Final Report Prepared for: Scottish Police Authority Prepared by: TNS JN:127475 Police Firearms Survey TNS 09.12.2014 JN127475 Contents 1. Background and objectives 3 2. Methodology
It's Still the Economy
 It's Still the Economy County Officials Views on the Economy in 2010 Richard L. Clark, Ph.D Prepared in cooperation with The National Association of Counties Carl Vinson Institute of Government University
WISCONSIN ECONOMIC SCORECARD
 RESEARCH BRIEF Q4 2013 Joseph Cera, PhD CUIR Survey Center University of Wisconsin Milwaukee WISCONSIN ECONOMIC SCORECARD The Wisconsin Economic Scorecard is a quarterly poll of Wisconsin residents conducted
CITY OF BELLINGHAM RESIDENTIAL SURVEY REPORT
 CITY OF BELLINGHAM RESIDENTIAL SURVEY REPORT CENTER FOR ECONOMIC AND BUSINESS RESEARCH February 8, 2019 Prepared for The City of Bellingham Author(s) Rowan Innes Hart Hodges, Ph.D. James McCafferty Prepared
Background. Response Rate and Age Profile of Respondents. Community Facilities and Amenities. Transport Issues. Employment and Employment Land Issues
 Background Response Rate and Age Profile of Respondents Community Facilities and Amenities Transport Issues Employment and Employment Land Issues Housing and Housing Land Issues Telecommunications Tourism
Statewide Survey on Job Approval of President Donald Trump
 University of New Orleans ScholarWorks@UNO Survey Research Center Publications Survey Research Center (UNO Poll) 3-2017 Statewide Survey on Job Approval of President Donald Trump Edward Chervenak University
Body Worn Cameras on Police: Results from a National Survey of Public Attitudes
 July 2015, CCJP 2015-02 Body Worn Cameras on Police: Results from a National Survey of Public Attitudes By William H. Sousa, Ph.D., Terance D. Miethe, Ph.D., and Mari Sakiyama, M.A. Body worn cameras (BWCs)
OFFICE OF THE CONTROLLER. City Services Auditor 2005 Taxi Commission Survey Report
 OFFICE OF THE CONTROLLER City Services Auditor 2005 Taxi Commission Survey Report February 7, 2006 TABLE OF CONTENTS INTRODUCTION 3 SURVEY DATA ANALYSIS 5 I. The Survey Respondents 5 II. The Reasonableness
STEM CELL RESEARCH AND THE NEW CONGRESS: What Americans Think
 March 2000 STEM CELL RESEARCH AND THE NEW CONGRESS: What Americans Think Prepared for: Civil Society Institute Prepared by OPINION RESEARCH CORPORATION January 4, 2007 Opinion Research Corporation TABLE
Attitudes to global risks and governance
 Attitudes to global risks and governance Global Challenges Foundation 2017 Table of contents Introduction 3 Methodology 4 Executive summary 5 Perceptions of global risks 7 Perceptions of global governance
PPIC Statewide Survey Methodology
 PPIC Statewide Survey Methodology Updated February 7, 2018 The PPIC Statewide Survey was inaugurated in 1998 to provide a way for Californians to express their views on important public policy issues.
2016 Appointed Boards and Commissions Diversity Survey Report
 2016 Appointed Boards and Commissions Diversity Survey Report November 28, 2016 Neighborhood and Community Relations Department 612-673-3737 www.minneapolismn.gov/ncr Table of Contents Introduction...
Californians & Their Government
 PPIC STATEWIDE SURVEY DECEMBER 2018 Californians & Their Government Mark Baldassare Dean Bonner Alyssa Dykman Lunna Lopes CONTENTS Press Release State Post-Election Landscape Federal Post-Election Landscape
as Philadelphians voice concerns about violent crime and the overall direction of the city.
 PUBLIC OPINION POLL: MAYOR Nutter s ratings improve, but philadelphians worry about crime AND DIRECTION OF THE CITY February 14, 2012 KEY FINDINGS A new public opinion poll commissioned by The Pew Charitable
SURVEY ASSESSING BARRIERS TO WOMEN OBTAINING COMPUTERIZED NATIONAL IDENTITY CARDS (CNICs) February 2013
 February 2013") SURVEY ASSESSING BARRIERS TO WOMEN OBTAINING COMPUTERIZED NATIONAL IDENTITY CARDS (CNICs) February 2013 Survey Assessing Barriers to Women Obtaining Computerized National Identity Cards (CNICs) Survey
SURVEY ASSESSING BARRIERS TO WOMEN OBTAINING COMPUTERIZED NATIONAL IDENTITY CARDS (CNICs) February 2013 Survey Assessing Barriers to Women Obtaining Computerized National Identity Cards (CNICs) Survey
Civil Society Organizations in Montenegro
 Civil Society Organizations in Montenegro This project is funded by the European Union. This project is funded by the European Union. 1 TABLE OF CONTENTS EVALUATION OF LEGAL REGULATIONS AND CIRCUMSTANCES
Release #2475 Release Date: Wednesday, July 2, 2014 WHILE CALIFORNIANS ARE DISSATISFIED
 THE FIELD POLL THE INDEPENDENT AND NON-PARTISAN SURVEY OF PUBLIC OPINION ESTABLISHED IN 1947 AS THE CALIFORNIA POLL BY MERVIN FIELD Field Research Corporation 601 California Street, Suite 210 San Francisco,
Rural Pulse 2019 RURAL PULSE RESEARCH. Rural/Urban Findings March 2019
 Rural Pulse 2019 RURAL PULSE RESEARCH Rural/Urban Findings March 2019 Contents Executive Summary 3 Project Goals and Objectives 9 Methodology 10 Demographics 12 Detailed Research Findings 18 Appendix Prepared
CITY USER PROFILE 15 ADELAIDE CITY COUNCIL RESEARCH REPORT
 CITY USER PROFILE 15 ADELAIDE CITY COUNCIL RESEARCH REPORT CONTENTS What is the City User Profile and why do we do it? p. 03 How is CUP data collected? p. 03 What are some of the key findings from CUP
Kansas Policy Survey: Fall 2001 Survey Results
 Kansas Policy Survey: Fall 2001 Survey Results Prepared by Tarek Baghal with Chad J. Kniss, Donald P. Haider-Markel, and Steven Maynard-Moody September 2002 Report 267 Policy Research Institute University
Belief in climate change eroding
 FOR IMMEDIATE RELEASE Belief in climate change eroding Majority still believe human activity is the cause - In a random sampling of public opinion taken by the Forum Poll among 1286 Canadian adults, close
2016 Nova Scotia Culture Index
 2016 Nova Scotia Culture Index Final Report Prepared for: Communications Nova Scotia and Department of Communities, Culture and Heritage March 2016 www.cra.ca 1-888-414-1336 Table of Contents Page Introduction...
The City of Corpus Christi Citizen Survey
 The City of Corpus Christi Citizen Survey Report for the year 2005 Completed by Social Sciences Research Center Daniel J. Jorgensen, Ph.D. Joyce DuVall, Research Assistant College of Arts and Humanities
2017 State of the State Courts Survey Analysis
 To: National Center for State Courts From: GBA Strategies Date: November 15, 2017 2017 State of the State Courts Survey Analysis The latest edition of the State of the State Courts research, an annual
Streetcar Community Attitudes Survey - Community Development and Transportation Principles
 PREPARED FOR: CITY OF LAKE OSWEGO Streetcar Community Attitudes Survey - Community Development and Transportation Principles October 2011 PREPARED BY: DHM RESEARCH (503) 220-0575 203 SW Pine St., Portland,
AMERICANS VIEWS OF PRESIDENT TRUMP S AGENDA ON HEALTH CARE, IMMIGRATION, AND INFRASTRUCTURE
 AMERICANS VIEWS OF PRESIDENT TRUMP S AGENDA ON HEALTH CARE, IMMIGRATION, AND INFRASTRUCTURE March 2018 1 TABLE OF CONTENTS I. Health Care........... 3 II. Immigration... 7 III. Infrastructure....... 12
Public Attitudes Survey Bulletin
 An Garda Síochána Public Attitudes Survey Bulletin 2017 Research conducted by This bulletin presents key findings from the first quarter of the Public Attitudes Survey conducted between January and March
Percentages of Support for Hillary Clinton by Party ID
 Executive Summary The Meredith College Poll asked questions about North Carolinians views of as political leaders and whether they would vote for Hillary Clinton if she ran for president. The questions
Regina City Priority Population Study Study #2 - Immigrants. August 2011 EXECUTIVE SUMMARY
 Regina City Priority Population Study Study #2 - Immigrants August 2011 EXECUTIVE SUMMARY Executive Summary The City of Regina has commissioned four background studies to help inform the development of
REPORT TO PROPRIETARY RESULTS FROM THE 48 TH PAN ATLANTIC SMS GROUP. THE BENCHMARK OF MAINE PUBLIC OPINION Issued May, 2011
 REPORT TO PROPRIETARY RESULTS FROM THE 48 TH PAN ATLANTIC SMS GROUP OMNIBUS POLL THE BENCHMARK OF MAINE PUBLIC OPINION Issued May, 2011 5 Milk Street Portland, Maine 04101 Tel: (207) 871-8622 www.panatlanticsmsgroup.com
Vermonters Awareness of and Attitudes Toward Sprawl Development in 2002
 Vermonters Awareness of and Attitudes Toward Sprawl Development in 2002 Written by Thomas P. DeSisto, Data Research Specialist Introduction In recent years sprawl has been viewed by a number of Vermont
Influence of Consumer Culture and Race on Travel Behavior
 PAPER Influence of Consumer Culture and Race on Travel Behavior JOHANNA P. ZMUD CARLOS H. ARCE NuStats International ABSTRACT In this paper, data from the National Personal Transportation Survey (NPTS),
ANNUAL SURVEY REPORT: GEORGIA
 ANNUAL SURVEY REPORT: GEORGIA 2 nd Wave (Spring 2017) OPEN Neighbourhood Communicating for a stronger partnership: connecting with citizens across the Eastern Neighbourhood June 2017 TABLE OF CONTENTS
An Assessment of Ranked-Choice Voting in the San Francisco 2005 Election. Final Report. July 2006
 Public Research Institute San Francisco State University 1600 Holloway Ave. San Francisco, CA 94132 Ph.415.338.2978, Fx.415.338.6099 http://pri.sfsu.edu An Assessment of Ranked-Choice Voting in the San
North Carolina and the Federal Budget Crisis
 North Carolina and the Federal Budget Crisis Elon University Poll February 24-28, 2013 Kenneth E. Fernandez, Ph.D. Director of the Elon University Poll Assistant Professor of Political Science kfernandez@elon.edu
THE LOUISIANA SURVEY 2017
 THE LOUISIANA SURVEY 2017 Public Approves of Medicaid Expansion, But Remains Divided on Affordable Care Act Opinion of the ACA Improves Among Democrats and Independents Since 2014 The fifth in a series
Wisconsin Economic Scorecard
 RESEARCH PAPER> May 2012 Wisconsin Economic Scorecard Analysis: Determinants of Individual Opinion about the State Economy Joseph Cera Researcher Survey Center Manager The Wisconsin Economic Scorecard
Immigration and Multiculturalism: Views from a Multicultural Prairie City
 Immigration and Multiculturalism: Views from a Multicultural Prairie City Paul Gingrich Department of Sociology and Social Studies University of Regina Paper presented at the annual meeting of the Canadian
Introduction: Summary of the Survey Results
 Introduction: Summary of the Survey Results The following is a chapter-by-chapter summary of the main points that became apparent as a result of this survey. The design of the survey form is similar in
Kansas Speaks Fall 2018 Statewide Public Opinion Survey
 Kansas Speaks Fall 2018 Statewide Public Opinion Survey Prepared For The Citizens of Kansas By The Docking Institute of Public Affairs Fort Hays State University Copyright October 2018 All Rights Reserved
Building common ground. How shared attitudes and concerns can create alliances between African-Americans and Latinos in a post-katrina New Orleans.
 Building common ground How shared attitudes and concerns can create alliances between African-Americans and Latinos in a post-katrina New Orleans. Key findings from Dr. Silas Lee & Associates survey of
Urban Coast Institute Polling Institute. Released: December 5, CONTACT: Tony MacDonald Director, Urban Coast Institute
 Mid-Atlantic Coastal Policy: The Public View A survey of residents in the six-state Mid-Atlantic region (New York, New Jersey, Pennsylvania, Delaware, Maryland, Virginia) Urban Coast Institute Polling
NATIONAL SURVEY / ARGENTINES PERCEPTIONS OF THE WORLD ORDER, FOREIGN POLICY, AND GLOBAL ISSUES (Round 2)
") November 2, 20 NATIONAL SURVEY / ARGENTINES PERCEPTIONS OF THE WORLD ORDER, FOREIGN POLICY, AND GLOBAL ISSUES (Round 2) PRESS CONTACTS: Alejandro CATTERBERG / President, Poliarquía Consultores Benjamin
November 2, 20 NATIONAL SURVEY / ARGENTINES PERCEPTIONS OF THE WORLD ORDER, FOREIGN POLICY, AND GLOBAL ISSUES (Round 2) PRESS CONTACTS: Alejandro CATTERBERG / President, Poliarquía Consultores Benjamin
An in-depth examination of North Carolina voter attitudes in important current issues. Registered Voters in North Carolina
 An in-depth examination of North Carolina voter attitudes in important current issues Registered Voters in North Carolina January 21-25, 2018 Table of Contents Key Survey Insights... 3 Satisfaction with
THE 2004 NATIONAL SURVEY OF LATINOS: POLITICS AND CIVIC PARTICIPATION
 Summary and Chartpack Pew Hispanic Center/Kaiser Family Foundation THE 2004 NATIONAL SURVEY OF LATINOS: POLITICS AND CIVIC PARTICIPATION July 2004 Methodology The Pew Hispanic Center/Kaiser Family Foundation