Vulnerability Assessment of Syrian Refugees (VASyR) in Lebanon
|
|
|
- Samuel McLaughlin
- 6 years ago
- Views:
Transcription
 in Lebanon WFP/Sandy")
1 Vulnerability Assessment of Syrian Refugees (VASyR) in Lebanon WFP/Sandy Maroun 2014


")
.")


2 ACKNOWLEDGEMENTS The 2014 Vulnerability Assessment for Syrian Refugees (VASyR) in Lebanon was conducted jointly by the World Food Programme (WFP), the United Nations High Commission for Refugees (UNHCR) and the United Nations Children s Fund (UNICEF). The VASyR team in Lebanon expresses its gratitude to the international non-governmental organisations (NGOs) responsible for the field data collection: Action Contre la Faim, ACTED/REACH, CARE, InterSOS, Mercy Corps, Norwegian Refugee Council, Première Urgence Aide Médicale Internationale, SHEILD, Solidarités International and World Vision International. The team would also like to thank all actors who contributed to the questionnaire design, methodology and analysis plan. Special thanks will go to the 1,750 refugee households and focus group discussion participants who welcomed the survey team to answer questions and provide invaluable information for this assessment.
3 TABLE OF CONTENTS Acknowledgements Table of contents Acronyms Executive summary Background and objectives Methodology Results 1. Demographics 2. Arrival profile 3. Shelter 4. WASH 5. Assets and services 6. Education 7. Health 8. Security 9. Livelihood sources 10. Expenditure 11. Food consumption and source 12. Coping strategies 13. Food security 14. Assistance 15. Focus group discussions results 16. Population profiles by key indicators 17. Conclusions 18. Recommendations Annex I: VASyR comparison Annex II: Profile by food security category Annex III: Profile by beneficiary status Annex IV: Profile by household head gender Annex V: Profile by Syrian-Lebanese population ratio
4 Annex VI: Profile by shelter type Annex VII: Key findings by region Annex VIII: Cluster selection for data collection Annex IX: Clusters selection for focus group discussions Annex X: Minimum expenditure basket methodology Annex XI: Food consumption score calculation Annex XII: Livelihood coping strategies indicator Annex XIII: Questionnaire Annex XIV: Focus group discussion questionnaire References 195 3
5 ACRONYMS ADCS BML CS DR ECHO FCS FGD FS HC HDADD HDDS HH HHH HWDD IMWG IS ITS IYCF MEB MFI MSFI MSNA NFI NGO PC PHC PLW SEB SHC UNHCR UNICEF VASyR WFP WHO asset depletion coping strategies Beirut- Mount Lebanon coping strategies dependency ratio european commission humanitarian aid office food consumption score focus group discussion food secure health centre household daily average diet diversity households daily dietary score household household head household weekly diet diversity information management working group informal settlement informal tented settlement infant and young child feeding minimum expenditure basket mildly food insecure moderately or severely food insecure multi-sectorial needs assessment non-food item non-governmental organization per capita primary healthcare pregnant or lactating women survival expenditure basket secondary healthcare united nations high commissioner for refugees united nations international children s emergency fund vulnerability assessment of syrian refugees world food programme world health organization 4
6 EXECUTIVE SUMMARY Background and objectives The 2013 VASyR was the first multi-sectorial survey on Syrian refugees living conditions across Lebanon. Conducted as a joint exercise lead by WFP in collaboration with UNHCR and UNICEF in May and June 2013, it assessed the vulnerability of Syrian refugees in Lebanon and provided information for decision making and re-designing of assistance programmes. Since May 2013 the context in Lebanon has transformed in some key aspects, which is likely to have impacted the vulnerability situation of Syrian refugee population. On one hand, the number of refugees has risen from less than a half million in May 2013 to more than 1 million in May 2014 as the conflict in Syria entered its fourth year. In addition, blanket assistance for food, hygiene and baby kits was shifted to targeted assistance in October and November The current 2014 VASyR is intended to monitor the vulnerability and living conditionsof Syrian refugees and analyse the changes observed from As such, the VASyR 2014 was conducted by WFP in collaboration with UNHCR and UNICEF during May and June Methodology The VASyR 2014 surveyed 1,747 Syrian refugee household that were registered or awaiting registration with UNHCR in Lebanon. A representative sample of 350 households was interviewed in each of the 5 regions considered: Akkar, the Bekaa Valley, Beirut-Mount Lebanon, South Lebanon and Tripoli + 5. Households were selected following a 2 stage-cluster random sampling methodology proportional to population size. In each region, 35 clusters were randomly selected proportional to refugee population size and 10 households were randomly selected per cluster. Field data collection was undertaken between 26 May and 6 June 2014 by 10 partners with 82 enumerators, 12 supervisors and 10 quality monitors. A multi-sectorial household questionnaire of 1 hour long, previously discussed and agreed among sectors, was administered to the household head or other members of the household. Eight Focus Group Discussions also were conducted per region. Basic statistics were calculated for direct and derived sectorial indicators providing the vulnerability profile of the population at regional and country level. Statistical tests for means and frequencies comparison were applied to estimate the difference on the vulnerability profile by year ( ), food security status, eligibility status and refugee population concentration, shelter type and household head gender. Key Findings This assessment studies the living conditions of Syrian refugees in Lebanon. It encompasses all sectors, from food security to education. It is important to note that the following results correspond to the fact that 69% of households were benefiting from food assistance 1. Vulnerability indicators, such as food insecurity or households below the poverty line or Minimum Expenditure Basket, are expected to be deteriorated if assistance amount or coverage is reduced. Below are the significant results by sector. Household composition: The average household size was 6.6 members, composed of 3 adults, 2 children between 5-15 years old, one child under 5 years old, and one older child and elder in every fourth household. Household size is smaller than in 2013 by one adult member. Sixteen percent of households were headed by women, 7% by elders and 1% by children. One third of households had more than 3 dependents per 2 non-dependent household members, while 17% had more than 2 dependents per non-dependent and were at greatest risk of not meeting the households needs. Households in Akkar and the Bekaa Valley were more likely to be headed by a woman. Akkar also showed more dependents per non-dependent household members compared to Beirut-Mount Lebanon. Two percent of households cared for children that were not part of their immediate family. Half of the households had a member with specific needs, mainly chronic diseases and pregnant or lactating women; households with members with specific needs were more common in South Lebanon. Arrival and registration profile: About 60% of Syrian refugee households arrived in Lebanon together as a complete family unit and 68% registered more than 6 months prior to the survey. One quarter of households (28%) included more than one registration case; one person in every 2 households is not registered and 1 in every 10 households had no intention to be registered. One in every 3 households had a child under 3 years old born in Lebanon, 10% of which did not have birth a certificate. 5
7 Shelter: The majority of households lived in an apartment or independent house (59%), while one quarter of households lived in unfinished shelters (mainly one room structure) and 14% in informal settlements. The average shelter was 54m 2 and had 2-3 rooms with 3-4 people per room; one fifth of households live in 3.5m 2 or less. Most households (82%) were renting, mainly for unfurnished shelters, with an average monthly rent of US$205. Shelter condition were good for 35% of households; the main problems were high humidity (50%), water leakage, rodents and the lack of adequate ventilation. Informal settlements were more common in Akkar and the Bekaa Valley than other regions. Renting a furnished apartment was more common in Beirut-Mount Lebanon, where rent was highest. Assets and Services: The most common assets accessible to households were TVs, mattresses, blankets, satellite dishes and gas stoves, although accessibility to specific assets varies significantly among regions. Compared to 2013, more refugee households had access to winter clothes, gas stoves, refrigerators and TVs in 2014, while less household had enough blankets or satellite dishes. One quarter of the households reported not having access to enough cooking fuel, especially in Akkar (38%). Electricity was the main source of lighting for almost all households, while 2% of households relied on candles. WASH: The main sources of drinking water in households were bottled water (34% of households) and household water (land pipes/tap water) (31%), while main source of cooking and washing water was household water (54%) and protected wells (14%). Households in Beirut-Mount Lebanon relied mostly on bottled water for drinking (59%); in South Lebanon households mostly used household tap water for drinking (46%), while households in Akkar relied significantly more on protected wells and springs. One third of households had a water storage capacity of less than 250 litres, and similar proportion of households reported not having access to 35 litres of water per person per day, 6% more than in Access to bathrooms has also decreased compared to 2013; one in 8 households did not have access to bathroom facilities -twice the proportion found in 2013-, while 7% of households were sharing the bathroom with 15 people or more. Traditional pit latrines were found in 28% households and 2% did not have access to any type of latrine. Forty percent households did not have sufficient access to soap or other hygiene items a remarkable increase compared to the 13% reported in In Beirut-Mount Lebanon, households were less likely to have access to bathrooms but more likely to have flush toilets. The highest proportion of households with access to bathrooms was in Akkar where traditional pit latrines were more common than in other regions. Education: The majority of household heads had at least a primary education (83%), 42% have completed intermediate studies, although thirteen percent of household heads were not able read or write. In South Lebanon household heads were more educated than in other regions, and across all regions household heads tended to be more educated than their spouses or household caretakers. Syrian refugee households had on average 2-3 children in school age (3-17 years old). Two thirds of them were not receiving any education and 44% had not attended school for at least one year, showing a slight improvement compared to The main reasons for not attending school continue to be tuition fees and school supplies that were considered too expensive. Akkar had the highest percentage of children attending school while the Bekaa Valley had the lowest percentage of school attendance amongst school aged children. Nearly one every 6 children attended school and moved to the next grade. Health: Households paid the full cost of primary and secondary health assistance in one fourth of cases and shared costs in about 30% of cases. Primary health care was more likely than secondary care to be needed and was more likely to be free. More households received free health care than in The proportion of households receiving free primary care was significantly higher in Akkar and the Bekaa Valley and lowest in Beirut-Mount Lebanon. Households in Beirut-Mount Lebanon were also less likely to require any primary health assistance and less likely to know what assistance was available. The main reason for households not receiving the required medical treatment was the cost of drugs/treatment and doctor fees. The majority of children under the age of 5 were sick during the two weeks prior to the survey, mostly with a fever (51%), a cough (45%) or diarrhoea (35%). Half of all children were sick with more than 2 symptoms, a sign of sickness severity. The level of child sickness was higher in 2014, as compared to 2013 when less than half of children were sick. 6
8 Security: Twelve percent of households experienced some type of insecurity in Lebanon during the three months prior to the survey, 2% more than in The most common type of insecurity was harassment caused by neighbours, which showed a remarkable increase compared to Insecurity restricted the free movement of members in 66% of households that felt insecure. Feeling of insecurity was significantly more common in Beirut-Mount Lebanon, Akkar and Tripoli + 5. Livelihoods: In 31% of households there were 5 or more dependents per working household member while no household member were able to work in 26% of households. Three quarters of all employment was temporal. In Akkar, the number of working household members was significantly lower, and the percentage of households without any working members was 3 times higher than in Beirut-Mount Lebanon and South Lebanon. Although the food voucher is restricted cash assistance, it constitutes the most important livelihood source for Syrian refugees in Lebanon and an increasingly important primary livelihood source 40% of all households rely on the food voucher as first livelihood source, compared to the 24% found in Households relying on food vouchers as a livelihood source were highest in the Bekaa Valley (67%) and lowest in Beirut-Mount Lebanon (11%). Non-agricultural casual labour (29%) and skilled work (14%) were the other main primary income sources. Loans and credits, mainly informal, were one of the three primary livelihood sources for half of all households, showing a marked increase compared to Expenditure: Households spent US$762 per month on average, of which 77% was spent on food 2, rent and health care. One third of households spent more than half of their monthly budget on food. Most expenditure on food was on bread (23%), fruits and vegetables (13%), dairy products (11%), cereals and fats (9%). Half of the refugee households were below the Lebanese extreme poverty line (US$3.84 per person per day), while 43% of households expenditure was below the Minimum Expenditure Basket. Household expenditure in 2014 was higher in Beirut-Mount Lebanon and lower in Akkar and the Bekaa Valley, where food expenditure share was highest. Food consumption and source: Food Consumption Score was poor or border line in 13% of households, almost double the 7% found in Although diet diversity was acceptable for most households, it also showed a decreased compared to Further, food groups most consumed (bread, condiments, sugar and fat) have low nutrient values; 60% of households did not consume any vitamin A rich fruits and vegetables. In 23% households, adults had less than 2 cooked meals the previous day and in 36% of households children were prioritised access to food. One fifth of households is not able to cook food at least once a day mainly due to lack of food to cook. Diet diversity and the percentage of households with acceptable food consumption was highest in South Lebanon and lowest in Akkar and Beirut-Mount Lebanon. Purchasing food was the major food source. Food vouchers were reported as the main food source by 41% of households, significantly more in the Bekaa Valley and Akkar and less common in Beirut-Mount Lebanon and Tripoli + 5. Child infant feeding practices: Half of the children between 6 and 23 months old were breastfed the day prior to the survey, although breastfeeding practice decreased with according to the World Health Organization s Infant and Young Child Feeding (IYCF) guidelines. Children in South Lebanon had better IYCF practices. Coping strategies and debt: Two thirds of households experienced a lack of food or money to buy food during the month prior to the survey, an increase from 48% of households in A lack of food or money to buy food was more common in the Bekaa Valley and less common in Beirut-Mount Lebanon. Almost all households experiencing a shortage of food applied food consumption related coping strategies, specially relying on less preferred or less expensive food, reducing meal portion sizes and reducing the number of meals per day. Thirty percent of households that experienced lack of food or money to buy it engaged in crisis coping strategies like reducing expenses in education or health and 12% in emergency coping strategies like involving children income generation activities. Out of the total population, households that engaged in crisis coping strategies when experiencing lack of food or money to buy it increased in 2014 compared to The majority of households borrowed money or received credit in three months prior to the survey (82%), ranging from 88% of households in the Bekaa Valley to 74% of households in Beirut-Mount Lebanon. The main reasons for borrowing money or receiving credit mainly received from friends or relatives in Lebanon- were to buy food (73%), to pay rent (50%) and to cover health expenses (31%). About 80% of households had some debt and half of them of US$400 or more. The number of households in debt and level of debt increased as compared to
9 Food security: Three quarters of households showed some degree of food insecurity, 13% moderate or severe food insecurity. A deterioration in food security was observed in 2014 compared to 2013, with 7% food secure households less in Akkar was the region with the highest percentage of severely and moderately food insecure households whereas Beirut-Mount Lebanon had the highest percentage of food secure ones. Assistance: Three quarters of households were considered eligible for WFP or UNHCR assistance; eligible households were less common in Beirut-Mount Lebanon and more common in Akkar. The most commonly provided assistance was food vouchers, received by 69% of households, followed by hygiene kits, health assistance and food in kind. In the last year, 17% households benefitted from education assistance and 13% received furniture or clothes, among others. Households in Beirut-Mount Lebanon were less likely to receive assistance than elsewhere. Vulnerability profiles: Households were classified by food security category, beneficiary status for food assistance, gender of the household head, shelter and by the refugee/host population ratio in their host community. Comparison across the VASyR was then undertaken based upon these classifications in order to define population profiles associated to these indicators. Households food security situation was found to be significantly associated with household composition, level of education of household head and caretaker, livelihood sources, expenditures, food consumption, coping strategies, shelter and WASH conditions, access to basic assets and services as well as residential permits. Eligibility status for food assistance showed statistical associations with household composition, level of education of household heads and caretakers, chidren school attendance, access to health, water and hygiene items, shelter crowding index, assets, livelihood sources, expenditures, food consumption, coping strategies and arrival and registration date. Gender of household head presents noteworthy links with dependency ratio, specific needs, shelter conditions, access to water and hygiene items, livelihood sources, expenditures, food consumption, coping strategies, food security and debts. Meanwhile, the type of shelter was found to be related with household composition, other shelter characteristics, WASH, access to assets and services, ecuation of household head, child school attendance, child sickness, livelihood sources, expenditure, food consumption, coping strategies and food security. Refugee and host population ratio in host communities showed significant associations with household composition, specific needs, residential permit, shelter and WASH, level of education, access to health, security, livelihood sources, expenditures, food consumption, coping strategies, debts and food security. Where the concentration of Syrian refugees, compare to Lebanese residents, was lowest, households felt more insecure especially due to neighbours. Conclusion The living conditions of Syrian refugees in Lebanon has deteriorated over the previous year, despite on-going assistance. Access to work was limited and mainly restricted to temporal employments that are insufficient to cover households monthly expenses. Households savings and available assets have become increasingly depleted, as such households had engaged in more severe and irreversible coping strategies to meet their basic needs. Food vouchers, and to a lesser extent loans and credits, have increasingly become key livelihood sources for households indicating the escalating dependency of households on external livelihood sources. Food, shelter and health were the main expenses of households as well as the main reasons for borrowing money. At the same time, adequate access to water, bathrooms and hygiene items had worsened significantly while the continued reduced education coverage risks losing a generation of Syrian children. Tension with host communities had increased making security situation an issue of concern. Focus Groups Discussions highlight that rent, health, food, education and work opportunities are refugees main priorities. Shelter, health, lack of job opportunities, harrassment by host communities and legal permits are the main problems they have to face, and therefore their priorities for intervention. Recommendations A multi-sectorial and comprehensive assistance package, which takes into consideration the regional differences in vulnerability, is recommended to improve and/or stop the progressive deterioration of Syrian refugees living conditions in country. Assistance for food, shelter, health, livelihoods, social cohesion, WASH, protection and education, at household and community level, is needed to continue or to increase in order to allow households to cover their basic needs. As the situation is not expected to be improved but to progressively deteriorated, short and medium-long term solutions are required to ensure a sustainable approach to the Syrian refugee crisis in Lebanon. 8
10 BACKGROUND AND OBJECTIVES As the conflict in Syria commenced refugees began entering Lebanon in April One year later, 10,000 Syrian refugees were registered with UNHCR, and by April 2013 there were 300,000 registered Syrian refugees in Lebanon, a 30-fold increase within a year. By April 2014, there were more than 1 million Syrian refugees in Lebanon registered with UNHCR, and the number was continuing to grow at a rate of 12,000 people per week. Syrian refugees are spread across Lebanon in 1,700 individual locations, however there is a higher concentration living in the Bekaa Valley and North Lebanon governorates. The first nationally-representative and multi-sector survey of Syrian refugees in Lebanon, the Vulnerability Assessment of Syrian Refugees (VASyR) was conducted in May and June of 2013 by WFP, UNHCR and UNICEF, with contribution from ECHO. The objective of the VASyR was to assess Syrian refugee s living conditions and their needs and provided a multi-sectorial overview of the vulnerability levels of registered and pre-registered Syrian refugees in Lebanon. The information obtained from the VASyR 2013 allowed better-informed programme design and decision making, particularly for the implementation of targeting of food voucher assistance and hygiene and baby kit assistance. Between when VASyR 2013 survey was undertaken and the VASyR 2014 survey was undertaken the context in Lebanon, including the situation of Syrian refugees, developed considerably. Most notably: As of June 2014 there were 1,032,469 registered Syrian refugees in Lebanon, equivalent to one quarter of the population of Lebanon. This increased the strain on the already stressed infrastructure in Lebanon and in some cases increased tensions within host communities and negatively affected refugees access to shelter, employment and essential basic services (including health, education, water, sanitation and electricity). As part of responsible programming, various forms of assistance (food, hygiene and baby kits) shifted from blanket to targeted assistance during October and November Targeted assistance, aimed at the most vulnerable refugees, was implemented to maximise the impact of food and non-food assistance, this included 70% of Syrian refugees in Lebanon. The remainder of the registered population were deemed able to cover their basic needs without engaging in irreversible coping strategies. Nonetheless monitoring of how assistance, now targeted, affected the Syrian refugee population as a whole continued to be conducted. Syrian refugees, through their protracted settlement in Lebanon, have increasingly adapted to the new context and gained a knowledge of the services and assistance entitlements available to them. However, they have also drawn down on or exhausted their existing resources and increasingly taken on debt. The VASyR 2014 was designed to better understand how the situation of Syrian refugees has evolved and to estimate the actual impact the above mentioned factors were having on the living conditions of Syrian refugees. The VASyR 2014 survey was conducted in May and June 2014, to ensure comparability with the VASyR 2013 which was conducted in May and June ,200,000 1,000, , , , ,000 - Figure 1: UNHCR registration trends of Syrians in Lebanon. Statistics as of 8 December
11 Objective The main objective of the VASyR 2014 is to provide a multi-sectorial overview of the vulnerability situation of Syrian refugees in Lebanon one year after the original VASyR As specific objectives, the study will: (i) (ii) (iii) (iv) (v) assess the current living conditions of Syrian refugees in Lebanon; analyse regional differences in vulnerability; identify main changes in their living standards compared to last year; discuss and consider the major possible causes of these changes (if any); and make recommendations for steps forward. METHODOLOGY Population and sampling The VASyR 2014 surveyed 1,747 Syrian refugee households that were registered or awaiting registration with UNHCR in Lebanon. The population was divided geographically into five regions Akkar, the Bekaa Valley (Bekaa), Beirut-Mount Lebanon (BML), South Lebanon (South), and Tripoli considering governorate administrative boundaries, operational areas and the number of Syrian refugees registered in each region (see Table 1). This approach is consistent with the Sixth Regional Refugee Response Plan and the Regional Refugee and Resilience Plan for Lebanon, and ensures the information is obtained at administrative and operational levels so that it may be used for decision making purposes. The sample was determined to be representative for each of these regions according to the following parameters: - Estimated prevalence of 50 percent - Desired precision of 10 percent Sample size per region is 345 households - Design effect of 3 Total sample for 5 regions is 1,725 households - Non-valid response households rate of 10 percent The household selection followed a two-stage cluster 3 random sampling method proportional to the population size of refugees. In order to estimate the number of clusters as well as households per cluster, the following assumptions were made in accordance with statistical and operational considerations: - A minimum of 30 clusters per region. - Two people per household visit (forming one team). - Five households to be surveyed per day and per team. - Two teams per cluster per day. Region Syrian refugees registered or awaiting registration Sample size (number of households) Akkar 106, Bekaa 344, BML 268, South 122, T5 160, Table 1: Population of Syrian refugees, both registered and awaiting registration, and sample size by region. Data: UNHCR, 3 April
12 Operations In the first stage, 35 clusters and 4 replacement clusters were randomly selected per region proportional to refugee population size. The population size per location considered for the cluster selection was the total number of Syrian refugees, both registered and awaiting registration. Clusters were selected based on the Syrian refugee population registered and awaiting registration by UNHCR as of 4 April A total of 9,743 refugees without specific location of residence were not considered in the random selection of clusters. Thirteen locations (47,750 refugees) were excluded from the random selection due to security reasons and access restrictions (see Table 2). Area Refugee population size BML Borj el Brajne 18,730 Chiayah 2,372 Ghobeire 2,402 Haret Hreik 3,614 Hay es Sellom 7,708 Mraije 1,136 Tahouitet el Ghadir 534 Lailake 2,632 Beirut 5,936 T5 El Maloula 408 Hdadine 26 Maloule 13 Tabbaneh 5,467 Zahrieh 2,708 Tripoli 907 Table 2: Clusters removed from the sampling selection due to security reasons and access restrictions. At the second stage, 10 households were randomly selected within each cluster. Replacement households within each cluster were also identified. If the number of refugees in the cluster was not enough to complete the 10 interviews, the geographically closest cluster was identified until completing the 10 households for that cluster. Organization of the survey operations was based on the following: - Two teams (four enumerators) per cluster per day, to survey 10 households per cluster per day; households per region / 5 households per day per team = 34.5, rounded up to 35 clusters per region; - 35 clusters per region and 10 households per cluster = 350 households per region; - 35 clusters per region and five regions = 175 clusters; - Eight teams (16 enumerators) per region = 40 teams = 80 enumerators per region; - One supervisor for every four teams = 10 supervisors; - One regional coordinator per region = Five regional coordinators; and - 1,750 households surveyed by five households per team per day by 40 teams = 9 days of data collection. Data collection The data was collected between 26 May and 6 June 2014 by 82 enumerators and 13 supervisors. Each team consisted of two enumerators and each supervisor was responsible for 3 4 teams. To ensure the quality of the data collected, 2 or 3 quality monitors per region accompanied the teams during data collection and assisted supervisors with data quality supervision. Field data collection was undertaken by 11 partners: ACF, NRC and SHEILD in South Lebanon; ACTED/REACH in Akkar and Beirut-Mount Lebanon; Care, NRC and Solidarités International in Tripoli + 5; InterSOS, Mercy Corps and World Vision in the Bekaa Valley; and Première Urgence in Beirut-Mount Lebanon. The data collected was registered through electronic devices using Open Data Kit software and uploaded automatically to an online database on a daily basis. 11
13 Teams made appointments with selected households the day before the survey team s visit in order to minimize the risk of preparation by households for the visit and therefore limit bias in the results. Questionnaire The household questionnaire design was based on the VASyR 2013 questionnaire to ensure comparability, including inputs from sector working groups and information needs identified by the Multi-Sectorial Needs Assessment (MSNA) secondary data analysis. It was designed to be able to be completed in approximately an hour and covered indicators across all sectors, including household demographics, arrival profile, registration, protection, shelter, WASH, assets and services, health, education, security, livelihoods, household expenditures, food consumption, coping strategies, debts, assistance and child health and feeding practices. A field test was conducted in advance of the survey roll-out to ensure its feasibility. The questionnaire is included in Annex XII. One questionnaire was administered to each selected household. A household was defined as group of family members that live under the same roof, or different structures, eat out of the same pot and share the same budget that is managed by the head of the household. This definition implies that a household may be constituted by two or more UNHCR registration cases. Data analysis Data was cleaned and weights were assigned to each region according to the population of refugees registered in that region as of June Data analysis included the following: - Calculation of indirect indicators such as dependency ratio, crowding index, Food Consumption Score, coping strat egies classification, among others. - Descriptive statistics of direct and indirect indicators to provide a general characterization of the refugee population. - Comparison of main indicators among regions and with VASyR Statistical testing, including the chi-squared tests for comparison of frequencies and t-tests for comparison of means. Statistical significance was determined applying a p-value of 0.01 for regional differences whereas a p-value of 0.05 was used to evaluate the differences by food security groups and eligibility status. The statistical software used was SPSS 20.0, and graphs were generated using Microsoft Excel Focus Group Discussions Focus groups were organized to collect qualitative information to complement the quantitative data collected through the household visits and to enable a more in-depth understanding of aspects that may not have been captured through the quantitative forms. The questionnaire used to guide focus group discussions can be found in Annex XIII. The main objectives and discussion topics of the focus groups were to: - Understand shocks: What the main problems faced by refugees are and their consequences; - Identify social networks: What the existing support structures available are and whether refugees have access to them; and - Understand refugee priorities: What the identified priorities of the refugees are, and the ways in which they perceive the situation can be improved. Focus group discussion (FGDs) were conducted in all five regions of Lebanon covered by the VASyR 2014: Akkar, the Bekaa Valley, Beirut-Mount Lebanon, South Lebanon and Tripoli + 5. Eight FGDs were organized in each area, for a total of 40 group discussions. The locations of FGDs were selected through a random method proportional to population size. Two replacement clusters were also identified per region. Each interview was held with the participation of between 6 and 15 refugees chosen with consideration to having a diversity of livelihood backgrounds, socio-economic status, gender, age and household head status. More detailed information on the locations can be found in Annex VIII. Coordination The VASyR 2014 methodology was discussed within the Data Collection sub-working group of the Information Management Working Group (IMWG). Sampling frame, questionnaire and analysis plan was discussed and agreed within the Data Collection sub-working group with the participation of representatives of all sectors. 12
14 The results of the secondary data analysis of the MSNA also informed the development of the VASyR 2014 questionnaire. The aim was to fill information gaps identified by the MSNA to the extent possible, considering the limitations of a multi-sectorial survey and comparability with VASyR For comparison purposes, core indicators and categories in the VASyR 2014 questionnaire, as well as analysis approach, remained the same as the VASyR 2013 where possible. Similarly, data collection was carried out at the same time of the year as in The VASyR 2014 benefited from lessons learnt from the VASyR 2013, the ongoing targeting/verification exercise and other parallel initiatives. Limitations Household replacement rate within each cluster was higher than 50 percent in some regions, mainly due to household movement to different residence locations or inability to communicate with the selected households. This rate of replacement may have introduced a bias towards those households with less geographical movement and/or households that were able to maintain their phone numbers. In South Lebanon, two clusters had to be replaced due to the lack of permission from government authorities to conduct the questionnaire without the supervision of government representatives. Applying the definition of a household to the context of Syrian refugees in Lebanon continues to be a challenge. Refugee household members who may have been living independently in Syria constitute new household units in Lebanon. In other cases, family members may be sharing roof and food but function as different household units with their own budgets managed by each different household heads. This complex household dynamic and the difference in household definition compared to UNHCR registration database 4, may explain the difference in household size and composition compared to other surveys. This assessment does not intend to be a medical health survey. Specific needs and child sickness and symptoms are based on the information reported by the interviewees and guidelines provided to enumerators. The field data collection did not include any professional medical diagnosis. The expenditure module of VASyR 2014 included additional non-food expenditure categories compared to VASyR 2013, and as such the comparability of expenditure is limited. When including additional categories, total expenditure tended to be higher and the share of expenditure on food tended to be lower. Differences in average household size between 2013 and 2014 also affected the comparison of average expenditure. A larger household size implies higher expenditure at household level and lower expenditure per capita. These differences in household size and expenditure categories should be noted when comparing the expenditure data. 13
15 RESULTS 1. DEMOGRAPHICS 1.1 Interviewee The majority of interviews (62%) were able to be conducted with the presence of the household head; the remainder were conducted with the spouse of the household head or other adult household members available during the household visit, mainly household head s offspring, sibblings or parents. In Tripoli + 5 significantly less interviews were conducted with heads of household. Forty four percent of all interviewees were women; this proportion was lowest in Beirut-Mount Lebanon and highest in South Lebanon. The average age of the interviewees was 37, with 62% aged between 20 and 40 years old. Although it is not quantitative recorded, it was common that more than one household member was present during the interview (for example the household head and their spouse), participating and/or supporting depending on the type of question. Interviewee Akkar Bekaa BML South T5 Total HHH 63% 69% 62% 64% 48% 62% HHH spouse 21% 18% 28% 28% 39% 27% Other 16% 12% 10% 9% 13% 11% Females 45% 44% 38% 50% 48% 44% Table 3: Interviewee profile by region. 1.2 Household head The average household head was a 39 year old Syrian man, with no significant differences among regions. The majority of household heads (57%) were between the age of 20 and 40; 7% of household heads were aged 60 years old or above and 14 cases were headed by a child under the age of 18 (less than 1% of the sample). Regarding nationality, 99% of household heads were Syrian. Countrywide, 16% of households were headed by women, however this was significantly higher in Akkar and the Bekaa Valley and lower in Beirut-Mount Lebanon and Tripoli + 5. The proportion of households headed by women increased as compared to 2013 (11%). The increase in household headed by women can reflect the return of male adults to Syria or the arrival of women and children in Lebanon while men stay in Syria, or visit their families in Lebanon regularly though not staying permanently. Household Head Akkar Bekaa BML South T5 Total 2014 Total 2013 HHHed by women 23% 21% 10% 18% 13% 16% 11% HHHed by a child 1.1%.6% 1.1%.6%.6%.7% 1% Table 4: Household head by region. 1.3 Household size and composition The average household had 6.6 members 5, while the median household size was 6 members. The average household is one adult member smaller than in In 2014, households with 4 or less members were more frequent than in 2013 while larger households were less common. This difference could be due to a progressive disaggregation of households as they adapt to living in Lebanon or to the departure of some household members out of the country. Households were smaller in Beirut-Mount Lebanon (6.1) and larger in the Bekaa Valley (7.1). The average household was comprised of 3 adults, 2 children between the age of 5 and 15, one child under the age of 5, and one older child (between the age of 16 and 17) and one elder above 60 years of age in every 4th household. The percentage of households with children under 5 was significantly lower than in 2013 (65% compared to 72%). In Akkar, the number of adults is significantly lower than in the Bekaa Valley. The average household size is higher than UNHCR registration case database, this is most likely because households can be constituted by more than one UNHCR registration case (as outlined in the methodology) and households may include non-registered members. 14
16 4% 8% Under 2 years old 10% Between 2 and 4 years old 45% 29% Between 5 and 15 years old Between 16 and 17 years old Between 18 and 59 years old 4% Over 60 years old Figure 2: Average household composition Over 60 years old Between 18 and 59 years old Between 16 and 17 years old Between 5 and 15 years old Between 2 and 4 years old Akkar Bekaa BML South T5 Figure 3: Household composition, average number of members per age range by region. 1.4 Unaccompanied children Two percent of households (36 cases) cared for children who were not part of their immediate family. The number of the cases was highest in Beirut-Mount Lebanon and Tripoli + 5 (11 cases) and lowest in the Bekaa Valley (2 cases). 1.5 Specific needs. Countrywide, 35% of households reported having a pregnant or lactating woman (PLW), down from 40% in The rate of PLW was lowest in Tripoli + 5 and the highest in Akkar. Among them, 7 cases of pregnant or lactating girls under 16 years old were found (0.7% of households) -3 cases in Tripoli + 5, 2 cases in South Lebanon and 2 cases in Beirut-Mount Lebanon-. Half of the households had a member with specific needs 6, including in this group those with any chronic illness (43%), mental or physical disability (12%), temporary functional limitations (10%), serious medical conditions (6%) or other type (3%). An increase of 9% was observed for households reporting at least one member with a chronic illness compared to
17 Households in South Lebanon had significantly more members with specific needs, followed by Beirut-Mount Lebanon, while the lowest rate was in Akkar (30 percentage points lower than in South Lebanon). The type of specific needs also varied by region; households in Tripoli + 5 reported higher rates of household members with chronic diseases, with disabilities and in need of support for basic daily activities. Meanwhile, temporal limitations or injuries were more common in South Lebanon and serious medical conditions were more common in Beirut-Mount Lebanon. The autonomy degree has been evaluated based on the need of support for basic daily activities 7 ; according to this proxy, 4% of households were judged to have at least one specific needs dependant household member. When considering only the specific needs of working age members (between the age of 16 and 59), 40% of households had at least one member with specific needs and 1.3% of households had at least one member in need of support for basic daily activities. 140% 120% 100% 80% 4% 3% 1% 1% 2% 7% 3% 3% 10% 10% 10% 6% 11% 10% 10% 3% 6% 4% 7% 7% 3% 16% 12% 11% 17% 4% 3% 6% 10% 12% Other needs Daily basic support Serious medical condifons 60% 40% 35% 42% 43% 44% 47% 43% Temporal limitafons Disability Chronic illness 20% 42% 36% 32% 34% 32% 34% PLW 0% Akkar Bekaa BML South T5 Total Figure 4: Household members with specific needs by region. Akkar Bekaa BML South T5 Total HH members with specific needs 36% 46% 55% 66% 44% 53% HH adult members (16-59 years old) with specific needs 31% 40% 37% 44% 46% 40% Table 5: Household members with specific needs per age group and region. 1.6 Dependency The dependency ratio (DR) reflects the potential of the household to generate sufficient income to meet all household members needs. Therefore, household members were considered dependent if they were not able to work because of age and/or any physical or mental limitation. The non-dependent members in the household were those aged between 18 and 59 years old who do not need any support for basic daily activities. A higher DR suggests that a household is at greater risk of not meeting the household s needs. Dependency ratio Number of dependents / number of non- dependents Dependents Children under 18 + elders 60 + non- autonomous adults (age 18-59) Non- dependents Autonomous adults (18-59 years old) Table 6: Calculation of the dependency ratio. 16
18 When households were classified into categories according to their DR, almost half of Syrian refugee households have one dependent per non dependent member; however, 17% had more than 2 dependents per non-dependent household member and were at greatest risk of not meeting the households needs. The number of dependents per non dependent was lowest in Beirut-Mount Lebanon (1.2) and highest in Akkar (1.6). The proportion of households headed by a single guardian with dependents was 8%, but differed among regions from 3% in Beirut-Mount Lebanon to 10% in the Bekaa Valley and 15% of households in Akkar. Further, there were 16 households were all members were dependent (1%). A slight increase in dependency ratio was observed compared to 2013 VASyR results 8, with 2% more households in the highest category. Percentage of single headed households with dependents also doubled as compared with Category I Category II Category III Category IV Table 7: Dependency Ratio categories. 1 dependent or less per non- dependent member (DR 1). Up to 3 dependents per 2 non- dependent member (1<DR 1.5) Up to 2 dependents per non- dependent member (1.5<DR 2) More than 2 dependents per non- dependent member (DR 2) Category I DR 1 Category II 1<DR 1.5 Category III 1.5<DR 2 Category IV DR 2 Akkar 47% 13% 17% 22% Bekaa 47% 18% 16% 18% BML 55% 20% 13% 13% South 45% 23% 15% 17% T5 48% 20% 15% 18% Total % 19% 15% 17% Total % 18% 12% 13% Total % 19% 13% 11% Table 8: Dependency Ratio by categories and region. 2. ARRIVAL PROFILE 2.1 Arrival to Lebanon The majority of households (60%) arrived in Lebanon together as a complete family unit at the same time. However, household members in Tripoli + 5 and South Lebanon were more likely to come at different times (55% and 50%, respectively). Households who arrived as a complete unit, on average, arrived more recently than the first member of households whose members arrived at different times. Households in Beirut-Mount Lebanon and South Lebanon were more likely to have members that had arrived before the conflict started (20%) compared to other regions ( 5%). Complete Separate, first member Separate, last member 6 months or less 12% 7% 37% 7 months 1 year 17% 12% 22% 1 2 years 52% 43% 32% 2 3 years 18% 28% 9% Before conflict started 1% 10% 0% Table 9: Arrival time by family members. 17
19 2.2 Registration One person in every 2 households was not registered with UNHCR, and one in every 10 households had no intention of registering. In Beirut-Mount Lebanon and South Lebanon the percentage of people with no intention of registering was higher, 1 in every 5 households. This result could be associated with the higher proportion of household members who arrived in Lebanon before the conflict started or the lower proportion of beneficiaries from assistance in these regions compared to Akkar, the Bekaa Valley and Tripoli + 5 (which could reduce refugees perceived benefit of registering). Reasons for not registering were diverse, including: 15% did not see any benefit in registering, 9% were unaware of the process, 9% were new comers, 8% were unable to approach the registration centre, 6% could not afford the transportation cost to reach the registration centre, 5% were not Syrian nationals, 4% feel unsafe or are not free to go to the registration center, another 4% are afraid that the data would be shared with authorities, 3% were rejected and another 3% were newborns; smaller percentages are also found for other reasons like lack of required documentation, single people, lack of answering the phone, etc. One third of households had a child under 3 years old born in Lebanon, of which 10% did not have a birth certificates. Regional differences were not significant; the highest percentage of children without birth certificate was in South Lebanon (14%) and the lowest in Tripoli + 5 (7%). The majority of households (68%) had been registered for more than 6 months prior to the survey (before December 2013). In Tripoli + 5 households had been registered for a longer period, with the majority registered before May 2013, while in Beirut-Mount Lebanon households had been registered for a shorter period of time, 43% had registered after December 2013 in the 6 months prior to the survey. Akkar Bekaa BML South T5 Total 1 month 5% 4% 9% 2% 1% 5% 2-3 months 11% 8% 15% 5% 6% 10% 4-6 months 18% 16% 19% 18% 16% 17% 7-12 months 25% 33% 32% 32% 20% 29% 1-2 years 34% 34% 23% 41% 48% 34% 2-3 years 5% 4% 2% 2% 8% 4% >3 years 1.7% 0.6% 0.3% 0% 0.3% 1% Table 10: Households by date of registration. 18
20 3. SHELTER 3.1 Housing The majority of households lived in an apartment or independent house (59%), one quarter lived in unfinished shelters 11, mainly one room structure, and 14% lived in informal settlements 12. Housing types were similar as compared to Residing in apartments and independent houses was significantly less common in Akkar and the Bekaa Valley where significantly more households were residing in informal settlements. Unfinished buildings were relatively more common in South Lebanon while one room structures were more frequent in Akkar and Beirut-Mount Lebanon compared to South and Tripoli 5. 5% 2% 2% 4% Independent House 12% One Room Tent in ITS Garage / Shop 59% Unfinished Building 16% Factory / Warehouse Other Figure 5: Types of housing. 80% 70% 60% 50% 40% 30% 20% 10% 0% Independent House One Room Tent in ITS Garage / Shop Unfinished Building Akkar Bekaa BML South T5 Factory / Warehouse Other Figure 6: Types of housing by region. 19
21 3.2 Occupancy The majority of households (82%) were paying rent, mainly for unfurnished shelters (67%), including the land where tents or handmade shelters had been established. The proportion of households with housing provided by their employer was 7%; 5% were hosted for free and 5% benefited from assistance. Household occupancy was similar to 2013, although households were less likely to be squatting in 2014 (0.1%) as compared to 2013 (3%). Households in Beirut-Mount Lebanon were more likely to rent furnished apartments, whereas unfurnished rental was more common in the Bekaa Valley and Tripoli + 5. Households in Beirut-Mount Lebanon and Tripoli + 5 received less housing assistance, whereas in Akkar the proportion of households hosted for free was higher than other regions and in South Lebanon the proportion of households provided with housing from their employer was higher. 80% 70% 60% 50% 40% 30% 20% 10% 0% Unfurnished Rental Furnished Rental Provided by employer Assistance Charity Hosted for free Other Akkar Bekaa BML South T5 Total Figure 7: Type of occupancy by region. The average rent paid was US$205 per month, a considerable decreased from US$246 in Rental prices were highest in Beirut-Mount Lebanon and lowest in Akkar, where half of the households that pay rent shelter paid less than US$70 per month Akkar South Bekaa Tripoli 5 Beirut & Mount Lebanon Figure 8: Average rent by region. Total 20
22 3.3 Living area and crowding index Households, on average, lived in an area of 54m 2, divided into 2-3 rooms accommodating 3-4 people in each room. Half of all households lived in 7m 2 per person or smaller; one fifth in 3.5m 2 or smaller and one sixth of households had 6 or more people per room. The living area per person is similar to 2013, although there were less people per room on average and less living space per household. In Beirut-Mount Lebanon and the Bekaa Valley there were more people per room (4) being lowest in Akkar and South Lebanon. In Tripoli + 5 there were more square meters per person and number of rooms than in Beirut-Mount Lebanon, the Bekaa Valley and South Lebanon. Akkar Bekaa BML South T5 Total Density >10.5 m2/person 34% 27% 24% 27% 44% 30% m2/person 26% 19% 17% 21% 18% 19% m2/person 27% 34% 33% 34% 24% 31% 3.5 m2/person 14% 20% 25% 18% 15% 20% Crowding Index 1-2 person/room 47% 31% 27% 39% 40% 34% 3-5 person/room 41% 53% 51% 49% 43% 49% 6-7 person/room 10% 9% 14% 7% 10% 10% 8 person/room 3% 7% 8% 5% 7% 7% Table 11: Density and Crowding index by region. 3.4 Shelter conditions Shelter conditions were good in one third of households, although it was lower in Akkar and higher in the Bekaa Valley. Half of the households housing had high humidity, and one quarter had an issue of water leakage, especially in South Lebanon and Akkar. A further one quarter of households had rodents and similar percentage had no ventilation 13. In general, inadequate shelter conditions were more reported in Beirut-Mount Lebanon, South Lebanon and Akkar and less in the Bekaa Valley. Akkar Bekaa BML South T5 Total High humidity 55% 29% 55% 36% 54% 50% Good condition 22% 41% 38% 36% 32% 35% Water leakage 45% 29% 27% 55% 11% 28% Rodents 35% 18% 20% 39% 22% 24% No ventilation 18% 12% 22% 15% 35% 23% Dirty 10% 12% 23% 6% 17% 17% No windows 14% 6% 11% 21% 13% 12% Iron/plastic/fabric walls 6% 12% 16% 21% 4% 12% No doors 6% 6% 9% 12% 15% 10% Health hazards 8% 0% 14% 6% 0% 7% Broken stairs/ Debris 2% 0% 13% 0% 0% 5% Other 0% 0% 5% 0% 0% 2% Table 12: Shelter condition by region. 21
, one third of households relied on household water (land pipes/tap water), 19% with connection for more than")
23 4. WASH 4.1 Sources of Water The main source of drinking water in households was bottled water (34%), one third of households relied on household water (land pipes/tap water), 19% with connection for more than two hours per day. The main source of cooking and washing water was household tap water (54%), followed by protected wells and a water provider. The use of household tap water mainly for non-drinking purposes had increased as compared to % 4% 3% 4% 2% 2% 1% 0% 34% 5% 10% 12% 19% Bottled water HH tap water >2h HH tap water <2h Protected well Public standpipe Water provider Protected spring Unprotected spring Other Unprotected well Public reservoir UN/NGO tanker/truck water Borehole Figure 9: Source of water. Figure 10: Main source of cooking and washing water. The source of drinking and cooking and washing water differed significantly between regions. Households in Beirut-Mount Lebanon relied mostly on bottled water for drinking (59%) whereas in South Lebanon households mostly used household water for drinking. Households in Akkar relied significantly more on protected wells (40%) and springs (10%) and less on bottled or household tap water. Unprotected springs were also more common in Akkar and Tripoli + 5. Water providers were more common in Akkar and in the Bekaa Valley but very rare in Tripoli + 5. The main source of cooking and washing water in Beirut-Mount Lebanon, Tripoli + 5 and South Lebanon was household water with more than 2 hours connection. In the Bekaa Valley, the main sources for cooking and drinking water were household water with less than 2 hours connection and protected wells and in Akkar the main source of non-drinking water was protected wells and water providers % 90% 80% 70% 60% 50% 40% 30% 20% 10% 0% 5% 3% 5% 9% 6% 5% 9% 3% 10% 15% 5% 3% 4% 6% 6% 17% 8% 5% 7% 9% 7% 13% 9% 13% 5% 14% 12% 6% 4% 21% 31% 31% 23% 40% 22% 39% 59% 51% 59% 12% 23% 48% 4% 36% 36% 7% 8% 19% 8% 10% 16% 2% 0% 7% 3% 6% Akkar Bekaa BML South T5 Akkar Bekaa BML South T5 Drinking Cooking and Washing Borehole UN Water Public Reservoir Unprotected Well Other Unprotected Spring Protected Spring Water Provider Public Standpipe Protected Well Household Water > 2 hours Household Water < 2 hours BoPled water Figure 11: Drinking and cooking and washing water source by region.
24 4.2 Toilet and bathroom facilities One in eight households did not have access to bathroom facilities, which doubles the percentage found in 2013 (6%). In Beirut-Mount Lebanon more households did not have access to bathroom facilities (20%), while in Akkar only 4% of households did not have bathroom access. The proportion of households with access to bathrooms but sharing it with 15 people or more was 7%, ranging from 4% in Akkar to 10% in the Bekaa Valley. The majority of households had flush toilet or improved latrine with pour flush and cement slab (70%), although 2% did not have access to any type of toilet facilities and used the open field. More households used flush toilets and less households used traditional pit latrines or the open field than in Households in Beirut-Mount Lebanon and Tripoli + 5 were more likely to have access to flush toilets, whereas improved latrines were relatively more common in South Lebanon and traditional pit latrines in Akkar. The proportion of households sharing a latrine with 15 people or more was significantly higher in the Bekaa Valley (18%). 100% 90% 80% 70% 60% 50% 40% 30% 20% 10% 0% 5% 3% 3% 2% 2% 21% 33% 26% 23% 28% 43% 29% 30% 34% 37% 47% 31% 50% 46% 18% 36% 27% 21% 25% 4% 5% 6% 8% 9% Akkar Bekaa BML South T5 Total Flush toilet Improved latrine Traditional pit Open air Latrines shared by more than 15 people Figure 11: Type of latrine by region. 4.3 Water Storage capacity and treatment One fifth of households had no water storage, although this was significantly lower in the Bekaa Valley (7%). Also, one fifth of households had a water storage capacity of more than 1000 litres; this level of water storage was less common in Tripoli + 5 and Beirut-Mount Lebanon and significantly higher in Akkar (42%). Five percent of households treated water; the most common method was the use of ceramic filters. 100% 90% 80% 70% 60% 50% 40% 30% 20% 10% 0% 7% 6% 6% 2% 4% 18% 16% 13% 23% 18% 35% 24% 28% 37% 31% 29% 19% 18% 18% 11% 15% 11% 14% 16% 7% 17% 20% 13% 20% 21% 22% 17% 16% 20% 7% Akkar Bekaa BML South T5 Total none less than 250L L L L more than 2000L Figure 12: Water storage capacity by region. 23
.")
25 4.4 Access to water and hygiene products One third of households reported not have access to enough water for drinking, cooking, washing or toilet purposes, and a similar proportion did not have access to 35 litres of water per person per day for those purposes. Insuficient access to water was more common in Akkar and the Bekaa Valley, and shows a slight increase compared to 2013 (28%). Forty percent of households stated not have enough access to soap and hygiene items, which indicates a marked increased compared to the 13% reported in Access to hygiene items was better in the Bekaa Valley and lowest in Tripoli + 5 but regional differences were not significant. Figure 13: Access to water, hygiene items and drinking water by region. 4.5 Waste management Dumpsters or barrels were the main waste disposal method for the majority of households (91%), while 8% of households burnt their garbage or threw it into the field, especially in Akkar (18%). The municipality collected dumpsters or barrels for 46% of households in Beirut-Mount Lebanon, compared to 2 3% in other regions. 5. ASSETS AND SERVICES 5.1 Assets On average, households had access to 7 of the assets listed in the questionnaire, the same as in More refugee households had access to gas stoves, winter clothes, refrigerators and TVs in 2014, while less household have enough number of blankets or a satellite. Countrywide, the most common assets accessible to households were TVs, blankets, mattresses, satellite dishes and gas stoves, although household s accessibility to these assets varied significantly between regions. Households in Akkar and South Lebanon had access to less assets, on average, and gas stoves were sigificanlty less common. In the Bekaa Valley gas stoves and winter clothing were more commonly accessible than TVs and satellites; in Beirut-Mount Lebanon refrigerators were more commonly accessible than mattresses, gas stoves or winter clothes; in South Lebanon water heaters and refridgerators were more accessible than blankets or mattresses; and in Tripoli + 5 gas stoves were more commonly accessible. It is noticeable that half of the households in South Lebanon and around 40% in Beirut-Mount Lebanon did not have enough mattresses or blankets to cover their needs, compared to the 20% of households in Akkar and Tripoli + 5 and less than 10% found in the Bekaa Valley. 24
26 Akkar Bekaa BML South T5 Total Total TV 74% 74% 86% 82% 88% 81% 75% Blankets 78% 94% 62% 49% 78% 75% 90% Mattress 79% 91% 58% 48% 79% 73% 93% Satellite 72% 71% 75% 69% 72% 72% 63% Gas stove 48% 92% 57% 46% 84% 70% 43% Winter clothes 51% 84% 49% 40% 52% 59% 46% Refrigerator 50% 41% 69% 64% 69% 58% 50% Water heater 32% 36% 51% 65% 56% 47% 43% Washing machine 40% 33% 48% 52% 57% 45% 46% Sofa set 15% 21% 49% 32% 35% 32% 38% Beds 32% 9% 38% 12% 29% 24% 21% Table and chairs 20% 15% 34% 15% 27% 24% 27% Motorcycle 6% 7% 6% 13% 6% 7% 8% Sewing machine/iron 3% 7% 4% 7% 6% 6% 17% Electric oven 1% 3% 5% 3% 2% 3% 3% Cars 0% 5% 4% 3% 2% 3% 6% Air conditioning 1% 0% 6% 1% 3% 3% 3% DVD 0% 1% 4% 1% 5% 2% 6% Microwave/Vacuum 2% 1% 5% 2% 1% cleaner 2% 2% Computer 1% 1% 3% 2% 2% 2% 4% Central heating 0% 0% 3% 0% 2% 1% 1% Dishwasher/separate 1% 0% 0% 1% 1% freezer/drier machine 0% 1% Table 13: Household assets by region. Assets were classified into three categories basic, medium luxury and luxury 14 to determine the type of asset ownership by households. On average, households had access to 3 basic assets and 2 medium luxury assets and 1 in every 3 households had a luxury asset. Households in the Bekaa Valley had more basic assets but fewer medium assets, which are more common in Beirut-Mount Lebanon, Tripoli + 5 and South Lebanon. In Akkar households also had less medium and luxury assets. Luxury assets were more accessible in Beirut-Mount Lebanon and South Lebanon which could be associated with a higher proportion of refugee households that were living in Lebanon before the conflict started Akkar Bekaa BML South T5 Total Figure 14: Basic and luxury assets by region. Luxury assets Medium luxury assets Basic assets 25
27 5.2 Cooking fuel and lighting Gas was the main source of fuel for almost all households, while 4% of households were using wood or charcoal, more in Akkar (9%). One quarter of households reported not having access to enough cooking fuel, significantly more in Akkar (38%). Electricity was the main source of lighting for almost all households, while 2% of households relied on candles, most of them in the Bekaa Valley and Akkar (3%). 6. EDUCATION 6.1 Household head education The majority of household heads had at least a primary education (83%), although 13% of household heads were not able to read or write 15. In South Lebanon more household heads completed intermediate education compared to Akkar, the Bekaa Valley or Beirut-Mount Lebanon. Across the country, household heads tended to be more educated than their spouses or household caretakers. HHH Akkar Bekaa BML South T5 Total Spouse/ caretaker HHH Spouse/ caretaker HHH Spouse/ caretaker 6.2 Education of children and reasons for non-enrolment Two thirds of Syrian refugee children in school age 16 were not attending school or learning center, 44% have not attended school for more than 1 year and 6% were receiving some type of non-formal education; 16% children attended school last year and moved to the next grade. Of those households with school aged children, the majority (85%) had at least one child not attending school with most (56%) not attending for 1 year or more; in half of the households none of the children were attending school. In one quarter of households with school aged children at least one child had attended school or a learning space in the last year and moved to the next grade. Considering only those households with children, the average household had 3 school aged children, one of whom was attending school, one of whom was not currently attending school but had attended school in the past year and one of whom had not attended school for more than one year. The number of school aged children as well as the percentage of children not attending school was highest in the Bekaa Valley. Number The percentage of children not attending school for 1 year or more was also highest in the Bekaa Valley and South Lebanon. Conversely, Akkar was the best performing region in term of education attainment; the rate of children attending school was highest, the rate of children being absent from education for 1 year or more was lowest and the rate of children moving to the next grade was highest. HHH Spouse/ caretaker HHH Spouse/ caretaker None 16% 21 % 17% 22% 9% 16% 11% 16% 12% 15% 13% 18% Read & write 4% 3% 3% 2% 9% 9% 1% 1% 3% 3% 4% 4% Primary 39% 30% 43% 35% 42% 35% 36% 38% 40% 36% 41% 35% Intermediate 27% 25% 24% 25% 24% 21% 40% 32% 32% 24% 28% 25% Secondary 9% 7% 8% 10% 8% 9% 8% 7% 7% 9% 8% 9% Technical 1% 1% 3% 0% 3% 2% 2% 1% 2% 3% 2% 1% University 4% 4% 3% 3% 5% 2% 1% 3% 5% 1% 4% 3% NA - 10% - 2% - 5% - 2% - 9% 5% Table 14: Education level of household head and spouse. HHH Spouse/ caretaker Akkar Bekaa BML South T5 Total Households with school aged children (%) 74% 82% 74% 80% 74% 77% Total number of school aged children Children not attending school (%) 52% 72% 64% 67% 66% 66% Children not attending school for 1 year or 26% 54% 37% 59% 33% 44% more (%) Children that attended school last year and 26% 17% 11% 18% 16% 16% moved to next grade (%) Children receiving non- formal education (%) 5% 4% 9% 6% 6% 6% Table 15: Education status of Syrian refugee children by region. 26
28 Children were not attending school for a range of reasons, although a lack of financial resources and/or 17 the age of children were the most commonly sighted. This is consistent with the results of the VASyR 2013 and is despite UNHCR and UNICEF programs designed to cover all education related costs in public schools for Syrian children. Therefore it is recommended that this be investigated further. 40% 35% 30% 25% 20% 15% 10% 5% 0% 37% 28% 11% 6% 6% 5% 4% 3% 3% 3% 2% 2% 2% 2% 2% 5% Figure 15: Education status of Syrian refugee children by region. Akkar Bekaa BML South T5 Cannot afford tuition 22% 36% 50% 44% 26% Children are too young 33% 32% 23% 23% 23% School supplies too expensive 7% 7% 14% 12% 13% No space in school 7% 7% 4% 9% 7% Difference / Difficulty of curriculum 13% 5% 4% 5% 3% No school in the community 7% 11% 3% 2% 2% Newly arrived 3% 4% 3% 6% 2% Transport cost 1% 3% 5% 10% 0% Children need to work 2% 4% 3% 5% 1% School has already finished 2% 3% 4% 3% 2% Language 6% 3% 2% 1% 1% Recent or continuous movement to other 4% 0% 2% 3% 1% locations Other reason 2% 2% 2% 0% 3% Considered unnecessary 2% 2% 3% 2% 0% Need to stay at home 3% 2% 0% 2% 1% Children are old enough ( > 16 years) 2% 2% 2% 1% 0% Disability / Illness 2% 2% 0% 2% 0% Children not attending school in Syria 1% 2% 1% 2% 0% Security Situation 1% 1% 0% 0% 2% Bullying / Unsafe 0% 0% 0% 1% 1% Missed too much to catch up 0% 0% 0% 2% 0% Married 0% 0% 1% 1% 0% No documents / not recognized 1% 0% 0% 0% 0% Table 16: Reasons for children not attending school by region. 27
29 7. HEALTH 7.1 Access to health care Close to 30% households received partial health assistance and shared the costs related to primary and secondary health care and one quarter of all households paid the full cost. As expected, primary health care was more likely than secondary care to be needed and was more likely to be free. More households received free health care than in % 30% 25% 29% 28% 26% 26% 22% 20% 15% 10% 16% 8% 15% 10% 11% 5% 3% 4% 1% 1% 0% Cost sharing Household pays all Free health care Not needed Don t know Other Insurance Primary Health Care Secondary Health Care Figure 16: Cost share of health care for primary and secondary health care. The proportion of households receiving free primary care was significantly higher in Akkar and the Bekaa Valley and lowest in Beirut-Mount Lebanon. Sharing the cost or receiving partial benefits is significantly more common in South Lebanon, followed by Akkar and lowest in Beirut-Mount Lebanon and Tripoli 5. Households in Beirut-Mount Lebanon were also less likely to require any primary health assistance and less likely to know what assistance was available. In South Lebanon cost sharing was more common than elsewhere and only 1% of households were unaware of what services were available. The proportion of households not receiving any health assistance was highest in Tripoli + 5. Households in South Lebanon and Tripoli + 5 were more likely to not receive any secondary health assistance and pay all related costs. Households in Bekaa Valley, South Lebanon and Akkar were more likely to receive partial health assistance. Similar to primary health assistance, households in Beirut-Mount Lebanon were more likely to not require assistance. 28
30 100% 90% 80% 70% 60% 50% 40% 30% 20% 10% 10% 6% 26% 19% 37% 17% 10% 10% 11% 14% 21% 23% 9% 10% 21% 20% 25% 41% 30% 29% 16% 16% 24% 37% 8% 2% 24% 22% 23% 16% 1% 12% 11% 28% 45% 2% 18% 5% 37% 33% 8% 8% 10% 11% 13% 16% 15% 22% 15% 13% 16% 8% 31% 34% 26% 26% 25% 22% 29% 28% 0% PHC SHC PHC SHC PHC SHC PHC SHC PHC SHC PHC SHC Akkar Bekaa BML South T5 Total Insurance Other Don t know Not needed Free health care Household pays all Cost sharing Figure 17: Cost share of health care for primary and secondary health care by region. One in seven households needed primary health care in the six months prior to the survey but were not able to received it, and one in ten households were unable to receive secondary health care. Households in South Lebanon were more likely to receive the needed assistance whereas the opposite occurred in Beirut-Mount Lebanon. However the response rate for this question was low and varied by region, limiting the validity of this result % 90% 80% 70% 23% 36% 33% 23% 30% 13% 60% 50% 40% 30% 20% 10% 17% 47% 14% 39% 18% 34% 8% 54% 26% 14% 32% 15% 39% 13% 5% 21% 34% 13% 31% 20% 11% 19% 13% 50% 21% 13% 11% 10% 25% 28% 0% Akkar Bekaa BML South T5 Total Akkar Bekaa BML South T5 Total PHC SHC Figure 18: Receipt of health care assistance by region. Not required Not able to receive Received when needed 29
31 7.2 Barriers to health care The main reason for households not receiving the required health assistance was the cost of drugs/treatment and doctor s fees. One fifth of households had been rejected by hospitals or health centres. Rejection from a health centre was more common for households in the Bekaa Valley and Beirut-Mount Lebanon and inadequate welcoming in health centres was more common for households in Tripoli + 5. Distance and transportation cost was a more common barrier to receiving health care assistance for households in Akkar whereas households in South Lebanon more often did not know where to go for treatment % 140.0% 120.0% 100.0% 80.0% 60.0% 40.0% 20.0% 0.0% 4% 11% 3% 4% 9% 16% 9% 32% 6% 10% 22% 9% 15% 24% 9% 12% 13% 5% 23% 4% 18% 19% 27% 47% 46% 40% 5% 31% 40% 27% 40% 49% 52% 41% 38% 45% Akkar Bekaa BML South T5 Total Pending Appointment Physical limiteagons to access the health center Other Inadequete welcoming/treatment by health center staff Distance of health center/ transportagon costs Dont know where to go Rejected Cant afford doctors fees Cost of drugs/treatment Figure 19: Reason for not receiving required health assistance by region. 7.3 Child Health Nationwide 1,770 children between the age of 6 and 59 months were surveyed for health. Among them, 750 children under the age of 2 (6 23 months) were assessed for infant and young child feeding (IYCF) practices. Table 18 and 19 show the age and sex distribution of the sample. Female Male Total Age Number % Number % Number % 6-11m % % % 12-23m % % % 24-35m % % % 36-47m % % % 48-59m % % % Total % % % Table 18: Number and proportion of children sampled by sex and age group by region. Akkar Bekaa BML South T5 Total Number % Number % Number % Number % Number % Number % 6-23m % % % % % % 24-59m % % % % % % Total % % % % % % Table 19. Number and proportion of children 6-23 months by region. 30
32 The majority (68%) of children under the age of 5 were sick during the two weeks prior to the survey. The most common symptoms were fever (51%), cough (45%) and diarrhoea (35%), while 14% of children who were sick had other symptoms including allergy, infections, asthma or measles. Half of all children (71% of the sick children) were sick with more than 2 symptoms, a sign of sickness severity 19. Child sickness was higher for children under 2 years old, compared to those between 2 and 5 years of age, mainly due to diarrhoea and fever; sickness severity was also higher in children under 2 years of age. The level of child sickness was higher in 2014, as compared to 2013 when less than half of children were sick in the two weeks prior to the survey. In 2014, children were more likely to have diarrhoea, a cough or a fever and had a higher sickness severity months months Sick 76% 62% Diarrhoea 48% 26% Cough 49% 41% Fever 60% 43% Others 12% 15% 2 symptoms 58% 41% Table 20. Percentage of children sick and main symptoms by age group. Sick children were more common in Akkar and South Lebanon and less common in Beirut-Mount Lebanon, but differences were not significant. Sickness severity, the prevalence of diarrhoea, a cough, and a fever was also highest in Akkar and South Lebanon and lowest in Beirut-Mount Lebanon. 180% 160% 140% 120% 100% 80% 60% 40% 20% 0% 11% 14% 10% 18% 14% 53% 16% 60% 50% 52% 51% 44% 57% 44% 53% 45% 45% 37% 40% 39% 27% 37% 35% 35% Akkar Bekaa BML South T5 TOTAL 100% 90% 80% 70% 60% 50% 40% 30% 20% 10% 0% Other Fever Cough Diarrhea Sickness 2 Symptoms Figure 20: Percentage of children sick and main symptoms by region and total. 8. SECURITY Twelve percent of households experienced some type of insecurity in Lebanon during the three months prior to the survey, compared to ten percent in Feeling of insecurity was significantly more common in Beirut-Mount Lebanon (18%), followed by Akkar and Tripoli + 5 (15%), and less common in the Bekaa Valley (5%) and South Lebanon (9%). Of households who experienced insecurity, 66% experienced insecurity that limited the movement of household members. This was more common in Akkar (84%) than in Beirut-Mount Lebanon (52%). Nine percent of all households experienced harassment, violence and/or physical assault. Extortion was much less common than in 2013, reported by 27% of households who felt insecure, compared to 8% of insecure households in Cross border shelling was a major concern only in Akkar. Insecurity was mainly caused by neighbours and armed groups. Shop owners were a more common cause on insecurity in Akkar. 31
33 Figure 21: Type of insecurity experienced by household who felt insecure by region. 120% 100% 80% 60% 40% 20% 0% 10% 11% 3% 5% 9% 8% 9% 12% 8% 16% 3% 8% 18% 15% 9% 6% 4% 8% 16% 10% 4% 12% 11% 12% 4% 4% 10% 4% 12% 19% 12% 11% 12% 9% 53% 12% 57% 42% 36% 45% 24% Akkar Bekaa BML South T5 Total Clashes, rockets, gunfire Refugee leaders/community Armed groups Shop owners Hosts / landlords Local organisamons Local authorimes Armed Groups Neighbours Figure 22: Cause of insecurity experienced by household who felt insecure by region. 9. LIVELIHOOD SOURCES 9.1 Source of income in Lebanon In one fourth of households no household member were able to work during the 30 days prior to the survey and in nearly one third of households there were 5 or more non-working persons per working household member. In Akkar, the number of working household members was significantly lower, and the percentage of households without any working members was 3 times higher than in Beirut-Mount Lebanon and South Lebanon, where half of the population had at least one working member per four non-active ones. In the Bekaa Valley and Tripoli + 5, one third of households had no working members and similar percentage had at least one working member per four dependents. 32
34 100% 90% 80% 70% 60% 13% 13% 21% 22% 17% 17% 17% 25% 20% 26% 32% 21% 32% <= 2 dependents/working member 3-4 dependents/working member 50% 40% 30% 20% 10% 0% 32% 33% 31% 32% 32% 49% 31% 30% 26% 16% 14% Akkar Bekaa BML South T5 Total or more dependents per working member No working members Median Figure 23: Dependents per working household member by region. Each working member has, on average, one employment that in three fourth of cases was temporal (74%) while 21% was permanent. In Akkar, working members were more likely to have more than one job than in the rest of the country. In Akkar and the Bekaa Valley people were less likely to gain permanent employment (13% and 10%, respectively) than in South Lebanon or Tripoli + 5 (23% and 29%, respectively). Seasonal employment was most common in South Lebanon. Although the food voucher is restricted cash assistance, it constitutes the most important livelihood source for Syrian refugees in Lebanon and an increasingly important primary livelihood source 59% of all households rely on the food voucher as one of their three main livelihood sources. Non-agricultural casual labor (50%) and loans and credits (44%), mainly informal, are the second and third most important livelihood sources. Dependency on these livelihood sources has increased since 2013, when 44% relied on non-agricultural casual labour and 16% on credits or loans. Households relying on skilled work has halved in 2014 (21%) compared to 2013 (40%), while proportions for gifts (12%) agricultural casual labour (8%) remain similar. Number of livelihood sources per household has slightly increased compared to The food voucher was the primary livelihood source for 40% of households, followed by non-agricultural casual labour (29%) and skilled work (14%). This is a significant change from 2013 when 24% of households relied upon the food voucher as their primary source of income and another 24% of households relied upon skilled work as their primary source of income. Food voucher was the primary livelihood source in Akkar and South Lebanon but mainly in the Bekaa Valley (67%) where only 1% of households relied upon skilled work as their primary income source. In Beirut-Mount Lebanon, non-agricultural casual labour and skilled work were the primary sources of income, followed by the food voucher, whereas in Tripoli + 5, non-agricultural casual labor and food vouchers are equally important as primary livelihood sources, followed by skilled work. In South Lebanon agricutural casual labor and skilled work were the third most important primary livelihood source, whereas In Akkar more households relied on formal credits as their primary livelihood source. One fifth of households had only one livelihood source. The proportion of households with only one livelihood source was highest in Akkar and Tripoli + 5 (more than 34%) and lowest in the Bekaa Valley were more households had three livelihood sources than in other regions (77% compared to less than 36%). Informal debts or credits and to non-agricultural casual labour were the secondary livelihood sources for one fifth of households each. Gifts from family or friends (6%), skilled work (5%), agricultural labour (4%), savings (3%) and formal debts (3%) where the other significant secondary livelihood sources for households in Households in Akkar, South Lebanon and Tripoli + 5 relied mainly on food vouchers and non-agricultural casual labour as their second livelihood source; in the Bekaa Valley households relied on non-agricultural casual labour and informal credits; and in Beirut-Mount Lebanon households relied on informal credits and the food voucher. Less than half of the households had a third livelihood source, and informal debts or credits were the most reported one in all regions except in Akkar where fod vouchers was more important. More households were using informal debts or credits as a third livelihoods source in 2014 than in 2013, 18% of total households compared to 5%. 33
35 In 2014, households 100% 90% 80% 70% 60% 50% 40% 30% 20% 10% 0% 7% 17% 9% 14% 11% 35% 35% 17% 37% 29% 48% 67% 37% 44% 35% 40% 11% Akkar Bekaa BML South T5 Total Other Formal credit Savings GiGs Agric. casual labor Informal credit/debts Skilled work Non- agric. casual labor Food voucher Figure 24: Primary livelihood source in Lebanon, by region. 9.2 Livelihood sources in Syria In Syria, the main livelihood sources for households was skilled work and non-agricultural casual labour; 55% and 38% of households relied on these activities as one of the three most important livelihood sources. Half of the households had more than one livelihood source and one fifth of households had at least three sources of money. Households that had skilled work as a main source of income in Syria have tended to settle more in Beirut-Mount Lebanon and Akkar, while households that had non-agricultural casual labour as their main source of income have tended to settle in the Bekaa Valley, South Lebanon and Tripoli + 5. The proportion of households that depended on agricultural casual labour in Syria was higher in the Bekaa Valley. Households that previously relied on the sale of crops were more common in Akkar, the Bekaa Valley and South Lebanon. 100% 90% Gi>s 9% 6% 7% 8% 80% 10% Other 10% 12% 10% 9% 70% 14% 7% Sale of livestock 14% 14% 10% 10% 60% 24% 10% Informal commerce 50% 18% 28% Formal commerce 29% 32% 40% 33% Sale of crops 30% 46% Agric. casual labor 20% 37% 27% 28% 33% 10% 22% Non- agric. casual labor 0% Skilled work Akkar Bekaa BML South T5 Total Figure 25: Livelihood sources of the refugee households in Syria, by region. 34
36 10. EXPENDITURE Households spent US$762 per month on average; of which three quarters (77%) was spent to cover the need for food 20, rent and health care. Expenditure per capita was US$138 per month on average. Households total expenditure decreased between 2013 and 2014, reflecting the decrease in expenditure mainly on food, but also on transportation and tobacco. On the other hand, expenditure per capita between 2013 and 2014 increased for rent 21. Household expenditure in 2014 was higher in Beirut-Mount Lebanon and lower in Akkar and the Bekaa Valley. The main regional differences of expenditure per capita were on rent, water and transportation. There were no significant regional differences for health, assets, education or clothing both at household level and per capita level. Household expenditure between Akkar and the Bekaa Valley was significantly different (US$103), however due to the difference in household size expenditure per capita was comparable. Akkar Bekaa BML South T5 Total HH PC HH PC HH PC HH PC HH PC HH PC Food Rent Health Tobacco/alcohol Hygiene Transport Fuel Telecom Electricity Water Clothing Education HH assets Others Total Table 21: Average household and per capita monthly expenditure by category and region Akkar Bekaa BML South T5 TOTAL Others HH assets Educa=on Clothing Water Electricity Telecom Fuel Transport Figure 26: Household monthly expenditure per capita by category by region. 35
37 10.1 Relative household monthly expenditure On average, 44% of the total household s monthly expenditure was to buy food; 24% was to pay the rent, while the remaining 32% was on other expenses, mainly health (9%), followed by tobacco/alcohol and hygiene items (4%) or fuel, transport, telecommunications and electricity (3%). 3% 2% 3% 3% 3% 4% 4% 9% 1% 1% 0% 0% Food Rent Health Tobacco/Alcohol Hygiene 44% Fuel Transport TelecomunicaAons Electricity Water Clothing EducaAon 24% HH assets Others Figure 27: Household monthly expenditure share by category. Table 22 show the expenditure share on each category by region and total. Food expenditure share was significantly higher in the Bekaa Valley and Akkar than in Tripoli+5 or Beirut-Mount Lebanon and also higher in the South than in Beirut-Mount Lebanon. On the other hand, the expenditure share on rent was significantly higher in Beirut-Mount Lebanon and Tripoli+5 (28%) than in Akkar, the Bekaa Valley or South Lebanon (20%). In Beirut-Mount Lebanon the expenditure share on water was significantly higher than in the rest of the country. In South Lebanon expenditure on tobacco/alcohol was relatively higher than in Beirut-Mount Lebanon, Akkar and Bekaa. Expenditure share on hygiene items was significantly higher in Akkar. Expenditure share on fuel is significantly higher in Akkar and the Bekaa Valley than the rest. Proportion of the expenditure on transportation was significantly higher in Beirut-Mount Lebanon compared to the other regions, where the lowest was in the Bekaa Valley. The households in the Bekaa Valley and Tripoli+5 tend to spend relatively more on electricity than in Akkar, where the expenditure share on clothing was higher. The expenditure share on communications tended to be higher in South Lebanon and lowest in Akkar. Akkar Bekaa BML South T5 Total Food 47% 49% 37% 45% 41% 44% Rent 20% 20% 28% 20% 27% 23% Health 10% 9% 8% 9% 8% 9% Hygiene 4.4% 3.1% 3.6% 3.8% 3.8% 3.7% Tobacco/Alcohol 2.6% 3.7% 3.9% 4.7% 3.3% 3.6% Fuel 4.3% 4.2% 2.8% 2.9% 3.3% 3.5% Transport 2.9% 1.7% 4.6% 3.6% 2.9% 3.1% Telecommunications 2.3% 2.4% 2.8% 3.3% 3.2% 2.8% Electricity 1.7% 3.1% 2.4% 2.4% 2.5% 2.4% Water 1.3% 1.7% 3.0% 1.6% 1.9% 1.9% Clothing 2.2% 0.7% 1.0% 1.9% 1.6% 1.5% Education 0.7% 0.6% 1.3% 0.8% 0.9% 0.9% HH assets 0.7% 0.3% 0.4% 0.5% 0.4% 0.4% Others 0.6% 0.2% 0.7% 0.4% 0.0% 0.4% Table 22: Expenditure share by category by region. 36
38 Food expenditure share is one of the indicators included to calculate food security. It is assumed that the higher expenditure share on food implies that the household has less resources available for other non-food essential expenditures like health, education or shelter. Food expenditure share is classified into 4 categories using the thresholds of 50%, 65% and 75%. One third of households spent more than half of their monthly budget on food, which represents a decrease compared to the 20% found in However, 11% of households spent more than 65% of their expenditure on food. Regional differences were significant, households in Akkar and the Bekaa Valley were more likely to have a higher expenditure share on food, contributing to their food insecurity. 100% 90% 80% 70% 60% 50% 40% 30% 20% 10% 0% 55% 55% 82% 68% 74% 67% 28% 27% 9% 24% 22% 17% 9% 13% 8% 9% 3% 2% 5% 3% 6% 6% 3% 5% Akkar Bekaa BML South T5 Total <50 Low Medium High >75 Very high Figure 28: Households by food expenditure share by region Poverty line and minimum expenditure basket Half of all households were below the Lebanese national extreme poverty line, established at US$3.84 per person per day (UNDP 2014) 23. It showed a slight decreased compared to 2013 if only the expenditure categories common for both surveys are considered 24. The proportion of households below the extreme poverty line was significantly lower in Beirut-Mount Lebanon (31%) and higher in the Bekaa Valley and Akkar (62%). The Minimum Expenditure Basket (MEB) represents the minimum set of food and non-food items considered essential for a household to cover the basic needs of all members for one month 25. The cost of the MEB, which is estimated in US$640, reflects the minimum monthly expenditure that an average household of 6 members 26 should have to ensure their basic needs. The Survival Expenditure Basket (SEB) is a subset of the MEB that includes the minimum quantities of food and non-food items considered essential to cover the survival needs of all members for one month. The cost of the SEB indicates the minimum monthly expenditure required by an average household to ensure their survival needs. It is estimated to be US$502 for a household of 6 members. Households were subsequently classified in 4 categories according to the proportion of the MEB and SEB that was covered in their total expenditure 27 below the SEB; between the SEB and MEB; between the MEB and 125% of the MEB; and above 125% of the MEB. The categories were established to estimate the probability of the household to be able to cover their survival and basic needs. One quarter of all households were below the SEB and 43% were below the MEB. Regional differences were significant and households in Beirut-Mount Lebanon were significantly more likely to have a total expenditure above 125% the MEB. This percentage was also higher in South Lebanon and Tripoli + 5 compared to Akkar or the Bekaa Valley where households were more likely to be below the SEB. 37
, one quarter (24%) was on fruits, vegetables and dairy products and one quarter")
39 Figure 29: Household classification according to Minimum Expenditure Basket 28 categories and extreme poverty line by region Relative household monthly expenditure by food group One quarter of monthly expenditure on food was on bread (23%), one quarter (24%) was on fruits, vegetables and dairy products and one quarter (25%) was on cereals, fats, meat, fish and eggs. There were significant regional differences, and households in Akkar and Tripoli + 5 spent relatively more on bread than in South Lebanon. Expenditure on cereals was higher in Akkar and the Bekaa Valley compared to Beirut-Mount Lebanon and Tripoli + 5. Also in these two regions, the expenditure on pulses was higher than elsewhere. Expenditure share on dairy products was higher in Beirut-Mount Lebanon and Tripoli + 5 than in the Bekaa Valley. Expenditure on sugar was relatively higher in South Lebanon and the Bekaa Valley compared to Beirut-Mount Lebanon and Tripoli + 5. In Beirut-Mount Lebanon the expenditure on canned food was higher than in Akkar. Expenditure share on meat, fish or eggs was higher in South Lebanon, Tripoli + 5 and Beirut-Mount Lebanon compared to the Bekaa Valley and Akkar. Expenditure on fruits and vegetables was relatively higher in South Lebanon than in other regions. Expenditure share on cooked food was higher in Akkar than in the Bekaa Valley or South Lebanon and share on other food items was higher in South Lebanon than in Tripoli + 5. Table 23 shows the average expenditure on each food group per region at household level and per capita. Expenditure on food per capita was significantly higher in Akkar, followed by Tripoli + 5 and Beirut-Mount Lebanon and lowest in the Bekaa Valley. Akkar show higher expenditure on cereals, tubers and pulses than any other regions and higher expenditure on sugar compared to Beirut-Mount Lebanon. Together with Tripoli + 5, Akkar also showed higher expenditure on bread and fats. Expenditure per capita on dairy products was significantly lower in the Bekaa valley. Households, including per capita, in South Lebanon tended to spend more on fruits and vegetables. Expenditure per capita on meat, fish and eggs was higher in Tripoli + 5 and Beirut-Mount Lebanon than in the Bekaa Valley where expenditure on these items was lowest. 38
40 Pulses, 5% Other, 3% Cooked, 1% Sugar, 6% Bread, 23% Cans, 6% Tubers, 7% Meat, fish & eggs, 8% Fruits & veg., 13% Fats, 9% Dairy, 11% Cereal, 9% Figure 30: Food groups share. Akkar Bekaa BML South T5 Total HH PC HH PC HH PC HH PC HH PC HH PC Bread Fruits & veg Dairy Cereal Meat, fish & eggs Fats Tubers Cans Sugar Pulses Other Cooked Total Food Table 23: Average expenditure by food group per household and per capita, by region. 11. Food consumption and source In 62% of households, adults consumed less than 3 warm or cooked meals in the day prior to the survey and in 23% of households they consumed 1 or less cooked meals. Children under the age of 5 years old consumed less than 3 warm or cooked meals in the day prior to the survey in 41% of households. For adults the average number of meals per day was lowest in Akkar (1.3), followed by Tripoli + 5 (1.7) and Beirut-Mount Lebanon (2.3), and highest in the Bekaa Valley and South Lebanon (2.5 in both). For children, the trend was similar with the lowest number of meals per day in Akkar (1.5) followed by Tripoli + 5 (1.9), the Bekaa Valley and Beirut-Mount Lebanon (2.8) and highest in South Lebanon (3.6). Children were prioritised access to food in one third of households, but the majority of households gave all members the same access to food. Children were more often prioritised in Beirut-Mount Lebanon and South Lebanon and less often prioritised in Akkar. 39
41 Akkar Bekaa BML South T5 Total Number of 1 meal 70% 4% 16% 4% 50% 23% meals- adults 2 meals 22% 44% 41% 44% 31% 38% 3 meals 7% 52% 43% 53% 19% 38% Number of 1 meal 58% 4% 16% 2% 39% 19% meals- children 2 meals 21% 24% 17% 14% 28% 21% under 5 3 meals 22% 72% 67% 85% 33% 59% Cook daily basis No 24% 29% 15% 12% 17% 20% Priority access Adult female 0% 1% 0% 1% 0% 1% food Adult male 1% 2% 1% 2% 1% 1% All equal 90% 59% 51% 56% 69% 62% Children 8% 37% 48% 41% 29% 36% Elders 1% 1% 0% 1% 1% 1% Table 24: Meals per day and access to food by region. One fifth of households were not able to cook food at least once a day on average. This was mainly due to a lack of food to cook (83% of households), which increased as a reason for not cooking compared to 2013 (61%). Insufficient fuel, cooking utensils or kitchen stove were also reported as reasons for households not being able to cook on a daily basis. The percentage of households not able to cook at least once a day was significantly higher in the Bekaa Valley (29%) and Akkar (24%), and lower in South Lebanon (12%). More households in Tripoli + 5 had sufficient food to cook, as compared to other regions, while a lack of stove or kitchen was a determining factor for more households in Beirut-Mount Lebanon (24%) and Akkar (18%) and less in the Bekaa Valley (3%). Figure 31: Reasons for not cooking by region % 90% 80% 70% 60% 50% 40% 30% 20% 10% 0% 18% 22% 19% 74% 7% 14% 92% 6% 7% 7% 5% 8% 9% 24% 19% 7% 11% 16% 16% 22% 14% 86% Akkar Bekaa BML South T5 Total Lack of adequate safe water No Cme or can t cook Others Lack of stove / kitchen Lack of utensils Lack of cooking fuel Lack of food to cook 11.1 Diet diversity Households consumed, on average, 9 out of the 12 food groups considered 29 in a week and 7 out of the 12 food groups on a daily basis. Almost all interviewed households (95%) consumed 7 or more food groups in the week prior to the survey, and 5 or more food groups per day. However, the Household Daily Average Diet Diversity (HDADD) 30 and the Household Weekly Diet Diversity (HWDD) 31 decreased compared to 2013 (7.4 to 6.8 and 9.7 to 9.4, respectively). The highest HWDD and HDADD was in South Lebanon; the lowest HWDD was in Akkar; and the lowest HDADD was in Beirut-Mount Lebanon. HWDD Mean Akkar 9.0 0% 2% 3% 24% 71% Bekaa % 1% 3% 21% 75% BML % 1% 2% 23% 74% South 9.8 0% 0.3% 1% 17% 82% T % 1% 5% 23% 72% Total % 1% 3% 22% 74% Table 25: Household weekly diet diversity by region. 91% 58% 83%

42 HDADD Mean < Akkar 6.6 1% 3% 5% 37% 54% Bekaa % 1% 2% 27% 71% BML 6.5 1% 1% 5% 40% 52% South 7.2 0% 0% 2% 25% 73% T % 1% 4% 32% 63% Total 6.8 1% 1% 4% 32% 63% Table 26: Household daily diet diversity by region Food Consumption Score Food Consumption Score (FCS) is a composite indicator of dietary diversity, food frequency and nutritional intake, based on which households are classified into three categories: poor, border line and acceptable FCS 32. In 2014, 3% of households had poor FCS, 10% had border line and 87% acceptable FCS -which represents a deterioration compared to the 93% of households with acceptable FCS in Although the average FCS was significantly higher in South Lebanon, there were no statistical differences in the FCS categories between regions. The main difference among food consumption categories was the intake of protein rich food groups such as meat and dairy products and to a lesser extent pulses. Differences were also observed for fruit and vegetable consumption. 100% 90% 80% 70% 60% 50% 40% 30% 20% 10% 0% 73 89% 85% 85% 85% 87% 69 92% % 5% 7% 13% 9% 3% 2% 6% 2% 6% 10% 3% Akkar Bekaa BML South Tripoli 5 Total Poor Border line Acceptable Mean Figure 32: Food consumption score by region. Figure 33: Consumption frequency by Food Consumption Score categories. 41
43 11.3 Food consumption patterns Most households had acceptable food consumption and diet diversity; however, the food groups most consumed (bread, condiments, sugar and fat) have low nutrient values. Furthermore, 60% of households did not consume any Vitamin A rich vegetables or fruit 33 during the week prior to the survey and 43% of households did not consume any iron rich food groups, such as meat or fish. The main source of vitamin A was dairy products and eggs. This food consumption pattern may increase the risk of micronutrient deficiencies, especially in iron deficiency anaemia and children, who are recommended to have daily intake of vitamin A rich fruits and vegetables and meat or fish. 100% 90% 80% 70% 60% 50% 40% 30% 20% 10% 0% 96% 93% 87% 84% 58% 57% 37% 29% 4% 9% 15% 6% 1% 4% 1% 5% 15% 2% 1% 1% 1% 0% 17% 13% 10% 6% 7 13% 25% 24% 29% 26% 6 85% 79% % 61% 7% 15% 19% 2% 52% % 87% 89% 94% 3 68% 72% 2 47% Figure 34: Food consumption by food group. 6-7 days/week 1-5 days/week 0 days/week Median Mean Cereals, including bread and pasta, as well as pulses were less often consumed in Beirut-Mount Lebanon while households in Akkar consumed more tubers and households in the Bekaa Valley consumed more green leafy vegetables. Dark yellow and orange vegetables were consumed more often in Tripoli + 5 and Akkar and less in the Bekaa Valley whereas households in South Lebanon had a higher consumption of non-vitamin A rich vegetables and fruits as well as eggs. Meat was more often consumed in Beirut-Mount Lebanon, South Lebanon and Tripoli + 5 while households in the Bekaa Valley and South Lebanon consumed more fish. More sugar and fats were consumed in the Bekaa Valley, South Lebanon and Tripoli + 5; more condiments were consumed in the Bekaa Valley and Tripoli + 5; and more dairy products were consumed in South Lebanon. Average consumption of most food groups has decreased in 2014 compared to 2013, specially of tubers, vegetables, eggs and dairy products. 42
44 Akkar Bekaa BML South T5 Total Total Cereals Bread and pasta Tubers Pulses Green leaves Dark yellow /orange vegetables Other vegetables Dark yellow/ orange fruits Other fruits Organ meat Flesh meat Eggs Fish/seafood Sugar/sweets Dairy products Fats/oil Condiments Table 27: Number of days per week each food group was consumed by region and year Infant and young child feeding Half of the 750 children between 6 and 23 months old surveyed were breastfed the day prior to the survey, although breastfeeding practice decreased with child s age. The majority (63%) of children between the age of 6 and 23 months received complementary feeding 34, and the introduction of foods different from breast milk increased with age. More than 80% of children between 6 and 23 months did not have the minimum acceptable meal frequency 35 and same percentage did not meet the minimum diet diversity the day prior to the survey 36 ; children under 1 year of age were significantly less likely to meet the minimum diet diversity than older ones. Only 4% of children were consuming the minimum acceptable diet according to World Health Organization (WHO) Infant and Young Child Feeding (IYCF) guidelines. The proportion of children receiving complementary food and minimum acceptable food frequency decreased, compared to % 80% 70% 60% 50% 40% 30% 20% 10% 0% 80% 45% 24% Breastmilk 45% 69% 79% Complementary feeding 20% 16% 16% Minimum acceptable frequency Figure 35: Infant and young child feeding practises by age group. 28% 24% 6% 3% 2% 4% Minimum diet diversity Minimum acceptable diet 6-11m 12-17m 18-23m Half of all 6-23 months aged children consumed grains, roots and tubers and similar percentage consumed dairy products the day prior to the survey. Although it is recommended that children between the age of 6 and 23 months have a daily intake of vitamin A-rich fruits and vegetables and meat or fish, less than 10% of children within this age range consumed these food items. Consumption of the different food groups increased with child s age, especially between the children aged under and over 1 year old. Child formula was consumed by 21% of children, significantly more by those under 1 year old, but less than in The proportion of children consuming pulses and mainly grains and tubers has increased, as compared to 2013, while consumption of vegetables and fruits has decreased. 43
45 90% 80% 70% 60% 50% 66% 81% 62% 69% 44% 6-11m 40% 30% 20% 10% 31% 34% 33% 9% 31% 18% 17% 30% 28% 8% 25% 23% 13% 12% 9% 11% 4% 3% 1% 12-17m 18-23m 0% Cereals Dairy Eggs Formula Other fruits & veg. Pulses Vitamin A Meat, fish rich fruits & veg Figure 36: Percentage of children by age group that consumed each food group. Children in South Lebanon had better IYCF practices; a significantly higher proportion of children in South Lebanon received complementary feeding, had adequate meal frequency, consumed grains and tubers and non-vitamin A rich vegetables and fruits, and met the minimum acceptable diet. Akkar Bekaa BML South T5 Total Breast milk 54% 48% 54% 61% 46% 52% Complementary feeding 59% 67% 52% 79% 65% 63% Minimum acceptable frequency 18% 17% 12% 35% 16% 18% Minimum diet diversity 14% 18% 16% 24% 17% 18% Minimum acceptable diet 1% 4% 3% 12% 1% 4% Formula 24% 13% 27% 31% 19% 21% Grains, roots, tubers 49% 60% 46% 67% 62% 56% Dairy products 46% 63% 48% 59% 49% 54% Eggs 26% 23% 21% 34% 31% 26% Other vegetables and fruits 15% 22% 13% 30% 24% 20% Legumes & nuts 12% 15% 18% 16% 19% 16% Vitamin A rich fruits and vegetables 10% 9% 8% 10% 7% 9% Meat & fish 8% 4% 5% 8% 6% 6% Table 28: Infant and Young Child Feeding indicators by region Food sources The major sources of food was the market and food vouchers. Food vouchers were significantly more important as sources of food in the Bekaa Valley and Akkar while market purchases were more common in Beirut-Mount Lebanon and Tripoli + 5. Obtaining food on credit was more frequent in the Bekaa Valley while borrowing food was more common in South Lebanon and other food aid (not including food vouchers) was more frequent in Tripoli
46 100% 5% 12% 8% 7% 90% 7% 8% 80% 70% 32% 36% 47% 41% 60% 52% 42% 50% 40% 30% 56% 53% 43% 40% 45% 20% 34% 10% 0% Akkar Bekaa BML South T5 TOTAL Figure 37: Food sources by region. Other Cash In Kind Food Aid GiEs Borrowing Credit Food Voucher Market More than half of households used food vouchers to buy fats, sugar, cereals and spices and close to 50% use it to get milk, eggs, fish and pulses. Most households (60-80%) purchased the remaining food items with their own budget, especially for fresh food like vegetables and fruits and meat. 100% 90% 80% 70% 60% 50% 40% 30% 20% 10% 0% 30% 30% 31% 35% 39% 39% 40% 42% 57% 68% 68% 77% 71% 77% 75% 80% 81% 59% 59% 58% 54% 48% 48% 47% 47% 26% 23% 17% 12% 11% 11% 10% 9% 9% Other Cash assistance Other Food aid Gi<s Borrowed Credit Market Food Voucher Figure 38: Main sources of food by food item. 12. Coping strategies Two thirds of households experienced a lack of food or money to buy food during the month prior to the survey, an increase from 48% in A lack of food or money to buy food was more common in the Bekaa Valley and less common in Beirut-Mount Lebanon. Almost all households experiencing a shortage of food applied food consumption related coping strategies (FCRCS). The most common coping strategies (CS) were relying on less preferred or expensive food, reducing meal portion sizes and reducing the number of meals per day, that were applied by more households than in Households reducing the number of meals eaten per day was more common in Tripoli + 5 (77%) and less common in the Bekaa Valley (60%), where it was more common to restrict adult consumption in order to feed young children (58%) than in Tripoli + 5 (43%) or Akkar (40%). Spending days without eating was more common in Beirut-Mount Lebanon (29%) than in other regions (less than 10%). Restricting consumption women was also more common in Beirut-Mount Lebanon (13%), especially compared to the Bekaa Valley (4%). Akkar Bekaa BML South T5 Total Lack of food 74% 80% 47% 66% 73% 67% FCRCS 99% 99% 99% 97% 100% 99% Table 29: Proportion of households that had a lack of food or money to buy food and households that applied food consumption related coping strategies in the 30 days prior to the survey. 45
47 Less preferred/expensive food 95% Reduced meals por8on size Reduced number of meals 68% 74% Restrict consump8on by adults Borrowed food/help from friends or rela8ves 49% 46% Send household members to eat elsewhere 12% Spent days without ea8ng Restrict consump8on of female household members. Figure 39: Food related coping strategies by region. 7% 12% 0% 20% 40% 60% 80% 100% Akkar Bekaa BML South T5 Total Households that experienced a lack of food or money to buy food also applied non-food consumption related coping strategies, known as assets depletion coping strategies (ADCS) 37. The most common ADCS were buying food on credit or borrowing money to buy food, reducing essential non-food expenditures such as health or education, spending savings, selling household goods or withdrawing children from school. Households were more likely to reduce essential non-food expenses and buy food on credit than in 2013, but less likely to sell household goods, productive assets, house or land, spend savings or marry children under 18. This may be due to these assets and savings having already been depleted. Households reducing essential non-food expenditures was more common in South Lebanon (54%) and less common in Beirut-Mount Lebanon (6%). While households spending savings was more common in Akkar, the Bekaa Valley and Tripoli + 5 ( 21%) and less common in Beirut-Mount Lebanon (8%); and withdrawing children from school was more common in the Bekaa Valley and South Lebanon (23% and 24%, respectively) than in Beirut-Mount Lebanon or Akkar (6%). It was more common in South Lebanon to accept high risk, illegal, socially degrading or exploitative temporary jobs/activities (12%) or to send adult household members to find work elsewhere 38 (13%) than in other regions. 44% Reduce essencal non- food expenditures such as 30% Spent savings 21% Selling household goods (radio, furniture, television, 18% Withdrew children from school 16% Have school children (6-15 years old) involved in 8% Sent an adult household member sought work 5% Sell /produccve assets or means of transport (sewing 3% Begged 2% Accept high risk, illegal, socially degrading or 2% Marriage of children under 18 2% Sold /house or land 1% 0% 10% 20% 30% 40% 50% 60% Akkar Bekaa BML South T5 Total Figure 40: Assets Depletion Coping Strategies by region. 46
48 ADCS were classified according to their severity or irreversibility into three categories Stress, Crisis and Emergency Coping Strategies. Stress coping strategies are the least severe category and emergency coping strategies are the most severe; the full methodology for classification is described in Annex XI. Half of the households that experienced a lack of food or money to buy food applied only stress coping strategies, 30% applied crisis coping strategies and 12% emergency coping strategies. Households in South Lebanon applied an emergency or crisis coping strategy more often, while households in Beirut-Mount Lebanon did not adopt a coping strategy or applied a stress coping strategy more often. Akkar Bekaa BML South T5 Total HH not adopting CS 4% 3% 11% 3% 5% 5% Stress CS 61% 51% 69% 32% 49% 53% Crisis CS 23% 35% 8% 43% 37% 30% Emergencies CS 12% 11% 12% 22% 9% 12% Table 30: Assets Depletion Coping Strategies classification by region Debts The majority of households borrowed money or received credit in three months prior to the survey, ranging from 74% of households in Beirut-Mount Lebanon to 88% of households in the Bekaa Valley. The main reasons for borrowing money or receiving credit were to buy food (more in Akkar and the Bekaa Valley), to pay rent (more often in the Bekaa Valley) and to cover health expenses (more frequent in Akkar). The proportion of households that borrowed to pay for food have decreased as compared to 2013 (81% to 73%), while the proportion of households that borrowed to cover health expenses increased from 25% of households in 2013 to 31% of households in % 80% 73% 70% 60% 50% 50% 40% 30% 31% 20% 10% 0% 5% 3% 3% 1% 1% Buy food Pay rent Health care Water Transport Others EducaCon Legal fees Akkar Bekaa BML South T5 Total Figure 41: Reasons for borrowing money and receiving credit by region. The main sources of loans or credits were friends or relatives living in Lebanon. In Akkar, households getting credit from friends or relatives out of Lebanon was higher than in other regions. Akkar Bekaa BML South T5 Total Borrow money / credit 83% 88% 74% 82% 82% 82% Friends/relatives in Lebanon 84% 94% 91% 92% 93% 92% Friends/relatives out of Lebanon 12% 4% 6% 4% 6% 6% Others 2% 6% 7% 6% 0.4% 5% Money lender 2% 0.3% 0% 4% 1% 1% Bank/ formal institution 0% 0% 0.4% 0.3% 0% 0.1% Local Inst./ Charity 0% 0.3% 0% 0% 0% 0.1% Informal saving group 0.3% 0% 0% 0% 0% 0% Table 30: Assets Depletion Coping Strategies classification by region. 47
49 The majority of households had some debts (81%); half of all households had debts of US$400 or more and the average level of debt was US$674 per household with some debt 39. The proportion of households in debt increased in 11% as compared to 2013, as well as the amount of debt; in 2014, 9% more households had debts of more than US$200. Akkar Bekaa BML South T5 Total Average (US$) Median (US$) Mode (US$) Table 32: Total amount of debts by region (of households that borrowed money in the last 3 months) 100% 90% 21% 21% 31% 28% 35% 80% 28% 70% 60% 24% 34% 28% 50% 34% 35% 31% 40% 22% 33% 30% 26% 18% 20% 17% 23% 10% 17% 27% 13% 18% 18% 19% 0% Akkar Bekaa BML South T5 Total Figure 42: Amount of debts by region US$601 US$ US$200 No debt Mean Median 13. Food security The classification of households according to their food security situation is based on a composite indicator that considers food consumption, food expenditure share and coping strategies. The criteria provide a score, between 1 and 4, that reflect the two key dimensions of food security status: the current situation of household (short term) as measured by the Food Consumption Score (FCS) and food consumption related coping strategies; and the forward looking food security status as determined by the food expenditure share and coping strategies. Households were then classified into four food security categories: food secure, mildly food insecure, moderately food insecure and severely food insecure (see Table 33). Food consumption Food expenditure share Coping strategies 1 Food Security 2 Mild Food Insecurity Table 33: Thresholds and Point scale for food security classification. 3 Moderate Food Insecurity Borderline Acceptable Acceptable with food related coping strategies <50% 50-65% 65-75% >75% HH not adopting coping strategies Stress coping strategies Crisis coping strategies 4 Severe Food Insecurity Poor Emergencies coping strategies 48
50 Food Security Group Household Group Condition 1 - Food Security Able to meet essential food and non- food needs without engaging in atypical coping strategies 2 - Mild Food Insecurity Has minimally adequate food consumption without engaging in irreversible coping strategies; unable to afford some essential non- food expenditures 3 - Moderate Food Insecurity Has significant food consumption gaps, OR, Marginally able to meet minimum food needs only with irreversible coping strategies 4 - Severe Food Insecurity Has extreme food consumption gaps, OR, Has extreme loss of livelihood assets that will lead to food consumption gaps OR worse. Table 34: Food security classification, and associated condition. Three quarters of households had some degree of food insecurity, most of which were classified as mildly food insecure, also called marginally food secure. More households were experiencing some degree of food insecurity than in 2013, increasing from 66% to 75% of all households. The main determinant of food insecurity was the assets depletion coping strategies, with 28% of households applying crisis or emergency coping strategies, which represents an increase of 6% compared to Considering the FCS as proxy measurement of households current food security status, although the current food consumption was acceptable for most of the population (87%), the medium or long term food security situation could be compromised by an increasingly limited coping capacity. 1 Food Security 2 Mild Food Insecurity Table 35: Percentage of households per food security group and indicator. 3 Moderate Food Insecurity Food Security 25% 62% 12% 0.4% Food consumption 35% 52% 9% 3% Food expenditure share 68% 21% 6% 5% Coping strategies 13% 59% 20% 8% Coping capacity indicator 10% 68% 20% 2% 4 Severe Food Insecurity Households in Beirut-Mount Lebanon were more likely to be food secure, while households in the Bekaa Valley were less likely to be food secure. Households with moderate or severe food insecurity were more common in Akkar and the Bekaa Valley. 100% 90% 80% 18% 14% 43% 27% 19% 25% 70% 60% 50% 40% 30% 61% 70% 50% 60% 69% 62% Food secure Mild food insecurity Moderate food insecurity Severe food insecurity 20% 21% 10% 15% 6% 13% 12% 12% 0% 1% 1% 0% 0% 0% Akkar Bekaa BML South T5 Total Figure 43: Percentage of households per food security group by region. 49
51 1 Food Security 2 Mild Food Insecurity 3 Moderate Food Insecurity 4 Severe Food Insecurity Akkar 22,274 61,575 21,680 1,089 17% Bekaa 49, ,832 56,690 3,493 44% BML 13% 119, ,838 18,013 - South 33,087 78,770 18, % T5 32, ,498 17, % Total 256, , ,817 5, % % moderate or severe food insecurity Table 36: People 40 per food security group and region and percentage of moderate or severe food insecurity households per region out of the total. As of 5 June 2014, it is estimated that 131,817 Syrian refugees (UNHCR registered) were moderately or severely food insecure, 44% of which were located in the Bekaa Valley. In addition, 699,513 Syrian refugees were mildly food insecure, 41% of which were located in the Bekaa Valley. 14. Assistance Three quarters of households were considered eligible for WFP or UNHCR assistance, although eligible households were less common in Beirut-Mount Lebanon and more common in Akkar. Newly registered and pending registration households were more common in Beirut-Mount Lebanon and households that had been considered ineligible were more common in the Bekaa Valley and Beirut-Mount Lebanon. Households can include more than one registration case, therefore some household members could have been receiving assistance while others could be pending confirmation or had been found ineligible. Akkar Bekaa BML South T5 Total Eligible 86% 76% 62% 77% 80% 74% Not eligible 12% 27% 26% 18% 16% 22% Newly registered- pending decision 3% 5% 11% 3% 2% 6% Appealed- pending confirmation 1% 0% 5% 2% 3% 3% Others 2% 3% 0% 1% 1% 2% Not registered yet 1% 4% 0% 1% 0% 1% Table 37: eligibility for assistance by region. 80% 70% 60% 50% 40% 30% 20% 10% 0% 69% 39% 23% 21% 13% 12% 8% 5% 1% 1% 17% 13% 7% 7% 6% 6% 4% 1% 1% Food vouchers Hygiene kits Health care Food in kind Cash assistance Fuel subsidy Other NFI Rent subsidy Others Psychosocial EducaHon Furniture / clothes Water storage items Shelter material Toilets Cooking kits Other Legal Last 3 months Last year Figure 44: Type of assistance. 50
52 The most commonly provided assistance was food vouchers, received by 69% of households in the 3 months prior to the survey; followed by hygiene kits, health assistance and food in kind. In the year prior to the survey, education assistance and furniture or clothes were the most commonly received assistance, by 17% and 13% of households respectively. Less households received food vouchers (69%, compared to 73%), hygiene kits (39%, compared to 50%) and food in-kind (21%, compared to 32%) and more households received cash assistance (10%, compared to 6%), during three months prior to survey in 2014 than in During the 3 months before the survey, households in Beirut-Mount Lebanon were less likely to receive assistance than elsewhere. In Akkar more households received health assistance, fuel and specially food in kind and rent subsidy. In the Bekaa Valley, more households received hygiene kits, fuel subsidy, other NFIs and mainly cash assistance, whereas less households benefitted from food in-kind assistance than in other regions. In South Lebanon, hygiene kits were more commonly received than in other regions. While in Tripoli + 5, more households received food in kind and cash, but less fuel and hygiene items. 250% 200% 150% 100% 50% 0% 15% 14% 31% 11% 23% 23% 14% 16% 33% 15% 35% 30% 32% 12% 29% 51% 20% 58% 19% 44% 11% 22% 29% 72% 75% 55% 75% 71% Akkar Bekaa BML South T5 Psychosocial Other assistance Rent Other NFI Cash Fuel Food in- kind Health care Hygiene kits Food vouchers Figure 45: Assistance provided by region in the 3 months prior to the survey. Over the year prior to the survey households in Beirut-Mount Lebanon also received less assistance of all types, particularly for shelter materials, furniture and clothes, followed by Tripoli + 5. Households in Akkar received the most assistance, particularly of furniture and clothes, cooking kits. Households in the Bekaa Valley were more likely to receive water storage items and toilets compared to other regions. Education assistance was more common in South Lebanon, Akkar and the Bekaa Valley. 100% 90% 80% 70% 60% 50% 40% 30% 20% 10% 0% 5% 7% 6% 6% 8% 10% 12% 6% 5% 16% 14% 9% 4% 5% 9% 11% 6% 27% 6% 6% 14% 18% 4% 15% 23% 22% 3% 24% 8% 16% Akkar Bekaa BML South T5 Legal Water Latrines Water systems Shelter Cooking Furniture / clothing EducaIon Figure 46: Assistance provided by region in the year prior to the survey. 51
53 The regularity of assistance varied according to the type of assistance. Food vouchers were received consistently in almost all cases while health assistance, rent subsidy, hygiene kits, psychological support and food in kind were received regularly in 57-67% of households. More than half of households who received a fuel subsidy were previously provided with the assistance regularly but not anymore, reflecting the seasonality of winterization assistance. Other assistance, including NFIs, were received only once in most cases (57%-69%). Food in kind assistance was regularly received by households in Beirut-Mount Lebanon and Tripoli + 5 (for around 85% of households), whereas in the Bekaa Valley and South Lebanon it was received just once (70-80%); in Akkar both types (regular and one off) were provided in similar proportions (40-45%). Health assistance tended to be more regular in Akkar than in Beirut-Mount Lebanon, South Lebanon or Tripoli + 5, where it was more likely to be received once. In Akkar, fuel subsidy was also more regular than in the Bekaa Valley or South Lebanon, and less likely to be received just once. Hygiene kits assistance were received regularly in most of the regions except South Lebanon where higher proportion of households received it only once. There was also a significant higher proportion of household in Tripoli + 5 that previously received hygiene kits regularly, but no longer did. 100% 90% 80% 70% 60% 50% 40% 30% 20% 10% 0% Received once Was regular, not any more Regular 2% 2% 16% 31% 27% 18% 41% 37% 3% 13% 57% 69% 6% 96% 67% 66% 60% 59% 57% 14% 6% 29% 26% 37% 52% 11% Figure 47: Type of assistance and regularity Food voucher and unconditional cash Households benefiting from food vouchers (69% of all households) received US$178 per month on average, which would corresponded to a household of 5.9 members. On average, 85% of household members received their food voucher worth US$30, meaning that of a household with 7 members, 6 were receiving their voucher amount. This difference between the number of household members and people benefiting from the food voucher can be due to household members that were not registered or households composed by more than one registration case where one of the cases is excluded. The average total amount of voucher assistance was lower in Beirut-Mount Lebanon and Akkar and highest in the Bekaa Valley and South Lebanon, although differences were not significant. The percentage of household members covered with the voucher was similar across the regions, ranging from 83% in Beirut-Mount Lebanon and South Lebanon to 89% in Akkar. In 23% of households receiving food vouchers, the amount received is equivalent to less than three quarters of the household members receiving the US$30 vouchers, and in 11% of households less than half household members were receiving vouchers. Households receiving cash assistance (12% of all households), received on average US$128 in the month prior to the survey, equivalent to US$19 per household member and month. Although regional differences were not statistically significant, most probably due to the small sample size, the total amount of cash received by households was higher in Beirut-Mount Lebanon, followed by Tripoli + 5, Akkar, the Bekaa Valley and South Lebanon. The amount per household member was again higher in Beirut-Mount Lebanon but lowest in the Bekaa Valley. 52
54 15. Focus Group Discussions Results The Focus Groups Discussion (FGDs) provide a qualitative insight of the experience and livelihoods of Syrian refugee households in Lebanon and complement the quantitative data collected through household surveys. In particular the FGDs were intended to assist in understanding the shocks, identifying the social networks, and understanding the priorities of Syrian taking refuge in Lebanon. The questionnaire that were used to guide focus group discussions can be found in Annex XIII Understanding shocks and coping Main problems The main problem faced by Syrian refugees in Lebanon according to the interviewees was high rent, mentioned by 34 out of the 40 people. Other major concerns were a lack of health assistance, lack of employment opportunities, harassment from the host community members and various problems with legal permits such as being unable to renew the lease because of increased rent, inability to go the border, etc. We don t have money to buy food to eat. How can we pay rent? No matter how smart you are or which level you studied, the only job you ll get is the physically hardest one and with the lowest wage. Main problems faced by households Number % High rent No health assistance Lack of work opportunities Harassment from the Lebanese and not feeling welcome Problems with legal permits Poor living conditions Water (access, cleanliness) High cost of living (bills) Unfair distribution from NGOs Education E- card not enough (need cash for basic necessities) 8 20 Exclusion from assistance 8 20 Limited movement because of problems with residency permit Difficulty connecting to UNHCR hotline 4 10 Poor quality of hygiene kits and clothing items Men and women using same few latrines 2 5 Bugs, rodents, insects 2 5 Discrimination by shawish 2 5 Bad treatment from hospital staff Sexual harassment when women leave ITS to go to work Table 52: Main problems identified by Focus Group Discussions. 53
55 Have these problems changed from last year? Participants in the focus group discussions unanimously agreed that the aforementioned main problems have worsened compared to last year due to a range of reasons. In particular, they mentioned that the Lebanese were now less welcoming, that they were now having problems renewing their residency permits, that landlords were increasing rent, and that they were receiving less assistance than before. There are a lot of Syrian refugees. We are in a real depression nowadays, the people here are treating us as unwelcome guests, just because we re Syrians. The renewal is so expensive, so we are obliged to ignore it In (our neighbourhood), they told us that Syrians are not allowed to go out after 5 pm, and anyone found outside after 6 or 7 pm will be beaten. Problems worsened Number % Lebanese people used to be nicer Problems with registration and expired residency permits Increased rent Less assistance Unfair and slow assistance Spent savings and sold assets Exclusion from assistance Curfews imposed by neighbours or municipality 4 10 Shopkeepers taking advantage of e- card holders 4 10 Children out of school in exchange of labour Harassment of children at school and by neighbours 2 5 Table 53: Worsening problems identified by Focus Group Discussions Consequences of the problems on the family The main consequences these problems brought to their families was the psychological consequences, including feelings of anxiety over the future, sadness, loss, an inability to perform regular daily tasks, etc. This was followed by increased level of illness due to the lack of access to medications (particularly for those suffering from chronic diseases). Poverty, increased debt and increased tension between family members and with the host community were also mentioned. Children are the most affected, because they had to leave their schools, and it s not easy for them to change their lives in that way. 54 Main consequences Number % Psychological issues Increased illness due to the lack of health care Poverty and increased debt Tension within the family and with host community Accepting any type of low- paid job Taking children out of school 6 15 Resorting to undesirable activities (such as begging and theft) Wanting to seek refuge somewhere else (because of harassment) 4 10 Limits to movement because of no residency permit 4 10 Selling e- cards Continuous movement of the residence because of high rent 2 5 Table 54: Consequences of problems identified by Focus Group Discussions.
56 15.2. Identifying social networks Support structures Participants were asked to list available support structures that existed within the community and what kind of assistance they were providing. Non-governmental organizations (NGOs) were most sighted, followed by the United Nations agencies and various political parties. 5 out of 40 interviewees stated that there was no support structure available in their communities. What are the existing support structures in your community? Number % NGOs (various) UNHCR, WFP, UN Political parties (various) 6 15 No support Other (church, municipality, public figure) Table 55: Existing support structures identified by Focus Group Discussions Access to support structures According to interviewees support structures were most easily and readily accessed by people with connections, such as people who know the NGO members, who had relatives in Lebanon, who were friends with influential people in the community etc. Other answers included newcomers, children, registered refugees, the elderly, people living in informal tented settlements and the poorest. The people who get the help are the ones who move more and ask more. If you know some people there you get more help, not like the ones who don t know anyone in the area. In order to get help you should know some of the people who are in charge of the distribution process. Who has access to these support structures? Number % People with connections Newcomers Children The registered The elderly 4 10 People living in ITS 4 10 The poorest Table 56: Access to support structures identified by Focus Group Discussions Limitations to efficiency The majority of the participants, when asked whether they considered the available support structures efficient, believed that the support structures were not efficient. The main reasons for the inefficiency were, inability of the NGOs to determine/identify vulnerability, unfairness and discrimination in distributions and a general feeling that aid organizations make promises of assistance that they do not fulfil. We hear a lot and sometimes we see these organizations providing support to others but not us. We only can hear about them without seeing them around. Maybe they provided us the assistance one time but that is not enough. We all are suffering from the bad situation, we are all refugees. The only help that we get is the food vouchers from UNHCR. Well I m young and I can work, but I have 3 children and two of them are infants. UNHCR rejected me from the distributions they do. How can I feed these two infants? If they want to reject my name only it is ok but why did they reject my kids too? The (hygiene) kit value is way lower than the transportation we pay to reach the distribution site. 55
57 If inefficient, what are the reasons for inefficiency? Number % NGOs do not judge well who deserves and who doesn't Distribution is discriminative and unfair Mosques, political parties, NGOs take our names and we never hear back from them Table 57: Reasons for inefficiency identified by Focus Group Discussions Access to credit Informal sources provided the main sources and access to credit according to interviewees. In particular relatives, shopkeepers, friends, landlords, and employers provided credit. 5 of the 40 participants stated that they did not asked for credit as they would not be able to return the borrowed money. Table 59: Current household priorities identified by Focus Group Discussions. 56 Who gives you credit? Number % Relatives Shopkeepers Friends Landlords 8 20 Not asked since we can't pay it back Employer 2 5 Table 58: Sources of credit identified by Focus Group Discussions Issues and Priorities We have not asked for credit, because we know that we ll not get it Priorities of the population Almost all of the focus group participants stated that paying rent was their top priority. Other key concerns included paying for healthcare and/or medications, purchasing food and education for their families, accessing better working opportunities, renewing residency permits and safety and security. Further priorities included better shelter conditions, buying water and paying transportation for children to school. Returning to Syria was mentioned by 2 interviewees, as was migrating abroad. Money is very important here, you can t do anything without it. The house rent and the health care are the most important things to us. You can face all the problems here in Lebanon, but don t get sick; it s the worst situation to deal with here. As adult people we can manage our way of living. But we can t manage how children will live. It is so hard to see your son starving and you can t do anything because you are starving too. What are your current household priorities? Number % Paying rent Paying for healthcare and/or medications Food Education Better work opportunities Renewing residency permits Safety and security 8 20 Better shelter Water 6 15 Transport of children to school Going back to Syria 2 5 Electricity 2 5 Migrating abroad 2 5
58 Priority support interventions When asked to identify three priority interventions that were needed to solve their difficulties support for rent was the most sighted concern. Other interventions that were commonly identified were creating work opportunities, support for health care, support for renewing residency permits, an increase in overall assistance, ensuring better housing conditions, providing cash assistance, education assistance and re-including excluded refugees in assistance schemes. Sure, before it wasn t a priority to renew the legal stay. But these days, we can t move, we feel like we are living in a big prison. We wish that they can stop the food items and pay us the rent. Priority interventions Number % Support for rent Create work opportunities Provide health assistance Support renewing residency permits Increase over all assistance 8 20 Better housing conditions Cash assistance 6 15 Education assistance Re- include the excluded A shop with e- card machine in the village Clinic it the village Pharmacy for refugees 2 5 Table 60: Priority interventions identified by Focus Group Discussions Feeling of security Within their residential area, interviewees gave almost equal responses to feeling safe and unsafe. Other feeling regarding security were focused on children being harassed, feeling unwelcome, the imposed curfew and being afraid of crossing checkpoints. They always say to us that we are the reason of the unemployment in Lebanon. We think wherever we go in Lebanon we will feel the same. The most important thing is to feel safe; we feel that we don t have a life here. Do you generally feel safe in your area? Number % Feeling safe Feeling unsafe Children being harassed Feeling unwelcome Curfew was imposed Afraid to cross checkpoints Table 61: Feeling of safety identified by Focus Group Discussions Improving the situation Rent was identified as the key requirement to improve interviewee s situation by the majority of participants. Other needs sighted were better job opportunities, reconsidering assistance for previously excluded people, increasing overall assistance and fair distributions. Better treatment of the refugees by the host community, helping with the renewal of security permits, health assistance, education, cash assistance, lowering cost of living, and more security, were also mentioned. The rent of houses is expensive for us at the moment, we are borrowing money to pay the rent for our housing. No matter how smart you are or which level you studied, the only job you ll get is the hardest physically and with the lowest wage. 57
59 What needs to be done to improve the situation? Number % Helping with rent More and better job opportunities Reconsidering excluded people Increasing overall assistance Fair distributions Better treatment of Syrian refugees by the Lebanese Helping with residency permit renewal Health/medication assistance Education Cash assistance Lower living costs 4 10 Improved security 4 10 Table 62: How to improve the situation identified by Focus Group Discussions. 16. Population profiles by key indicators Profile by food security category The classification of households according to their food security situation is based on a composite indicator that considers food consumption, food expenditure and coping strategies. Households were classified into three food security categories food secure; mildly food insecure; and moderately or severely food insecure and each categories questionnaire answers, for each sector, were compared. Households were more likely to be food secure when they had less members (between 5-6 members), were headed by men rather than women or children, did not have to care for a member with specific needs and had a residence permit. The percentage of households living in tents in informal tented settlements was significantly higher in the moderately or severely food insecure category while the percentage of households living in independent houses was significantly higher in the food secure category. Moderately or severely food insecure households were more likely to have an open air or traditional pit latrines and less likely to have access to 35 litres of water, to sufficient water for drinking, cooking and washing or to have enough soap and hygiene items for all household members. Households classified as moderately or severely food insecure also had significantly less access to assets and were less likely to have access to sufficient fuel to cover their cooking needs. The number of household members working strongly correlates to food security; food secure households relied more on skilled work and non-agricultural casual labour while food insecure households were more reliant on food vouchers. Further, expenditure (per capita and for the household) was significantly lower for moderately or severely food insecure households and food insecure households borrowed more often and had more debt. Children from moderately or severely food insecure households were significantly more likely to not be attending school, compared to children from food secure households. Children living in mildly, moderately or severely food insecure households were also more likely to be sick, across all conditions; had more symptoms and were less likely to have the minimum diet diversity. Although households not requiring health assistance was more common within the moderately or severely food insecure category, particularly for secondary health care, mildly food insecure households accessed free health care more commonly, were more likely to pay all related health care costs and were more likely to need health care Profile by beneficiary status Not all Syrian refugee households in Lebanon, or in the VASyR survey, received food voucher assistance. Comparison between households receiving food vouchers and those who don t, based on the questionnaire sectors, allowed identification of factors or indicators that were directly or indirectly associated with the receipt of assistance. The demographics of a household, most likely due to the targeting criteria, had a significant effect on eligibility status. As did the registration status of a household, households that had been registered for more than 6 months before the survey were significantly more likely to benefit from food assistance. 58
60 Households receiving assistance paid less rent and resided in accommodation that was more densely populated, and were more likely to have access to 35 litres of water per person per day as well as sufficient access to hygiene items. Households receiving food assistance had significantly more school age children, however those children were more likely to attend school, or non-formal education, and were more likely to move to the next grade. Food vouchers beneficiaries were more likely to receive assistance for health care, whereas ineligible households were more frequently unable to access primary health care when needed and children in ineligible households were more likely to be sick. Eligible households were also less likely to have experienced insecurity in the 3 months prior to the survey. Ineligible households were significantly more likely to be under the poverty line and the Minimum Expenditure Basket, spent relatively less of their expenditure on food and were more likely to be food insecure. Ineligible households were also more likely to reduce the number of meals eaten per day, to spend days without eating and to borrow food or rely on help from friends or relatives. The level of debt was not significantly different between eligible and ineligible households, although ineligible households had, on average, US$50 more debt Profile by household head gender The vast majority of households were headed by men, however there were a range of differences between households headed by men and households headed by women. Households headed by women were less likely to have children under the age of 5 and the dependency ratio was significantly higher. Households headed by women were also significantly less likely to have a household member with specific needs, this was mostly because households headed by women were significantly less likely to have a household member that was pregnant or lactating. Households headed by women were less likely to reside in an unfurnished rental and, on average, paid significantly less rent compared to households headed by men. Households headed by women were more likely to have insufficient water and hygiene items and more often sighted the need for children to stay at home as a reason for children not attending school, although the difference was not significant. The majority of households headed by women relied on food vouchers to secure their livelihoods compared to households headed by men which primarily relied on food vouchers as well as non-agricultural casual labour to secure their livelihoods. Households headed by women spent considerably less on food, rent and alcohol and tobacco. However, households headed by women spent a larger proportion of their total household expenditure on food, of which they spent significantly less, in relative terms, than households headed by men on sugar and sweets. Households headed by men, on average, had considerably higher levels of debt US$1295 compared to US$491 in households headed by women. Households headed by men had higher rates of food security, 27% of households headed by men were food secure compared to 16% of households headed by women. Households headed by men were also more likely to have an acceptable, or acceptable with coping strategies, Food Consumption Score (FCS), while more households headed by women were more likely to have a borderline or poor FCS Profile by Syrian-Lebanese population ratio The demographics of the community in which Syrian refugees in Lebanon were residing may serve as a proxy to other characteristics about a household, such as food security, expenditure or health. In particular the size of the Syrian refugee population, compared to the local Lebanese population, was considered and analysed. Households living in areas where the concentration of Syrian refugees, relative to Lebanese residents, was highest were more likely to have larger households; more likely to rely upon the food voucher as their primary livelihood source; more likely to experience a lack of food or money to buy food and were also more likely to be below the poverty line (US$3.84). On the other hand, where the concentration of Syrian refugees, relative to Lebanese residents, was lowest households were more likely to have residential permits; more likely to live in independent houses and furnished rental apartments; more likely to have access to flush toilet and sufficient water for drinking, cooking and washing; more likely to be food secure, to have a diverse diet and were have an acceptable Food Consumption Scores; but felt more insecure than elsewhere, especially due to harassment from neighbours Profile by shelter type Syrian refugee households were residing in a range of shelter types; households were divided into four shelter types independent houses; one room shelters; tented settlements; and sub-standard shelters. The household shelter type correlated to a number of other differences between households. Although these differences were not necessarily due 59
61 to the different shelter types, they could reflect geographical factors that correspond with shelter type for example. Households living in tented settlements and independent houses had more children per household while households living in tented settlements were more likely to be headed by women or by single guardians. Households living in independent houses and one room structures had significantly more access to bathrooms and water, while households living in tented settlements were more likely to share a latrine with 15 or more people and were more likely to rely on protected wells for drinking water. There were no significant differences in access to health care, however households living in one room structures more often had sick children and, along with households in sub-standard shelters, had significantly more children suffering from diarrhoea. Meanwhile, children in households living in independent houses were more likely to be attending school and were more likely to have attended school and moved to the next grade. The majority of households living in tented settlements relied upon food vouchers as their primary source of income. Households living in independent houses and tented settlements were more likely to have a second source of income, and households living in tented settlements were more likely to have a third income sources. The total expenditure of households living in independent houses was significantly higher than other households, especially due to expenditure on food, rent, water and electricity. Households living in independent houses or apartments had a better diet diversity and were more likely to be food secure. Whereas households living in tented settlements were more likely to apply food related coping strategies and were more likely to be moderately or severely food insecure. 17. CONCLUSIONS Through focus group discussions, refugees stated that households main priorities were rent, health, food, education and work opportunities. At the same time, shelter, health, lack of job opportunities, harassment by host communities and legal permits were the main problems they reported facing, and were therefore also their priorities for intervention. They believed that the situation had worsened over the previous year, particularly in terms of relations with host communities, residence permits, higher rents and reduced assistance. According to refugees, the impact of these problems had manifested in psychological difficulties in coping with the situation (for example anxiety, sadness, inability to perform regular daily tasks), increased levels of illness, poverty and debt, as well as increased tension within households and with the host community. The support structures were generally considered inefficient by refugees mainly due to the perceived inability to correctly identify vulnerable households, unfair distributions and promises of assistance that were not kept. While the proportion of refugees below the poverty line remained similar to 2013, the food security situation of Syrian refugees in Lebanon had deteriorated, there had been a significant decrease in food secure households and a parallel increase in mild food insecurity. No differences were observed for moderate or severe food insecurity, which affected 13% of Syrian refugee households. This deterioration in food security was mainly determined by poorer food consumption levels and higher severity of the coping strategies applied by households. One of the main causes could be attributed to the lack of livelihood opportunities to cover household basic needs. Half of refugee households lived below the poverty line of US$ 3.84 per person per day, 42% were not able to cover the Minimum Expenditure Basket and 29% were not able to cover the Survival Expenditure Basket. Three quarters of household expenditures were on food (44%), rent (24%) and health (9%), which were also the main reasons for borrowing money. On average, out of 6 7 household members, only one was able to work, usually in temporary employment. This was insufficient to cover the US$762 that the average household spent on a monthly basis. One quarter of households did not have any members who were working. Compared to last year, refugees depended more on external sources of cash like loans or WFP s food vouchers, and less on skilled work or their own savings. Borrowing money was occurring more frequently and debt levels were higher than last year. Households headed by women and households headed by single guardians with dependents had also increased compared to These households were particularly vulnerable to difficulties accessing work. Despite the fact that households were employing coping strategies, food consumption of most food groups as well as diet diversity had decreased. In 2014, households were less likely to have acceptable food consumption levels. As savings and assets were being exhausted or becoming more limited, households were also engaged in coping strategies with more irreversible effects, like reducing expenses on health or education. Expenditures on health, water and hygiene items had increased. The higher expenditure on soap and hygiene items and water may have reflected the reduction in hygiene and baby kits in-kind assistance and the water scarcity situa- 60
62 tion in Lebanon, respectively. In 2014, there were more refugee households without access to bathrooms, sufficient access to water, soap or hygiene items. Child health worsened compared to 2013 and child feeding practices continued to be very poor, implying a high risk of malnutrition at the level of immediate causes. Geographically, vulnerability tended to be higher in Akkar and the Bekaa Valley and lower in Beirut-Mount Lebanon, however the regional differences did not follow the same pattern across sectors. Moderate or severe food insecurity was proportionally higher in Akkar, followed by the Bekaa Valley. Considering the number of refugees in each region, almost three quarters of the moderately or severely food insecure households were in the Bekaa Valley (42%) and the North (Akkar and Tripoli + 5, 32%). A similar pattern was observed for the percentage of households that were not able to cover the MEB, with a higher percentage of these in Akkar and the Bekaa Valley. The profile of food insecure households was determined by those indicators that have shown to be significantly associated with food insecurity in this refugee population. These include: households headed by a single guardian with dependents; households headed by women; household members with temporal functional limitations; poorer level of education of the household head or caretaker; fewer working members; and a higher dependency on external sources of cash as their main livelihood source like food vouchers, loans, credits or gifts, and relatively less on skilled work or agricultural casual labour. Food insecure households were also more dependent on agricultural casual labour as the second main livelihood source, and on sale of crops as their main source of livelihoods in Syria. These households also had lower monthly household and per capita expenditure, a higher food expenditure share, lower household food consumption and diet diversity as well as child diet diversity. They had a higher probability of experiencing lack of food or money to buy food, a higher application of food consumption related coping strategies such as reducing the number of meals, portion sizes or spending days without eating. These households were more likely to engage in crisis and emergency coping strategies, such as reducing non-food essential expenditures, withdrawing children from school, having children involved in income generating activities, accepting high risk jobs, or begging as well as taking on more debts. They had poorer shelter and WASH conditions, they were more likely to live in informal settlements, have a smaller living space and rent, a higher crowding index and density, less adequate access to bathrooms, latrines, enough water, soap and hygiene items or waste disposal. They were less likely to be able to access enough fuel for cooking, or basic assets and services. Food insecure households were also less likely to have residence permits and were less likely to have arrived before the conflict started. The analysis of household profile by eligibility status show that households receiving food assistance were more likely to have per capita expenditure below the poverty line and MEB. This association points out that the current eligibility criteria seems to be effective in identifying households with difficulties to cover the MEB. These results were expected given that the eligibility criteria (burden score) is mainly based on demographic variables, especially household size and dependency ratio, which have strong implications for per capita expenditure: the higher the household size the lower the expenditure per capita. Although assisted households tended to have lower expenditure per capita on most of the categories, analysis of food expenditure does not show significant differences among food assisted and non-assisted households, indicating that the food voucher facilitates eligible households to reach the average expenditure per capita on food. However, although assisted and non-assisted households spent similar amounts of money per capita on food, households that did not receive food vouchers had poorer food consumption scores, applied more food consumption related coping strategies and were more likely to be severely food insecure. One possible reason could be the smaller household size of ineligible households which implies lower expenditure at household level (ineligible households spent on average $70 less than eligible households). Food expenditure of ineligible small sized households could have been insufficient to cover the same food consumption than assisted households, which also could imply the need of engaging in more food consumption related coping strategies. As the conflict in Syria continues and there is no expectation of an imminent resolution, the number of refugees in Lebanon continues to increase. Following the same observed trend, employment opportunities and access to shelter and basic services will continue to deteriorate, making it difficult for refugees to cover their basic needs. The increased tensions between refugees and host communities, reflected in the results of security section and recently intensified due to events in the northeast part of the country (Aarsal) as well as in Iraq, are expected to continue rising. As at the end of December 2014, only 46% of the 2014 funding requirements for the Syria operation have been covered. The deterioration in the living conditions of Syrian refugees, the impact of the crisis on the most vulnerable Lebanese in the population and the increasingly tense security situation all constitute a risky context and a threat to Lebanon s stability, especially if overall assistance is reduced due to funding constraints. 61
63 18. RECOMMENDATIONS Assistance is still required to allow refugees to cover their basic needs. The assistance is needed at individual, household, community and policy level to ensure adequate availability of and accessibility to resources and services. Food, rent and health accounts for more than three quarters of household expenditures and represent the main reasons for borrowing money as well as the first three priorities for the population. Where food is concerned, although availability is generally not a problem, and access is facilitated for approximately 70% of households through WFP food vouchers, food consumption deteriorated and most household applied food consumption related coping strategies. Refugees still recommend the inclusion of excluded households and the increase of overall assistance. On the other hand, constraints on availability of shelter and healthcare, together with low levels of assistance provided (25% of households report receiving assistance for health, and 5% for rent) make these sectors a priority for strengthening assistance, according to refugees. After three years of conflict, household savings and assets are already limited or exhausted and the level of debts is increasing. With restricted access to job opportunities, that are usually temporary, unskilled and low-waged, the level of assistance needed to cover refugee households basic needs, is difficult to sustain. In what is starting to be considered a protracted crisis, increasing livelihood opportunities are a priority going forward. Security, especially the increased tension between refugee and host communities, is a growing issue of concern and deserves attention, in order to ensure adequate access to services and resources by refugees and for the general stability in the country. The continued low rate of education enrolment represents a current problem but also implies the potential loss of a whole generation of children that will see their future compromised with very limited livelihoods opportunities, and who are exposed to abuse and exploitation. The transition from an emergency operation to a protracted crisis highlights the need for programs to increase the rate of enrolment of the more than 400,000 Syrian refugee children of school age residing in Lebanon. Strengthening protection assistance is required as protection cases continue to increase, due to higher number of refugees and the worsening of the situation. Some of the factors contributing to these vulnerabilities are poorer living conditions with higher risk of eviction; the severity of the coping strategies that households are adopting, especially those affecting children; increased tensions with host communities but also within the household; and consequences of illegal status in country. The significant increase of households without adequate access to soap and hygiene items or without access to bathrooms and the similar percentage of households without adequate access to water than last year, among other WASH indicators, point to the assistance needed to provide adequate access to water and sanitation conditions for refugees. Although acute malnutrition continues within normal ranges, the risk of malnutrition is high and at the level of immediate causes according to the malnutrition conceptual framework, with poor child and infant feeding practices and poor child health, especially in children under two. Prevention of malnutrition is recommended through sensitization on adequate child feeding practices and disease prevention together with a surveillance system that would provide an alert in case of a deterioration in the situation. Adequate diagnosis and treatment of acute malnutrition in public health facilities needs to be ensured in a country where acute malnutrition is not a general issue of concern. In sum, the situation of Syrian refugees in Lebanon would require comprehensive assistance that would allow for covering the current needs of refugees while shifting from an emergency situation to a consistent approach with a context of protracted crisis. The Bekaa Valley hosts the highest number of vulnerable refugees, followed by the north, especially Akkar in terms of proportion of vulnerable households. Assistance therefore needs to be prioritized in these areas especially at community level and services. While the proportion of assistance will be higher in these areas due to the number of vulnerable households, it is recommended that household targeting is based on specific household characteristics and not geographic location that, given the high mobility of refugee population, could derive in an unwanted calling effect on refugees. 62
64 ANNEX I: VASyR COMPARISON Comparing the results of the VASyR 2014 survey and the VASyR 2013 survey is designed to enable a clearer understanding of the changes in living conditions and vulnerability Syrian refugee households have experienced between May/June 2013 and May/June Comparison between the two datasets is only reliable at country level, given that the stratification of the population for sampling purposes differed between the assessments. In 2013, households were stratified in according to their registration date, whereas in 2014 the households were stratified based on regional differences. Both datasets differ significantly in registration date and regional composition (see Table 38). In the VASyR 2014 dataset, there were proportionally more households registered for 6 months or more and less households registered for less than 6 months, although this reflects the arrival profile of the overall population of Syrian refugee households into Lebanon. Additionally, households in Akkar, the Bekaa Valley and Tripoli + 5 were more represented in Awaiting Registration 25% 0% Less than three months 25% 14% 3 6 months 25% 17% More than 6 months 25% 68% BML 12% 20% Bekaa 39% 20% South 11% 20% T5 20% 20% Akkar 17% 20% Table AI 1: comparison of registration profile and region distribution of households. Household composition Household headed by women 11% 16% Household headed by children (under 18) 1% 1% HH size Household size categories % 31% % 30% % 22% 10 26% 18% Dependency ratio % 57% % 18% % 12% % 13% Households headed by a single guardian with dependents 3% 7% Households with children under 5 72% 65% Households with elders 19% 20% Households with all dependents 0% 1% Non related children under 18 1% 2% Households with at least one person with: Table AI 2: comparison of demographic indicators. Specific Needs 47% 49% PLW 41% 35% Disability 8% 12% Chronically Ill 34% 43% Temporarily Ill 10% 10% Need help to go to the toilet 10% 4% Other needs 5% 3% 63
65 Shelter Type of Villa/independent house 59% 59% housing One room structure 18% 16% Tent in ITS 12% 13% Garage/shop/magasin/worksite 5% 5% Unfinished building 3% 2% Factory/warehouse 2% 2% Handmade shelter - 1% Collective shelter/center 1% 1% Other 0.4% 1% Official camp 0.4% 0.3% Unofficial camp 0.4% - Type of Unfurnished rental 66% 67% Occupancy Furnished rental 15% 15% Provided by employer 4% 7% Assistance 5% 5% Hosted for free 7% 5% Other 0% 0.3% Owned 0.4% 0.2% Squatting 3% 0.1% Density >10.5 m 2 /person 32% 30% categories m 2 /person 20% 19% m2/person 29% 31% 3.5 m2/person 19% 20% Crowding 1-2 person/room 27% 34% index 3-5 person/room 49% 49% categories 6-7 person/room 14% 10% 8 person/room 11% 7% Average crowding index 4 4 Living space (m 2 ) Rent ($) Table AI 3: comparison of key shelter indicators. 64
66 WASH Access to bathrooms 94% 88% Bathroom shared by more than 15 11% 7% Type of latrine Flush Toilet 26% 36% Improved latrine 35% 34% Traditional pit 32% 28% Open air 7% 2% Latrines shared by more than 15 13% 9% Access to sufficient drinking water 73% 67% Access to enough hygiene items 87% 60% Source of drinking water Source of cooking water Bottled water 32% 34% Household connection more than 2 hrs. 20% 19% Household connection less than 2 hrs. 6% 12% Protected dug well 12% 10% Public standpipe 12% 5% Protected spring 6% 4% Water provider 0% 4% Unprotected spring 2% 3% Other 1% 3% Unprotected well 5% 2% Public reservoir 6% 2% UN/NGO Tanker 0.1% 1% Borehole - 0.3% Household connection more than 2 hrs. 28% 37% Household connection less than 2 hrs. 11% 17% Protected dug well 14% 14% Water provider 0% 8% Public standpipe 10% 4% Unprotected well 10% 4% Bottled water 10% 4% Other 1% 3% Public reservoir 11% 2% Protected spring 2% 2% Unprotected spring 2% 2% UN/NGO Tanker 0.1% 2% Borehole - 1% Table AI 4: comparison of key shelter indicators. 65
67 Assets and services TV 74% 81% Blankets 90% 75% Mattresses 93% 73% Satellite dish 63% 72% Gas stove 43% 70% Winter clothes 46% 59% Refrigerator 50% 58% Water heater 43% 47% Washing machine 46% 45% Sofa set 38% 32% Beds 21% 24% Table & chairs 27% 24% Motorcycle 8% 7% Sewing machine/iron 17% 6% Electric oven 3% 3% Air conditioning 3% 3% Car/truck/van 6% 3% Microwave 2% 2% DVD 6% 2% Computer 4% 2% Central heating 1% 1% Access to four or more assets 84% 86% Access to 10 or more assets 20% 19% No access to basic assets 2% 10% Access to all basic assets 30% 35% Average number of assets 7 7 Electricity 97% 98% Gas 93% 96% Access to enough fuel 69% 76% Table AI 5: comparison of assets and services indicators. 66
68 Education Household head education Spouse/caretaker education None 14% 13% Read and write 4% 4% Primary school 36% 41% Intermediate school 32% 28% Secondary school 9% 8% Technical course 1% 2% University 5% 4% None 9% 18% Read and write 5% 4% Primary school 36% 35% Intermediate school 33% 25% Secondary school 11% 9% Technical course 1% 1% University 5% 3% Not Applicable 13% 5% Reason for not Cannot afford tuition 59% 48% attending school 1 Children are too small - 27% No space in school 18% 6% No school in the community 12% 6% Difference / Difficulty of curriculum - 5% Newly arrived 13% 4% Transport cost 6% 4% Children need to work 3% 3% School has already finished - 3% Language - 2% Considered unnecessary 3% 2% Need to stay at home 1% 2% Other reason 9% 6% Children are old enough ( > 16 years) - 2% Table AI 6: comparison of education indicators. mor 67
69 Health Cost sharing 29% 29% HH pays all related costs 35% 26% Don t know/didn t require 23% 25% Free health care 10% 16% Other 3% 3% HH receive financial contribution 0.1% 1% Insurance 0.2% 0% Child Health Indicators Sickness 45% 68% Diarrhoea 17% 35% Cough 23% 45% Fever 29% 51% Other 9% 14% More than 2 symptoms Table AI 7: comparison of health care indicators. 24% 48% Security Insecurity 10% 12% Type of Harassment 31% 81% insecurity 43 Community Violence - 9% Extortion 27% 8% Theft/robbery 6% 7% Forced displacement - 3% Arbitrary arrest- 3% Table AI 8: comparison of key security indicators. Cross shelling - 2% Kidnapping - 2% Unsafe 56% - Cause of Neighbours 42% 45% insecurity 50 Armed groups - 11% Local Authorities 10% 10% Local organizations - 10% Hosts 14% 9% Others 30% 8% Shop owners 11% 8% Clashes - 2% Refugee Organizations/leaders 3% 2% Movement limited by insecurity 7% 8% 68
70 Livelihood sources Households members that have worked % 26% 1 51% 53% 2 16% 16% 3 or more 8% 5% Average number of working members 1 1 First livelihood source Food voucher 28% 40% Non- agricultural waged labour 24% 29% Skilled work 24% 14% Agricultural waged labour 4% 3% Informal debts 2% 3% Savings 7% 2% Gifts 4% 2% N/A 0% 2% Informal commerce 1% 1% Remittances 1% 1% Formal credit 1% 1% Cash from humanitarian organization 1% 1% Other 2% 0.4% Sale of assets 0.4% 0.3% Formal commerce 0.2% 0.2% Sale of food aid 0.1% 0.2% Sale of crops 0.4% 0.1% Sale of livestock 0% 0.1% Cash from charity organization 0% 0.1% Begging 0% 0.1% Second livelihood source Non- agricultural waged labour 16% 18% Informal debts 7% 17% Food voucher 24% 14% Gifts 3% 6% Skilled work 12% 5% Agricultural waged labour 3% 4% Savings 5% 3% Formal credit 0.3% 3% Cash from humanitarian organization 1% 2% Informal commerce 0% 1% Sale of assets 1% 1% Remittances 1% 1% Sale of food aid 0.1% 1% Other 0.4% 1% Sale of crops 0.1% 0.3% Formal commerce 0% 0.2% Begging 0.2% 0.2% Sale of livestock 0% 0.1% Cash from charity organization 0% 0.1% N/A 28% 23% Third livelihood source Informal debts 5% 18% 69
71 N/A 28% 23% Third livelihood source Informal debts 5% 18% Food voucher 8% 5% Non- agricultural waged labour 4% 3% Gifts 3% 3% Formal credit 1% 2% Other 0.1% 2% Agricultural waged labour 1% 1% Skilled work 5% 1% Sale of assets 1% 1% Remittances 0.3% 1% Savings 2% 1% Cash from humanitarian organization 1% 1% Cash from charity organization 0% 1% Sale of food aid 0.4% 0.2% Sale of crops 0.1% 0.1% Formal commerce 0% 0.1% Informal commerce 0% 0.1% Begging 0.2% 0.1% N/A 69% 61% First livelihood source in Syria Second livelihood source in Syria Skilled work 38% 33% Non- agricultural waged labour 29% 28% Agricultural waged labour 7% 10% Sale of crops 5% 9% Formal commerce 8% 8% Sale of livestock 2% 3% Informal commerce 4% 3% Other 4% 2% Remittances 1% 1% Informal debts 0% 1% Gifts 1% 1% Sale of assets 0.2% 0.20% Savings 0.2% 0.10% Formal credit 0.1% 0.10% Sale of food aid 0% 0.10% Cash from charity organization 0% 0.10% Food voucher 0.20% 0.10% Cash from humanitarian organization 0.30% 0% Begging 0% 0% N/A 0% 1% Non- agricultural waged labour 7% 6% Skilled work 12% 6% Savings 1% 6% Informal debts 0% 5% Sale of crops 4% 4% Sale of livestock 1% 3% Agricultural waged labour 2% 3% Formal commerce 3% 3% Other 1% 3% Gifts 1% 2% 70
72 Third livelihood source in Syria Table AI 9: comparison of key livelihoods indicators. Formal commerce 3% 3% Other 1% 3% Gifts 1% 2% Informal commerce 2% 1% Formal credit 0.10% 1% Sale of assets 0.20% 0.30% Remittances 0.20% 0.30% Food Voucher 0% 0.20% Sale of food aid 0% 0.10% Cash from charitable org 0% 0.10% Cash from humanitarian organization 0.20% 0% Begging 0% 0% N/A 67% 55% Informal debts 0% 5% Savings 1% 3% Other 0.30% 3% Non- agricultural waged labour 2% 2% Skilled work 5% 2% Sale of crops 1% 1% Sale of livestock 1% 1% Agricultural waged labour 1% 1% Informal commerce 1.70% 1% Gifts 0.30% 1% Formal commerce 2% 0.40% Formal credit 0% 0.30% Begging 0% 0.20% Remittances 0% 0.10% Cash from charity organization 0% 0.10% Food voucher 0.10% 0.10% Sale of assets 0% 0% Sale of food aid 0% 0% Cash from humanitarian organization 0.10% 0% N/A 87% 79% 71
73 Expenditure Table AI 10: comparison of expenditure indicators. 72 Household Food Expenditure ($) Rent Health Alcohol/tobacco Hygiene items Transportation Electricity Water Education 5 9 Other 7 3 Total Expenditure Per Food Expense Capita ($) Rent Expense Health Alcohol 6 5 Hygiene 4 5 Transport 5 5 Electricity 4 4 Water Expense 2 2 Education 1 1 Total Relative Food Expense Health Education Rent Water Alcohol/tobacco Soap Transport Electric Others Food <50% 55% 58% Expenditure 50-65% 26% 24% Share 65-75% 9% 9% >75% 10% 9% Minimum 125% MEB ( US$133) 29% 39% expenditure MEB- 125% MEB (US$ ) 15% 18% Basket SMEB- MEB (US$84-106) 20% 17% < SMEB (US$84) 36% 26% Below poverty line 61% 57%
74 Food consumption and IYCF Household Daily Average Diet Diversity Household Weekly Diet Diversity Food Poor food consumption ( 28) 2% 3% Consumption Border line food consumption (29-5% 10% Score categories (28/42) 42) Acceptable food consumption (>42) 93% 87% Average number of days food items were consumed in the last week Infant and young child feeding indicators Cereals 4 3 Bread/Pasta 7 7 Tubers 5 4 Pulses 2 2 Green Leaves 1 1 Dark yellow/orange vegetables <1 <1 Other vegetables 6 5 Dark yellow/orange rich fruits <1 <1 Other fruits 1 1 Organ meat <1 <1 Flesh meat 1 1 Eggs 4 3 Fish/seafood <1 <1 Sugary products 7 6 Dairy products 6 5 Fats/oils 7 6 Condiments 7 7 Breast Milk 51% 52% Semi- solid food 73% 63% Minimum acceptable frequency 25% 18% Adequate diet diversity 16% 18% Minimum acceptable diet 4% 4% Formula 40% 21% Cereals 46% 56% Dairy 54% 54% Eggs 24% 26% Non- vitamin A vegetables and fruits 26% 20% Pulses 11% 16% Vitamin A vegetables 6% 9% Meat/fish 5% 6% Table AI 11: comparison of key food consumption indicators. 73
75 Coping strategies Independent house (A) One room (B) Tented settlements (C) Sub- standard shelters (D) Experienced a lack of food or money to buy 64% 71% 76% A 75% A enough food in the 30 days prior to the survey Relied on less preferred, less expensive food 88% 92% 95% A D 86% Borrowed food or relied on help from friends or 32% 46% A 56% A 42% relatives Reduced the number of meals eaten per day 60% 63% 67% 61% Spent days without eating 7% 14% A 10% 9% Restrict consumption by adults in order to young- 41% 39% 45% 43% small children to eat? Send household members to eat elsewhere 7% 13% 20% A D 8% Reduced portion size of meals 63% 64% 76% A 68% Restrict consumption of female household 6% 5% 4% 8% members HH adopt strategies of consumption reduction 81% 86% 92% A 83% Selling household goods (radio, furniture, 21% 13% 16% 20% television, jewellery, etc.) Sell productive assets or means of transport 4% 3% 1% 2% (sewing machine, wheelbarrow, bicycle, car, livestock, etc.) Reduce essential non- food expenditures such as 31% 22% 35% 45% A B education, health, etc. Spent savings 20% 14% 28% B 20% Bought food on credit or borrowed money to 40% 49% 48% 47% purchase food Sold house or land 1% 1% 1% 2% Withdrew children from school 13% 10% 22% B 19% Have school children (6-15 years old) involved in 7% 6% 14% 9% income generation Marriage of children under 18 1% 1% 2% 1% Accept high risk, illegal, socially degrading or 4% 3% 1% 2% exploitative temporary jobs/activities? (e.g. theft, survival sex, exchange of favours, services ) Sent an adult household member to seek work 6% 6% 2% 6% elsewhere (regardless of the usual seasonal migration) Begged 2% 1% 3% 3% Did you borrow money in the past 3 months 79% 81% 92% A B 86% Reason for Documentation 1% 2% 1% 3% borrowing Education 2% 0% 0% 2% Food 70% 73% 82% A 73% Health 30% 37% 34% 33% Income 0.2% 0.4% 0% 0% Rent 57% B C 40% 32% 45% Social 0.2% 0% 0% 1% Transport 3% 4% 4% 3% Borrowing source Bank 0% 0.4% 0% 1% Friends and family in Lebanon 92% 87% 92% 90% Table AI 12: comparison of coping strategies and debt indicators. 74
76 Food Security Food Security Food secure 32% 25% Mild food insecurity 56% 62% Moderate food insecurity 12% 12% Severe food insecurity 1% 0.4% FES groups < 50% 54% 68% 50-65% 27% 21% 65-75% 9% 6% 75% 10% 5% Food Consumption Poor food consumption ( 28) 2% 4% Score categories Border line food consumption (29-42) 4% 9% (28/42) Acceptable food consumption (>42) 93% 87% Below poverty line 60% 57% Coping strategies summary (asset depletion) Table AI 13: comparison of food security indicators. HH not adopting coping strategies 18% 13% Stress coping strategies 62% 59% Crisis coping strategies 13% 20% Emergencies coping strategies 7% 8% HH adopt strategies of consumption reduction 41% 92% Experienced a lack of food or money to buy enough food 46% 67% number of meals yesterday- adults number of meals yesterday- children under Food Consumption 4 scale classification Acceptable 57% 35% Acceptable with coping strategies 36% 52% Borderline 5% 10% Poor 2% 3% Assistance Assistance in the last 3 months Food vouchers 73% 69% Hygiene kits 50% 39% Health care 22% 23% Food in kind 32% 21% Cash assistance 6% 13% Fuel subsidy 14% 12% Other NFIs 6% 8% Rent subsidy 9% 5% Psychosocial 2% 1% Table AI 14: comparison between the types of the assistance received
77 ANNEX II: Profile by food security category The classification of households according to their food security situation is based on a composite indicator that considers food consumption, food expenditure and coping strategies. Households were classified into three food security categories: food secure; mildly food insecure; and moderately or severely food insecure. One quarter of households were to be food secure; 62% mildly food insecure; and 13% of households were moderately or severely food insecure. Comparison between households in each of these categories, based on the questionnaire sectors was undertaken. Results identified which factors or indicators were directly or indirectly associated with food security. These significant associations constitute valuable information on causes (for example livelihood sources, household composition) or consequences (for example health or education outcomes) of food insecurity, as well as causality associations that contribute to define the profile of food insecure households and therefore can help their identification in the field (for example type of shelter, latrines). Values with superscripts are statistically different than the values corresponding to the letter used for the superscript, for example the percentage of food secure households with 5 or 6 members is statistically different from the percentage moderately food secure households with 5 or 6 members (see Table AI 1). Demographics Of the food secure households, 36% were likely to consist of five to six members, significantly higher than the mildly food insecure, moderately or severely food insecure. Households headed by a single guardian with dependents were significantly more likely to be moderately or severely food insecure and households headed by women were more likely to fall within the moderately or severely food insecure category. Although there was a higher proportion of households with unaccompanied children that were food insecure, the differences were not significant, probably due to the small number of households in that situation. Households classified as mildly food insecure were significant more likely to have pregnant or lactating women and moderately or severely food insecure households were significantly more likely to have members with temporary functional limitations or injuries. 76
78 FS (A) MFI (B) MSFI (C) HH size HH size categories % 30% 31% % B 28% 31% % 23% 24% 10 15% 19% 14% HH composition Children under five Children aged 5 15 years Members aged years Members aged years Members above 60 years 0.2 C Dependency Ratio Dependency ratio categories 1 59% 54% 56% % 18% 18% % 14% 9% % 14% 17% Households headed by a single guardian with 5% 9% A 11% A dependents under 18 Sex ratio Households headed by women 11% 18% A 24% A Households headed by children 1% 1% 1% Unaccompanied children 3% 2% 1% Average number of specific needs members Presence of individual with specific needs 45% 51% 48% Pregnant and lactating women 28% 38% A 33% Pregnant and lactating women under 16 years 0.5% 0.3% 0.8% Disability 10% 12% 14% Temporary functional limitations/injured 8% 11% 16% A B Chronically ill 39% 44% 40% Serious medical conditions 7% 5% 7% Others 3% 3% 2% Members in need of support to go to the toilet 5% 4% 4% Table AII 1: Demographics by food security comparison. Arrival profile and registration There was a higher percentage of food secure households with members who arrived at the same time and before the conflict started in Syria, and the difference was significant. There also was a higher percentage of food secure households that had a residence permit, with a significant difference noted between food secure and moderately or severely food insecure households. This most likely reflects the economic capacity of households who were able to pay the fees for a residence permit, rather than a causal relationship directly between residency status and food security. 77
79 FS (A) MFI (B) MSFI (C) HH arrive at the same time 58% 57% 64% HH arrive at the 1 to 2 years ago 54% 52% 50% same time categories 1 to 3 months ago 2% 4% 7% 2 to 3 years ago 19% 18% 18% 4 to 6 months ago 7% 8% 6% 7 months to 1 year ago 15% 17% 18% Before conflict started in Syria 3.3% B 0.8% 0.0% Registration date categories Less than 1 month 0.0% 0.2% 0.0% Less than 3 months 12% 13% 15% 3 to 6 months ago 20% 17% 17% From 6 months till 1 year 33% 33% 39% From 1 till 1.5 years 28% 27% 20% From 1.5 till 2 years 4% 5% 5% More than 2 years 4% 5% 5% % HH with residence permit 89% B C 78% C 69% % HH with all members registered 92% 93% 95% % HH with members awaiting registration 6% 6% 7% % HH with non- registered members willing to 11% 13% 11% register % HH with non- registered members not willing to register 9% 6% 6% % HH by reason of Costs to reach the 0.7% 1.9% 1.2% not registering registration centre Disability 0.0% 0.1% 0.0% Lack of trust 0.2% 0.9% 1.2% See no benefit in registration 5% 3% 2% Physically unable 2% 2% 2% Unaware of the process 2% 2% 2% Unsafe 1.2% 0.7% 0.8% Rejected 0.9% 0.7% 0.8% Others 6% 8% 8% % children without birth certificate 76% 76% 77% Table AII 2: Registration and arrival dates by Food Security comparison. Shelter Living in tents in informal tented settlements was significantly more common in the moderately or severely food insecure households, living in independent houses is significantly more common in the food secure households. Households classified as moderately or severely food insecure were more likely to be receiving assistance for occupancy, with the difference being significant. Households classified as food secure were more likely to be living in a furnished rental apartment, with a significant difference compared to households that were mildly, moderately or severely food insecure 78
80 Type of housing Type of occupancy FS (A) MFI (B) MSFI (C) Collective centre % 0.40% 0.00% Independent house 74% B C 58% C 38% One room structure 13% 17% 17% Garage/shop 4% 6% 8% Tent in informal settlements 5% 11% A 26% A B Unfinished building 2% 3% 5% Factory/warehouse 1.2% 2.7% 2.8% Self- constructed shelter in informal 0.7% 1.0% 1.2% settlements Other 0.5% 1.0% 1.2% Collective shelter % 0.7% 0.8% Formal tented 0.2% 0.3% 0.0% Homeless/No shelter 0.0% 0.0% 0.8% Assistance 0.0% 0.2% 0.0% Assistance Charity 1% 5% A 15% A B Furnished rental 20% B C 13% 9% Hosted for free 4% 6% 7% Other 0.2% 0.1% 2.0% B Owned apartment 0.0% 0.3% 0.4% Provided by employer 5% 7% 10% Squatting 0.0% 0.0% 0.4% Unfurnished rental 70% C 69% C 56% Density (m 2 /person) 12.7 B C Density categories Crowding index categories >10.5 m 2 /person 41% B C 30% 22% m2/person 19% 20% 21% m2/person 27% 32% 29% 3.5 m2/person 14% 18% 29% A B 1 2 people/room 45% B C 35% 30% 3 5 people/room 44% 49% 50% 6 7 people/room 7% 10% 12% 8 people/room 4% 6% 8% Rooms 4 rooms 21% C 16% C 9% categories 3 rooms 23% 21% 16% 2 rooms 29% 30% 33% 1 room 27% 33% A 42% A B Average rent B C Living space 64.7 B C 54.8 C 42.7 Number of rooms 2.5 B C 2.3 C 2 Table AII 3: Shelter by Food Security comparison. 79
81 WASH Bottled mineral water was significantly more commonly used as drinking water by food secure households than by food insecure households, while moderately or severely food insecure households used unprotected well as a main source of drinking and cooking and washing water significantly more than food secure or mildly food insecure households. Food secure households used household water (land pipes/tap water) for more than 2 hours per day as a main source of cooking and washing water with a significant difference compared to other categories, while mildly food insecure households used household water for less than 2 hours per day as a main source of cooking and washing water with a significant difference compared to households classified as moderately or severely food insecure. Less moderately or severely food insecure households had access to 35 litres of water, to sufficient water for drinking, cooking and washing and to enough soap and hygiene items for all household members. Moderately or severely food insecure households were more likely to have an open air or traditional pit latrines, with a significant difference compared to other food security categories. Meanwhile, moderately or severely food insecure households were more likely to burn and throw garbage into open fields compared to households. FS (A) MFI (B) MSFI (C) % HH with access to bathrooms 89% 92% C 85% % HH sharing bathroom between more than 15 people 5% 8% 5% Types of Flush toilet 43% B C 33% C 21% Latrine Improved latrine 36% 36% 29% Open air 0.9% 1.7% 8.1% A B Traditional pit 20% 30% A 42% A B % HH sharing latrines with more than 15 people 5% 9% A 10% A Main source of drinking water Borehole 0.2% 0.4% 0.0% Bottled mineral water 45% B C 29% 22% Household water (land 9% 13% 8% pipes/tap water) (<2 hours per day) Household water (land 21% 20% 18% pipes/tap water) (>2 hours per day) Other 1% 2% 5% A B Protected spring 5% 4% 2% Protected dug well 10% 13% 18% A Public reservoir 1% 2% 2% Public standpipe 2% 6% A 7% A UN/NGO tanker/ trucked 0% 1% 2% water Unprotected spring 3% 3% 6% Unprotected well 2% 2% 6% A B Water trucking, non-ngo provider 2% 5% A 3% 80
82 Main source Borehole 1% 1% 2% of cooking Bottled mineral water 5% 3% 3% water Household water (land pipes/ 13% 18% C 11% tap water) (<2 hours per day) Household water (land pipes/ 48% B C 34% 28% tap water) (>2 hours per day) Other 1% 2% A 5% A Protected spring 2% 2% 2% Protected dug well 13% 16% 19% Public reservoir 3% 2% 3% Public standpipe 3% 4% 6% UN/NGO tanker/ truck water 0.9% 2.0% 2.4% Unprotected spring 0.7% 2.2% 4.1% A Unprotected well 2% 4% 8% A B Water trucking, non-ngo 9% 9% 6% provider Water storage No storage capacity 17% 22% 25% capacity Less than 250L 12% 11% 15% L 16% C 15% C 8% L 23% 31% A 22% L 27% B 18% 23% B More than 2000L 6% 3% 6% % HH with treated water 6% 5% 7% Method of Ceramic filters (e.g., candle 35% 28% 47% water treatment type) Chlorine products (e.g. Aquatabs, 40% 38% 27% powder) Traditional methods 25% 32% 7% Do not know 0% 2% 20% B % HH with access to 35 litres 79% B C 64% C 51% % HH with access to sufficient water for 80% B C 66% C 55% drinking, cooking and washing % HH with enough soap and hygiene items for female and male household members 75% B C 57% C 44% Main type of waste disposal Table AII 4: WASH indicators by food security comparison. Burning 4% 5% 10% A B Dumpster 72% 82% A C 73% Collected by municipality 21% B C 9% 5.3% Others 0.5% 0.3% 0.0% Rubbish pit 0.5% 0.7% 0.8% Throw it to open field 3% 3% 11% A B 81
83 Assets and services Households classified as moderately or severely food insecure had significantly less access to assets compared to the other food security categories, except for stoves, dishwashers and motorcycles. Food secure households were more likely to have access to basic assets, as compared to moderately or severely food insecure households. Moderately or severely food insecure households were significantly less likely to have access to sufficient fuel to cover cooking needs, more likely to use wood charcoal as a fuel for cooking, and less likely to have electricity as a main source of lighting. FS (A) MFI (B) MSFI (C) % HH with Mattress 74% C 71% 65% access to Beds 36% B C 22% C 14% assets Blankets 78% C 72% C 64% Winter 64% B C 55% C 44% Table 32% B C 22% C 10% Sofa 46% B C 28% C 16% Stove 66% 66% 60% Refrigerator 72% B C 58% C 37% Water 60% B C 48% C 29% Washing machine 55% B C 47% C 29% Electric oven 5.5% B C 2.5% 0.8% Microwave 3.8% B 1.6% 1.6% Dishwasher 1.2% 0.4% 0.0% Central heating 2.4% B 0.6% 0.4% Air conditioning 5.0% B C 1.6% 0.4% Sewing machine 10.7% B C 4.3% C 0.4% Television 87% B C 82% C 67% Dishwasher 4.0% B 1.5% 1.2% Computers 3.8% B 1.1% 0.0% Satellite 78% C 73% C 56% Motorcycle 9% 8% 5% Cars 6.6% B C 1.7% 1.2% % HH with access to Basic assets 93% C 90% 86% Type of fuel for Electricity 0.2% 0.5% 0.8% cooking Gas 98% C 96% C 86% Other 0.0% 0.1% 0.4% Paraffin 0.0% 0.0% 0.4% Wood charcoal 2% 3% 13% A B % HH access to fuel for cooking needs 83% B C 74% C 60% Main source of lighting Candles 1% 2% 4% Electricity 98% C 98% C 95% Gas 0.0% 0.2% 0.8% Other 0.5% 0.2% 0.8% Table AII 5: Access to assets by food security comparison. 82
84 Education The level of education of the household head, as well as the spouse or caretaker s level of education, was lowest within households classified as moderately or severely food insecure, compared to the food secure households, with a significant difference for the illiterate. Children from moderately or severely food insecure households were significantly more likely to not be attending school, compared to children from food secure households. Education level of household head Education level of spouse/ caretaker FS (A) MFI (B) MSFI (C) Intermediate/ complementary 30% 30% 26% school None 9% 13% 20% A Primary school 38% 41% 39% Knows how to read and write 4% 4% 2% Secondary school 12% B 7% 7% Technical course 2% 2% 2% University 5% 3% 3% Intermediate/ complementary 29% 25% 24% school None 16% 18% 23% A Primary school 33% 37% 31% Knows how to read and write 4% 3% 3% Secondary school 9% B 9% 7% Technical course 2% 1% 2% University 4% 3% 1% Average number of children Children currently not attending school 55% 61% 67% A Children in informal education 7% 6% 5% Children moved to the next grade this year 76% 80% 85% Table AII 6: Education by food security comparison. Health Households not requiring health assistance was more common within the moderately or severely food insecure category, with a significant difference for moderately or severely insecure households not receiving secondary health assistance compared to food secure households. Mildly food insecure households accessed free primary and secondary health care more commonly, were more likely to pay all related health care costs and were less likely to not need health care. Children living in mildly, moderately or severely food insecure households were more likely to be sick, have diarrhoea, have a cough, have a fever, and had more symptoms compared with children living in food secure households, and the differences were significant. 83
85 HH that did not have access to Primary Health Care HH that did not have access to Secondary Health Care Primary Health Type Secondary Health Type Reason why HH could not access primary health care 2 weeks before the survey children with Table AII 7: Health indicators by food security comparison. FS (A) MFI (B) MSFI (C) 24% 25% 32% 28% 23% 38% B Free health care 12% 19% A 13% Cost sharing/partial benefits 34% 32% 29% Don t know 9% 9% 12% Pays all related costs 23% 27% 25% Insurance 0.0% 0.0% 0.0% Receiving contribution 0.5% 0.6% 1.6% Not needed 18% B 11% 17% B Other 4% 3% 3% Free health care 5% 9% A 7% Cost sharing/partial benefits 28% 30% 24% Don t know 10% 10% 17% A B Pays all related costs 24% 29% C 20% Insurance 0.0% 0.1% 0.0% Receiving contribution 0.7% 0.8% 2.0% Not needed 27% B 18% 25% B Other 5% 4% 6% Cost of drugs/treatment 10% 7% 12% Distance of health centre/ 2% 2% 3% transportation costs Don t know where to go 2% 3% 4% Could not afford doctors fees 7% 8% 8% Inadequate treatment by health 2% 1% 2% centre Other 0.2% 0.7% 0.0% Pending appointment 0.2% 0.3% 0.4% Physical limitations preventing 0.2% 0.5% 0.0% access to health centre Rejected 3.3% 3.2% 2.0% Sickness 62% 71% A 70% Diarrhoea 25% 40% A 33% Cough 40% 48% A 53% A Fever 45% 54% A 53% Other 13% 14% 14% Symptoms 42% 52% A 52% A 84
86 Security There were no significant differences in the type and cause of insecurity between households with different levels of food security. Moderate or severely food insecure households experienced insecurity from local authorities and shop owners / managers more often, although the difference was not significant. Household members experienced any kind of insecurity during the last 3 months in Lebanon FS (A) MFI (B) MSFI (C) 11% 13% 11% Kind of Insecurity Cause of Insecurity Community violence/dispute 0.7% 0.9% 2.0% Cross- border shelling 0.2% 0.6% 0.4% Extortion/bribe 0.7% 1.1% 1.2% Forced displacement/eviction 0.5% 0.5% 0.4% Harassment/Physical assault 8% 9% 8% Theft/robbery 0.7% 0.7% 0.8% Kidnapping 0.2% 0.3% 0.0% Others 2.4% 4.0% C 0.8% Armed groups 15% 8% 4% Clashes, rockets, gunfire 2% 3% 4% Hosts/Landlord 9% 9% 7% Local authorities 7% 8% 14% Local organizations/charity 7% 8% 14% based Neighbours/Host community 44% 47% 46% Other causes of insecurity 3% 4% 1% Refugee leaders/refugee 7% 2% 0.0% community Shop owners/managers 7% 9% 14% Household had to reduce mobility 57% 72% 75% Table AII 8: Security by food security comparison. Livelihood sources The number of household members working strongly correlates to food security, as such the proportion of households with no members working increases significantly with food insecurity. At the same time, food secure households were significantly more likely to have at least one member working than food insecure households. There was a significant difference for the main livelihood source between food security categories, food secure households relied more on skilled work and non-agricultural casual labour, while food insecure households were more reliant on food vouchers and households with moderate or severe food insecurity were also more reliant on formal credits/debts, gifts from family or relatives, informal credits or debts (shops, friends or hosts). Moderately or severely food insecure households also relied more on agricultural waged labour and formal credits or debts as a second source of income, with a significant difference. Food vouchers and skilled work were more common secondary livelihood sources for food secure households. 85
87 Proportion of HH members working Number of HH members who worked last month, by category First livelihood source FS (A) MFI (B) MSFI (C) No working members 19% 29% A 37% A B 5 dependents/working 30% 31% 25% member % B C 23% 22% dependents/working member 2 dependents/working 18% 17% 16% member 0 19% 29% A 37% A B 1 58% C 52% 44% 2 18% 15% 13% 3 5% 4% 6% Agricultural waged 5% 3% 4% labour Begging 0.0% 0.1% 0.4% Cash from charitable 0.0% 0.1% 0.0% organizations Cash from humanitarian 0.0% 1.2% 0.0% organizations Food voucher 30% 43% A 50% A Formal commerce 0.5% 0.1% 0.0% Formal credits/ debts 0.2% 0.7% 4.1% A B Gifts from family 1.7% 2.1% 4.9% A B /relatives Informal commerce 1.4% 1.0% 0.0% Informal credits debts 2% 3% 7% A B (e.g. from shops) Not applicable 3% 2% 1% Non- agricultural casual 32% C 29% 22% labour (casual labour) Other 0.0% 0.6% 0.0% Remittances 0.9% 0.5% 0.0% Sale of crops 0.2% 0.1% 0.0% Sale of livestock and 0.2% 0.0% 0.0% animal produce Sale of food aid 0.2% 0.1% 0.4% Sale of assets (car, 0.5% 0.1% 0.8% bicycle, refrigerator, TV, jewellery) Savings 2.4% 1.4% 0.4% Skilled work 20% B C 12% C 5% 86
88 Second livelihood source Third livelihood source Agricultural waged 2% 3% 8% A B labour Begging 0% 0% 1% Cash from charitable 0% 0% 0% organizations Cash from humanitarian 1% 3% 1% organizations Food voucher 23% B C 16% C 8% Formal commerce 0.9% 0.0% 0.0% Formal credits/ debts 1% 3% 6% A Gifts from family or 5% 5% 7% relatives Informal commerce 0.9% 0.5% 0.4% Informal credits debts 0.0% 0.1% 0.4% (e.g. from shops) Formal credits/ debts 13% 19% A 16.3% Not applicable 23% 22% 26% Non- agricultural casual 18% 19% 18% labour Other 0.7% 0.6% 1.6% Remittances 0.2% 0.7% 0.0% Sale of crops 0.0% 0.3% 0.8% Sale of livestock and 0.0% 0.1% 0.0% animal produce Sale of food aid 0.2% 0.7% 0.8% Sales of assets (car, 0.9% 0.7% 0.8% bicycle, etc.) Sale of non- food 0.0% 0.1% 0.0% assistance Savings 3% 2% 2% Skilled work 7% B C 4% 2% Agricultural waged 0.5% 0.7% 1.6% labour Begging 0.0% 0.0% 0.8% Cash from charitable 0.0% 0.7% 0.0% organizations Cash from humanitarian 0.5% 0.9% 0.4% organizations Food voucher 6.2% 4.6% 4.1% Formal commerce 0.2% 0.0% 0.0% Formal credits/ debts 1% 2% 1% Gifts from family or 2% 3% 4% relatives 87
89 First livelihood source in Syria Second livelihood source in Syria Informal commerce 0.2% 0.1% 0.0% Informal credits or debts 15% 20% 17% Not applicable 67% B 58% 64% Non- agricultural casual 2.4% 3.9% C 0.8% labour Other 1.4% 1.9% 4.1% Remittances 0.7% 0.7% 0.4% Sale of crops 0.0% 0.1% 0.0% Sale of food aid 0.0% 0.3% 0.0% Sales of assets (e.g. car, 0.2% 0.7% 0.8% bicycle, etc.) Sale of non- food 0.0% 0.1% 0.0% assistance Savings 1.4% 1.1% 0.8% Skilled work 1.4% 1.0% 0.8% Agricultural waged 8.1% 10.0% 9.3% labour Cash from charitable 0.0% 0.1% 0.0% organizations Food voucher 0.2% 0.0% 0.0% Formal commerce 10% 8% 8% Formal credits/ debts 0.0% 0.1% 0.0% Gifts from family or 1.7% 1.3% 1.2% relatives Informal commerce 3% 3% 5% Informal credits or debts 0.2% 0.4% 1.2% Not applicable 1.9% 1.0% 0.8% Non- agricultural casual 24% 28% 29% labour) Other 3% 2% 2% Remittances 3.1% B 1.0% 0.0% Sale of crops 7% 10% 15% A Sale of livestock and 2% 3% 3% animal produce Sale of food aid 0.2% 0.0% 0.0% Sale of assets (e.g. car, 0.2% 0.1% 0.4% bicycle) Savings 0.5% 0.0% 0.0% Skilled work 36% C 32% 26% Agricultural waged 3% 3% 3% labour Cash from charitable 0.0% 0.1% 0.0% organizations Food voucher 0.2% 0.2% 0.4% 88
90 Third livelihood source in Syria Formal commerce 4% 2% 2% Formal credits or debts 0.2% 1.5% 0.8% Gifts from family or 2.8% 2.1% 2.0% relatives Informal commerce 0.2% 1.5% 0.8% Informal credits or debts 4% 6% 4% Not applicable 55% 55% 57% Non- agricultural casual 6% 7% 5% labour Other 3% 2% 5% Remittances 0.7% 0.3% 0.0% Sale of crops 4% 5% 4% Sale of livestock and 3% 3% 6% animal produce Sale of food aid 0.0% 0.1% 0.0% Sale of assets (e.g. car, 0.2% 0.4% 0.0% bicycle) Savings 7% 5% 7% Skilled work 7% 6% 5% Agricultural waged 0.5% 0.8% 0.8% labour Begging 0.0% 0.1% 0.8% B Cash from charitable 0.0% 0.1% 0.0% organizations Food voucher 0.2% 0.0% 0.0% Formal commerce 0.5% 0.3% 0.8% Formal credits/ debts 0.0% 0.6% 0.0% Gifts from 0.9% 1.5% 0.4% family/relatives Informal commerce 0.2% 0.6% 0.4% Informal credits debts 3% 6% A 7% A Not applicable 86% B C 77% 79% Non- agricultural casual 0.7% 2.2% 0.8% labour Other 3% 2% 5% Remittances 0.0% 0.2% 0.0% Sale of crops 1.2% 1.3% 0.4% Sale of livestock and 0.5% 0.8% 1.6% animal produce Savings 2% 4% 3% Table AII 9: Livelihood sources by food security comparison. Expenditure Expenditure (per capita and for the household) was significantly lower for moderately or severely food insecure households, especially for health, education, rent, water, alcohol, hygiene items, electricity, and telecommunication. 89
91 The more food secure the household was, the higher total expenditures were. Half of the households classified as moderately or severely food insecure spent less than US$88 per month per capita, while more than 50% of the food secure households spent more than US$132 per capita (MEB>125%). Moderately or severely food insecure households were more likely to spend at least half of their total expenditure on food. Table AII 10: Expenditures by food security comparison. 90 Monthly expenditures per HH Monthly expenditures per capita Share Food expenditure 4 categories Minimum Expenditure Basket categories FS (A) MFI (B) MSFI (C) Food Health 83 C 73 C 35 Education 16 B C 7 2 Rent 241 B C 173 C 100 Water 18 B C 14 C 8 Alcohol 35 B C Soap and Hygiene 29 B C 25 C 21 items Electricity Clothes 20 B C 11 4 Telecommunication 25 B C 18 C 12 A Assets 5 B C 3 C 1 Rest 6 B C 2 C 3 Total Expenditures 874 C Food Rent 47 B C 31 C 20 Water 3 B C 2 C 2 Tobacco/alcohol 7 B C 5 4 Hygiene 6 B C 4 4 Fuel 4 C 4 C 3 Transport 7 B C 4 C 3 Electricity 4 B C 3 C 2 Telecom 5 B C 3 C 2 Household assets 1.0 C Others 1.1 B Health 15 C 15 C 6 Education 1.5 B C Clothing 2.3 B C 1.4 C 0.6 Total 164 B C 131 C 104 <50 Low 94% B C 63% C 35% Medium 6% 28% A 24% A High 0% 6% 18% B >75 Very high 0% 3% 23% B 125% MEB ( 132$) 53% B C 36% C 21% MEB- 125% MEB (106 17% 20% C 14% - 131$) SMEB- MEB (88-105$) 10% 14% A 18% A < SMEB (88$) 20% 29% A 48% A B Below poverty line 35% 51% A 73% A B <3.84
92 Food consumption As food consumption is one of the three indicators considered in the calculation of food insecurity, the association between these 2 variables is expected by definition. There is a strong correlation between food consumptions and food insecurity. However, the magnitude of the specific differences provide useful information to understand the food usually consumed by each food security group. Moderately or severely food insecure households were more likely to have poor food consumption or borderline food consumption. Food secure households had a higher diet diversity, although all households consumed bread and pasta at the same level. Food secure households consumed significantly more green leaves and vegetables, vitamin A-rich fruits, other fruits, flesh meat, eggs and dairy products than both mildly and moderately or severely food insecure households. Additionally, food secure households consumed significantly more cereals, tubers, pulses, vitamin A rich vegetables, other vegetables, organ meat, fish/seafood, sugary products, fats/oil, and condiments than moderately or severely food insecure households. Moderately or severely food insecure households also consumed fewer meals on average. There were no significant differences for infant and young children feeding practices between households with different food security, except diet diversity. Children in moderately or severely food insecure households were significantly less likely to have the minimum diet diversity. Children from moderately or severely food insecure households consumed more cereals but less pulses, dairy products, meat or fish, eggs, vitamin A-rich vegetables and fruits, other vegetables and fruits, with a significant difference for dairy products and other vegetables and fruits. Food Consumption Score categories (28/42) Food Consumption 4 scale classification Household Weekly Diet Diversity- 5 categories HH Daily Average Diet Diversity- 5 categories FS (A) MFI (B) MSFI (C) Poor food consumption ( 28) 0% 0% 18% Borderline food consumption (29-0% 4% 32% B 42) Acceptable food consumption (>42) 100% 96% C 50% Acceptable 100% 20% 0% Acceptable with coping strategies 0% 76% C 50% Borderline 0% 4% 32% B Poor 0% 0% 18% 2 food groups 0% 0% 1% 3 4 food groups 0.2% 0.0% 6.1% A 5 6 food groups 0.5% 0.7% 15.4% A B 7 8 food groups 8% 21% A 47% A B 9 food groups 91% B C 78% C 31% 2.5 food groups 0.2% 0.1% 2.0% B food groups 0.2% 0.4% 5.3% A B food groups 1% 2% 17% A B food groups 23% 32% A 51% A B 6.5 food groups 76% B C 66% C 25% HH Daily Average Diet Diversity 7.3 B C 7.1 C 5.8 HH Weekly Average Diet Diversity 10.0 B C 9.6 C 8.0 Number of meals eaten yesterday by adults 2.2 C Number of meals eaten yesterday by children under C 2.7 C 2.5 Average number of days the follow food Cereals 3 4 A C 3 Bread and pasta Tubers 4 C 4 C 3 91
93 follow food items were consumed by the HH Child eat or drink a day before Tubers 4 C 4 C 3 Pulses 2 C 2 C 1 Green leaves 1 C 1 C Vitamin A- rich vegetables C Other vegetables 6 C 6 C 4 Vitamin A rich fruits B C Fruits 1 B C Organ meat Flesh meat 1 B C 1 C Eggs 4 C 4 C 2 Fish/seafood C C Sugary products 7 C 7 C 6 Dairy products 6 B C 6 C 3 Fats/oil 6 7 A C 6 Condiments 7 7 C 7 Cereals 58% 56% 61% Pulses 20% 16% 10% Dairy products 61% C 54% C 36% Meat / Fish 11% B 6% 0% Eggs 29% 28% 19% Vitamin A rich vegetables and fruits 10% 9% 4 % Other vegetables and fruits 20% 23% C 10% Breastfeeding a day before 47% 54% 58% Complementary Feeding 72% 63% 61% Meal Frequency 22% 19% 17% Diet Diversity 20% C 20% C 7% Minimum Acceptable Diet 5% 5% 1% Table AII 11: Food consumption by food security comparison. Coping Strategies As coping strategies is one of the three indicators considered in the calculation of food insecurity, the association between these 2 variables is expected by definition. However, the magnitude of the specific differences found for each coping strategy provide useful information to understand the practices usually applied by each food security group. Food secure households were significantly less likely to experience a lack of food or money to buy food than food insecure households and were also less likely to apply coping strategies. Moderate or severely food insecure households were more likely to engage in crisis and emergency coping strategies whereas food secure or mildly food insecure households applied less severe coping strategies. Food consumption related coping strategies were significantly more common in moderately or severely food insecure households than by mildly food insecure households, and more by mildly food insecure households than food secure households. Although not all differences between mild and moderate or severe food insecurity households were significant, in particular the differences in restriction of food consumption by adults; restriction of food consumption by women; and relying on less preferred or expensive food, were not significant. Food secure households applied four coping strategies that are not directly related to food consumption: selling household goods, spending savings, buying food on credit or borrowed money to purchased food and sending adults to work elsewhere. There were no significant differences by food security status for spending savings, selling household goods or productive assets, or for early marriage. The percentage of food insecure households that borrowed money in the last three months is significantly higher than food secure households. The percentage of food secure households with no debt is higher than food insecure households, and a third of the moderately or severely food insecure households have debt of more than US$
94 During the last 30 days, % HH experienced a lack of food or money to buy food FS (A) MFI (B) MSFI (C) 8% 86% A 90% A HH adopt strategies of consumption reduction 58% 91% A 96% A B Summary of HH not adopting CS 34% B C 6% 3% asset depletion Stress CS 66% C 60% C 33% coping strategies (CS) Crisis CS 0.0% 25.1% 37.4% B Emergencies CS 0.0% 8.2% 26.4% B During last 7 days before the survey % HH During the past 30 days before the survey % HH Relied on less preferred food. 76% 94% A 93% A Borrowed food or relied on help 20% 43% A 52% A B from friends Reduced the number of meals 38% 67% A 75% A B per day Spent days without eating. 3% 9% A 18% A B Restrict consumption by adults in order for children. 25% 46% A 50% A Sent members to eat elsewhere. 3% 11% A 18% A B Reduced portion size of meals. 40% 72% A 81% A B Restrict consumption of female. 1% 7% A 9% A Selling household goods (furniture...) 21% 19% 18% Sell productive assets or means 0.0% 3.2% 4.1% of transport (car ) Reduce essential non-food expenditures 0.0% 29.3% 50.7% B (education ) Spent savings 18% 20% 20% Bought food on credit or borrowed 18% 43% A 50% A money to purchase food. Sold house or land 0.0% 1.1% 1.8% Withdrew children from school 0.0% 12.9% 25.3% B Have school children involved in 0.0% 5.9% 19.5% B income generation Marriage of children under % 1.1% 2.3% Accept high risk, illegal, socially degrading or exploitative temporary jobs (e.g. theft, survival sex...) 0.0% 2.4% 5.4% B Sent an adult household member 6% 4% 9% B to seek work elsewhere Begged 0.0% 1.2% 5.9% B HH that borrowed money in the past three 66% 87% A 89% A months Total amount of debt (US$)
95 Primary reason for borrowing Source of borrowing Total amount of debt categories Documentation/legal state fees 1.7% 1.3% 0.4% To pay for education 1.9% 1.1% 1.2% To buy food 42% 66% A 69% A To pay for health care 19% 29% A 28% A For income generating activities/investment 0.2% 0.1% 0.4% To buy/rent house 39% 45% C 31% To pay social event 0.2% 0.2% 0.0% For transport 1.7% 2.9% 3.7% To purchase water 59% B C 48% C 29% Other 2.1% 1.7% 2.0% Bank/formal institution 0.0% 0.1% 0.5% Friends/relatives in Lebanon 90% 90% 93% Friends/relatives out of Lebanon 7% 7% 4% Informal savings group 0.0% 0.1% 0.0% Local associations/charity 0.0% 0.1% 0.0% Money lender 0.4% 1.6% 2.8% Others 6.1% 4.2% 2.8% No debt 35% B C 14% 12% US$ % 24% 25% US$ % 34% A 31% US$ % 28% 32% A Table AII 12: Coping Strategies by food security comparison. ANNEX III: PROFILE BY BENEFICIARY STATUS Not all Syrian refugee households in Lebanon, or in the survey, receive food voucher assistance. Comparisons between households receiving and not receiving assistance, based on the questionnaire sectors were undertaken. Results identified which factors or indicators were directly or indirectly associated with the receipt of assistance. For this analysis households receiving food vouchers with a ration for half or more household members were considering to be receiving assistance, while those who do not receive a food voucher or receive a food voucher with a ration for less than half of the household members is considered to not be receiving assistance. For example, a household of 7 members who receives a food voucher of US$60 on a monthly basis (ration for 2 people) would be considered in the analysis as not receiving assistance. According to these criteria, although 69% of households were receiving food vouchers, only 61% were classified as receiving assistance. The proportion of households receiving assistance by region is shown in Table AII 1. Values with superscripts are statistically different than the values corresponding to the letter used for the superscript, for example the average household size of eligible households is statistically different from the average household size on ineligible households (see Table AI 2). Table AIII 1: Receipt of food vouchers by region. 94 Akkar Bekaa BML South T5 Receiving food vouchers 72% 75% 55% 75% 71%
96 Demographics The demographics of a household had a significant effect on edibility status. However, the demographic differences found by eligibility status were expected due to the targeting criteria. The burden index applied to UNHCR registration database that serves as basis for determining registration case and eligibility status for assistance is mainly based on the dependency ratio, the gender of household members and specific vulnerabilities like big household size, households headed by women and/or children and households headed by a single guardian with dependents among others 49. Eligible households were larger than that of ineligible households, the average eligible household had 7 members whereas ineligible households had 6 members. Eligible households were also more likely to have a significantly higher dependency ratio, due to less adult members and more children, on average. Households headed by a single guardian with dependents and households where all members were dependents were more likely to be eligible, although these were not significance most likely due to the small number of households in this situation. Households headed by women and households with a higher ratio of women to men were also significantly more likely to be eligible. The proportion of households headed by children and households with unaccompanied children was higher among those receiving vouchers, however the differences were not significant, again probably due to the small number of households in this situation. The presence of household members with specific needs did not have an impact on eligibility status. Excluded (A) Included (B) HH size A HH size % B 21% categories % 34% A % 27% A 10 16% 18% HH Children Under A composition Children 5-15 years A Members years Members years 3.1 B 2.8 Members above 60 years Dependency ratio A Dependency ratio categories 1 73% B 33% % 22% A % 21% A 2.1 7% 24% A 4% 11% A HH headed by a single guardian with dependents under 18 Sex ratio A HH headed by women 11% 21% A HH headed by children 0.6% 0.9% Unaccompanied children 1.8% 2.2% Average number of specific needs members Presence of individual with a specific needs 47% 51% Pregnant and lactating women 35% 35% Pregnant and lactating women under 16 years 0.3% 0.5% Disability 11% 12% Temporal functional limitations/injured 11% 11% Chronically ill 44% 41% Serious medical conditions 6% 6% Others 3% 3% Members in need of support to go to the toilet 3% 5% Table AIII 2: Demographics by eligibility status. 95
97 Arrival profile and registration Households that had been registered for more than 6 months before the survey were significantly more likely to be eligible for assistance. All other arrival profile and registration factors had no significant effect on assistance eligibility. Excluded (A) Included (B) HH arrive at the same time 54% 60% HH arrive at the 1 to 3 months ago 7% B 3% same time 4 to 6 months ago 11% B 6% categories 7 months to 1 year ago 15% 17% 1 to 2 years ago 48% 54% 2 to 3 years ago 18% 19% Before the conflict started in Syria 2.2% 0.8% Registration date Less than 1month 0.3% 0.0% categories Less than 3 months 20% B 9% 3 to 6 months ago 18% 17% More than 6 months 62% 74% A % HH members with residential permit 83% B 77% % HH with all members registered 92% 94% % HH members awaiting registration 8% B 5% % HH with members willing to register 15% 11% % HH with non- registered members not willing to register 8% 6% % by reason of Costs to reach the registration centre 1.30% 1.60% not registering Disability 0.0% 0.1% Lack of trust 1.3% 0.5% See no benefit in registration 4% 3% Physically unable 2% 2% Unaware of the process 3% 1% Unsafe 1.2% 0.6% Rejected 1.3% 0.4% Others 9% 7% % Children without birth certificate 22% 25% Table AIII 3: Arrival profile by eligibility status. 96
98 Shelter Households receiving assistance paid less rent and resided in accommodation that was more densely populated. However, there were no significant differences in the type of housing or occupancy by assistance eligibility status. Excluded Included Type of Collective centre (>6 families managed) 0.3% 0.3% Housing Collective shelter (>6 families unmanaged) 0.4% 0.7% Factory / warehouse 2.4% 2.3% Formal tented 0.1% 0.3% Garage/ shop 6.1% 5.1% Handmade shelter in informal settlements 0.9% 1.0% Homeless / No shelter 0.1% 0.1% Independent house 59% 59% One room structure 19% 14% Other 1.0% 0.9% Tent in informal settlements 9% 13% Unfinished building 2% 3% Type of Assistance 0.1% 0.1% Occupancy Assistance Charity 5% 6% Furnished rental 16% 13% Hosted for free 5% 6% Other 0.3% 0.5% Owned apartment 0.3% 0.2% Provided by employer 7% 7% Squatting / occupancy 0.1% 0.0% Unfurnished rental 66% 68% Density 11.8 B 9.6 Density >10.5 m2/person 34% 30% categories m2/person 21% 19% m2/person 29% 31% 3.5 m2/person 17% 19% Rent average Crowding Index categories 1-2 person/room 45% B 35% 3-5 person/room 42% 46% 6-7 person/room 8% 11% 8 person/room 6% 7% Living space Number of rooms A Number of rooms by categories 4 rooms 16% 17% 3 rooms 20% 21% 2 rooms 26% 33% A 1 room 39% B 29% Table AIII 4: Shelter by assistance eligibility status. 97
99 WASH Households eligible for assistance were more likely to have access to 35 litres of water per person per day as well as sufficient access to hygiene items. Eligible households were also more likely to receive drinking water from UN/NGO truck/tanker. However, there were no significant differences by assistance eligibility status for source of cooking and washing water, type of latrines, access to bathrooms, water storage capacity or water treatment. Although, there was a significant association between eligibility status and waste collection, probably reflecting the regional differences on eligibility status and waste collection. Excluded (A) Included (B) % HH with access bathrooms 90% 90% % HH sharing bathroom with more than 15 people 7% 7% Type of Flush toilet 36% 32% Latrine Improved latrine 35% 35% Open air 3% 2% Traditional pit 27% 31% % HH sharing latrines with more than 15 people 8% 8% Main Borehole 0.3% 0.3% source of Bottled mineral water 33% 31% drinking Household water tap / water network (<2 hrs per 12% 11% water day) Household water tap / water network (>2 hrs per 18% 21% day) Other 2% 3% Protected spring 4% 4% Protected dug well 13% 13% Public reservoir 2% 2% Public standpipe 5% 5% UN/NGO tanker/ truck water 0.3% 1.8% A Unprotected spring 3% 4% Unprotected well 2% 3% Water trucking non- NGO provider 4% 4% Main Borehole 1% 1% source of Bottled mineral water 4% 3% cooking Household water tap / water network (<2 hrs per 17% 15% and day) washing Household water tap / water network (>2 hrs per 39% 36% water day) Other 3% 2% Protected spring 2% 2% Protected dug well 15% 16% Public reservoir 2% 3% Public standpipe 3% 5% UN/NGO tanker/ truck water 1% 2% Unprotected spring 2% 2% Unprotected well 4% 4% Water trucking non- NGO provider 8% 9% Water 98 None 21% 21%
100 Water None 21% 21% storage less than 250L 14% 11% capacity L 16% 13% L 26% 29% L 19% 22% More than 2000L 5% 4% HH treating water 5% 6% Method of water treatment Ceramic filters 33% 33% Chlorine products 30% 40% Traditional Method 30% 24% Do not know 7% 3% HH access to 35 Litres 62% 68% A HH access to sufficient water for drinking, cooking and washing 65% 69% HH with enough soap and hygiene items for females and males 54% 62% A Main type Burning 4% 6% of waste disposal Dumpster barrels 73% 82% A Municipality 16% B 8% Others 0.3% 0.3% Rubbish pit 1.0% 0.4% Throw field 5% 4% Table AIII 5: Services by assistance eligibility status. Assets and services Households eligible for assistance had significantly less beds but more gas stoves, TVs and satellites. Further eligible households were more likely to have sufficient access to fuel but differences were not significant. % HH with access to Excluded (A) Included (B) Mattress 61% 68% A Beds 28% B 22% Blankets 70% 73% Winter clothes 55% 55% Table 24% 22% Sofa 31% 30% Stove 61% 68% A Fridge 60% 58% Water 50% 47% Washing machine 43% 48% Electric oven 3% 3% Microwave 3% 2% Dishwasher 0.6% 0.5% Central heating 1.2% 0.8% Air conditioning 3% 2% Sewing machine 4% 6% TV 77% 83% A Dishwasher 0.6% 0.5% 99
101 Dishwasher 0.6% 0.5% Computers 1% 2% Satellite 66% 75% A Motorcycle 7% 8% Cars 3% 3% % HH with access to basic assets 88% 91% Type of fuel Electricity 0.6% 0.4% foe cooking Gas 94% 96% Other 0.1% 0.1% Paraffin 0.1% 0.0% Wood charcoal 5% 4% % HH with access to sufficient fuel to cover the cooking needs 72% 76% Main source of lighting Candles 1% 2% Electricity 98% 97% Gas 0.0% 0.4% Other 0.4% 0.3% Table AIII 6: Assets and services by assistance eligibility status. Education Households receiving food assistance were less likely to have a household head or a spouse/caretaker with a university education degree. The eligibility of a households was strongly correlated to children s education. Households receiving food assistance also had significantly more school age children (3-17 years old), those children were more likely to attend school, or non-formal education, and those children were more likely to move to the next grade. Education level of household head Education level of spouse/ caretaker Excluded (A) Included (B) None 11.1% 14.0% Knows how to read and write 3.6% 4.1% Primary school 41.7% 39.0% Intermediate/ complementary school 27.3% 30.7% Secondary school 8.7% 7.7% Technical course 2.4% 1.9% University 5.2% B 2.6% Not Applicable 6.7% 4.6% None 16.8% 18.8% Knows how to read and write 2.8% 3.7% Primary school 34.0% 35.6% Intermediate/ complementary school 25.3% 25.7% Secondary school 8.8% 8.2% Technical course 1.5% 1.4% University 3.9% B 1.9% Average number of children A Children currently not attending school 72.1% B 53.0% Children attending non formal education 4.20% 7.70% A Children moved to the next grade this year 12% 25% A Table AIII 7: Education by assistance eligibility status. 100
102 Health Households eligible for assistance were more likely to receive assistance for primary and secondary health care, whereas ineligible households were more frequently unable to access primary health care when needed. Eligible households were also more likely to benefit from cost sharing when accessing health care. Households not eligible for assistance were more likely to not require health assistance, for primary and secondary health care. Among the reasons for not being able to access health assistance when required, distance was more mentioned by ineligible households. Excluded (A) Included (B) % HH that did not have access to primary health care 33% B 22% % HH that did not have access to secondary health care 32% 23% Type of Free health care 14% 18% primary Cost sharing/partial benefits 25% 36% A health Don t know 10% 9% care HH pays all related costs 29% 24% received Insurance 0.0% 0.0% HH received contribution 0.7% 0.6% Not needed 18% B 11% Type of secondary health care received Reasons for not receiving health care 2 weeks before the survey children with Other 4% 2% Free health care 8% 8% Cost sharing/partial benefits 22% 32% A Don t know 11% 11% HH pays all related costs 28% 26% Insurance 0.0% 0.1% HH received contribution 0.7% 1.1% Not needed 25% B 19% Other 6% B 3% Cost of drugs/treatment 9% 8% Distance of health centre/ transportation costs 4% B 1% Don t know where to go 3% 3% Can t afford doctors fees 9% 7% Inadequate welcoming/treatment by health centre 2% 2% staff Other 0.7% 0.3% Pending Appointment 0.1% 0.4% Physical limitations to access the health centre 0.9% 0.0% Rejected 3% 3% Sickness 72.1% 67.8% Diarrhoea 34.7% 36.4% Cough 48.2% 46.5% Fever 52.8% 51.8% Other 16.1% 12.9% Symptoms 49.9% 50.1% Table AIII 8: Health by assistance eligibility status. 101
103 Security Ineligible households were more likely to have experienced insecurity in the 3 months prior to the survey. In particular, ineligible households were significantly more like to have experienced extortion and bribery. Eligible households were more likely to have felt harassed, although the difference was not significant. Any of the household members experienced any kind of insecurity during the last 3 months in Lebanon Insecurity Type Table AIII 9: Security by assistance eligibility status. Excluded (A) Included (B) 15% 11% Community violence/dispute 8% 8% Cross- border shelling 4% 3% Extortion/ bribery 13% B 4% Forced displacement / eviction 3% 4% Harassment / violence / Physical assault 63% 73% Theft / robbery 5% 7% kidnapping 2.1% 1.7% Others 4% 3% Armed groups 8% 9% Clashes, rockets, gunfire 2% 3% Hosts / Landlord 7% 10% Local authorities 12% 5% Cause of Local organizations/ charity based 12% 5% Insecurity Neighbours / Hosts community 46% 46% Refugee leaders / refugee community 4% 2% Shop owners / managers 10% 8% Others 4% 3% Household had to reduce mobility 67% 71% Livelihood sources As food vouchers were a main source of livelihoods for Syrian refugee households in Lebanon, the association between these 2 variables is expected by definition. There is a strong correlation between livelihood sources and food voucher eligibility. The proportion of households that depend on food vouchers as one of the three main livelihood sources is, as expected, significantly higher among the eligible households. On the other hand, formal and informal debts or loans, skilled work, non-agricultural casual labour, gifts from relatives or savings were significantly more common as the first main livelihood source among the ineligible households. Eligible households tend to have more livelihood sources than ineligible ones. There were proportionally more eligible households with non-agricultural casual labour as the second main livelihood source and with informal debts as the third livelihood source, whereas informal debts were more common among the ineligible households as the second main livelihood source. Ineligible households had a significantly higher proportion of household members who were working. While, eligible households were more likely to have no working member, although the differences were not significant. 102
104 Excluded (A) Included (B) Average number of HH members that have worked last month 1 1 Proportion of No working members 24% 30% working 5 or more dependents per working member 20% 36% A household 3-4 dependents per working member 29% B 23% members 2 dependents per working member 27% B 11% HH members who worked last month in categories First livelihood source Second livelihood source 0 24% 30% 1 55% 50% 2 15% 15% 3 5% 5% Agricultural waged labour 4% 3% Begging.1%.1% Cash from charitable organizations.1% 0.0% Cash from humanitarian organizations.3% 1.0% Food voucher 15% 57% A Formal commerce.1%.2% Formal credits/ debts 2.1% B.5% Gifts from family /relatives 4.9% B.8% Informal commerce.9% 1.0% informal credits debts (shops, friends hosts) 7% B 1% Non applicable 2% 2% Non- agricultural casual labour (provision of 40% B 21% services) other 1.0% 0.0% Remittances.7%.4% Sale of crops.1%.1% sale of livestock and animal produce 0.0%.1% Sale of food aid.1%.2% Sales of assets (car, refrigerator, TV, jewellery).4%.2% Savings 2.8% B.6% Skilled work 17% B 10% Agricultural waged labour 2% 4% Begging.1%.3% Cash from charitable organizations.1%.1% Cash from humanitarian organizations 1% 2% Food voucher 7% 22% A Formal commerce.1%.3% Formal credits/ debts 3% 3% Gifts from family /relatives 6% 5% Informal commerce.4%.6% Informal credits debts (shops, friends hosts).1%.1% Informal credits/ debts 22% B 14% Non applicable 35% B 16% Non- agricultural casual labour (provision of 11% 23% A services) Other 1.2%.5% Remittances.6%.4% 103
105 Third livelihood source 104 Remittances.6%.4% Sale of crops.6%.1% sale of livestock and animal produce 0.0%.1% Sale of food aid.9%.4% sales of assets (car, refrigerator, TV, jewellery).9%.6% Sale of non- food assistance 0.0%.1% savings 3% 2% Skilled work 4% 5% Agricultural waged labour.4% 1.0% Begging.3% 0.0% Cash from charitable organizations.4%.5% Cash from humanitarian organizations 1.0%.6% Food voucher 3% 6% A Formal commerce.1% 0.0% Formal credits/ debts.9% 2.2% Gifts from family /relatives 3% 3% Informal commerce 0.0%.2% Informal credits debts (shops, friends hosts) 11% 22% A Non applicable 69% B 56% Non- agricultural casual labour ( provision of 3% 3% services) Other 3% 2% Remittances.7%.6% Sale of crops 0.0%.1% Sale of food aid.1%.2% sales of assets (car,, refrigerator, TV, jewellery).7%.5% Sale of non- food assistance.1% 0.0% savings 1.2% 1.1% Skilled work 1.0% 1.1% Table AIII 10: Income and livelihood source by assistance eligibility status. Expenditure Expenditure per capita, especially for rent, health, hygiene items, fuel, transport, electricity, telecommunications and tobacco and/or alcohol, was significantly higher among households who were not eligible for assistance. However at the household level, food and fuel expenditures were significantly higher among the eligible households, although at a lower confidence level (p<0.05). At the household level ineligible households still have higher rents and telecommunication costs. The proportion of total expenditure on food was higher for eligible households whereas the share expenditure spent on rent and telecommunication was higher among the ineligible households. Eligible households were more likely to spend more than half of their total expenditure on food. Non-eligible households were significantly more likely to be under the poverty line and the Minimum Expenditure Basket (MEB), whereas eligible households were more likely to have a total expenditure above 125% the MEB. The correlation between eligibility status and expenditure could be explained, at least partially, by the existing association among eligibility status, geographic regions, household size and expenditure per capita. Households with more members usually have lower per capita expenditure because some expenses do not vary proportionally to the number of household members and remain constant or quite similar with relatively small increases in household size, therefore were shared across more household members. Results also show regional differences on expenditure, household size and eligibility status. Therefore, the differences observed on expenditure by eligibility status could be also reflecting regional differences on expenditure and household size as well as difference on household size by eligibility status.
106 Monthly expenditure per HH Monthly expenditure per capita Share food expenditure 4 categories Minimum Expenditure Basket Total daily expenditure per capita Table AIII 11: Expenditures by eligibility status. Excluded (A) Included (B) Food A Health Education Rent Water Alcohol Soap and hygiene items Electricity Clothes Telecommunication Assets Rest Total A Food Rent 40.4 B 28.8 Water Tobacco/alcohol 6.6 B 4.1 Hygiene 5.5 B 4.2 Fuel 4.3 B 3.9 Transport 5.3 B 4.0 Electricity 3.8 B 3.1 Telecom 4.8 B 2.9 Assets Others Health 16.0 B 12.0 Education Clothing Total Monthly Expenditure B <50 Low 75% B 61% Medium 15% 26% A High 5% 7% >75 Very high 4% 6% 125% MEB ( US$132) 48% B 33% MEB- 125% MEB (US$ ) 16% 20% SEB- MEB (US$88-105) 10% 16% A <SEB (US$88) 26% 32% A Above poverty line % B 46% Below poverty line < % 54% A 105
107 Food consumption and food security Eligible households hadhigher diet diversity, higher, and more often acceptable, food consumption score (FCS) and were more likely to cook at least once a day. Eligible households also consume more cereals, bread, pulses, meat, fish, eggs, dairy products, sugar, fats and condiments. On the other hand, ineligible households were more likely to have poor or borderline FCS and were more likely to be severely food insecure. However there were no significant differences regarding the number of meals per day or who was prioritised to receive food. Food consumption score categories (28/42) Food security classification- categories Food consumption - 4 scale classification Household Weekly Diet Diversity - 5 categories Household Daily Average Diet Diversity - 5 categories Excluded (A) Included (B) Poor FCS( 28) 6% B 2% Border line FCS (29-42) 12% B 7% Acceptable FCS (>42) 81% 91% A Food secure 23% 25% Mild food insecurity 62% 62% Moderate food insecurity 14% 13% Severe food insecurity 1% B 0% Acceptable 30% 37% A Acceptable with coping 52% 54% strategies Borderline 12% B 7% Poor 6% B 2% 2 food groups 0.3% 0.0% 3-4 food groups 1.8% B 0.4% 5-6 food groups 5% B 2% 7-8 food groups 26% B 19% 9 food groups 67% 79% A 2.5 food groups 0.6% 0.3% food groups 1.9% B 0.5% food groups 7% B 2% food groups 39% B 28% 6.5 food groups 52% 69% A Household Daily Average Diet Diversity A Household Weekly Average Diet Diversity A Average number of days the follow food items were consumed by the HH Cereals 3 4 A Pasta 7 7 A Tubers 4 4 A Pulses 2 2 A Green leaves 1 1 Vitamin A rich vegetables Other vegetables 5 6 A Vitamin A rich fruits Other fruits 1 Organ meat Flesh meat 1 1 A Eggs 3 4 A Fish/Seafood A 106
108 Sugary products 6 7 A Dairy products 5 6 A Fats/oil 6 7 A Condiments 7 7 A Child eat or drink a day before Cereals 50.6% 60.3% Pulses 13.3% 17.4% Dairy products 45.9% 57.3% A Meat Fish 5.9% 6.5% Eggs 23.1% 29.1% Vitamin A rich vegetables and 7.8% 9.3% fruits Other vegetables and fruits 18.2% 22.5% Breastfeeding a day before 53.7% 52.0% Complementary feeding 56.1% 69.2% A Meal frequency 18.0% 20.4% Diet diversity 14.5% 19.8% Minimum acceptable diet 3.1% 4.9% Table AIII 12: Food consumption by eligibility status Coping strategies Households that lacked food or money to buy food were less common among eligible households, although the difference was not significant. There were no significant differences for the categories of applied coping strategies (stress, crisis or emergency), but the proportion of households applying specific strategies differ significantly by eligibility status. Eligible households were more likely to restrict the consumption of adults in order to feed young children, to spend savings and to reduce essential non-food expenditures like health or education. At a lower level of significance (p<0.05) eligible households were also more likely to withdrew children from school. On the other hand, ineligible households were more likely to reduce the number of meals eaten per day, to spend days without eating and to borrow food or rely on help from friends or relatives. The level of debt was not significantly different between eligible and ineligible households, although ineligible households had, on average, US$50 more debt. Excluded (A) Included (B) During the last 30 days, % HH experienced a lack of food or money to buy food 71% 66% HH adopt strategies of consumption reduction 86% 82% Summary of asset HH not adopting CS 12% 13% depletion coping Stress CS 61% 56% strategies (CS) Crisis CS 18% 22% Emergencies CS 9% 9% During last 7 days before the survey % HH Relied on less preferred food. 90% 89% Borrow food or relied on help from friends. 43% B 36% Reduce number of meals per day 67% B 58% Spent days without eating. 14% B 6% Restrict consumption by adults in order to children. 37% 44% A Sent members to eat elsewhere. 12% 9% Reduce portion size of meals. 69% 63% Restrict consumption of female. 6% 6% Selling household goods (furniture, etc.). 22% 17% 107
109 During the past 30 days before the survey % HH Sell productive assets or means of transport (car ) 3% 3% Reduce essential non- food expenditures (education ) 27% 36% A Spent savings. 16% 23% A Bought food on credit or borrowed money to purchase food. 42% 45% Sold house or land. 2% 1% Withdrew children from school. 12% 17% Have school children involved in income generation. 7% 9% Marriage of children under 18. 2% 1% Accept high risk, illegal, socially degrading jobs (e.g. theft, survival sex, etc.). 3% 3% Sent an adult to seek work elsewhere. 6% 5% Begged. 2% 2% HH borrowing money in the past 3 months 81% 82% Total amount of debt US$ Total amount of debt US$- categories Primary reason for borrowing Source of borrowing No debt 19% 18% % 24% % 31% % 27% Buy food 63% 60% Buy/ rent house 41% 41% Pay health care 25% 28% Documentation / legal state fees (such as passport) 1.3% 1.2% Pay education 1.3% 1.3% For income generating activities/investment 0.1% 0.2% pay social event 0.0% 0.3% Transport 2% 3% Purchase water 50% 47% Other 2% 2% Bank 0.3% 0.0% Friends/relatives in Lebanon 73% 75% Friends/relatives out of Lebanon 5% 5% Informal saving group 0.1% 0.0% Local associations / charity 0.0% 0.1% Money lender 1.3% 1.3% Other 3% 4% Table AIII 13: Coping strategies and debt by assistance eligibility status. ANNEX IV: PROFILE BY HOUSEHOLD HEAD GENDER Households can be differentiated between households headed by men and households headed by women. Results identified which factors or indicators were directly or indirectly associated with the gender of the household head. Demographic The vast majority of households were headed by men, across all 5 regions. Beirut-Mount Lebanon had the highest percentage of households headed by men, while Akkar had the highest percentage of households headed by women. A significantly different distribution across regions was noted between households headed by men and women (p<0.001). 108
110 100% 90% 80% 70% 60% 50% 40% 30% 20% 10% 0% 90% 87% 82% 84% 77% 79% 23% 21% 18% 16% 13% 10% Akkar Bekaa BML South Tripoli 5 Total Male Female*** Figure AIV 1: Gender of the household head according to regions (***significant at p<0.001). The majority of households had members that were between 5 and 15 years of age, and these households were primarily headed by men. Furthermore, 65% of households had members aged between 2 and 5 with significant differences between the gender of the household heads. Only 20% of households have elderly members and these households were primarily headed by women. 80% 70% 60% 50% 40% 30% 20% 10% 0% Households with members less than 2** Households with members less than 5*** Households with members between 5 and 15 Households with members between 16 and 17 Households with elderly (60 and above) Male- headed household Female- headed household Total Figure AIV 2: Age distribution of the household by the gender of the household head (**significant at p<0.005; ***significant at p<0.001). 109
111 The dependency ratio, the number of dependent household members per working household member, was significantly higher for households headed by women. Households headed by women were significantly, almost 3 times, more likely to have more than 2 dependant household members per working household member. >=2.1*** <=1 Mean*** 100% 90% 80% 70% 60% 50% 40% 30% 20% 10% 0% 10% 29% 13% 12.56% 172% 12.70% 19.98% 17.91% 13.45% 125% 115% 7.16% 57.51% 49.98% 56.29% HHH man HHH woman Total 200% 180% 160% 140% 120% 100% 80% 60% 40% 20% 0% Figure AIV 3: Dependency Ratio by gender of household head (***significant at p<0.001). Households headed by women were significantly less likely to have a household member with specific needs, this was mostly because households headed by women were significantly less likely to have a household member that was pregnant or lactating. 120% 100% 80% 60% 40% 3% 4% 6% 3% 4% 6% 10% 3% 10% 7% 9% 43% 43% 45% Adults in need of support for daily basic acdvides In need of support for daily basic acdvides Other specific needs Serious medical condidons Temporal funcdonal limitadons 20% 0% 37% Male- headed household 21% Female- headed household 35% Total Chronically ill Pregnant / lactadng women*** Figure AIV 4: Household members with specific needs according to gender of household head (***significant at p<0.001). 110
112 Shelter The type of occupancy differed significantly between households headed by men and women (p<0.005). Households headed by men were more likely to reside in an unfurnished rental than households headed by women. 80% Male- headed household Female- headed household Total 70% 60% 50% 40% 30% 20% 10% 0% Unfurnished rental** Furnished rental Provided by employer Hosted (for free) Assistance / Charity Figure AIV 5: Type of occupancy by gender of household head (**significant at p<0.005). Households headed by women, on average, paid significantly less rent compared to households headed by men (p<0.05) US$165 compared to US$ Male- headed household Female- headed household Total Mean* Median Figure AIV 6: Mean and median monthly rent paid according to the gender of household head (*significant at p<0.05). 111
113 WASH There were significant differences in drinking water (p<0.005) and cooking and washing water (p<0.05) sources. Households headed by women were more likely to use household water with less than two hours of supply per day for drinking and washing and cooking. 100% 90% 80% 70% 60% 50% 40% 30% 20% 10% 0% 36% 26% 34% 2% 10% 5% 19% 3% 11% 7% 17% 2% 10% 5% 19% 4% 4% 4% 4% 6% 4% 14% 14% 15% 4% 4% 4% 39% 30% 37% 11% 16% 12% 16% 19% 17% HHH man HHH woman Total HHH man HHH woman Total Other Public reservoir Water trucking non- NGO UN/NGO Tanking / Truck Water Unprotected spring Protected spring Borehole BoNled water Unprotected well Protected well Public standpipe Drinking Water Cooking Water Figure AIV 7: Water source by gender of the household head (*significant at p<0.05; ** significant at p<0.005). Households headed by women were more likely to have insufficient water and hygiene items as compared to households headed by men. While less households headed by women had sufficient water or hygiene items compared to households headed by men. 50% 40% 30% 20% 10% 34% 32% 39% 39% 37% 46% 35% 33% 40% < 35 l water/person/day Insufficient water Insufficient hygiene items 0% HHH man HHH woman Total Figure AIV 8: Access to water and hygiene items by gender of household head. There was minimal difference regarding water storage capacity between households headed by men and women. 112
114 100% 90% 18.28% 17.19% 18.11% 80% 70% 60% 50% 40% 30% 20% 10% 0% 29.97% 24.78% 29.14% 16.52% 14.88% 15.14% 12.47% 18% 13% 19.87% 20.37% 19.95% HHH man HHH woman Total More than Less than 250 No storage capacity Figure AIV 9: Water storage capacity by gender of household head. There was minimal difference regarding the type of toilet used between households headed by men and women. 100% 90% 80% 28% 29% 28% 70% 2% 2% 2% Tradi9onal Pit 60% Open Air 50% 34% 34% 34% Improved Latrine 40% 30% 20% 10% 0% 36% 34% 36% 13% 9% 9% HHH man HHH woman Total Flush Toilet Latrine shared with >=15 people Figure AIV 10: Type of latrine by gender of household head. 113
115 Education There was no significant difference in reasoning for children not attending school between households headed by men and women. However, households headed by women more often sighted the need for children to stay at home as a reason for children not attending school. 35% 30% 25% 20% 15% 10% 5% 0% HHH man HHH woman Total Figure AIV 11: Reason for not going to school by gender of household head. Health There was minimal difference in receiving health care between households headed by men and women. 90% 80% 70% 60% 50% 40% 30% 20% 10% 0% 30.55% 28.46% 30.22% 14.82% 14.82% 14.82% 20.45% 24.28% 21.07% 11.21% 9.22% 10.89% 39.06% 38.33% 38.94% 27.87% 27.34% 27.78% HHH man HHH woman Total Male Female Total PHC SHC Not required Not able to receive Received when needed Figure AIV 12: Health care assistance by gender of household head. 114
116 100% 90% 80% 70% 60% 50% 40% 30% 20% 10% 0% 3% 4% 3% 6% 3% 4% 10% 11% 11% 10% 10% 11% 15% 11% 15% 22% 21% 22% 26% 24% 26% 26% 21% 26% 28% 30% 29% 28% 30% 28% 15% 22% 7% 10% 16% 8% PH SH PH SH PH SH Male- headed household Female- headed household Total Other Don't know Never needed HH recived financial contribukon Insurance HH pays all related costs Cost sharing Free health care Figure AIV 13: Cost share of health care by gender of household head. 35% Other 30% 25% 20% 15% 1% 3% 4% 8% 1% 4% 3% 9% 3% 4% 8% Pending appointment Don t know where to go Rejected / not accepted Cost of drugs/treatment Cost of doctor visit 10% 5% 0% 9% 11% 9% 2% 2% 2% 2% 1% 2% HHH man HHH woman Total Inadequate welcoming/treatment by health center staff Physical limitanons to access the health center Distance of health center/ transportanon cost Figure AIV 14: Reasons for not receiving the required health care. Security There was minimal security differences between households headed by men and women. 140% 120% 100% 80% 60% 40% 20% 0% 5% 7% 8% 13% 9% 12% 9% 12% 8% 5% 7% 7% 11% 8% 69% 70% 69% HHH man HHH woman Total Others Forced displacement/evicbon Community violence/dispute Cross- border shelling Harassment/ arrest at checkpoint Figure AIV 15: Type of insecurity for households that experienced insecurity. 115
117 Livelihood sources The majority of households headed by women relied on food vouchers to secure their livelihoods compared to households headed by men which primarily relied on food vouchers and non-agricultural casual labour to secure their livelihood. 100% 90% 80% 16% 4% 18% 14% Skilled work Savings Sale of assets (car, bicycle, refrigerator, TV, jewelry) Sale of food aid (food vouchers or parcels) 70% 60% 31% 4% 29% Sale of livestock and animal produce Sale of crops RemiLances 50% 40% 30% 1% 60% 2% Other Non- agricultural casual labor (casual labor, provision of services) NA Informal credit/debts (shops, friends hosts) 20% 37% 40% Informal commerce GiTs from family/relauves 10% Formal credit/debts (e.g. banks) 0% 3% 4% 3% HHH man HHH woman Total Formal commerce Figure AIV 16: Main livelihood source in Lebanon by gender of the head of the household. In Syria, households headed by women relied upon agricultural labour as a livelihood source more than households headed by men which more commonly relied upon skilled work and non-agricultural labour. 100% 90% 80% 70% 60% 50% 40% 30% 20% 10% 0% 34% 28% 33% 9% 9% 3% 9% 28% 25% 28% 4% 3% 3% 3% 8% 8% 8% 10% 14% 10% HHH man HHH woman Total Skilled work Savings Sale of assets (car, bicycle, refrigerator, TV, jewelry) Sale of food aid (food vouchers or parcels) Sale of livestock and animal produce Sale of crops RemiLances Other Non- agricultural casual labor (casual labor, provision of services) Figure AIV 17: Main livelihood source in Syria by gender of the head of the household. 116
118 Expenditure Household expenditure on food, rent, alcohol and tobacco, hygiene items, fuel, transport, electricity and telecommunications were significantly different between households headed by men and households headed by women. Households headed by women spent considerably less on food, rent and alcohol and tobacco. 350 Food*** Health House rent*** Alcohol / Tobacco*** Hygiene items*** Fuel* 100 Transport** HHH man HHH woman Total Electricity* TelecommunicaCons* ** Figure AIV 18: Median monthly expenditures by gender of household head (*significant at p<0.05; ** significant at p<0.005; *** significant at p<0.001). Households headed by women spent a larger proportion of their total household expenditure on food, 20% of households headed by women spent more than 65% of their total expenditure on food, compared to 9% of households headed by men. 100% 90% 80% 4% 5% 21% 11% 9% 5% 6% 21% 70% 21% 60% 75% and above 50% 65% - 75% 40% 30% 69% 59% 68% 50% - 65% <= 50% 20% 10% 0% HHH man HHH woman Total Figure AIV 19: Food expenditure share by gender of household head. 117
119 Reasons for not cooking were not significantly different between households headed by men and women. HHH man HHH woman Total 90% 83% 80% 70% 60% 50% 40% 30% 20% 10% 0% 2% Lack of adequate safe water 16% Lack of cooking fuel Lack of food to cook Lack of stove / kitchen 9% 11% Lack of utensils 3% No Cme or can t cook Figure AIV 20: Reasons for not cooking. Households headed by women spent significant less on sugar and sweets, sugars and sweets expenditure was the only food category to be significantly different between households headed by men and households headed by women (p<0.05). However households headed by women spent more money on bread and pasta and less money on pulses as compared to households headed by men HHH man HHH woman Total Bread, pasta Cereals (sorghum, millet, maize, wheat) Tubers (potatoes) Groundnuts / Beans / Pulses Milk / yoghurt / cheese Oil / fat / gee Sugar / sweets* Canned food (tomato paste, tuna, meat) Fresh meat / chicken / eggs / fish Fresh fruits and vegetables Other foods (condiments, spices, salt, etc.) Cooked / processed food eaten at home or outside by the family Figure AIV 21: Mean monthly food expenditure by gender of household head (*significant at p<0.05). 118
120 Food consumption and source There were no significant differences in Food Consumption Scores between households headed by men and households headed by women. Acceptable food consump?on (>42) Border line food consump?on (29-42) Poor food consump?on (<=28) 100% 90% 80% 70% 60% 50% 40% 30% 20% 10% 0% 88% 84% 87% 9% 12% 9% 3% 4% 4% HHH man HHH woman Total Figure AIV 22: Food Consumption Score by gender of household head. Food security Households headed by men had higher rates of food security than households headed by women, 27% of households headed by men were food secure compared to 16% of households headed by women. 100% 90% 80% 70% 60% 50% 40% 30% 20% 10% 0% 0% 1% 0% 11% 13% 19% 61% 62% 65% 27% 15% 25% HHH man HHH woman Total Severe food insecurity Moderate food insecurity Mild food insecurity Food secure Figure AIV 23: Food Security Category by gender of household head. 119
121 Households headed by men were more likely to have an acceptable, or acceptable with coping strategies, Food Consumption Score (FCS), while more households headed by women were more likely to have a borderline or poor FCS. 100% 90% 80% 70% 60% 50% 40% 30% 20% 10% 0% Poor Borderline Acceptable with coping strategies Acceptable 3% 3% 3% 9% 13% 9% 51% 37% 57% 27% 52% 35% HHH man HHH woman Total Figure AIV 24: Food Consumption Score (FCS) category by gender of household head. Households headed by women were more likely to adopt crisis or emergency coping strategies. 100% 90% 80% 70% 60% 50% 40% 30% 20% 10% 0% Emergencies coping strategies Crisis coping strategies Stress coping strategies HH not adopang coping strategies 7% 12% 8% 19% 20% 24% 60% 52% 59% 13% 13% 13% HHH man HHH woman Total Figure AIV 25: Assets Depletion coping strategies category by gender of household head. 120
122 Coping strategies There were no significant differences in coping strategies adopted between households headed by men and households headed by women. Although households headed by women were more likely to borrow food from friends and relatives. This was true for households that had a food shortage and households without a food shortage. HHH man HHH woman Total 100% 90% 80% 70% 60% 50% 40% 30% 20% 10% 0% 90% Relied on less preferred, less expensive food 38% Borrowed food or relied on help from friends or rela@ves 60% Reduced the number of meals eaten per day 9% Spent days without ea@ng 43% Restrict consump@on by adults in order to young- small children to eat 9% Send household members to eat elsewhere 65% Reduced por@on size of meals 6% Restrict consump@on of female household members Figure AIV 26: Food-related coping strategies by gender of household head. There were no significant differences in the rate or reasoning for borrowing between households headed by men and households headed by women. HHH man HHH woman Total 80% 70% 60% 50% 40% 30% 20% 10% 0% 73% 50% 31% 1% 0% 45% 3% 1% 0% 2% Figure AIV 27: Reasons for borrowing money by gender of household head. 121
123 Households headed by men, on average, had considerably higher levels of debt (US$1295) than households headed by women (US$491). Almost double the proportion of households headed by men had debts over US$600 compared to households headed by women. 100% 90% 80% % 16% 28% US$601 and above 70% 60% 50% 40% 30% 20% 10% 37% 29% 31% 29% % % % 19% 19% US$ US$200 and below No debt Mean Median 0% HHH man HHH woman Total 0.0 Figure AIV 28: Amount of debt by gender of household head. ANNEX V: PROFILE BY SYRIAN-LEBANESE POPULATION RATIO The demographics of the community in which Syrian refugees in Lebanon were residing may serve as a proxy to other characteristics about a household, such as food security, expenditure or health. Results identified which factors or indicators were directly or indirectly associated with the demographics surrounding households. In particular the demographics considered the size of the Syrian refugee population, compared to the local Lebanese population. Results correspond to the comparison of the ratio categories of registered and awaiting registration Syrians refugees compared to Lebanese residents. The ratio was obtained by calculating the percentage of Syrians refugee compared to Lebanese residents by cluster and was divided into 3 categories low under to 0.2 Syrian s per Lebanese resident, medium between 0.2 and 0.5, high more than 0.5. Data regarding Lebanese residents was sourced from the UNDP locality level vulnerability mapping, however there was no information about Lebanese residents for 18 clusters. Values with superscripts are statistically different than the values corresponding to the letter used for the superscript, for example the average household size of households residing where the concentration of Syrian refugees, relative to Lebanese residents, was highest is statistically different from other areas (see Table AV 1). Demographics Household size was largest where the concentration of Syrian refugees, relative to Lebanese residents, was highest. 122
124 Low (A) Medium (B) High (C) HH size A B HH size % 31% 28% categories % 31% 29% % 24% 22% 10 15% 14% 21% A B HH Children Under composition Children between 5 and 15 years A B Members between 16 and 17 years Members between 18 and 59 years A Members above 60 years Dependency Ratio Dependency ratio categories 1 48% 50% 46% % 18% 18% % 15% 17% % 17% 20% Household headed by a single guardian with 11% 14% 19% A dependents Sex ratio Household headed by women 12% 15% 21% A Households headed by children 0.7% 0.3% 0.9% Unaccompanied children 2.1% 1.6% 1.7% Average Number of Specific needs members Presence of individual with a specific needs 49% 44% 53% B Pregnant and lactating women 28% 40% A 37% A Pregnant and lactating women under 16 years 0.7% 0.3% 0.4% Disability 11% 12% 13% Temporal functional limitations/injured 9% 11% 11% Chronically ill 43% 41% 43% Serious medical conditions 7% 4% 7% Others 2% 2% 3% Members in need of support to go to the toilet 5% 6% 3% Table AV 1: Demographics by demographic profile. Arrival profile The percentage of household members with residential permits was higher where the concentration of Syrian refugees, relative to Lebanese residents, was lowest. Low (A) Medium (B) High (C) HH arrive at the same time 44% 43% 41% HH arrive at 1 to 2 years ago 48% 54% 51% the same 1 to 3 months ago 4% 4% 4% time 2 to 3 years ago 23% 19% 17% categories 4 to 6 months ago 8% 7% 8% 7 months to 1 year ago 14% 15% 19% Before conflict started in Syria 2.9% 1.4% 0.4% 123
125 Registration date categories Table AV 2: Arrival date by demographic profile. Before conflict started in Syria 2.9% 1.4% 0.4% Less than 1month 0.0% 0.0% 0.2% less than 3 months 13% 13% 12% 3 to 6 months ago 20% 16% 16% more than 6 months 67% 71% 72% % HH with residential permit 86% C 84% C 70% % HH with all members registered 93% 91% 93% % HH awaiting registration 5% 7% 6% % HH with members willing to register 13% 10% 13% % HH with non- registered members not willing to register % HH by Costs to reach the registration reason of centre not registering 8% 7% 7% 2.4% 1.8% 0.8% Disability 0.2% 0.0% 0.0% Lack of trust 0.9% 1.3% 0.7% See no benefit in registration 2% 5% 3% Physically unable 1.6% 1.3% 2.7% Unaware of the process 3.1% 0.5% 1.9% Unsafe 0.9% 0.3% 1.2% Rejected 1.2% 0.8% 0.4% Others 8% 6% 9% % children without birth certificate 77% 74% 77% Shelter Households were more likely to live in independent houses and furnished rental apartments where the concentration of Syrian refugees, relative to Lebanese residents, was lowest and were more likely to live in ITS and unfurnished rental apartments where the concentration of Syrian refugees, relative to Lebanese residents, was highest. Type of housing Low (A) Medium (B) High (C) Collective centre (>6 families 0.2% 0.3% 0.4% managed) Collective shelter (>6 families 0.0% 1.3% 0.7% unmanaged) Factory / warehouse 2.4% 1.8% 2.5% Formal tented 0.2% 0.0% 0.4% Garage/ shop 5% 6% 6% Handmade shelter in informal 0.0% 2.1% 0.8% settlements Homeless / No shelter 0.2% 0.0% 0.0% Independent house 73% B C 60% C 51% One room structure 12% 19% A 15% Other 0.7% 0.5% 1.6% Tent in informal settlements 3% 6% 19% A B Unfinished building 3% 4% 2% 124
126 Type of occupancy Assistance Charity 2% 4% 8% A B Furnished rental 22% B C 14% C 9% Hosted for free 6% 3% 6% B Other 0.5% 0.0% 0.3% Owned apartment 0.2% 0.5% 0.1% Provided by employer 8% 10% C 5% Squatting / occupancy 0.0% 0.3% 0.0% Unfurnished rental 62% 68% 71% A Density Density categories Crowding index categories Rooms categories >10.5 m2/person 30% 31% 34% m2/person 21% 18% 21% m2/person 32% 32% 29% 3.5 m2/person 17% 18% 17% 1-2 person/room 39% 34% 38% 3-5 person/room 48% 48% 47% 6-7 person/room 8% 11% 9% 8 person/room 5% 7% 6% 4 rooms 16% 15% 19% 3 rooms 23% 16% 23% B 2 rooms 32% 32% 29% 1 room 30% 36% 30% Rent Average Living Space Number of rooms Table AV 3: Shelter by demographic profile. WASH Households residing where the concentration of Syrian refugees, relative to Lebanese residents, was lowest had better access to flush toilet and were more likely to have sufficient water for drinking, cooking and washing. Whereas in areas where the concentration of Syrian refugees, relative to Lebanese residents, was higher households were more likely to use a traditional pit latrine and share latrines with more than 15 people. Low (A) Medium (B) High (C) % HH with access bathrooms 90% 89% 93% % HH sharing bathroom with more than 15 people Types of Latrine 5% 8% 8% Flush toilet 43% B C 34% 29% Improved latrine 32% 36% 34% Open air 2% 3% 2% Traditional pit 23% 27% 35% A B % HH sharing latrines with more than 15 people 3% 7% 12% A 125
127 Main source of drinking water Main source of cooking water Water storage capacity Borehole 0.5% 0.3% 0.3% Bottled mineral water 39% B C 30% C 23% Household water tap / water network (<2 hrs per day) Household water tap / water network (>2 hrs per day) 9% 14% 13% 29% C 24% C 15% Other 0.2% 0.3% 5.1% A B protected spring 3% 6% A 4% protected dug well 8% 8% 17% A B Public reservoir 2% 2% 2% Public standpipe 4% 5% 6% UN/NGO tanker/ truck water 0.5% 0.5% 2.0% Unprotected spring 2.6% 3.1% 4.0% Unprotected well 1.6% 1.3% 3.7% Water trucking non-ngo provider 1.2% 5.5% A 5.1% A Borehole 1.9% 0.5% 0.9% Bottled mineral water 4% 4% 2% Household water tap / water network (<2 hrs per day) Household water tap / water network (>2 hrs per day) 16% 18% 16% 49% C 41% C 26% Other 0% 1% 4% A B protected spring 1% 3% A 2% protected dug well 8% 9% 23% A B Public reservoir 3% 3% 2% Public standpipe 4% 4% 4% UN/NGO tanker/ truck water 1% 2% 3% A Unprotected spring 3% 2% 2% Unprotected well 3% 2% 6% B Water trucking non-ngo provider 7% 11% 9% No Storage capacity 23% 20% 19% less than 250L 14% 12% 11% L 15% 18% C 12% L 25% 26% 31% L 19% 20% 22% more than 2000L 4% 4% 5% % HH with treating water 5% 6% 6% Method of water treatment Ceramic filters 33% 43% 33% Chlorine products (aqua tabs, powder) 44% 38% 25% Traditional Method 17% 19% 36% Do not know 5.6% 0.0% 5.6% % HH with access to 35 Litres 71% C 72% C 59% 126
128 % HH with access to sufficient water for drinking, cooking and washing % HH with enough soap and hygiene items for females and males household members Main type of waste disposal Table AV 4: WASH by demographic profile. Table AV 5: Assets by demographic profile. 72% C 72% C 62% 62% 59% 58% Burning 4% 7% 5% Dumpster barrels 76% 77% 85% A B Municipality 17% B C 11% C 5% Others 0.9% C 0.0% 0.1% Rubbish pit 0.2% 0.8% 0.3% Throw it to open field 2% 4% 4% Assets and services Households living in areas with fewer Syrian refugee households had more access to a sofa, as well as beds and fridges. Low (A) Medium (B) High (C) % HH with Mattress 64% 67% 73% access to Beds 36% 24% 24% Blankets 58% 67% 72% Winter 41% 45% 52% Table 27% 17% 21% Sofa 45% B 19% 28% Stove 63% 52% 68% Fridge 74% 60% 56% Water heater 55% 45% 47% Wash machine 50% 43% 54% Electric oven 5% 0% 4% Microwave 1.3% 4.8% 0.0% Dishwasher 1.3% 0.0% 1.4% Central heating 0% 0% 0% Air conditioning 6.4% 2.4% 0.0% Sewing machine 4% 5% 4% TV 89% 86% 83% Dishwasher 4% 2% 1% Computers 1% 0% 1% Satellite 74% 74% 63% Motorcycle 3% 5% 4% Cars 3% 0% 1% % HH with access to basic assets 83% 81% 93% Type of fuel Electricity 0.7% 0.8% 0.3% for cooking Gas 96% 95% 96% Other 0.5% 0.0% 0.0% Paraffin 0.0% 0.3% 0.0% Wood charcoal 3% 4% 4% % HH access to fuel for cooking needs 76% 79% 72% Main source Candles 0.9% 0.8% 2.7% of lighting Electricity 98% 99% 97% 127
129 Education There were no significant results regarding demographic makeup and education, however more children were not attending school in areas where there less Syrian refugees, relative to Lebanese residents. Low (A) Medium (B) High (C) Household None 9% 7% 10% head Knows how to read and write 0.0% 7.1% 5.6% education Primary school 37% 36% 39% level Intermediate/ complementary 40% 24% 25% school Secondary school 6% 14% 14% Technical course 1% 2% 3% University 6% 10% 3% Spouse None 18% 5% 14% education Not Applicable 8% 17% 4% level Knows how to read and write 1% 5% 3% Primary school 15% 36% A 38% A Intermediate/ complementary 41% 21% 25% school Secondary school 13% 10% 13% Technical course 0.0% 2.4% 0.0% University 4% 5% 3% Average number of children Children currently not attending school 69% 55% 55% Children attending non formal education 6% 7% 6% Children moved to the next grade this year 83% 79% 80% Table AV 6: Education by demographic profile. Health There were no significant differences in health care based upon the demographics of where households were living. Low (A) Medium (B) High (C) Primary Health Assistance not accessed 23% 22% 30% Secondary Health Assistance not accessed 20% 25% 29% Primary Health Type Free health care 12% 17% 20% A Cost sharing/partial benefits 35% C 33% 28% Don t know 9% B 5% 10% B Pays all related costs 24% 28% 28% Insurance 0% 0% 0% Receiving contribution 0.5% 0.3% 0.9% Not needed 17% C 16% C 10% Other 3% 1% 4% 128
130 Secondary Health Type Reasons for not receiving health care 2 weeks before the survey children illness Other 3% 1% 4% Free health care 6% 12% A 8% Cost sharing/partial benefits 27% 28% 30% Don t know 12% B 6% 11% B Pays all related costs 26% 27% 29% Insurance 0% 0% 0.1% Receiving contribution 0.7% 1% 1.2% Not needed 25% C 24% C 16% Other 3% 3% 5% Cost of drugs/treatment 6% 6% 11% A B Distance of health centre/ 2% 1% 3% transportation costs Don t know where to go 2% 3% 3% Can t afford doctors fees 8% 5% 9% B Inadequate treatment by health 1% 2% 1% centre Other 0.5% 0.8% 0.1% Pending Appointment 0.5% 0.3% 0.3% Physical limitations to access 0.2% 0% 0.1% the health centre Rejected 2.6% 2.1% 3.5% Sickness 68% 72% 68% Diarrhoea 31% 37% 39% A Cough 44% 51% 45% Fever 55% 53% 50% Other 13% 14% 14% Symptoms 47% 55% 49% Table AV 7: Health by demographic profile. Security Households living in area where the Lebanese population was larger, relative to the Syrian refugee population, felt more insecure than elsewhere. Insecurity from neighbours was particularly more common in areas where the refugee population was relatively smaller. Household members experienced any kind of insecurity during the last 3 months in Lebanon Low (A) Medium (B) High (C) 18% B C 11% 9% Kind of Community violence/dispute 9% 7% 6% insecurity Cross- border shelling 1% 5% 6% Extortion/ bribe 8% 5% 8% Forced displacement / eviction 3% 10% 1% Harassment / Physical assault 73% 62% 65% Theft / robbery 96% 93% 93% kidnapping 1% 5% 1% Others 19% 14% 17% Cause of Armed groups 2.1% 1.0% 0.7% 129
131 Cause of insecurity Others 19% 14% 17% Armed groups 2.1% 1.0% 0.7% Clashes, rockets, gunfire 0.5% 0.0% 0.5% Hosts / Landlord 1.4% 1.3% 0.7% Local authorities 2.1% C 1.0% 0.5% Local organizations/ charity 2.1% C 1.0% 0.5% based Neighbours / Hosts community 10% B C 3% 4% Others Causes Insecurity 15% 10% 20% Refugee leaders / refugee 0.7% 0.8% 0.0% community Shop owners / managers 2.4% 0.8% 0.8% Others 5% C 4% 2% Household had to reduce 14% B C 8% 6% mobility Table AV 8: Safety and security by demographic profile. Livelihood sources Households living in areas where the Syrian refugee population was relatively larger, compared to Lebanese residents, was more likely to rely upon the food voucher as their primary livelihood source. 130 Average number of HH members that have worked last month HH members who worked last month in categories First livelihood source Low (A) Medium (B) High (C) 1.1 C % 23% 35% A B 1 55% C 58% C 47% 2 17% 13% 15% 3 5% 5% 4% Agricultural waged labour 5% 2% 4% Begging 0.0% 0.3% 0.0% Cash from charitable organizations 0.2% 0.0% 0.0% Cash from humanitarian organizations 0.7% 1.0% 0.7% Food voucher 29% 38% A 54% A B Formal commerce 0.2% 0.3% 0.1% Formal credits/ debts 0.7% 0.5% 1.6% Gifts from family /relatives 3.1% 2.1% 2.3% Informal commerce 1.9% C 0.8% 0.1% Informal credits debts (shops, etc.) 3% 3% 4% Non applicable 1.6% 3.1% 1.5% Non- agricultural casual labour (casual 34% C 34% C 21% labour) Other 0.2% 0.0% 0.7% Remittances 0.9% 0.3% 0.4% Sale of crops 0.0% 0.0% 0.3% Sale of livestock and animal produce 0.2% 0.0% 0.0% Sale of food aid 0.0% 0.0% 0.1% Sales of assets (car, bicycle, refrigerator, 0.0% 0.0% 0.5% TV, jewellery) Savings 1.6% 1.3% 1.6% Skilled work 18% C 13% C 7% Second Agricultural waged labour 1.4% 3.4% 4.3% A
132 Second livelihood source Third livelihood source First livelihood source in Syria Skilled work 18% 13% 7% Agricultural waged labour 1.4% 3.4% 4.3% A Begging 0.2% 0.0% 0.1% Cash from charitable organizations 0.2% 0.3% 0.0% Cash from humanitarian organizations 1.2% 4.2% A C 1.2% Food voucher 23% C 17% C 12% Formal commerce 0.0% 0.0% 0.0% Informal credits/ debts 3% 2% 4% Gifts from family /relatives 4% 5% 7% Informal commerce 0.9% 0.0% 0.7% Informal credits debts (shops ) 0.0% 0.0% 0.3% Informal credits/ debts 18% 14% 18% Non applicable 25% 26% 21% Non- agricultural casual labour 14% 21% 21% A Other 0.2% 0.0% 1.6% A Remittances 0.9% 0.3% 0.4% Sale of crops 0.2% 0.0% 0.4% Sale of livestock and animal produce 0.0% 0.0% 0.1% Sale of food aid 0.5% 0.8% 0.5% Sales of assets (car, bicycle ) 0.7% 2.1% 0.0% Sale of non- food assistance 0.2% 0.0% 0.0% Savings 1.6% 1.6% 3.5% Skilled work 5.2% 3.1% 4.5% Agricultural waged labour 0.5% 1.3% 0.8% Begging 0.2% 0.0% 0.0% Cash from charitable organizations 0.0% 1.8% C 0.1% Cash from humanitarian organizations 0.5% 2.1% C 0.4% Food voucher 7% B 3% 4% Formal commerce 0.2% 0.0% 0.0% Formal credits/ debts 1.9% 1.8% 1.5% Gifts from family /relatives 3.3% 1.3% 3.6% Informal commerce 0.5% 0.0% 0.0% Informal credits debts (shops ) 13% 19% 22% A Non applicable 68% C 62% 56% Non- agricultural casual labour 2% 3% 4% Other 0.0% 0.8% 4.4% B Remittances 0.7% 0.8% 0.8% Sale of crops 0.0% 0.0% 0.1% Sale of food aid 0.0% 0.0% 0.4% Sales of assets (car, bicycle ) 0.7% 0.3% 0.8% Sale of non- food assistance 0.0% 0.3% 0.0% Savings 1.2% 2.1% 0.9% Skilled work 0.9% 0.8% 1.2% Agricultural waged labour 8% 9% 11% Cash from charitable organizations 0.2% 0.0% 0.0% Food voucher 0.2% 0.0% 0.0% Formal commerce 8% 11% 8% Formal credits/ debts 0.0% 0.3% 0.0% Gifts from family /relatives 1.6% 1.6% 1.3% Informal commerce 3.5% 2.9% 3.9% Informal credits debts (shops, etc.) 0.0% 0.0% 0.9% Non applicable 1.6% 1.6% 0.5% Non- agricultural casual labour) 29% 30% 26% Other 2.6% 1.0% 1.5% Remittances 3.3% C 1.3% C 0.1% Sale of crops 8% 9% 11% Sale of livestock and animal produce 0.9% 2.6% 3.7% A Sale of food aid 0.2% 0.0% 0.0% Sales of assets (car, bicycle ) 0.2% 0.0% 0.3% 131
133 Remittances 3.3% 1.3% 0.1% Sale of crops 8% 9% 11% Sale of livestock and animal produce 0.9% 2.6% 3.7% A Sale of food aid 0.2% 0.0% 0.0% Sales of assets (car, bicycle ) 0.2% 0.0% 0.3% Savings 0.2% 0.0% 0.1% Skilled work 33% 30% 32% Second Agricultural waged labour 2% 3% 3% livelihood Cash from charitable organizations 0.0% 0.0% 0.1% source in Syria Food voucher 0.0% 0.0% 0.5% Formal commerce 1.9% 3.7% 2.4% Formal credits/ debts 0.5% 1.3% 1.3% Gifts from family /relatives 1.9% 1.8% 3.3% Informal commerce 0.9% 0.5% 1.9% Informal credits debts (shops, etc.) 3.8% 4.2% 5.7% Non applicable 67% C 64% C 44% Non- agricultural casual labour 6% 4% 7% Other 0.5% 1.3% 4.8% A B Remittances 0.7% 0.3% 0.3% Sale of crops 4% 4% 5% Sale of livestock and animal produce 2% 3% 3% Sale of food aid 0.0% 0.3% 0.0% Sales of assets (car, bicycle...) 0.7% 0.3% 0.1% Savings 4% 2% 9% A B Skilled work 5% 6% 7% Third Agricultural waged labour 0.2% 0.8% 0.8% livelihood Begging 0.0% 0.0% 0.4% source in Syria Cash from charitable organizations 0.0% 0.3% 0.0% Food voucher 0.0% 0.0% 0.1% Formal commerce 0.0% 0.0% 0.7% Formal credits/ debts 0.0% 0.0% 0.8% Gifts from family /relatives 1.2% 1.6% 1.3% Informal commerce 0.5% 0.0% 0.7% Informal credits debts (shops, etc.) 4% 7% 7% A Non applicable 91% B C 82% C 69% Non- agricultural casual labour 1.4% 0.5% 2.4% Other 0.2% 1.6% 5.1% A B Remittances 0.0% 0.0% 0.3% Sale of crops 0.5% 0.5% 1.9% Sale of livestock and animal produce 0% 0.5% 1.3% savings 0.9% 2.1% 6.0% A B Skilled work 0.7% 2.9% 2.0% Table AV 9: Livelihood by demographic profile. Expenditure Households living in areas where the Syrian refugee population was relatively larger, compared to Lebanese residents, were more likely to be below the poverty line (US$3.84). 132
134 Monthly Expenditures Per HH Monthly Expenditures Per Capita Share Food expenditure 4 categories Minimum Expenditures Basket categories Total daily expenditure per capita Low Medium High Food Health Education Rent B C Water Alcohol 32.6 C 29.2 C 22.5 Soap and Hygiene items 27.7 C Electricity Clothes Telecommunication 23.2 B C Assets Rest Total Expenditures C Food 61.0 C 58.7 C 50.3 Rent 41.0 B C Water 3.1 C Tobacco/alcohol 7.0 C 5.5 C 3.6 Hygiene 5.7 B C 4.8 C 3.9 Fuel A Transport 6.2 B C Electricity 4.0 C Telecom 5.1 B C 3.7 C 2.7 HH assets Others Health Education 1.7 C Clothing Total B C C <50 Low 72% C 66% 62% Medium 19% 25% 24% High 4% 7% 8% A >75 Very high 5% 3% 6% B 125% MEB ( 132$) 47% C 40% C 31% MEB- 125% MEB (106-18% 21% 18% 131$) SMEB- MEB (88-105$) 12% 14% 14% < SMEB (88$) 23% 26% 37% A B Above poverty line % C 54% C 42% Below poverty line < % 46% 58% A B Table AV 10: Expenditures by demographic profile. Food consumption and food security Households living in areas where the Syrian refugee population was relatively small, compared to Lebanese residents, were more likely to be food secure, had a more diverse diet and were more likely to have an acceptable Food Consumption Scores. Food Consumption Score categories (28/42) Food Consumption 4 scale classification Low (A) Medium (B) High (C) Poor food consumption ( 28) 3% 2% 4% Border line food consumption (29-42) 8% 8% 11% Acceptable food consumption (>42) 89% 90% 85% Acceptable 43% C 37% C 26% Acceptable with coping strategies 46% 53% 59% A Borderline 8% 8% 11% Poor 3% 2% 4% Mild food insecurity 57% 66% 66% Moderate food insecurity 10% 9% 17% A B Severe food insecurity 0.5% 0.3% 0.5% 133
135 Poor 3% 2% 4% Food security Food secure 32% C 24% C 17% classification- categories Mild food insecurity 57% 66% 66% Moderate food insecurity 10% 9% 17% A B Severe food insecurity 0.5% 0.3% 0.5% Household Weekly Diet 2 food groups 0.7% 0.0% 0.4% Diversity- 5 categories 3-4 food groups 0.7% 0.8% 1.3% 5-6 food groups 3.5% 2.6% 3.6% 7-8 food groups 32.5% 26.8% 35.2% B 9 food groups 62.5% 69.8% C 59.5% Household Daily 2.5 food groups 0.0% 0.0% 0.1% Average Diet Diversity food groups 0.7% 1.0% 1.1% 5 categories food groups 3% 2% 3% food groups 20% 20% 24% 6.5 food groups 76% 77% 71% Household Daily Average Diet Diversity C 6.7 Household Weekly Average Diet Diversity Consumption in Cereals previous week Bread & pasta 7 7 A 7 Tubers Pulses A Green leaves vegetables 1 A B Vitamin A rich vegetables Other vegetables 5 6 A C 5 Vitamin A rich fruits Other fruits 1 C 1 C Organ meat A C Flesh meat 1 C 1 1 Eggs 4 C 4 C 3 Fish/Seafood B Sugary products Dairy products 5 C 5 C 4 Fats/oil 6 7 A 7 A Condiments A Number of meals eaten yesterday by adults 2.2 C Number of meals eaten yesterday by children under 5 3 B C 2.6 C 2.3 Child eat or drink a day before Cereals 63% 63% 56% Pulses 23% B 11% 17% Dairy products 59% 54% 52% Meat Fish 7% 5% 7% Eggs 29% 28% 29% Vitamin A rich vegetables and fruits 8% 10% 11% Other vegetables and fruits 21% 27% 21% Breastfeeding a day before 51% 53% 51% Complementary Feeding 74% B C 60% 62% Meal Frequency 72% B C 86% 84% Diet Diversity 23% 17% 17% Minimum Acceptable Diet 91% B C 98% 97% Table AV 11: Food consumption and food security by demographic profile. Coping strategies Households living in areas where the Syrian refugee population was relatively larger, compared to Lebanese residents, were somewhat more likely to experience a lack of food or money to buy food and had somewhat higher levels of debt. 134
136 During the last 30 days, % HH experienced a lack of food or money to buy food HH adopt strategies of consumption reduction Summary of asset depletion coping strategies (CS) During last 7 days before the survey % HH Low (A) Medium (B) High (C) 60% 65% 75% A B 75% 84% A 89% A HH not adopting CS 17% C 15% C 8% Stress CS 56% 61% 57% Crisis CS 16% 18% 26% A B Emergencies CS 11% B 6% 9% Relied on less preferred food. 84% 88% 92% A Borrowed food or relied on help 36% 38% 41% from friends. Reduced the number of meals 59% 63% 62% per day Spent days without eating. 10% 8% 7% Restrict consumption by adults in 34% 41% 46% A order for children. Sent members to eat elsewhere. 9% 9% 11% Reduced portion size of meals. 63% 66% 68% Restrict consumption of female. 7% B 3% 7% B During the past Selling household goods (furniture, etc.). 19% 19% 17% 30 days Sell productive assets or means of 2% 3% 4% before the transport (car ) survey % Reduce essential non-food expenditures (education ) 31% 27% 38% B HH Spent savings. 17% 15% 24% A B Bought food on credit or borrowed 35% 39% 51% A B money to purchase food. Sold house or land. 2% 1% 1% Withdrew children from school. 16% 12% 17% Have school children involved in 12% B 5% 9% income generation. Marriage of children under % 0.8% 1.4% Accept high risk, illegal, socially 4.4% 3.6% 1.8% degrading or exploitative temporary jobs (e.g. theft, survival sex, etc.). Sent an adult household member 7.1% 5.6% 4.3% to seek work elsewhere. Begged. 4.4% C 1.2% 1.1% HHs borrow money in the past 3 months 78% 79% 86% A B Total amount of debt $
137 Primary reason for borrowing Source of borrowing Total amount of debt categories Documentation / legal state fees 2.4% C 1.8% 0.5% To pay education 1.6% 1.0% 0.8% To buy food 58% 52% 66% A B To pay health care 25% 22% 31% B For income generating activities/ 0.0% 0.0% 0.4% investment To buy/ rent house 44% 39% 43% To pay social event 0.0% 0.5% 0.1% For transport 2.6% 1.8% 2.5% To purchase water 60% B C 51% C 42% Others 2.1% 2.1% 1.7% Bank / formal institution 0.2% 0.3% 0.0% Friends/relatives in Lebanon 71% 73% 78% A Friends/relatives out of Lebanon 4% 4% 6% Informal saving group 0.0% 0.0% 0.1% Local associations / Charity 0.0% 0.0% 0.1% Money lender 0.2% 2.4% A 1.3% Others 4.0% B 1.0% 3.9% B No debt 22% C 22% C 15% 200$ 26% 21% 21% $ 29% 32% 32% 601$ 23% 25% 32% A Table AV 12: Coping strategies by demographic profile. ANNEX VI: PROFILE BY SHELTER TYPE Households were residing in a range of shelter types, the type of shelter may serve as a proxy to other characteristics about a household, such as food security, expenditure or health. Results identified which factors or indicators were directly or indirectly associated with shelter type. The distribution of types of shelters that Syrian refugee households lived in differed across regions. Households living in independent houses were highest in Beirut-Mount Lebanon, while households living in one room shelters were highest in Akkar and households living in tented settlement was highest in the Bekaa Valley. Values with superscripts are statistically different than the values corresponding to the letter used for the superscript, for example the average household size of eligible households is statistically different from the average household size on ineligible households (see Table V). Independent house (A) One room (B) Tented settlements (C) Sub- standard shelters (D) Akkar 15% 30% A 27% A 23% Bekaa 14% 18% 56% A B D 16% BML 25% D 27% D 0% 9% South 23% B C 12% 8% 27% B C T5 22% B C 13% 9% 27% B C Table AVI 1: Types of shelter by region. 136
138 Demographics Households living in independent houses/apartments had an average household size of 7.2, significantly higher than households living in one room or sub-standard shelters. As for individuals, households living in independent houses had on average 3.3 adults (18-59 years old) per household, significantly more than households living in other shelter types. While households living in tented settlements and independent houses had on average 2.2 and 2.1 children per household, significantly more than households living in one room shelters. Households living in tented settlements had an average dependency ratio of 1.8, significantly higher than households living in other shelter types. Households living in one room structures, had a significantly higher percentage of households with a dependency ratio less than 1 (55%) compared to households living in tented settlements (40%). Households living in tented settlements had significantly more households headed by women (25%), and households headed by single guardians with dependents (17%) compared to households living in independent houses and sub-standard shelters. There were no significant differences regarding household members with presence of specific needs, although the presence of a person with a specific need was more common in households living in independent houses, where 51% of households had at least one person with specific needs and the least common in households living in tented settlements (42%). Independent house (A) One room (B) Tented settlements (C) Sub- standard shelters (D) Average Household size 7.2 B D B 6.1 B 0-2 years years years 2.05 B B years 0.30 B years 3.29 B C D B Above 60 years 0.29 D Average Dependency ratio A B D 1.31 Sex Ratio Household size categories Dependency ratio categories Households headed by a single guardian with dependents Household headed by women Households headed by children (under 18) Presence of unaccompanied children Presence of individual with a specific needs Presence of pregnant or lactating women Presence of individual with a Disability Presence of individual with a Chronic illness Presence of individual with a temporary illness % 49% A C D 33% 32% % 29% 29% 31% % B 15% 21% 23% 10 21% B 6% 17% B 13% 1 48% 55% C 40% 50% % 13% 16% 20% % 16% 15% 13% % 16% 30% A B D 17% 6% 12% A 17% A D 6% 15% 20% 25% A D 13% 1% 1% 1% 1% 3% 1% 0% 2% 51% 48% 42% 47% 33% 37% 37% 38% 13% 6% 12% 14% 46% 38% 35% 39% 11% 11% 11% 12% 137
139 a temporary illness Presence of individual with a serious medical condition Presence of individual with other specific needs Table AVI 2: Demographics by shelter type. 6% 5% 6% 6% 3% 2% 2% 2% Arrival profile The majority of households living in one room structures (71%) and tented settlements (67%) arrived together to Lebanon; significantly more than households living in independent houses. The majority of households had arrived between 1 to 2 years before the assessment, with no significant differences recorded among households in different shelter types. As for households that have arrived between 7 12 months before the assessment, households living in tented settlements were significantly higher compared to households living in independent houses. In the majority of households all members were registered, though no significant differences were recorded. Of the households that had at least one member not registered, households living in tented settlement had the highest percentage of households not willing to register (33%), while no significant differences were recorded. Of those households that had at least one non-registered members, households living in sub-standard shelters had the highest percentage of individuals willing to register. All household members having residential permits was most common for households living in independent houses and one room shelters (both at 59%). Independent house (A) One room (B) Tented settlements (C) Sub- standard shelters (D) HH arrived together 53% 71% A D 67% A 55% HH arrived Less than 1 month 0% 0% 0% 1% together 1 3 months 4% 2% 9% 2% arrival 4 6 months 7% 8% 7% 8% time 7 12 months ago 13% 19% 25% A 17% 1 2 years ago 55% 48% 44% 52% 2 3 years ago 18% 23% 14% 18% Before crisis started in Syria 2% 0% 1% 2% HH arrived separately, arrival time of first member HH arrived separately, arrival time of last member Less than 1 month 0.4% 0% 0% 0% 1 3 months 2% 1% 4% 1% 4 6 months 4% 5% 7% 5% 7 12 months ago 11% 15% 7% 13% 1 2 years ago 42% 44% 41% 51% 2 3 years ago 29% 23% 34% 23% Before crisis started in Syria 12% 11% 6% 7% Less than 1 month 8% 5% 9% 5% 1 3 months 14% 15% 17% 14% 4 6 months 14% 15% 13% 14% 7 12 months ago 20% 27% 23% 26% 1 2 years ago 34% 27% 31% 38% 2 3 years ago 10% 10% 7% 4% Before crisis started in Syria 0.2% 1% 0% 0% % HH all members registered 91% 94% 97% 94% Willing to register 13% 6% 0% 36% Not willing to register 13% 6% 33% 0% All HH members have permits 59% C 59% 47% 53% Children under 3 with birth certificates 90% 87% 91% 89% Table AVI 3: Arrival profile by shelter type. 138
140 Shelter Households relying on shelters provided by employers were significantly higher among households living in one room structures (9%), tented settlements (12%), and sub-standard housing (18%) in comparison to households living in independent houses. Households living in furnished rentals were significantly more common in households living in independent houses than any other shelter type. Meanwhile, households with more than 10.5m2/person and 1-2 people/room respectively were significantly more common among households living in independent houses in comparison to other shelter types. Households living in independent households also paid a significantly higher rent (US$230), on average. Independent house (A) One room (B) Tented settlements (C) Sub- standard shelters (D) Type of Assistance 0.1% 0% 0% 0% Occupancy Assistance (charity) 2% 8% A 16% A 8% A Furnished Rental 20% B C D 9% C 1% 5% Hosted for free 5% 10% A 4% 5% Other 0.3% 0% 1% 1% Owned Apartment 0.2% 0.4% 0.5% 0% Provided by employer 3% 9% A 12% A 18% A Squatting 0% 0% 0.5% 0% Unfurnished rental 69% 64% 65% 63% Density >10.5 m2/person 43% B C D 14% 11% 17% m2/person 20% 17% 19% 26% m2/person 27% 37% A 39% A 32% 3.5 m2/person 10% 32% A 31% A 25% A Crowding Index Number of rooms 1-2 person/room 43% B C D 26% 28% 28% 3-5 person/room 46% 51% 50% 50% 6-7 person/room 7% 16% A 12% 13% 8 person/room 4% 8% 9% A 10% A 4 rooms 25% B C D 4% 5% 4% 3 rooms 28% B C D 9% 10% 10% 2 rooms 30% B 15% 41% B 37% B 1 room 16% 72% A C D 44% A 50% A Average rent 230 B C D 139 C C Average living space 72 B C D Average number of rooms 7 B C D 5 6 B 6 Average Density 13 B C D Table AVI 4: Shelter by shelter type. WASH Households in independent houses (93%) and one room structures (93%) had significantly more access to bathrooms in comparison to households living in tented settlements (79%). One quarter (26%) of households living in tented settlements were sharing latrines with 15 or more people, significantly higher than households living in other types of shelter. Households living in tented settlements were using traditional pit latrines significantly more than other households, while households living in independent houses used flush toilets significantly more than other households. Households living in tented settlements also used protected wells for drinking water significantly more than households living in other shelter types and while households living in independent houses relied on municipal water for their cooking needs significantly more. More households living in independent houses (88%) had water storage capacity than households living in other shelter types. The treatment of water was more common among households living in tented settlements (12%). The most common treatment method among households living in independent houses was the traditional method, households living in one room structures and sub-standard shelters mainly used chlorine products (33% and 58% respectively), while households living in tented settlements mainly (48%) them used ceramic filters. There was no significant differences among households in different shelter types. Households that lived in independent houses (72%) had significantly more access to water compared to households living in tented settlements (53%). Households living in independent houses also had significantly higher percentages using at least 35L/person/day compared to households living in one room structures and tented settlements. 139
141 Households living in tented settlements resorted to burning their rubbish (21%) and throwing in fields (17%) significantly more than households living in other types of shelters. Independent house (A) One room (B) Tented settlements (C) Sub- standard shelters (D) Access to bathrooms 93% C D 93% C 79% 84% Sharing latrines with 15 people or more 6% 7% 26% A B D 6% Latrine Flush toilet 45% B C D 23% C 3% 22% C Type Improved Latrines 37% C 39% C 22% 32% Open Air 0.2% 1% 14% A B D 4% A Traditional pit 17% 38% A 61% A B D 42% A Drinking water Cooking water 140 Borehole 0.2% 0.4% 1% 0% Bottled water 36% C 30% C 17% 27% Household water < 2hrs 13% C 12% C 4% 9% Household water > 2 hrs 24% C 16% C 6% 20% C Other 1% 3% 6% A 4% Protected spring 4% 7% 1% 4% Protected well 9% 12% 33% A B D 14% Public reservoir 2% 3% 2% 2% Public standpipe 4% 4% 8% 8% UN water 0% 1% 7% A D 0% Unprotected spring 3% 5% 3% 3% Unprotected well 1% 2% 7% A 3% Water provider 3% 6% 6% 5% Borehole 1% 1% 2% 1% Bottled water 4% 6% C 0% 1% Household water < 2hrs 18% C 16% C 5% 15% C Household water > 2 hrs 45% B C 30% C 8% 35% C Other 1% 2% 5% A 3% Protected spring 2% 4% 1% 3% Protected well 11% 15% 43% A B D 14% Public reservoir 2% 4% 1% 3% Public standpipe 3% 4% 8% A 6% UN water 1% 2% 7% A D 1% Unprotected spring 1% 3% 3% 4% Unprotected well 2% 3% 11% A B 5% Water provider 8% 11% 5% 9% Water Storage 88% B C D 79% 68% 77% Treating water 5% 2% 12% A B 5% Treatment Ceramic filters 22% 0% 48% 33% method Chlorine products 26% 33% 32% 58% Don t know 4% 17% 4% 0% Other 15% 33% 8% 0% Traditional method 33% 17% 8% 8% Sufficient access to water 72% C 64% 52% 66% 35L/person/day 72% B C 59% 47% 62% Sufficient access to hygiene items 63% 56% 54% 52% Main Burning 2% 5% 21% A B D 8% A disposal Dumpster barrels 82% C 79% C 58% 80% C Municipality 14% C 11% C 3% 8% Others 0.4% 0% 0.5% 0% Rubbish pit 0.5% 2% 0.5% 0% Throw into field 1% 3% 17% A B D 5% A Table AVI 5: WASH by shelter type.
142 Assets and services Households living in independent houses had significantly more access to tables, sofas, refrigerators, washing machines, TVs, and satellites compared to households living in other types of shelters. While households living in tented settlements and independent houses had significantly more access to winter clothes compared to sub-standard shelters. Households living in independent houses also had significantly more access to beds than households living in tented settlements or sub-standard shelter. Households with access to all basic assets (mattresses, blankets, winter clothes, and gas stoves) were significantly more common amongst households living in independent houses than households living in sub-standard shelters. Households living in independent houses and one room structures were used gas for cooking significantly more than households living in tented settlements and sub-standard shelters, which used wood and charcoal more often. The main lighting source was electricity however households in tented settlements relied on candles significantly more than households in independent houses and one room structures. Independent house (A) One room (B) Tented settlements (C) Sub- standard shelters (D) Assets Mattress 73% D 68% 76% D 60% ownership Beds 29% C D 20% 11% 18% Blankets 75% B D 65% 78% B D 63% Winter clothes 59% D 52% 57% D 42% Table 32% B C D 10% 4% 12% Sofa 43% B C D 17% C 3% 14% C Stove 69% B D 55% 66% 58% Fridge 72% B C D 48% C 17% 47% C Washing machine 59% B C D 32% C 14% 35% C Electric oven 4% 3% 0.5% 2% Microwave 3% 1% 0% 0.4% Dishwasher 1% 0.4% 0% 0% Central heating 1% 1% 0% 1% Air conditioning 3% 1% 0% 1% Sewing machine 8% C D 3% 1% 1% TVs 88% B C D 76% C 60% 75% C DVDs 3% 1% 1% 1% Computers 3% 0% 0% 1% Satellite 78% B C D 66% 57% 65% Motorcycle 7% 5% 10% 8% Car 4% 1% 0% 2% Basic Assets 92% D 86% 92% 84% Cooking fuel Electricity 0.5% 0% 0% 1% Gas 98% C D 98% C D 83% 88% Other 0.1% 0% 0% 0.4% Paraffin 0% 0% 0% 0.4% Wood or charcoal 1% 2% 17% A B 10% A B Access to fuel 79% C D 72% 65% 65% Main lighting Candles 0.5% 1% 7% A B 3% Electricity 99% C D 99% C 90% 97% Gas 0.2% 0% 1% 0% Other 0.1% 0% 1% A 1% Main disposal Burning 2% 5% 21% 8% Dumpster barrels 82% 79% 58% 80% Municipality 14% 11% 3% 8% Others 0.4% 0% 0.5% 0% Rubbish pit 0.5% 2% 0.5% 0% Throw into field 1% 3% 17% 5% Table AVI 6: Assets and services by shelter type. 141
143 Education Household heads and spouses/caretakers were more educated in independent houses compared to tented settlements. Children not attending school was significantly more common in households living in tented settlements (72%) and households living in independent houses (67%) than households living in one room structures (53%). Children that had not attended school in more than one year were most common in households living in independent households (46%); significantly more than households living in one room structures (33%). Although 24% of children in households living in independent houses, significantly more than households living in one room (15%) structures and tented settlements (12%), moved to the next grade. As for non-formal education, no significant differences were recorded among households. Independent house (A) One room (B) Tented settlements (C) Sub- standard shelters (D) Households head Intermediate school 33% C 28% 17% 27% education None 9% 13% 30% A B D 14% Primary school 39% 38% 42% 45% Read and write 3% 7% 6% 2% Secondary school 9% 8% 3% 8% Technical course 2% 3% 0.5% 2% University 5% 3% 1% 2% Spouse/caretaker Intermediate school 28% C 23% C 11% 30% C education n/a 5% 9% 5% 6% None 14% 17% 40% A B D 16% Not applicable 0.1% 0% 0% 0% Primary school 35% 33% 35% 37% Read and write 3% 5% 4% 2% Secondary school 10% 9% 4% 6% Technical course 2% 1% 0.5% 2% University 3% 3% 0% 2% Children not attending school 67% B 53% 72% B 65% Children going to school 45% B C 33% 25% 37% Children attending school and moved to the next 24% B C 15% 12% 18% grade Children attending non- formal education 7% 4% 6% 6% Children not attending school in more than 1 46% B 33% 43% 42% year Average number of school aged children 3 B 2 3 B 2 Table AVI 7: Education by shelter type. Health There were no significant differences among shelter types regarding households access to necessary primary and secondary healthcare, the type of healthcare received or the reasons for not receiving health assistance. Households living in one room structures more often had sick children (75% of households). Households living in sub-standard shelters and on room shelters had significantly more children suffering from diarrhoea compared to households living in independent houses. There were no significant differences among other sicknesses, although households living in sub-standard shelters had a higher percentage of children suffering from diarrhoea and coughing. Independent house (A) One room (B) Tented settlements (C) Sub- standard shelters (D) No access to primary health assistance 23% 27% 32% 30% No access to secondary health assistance 25% 27% 22% 34% Primary Free health care 20% 23% 19% 23% Health Cost sharing/partial benefits 42% 46% 44% 41% assistance Don t know 2% 4% 2% 2% 142
144 assistance Secondary Health Assistance HH pays all related costs 31% 24% 28% 28% Insurance 0% 0% 0% 0% HH received contribution 1% 0% 0% 2% Not needed 3% 4% 5% 4% Other 1% 0% 3% 1% Free health care 9% 9% 8% 7% Cost sharing/partial benefits 33% 35% 45% 37% Don t know 5% 7% 4% 6% HH pays all related costs 34% 28% 23% 29% Insurance 0% 0% 0% 1% HH received contribution 2% 1% 0% 0% Not needed 15% 16% 14% 16% Other 3% 3% 6% 4% Cost of drugs/treatment 65% 47% 50% 40% Distance of health centre/ transportation costs 8% 7% 8% 13% Don t know where to go 21% 27% 17% 13% Can t afford doctors fees 50% 27% 67% 47% Inadequate welcoming/treatment by health 8% 13% 0% 27% centre staff Other 2% 7% 0% 0% Pending Appointment 0% 0% 0% 0% Physical limitations to access the health centre 0% 7% 8% 7% Rejected 13% 27% 8% 33% Child age groups 6-11m 15% 20% 14% 19% 12-17m 13% 12% 15% 15% 18-23m 13% 13% 13% 13% 24-35m 20% 22% 20% 19% 36-59m 39% 34% 38% 34% Children s sickness Diarrhoea 31% 43% A 41% 46% A Cough 45% 49% 49% 52% Fever 50% 54% 56% 57% Other 15% 16% 10% 11% Sickness 67% 75% 68% 71% Table AVI 8: Education by health type. Security Households living in sub-standard shelters had the highest percentage of people that felt insecure, though there were no significant differences between households in other shelter types. The main type of insecurity experienced by all households was harassment, while households in one room structures experienced more insecurity due to community violence and extortion (17%). The main cause of insecurity for all households was neighbours. The second most common cause for households living in sub-standard shelters were local authorities and organizations, as for households living in tented settlements, the second most common causes were hosts and refugee organizations (13%). Households living in one room structures had the highest percentage of households that have experienced a reduction in movement due to insecurity, although there was no significant differences. Households that experienced some kind of insecurity Type of insecurity Independent One room Tented Sub- standard house (A) (B) settlements (C) shelters (D) 12% 13% 10% 15% Community Violence 7% 17% 9% 3% Cross shelling 3% 11% 0% 0% Extortion 5% 17% 14% 9% Forced displacement 4% 0% 9% 3% Harassment 73% 54% 59% 74% 143
145 Cause of insecurity Harassment at check points 12% 9% 5% 17% Theft 3% 6% 14% 11% Kidnapping 2% 6% 0% 0% Arbitrary 3% 6% 0% 0% Armed groups 11% 9% 9% 0% Clashes 2% 9% 0% 0% Hosts 8% 9% 14% 9% Local authorities 7% 9% 0% 17% Local organizations 7% 9% 0% 17% Neighbours 45% 46% 41% 54% Police/army 10% 11% 0% 0% Refugee organization 2% 0% 14% 0% Shop owners 10% 9% 5% 11% Movement restriction due to insecurity 67% 74% 68% 71% Table AVI 9: Security by shelter type. Livelihood sources Five or more dependents per working member were significantly more common among households living in independent apartments compared to households living in one room structures, although households living in one room structures had significantly more unemployed members than households living in independent apartments. The majority (60%) of households living in tented settlements relied upon food vouchers as their primary source of income, significantly more than households living in other types of shelters. Households living in independent houses had significantly more members relying on non-agricultural labour than households living in one room apartments and sub-standard housing. Households living in independents houses and tented settlements were significantly more likely to have a second source of income, compared to households living in one room structures and sub-standard shelters. Households living in independent houses, tented settlement and sub-standard shelters relied significantly more on non-agricultural labour as a second source of income compared to households living in one room structures. Households living in tented settlements were significantly more likely to have a third income sources than all other shelter types (54%) and they mainly relied on informal debts (30%). The most common primary income source, when households were in Syria, of households living in tented settlements was selling crops (24%), significantly more than all other households. Working members Working members First livelihood source Independent house (A) One room (B) Tented settlements (C) Sub- standard shelters (D) No working members 24% 37% A 31% 29% 5 dependents or more per working 35% B 19% 27% 26% member 3-4 dependents per working member 27% 21% 24% 25% 2 dependents per working member 14% 24% A 18% 20% 0 24% 37% A 31% 29% 1 53% 52% 48% 53% 2 23% B 11% 21% 17% Agricultural labour 3% 1% 13% A B D 3% Begging 0.1% 0% 0.5% 0% Cash (charity) 0.1% 0% 0% 0% Cash (humanitarian) 0.5% 1% 0% 3% A Food voucher 37% 40% 60% A B D 41% Formal commerce 0.1% 1% 0% 0% Formal debts 1% 1% 0% 1% Gifts family 3% 1% 2% 2% Informal commerce 1% 1% 0% 0.4% Informal debts 3% 5% 4% 4% n/a 1% 2% 1% 5% A 144
146 Second livelihood source Third livelihood source n/a 1% 2% 1% 5% Non- agricultural labour 33% B C 23% 14% 28% C Other 0.5% 0% 0.5% 0.4% Remittances 0.4% 1% 0.5% 0% Sale crops 0.2% 0% 0% 0% Sale livestock 0% 0% 0.5% 0% Sale of aid 0.2% 0% 0% 0.4% Sale of car 0.3% 0.4% 0% 0.4% Savings 2% 2% 1% 0.4% Skilled work 13% C 20% C 3% 11% C Agricultural labour 1% 3% 13% A B 5% A Begging 0.1% 0% 0% 1% Cash (charity) 0% 0.4% 0% 0.4% Cash (humanitarian) 2% 1% 1% 2% Food voucher 19% C 15% 8% 14% Formal commerce 0.4% 0% 0% 0% Formal debts 3% 6% 1% 2% Gifts family 5% 7% 6% 5% Informal commerce 1% 1% 0.5% 0% Informal credit 0.2% 0% 0% 0% Informal debts 16% 19% 24% 13% n/a 22% 29% C 14% 29% C Non- agricultural labour 19% B 11% 23% B 21% B Other 1% 1% 2% 0% Remittances 1% 0% 0% 0% Sale crops 0% 0% 1% 0% Sale livestock 0% 0% 0.5% 0% Sale of aid 1% 0% 0.5% 0.4% Sale of car 1% 0.4% 0% 0.4% Sale of non food food 0.1% 0% 0% 0% Savings 3% 3% 1% 0.4% Skilled work 5% 5% 3% 5% Agricultural labour 0% 1% 3% A 1% Begging 0% 0% 0.5% 0.4% Cash (charity) 1% 1% 0% 0% Cash (humanitarian) 1% 1% 0.5% 0.4% Food voucher 5% 7% 4% 4% Formal commerce 0.1% 0% 0% 0% Formal debts 2% 1% 0.5% 4% Gifts family 2% 2% 5% 3% Informal commerce 0.1% 0.4% 0% 0% Informal debts 17% 17% 30% A B D 16% n/a 63% C 64% C 46% 66% C Non- agricultural labour 4% 1% 4% 1% Other 2% 3% 4% 1% Remittances 1% 0% 0% 0.4% Sale crops 0% 0% 0% 0% Sale of aid 0% 0% 0.5% 0% Sale of car 1% 0% 0.5% 0% sale of non food food 0.1% 0% 0% 0% Savings 1% 1% 1% 0.4% Skilled work 1% 1% 0.5% 2% First Agricultural labour 7% 9% 20% A B 10% 145
147 First livelihood source in Syria Second livelihood source in Syria Third livelihood source in 146 Agricultural labour 7% 9% 20% A B 10% Cash (charity) 0.1% 0% 0% 0% Food voucher 0% 0.4% 0% 0% Formal commerce 9% C 9% 2% 10% C Formal debts 0.1% 0% 0% 0% Gifts family 1% 1% 2% 3% Informal commerce 4% 3% 3% 1% Informal debts 1% 1% 0% 0% n/a 1% 3% 0.5% 1% Non- agricultural labour 29% 21% 23% 32% Other 2% 1% 1% 1% Remittances 2% 0% 0.5% 2% Sale crops 8% 8% 24% A B D 10% Sale livestock 2% 4% 7% A 2% Sale of aid 0.1% 0% 0% 0% Sale of car 0.1% 0% 0% 0% Savings 0.1% 0.4% 0% 0% Skilled work 34% C 40% C 17% 27% Agricultural labour 2% 1% 9% A B 3% Cash (charity) 0% 0% 0.5% 0% Food voucher 0.1% 0.4% 0.5% 0.4% Formal commerce 3% 1% 1% 2% Formal debts 1% 1% 0.5% 2% Gifts family 2% 3% 4% 2% Informal commerce 1% 0.4% 2% 0.4% Informal debts 4% 7% 7% 4% n/a 58% C 55% C 35% 62% C Non- agricultural labour 6% 5% 9% 4% Other 3% 3% 5% 2% Remittances 0.4% 0.4% 0% 0.4% Sale crops 3% 7% 8% 3% Sale livestock 3% 3% 7% 3% Sale of aid 0.1% 0% 0% 0% Sale of car 0.3% 0% 0% 1% Savings 6% 7% 8% 4% Skilled work 7% 6% 4% 7% Agricultural labour 0.3% 1% 2% A 1% Begging 0% 0.4% 0.5% 0.4% Cash (charity) 0.1% 0% 0% 0% Syria Food voucher 0% 0.4% 0% 0% Formal commerce 1% 0.4% 0% 0% Formal debts 0.2% 1% 0.5% 0.4% Gifts family 1% 3% 1% 2% Informal commerce 1% 0.4% 0.5% 0% Informal debts 4% 5% 14% A B 7% n/a 83% C 77% C 61% 83% C Non- agricultural labour 2% 1% 3% 1% Other 3% 3% 4% 1% Remittances 0.1% 0.4% 0% 0% Sale crops 1% 2% 3% 0% Sale livestock 1% 0% 2% 1% Savings 3% 3% 6% 1% Skilled work 2% 3% 1% 1% Table AVI 10: Livelihood sources by shelter type.
148 Expenditure The total expenditure of households living in independent houses ($860) was significantly higher than other households and they paid significantly more on food, rent, water and electricity than all other households. Households living in one room structures and sub-standard shelters were also paying significantly more rent than households in tented settlements. No significant differences were recorded among households for health, education, clothing, assets and other expenses. Households living in one room shelters spent significantly more on food per capita ($64) compared to households living in independent apartments ($55) and tented settlements ($50). Households living in independent houses and one room structures spent significantly more on rent per capita ($41 and $34 respectively) than households living in tented settlements and sub-standard shelters. Households living in independent apartments and one room shelters spent significantly more per person on telecoms and transportation than households living in tented settlements. Households that spent less than 50% of their expenditure on food were significantly more common amongst households that live in independent houses and households that spent more than 75% of their expenditure on food were significantly most common amongst households living in tented settlements and one room structures. Households living below the poverty line ($3.84 per person per day) were significantly higher in households living in tented settlements (73%) compared to households living in independent houses (44%) and one room structures (48%). Household expenditure per month (US$) Expenditure per capita per month (US$) Independent house (A) One room (B) Tented settlements (C) Sub- standard shelters (D) Food 350 B C D Health Education Rent 237 B C D 120 C C Water 16 B C D Alcohol and tobacco 30 B Soap 28 B C Fuel 24 B Transport 28 C D Electricity 24 B C D Clothing Telecom 21 B C Assets Other Total 860V Food A C Rent 41 C D 34 C D 9 22 C Water Tobacco/alcohol Hygiene 5 5 C 4 5 Fuel 4 5 A 4 4 Transport 5 C 5 C 2 4 Electricity 4 C D Telecom 4 C 4 C 2 4 HH assets Others Health Education Clothing Total 142 C 151 C D C 147
149 Total Food < 50% 76% B C D 62% C 34% 59% C Expenditure 50-65% 18% 22% 37% A B 27% A groups 65-75% 3% 9% A 15% A 8% A 75% 2% 8% A 14% A 6% Minimum 125% MEB ( US$132) 43% C D 41% C 18% 31% Expenditures MEB- 125% MEB (US$ ) 20% 19% 15% 15% Basket SEB- MEB (US$88-105) 13% 13% 15% 18% categories < SEB (US488) 24% 27% 52% A B D 37% A Below poverty line (< US$3.84/person/day) 44% 48% 73% A B 59% A Table AVI 11: Expenditure by shelter type. Food consumption The adults in households living in tented settlements ate significantly more meals per day, 2.2 on average, than adults in households living in one room structures. However, there were no significant differences among the number of meals that children consumed. Households living in independent houses or apartments consumed vegetables more often (6 days per week) than households living in tents and sub-standard shelters. Households living in tented settlements consumed significantly more fish/sea food compared to households living in one room structures and sub-standard shelters. Whereas households living in independent houses and tents consumed significantly more fats/oil than households living in one room structures. Households living in independent houses or apartments had a significantly higher average daily and weekly diet diversity (7 and 9.5 respectively) compared to all other households. While households with poor food consumption patterns were significantly more common amongst households living in tented settlements compared to those living in independent houses or apartments. There were no significant differences in infant and young child feeding practises, although households living in sub-standard shelters had the highest percentage of children receiving breast milk and semi-solid food and households living in independent houses had the highest percentage of children receiving formula. The majority of children in households living in independent houses had adequate access to milk, significantly higher than children of households living in one room structures. Households living in tented settlements were more likely to meet minimum adequate diet requirements, though the differences were not significant. There were no significant differences in children s consumption of different food groups. Number of days these items were consumed Food Consumption Score 148 Household Daily Average Independent house (A) One room (B) Tented settlements (C) Sub- standard shelters (D) Cereals Bread and Pasta Tubers Pulses Green leaves Vitamin A rich vegetables Other vegetables 6 C D Vitamin A rich fruits Other fruits Organ meat Flesh meat 1 B C Eggs Fish/seafood D 1 B D Sugary products Dairy products Fats/oil 6 B 6 6 B 6 Condiments Poor food consumption 3% 5% 8% A 4% Border line food consumption 9% 8% 11% 12% Acceptable food consumption 88% 87% 81% 84% Acceptable with coping strategies 50% 58% 55% 57% Borderline 9% 8% 11% 11% Poor 3% 4% 7% 3% 2.5 food groups 0.1% 1% 1% 0.4% food groups 1% 1% 2% 1%
150 Score Acceptable food consumption 88% 87% 81% 84% Food Acceptable 39% C 30% 27% 28% Consumption Acceptable with coping strategies 50% 58% 55% 57% four scale Borderline 9% 8% 11% 11% classification Poor 3% 4% 7% 3% Household Daily Average Diet Diversity Household Weekly Diet Diversity Food groups consumed by children 2.5 food groups 0.1% 1% 1% 0.4% food groups 1% 1% 2% 1% food groups 3% 5% 4% 6% food groups 30% 35% 34% 37% 6.5 food groups 67% D 57% 58% 55% 2 food groups 0% 0.4% 0.5% 0% 3-4 food groups 1% 1% 2% 1% 5-6 food groups 2% 3% 7% A 3% 7-8 food groups 19% 24% 27% 25% 9 food groups 78% C 72% 64% 70% Household Daily Average Diet Diversity 6.94 B C D Household Weekly Diet Diversity 9.54 B C D Number of meals yesterday- adults B 2.0 Number of meals yesterday- children under Breast milk 52% 55% 49% 57% Formula 25% 17% 14% 16% Semi solid 64% 62% 67% 69% Milk adequacy 70% B 53% 61% 67% Minimum acceptable diet 5% 1% 8% 0.0% Food groups consumed by children Cereals 58% 57% 60% 61% Pulses 16% 17% 18% 19% Dairy 55% 48% 51% 49% Meat fish 7% 7% 3% 4% Eggs 27% 30% 29% 28% Vitamin A vegetables 9% 9% 13% 9% Non vitamin A veg 22% 18% 16% 23% Cereals 58% 57% 60% 61% Pulses 16% 17% 18% 19% Dairy 55% 48% 51% 49% Meat fish 7% 7% 3% 4% Eggs 27% 30% 29% 28% Vitamin A vegetables 9% 9% 13% 9% Non vitamin A veg 22% 18% 16% 23% Table AVI 12: Food consumption by shelter type. Coping strategies Significantly more households living in tented settlements applied at least one food related coping strategy than households living in independent houses or apartments. Of the households that had experienced a lack of food or money to buy it, 45% of households living in sub-standard shelters reduced essential non-food expenditure, significantly more than households living in independent houses and one room structures. While households living in tented settlements spent savings and withdrew children from education significantly more than households living in one room shelters. Households living in tented settlements and sub-standard shelters were significantly more likely to have a lack of food or money to buy food (76% and 75% respectively) compared to households living in independent houses or apartments (64%). Households living in tented settlements relied on less preferred or less expensive food (95%) and had household members eat elsewhere (20%) significantly more than households living in independents houses and sub-standard shelters. Households living in one room structures borrowed food (46%) and spent days without eating (14%) significantly more than households living in independent houses or apartments. 149
151 Households living in tented settlements also borrowed money significantly more than households living in independent houses and one room structures. The main reason for households borrowing money was to buy food. However, households living in independent houses stated rent as a reason to borrow money significantly more than households living in one room structures and tented settlements. The main source of borrowing money for all households was friends or relatives in Lebanon. Households with no debt were most common amongst households living in independent houses or apartments. However there was no significant differences amongst households average debt level, although households in independent houses had the highest average debt (US$722). Independent house (A) One room (B) Tented settlements (C) Sub- standard shelters (D) Experienced a lack of food or money to buy 64% 71% 76% A 75% A enough food in the 30 days prior to the survey Relied on less preferred, less expensive food 88% 92% 95% A D 86% Borrowed food or relied on help from friends or 32% 46% A 56% A 42% relatives Reduced the number of meals eaten per day 60% 63% 67% 61% Spent days without eating 7% 14% A 10% 9% Restrict consumption by adults in order to young- 41% 39% 45% 43% small children to eat? Send household members to eat elsewhere 7% 13% 20% A D 8% Reduced portion size of meals 63% 64% 76% A 68% Restrict consumption of female household 6% 5% 4% 8% members HH adopt strategies of consumption reduction 81% 86% 92% A 83% Selling household goods (radio, furniture, 21% 13% 16% 20% television, jewellery, etc.) Sell productive assets or means of transport 4% 3% 1% 2% (sewing machine, wheelbarrow, bicycle, car, livestock, etc.) Reduce essential non- food expenditures such as 31% 22% 35% 45% A B education, health, etc. Spent savings 20% 14% 28% B 20% Bought food on credit or borrowed money to 40% 49% 48% 47% purchase food Sold house or land 1% 1% 1% 2% Withdrew children from school 13% 10% 22% B 19% Have school children (6-15 years old) involved in 7% 6% 14% 9% income generation Marriage of children under 18 1% 1% 2% 1% Accept high risk, illegal, socially degrading or 4% 3% 1% 2% exploitative temporary jobs/activities? (e.g. theft, survival sex, exchange of favours, services ) Sent an adult household member to seek work 6% 6% 2% 6% elsewhere (regardless of the usual seasonal migration) Begged 2% 1% 3% 3% Did you borrow money in the past 3 months 79% 81% 92% A B 86% Reason for Documentation 1% 2% 1% 3% borrowing Education 2% 0% 0% 2% Food 70% 73% 82% A 73% Health 30% 37% 34% 33% Income 0.2% 0.4% 0% 0% Rent 57% B C 40% 32% 45% Social 0.2% 0% 0% 1% Transport 3% 4% 4% 3% Borrowing source Bank 0% 0.4% 0% 1% 150
152 Friends and family not in 6% 8% 6% 6% Lebanon Informal Group 0% 0% 0% 1% Local charity 0% 0% 0% 1% Money lender 1% 4% A 2% 2% Total amount of No debt 21% C 19% 10% 14% debt US$200 22% 25% 25% 24% US$ % 34% 36% 34% US$601 28% 22% 29% 27% Average amount of debt (US$) Table AVI 13: Coping strategies by shelter type. Food Security Households living in independent households were significantly more likely to be food secure than all other households, while 28% of households living in tented settlements were moderately food insecure and 2.4% were severely food insecure. However households living in one room structures and sub-standard shelters had no severely food insecure households. Food security classification- categories Table AVI 14: Food security by shelter type. Independent house (A) One room (B) Tented settlements (C) Sub- standard shelters (D) Food secure 30% B C D 20% C 9% 16% Mild food insecurity 61% 65% 60% 64% Moderate food insecurity 9% 15% 28% A B 20% A Severe food insecurity.3% 0% 2.4% A 0% ANNEX VII: KEY FINDINGS BY REGION Key findings Akkar Demographics The average household size in Akkar was 6.2 members, including 3 adults, 2 children between 5 and 17, and 1 child under 5 and 1 elderly person per 5 households. One third (35%) of households were composed of 7 or more members; 23% of households were headed by women; and 12% of households were headed by a single guardian with dependents. The dependency ratio was higher than 1.5 in 39% of households; 36% of households had at least 1 member with a specific need and 42% of households had at least 1 pregnant or lactating woman. Shelter The majority (74%) of households were renting and the majority of them were renting unfurnished shelters; 45% of households live in apartments, 38% of households live in unfinished shelter and 17% live in informal settlements. The average rent in Akkar was US$118, the lowest of all regions. Housing was cramped, 41% of households live in 7m2/ person or less and 13% of households had 6 or more members per room. One quarter (22%) of households, less than the national average, were in good condition. WASH Protected well were much more common in Akkar, 40% of households source of drinking water was from protected wells, while 42% of had have access to less than 35L of water per person per day. Few (4%) households did not have access to bathrooms while 4% of those who had access were sharing it with 15 people or more. Traditional pit latrines were the most common latrine facility (43% of households), while 31% of households used improved latrine and 21% used flush toilets meanwhile 38% of households had insufficient access to hygiene items. Additionally, 18% of households disposed of their garbage by either burning it or throwing it in fields. 151
153 Assets and services Akkar had the highest percentage of households that did not have enough access to cooking fuel (38%). One in ten (9%) households used wood or charcoal as their main source of fuel and 3% of households relied on candles as their main source of lighting. Education Akkar had the lowest percentage of children not attending school (52%) and 26% have attended school in the last year and moved to the next grade. However 26% of children have not attended school for 1 year or more, while 5% attend non-formal education. The main reasons for not attending school were tuition fees and school supplies that were considered too expensive. Health Akkar was the region with the highest number of households benefitting from free primary health care (26%). Nonetheless, the main reasons for household members in Akkar not receiving health care were the doctors fees (47%) and the cost of medication (40%). Security The most common type of insecurity in Akkar was harassment caused by neighbours and 14% of households felt some kind of insecurity in the past 3 months. Movement was limited for 84% of the households that felt some kind of insecurity. Livelihood sources Akkar was the region with the highest percentage of households (49%) that did not have any working members, while 22% of households had one working member for 5 or more dependents members. Most employment (80%) was temporary. The main livelihood sources were food vouchers for 48% of households followed by non-agricultural casual labour (17%) and skilled labour (11%). Debts and loans were the main second livelihood source. Expenditure The average expenditure per household was $602, the lowest of all regions. Akkar was also the region with the highest food expenditure share, 17% of households spent two thirds or more of their expenditure on food. Most households (62%) were below the poverty line ($3.84) and 56% below the Minimum Expenditure Basket. Food consumption and source In Akkar, on average, adults in a Syrian refugee household consumed 1.3 meals per day and children under 5 consumed 1.5 meals per day. In the majority of households (90%) access to food was equal, however 8% of households gave priority to children, and 1% gave priority to adult men or adults. One quarter (24%) of households were not able to cook food on a daily basis, where 72% of households were unable to cook due to the lack of food. Akkar had the lowest average weekly diet diversity, with an average of 9 food groups out of 12 per week and 6.6 food groups on a daily basis. The food groups most commonly consumed had low nutrient value (bread/pasta, condiments, sugar and fats/oils). Further, 90% of households did not consume any vitamin A rich fruits, 73% did not consume vitamin A rich vegetables and 15% of households had poor or borderline Food Consumption Scores. Infant and young child feeding practices were adequate in 1% of children, 54% of which were breastfed, 59% were received complementary feeding, 18% met the minimum acceptable meal frequency and 14% had the minimum diet diversity. The food groups most consumed by children were grains, tubers, and roots (49%), followed by dairy products (46%) and eggs (26%). Meat and fish were consumed by 8% of children while vitamin A rich fruits and vegetables were consumed by 10%. The main source of food consumed was food vouchers: 47% of households relied on food vouchers to buy their food and 43% bought their food from the market. Coping strategies Three quarters (74%) of households experienced a lack of food or money to buy food, of these households 94% applied food related coping strategies. The main coping strategies applied were relying on less preferred of less expensive food and reducing the number of meals or meal sizes. Of the households that lacked food of money to buy it, 61% were adopting stress coping strategies, while 23% adopted crisis coping strategies and 12% adopted emergency coping strategies. The most common strategies were buying food on credit/borrowing money to buy food (45%), and reducing essential non-food expenditures such as education or health (26%). 152
154 Most households (83%) borrowed money or received credit in the 3 months prior to the survey, mainly to cover food (79%), rent (53%) and health (38%) expenses. Two thirds (65% of households had a debt of more than $200) and most loans came from friends or relatives in Lebanon. Food security Akkar had the highest percentage of moderately or severely food insecure households, 22% of all households, and 61% were vulnerable to food insecurity. Assistance More households in Akkar were eligible for assistance than elsewhere, 86% of households were eligible for WFP or UNHCR s assistance. The most common type of assistance was food assistance, received by 72% of households, hygiene kits (44%) and healthcare (35%). Key Findings The Bekaa Valley Demographics The average household in the Bekaa Valley had 7.1 members, including 3 adults, 2.5 children between 5 and 17 years, and 1.3 children under 5 and 1 elderly person per 4 households. One fifth (21%) of households were headed by women and 9% of households were headed by a single guardian and had dependents. One third (34%) of households had a dependency ration higher than 1.5, 46% of households had at least one member with a specific need and 36% of households had at least one pregnant or lactating woman. Shelter The majority (81%) of households were renting and the majority of them were renting unfurnished apartments; 41% of households live in apartments, 22% live in unfinished buildings and 31% live in informal settlements. The average rent is $181, 54% of households live in 7m2 or less and 16% of households had 6 or more people per room. Two fifths (41%) of households were in good condition. WASH One third (34%) of households relied on tap water for their drinking water and 40% of households had access to less than 35L of water per person per day. One in ten households did not have access to bathrooms, while 11% of households shared a bathroom with 15 or more people. The most common type of latrine was an improved latrine, used by 37% of households, while 33% used traditional pits and 27% of households used flush toilets. One third of households (35%) had insufficient access to hygiene and 10% of households disposed of their garbage by burning it or throwing it in fields. Assets and services The Bekaa Valley had the highest percentage of households with access to basic assets. Meanwhile, 5% of households used wood or charcoal as their main source of fuel and 3% of households used candles as their main source of lighting. Education The Bekaa Valley had the highest percentage of children not attending school (72%) 54% had not attended school for 1 year or more. However 17% of children had attended school in the last year and moved to the next grade and 4% attended non-formal education. The main reasons for not attending school were tuition fees (30%) and 11% of households had no school in the community. Health The cost of drugs and doctors fees were the causes of not receiving the required healthcare, sighted by 49% and 46% of households respectively. Security Households in the Bekaa Valley felt safer than elsewhere, only 5% of households felt insecure, mostly due to harassment by neighbours. 153
155 Livelihood sources One third (31%) of households did not have any working members and 32% of households had 5 or more dependents per working member. Most employment (85%) was temporary. The main livelihood sources were food vouchers (67%) followed by non-agricultural labour (17%), agricultural labour (3%) and savings (3%). The Bekaa Valley had the highest percentage of households relying on food vouchers as a main source of income. Expenditure The average household expenditure was US$705 and 18% of households allocated two thirds or more of their expenditure on food. Most households (62%) were below the poverty line ($3.84) and 56% were below the Minimum Expenditure Basket. Food consumption and source In the Bekaa Valley, on average, adults in a Syrian refugee household consumed 2.5 meals per day and children under 5 consumed 2.8 meals per day. In 59% of households all members had equal access to food while 37% of households gave children the priority to food. One third (29%) of households were not able to cook food on a daily basis, mostly because of a lack of food to cook. The average weekly diet diversity was 9.4 food groups out of 12 and 7 food groups daily. The food groups most consumed had low nutrient value (bread/pasta, condiments, sugar and fats/oils) and 91% and 93% of households did not consume any vitamin A rich fruits and vegetables respectively. The Food Consumption Score was poor or borderline in 11% of households. Infant and young child feeding practices were adequate in 4% of children between 6 and 24 months. Of those children 48% were being breastfed, 67% received complementary feeding, 17% had the minimum acceptable meal frequency and 18% met the minimum acceptable diet diversity. The food groups most consumed by children were dairy products (63%), grains, roots, tubers (60%) and eggs (23%). Whereas meat and fish were consumed by 4% of children and vitamin A rich fruits and vegetables were consumed by 9%. The food vouchers was the main source of food consumed, 52% of households relied on the food voucher while 34% of households bought their food from the markets. Coping strategies The Bekaa Valley had the highest proportion of households (80%) that experienced a lack of food or money to buy food, 91% of households applied some kind of food related coping strategy. The food related coping strategies most commonly used was relying on less preferred/less expensive food, reducing meal portion size, or reducing the number of meals eaten. Of the households that lacked food or money to buy it, 51% were adopting stress coping strategies, while 35% were adopting crisis coping strategies and 11% were adopting emergency coping strategies. The coping strategies most commonly applied was buying food on credit/borrowing money to buy food (45%) and reducing essential non-food expenses (34%). The Bekaa Valley also had the largest proportion of households that in debt and 88% of households borrowed money or received credit, mainly for food (77%), rent (56%) and health (34%) expenses. The main source of loans was friends or relatives in Lebanon and 50% of households had debts of more than US$500. Food security Oen every 6 households were moderately or severely food insecure (17%) and 70% were vulnerable to food insecurity. Assistance Three quarters (76%) of households were eligible for either WFP or UNHCR s assistance. The main type of assistance received were food vouchers, received by 75% of households, hygiene kits (51%) and cash assistance (31%). 154
156 Key findings Beirut-Mount Lebanon Demographics The average household in Beirut-Mount Lebanon had 6.1 members, including 3 adults, 2 children between 5 and 15, 1 child under 5 and 1 elderly person per 5 households. One third (34%) of households had 7 members or more; 10% of households were headed by women; 3% of households were headed by single guardian with dependents; 13% of households had more than 2 dependents for every working member; 55% of households had at least one member with a specific need; and 32% of households had at least 1 pregnant or lactating woman. Shelter The majority (85%) of households were renting, while 73% of households lived in apartments, 25% lived in unfinished shelters and a minority (0.3%) lived in informal settlements. The average rent was US$268, more than anywhere in Lebanon. Half of all households (58%) lived in less than 7m2 per person and 12% of households had 6 or more people per room, while 38% of households were living in a shelter of good condition. WASH Most households in Beirut-Mount Lebanon (59%) relied on bottled water as their source of drinking water, while 32% of households did not have access 35L of water per person per day. One fifth (20%) of households did not have access to bathrooms, while 5% of those who had access to bathrooms were sharing them with 15 people of more. Half of all households (50%) used flush toilets, 29% used improved latrines, and 31% of households were using traditional pits, and 41% of households did not have access to hygiene items. Assets and services Households in Beirut-Mount Lebanon owned the most medium-luxury assets. Education In Beirut-Mount Lebanon 63% of school aged children were not attending school and 5% were attending non-formal education, while 34% have not attended school for 1 year or more and 12% had attended school in the last year and moved to the next grade. The main reasons for not attending school were tuition fees and school supplies that were considered too expensive. Health The cost of drugs (41%) and the doctors fees (40%) were the main reason that households could not medical treatment that was needed. Security More households felt insure in Beirut-Mount Lebanon than elsewhere, 18% of households. The majority of households that felt insecure were harassed by neighbours and half (52%) of the households that felt insecure were limited in their movement. Livelihood sources One sixth (16%) of households had no working members and 32% of households had one working member for 5 or more dependents. Most employment was temporary, although 29% of jobs were permanent. The main livelihood sources were non-agricultural labour (37%), skilled work (35%), and Food vouchers (15%). Expenditure The average household expenditure was US$872, the highest among all regions, and 18% of households allocated more than half their expenditure on food. One third (31%) of households were below the poverty line ($3.84) and one quarter were below the Minimum Expenditure Basket. Food consumption and source In Beirut-Mount Lebanon, on average, an adult in a Syrian refugee household consumed 2.3 meals per day and children under 5 consume 2.9 meals per day. Half (51%) of households gave equal access to food, while 48% prioritized children and 15% of households were not able to cook on a daily basis, mainly due to the lack of food. The average weekly diet diversity was 9.3 food groups out of 12, while the average daily diet diversity was 6.5 food groups, the lowest among all regions. The food groups most consumed had low nutrient value (bread/pasta, condiments, sugar and fats/oils), while 80% and 89% of households did not consume vitamin A rich vegetables and fruits respectively. 155
157 Most (97% of children between the age of 6 and 24 months did not have the minimum adequate diet, while 54% of those children were breastfed, 52% received complementary feeding, 12% met the minimum acceptable meal frequency, and 16% met the minimum diet diversity of four food groups. The food groups consumed the most by children were dairy products (48%), grains, roots, and tubers (46%), and eggs (21%). The main sources of food consumed for households were markets (56%) and food vouchers (32%). Coping strategies Beirut-Mount Lebanon had the lowest percentage of households that lacked food or money to buy it (47%), where 92% of them applied food related coping strategies. The main coping strategies applied were relying on less preferred of less expensive food, reducing number of meals, or meal size. Two thirds (69%) of households that lacked food or money to buy it applied stress coping strategies, while 8% applied crisis coping strategies and 12% applied emergency coping strategies. The most common coping strategies employed were, buying food on credit/borrowing money to buy food (48%) and selling household goods (17%). Beirut-Mount Lebanon was also the region with the lowest number of households in debt, 74% of households borrowed money or received credit in the 3 months prior to the survey mainly to buy food (73%), rent (49%) and health (47%) expenses. The main source of loans was friends or relatives in Lebanon and 50% of households had a debt of $450 and above. Food security Six percent of households were moderately or severely food insecure and 18% were vulnerable to food insecurity (mildly food insecure). Beirut-Mount Lebanon was the region with the highest percentage of food secure households. Assistance Less households were eligible for WFP or UNHCR assistance than in other regions, only 62% of households were eligible. The most common type of assistance received was food vouchers, received by 55% of households, hygiene kits (29%), and food in-kind (20%). Key findings South Lebanon Demographics The average household in South Lebanon had 6.9 members including 3.5 adults, 2 children (5-15), 1 child under 5 and 1 adult for every 4 households. Two fifths (44%) of households had 7 or members; 18% of households were headed by women; 4% were headed by single guardians with dependents; 17% of households had 2 or more dependents for every working member; 66% of households had at least one member with a specific need; and 34% of households had at least 1 pregnant or lactating woman. Shelter Most (69%) households lived in apartments, 23% lived in unfinished shelters, and 5% lived in informal settlements. Most (78%) households were renting, with only 13% renting furnished apartments, and the average rent was US$125. Half (52%) of all households were living in less than 7m2 per person and 12% of households had 6 or more people per room. One third (36%) of households were living in a house of good condition. WASH Household tap water was the main source of drinking water in South Lebanon, used by 46% of households, while 28% of households did not have access to 35L of water per person per day. The majority of households were using improved latrines (48%), while 27% were using traditional pits and 25% were using flush toilets. However, 7% of households did not have access to bathrooms, 7% of households that had access to bathrooms were sharing them with 15 people or more and 44% of households had insufficient access to hygiene items. One in ten households disposed of their garbage by burning it or throwing it into fields. Assets and services 5% of households used wood or charcoal as their main source of fuel. Households that had access to water heater were higher in the south than any other region. 156
158 Education In South Lebanon 67% of children were not attending school; 6% attend non-formal education; 59% have not attended school for 1 year or more; while 18% had attended school in the last year and moved to the next grade. The main reasons for not attending school were the expenses related to it, including enrolment costs (44%), school supplies (12%) and transportation costs (10%). Health The main reasons household members were not receiving the required healthcare were cost of drugs (38%), doctors fees (27%) and because they didn t know where to seek medical help (27%). Security Households in South Lebanon felt safer than elsewhere, except the Bekaa Valley, only 9% of households felt insecure, mostly due to harassment by neighbours. Livelihood sources In South Lebanon 14% of households did not have any working member and 32% had one working member per 5 or more non-working members. Employment was mostly (65%) temporal, although 27% was permanent. The main sources of income were food vouchers (44%), non-agricultural labour (35%) and agricultural labour (7%). Expenditure The average household expenditure was US$808, of which 18% of households spent more than half of their expenditure on food. Almost half (46%) of households were below the poverty line (US$3.84) and 28% below the Minimum Expenditure Basket. Food consumption and sources In South Lebanon, on average, an adult in a Syrian refugee household consumed 2.5 meals per day and children under 5 consumed 3.6 meals. In 56% of households all members had equal access to food while in 41% of households children were given the priority, while of households that were not able to cook on a daily basis was 12%, mostly because of a lack of food. South Lebanon had the highest diet diversity, the average weekly diet diversity was 9.8 food groups per week and 7.2 food groups daily. However the food groups most consumed had low nutrient value (bread/pasta, condiments, sugar and fats/oils), while 83% and 90% of households did not consume Vitamin A rich vegetables and fruits respectively. The Food Consumption Score was poor or borderline in 8% of households. Infant and young child feeding practices were adequate in 12% of children between 6 and 24 months of age. While 61% of children were breastfed and 79% received complementary feeding. The food groups consumed most by children were grains, roots, tubers (67%), dairy products (59%) and eggs (34%). One third (35%) of children met the minimum meal frequency, while 24% had adequate diet diversity. The main sources of food were food vouchers and markets, 42% of households relied on food vouchers and 40% of households relied on markets. Coping strategies Two thirds (66%) of households had a lack of food or money to buy food, 88% of which applied at least one food related coping strategy. The main coping strategies applied were relying on less preferred of less expensive food, reducing the number of meals or reducing meal size. Of households that lacked food or money to buy food, 32% applied stress coping strategies, 43% adopted crisis coping strategies, and 22% adopted emergency coping strategies. The main strategies applied were reducing non-food expense (54%) and buying food on credit/borrowing money to buy food (45%). The majority (82%) of households borrowed or received credit in the 3 months prior to the survey. This money was mainly used to cover food (68%), rent (49%) and health (35%) expenses. The main source of loans was friends and relatives in Lebanon and 56% of households had a debt of more than $200. Food security Forteen percent of households were moderately or severely food insecure and 60% were vulnerable to food insecurity (mildly food insecure). 157
159 Assistance Three quarters (77%) of households were eligible for WFP or UNHCR assistance. The most common type of assistance received was food vouchers, received by 75% of households, hygiene kits (58%), and healthcare (58%). Key findings Tripoli + 5 Demographics The average household in Tripoli + 5 had 6.6 members, including 3 adults, 2 children between 5 and 17, 1.3 children under 5 and 1 elderly person per 4 households. Households were headed by females in 13% of cases; 6% of households were headed by a single guardian with dependents; 44% of households had at least one member with specific needs; and 32% of households had at least one pregnant or lactating woman. Shelter The majority (66%) of households lived in apartments, while 24% lived in unfinished shelters and 8% lived in informal settlements. Most (88%) households were renting and the majority of them were renting unfurnished apartments. The average rent was US$221, 17% of households 6 or more people per room and 32% of households were in good condition. WASH Household tap water was the main source of drinking water in Tripoli + 5, used by 39% of households, while 36% relied on bottled water. 30% of households have access to less than 35L of water per person per day. 10% of households did not have access to bathrooms and 8% of those who had access were sharing it with 15 or more people. 45% of households were using flush latrines, 30% were using improved latrines, and 23% traditional pit. 45% or households lacked access to hygiene items. Assets and services Households in Tripoli + 5 had significantly more TVs than any other region (88%). Education In Tripoli % of children were not attending school; 6% attend non-formal education; 33% have not attended school for 1 year or more; while 16% attended school in the last year and moved to the next grade. The main reasons children not attending school were tuition fees and school supplies that were considered too expensive. Health 52% of households couldn t receive healthcare due to the cost of doctors fees. Security One sixth (16%) of households felt insecure in the 3 months prior to the survey, most people felt insecure because of harassment from neighbours. Livelihood sources One third (30%) of households did not have any working member and a further third (33%) of households had 5 or more dependents per working member. Most employment (71%) was temporary, 23% permanent, and 6% seasonal. The main livelihood sources for households were non-agricultural labour (37%), food vouchers (34%) and skilled labour (9%). Two thirds (63%) of households had a second source of income. Expenditure The average household expenditure was US$754, of which 26% of households spent more than half of their expenditure on food. Half (49%) of all households were below the poverty line (US$3.84) and 44% were below the Minimum Expenditure Basket. Food consumption and source In Tripoli + 5, on average, an adult in a Syrian refugee household consumed 1.7 meals per day and children under 5 consumed 1.9 meals per day. In 69% of households all members had equal access to food while 29% gave priority to 158
160 children under 5, however 17% of households were not able to cook on a daily basis, mainly due to the lack of food. The average weekly diet diversity was 9.2 food groups and 6.8 food groups on a daily basis. The food groups most consumed had low nutrient value (bread/pasta, condiments, sugar and fats/oils), while 72% and 86% of households did not consume in the past week vitamin A rich vegetable and fruits respectively. The Food Consumption Score was poor or borderline for 15% of households. Infant and young child feeding practices were adequate for 1% of the 6-23 months old children. While 46% of children were breastfed, and 65% received complementary feeding. The food groups most consumed by children were grains, roots, tubers (62%), dairy products (49%) and eggs (31%), while 16% of children had the minimum acceptable meal frequency and 17% had the minimum diet diversity. The main sources of food were food vouchers and markets, 53% of households relied on food vouchers and 36% of households relied on markets. Coping strategies Three quarters (73%) of households lacked food or money to buy food and 90% of households applied food related coping strategies. The main coping strategies applied were relying on less preferred of less expensive food, reducing number of meals, or reducing meal sizes. Half (49%) of the households that lacked food or money to buy food applied stress coping strategies, 37% applied crisis coping strategies and 9% applied emergency coping strategies. The most common strategies applied were buying food on credit/borrowing money to buy food (44%) and reducing essential non-food expenses (30%). The majority (82%) of households borrowed money or received credit in the 3 months prior to the survey, mainly to cover food (68%), rent (45%) and health (29%) expenses. The main sources of loans were friends and relative in Lebanon and 50% of households were in debt of more than $300. Food security Twelve percent of households were moderately or severely food insecure and 69% were vulnerable to food insecurity (mildly food insecure). Assistance The majority (80%) of households were eligible for WFP or UNHCR assistance. The most common type of assistance was food vouchers, received by 71% of households, food in-kind (29%) and hygiene kits (22%). 159
161 ANNEX VIII: CLUSTER SELECTION FOR DATA COLLECTION Governorate District Population Clusters Number of HHs Akkar Akkar RC 350 Total RC 350 Bekaa Baalbek RC 100 El- Hermel Rachaya West Bekaa Zahle RC 180 Total RC 350 BML Beirut RC 30 Aley RC 70 Baabda Chouf RC 60 El Meten Jbeil 2934 RC Kesrwane Total RC 350 South Bent Jbeil El Nbatieh RC 90 Hasbaya Jezzine Marjaayoun RC 20 Saida RC 130 Sour RC 40 Total RC 350 T5 Bcharre El Batroun El Koura El Minieh- Dennie Tripoli RC 130 Zgharta RC 20 Total RC 350 Table AVIII 1: Clusters for data collection, regions and districts. 160
162 Cluster selection Akkar Geographical unit Population size Assigned cluster Aaklar El Attiqa Abde ,3,4 Akroum Amayer Bani Sakher Bebnine ,RC Berqayel ,10 Bire Borj el Arab Chane Daousse Baghdadi El Hichi El Majdal El Rama Fnaideq Halba ,20,21,22 Hissa Hrar Kfartoun Knaisse Kouikhat Machha Machta Hammoud Minyara Ouadi Ej jamous 1520 RC Qoubbet Chamra Rajm Hssein Semmaqiye 519 RC Tal Meaayan Tleil Wadi Khaled 4505 RC,35 Table AVIII 2: Clusters for data collection, Akkar. 161
163 Cluster selection The Bekaa Valley District Geographical unit Population size Assigned cluster Baalbek Aarsal ,2,3,RC Baalbek Baalbek ,6 Baalbek Betdaai 56 9 Baalbek Chmistar Baalbek El Qaa Baalbek Haouch Barada Baalbek Nabi Chit Baalbek Taibe 169 RC El Hermel Hermel Rachaya Khirbet Rouha West Bekaa El Marj ,14 West Bekaa Ghazze West Bekaa Joub Jannine West Bekaa Souairi Zahle Al Faour Zahle Bar Elias RC,7,8 Zahle Dalhamiye Zahle Deir Zenoun Zahle Jdita Zahle Karak Nouh Zahle Madinat Al Sina'iyat Zahle Majdel Anjar RC,24 Zahle Qabb Elias ,27,28 Zahle Raite Zahle Saadnayel ,31 Zahle Taalabaya Zahle Zahle ,35 Table AVIII 3: Cluster for data collection, the Bekaa Valley. Cluster selection Beirut-Mount Lebanon 162 District Geographical unit Population size Assigned cluster Aley Aaramoun Aley Aitat Aley Baissour Aley Bchamoun Aley Bhamdoun ed Dayaa Aley Khalde Aley Es Shwayfate 5945 RC,20 Baabda Bir Hassan ,9 Baabda Cite Sportive ,14,15
164 Baabda El Ouzaai ,19 Baabda Hazmiye Baabda Jnah Beirut Achrafiye 2450 RC Beirut Ras El Nabaa Beirut Tariq El Jdide ,35 Chouf Barja Chouf Borjein 361 RC Chouf Chhime Chouf Daraiya Chouf Gharife Chouf Naame Chouf Ouadi Ez Zeyni El Meten Antelias El Meten Borj Hammoud ,11 El Meten Dekouane El Meten Jdaide El Meten Mazraat Deir Aaoukar El Meten Sad el Baouchriye El Meten Sinn el Fil Jbeil Aamchit 349 RC Kesrwane Jounieh Kaslik Kesrwane Mairouba Table AVIII 4: Clusters for data collection, Beirut-Mount Lebanon. Cluster selection South Lebanon District Geographical unit Population size Assigned cluster Saida Aabra Bent Jbeil Aaita ez Zott 26 2 Bent Jbeil Ain Ebel Bent Jbeil Bent Jubail El Nabatieh Arab Salim El Nabatieh Deir ez Zahrani El Nabatieh Doueir El Nabatieh Habbouch El Nabatieh Harouf El Nabatieh Insar El Nabatieh Kfar Roummane El Nabatieh Nabatiye el Faouqa 2051 RC El Nabatieh Nabatiye el Tahta El Nabatieh Zefta Hasbaya Chebaa
165 El Nabatieh Zefta Hasbaya Chebaa Jezzine Jezzine Jezzine Lebaa Jezzine Sfarai Marjaayoun Marjaayoun 956 RC Marjaayoun Rabb et Talatine Marjaayoun Touline Saida Aaqbiye 2915 RC Saida Baissariye Saida Bramiye Saida Ez Zahrani Saida Ghaziye Saida Kfar Hatta Saida Kharayeb Saida Maghdouche Saida Saida ,26,27,28 Saida Sarafand Sour Borj ech Chmali 2537 RC Sour Qana Sour Sour ,32 Sour Tair Debba Table AVIII 5: Clusters for data collection, South Lebanon. Cluster selection Tripoli + 5 District Geographical unit Population size Assigned cluster El Batroun Batroun El Batroun Chekka El Batroun Dawrat El Batroun Kfar Aabida El Batroun Kfar Helda El Koura Barsa El Koura Dahr AlAin El Minieh- Dennie Beit jida El Minieh- Dennie Bqaa Safrin El Minieh- Dennie Deir Amar El Minieh- Dennie El Beddaoui ,14,15,16 El Minieh- Dennie El Minie ,19,20,21 El Minieh- Dennie En Nabi Youchaa El Minieh- Dennie Sir Ed Danniye Tripoli Abou Samra ,2,RC,3 Tripoli Bab Al Ramel
166 Tripoli Bab Al Ramel Tripoli El Mina Tripoli Fouwar 2605 RC Tripoli Mankoubin Tripoli Mina Jardin Tripoli Qalamoun Tripoli Qoubbe 9854 RC,29,30 Tripoli Shok Tripoli Tal ,34 Zgharta Aalma 532 RC Zgharta Miryata Zgharta Zgharta Table AVIII 6: Clusters for data collection, Tripoli + 5. ANNEX VIII: CLUSTER SELECTION FOR FOCUS GROUP DISCUSSION Akkar Bekaa BML South T5 Abde Aarsal Aaramoun Doueir Chekka Akroum Baalbek Khalde Chebaa El Beddaoui Bebnine Nabi Chit Bir Hassan Aaqbiye El Minie Bire Ghazze Cite Sportive Ghaziye Sir Ed Danniye Halba (2) Bar Elias Jnah Saida (2) Abou Samra Machha Dalhamiye Tariq El Jdide Borj ech Chmali Mina Jardin Tal Meaayan Qabb Elias Chhime Sour Qoubbe Taalabaya Jdaide Tal Table AIX 1: Clusters for Focus Group Discussions by region. ANNEX X: MINIMUM EXPENDITURE BASKET METHODOLOGY Methodology The Minimum Expenditure Basket (MEB) is based on secondary data on expenditures collected by 17 agencies. The data was consolidated and analysed by Handicap International during the second quarter of MEB composition was discussed and endorsed by the Cash Working Group after consultation and inputs received from sector working groups. The expenditures included in the MEB are: Minimum food expenditure basket (MFEB): MFEB is based on WFP quantities which contents 2,100 kcal per day plus all nutrients needed. In order to calculate it, prices collected by WFP in January 2014 over Lebanon were analysed. Non Food Item (NFI): the NFI package was decided by the NFI Working Group, monthly prices monitoring done by a few organizations were used to determine the average price for each item. Even though, only a few organizations are involved in the NFI price monitoring, prices were collected in all regions except Beirut. 165
167 Clothes: no minimum requirement for clothes has been agreed by the sector lead, therefore this calculation is based on monthly expenditures collected through PDM. Communication: the price taken is based on the minimum requirement per month to keep the phone line active. Rent: the calculation is based on average rent regardless of the types of shelter that refugees are living in considering the percentage of the refugees actually paying rent. Agreement received from the Shelter Sector Working Group. Water: the calculation is based on the Sphere standard where one individual will require 35 litres of water per day, then multiplied by the cost of water truck service. Agreement received from the WASH Sector Group. Transportation: no minimum requirement for transportation was agreed, thus the calculation is based on monthly expenditures collected through PDM. Health: the calculation is based on the agreement by Health Sector Working Group. Adults will make 2 medical visits per year in addition to drugs and diagnostic test which costs US$16 per year per person. Children under the age of 5 will make 4 medical visits per year which costs US$33 per year per person. It was assumed that a households was composed with 2 adults, 1 child above 5 years and 2 children under 5 years. Education: no feedback received from education sector, therefore the calculation is based on expenditures collected through PDM. Products Quantities per capita Quantities per HH Amount in LBP Amount in US$ Comments Food Basket Ration per month in G Lemon ,1 1 Minimum Food Expenditure Lettuce ,0 3 Basket per HH with WFP Egg ,4 2 ration to meet nutrient needs Bread , KCAL/month Milk powder Egyptian Rice ,8 4 Spaghettis ,0 2 Bulgur Wheat ,3 4 Canned meat ,8 7 Vegetable oil ,9 2 Sugar ,4 1 Lentils ,0 3 Salt iodized ,0 0 Total Food expenditures per person 55, Total Food expenditures per HH 275, Non Food items (CWG) 166 Prices collected by CWG actors Toilet Paper Toothpaste 4 rolls/packet , ,4 1 3 Quantities harmonized by the NFI WG. Minimum NFI required. tubes/75ml Laundry Bubbles 4 073,2 3 soap/detergent 900gr Liquid Dishes 750ml 2 478,8 2 detergent Sanitary napkins 3 packets of 8 051, pads per packet Individual soap 5 pieces of 2 461, g Hyppoallergic 125g per bar 1 298,2 1 Soap Disinfectant fluid 500ml 3 891,5 3 Shampoo 500ml 4 022,5 3
168 Shampoo 500ml 4 022,5 3 Diapers 90 per packet ,3 10 Cooking gas 1kg 2 733,3 2 Total NFI expenditures ,0 33 Other NFI Based on HH surveys Clothes per month ,0 25 Based on average expenditures collected through PDM Commination cost per month Minimum needed per month to keep the phone active Shelter Rent per month ,0 193 Average rent regardless the type of shelter. Weighted according to % of population residing in shelter. Wash Water supply per month Monthly cost of water per HH in normal situation, 35 L/person/day according to normal standard. Services per month ,00 27 Based on average Transportation expenditures collected through PDM Services Health per month ,00 10 According to health sector, adults will do 2 medical visits per year+ drugs and diagnostic test which costs 16$ per year/adult. Children <5 will do 4 medical visits per year which costs 33$ per year/child. We took the assumption that a HH was composed with 2 adults, 1 child>5 years and 2 children<5 years. Calculation: (16X3+33X2)/12 Services Education per month ,50 30 Based on average expenditures collected through PDM TOTAL MEB 857, Table AX 1: Minimum Expenditure Basket. Extra expenditures There were extra expenditures that required special attention to the humanitarian agencies who are providing assistance to Syrian refugees, such as legalisation of stay in Lebanon. All Syrian refugees arrived in Lebanon in 2013 had to renew their visa for 6 months (free for the next 6 months), in order to do so every individual over 15 years old had to pay US$200. It has been known that an average of 2 people per household had to legalise their visa in 2014, thus every household required an additional US$400 assistance. Regarding winterisation, it was agreed that only petrol will be an additional cost for the household as distribution of stoves and high thermal blanket has occurred and newcomers will receive this assistance. Limitations Data analysed were collected and based upon different timeframes, therefore the MEB is not perfectly accurate. Some expenditure could not be disintegrated which makes is difficult to understand what they are incorporating. There was no harmonisation of the expenditure collection. 167
169 Survival Expenditure Basket Based on the MEB, a survival expenditure basket was calculated which includes all the survival basic items needed by the households, which are: Food: based on the 2100KCAL per day, same as the MEB, excluding the cost of the 100% of the nutrients needed. NFI: the package remains the same as the previous one included in the MEB. Clothes: same package as MEB. Communication: same package as MEB. Rent: Average rent for refugees staying in ITS. Water: calculated based on 15L per day per person. Transportation: same package as MEB. Loan refund: based on average collected through field visit. Products Quantities per capita Quantities per HH Amount in LBP Amount in US$ Comments Food Basket Ration per month in g Egyptian Rice , Based on WFP vouchers. Spaghettis , Quantities to cover Bulgur Wheat , KCAL/day Canned meat , Vegetable oil 990 2, Sugar , White beans , Salt iodized Total Food expenditures per person 43, Additional 10% for dairy products 47, and vegetables Total Food expenditures/hh 238, Non Food items (CWG) 168 Prices collected by CWG actors Toilet Paper Toothpaste 4 rolls/packet 2 1, , Quantities harmonized by the NFI WG. Minimum NFI required. tubes/75ml Laundry Bubbles 4, soap/detergent 900gr Liquid Dishes 750ml 2, detergent Sanitary napkins 3 packets of 8, pads per packet Individual soap 5 pieces of 2, g Hyppoallergic 125g per bar 1, Soap Disinfectant fluid 500ml 3, Shampoo 500ml 4, Diapers 90 per packet 14, Cooking gas 1kg 2, Total NFI expenditures 48, Other NFI Based on HH surveys Clothes per month 37, Based on average Communication per month 26, expenditures collected cost through PDM Services per month 40, Transportation Personal per month 108,
 72.")
170 Legal Expenditures Personal expenditures Loan refund per month 108, Shelter Rent per month 121, Average rent in ITS Wash Water supply per month Monthly cost of water per HH in normal situation, 15 L/person/day according to sphere standard. Cost of legalizing stay in Lebanon (Based on legislation, registration data and HH surveys) 72.4 per year 600, Starting after one year from entry. Estimated 500,000 people by mid may be without residency; average family size in MEB = 5, assumption was made than 2 adults above 15 will require legalization of their stay. Winterisation Petrol, unleaded 100L 73, L per month during 5 months. One month is 118,3$ X 5months = 591,5$. To get a monthly cost 591,5$/12 = 49,3$ TOTAL SMEB Table AX 2: Survival Expenditure Basket. Figure 1. Household classification according to Minimum Expenditure Basket 50 categories and extreme poverty line by region. 169
171 ANNEX XI: FOOD CONSUMPTION SCORE CALCULATION The FCS is based on dietary diversity (number of food groups consumed by households during the seven days prior to the survey), food frequency (number of days on which each food group is consumed during the seven days prior to the survey) and the relative nutritional importance of each food group. A weight was attributed to each food group according to its nutrient density. The food consumption score is calculated by multiplying the frequency of consumption of each food group (maximum of seven if a food group was consumed every day) by each food group weight and then summing up these scores. The FCS can have a maximum value of 112, implying that each food was consumed every day for the last seven days. Households are then classified on the basis of their FCS and standard thresholds into three categories: poor, border line and acceptable. In this case, cut off points have been set at 28 and 42 as recommended by the WFP Emergency Food Security Assessment Handbook when oil and sugar are frequently consumedamongst nearly all households surveyed. Food groups Weight Justification Main staples 2 Energy dense/usually eaten in large quantities, protein content lower and poorer quality (PER less) than legumes, micro- nutrients (bounded by phytates) Pulses 3 Energy dense, high amounts of protein but of lower quality (PER less) than meats, micro- nutrients (inhibited by phytates), low fat Vegetables 1 Low energy, low protein, no fat, micro- nutrients Fruits 1 Low energy, low protein, no fat, micro- nutrients Meat and fish 4 Highest quality protein, easily absorbable micro- nutrients (no phytates), energy dense, fat. Even when consumed in small quantities, improvement to the quality of diet are large Milk 4 Highest quality protein, micro- nutrients, vitamin A, energy. However, milk could be consumed only in very small amount and should then be treated as condiment and therefore re- classification in such cases is needed Sugar 0.5 Empty calories. Usually consumed in small quantities Oil 0.5 Energy dense but usually no other micro- nutrients. Usually consumed in small quantities Condiments 0 These foods are by definition eaten in very small quantities and not considered to have an important impact on overall diet. Table AXI 1: Food consumption score calculation. FCS Profiles 0-28 Poor Border line >42 Acceptable Table AXI 2: Food consumption score classification. 170
172 ANNEX XII: LIVELIHOOD COPING STRATEGIES INDICATOR The Livelihood Coping Strategies indicator is used as a descriptor of a household s coping capacity. It is derived from a series of questions regarding the household s experience with livelihood stress and asset depletion during the 30 days prior to survey. Responses are used to understand the stress and insecurity faced by households and describe their capacity regarding future productivity. The strategies included in the questionnaire module are classified into 3 categories (see Table 1): Stress strategies, such as borrowing money or spending savings, are those which indicate a reduced ability to deal with future shocks due to a current reduction in resources or increase in debts. Crisis strategies, such as selling productive assets, directly reduce future productivity, including human capital formation. Emergency strategies, such as selling one s land, affect future productivity, but are more difficult to reverse or more dramatic in nature. Each household is classified with the most severe livelihood coping strategy which it experienced. Households which reported that they were unable to employ a particular strategy because they had already exhausted that option (e.g. they ve already spent all their savings in order to cope) are also considered to have experienced that strategy. Stress Crisis Emergency Spent savings Sold productive assets School aged children involved in income Sold goods Withdrew children from school Begged Bought food on credit Reduced non- food expenses Accepted high risk jobs Have debts Marriage of children under 18 Sold house or land Table AXII 1: Coping strategies by category. 171
173 ANNEX XIII: QUESTIONNAIRE 172
174 173
175 174
176 175
177 176
178 177
179 178
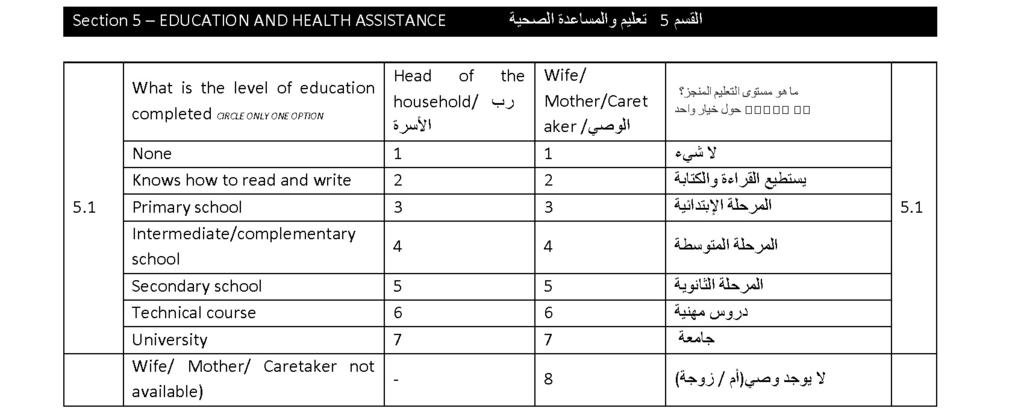
180 179
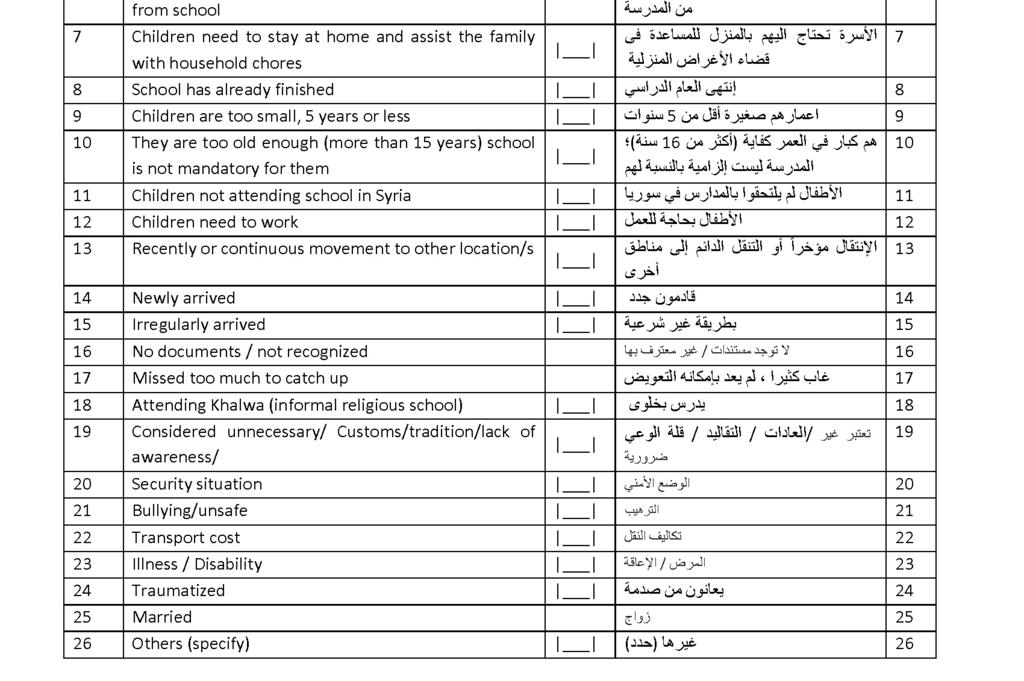
181 180
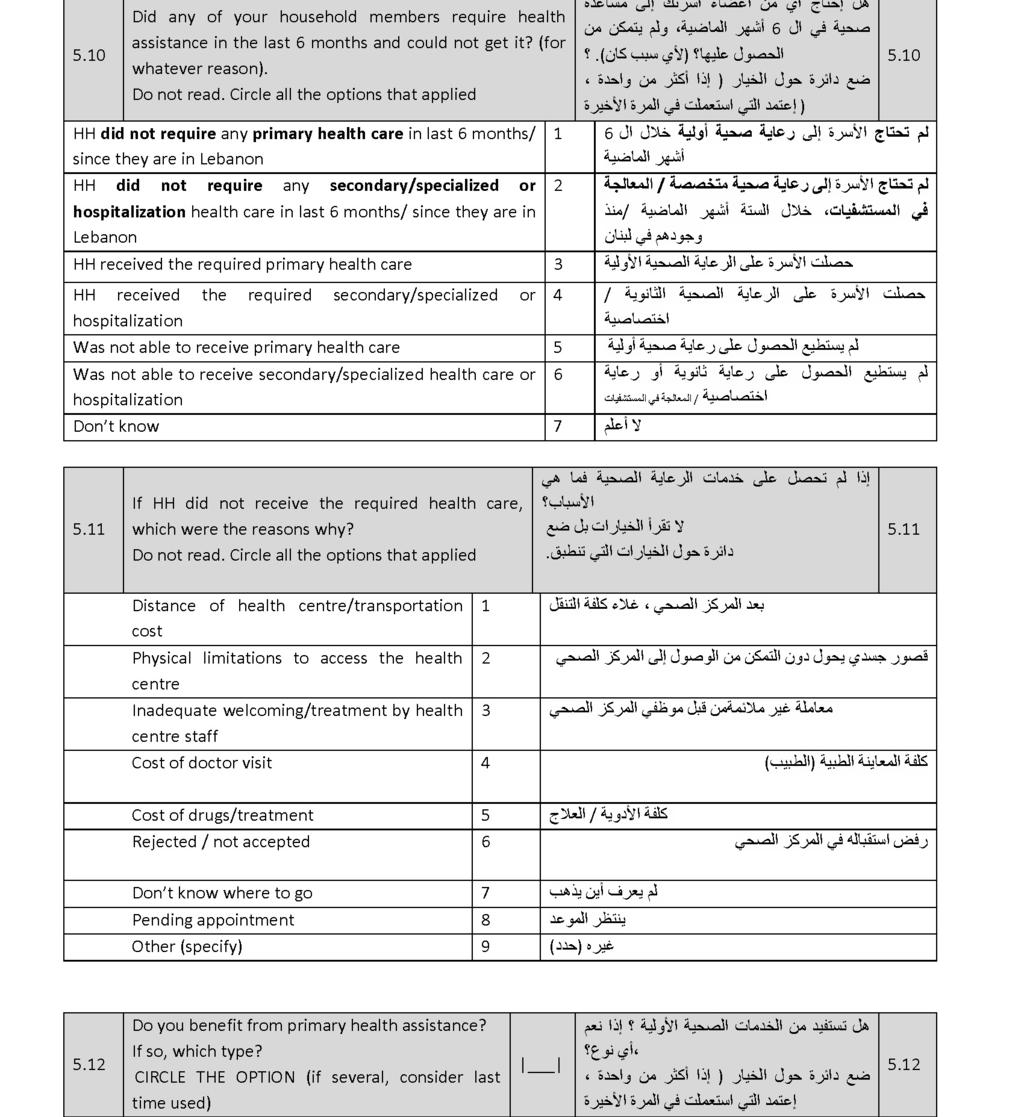

182 181
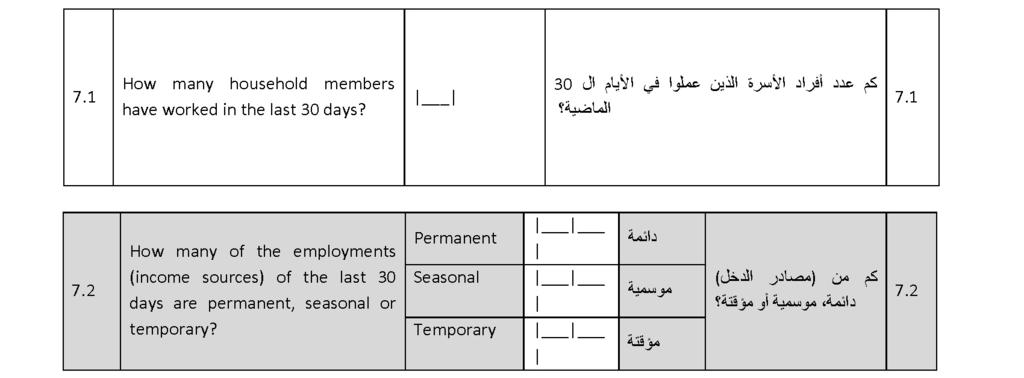
183 182
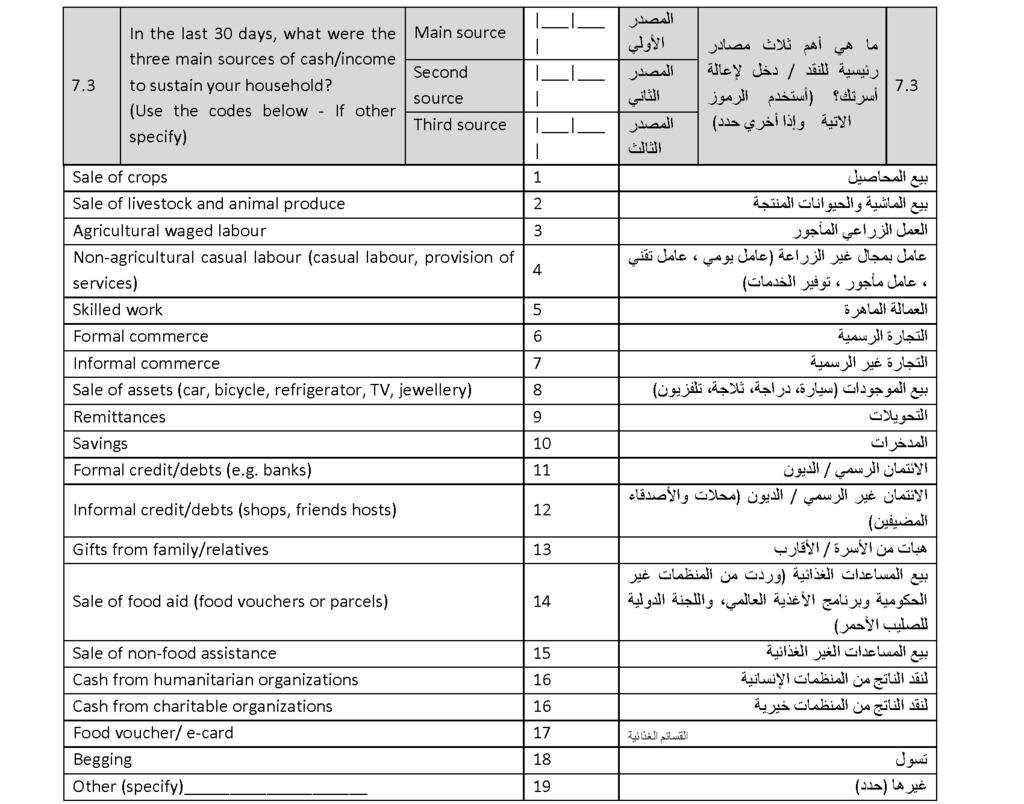

184 183
185 184
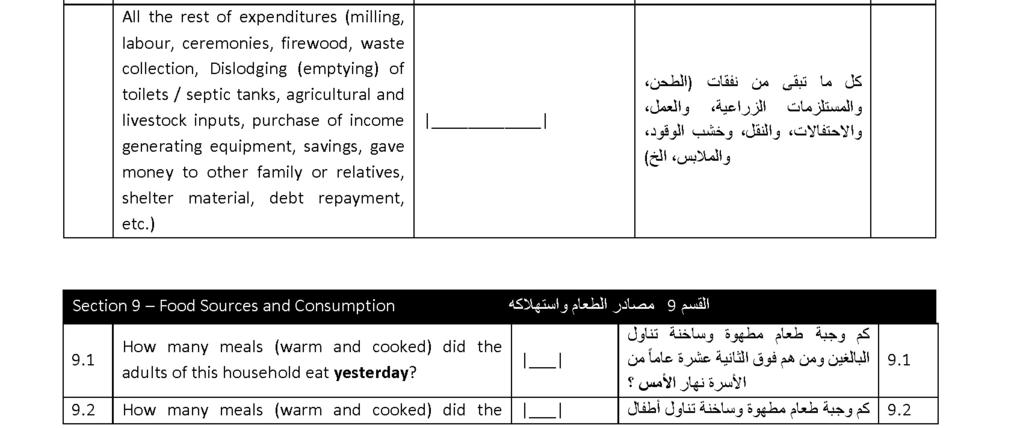
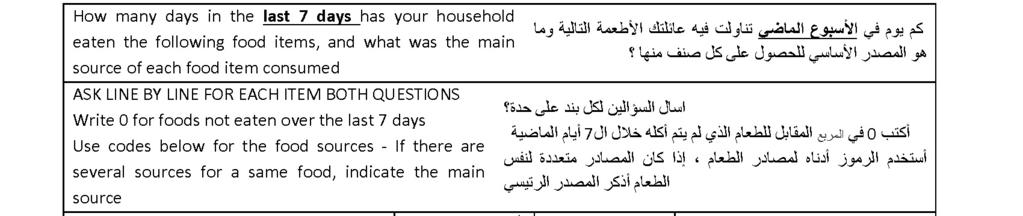
186 185
187 186
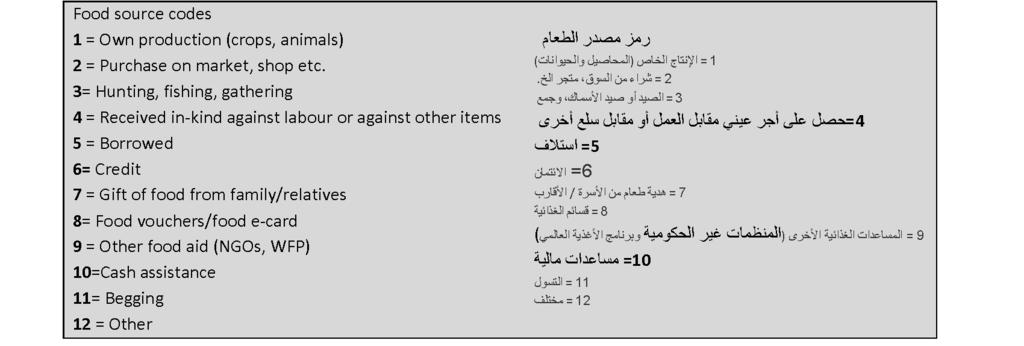

188 187
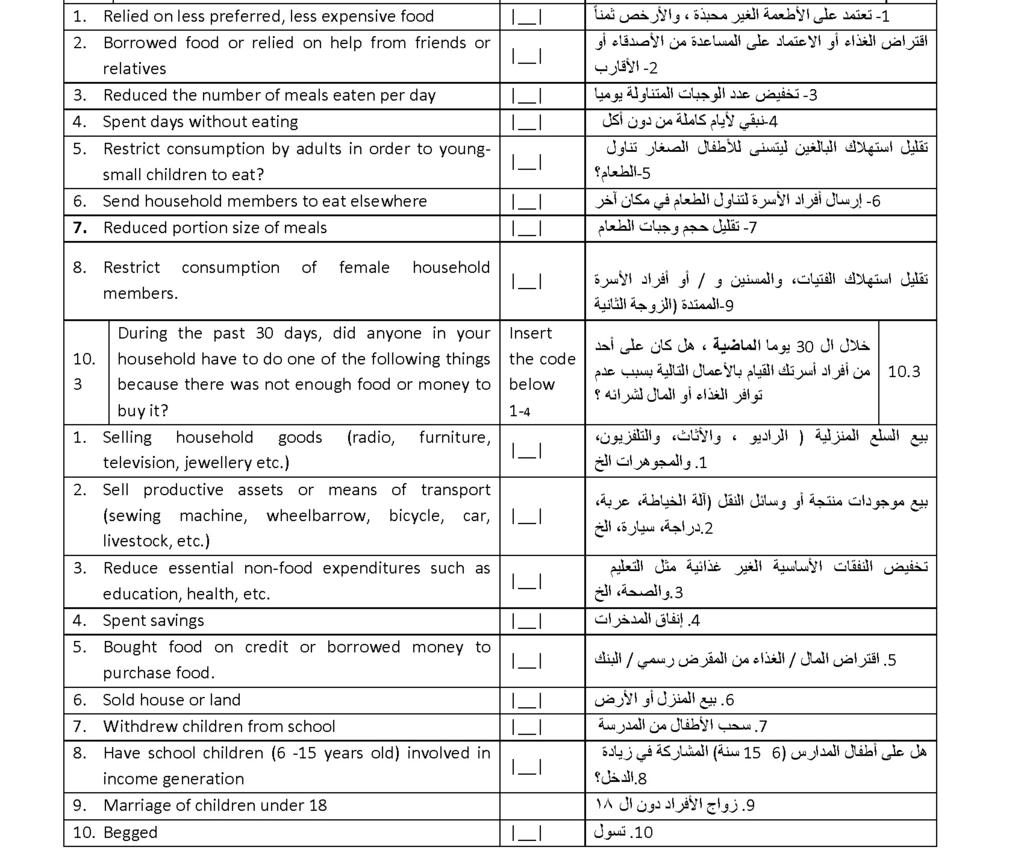

189 188
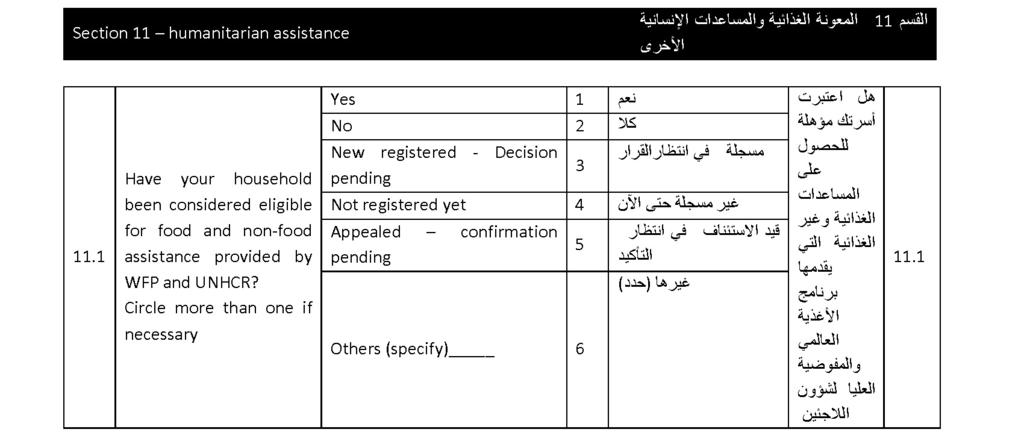
190 189
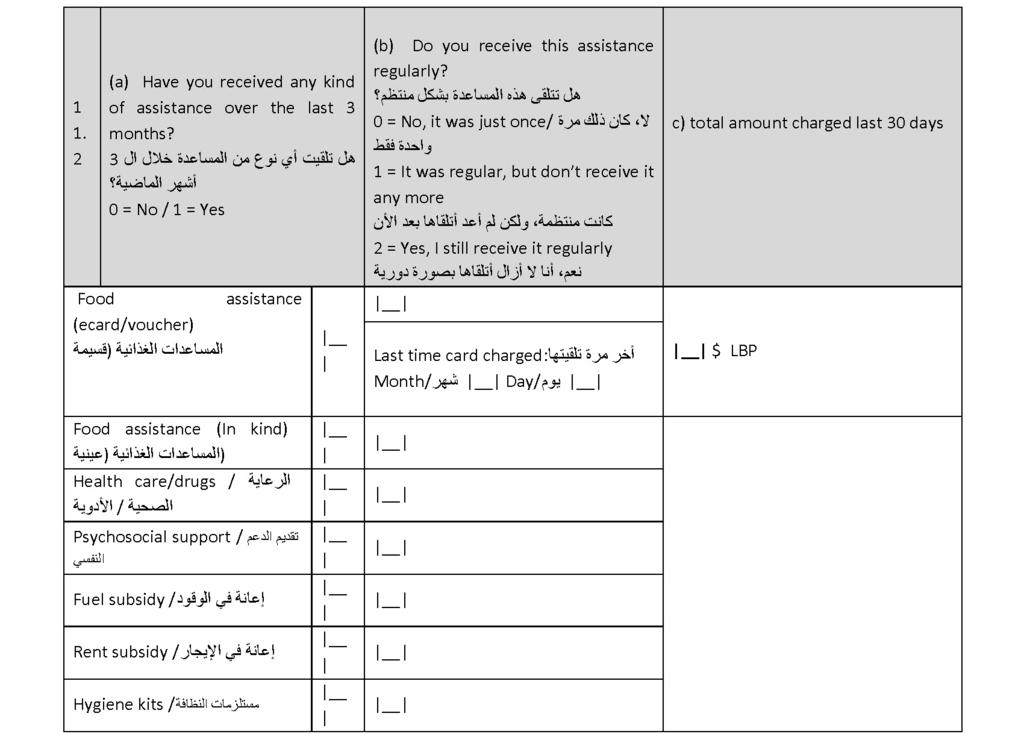
191 190
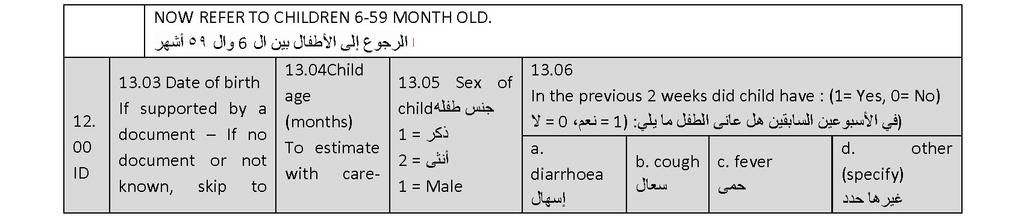

192 191
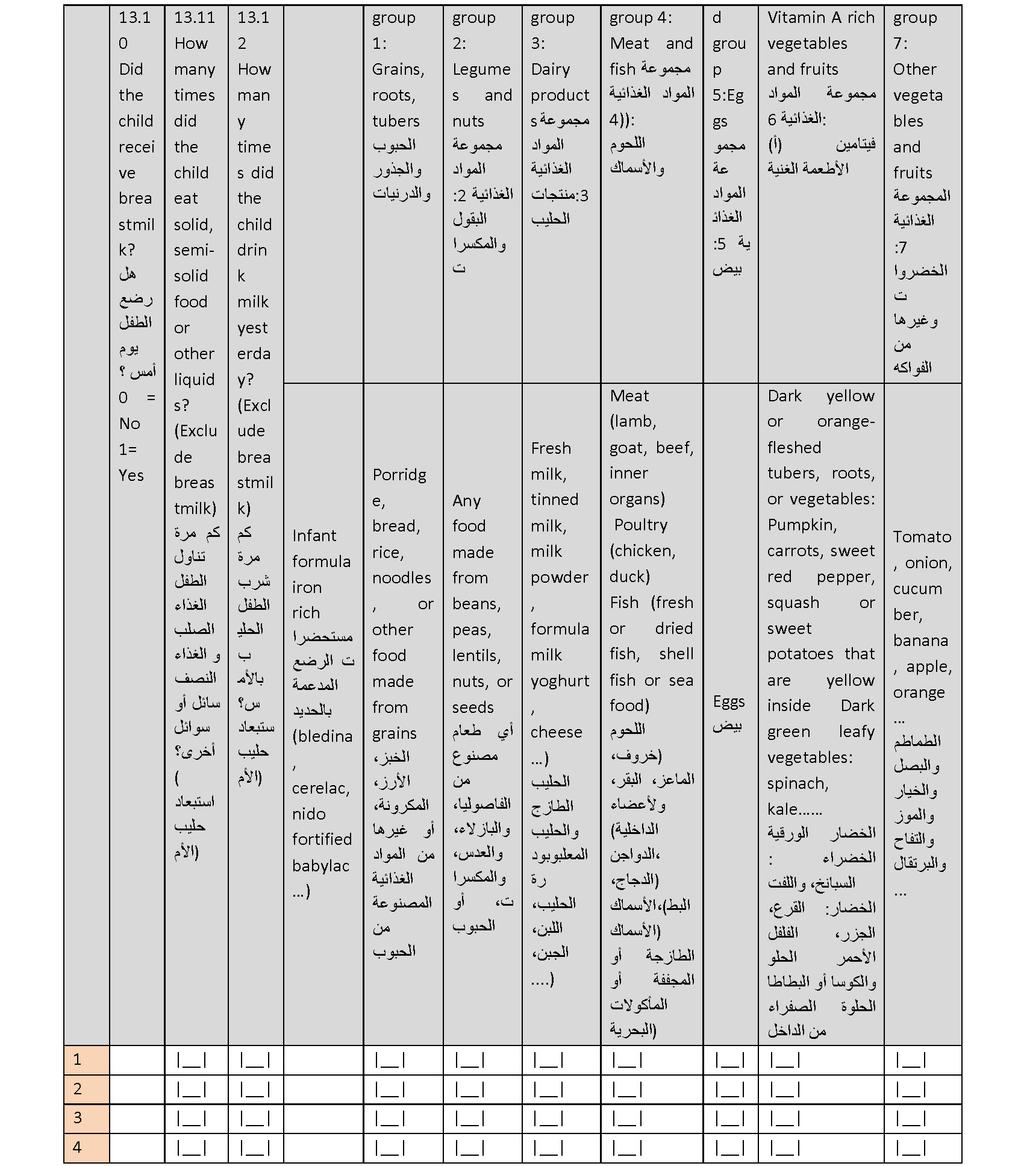
193 192
SYRIAN REFUGEE RESPONSE: Vulnerability Assessment of Syrian Refugees in Lebanon LEBANON HIGHLIGHTS OF THE SURVEY. August 8, 2014
 SYRIAN REFUGEE RESPONSE: Vulnerability Assessment of Syrian Refugees in Lebanon August 8, 2014 #FutureOfSyria Agencies and the Government of Lebanon had been requesting US$1.89 billion in the interagency
VASyR Vulnerability Assessment of Syrian Refugees. 27April 2016
 VASyR 2016 Vulnerability Assessment of Syrian Refugees 27April 2016 Contet X 102 23 April 2016: 1,055,984 Syrian refugees 11.7 % 23 April 2015: 1,196,560 Syrian refugees (11,319 pending registration) 22%
Acknowledgements. WFP is the world s largest humanitarian agency fighting hunger worldwide.
 Vulnerability Assessment of Syrian Refugees in Lebanon 2017 i Acknowledgements The Vulnerability Assessment for Syrian Refugees in Lebanon (VASyR-2017) was conducted jointly by the United Nations Children
PROFILING OF SYRIAN REFUGEES IN LEBANON 2015 SUMMARY REPORT
 PROFILING OF SYRIAN REFUGEES IN LEBANON 2015 SUMMARY REPORT ABOUT THIS REPORT This summary report highlights select findings from the full report Profiling of Syrian Refugees in Lebanon available on the
Vulnerability Assessment and Targeting of Syrian Refugees in Lebanon
 Vulnerability Assessment and Targeting of Syrian Refugees in Lebanon Susana Moreno Romero Food Security Expert; WFP Lebanon CO susana.moreno@wfp.org Introduction to stakeholders Beirut, April 2013 Background
From January to March 2015, WFP assisted 896,791 Syrian refugees, 11,972 new arrivals and 21,801 Palestine refugees from Syria.
 Quarter 1, January-March 2015 Regional Emergency Operation 200433- Syria crisis Lebanon Monitoring and Evaluation report, January-March 2015 Monitoring brief WFP conducts a range of monitoring and evaluation
The World Food Programme (WFP) Jordan FOOD SECURITY OUTCOME MONITORING (FSOM) Quarter 4 (Q4) 2016: Summary Report
 Jordan FOOD SECURITY OUTCOME MONITORING (FSOM) Quarter 4 (Q4) 2016: Summary Report") The World Food Programme (WFP) Jordan FOOD SECURITY OUTCOME MONITORING (FSOM) Quarter 4 (Q4) 26: Summary Report Quarter 4 (Q4) 26: Summary Report KEY FINDINGS: The food security situation has overall worsened
The World Food Programme (WFP) Jordan FOOD SECURITY OUTCOME MONITORING (FSOM) Quarter 4 (Q4) 26: Summary Report Quarter 4 (Q4) 26: Summary Report KEY FINDINGS: The food security situation has overall worsened
Vulnerability Assessment Framework
 Vulnerability Assessment Framework JORDAN RESPONSE PLAN Key findings June 2015 Developed under an interagency steering committee, including 5 NGOs, 5 UN agencies, BPRM and ECHO Refugees Outside of Camps
100% of individuals are registered as camp residents. 6% of households are headed by females. 38 years old: Average head of household age.
 Camp Profile - Roj Al-Hasakeh governorate, Syria November 2017 Management agency: Self management Registration actor: UNHCR Summary This profile provides a multisectoral needs overview and summarises the
16% 9% 13% 13% " " Services Storage Meters
 1+16+9+13+13 Camp Profile - Ein Issa Ar-Raqqa governorate, Syria November 2017 Management agency: Raqqa Civil Council (RCC) Registration actor: RCC, UNHCR Summary This profile provides a multisectoral
The World Food Programme (WFP) Jordan FOOD SECURITY OUTCOME MONITORING (FSOM) Quarter 3 (Q3) 2017: Summary Report
 Jordan FOOD SECURITY OUTCOME MONITORING (FSOM) Quarter 3 (Q3) 2017: Summary Report") The World Food Programme (WFP) Jordan FOOD SECURITY OUTCOME MONITORING (FSOM) KEY FINDINGS: Food consumption improved amongst Syrian refugee households in quarter 3 (Q3), for both WFP general food assistance
The World Food Programme (WFP) Jordan FOOD SECURITY OUTCOME MONITORING (FSOM) KEY FINDINGS: Food consumption improved amongst Syrian refugee households in quarter 3 (Q3), for both WFP general food assistance
SYRIAN HOUSEHOLDS IN JORDAN,
 SYRIAN HOUSEHOLDS IN JORDAN, THE KURDISTAN REGION OF IRAQ AND WITHIN SYRIA Regional Multi-Sector Analysis of Primary Data August 2014 CONTENTS SUMMARY... 2 Abbreviations and Acronyms... 4 Geographical
Première Urgence - Aide Médicale Internationale Rapid Assessment Report October 2012
 Première Urgence - Aide Médicale Internationale Rapid Assessment Report October 2012 Overview Since March 2011 and the continuously escalating crisis in Syria, Lebanon (along with Jordan, Iraq and Turkey)
16% 8% 11% 16% " " " " " " " " "
 1+16+8+11+16 Camp Profile - Mabruka Al-Hasakeh governorate, Syria November 2017 Management agency: UNCHR, Self administration Registration actor: UNHCR Summary This profile provides a multisectoral needs
RAPID NEED ASSESSMENT REPORT
 RAPID NEED ASSESSMENT REPORT Syrian Refugees Marj el Khokh Informal Camp Marjeyoun District, South Lebanon 3 rd of April 2013 AVSI Foundation EMERGENCY TEAM Jounieh Ghadir, Rue st. Fawka (Lebanon) Telefax:
EMERGENCY OPERATION ARMENIA
 EMERGENCY OPERATION ARMENIA 200558 Emergency food assistance to displaced population of Syrian Armenians Number of beneficiaries 5,000 Duration of project 1 July 2013 31 December 2013 (6 months) WFP food
Syria Crisis Regional Response M&E Updates. April-June 2014
 Syria Crisis Regional Response M&E Updates April-June Monitoring results from WFP Regional Emergency Operation 200433 Food assistance to vulnerable Syrian populations in Jordan, Lebanon, Iraq, Turkey,
122% 65+ years 1% 544% 0-2 years 5%
 +51A 49% +49A 51% Multi-Sector Needs Assessment - July 2018 Background and Methodology An estimated 723,000 Rohingya refugees have fled violence in Myanmar s Rakhine state since August 25, 2017 1. Most
VULNERABILITY STUDY IN KAKUMA CAMP
 EXECUTIVE BRIEF VULNERABILITY STUDY IN KAKUMA CAMP In September 2015, the World Food Programme (WFP) and the United Nations High Commissioner for Refugees (UNHCR) commissioned Kimetrica to undertake an
Main Findings. WFP Food Security Monitoring System (FSMS) West Darfur State. Round 10 (May 2011)
 West Darfur State. Round 10 (May 2011)") WFP Food Security Monitoring System (FSMS) Round 1 (May 11) West Darfur State Main Findings Data collection was carried out in May 11, which corresponds to the pre hunger season and all the sentinel sites
WFP Food Security Monitoring System (FSMS) Round 1 (May 11) West Darfur State Main Findings Data collection was carried out in May 11, which corresponds to the pre hunger season and all the sentinel sites
011% 65+ years 0% % years 14% 744% 0-2 years 7%
 +53A 47% +47A 53% Multi-Sector Needs Assessment - July 2018 Background and Methodology An estimated 723,000 Rohingya refugees have fled violence in Myanmar s Rakhine state since August 25, 2017 1. Most
133% 65+ years 1% % years 14% 544% 0-2 years 5%
 +59A 41% +50A 50% Multi-Sector Needs Assessment - July 2018 Background and Methodology An estimated 723,000 Rohingya refugees have fled violence in Myanmar s Rakhine state since August 25, 2017 1. Most
011% 65+ years 0% 666% 0-2 years 6%
 +58A 42% +42A 58% Multi-Sector Needs Assessment - July 2018 Background and Methodology An estimated 723,000 Rohingya refugees have fled violence in Myanmar s Rakhine state since August 25, 2017 1. Most
444% 0-2 years 4% Multi-Sector Needs Assessment - July W Demographics. Camp 23 / Shamlapur, Teknaf, Cox s Bazar, Bangladesh
 +53A 47% +43A 57% Multi-Sector Needs Assessment - July 2018 Background and Methodology An estimated 723,000 Rohingya refugees have fled violence in Myanmar s Rakhine state since August 25, 2017 1. Most
DEFINING COMMUNITY VULNERABILITIES
 DEFINING COMMUNITY VULNERABILITIES IN LEBANON LEBANON ASSESSMENT REPORT SEPTEMBER 2014 FEBRUARY 2015 12 Cover photo REACH, 2015 About REACH REACH is a joint initiative of two international non-governmental
FOOD ASSISTANCE PROJECT IN LEBANON
 FOOD ASSISTANCE PROJECT IN LEBANON Intervention Context / Background Rationale Five years since the beginning of Syria crisis, Lebanon is hosting an estimate of 2 million vulnerable Syrian refugees fleeing
REGIONAL QUARTERLY UPDATE: 3RP ACHIEVEMENTS DECEMBER 2017
 REGIONAL QUARTERLY UPDATE: 3RP ACHIEVEMENTS DECEMBER These dashboards reflect selected regional sectoral indicators on the humanitarian and resilience responses of more than 240 partners involved in the
RETURNEES AT RISK. Profiling Lebanese Returnees
 RETURNEES AT RISK Profiling Lebanese Returnees from THE Syrian Arab Republic Four Years into the Crisis 2015 RETURNEES AT RISK Profiling Lebanese Returnees from THE Syrian Arab Republic Four Years into
INTER-AGENCY MULTI-SECTOR NEEDS ASSESSMENT (MSNA) PHASE ONE REPORT
 PHASE ONE REPORT") INTER-AGENCY MULTI-SECTOR NEEDS ASSESSMENT (MSNA) PHASE ONE REPORT SECONDARY DATA REVIEW AND ANALYSIS MAY 2014 EXECUTIVE SUMMARY Aim of the Inter-Agency Multi-Sector Needs Assessment (MSNA), its structure
INTER-AGENCY MULTI-SECTOR NEEDS ASSESSMENT (MSNA) PHASE ONE REPORT SECONDARY DATA REVIEW AND ANALYSIS MAY 2014 EXECUTIVE SUMMARY Aim of the Inter-Agency Multi-Sector Needs Assessment (MSNA), its structure
Preliminary Job Information. General Information on the Mission
 JOB DESCRIPTION Job Title Country & Base of posting Reports to Duration of Mission Preliminary Job Information FIELD COORDINATOR LEBANON, BEIRUT BASE HEAD OF MISSION 12 months Context General Information
FOOD SECURITY AND OUTCOMES MONITORING REFUGEES OPERATION
 Highlights The yearly anthropometric survey in Kakuma was conducted in November with a Global Acute Malnutrition (GAM) rate of 11.4% among children less than 5 years of age. This is a deterioration compared
1,341, , million
 BASIC ASSISTANCE PEOPLE IN NEED PEOPLE TARGETED REQUIREMENTS (US$) 1,341,240 889,500 288.6 million # OF PARTNERS GENDER MARKER Humanitarian 29 Stabilization 1 Lead agencies: Ministry of Social Affairs
FOOD SECURITY MONITORING, TAJIKISTAN
 Fighting Hunger Worldwide BULLETIN February 2017 ISSUE 18 Tajikistan Food Security Monitoring Highlights The food security situation presents expected seasonal variation better in December after the harvest,
Findings of the Household Assessment of Syrian Households in Host Communities. Jarash Governorate. 7 th March 2013
 Geographical Scope / Depth of Data Findings of the Household Assessment of Syrian Households in Host Communities Jarash Governorate 7 th March 213 BACKGROUND The continued crisis in Syria has caused a
A PRECARIOUS EXISTENCE: THE SHELTER SITUATION OF REFUGEES FROM SYRIA IN NEIGHBOURING COUNTRIES
 A PRECARIOUS EXISTENCE: THE SHELTER SITUATION OF REFUGEES FROM SYRIA IN NEIGHBOURING COUNTRIES An upgraded shelter for a refugee family from Syria in Wadi Khaled, northern Lebanon June 2014 Contents Introduction
0% 18% 7% 11% 17% 93% Education % of children aged attending formal school
 0+18+7+11+17 Summary IDP Camp Profile - Al Hardania Management agency: IRD This profile provides an overview of conditions in Al Hardania camp. Primary data was collected through household surveys on 31/12/2017.
KAWEMPE I NEIGHBORHOOD PROFILE Urban community assessment Kampala, Uganda - July 2018
 KAWEMPE I NEIGHBORHOOD PROFILE Urban community assessment Kampala, Uganda - July 8 CONTEXT Surrounded by countries facing political instability, Uganda is the primary destination for refugees from South
1.1 million displaced people are currently in need of ongoing humanitarian assistance in KP and FATA.
 Pakistan: FATA Displacements Situation Report No. 1 (as of 21 May 2013) This report is produced by OCHA Pakistan in collaboration with humanitarian partners. It was issued by OCHA Pakistan. It covers the
150,000,000 9,300,000 6,500,000 4,100,000 4,300, ,000, Appeal Summary. Syria $68,137,610. Regional $81,828,836
 Syria Crisis IOM Appeal 2014 SYRIA HUMANITARIAN ASSISTANCE RESPONSE PLAN (SHARP) REGIONAL RESPONSE PLAN (RRP) 2014 9,300,000 Persons in need of humanitarian assistance in Syria 6,500,000 Internally Displaced
Vulnerability Assessment Framework
 Jordan Vulnerability Assessment Framework 7 Population Survey Report SECTOR VULNERABILITY REVIEW An overview of the socio-economic vulnerabilities of Syrian refugees residing amongst the Jordanian host
# of households: 719 Date opened: 9/28/2014 Occupied shelters: 1050 Planned shelters: 1100 Ongoing extension: no Camp area: 225,388m2
 IDP Camp Profile - Alwand 1 Management agency: Government and YAO Manager/Focal point: Mithaq Abdul Hamad Registration actor: YAO Organization Camp Overview Demographics This profile provides an overview
Inter Sectoral Meeting 5 February 2016
 Inter Sectoral Meeting 5 February 2016 AGENDA UNRWA situation update and priorities for sectors Real Time evaluation SGBV Analysis of partner targets and budgets of the LCRP Health analysis of service
Kakuma Refugee Camp: Household Vulnerability Study
 Kakuma Refugee Camp: Household Vulnerability Study Dr. Helen Guyatt Flavia Della Rosa Jenny Spencer Dr. Eric Nussbaumer Perry Muthoka Mehari Belachew Acknowledgements Commissioned by WFP, UNHCR and partners
LEBANON: Arsal Overview of Inter-Agency Response 15 November - 15 December 2013
 LEBANON: Arsal Overview of Inter-Agency Response 15 November - 15 December 2013 Refugee arrivals Figures of refugee arrivals were revised down slightly in early December in line with more accurate information
EU response to the Syrian crisis
 EU response to the Syrian crisis The allocation of the European Union and its 28 Member States has reached 4.4 billion in response to the conflict in Syria and its spill-over into neighbouring countries
Rapid Multi Sectoral Needs Assessment in Kukawa, Cross Kauwa and Doro Baga
 Rapid Multi Sectoral Needs Assessment in Kukawa, Cross Kauwa and Doro Baga November 2017 List of Contents Introduction and Methodology... 2 Main findings... 2 Kukawa... 2 Cross Kauwa... 4 Doro Baga...
Kenya Inter-agency Rapid Assessment Community Group Discussion
 Kenya Inter-agency Rapid Assessment Community Group Discussion General information G1. Take the GPS location G2. Name of the data collector G3. County G4. Sub-County G5. Ward G6. Location G7. Sub-location
PATHWAYS TO RESILIENCE: TRANSFORMING SYRIAN REFUGEE CAMPS INTO SELF-SUSTAINING SETTLEMENTS
 PATHWAYS TO RESILIENCE: TRANSFORMING SYRIAN REFUGEE CAMPS INTO SELF-SUSTAINING SETTLEMENTS FEASIBILITY STUDY FOR RESILIENCE-BUILDING IN SYRIAN REFUGEE CAMPS AND THEIR NEIGHBOURING HOST COMMUNITIES IN THE
SYRIAN REFUGEE RESPONSE: LEBANON INTER-AGENCY UPDATE
 SYRIAN REFUGEE RESPONSE: LEBANON INTER-AGENCY UPDATE 7 November 2014 LEBANON #FutureOfSyria Agencies and the Government of Lebanon had requested US$1.89 billion in the interagency funding appeal for 2014.
Fighting Hunger Worldwide. WFP Response to the Syria Crisis. Funding Appeal to the Kingdom of Saudi Arabia
 Fighting Hunger Worldwide WFP Response to the Syria Crisis Funding Appeal to the Kingdom of Saudi Arabia Emergency Food Assistance to Vulnerable Syrian Populations inside Syria and the Neighbouring Countries
REACH Situation Overview: Intentions and Needs in Eastern Aleppo City, Syria
 REACH Situation Overview: Intentions and Needs in Eastern Aleppo City, Syria 18 August 2016 INTRODUCTION Since the closure of Castello road in early July and the ensuing intensification of conflict in
DATE: [28/11/2016] CLOSING DATE AND TIME: [19/12/2016] 23:59 hrs CET
![DATE: [28/11/2016] CLOSING DATE AND TIME: [19/12/2016] 23:59 hrs CET](/thumbs/84/89155034.jpg "DATE: [28/11/2016] CLOSING DATE AND TIME: [19/12/2016] 23:59 hrs CET") _ DATE: [28/11/2016] REQUEST FOR EXPRESSION OF INTEREST: No. EOI OD-MENA-BA/ADMIN/2016/206 FOR THE PROVISION OF STUDY FOR DEEPER UNDERSTANDING OF THE COPING MECHANISMS OF SYRIAN REFUGEES CLOSING DATE AND
_ DATE: [28/11/2016] REQUEST FOR EXPRESSION OF INTEREST: No. EOI OD-MENA-BA/ADMIN/2016/206 FOR THE PROVISION OF STUDY FOR DEEPER UNDERSTANDING OF THE COPING MECHANISMS OF SYRIAN REFUGEES CLOSING DATE AND
KISENYI III NEIGHBORHOOD PROFILE Urban community assessment Kampala, Uganda - July 2018
 KISENYI III NEIGHBORHOOD PROFILE Urban community assessment Kampala, Uganda - July 8 CONTEXT Surrounded by countries facing political instability, Uganda is the primary destination for refugees from South
SUPPORTING DIGNIFIED CHOICES NRC cash-based NFI distribution in refugee camps in Jordan
 SUPPORTING DIGNIFIED CHOICES NRC cash-based NFI distribution in refugee camps in Jordan The Norwegian Refugee Council (NRC) in Jordan has directly assisted more than 360,000 vulnerable Syrian refugees
SYRIAN REFUGEE RESPONSE: LEBANON INTER-AGENCY UPDATE LEBANON
 SYRIAN REFUGEE RESPONSE: LEBANON INTER-AGENCY UPDATE October 18-25, 2013 #Syria FUNDING LEBANON 32 % funded $1.7 billion requested $530 million received as of 27 September HIGHLIGHTS OF THE WEEK More than
Inter Agency Meeting 4 September 2015
 Inter Agency Meeting 4 September 2015 AGENDA Protection update Cross-sectoral analysis of household visits Municipal coordination (UNDP) AOB AGENDA Protection update Cross-sectoral analysis of household
FACT SHEET # 3 20 JANUARY 2013
 Geographical Scope / Depth of Data FACT SHEET # 3 REACH ASSESSMENT OF SYRIAN REFUGEES IN HOST COMMUNITIES, SULAYMANIYAH GOVERNORATE, IRAQ 20 JANUARY 2013 BACKGROUND Of the over 793,597 Syrian refugees
Humanitarian Bulletin Lebanon
 Humanitarian Bulletin Lebanon Issue 29 1 August 31 October 2017 HIGHLIGHTS Vulnerability Assessment of Syrian Refugees results for 2017. Lebanon Humanitarian Fund holds a Donor Meeting to raise awareness
Findings of the Household Assessment of Syrian Households in Host Communities. Anbar Province, Iraq. 16 th of July 2013
 Findings of the Household Assessment of Syrian Households in Host Communities Anbar Province, Iraq 16 th of July 2013 BACKGROUND The ongoing crisis in Syria has caused a large influx of Syrian into Iraq,
Urgent gaps in delivering the 2018 Lebanon Crisis Response and key priorities at the start of 2018
 Urgent gaps in delivering the 2018 Lebanon Crisis Response and key priorities at the start of 2018 April 2018 Summary The 2018 Lebanon Crisis Response has secured US$ 251.3 million between January and
ERM Household Assessment Report AC28# assessments: 63 IDP HH assessment report in CCN district
 ERM Household Assessment Report AC28# assessments: 63 IDP HH assessment report in CCN district 1. General Information: Assessment Location: (Province/District/Village) Type of Crises: (Conflict/Natural
Area based community profile : Kabul, Afghanistan December 2017
 Area based community profile : Kabul, Afghanistan December 207 Funded by In collaboration with Implemented by Overview This area-based city profile details the main results and findings from an assessment
53% male / 6% female # of households: 208
 IDP Camp Profile - Al Nabi Younis Management agency: Baghdad overnorate Manager/Focal point: Hussein Shalash Taha Registration actor: Baghdad overnorate Camp Overview Demographics This profile provides
Fighting Hunger Worldwide HIGHLIGHTS/KEY PRIORITIES
 WFP s Response Inside Syria and in Neighbouring Countries: Jordan, Lebanon, Turkey, Iraq and Egypt Situation Report # 32 Reporting Period: 9-15 December 2012 Fighting Hunger Worldwide HIGHLIGHTS/KEY PRIORITIES
stateless, returnees and internally displaced people) identified and assisted more than 3,000 families.
 identified and assisted more than 3,000 families.") IRAQ Operational highlights Domestic and regional developments in 2013 continued to challenge UNHCR s programme in Iraq which notably saw a renewal in security concerns and the continuing arrival of refugees
IRAQ Operational highlights Domestic and regional developments in 2013 continued to challenge UNHCR s programme in Iraq which notably saw a renewal in security concerns and the continuing arrival of refugees
BWAISE II NEIGHBORHOOD PROFILE Urban community assessment Kampala, Uganda - July 2018
 BWAISE II NEIGHBORHOOD PROFILE Urban community assessment Kampala, Uganda - July 8 CONTEXT Surrounded by countries facing political instability, Uganda is the primary destination for refugees from South
MYANMAR KACHIN & NORTHERN SHAN STATES CAMP PROFILING ROUNDS 1-3 CROSS-CAMP AND TREND ANALYSIS REPORT
 MYANMAR KACHIN & NORTHERN SHAN STATES CAMP PROFILING ROUNDS 1-3 CROSS-CAMP AND TREND ANALYSIS REPORT 2013-2015 JANUARY 2016 ACKNOWLEDGEMENTS This report is a collaborative effort between the Shelter/NFI/CCCM
# of households: 723 Date opened: 10/10/2016 Occupied shelters: 873 Planned shelters: 1600 Ongoing extension: no Camp area: 511,837m2 14%
 IDP Camp Profile - Daquq Management agency: Manager/Focal point: Mahmud Faroq Shamil Registration actor: Camp Management Camp Overview Demographics This profile provides an overview of conditions in Daquq
Household Income and Expenditure Survey Methodology 2013 Workers Camps
 Household Income and Expenditure Survey Methodology 2013 Workers Camps 1 Content Introduction 3 Target community: 4 Survey geographical coverage: 4 Sampling method: 4 Survey variables: 5 Survey Questionnaires:
BASIC ASSISTANCE SECTOR
 LEBANON CRISIS RESPONSE PLAN - - Basic Assistance BASIC ASSISTANCE SECTOR PEOPLE IN NEED 2,241,000 PEOPLE TARGETED 1,276,000 REQUIREMENTS(US$) 571.5 million PARTNERS 571.5 million 42 GENDER MARKER 2a SECTOR
Humanitarian Situation Overview: Northern Hama
 SYRIA Humanitarian Situation Overview: Northern Hama Multi-Sectoral Trends Analysis (June - November 2017) January 2018 CCCM CLUSTER Cover Image: IDP camp in Syria, 2013. REACH About this report This report
A PRECARIOUS EXISTENCE: THE SHELTER SITUATION OF REFUGEES FROM SYRIA IN NEIGHBOURING COUNTRIES
 A PRECARIOUS EXISTENCE: THE SHELTER SITUATION OF REFUGEES FROM SYRIA IN NEIGHBOURING COUNTRIES An upgraded shelter for a refugee family from Syria in Wadi Khaled, northern Lebanon June 2014 Contents Introduction
EU response to the Syrian crisis
 EU response to the Syrian crisis S.Baldwin/UNHCR Delegation of the European Union to the Republic of 490 Harbour Drive bldg. Charles Helou av., Saifi - Beirut P.O.Box 11-4008 Riad el Solh Beirut 11072150
Rapid Nutritional Assessment for Children (6-59) Months of Age in Syrian Refuge Families in Al-Anbar Governorate/Al Qa im District.
 Months of Age in Syrian Refuge Families in Al-Anbar Governorate/Al Qa im District.") Rapid Nutritional Assessment for Children (6-59) Months of Age in Syrian Refuge Families in Al-Anbar Governorate/Al Qa im District. Ministry of Health-Nutrition Research Institute United Nation Children
Rapid Nutritional Assessment for Children (6-59) Months of Age in Syrian Refuge Families in Al-Anbar Governorate/Al Qa im District. Ministry of Health-Nutrition Research Institute United Nation Children
ÆÔ Æ. ÆÔ Camp Æ Informal Site. Camp and Informal Site Profiles
 Camp and Informal Site Profiles Northeast Syria March 2018 Background Throughout 2017, conflict in northeast Syria resulted in significant displacement of civilians and a deterioration in humanitarian
KISMAYO IDP SETTLEMENT ASSESSMENT SOMALIA
 KISMAYO IDP SETTLEMENT ASSESSMENT SOMALIA ASSESSMENT REPORT DECEMBER 2016 0 About REACH REACH is a joint initiative of two international non-governmental organizations - ACTED and IMPACT Initiatives -
WASH ASSESSMENT OF SYRIAN REFUGEE HOUSEHOLDS IN AKKAR GOVERNORATE
 WASH ASSESSMENT OF SYRIAN REFUGEE HOUSEHOLDS IN AKKAR GOVERNORATE LEBANON ASSESSMENT REPORT DECEMBER 2014 SUMMARY As the Syrian Crisis enters its fourth year, numerous water, sanitation, and hygiene (WASH)
Targeting in a National Social Safety Net Programme. WFP Turkey
 Targeting in a National Social Safety Net Programme WFP Turkey Emergency Social Safety Net Background EU funded nationwide assistance programme to refugees in Turkey Registration: Ministry of Interior
GENDER FACTS AND FIGURES URBAN NORTH WEST SOMALIA JUNE 2011
 GENDER FACTS AND FIGURES URBAN NORTH WEST SOMALIA JUNE 2011 Overview In November-December 2010, FSNAU and partners successfully piloted food security urban survey in five towns of the North West of Somalia
Lebanon. Lebanon: the largest per capita recipient of refugees in the world
 October 2014 Fighting Hunger Worldwide Is the Syrian crisis jeopardizing the economy and food security in Lebanon? Special Focus Lebanon The crisis in Syria now already in its third year has had an immense
THE WAGES OF WAR: How donors and NGOs can build upon the adaptations Syrians have made in the midst of war
 THE WAGES OF WAR: How donors and NGOs can build upon the adaptations Syrians have made in the midst of war FEBRUARY 2018 The scale of death and suffering in Syria is monumental. What began as a series
866, ,000 71,000
 Needs and Population Monitoring Cox s Bazar, Bangladesh NPM R7 REPORT December 2017 npmbangladesh@iom.int globaldtm.info/bangladesh Rohingya Population in Cox s Bazar, Bangladesh 866,000 655,000 71,000
1,500,000 Syrian refugees 1,500,000 Affected Lebanese 55,000 Palestine refugees from Syria 50,000 Lebanese returnees. USD 1.
 LEBANON: RRP6 Mid Term Review - OVERVIEW FOR 2014 USD 1.6 billion USD 1.51 billion USD 174 million POPULATIONS TARGETED 1,500,000 Syrian refugees 1,500,000 Affected Lebanese 55,000 Palestine refugees from
Site Assessment: Round 8
 IOM BANGLADESH Needs and Population Monitoring (NPM) Site Assessment: Round 8 Following an outbreak of violence on 25 August 2017 in Rakhine State, Myanmar, a new massive influx of Rohingya NPM refugees
ROHINGYA REFUGEE CRISIS Camp Settlement and Protection Profiling Cox s Bazar, Bangladesh Round 3
 ROHINGYA REFUGEE CRISIS Camp Settlement and Protection Profiling Cox s Bazar, Bangladesh Round 3 April 2018 UNHCR/Roger Arnold 1 Overview Upazila: Ukhiya Union: Palong Khali Introduction This profile provides
JOB DESCRIPTION. Preliminary job information PROTECTION COORDINATOR LEBANON, BEIRUT DEPUTY HOM/PROGRAM
 JOB DESCRIPTION Job Title Country and Base of posting Reports to Creation / Replacement (incl. name) Duration of Mission General information Context Preliminary job information PROTECTION COORDINATOR LEBANON,
PROTECTION RAPID NEED ASSESSMNET IN QARARAT AL-KATEF. PROTECTION RAPID NEED ASEESMENT Qararat al-qataf. PROTECTION SECTOR- LIBYA 28 February, 2018
 PROTECTION RAPID NEED ASEESMENT Qararat al-qataf PROTECTION SECTOR- LIBYA 28 February, 2018 BACKGROUND ON THE RETURN OF TAWARGHA On 26 December 2018, the Libyan Government of National Accord ratified an
% of IDP population living in camps that have been registered at the household level
 Key humanitarian indicators have been identified by global clusters and are available for use by country teams to create a composite and ongoing picture of the humanitarian situation. CCCM Indicators C1
Coordination of Afghan Relief (CoAR) Needs Assessment for Water, Sanitation and Hygiene of Pakistan Refugees and IDPs - Afghanistan
 Needs Assessment for Water, Sanitation and Hygiene of Pakistan Refugees and IDPs - Afghanistan") Coordination of Afghan Relief (CoAR) Needs Assessment for Water, Sanitation and Hygiene of Pakistan Refugees and IDPs - Afghanistan Submitted to: UNHCR Date: Contents 1. Introduction 1.1 Background 1.2
Coordination of Afghan Relief (CoAR) Needs Assessment for Water, Sanitation and Hygiene of Pakistan Refugees and IDPs - Afghanistan Submitted to: UNHCR Date: Contents 1. Introduction 1.1 Background 1.2
JOINT INITIAL ASSESSMENT GALGALA DISPLACED PEOPLE IN BARI AND SANAAG REGIONS.
 JOINT INITIAL ASSESSMENT GALGALA DISPLACED PEOPLE IN BARI AND SANAAG REGIONS. Date: 08 March 2015 Some of the new displaced people living outs tricks of Buraan village 1 P a g e General context In August,
Supporting Livelihoods in Azraq Refugee Camp
 Supporting Livelihoods in Azraq Refugee Camp A preliminary evaluation of the livelihood and psychological impacts of the IBV scheme in Azraq Refugee Camp, Jordan JULY 2017 Danish Refugee Council Jordan
EASTERN SUDAN FOOD SECURITY MONITORING
 EASTERN SUDAN FOOD SECURITY MONITORING KASSALA STATE, ROUND 1 JULY 2010 Highlights Round 1 of the FSMS in was carried out at the peak of the lean season. The food security situation in the urban and rural
Evaluation Terms of Reference
 Evaluation Terms of Reference Refugee Crisis Response Program (BRCRP) Myanmar-Bangladesh Refugee Crisis Protection Project II November 2018-11-13 Project # B210368 World Vision Bangladesh Published October
REGIONAL WINTER ASSISTANCE PROGRESS REPORT
 REGIONAL WINTER ASSISTANCE PROGRESS REPORT : Syria and Iraq Situation 1 Sep - 1 October 2015 (In Egypt, Iraq, Jordan, Lebanon, Syria and Turkey) Lebanon, 4 month year old baby and mother from Syrian refugee
MALAWI FLOOD RESPONSE Displacement Tracking Matrix Round III Report May 2015
 MALAWI FLOOD RESPONSE Displacement Tracking Matrix Round III Report May 2015 CONTACT Director of DoDMA: James Chiusiwa chiusiwaj@yahoo.com +265 (0) 999 937 952IOM DTM Project Officer: Brenda Chimenya bchimenya@iom.int
Did you sleep here last night? The impact of the household definition in sample surveys: a Tanzanian case study.
 Did you sleep here last night? The impact of the household definition in sample surveys: a Tanzanian case study. Tiziana Leone, LSE Ernestina Coast, LSE Sara Randall, UCL Abstract Household sample surveys
MULTI-SECTOR NEEDS ASSESSMENT OF SYRIAN REFUGEES IN CAMPS
 MULTI-SECTOR NEEDS ASSESSMENT OF SYRIAN REFUGEES IN CAMPS KURDISTAN REGION OF IRAQ ASSESSMENT REPORT SEPTEMBER 2014 SUMMARY As of 15 July 2014, according to the latest estimated from the United Nations
How urban Syrian refugees, vulnerable Jordanians and other refugees in Jordan are being impacted by the Syria crisis A SUMMARY
 7YEARS INTO EXILE How urban Syrian refugees, vulnerable Jordanians and other refugees in Jordan are being impacted by the Syria crisis A SUMMARY CARE INTERNATIONAL IN JORDAN AMMAN, JUNE 2017 CARE International
MULTI-SECTOR NEEDS ASSESSMENT OF SYRIAN REFUGEES OUTSIDE CAMPS KURDISTAN REGION OF IRAQ
 MULTI-SECTOR NEEDS ASSESSMENT OF SYRIAN REFUGEES OUTSIDE CAMPS KURDISTAN REGION OF IRAQ ASSESSMENT REPORT SEPTEMBER 2014 SUMMARY According to the UNHCR s latest estimates, more than 212,000 Syrian refugees
East Africa Hunger Crisis East Africa Hunger Crisis Emergency Response Emergency Response Mid-2017 Updated Appeal Mid-2017 Appeal
 ETHIOPIA SOUTH SUDAN East Africa Hunger Crisis East Africa Hunger Crisis Emergency Response Emergency Response Mid-2017 Updated Appeal Mid-2017 Appeal KEY MESSAGES Deteriorating security situation: All