State of Working Pennsylvania 2018
|
|
|
- Cora Powers
- 5 years ago
- Views:
Transcription

1 State of Working Pennsylvania 2018 August 2018 by Mark Price and Stephen Herzenberg
2 The Keystone Research Center (KRC) was founded in 1996 to broaden public discussion on strategies to achieve a more prosperous and equitable Pennsylvania economy. Since its creation, KRC has become a leading source of independent analysis of Pennsylvania s economy and public policy. KRC is located at 412 North Third Street, Harrisburg, Pennsylvania Most of KRC s original research is available on the KRC website at KRC welcomes questions or other inquiries about its work at About the Authors Mark Price, KRC s labor economist and research director, holds a PhD in economics from the University of Utah. He is a coauthor of The New Gilded Age: Income inequality in the U.S. by state, metropolitan area, and county, published in 2016 by the Economic Analysis Research Network (EARN). Stephen Herzenberg, KRC s executive director, holds a PhD in economics from MIT. He is a coauthor of Losing Ground in Early Childhood Education, published in 2005 by the Economic Policy Institute (EPI), and New Rules for a New Economy: Employment and Opportunity in Postindustrial America, published in 1998 by Cornell/ILR Press. Acknowledgments The authors thank the team at EPI, which provides support to KRC and the other state think tanks within EARN; this team includes, Naomi Walker, David Cooper, and Janelle Jones. Thanks to Estelle Sommeiller of the Institute for Research in Economic and Social Sciences (IRES) for her work to update the state by state top income series. Thanks to John Neurohr, communications director for KRC and its Pennsylvania Budget and Policy Center (PBPC) and Erica K Freeman, deputy communications director, for editorial assistance and guidance, and to Stephanie Frank, KRC office manager, for generating the charts, figures and cover for this report. Support KRC The work of KRC is supported by grants from charitable foundations, research contracts with various organizations (including local, state, and federal governments), and contributions from organizations and individuals who share KRC s vision of broadly shared prosperity in Pennsylvania. To learn how you or your organization can support KRC, please visit the KRC website at org or call The IRS has designated KRC as a federal tax exempt, nonprofit, 501(c)(3) corporation. KRC is also registered as a charitable organization with the Pennsylvania Department of State s Bureau of Charitable Organizations. KRC s official registration and financial information may be obtained from the Pennsylvania Department of State by calling toll free, within Pennsylvania, Registration does not imply endorsement.
3 Contents Executive Summary... 2 The State of the Pennsylvania Economy... 4 Unemployment, Underemployment, and Employment Rates... 5 Wage Growth in the Last 12 Months... 7 Personal Income Tax Collections in the Last 12 Months... 7 Wage Growth in the Last 10 Years... 8 Wage Growth in the Last 17 Years... 9 Productivity and Compensation Growth in Pennsylvania since Top Incomes 1917 to The Erosion of Bargaining Power for Pennsylvania Workers Conclusion Page 1
4 Executive Summary The State of Working Pennsylvania 2018, Keystone Research Center s 23rd annual review of the Pennsylvania economy and labor market finds that, nearly a decade into the current national economic expansion, many Pennsylvania workers are still waiting for a raise. The report points to three factors that help explain this. First, despite low unemployment, some slack remains in the job market. Second, employers led by giant service-sector employers of millions of lowwage workers ruthlessly use their market power over workers to repress wages. Third, national and state public policies, shaped by legislatures with Republican majorities and federal courts (including the Supreme Court) dominated by conservative justices, push mostly in the wrong direction. They keep rigging the economy further against ordinary workers. Where Pennsylvania s current governor and attorney general have authority to act independently they have sought to lift wages. Faster and greater progress in Pennsylvania requires state lawmakers to row in the same direction. The Pennsylvania economy has grown steadily since the current economic recovery began in the middle of Non-farm employment now exceeds the level in early 2010 by 8%. Unemployment has fallen to less than half its post-recession peak 4.2% in July Yet Pennsylvania workers wages remain stubbornly unmoved by steady economic growth. Wages for workers throughout most of the Pennsylvania wage distribution fell in the 12 months ending in June Over the past decade, wages have also fallen for most of the bottom 60% of Pennsylvania workers. Meanwhile, top 1% incomes, which took a dive with the stock market crash in and after the Great Recession, are back on the fast track. Top 1% earners took home one-third of the increase in Pennsylvania income from (the latest period for which these data are available). And Pennsylvania income other than typical wages and salaries ( non-withholding income ), which goes mostly to high earners (e.g., dividends, capital gains, and profits) increased a robust 7.8% in the last 12 months (i.e., the fiscal year ending in June 2018). Our three-part explanation for why wages remain stagnant starts with labor market slack. One broad measure of such slack underemployment includes, in addition to the unemployed, part-time workers who want full-time work and discouraged workers who want jobs but have given up looking. Underemployment remains slightly higher today than at its highest level after the recession following the burst of the dot.com stock market bubble in the early 2000s. Underemployment also remains substantially higher than its lowest level before the Great Recession (9.4% versus 7.9%). And the employment-to-population ratio for Pennsylvanians aged 16 and over is well below the 2007 level (59.4% versus 61.7%). A second reason that wages remain stagnant is that the market power of employers, including giant service corporations that together employ millions of low- and moderate-wage workers: H&R Block, McDonald s and other fast food companies, and the like. Within their franchisees, many such companies use non-compete agreements promises not to poach each other s workers to short-circuit competition for workers. Therefore, wages become less responsive to low unemployment in a tight labor market. Page 2
5 A third reason: public policy. Lawmakers in every surrounding state have increased their state minimum wage. Pennsylvania lawmakers have not. At the federal level, in June 2018 the U.S. Supreme Court reversed a longstanding policy and eliminated the contributions that public sector unions previously received from non-members those unions represent. This aims to weaken unions ability to bargain for higher wages and benefits for public workers, as well as their ability to push for policies that raise the wages of private workers (e.g., via a higher minimum wage or high construction worker wages on publicly funded jobs). Eager to kick Pennsylvania workers when they are down, some Pennsylvania lawmakers have jumped in the wake of this U.S. Supreme Court decision with state proposals aimed at maximizing its negative impact on union resources. In sum, state policies that we summarized in State of Working Pennsylvania 2016 as The Agenda to Lower Pennsylvania s Pay remain influential with the majority caucus in the legislature. So far, these lawmakers must be considered successful: many of their constituents have inflation adjusted earnings that remain lower than wages for their counterparts 10 years ago. Governor Wolf, while blocked in his efforts to raise the state minimum wage, has submitted a formal notice of proposed rulemaking to increase the threshold below which all Pennsylvania salaried workers receive overtime pay. And Attorney General Josh Shapiro has spearheaded an effort by attorneys general across many states to get companies to stop using non-compete agreements with lower-wage workers. In 2019 and beyond, a return to broadly shared prosperity requires Pennsylvania lawmakers to enact a more comprehensive agenda to raise the wages of incomes of Pennsylvania workers, such as the ones outlined in our Agenda to Raise Pennsylvania s Pay in the We the People Pennsylvania agenda online at Page 3
. This rate of growth is in line with the 1.8% rate of growth in 2017 and just above the rate of growth in our wider region (defined here to include Delaware, D.")
6 The State of the Pennsylvania Economy Gross Domestic Product, the Figure 1 broadest measure of economic activity in Pennsylvania, grew at an annualized rate of 2% in the first quarter of 2018 (the most recent quarter of data available). This rate of growth is in line with the 1.8% rate of growth in 2017 and just above the rate of growth in our wider region (defined here to include Delaware, D.C., Maryland, New Jersey, New York, Ohio, and West Virginia) where Gross Domestic Product grew at an annual rate of 1.8% in the first quarter of Shifting our focus to Figure 2 employment, the number of workers on the payrolls of nonfarm businesses (based on data from employers) the standard source relied on to measure job growth expanded by an average of 3,843 jobs per month in the first seven months of An alternative measure of employment, resident employment measured by a survey of some households moved in the opposite direction, falling 793 jobs a month through this July. The growth of nonfarm payrolls and resident employment occasionally diverge over short periods; over longer periods the two measures of employment growth tend to produce similar trends. Looking across the region, the divergence in non-farm and resident employment growth is also present since 2016 with non-farm payrolls growing in the region by 3% (over the same period they grew 2.7% in Pennsylvania) while resident employment grew by just 1% in the region. (In Pennsylvania, resident employment fell 0.2% over this period.) Overall, the growth in both Gross Domestic Product and employment in Pennsylvania can be characterized as healthy and consistent with an economy that s expanding. We now turn our attention to labor market statistics that track the underutilization of labor so that we might assess the extent to which the Pennsylvania economy is near full employment. Page 4
7 Unemployment, Underemployment, and Employment Rates According to the National Figure 3 Bureau of Economic Research 1, the Great Recession ended officially in June 2009, but resident employment and non-farm payrolls didn t begin to rise steadily until early 2010 and it s in early 2010 that the unemployment rate in Pennsylvania peaked at 8.8%. Eight years later, the unemployment rate has fallen by just over half to 4.2% this July (Figure 3), its lowest level since 2007 (Figure 4). The unemployment rate throughout the region was 4.4% this July. Looking back at the peak of the last four economic expansions, the unemployment rate in Pennsylvania reached a low of 4.5% in February 1989, 4% in February 2000, and 4.2% in February As of this July, the unemployment rate is at or within three tenths of a percentage point of these previous lows. Figure 4 A broader measure of the underutilization of labor, the underemployment rate (see Box 1 for a definition) provides Box 1: The Underemployment Rate The use of the term underemployment sometimes invokes the idea of workers with a specialized skill or degree working in lower-paying jobs that don't require skills or a degree. The underemployment rate as used here (and as defined by the Bureau of Labor Statistics) doesn t capture whether skills are being fully utilized. It does capture people we traditionally think of as unemployed plus three other groups: those that have looked for work recently (previous four weeks) but can t find it; discouraged workers people not considered unemployed because they haven t looked for work in the previous four weeks but who are ready and willing to work (and have looked for work within the last year); and workers who want full-time work but can t find it and so work part-time. The third group is the biggest of the three other groups. Page 5
8 evidence that although the official unemployment rate is near historic lows there is still some lingering slack in the Pennsylvania labor market. Figure 5 The underemployment rate has improved substantially since it peaked at 14.7% in Despite this, at 9.4% the underemployment rate today remains just above the 9.3% peak in 2002, following the dot.com recession of 2001 and one-and-a-half percentage points above the level before the Great Recession. 2 The final metric to evaluate whether the economy is near full employment is the employment rate or the percentage of the population with a job (Figure 5). At 59.4% the employment rate in Pennsylvania remains 2.3 percentage points below its pre-recession (2007) peak. Employment rates for workers 55 and older have surpassed their pre-recession peaks (Table 1). But for prime-age workers in Pennsylvania, the employment rate at 79.1% remains 1.4 percentage points below its prerecession peak. Fewer people in the total population working relative to previous years, especially among prime-age workers, demonstrates that the economy has yet to fully utilize the potential universe of employable workers that it had been using before the start of the Great Recession. If the overall employment rate in 2017 was 61.7% (its 2007 level) there would be 240,000 more employed workers in Pennsylvania. This persistent slack in the labor market has important implication for workers: it translates into less upward pressure than there might otherwise be on wage levels. When employers can t fill job openings or fail to receive enough job applications they will have to raise the wage they offer to entice workers to apply. With less upward pressure on wages, workers overall will see less income growth. Critically, it s this process during economic expansions that allows workers to see meaningful improvements in their standard of living. Let us now turn our attention to trends in wages over time in Pennsylvania. Table 1. The percentage of the population with a job in Pennsylvania and throughout the region, 2007 and 2017 Category Pennsylvania Percentage Point Difference Region¹ Percentage Point Difference All 61.7% 59.4% -2.3% 62.0% 59.6% -2.4% % 54.0% -0.5% 48.6% 47.0% -1.6% % 79.1% -1.4% 79.6% 78.6% -1.0% 55 and over 36.2% 38.7% 2.4% 37.9% 39.0% 1.1% ¹Delaware, District of Columbia, Maryland, New Jersey, New York, Ohio, and West Virginia Source: Keystone Research Center based on Current Population Survey data Page 6
9 Wage Growth in the Last 12 Months The economic data on output Figure 6 and employment in Pennsylvania illustrates an economy that is growing but has yet to reach its full potential. Turning our attention to hourly earnings in the 12 months ending this June we find that wages fell for most workers in Pennsylvania and across our region. Median wages at $18.24 per hour in the 12-month period from July 2017 to June 2018 were down in Pennsylvania by 18 cents or 1% from the previous year (Table 2). In marginally better news, hourly wages for the lowest-paid workers, those at the 10th percentile at $9.51 per hour were up in the last 12 months by 4 cents. Wages also rose to $11.42 for the 20th percentile, by a single cent per hour. The only other group of workers to see a wage increase in the last 12 months were those at the 70th percentile where hourly wages rose 21 cents (an increase of 0.8%) to $ The underemployment and employment rate data summarized so far suggests the presence of labor market slack in Pennsylvania that is depressing wage growth. Still, the inflation adjusted decline in hourly earnings for most workers in the past 12 months is startling, especially considering the fiscal stimulus injected into the economy over the last eight months. The Congressional Budget Office projects the federal deficit will rise from 3.5% to 4% of GDP in 2018 (an increase in the deficit of $139 billion over 2017). 3 Economic forecasters are expecting this fiscal stimulus from the Tax Cuts and Jobs Act (TCJA) to boost GDP growth. However, the distribution of the benefits of the TCJA are also widely expected to be skewed toward families with the highest incomes. Here in Pennsylvania, the Institute on Taxation and Economic Policy (ITEP) estimates the top 5% of Pennsylvania taxpayers, those earning $225,900 or more, will capture 51% of the benefits of the TCJA this year (2018). 4 The early returns on hourly wages summarized above point to the so-far limited impact of this poorly targeted fiscal stimulus on wage growth. Personal Income Tax Collections in the Last 12 Months Pennsylvania personal income tax collections also provide some limited information about the distribution of income growth in the wake of the TCJA. 5 In the fiscal year, Pennsylvania personal income tax withholding, which captures income from wages and salaries, grew by 2.1% after adjusting for inflation. In contrast, personal income tax collections on non-withholding income (i.e., income other than wages and salaries such as income from profits, dividends, and capital gains, which goes mostly to upper-income Pennsylvanians) grew after adjusting for inflation by 7.8% in the last 12 months. 6 Page 7
10 While taxpayers with incomes of $250,000 or higher account for just 2.8% of taxpayers, they capture about two-thirds of non-withholding income. While it will be another two years (Summer 2020) before tax data by income will be released, allowing a more precise analysis of the distribution of income growth in Pennsylvania, the early returns point to rapid growth for the top 1% of families and stagnant or falling wages for most other workers. 7 Wage Growth in the Last 10 Years Figure 7 As the business cycle ages, yearly wage trends like those summarized in the previous section are usually positive, reflecting the cumulative impact of job growth and rising employment rates. As more people become employed, and as unemployment and underemployment rates fall, more employers boost wages to drive up applications for their openings. This points to a key challenge for workers: there need to be enough good years of wage growth in the latter part of an expansion to make up for wage declines in recessions from job loss and the slow growth of wages relative to inflation for workers that keep their jobs during and shortly following a recession. Figure 7 illustrates that hourly wages for the bottom 60% of Pennsylvania workers (those earning less than $21.30 an hour in the last 12 months) remain lower today than they were 10 years ago. Pennsylvania workers have yet some distance to travel to fully recover from the Great Recession. Page 8
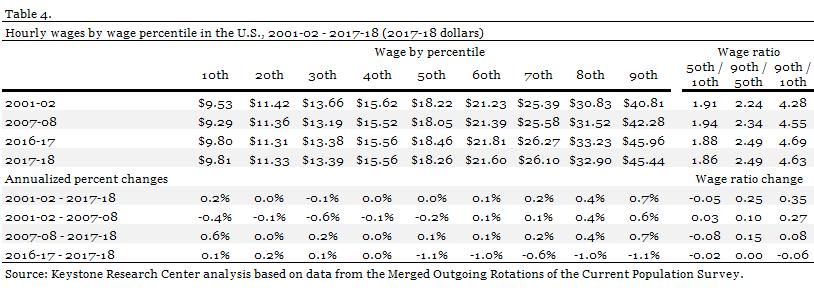
11 Throughout the region, wage growth in the last 10 years in other states has been better than in Pennsylvania for all workers except those at the very top (90th percentile). Although regional wage growth was more broadly positive, the pattern of growth is similar to Pennsylvania s, with growth improving as you move to higher percentiles. The one exception to this pattern is wages at the 10th percentile, which in the region have grown faster, up 5 cents a year, (an average annual increase of 0.6%) a trend that reflects, in part, rising minimum wages throughout the region except in Pennsylvania. Wage Growth in the Last 17 Years Figure 8 Looking back 17 years, real wages remain lower today than they were in for the bottom half of Pennsylvania workers. Positive wage growth for workers in the top 40% translated into rising wage inequality in Pennsylvania. (See the final three columns of Table 2 on the next page.) Josh Bivens and Ben Zipperer of the Economic Policy Institute find that the unemployment rate necessary to generate real wage growth for the typical worker has steadily declined since 1973, a fact which they attribute to decline of worker bargaining power. See their paper The Importance of locking in full employment for the long haul at to learn more about the relationship between unemployment rates and wage growth for low-wage workers, the racial employment gap and monetary policy. Page 9


12 Page 10
13 Productivity and Compensation Growth in Pennsylvania since 1979 Since 1979, median hourly compensation (wages plus benefits) has grown 10.1% to $ Over the same period, productivity has grown 77.6% or more than seven times as much. This growing wedge between median compensation and productivity in Pennsylvania is a key driver of the sharp increase in family incomes at the top of the income distribution in the Commonwealth. We now turn our attention to the growth of incomes at the top. Figure 9 This July, Keystone Research Center s executive director Stephen Herzenberg and his coauthor Jonathan White issued a report: Democracy in Pennsylvania. The report found that Pennsylvania s democracy is not healthy, as measured by the amount of money in politics, electoral competition (do voters have choices in primary and general elections?), political participation (e.g. voter turnout), and confidence in government. The report also concluded that the citizens of Pennsylvania still have the power to revitalize their democracy. Read more about the opportunity to reverse Pennsylvania s drift towards oligarchy at Page 11

14 Top Incomes 1917 to 2015 The wage trends discussed so far are drawn from a survey of households that for a variety of technical reasons tend to understate top incomes. 8 For better data on the highest earners, we rely on estimates of top incomes based on tax data published by the Internal Revenue Service. 9 As we discussed when examining wage trends, the growth in incomes tends to be more broadly distributed as the economic expansion ages: as the labor market gets closer to full employment, the pressure on employers to raise wages increases. Of course, the rising tide of economic activity also pushes up other non-wage income like dividends, rents, and capital gains. Figure 10 illustrates that in more recent economic expansions, the top 1% in Pennsylvania have received a rising share of total income growth. During the five economic expansions between 1945 and 1970, the top 1% captured less than 11% of income growth with the remainder flowing to the bottom 99%. Starting in the late 70s, the top 1% s take of income growth during expansions has steadily increased from 21% to 42.5% in the expansion from 2001 to So far, in the current expansion (2009 to 2015), the top 1% has taken home 33.3% of all income growth. Figure 10 Figure 11 In 2015, the average income of the top 1% of families in Pennsylvania (a group that includes 67,993 families) was $1.1 million with the threshold for entering the top 1% of $388,593. The average income of the top 0.01% of families (a group that includes 679 Pennsylvania families) was $24.2 million. See a national report by Keystone Research Center labor economist Mark Price and French economist Estelle Sommeiller on top incomes all across the country at Page 12

15 Why does the uneven split of income growth matter? As a disproportionately large share of growth is captured by the top 1% during expansions their total share of all income will rise. In 1973, before the beginning of the new gilded age, the top 1% of Pennsylvania families took home just 9% of all income. Thanks to the uneven distribution of income growth since 1973, today the top 1% in Pennsylvania take home 18% of all income. Absent changes in economic policy that lead to more broadly shared wage and income growth, the concentration of income in Pennsylvania may soon surpass the 21.9% peak reached in The Erosion of Bargaining Power for Pennsylvania Workers Figure 12 Our results show that over the last nine decades, when unions expand, whether at the national level or the state level, they tend to draw in unskilled workers and raise their relative wages with significant impacts on inequality. Source: Farber, Henry, Daniel Herbst, Ilyana Kuziemko, and Suresh Naidu, Unions and Inequality Over The Twentieth Century: New Evidence from Survey Data. National Bureau of Economic Research Working Paper 24587, Page 13
16 Just over one in four workers in Pennsylvania were members of unions in 1983; today that figure is one in eight. The falling representation of workers by unions in Pennsylvania, which has mirrored national trends (Figure 12), is a contributor to the growing gap between productivity growth and hourly compensation. Unions raise wages for workers they represent and tend to lift wages even in Celine McNicholas, Heidi Shierholz, and non-union workplaces as employers seek Samantha Sanders have advanced a bold set of to avoid unionization by maintaining reforms aimed at restoring bargaining power higher wages as a means of avoiding for workers. Their report First Day Fairness: union organizing drives. As unions have An agenda to build worker power and ensure declined, fewer and fewer workers see a job quality. is available online at share of their rising productivity show up in their paychecks either directly through collective bargaining or indirectly as their employers raise wages to avoid union organizing. For low-wage workers the loss of bargaining power implied by the declining power of unions has been amplified by the falling purchasing power of the minimum wage, down 28% since In recent years, bargaining power has also been eroded by the growth of giant service-sector corporations, which have great leverage (or monopsony power ) when bargaining with individual workers in the job market. Companies with 10,000 or more employees now account for 28% of U.S. employment, up from 24% in Adding in franchises, misclassified independent contractors, low-wage subcontractors, and other gig workers would increase the share of the workforce over which these quasi-monopolies exert overwhelming influence. Economic research documents the way employers use their monopsony power to drive down wages and how anti-trust policy could be used to combat these abuses. 12 One specific way that large employers suppress wage growth is by restricting worker mobility to move to a similar employer for a higher wage. This hobbles the capacity of normal market forces to boost wage growth for low-wage workers. Currently, it is estimated that a quarter of American workers are restricted by their employer from taking another job through so called noncompete or no-raid pacts ; 21% of workers earning less than the median wage are currently, or have been, restricted in their mobility by one of these agreements. 13 An examination of franchise agreements covering franchises like McDonald s, Burger King, Jiffy Lube, and H&R Block, finds that 58% of those agreements include no poaching clauses preventing one franchisee, say at a McDonald s, from hiring an employee of another McDonald s franchisee. The casual observer is probably surprised to hear that these kinds of agreements are common in low-wage industries. They also have pernicious effects on the broader economy, especially through the distribution of wages and income during expansions. As the economy recovers from a recession, employers faced with new customers and orders seek to hire new workers. Initially, thanks to high unemployment, employers find a deep pool of applicants; but as unemployment falls, employers seeking to expand and or replace workers will find a smaller and smaller pool of applicants to draw from. In a normal market process, employers that have difficulty filling openings will begin offering higher wages to attract more applicants. However, a significant share of workers in the economy are either directly prohibited from chasing higher wages or face a labor market where a significant number of employers are colluding to prevent them from getting higher-wage jobs. Combine this with the falling purchasing power of the minimum wage and declining union power, and the end result is slower wage growth for low- and middle- Page 14

17 income workers. Falling union density, falling minimum wages, and collusion by employers has contributed to an economy in which the top 1% of Pennsylvania families has captured 46% of income growth since 1973 (Figure 13). Figure 13 Conclusion Last year s State of Working Pennsylvania highlighted from our Agenda to Raise Pennsylvania s Pay (available at made two key policy recommendations, raising the Pennsylvania minimum wage and updating Pennsylvania s rules governing overtime pay. See our joint release with the National Employment Law Project estimating the number of workers by county impacted by the new overtime regulations. Wolf Proposal Would Restore 40-Hour Work Week and Fair Overtime Pay for 465,000 PA Salaried Workers Available at Pennsylvania has made significant progress since last year s report. Specifically, this June, Governor Tom Wolf issued a notice of his intention to restore guaranteed overtime pay for Pennsylvania salaried employees earning between about $24,000 and $48,000 when they work more than 40 hours in a week. (For a detailed background on the overtime issue, see the box above and to the right.) This change would benefit an estimated 465,000 Pennsylvania salaried employees statewide, including up to 20% of workers in some lower-wage rural counties with shortages of family-supporting jobs. The first round of public comment on the proposed regulations concluded earlier this August. Page 15
18 Under Pennsylvania law, Governor Wolf has the authority to increase the overtime pay threshold without passage of legislation by the General Assembly. In contrast to the minimum wage where the state legislature must act if workers are to receive an increase, the news is much less positive. The General Assembly still has not moved any legislation that would increase Pennsylvania s minimum wage through either the House or Senate Labor and Industry Committees towards a full vote on the House and Senate floor. A minimum wage increase in Pennsylvania is long overdue and continued inaction is contributing to the slow growth in earnings for workers earning less than $15 an hour. See our estimates of the number of workers affected and the characteristics of the workers affected by a minimum wage increase to $15 by The factsheets present, when possible, data specific to counties, state senate, and state house districts as well as some data by congressional district on a federal increase in the minimum wage as proposed under The Raise The Wage Act of Available at In another important area, related to noncompete agreements and no poaching clauses, a second statewide elected official has the ability to weigh in on the workers side without being blocked by the legislature. And Attorney General Josh Shapiro has done exactly that ( On July 9, he and attorneys general from nine other states and the District of Columbia sent a letter ( to Arby s, Burger King, Dunkin Donuts, Five Guys, Little Caesars, Panera Bread, Popeyes Louisiana Kitchen and Wendy s asking these restaurants to provide documents that include copies of franchise agreements and communications related to no-poach provisions. One possible model for a multi-state agreement is the agreement secured in July by the Washington state attorney general ( with Arby s, Auntie Anne s, Buffalo Wild Wings, Carl s Jr., Cinnabon, Jimmy John s, and McDonald s to not enforce existing agreements and not enter any new agreements that would prevent their employees from accepting employment from another franchise location for higher pay. If these agreements are also being used in Pennsylvania they serve no purpose other than restraining competition and ultimately limiting the growth in wages for Pennsylvania workers. A multi-state effort to restrict their use will boost wages for Pennsylvania workers. In 2019 and beyond, a return to broadly shared prosperity requires Pennsylvania lawmakers to enact a more comprehensive agenda to lift up the wages of incomes of Pennsylvania workers such as the ones outlined in our Agenda to Raise Pennsylvania s Pay in the We the People Pennsylvania agenda online at Page 16
19 1 See 2 We present calendar year estimates in the main body, but the Bureau of Labor Statistics does publish a rolling average; the latest figure is 9% for the twelve months between the third quarter of 2017 and the second quarter of 2018 ( 3 See Table 2 on page 8 of the Congressional Budget Office, The Budget and Economic Outlook 2018 to April 2018, outlook.pdf 4 Steve Wamhoff, Extensions of the New Tax Law s Temporary Provisions Would Mainly Benefit the Wealth, Institute on Taxation and Economic Policy, April 10, 2018, 5 See the Pennsylvania Department of Revenues Monthly Revenue Reports ges/default.aspx. 6 Although non-withholding personal income tax collections have grown quickly in the last twelve months surging in particular by 25% in January 2018 total general fund collections in Pennsylvania were still $137 million below projections in fiscal year According to data from the Bureau of Labor Statistics adjusted for inflation, average hourly earnings for private sector workers in Pennsylvania fell 0.5% in the 12 months ending this June. Enter SMU at to access this data. 8 Two key reasons that top incomes are understated in the Current Population Survey, our source for trends in hourly wages, are the non-disclosure of the highest incomes by the Census Bureau to protect the anonymity of survey participants and the difficulty of sampling the highest earners who represent a tiny fraction of the population. 9 Estelle Sommeiller and Mark Price The New Gilded Age: Income Inequality in the U.S. by State, Metropolitan Area, and County. Economic Policy Institute, July Inflation adjustment based on the CPI-U-RS with inflation for 2018 (current as of this publication through July) assumed to be 2% for all of Meanwhile, the share of U.S. employment in companies with fewer than 20 employees fell from 22% to 18% since David Leonhardt, The Charts That Show How Big Business Is Winning, New York Times, June 17, 2018; Leonhardt s data come from the Census Bureau Longitudinal Business Database , online at 12 Suresh Naidu, Eric A. Posner, and Glen E. Weyl, Antitrust Remedies for Labor Market Power, Harvard Law Review, forthcoming; available at 13 Alan Krueger and Eric Posner A Proposal for Protecting Low-Income Workers from Monopsony and Collusion. The Hamilton Project, Brookings, sion_krueger_posner_pp.pdf Page 17
The State of Working Pennsylvania 2004
 The State of Working Pennsylvania 2004 Howard Wial The Keystone Research Center Harrisburg, Pennsylvania The Keystone Research Center The Keystone Research Center (KRC) was founded in 1996 to broaden public
The State of Working Wisconsin 2017
 The State of Working Wisconsin 2017 Facts & Figures Facts & Figures Laura Dresser and Joel Rogers INTRODUCTION For more than two decades now, annually, on Labor Day, COWS reports on how working people
A Barometer of the Economic Recovery in Our State
 THE WELL-BEING OF NORTH CAROLINA S WORKERS IN 2012: A Barometer of the Economic Recovery in Our State By ALEXANDRA FORTER SIROTA Director, BUDGET & TAX CENTER. a project of the NORTH CAROLINA JUSTICE CENTER
Is the recession over in New York?
 By James A. Parrott May 10, 2010 Job numbers are up, unemployment is down. Consumer confidence is up. Gross domestic product has increased for three quarters. It sounds like the is behind us and we re
The State of. Working Wisconsin. Update September Center on Wisconsin Strategy
 The State of Working Wisconsin Update 2005 September 2005 Center on Wisconsin Strategy About COWS The Center on Wisconsin Strategy (COWS), based at the University of Wisconsin-Madison, is a research center
Job Displacement Over the Business Cycle,
 cepr CENTER FOR ECONOMIC AND POLICY RESEARCH Briefing Paper Job Displacement Over the Business Cycle, 1991-2001 John Schmitt 1 June 2004 CENTER FOR ECONOMIC AND POLICY RESEARCH 1611 CONNECTICUT AVE., NW,
A COMPARISON OF ARIZONA TO NATIONS OF COMPARABLE SIZE
 A COMPARISON OF ARIZONA TO NATIONS OF COMPARABLE SIZE A Report from the Office of the University Economist July 2009 Dennis Hoffman, Ph.D. Professor of Economics, University Economist, and Director, L.
Working women have won enormous progress in breaking through long-standing educational and
 THE CURRENT JOB OUTLOOK REGIONAL LABOR REVIEW, Fall 2008 The Gender Pay Gap in New York City and Long Island: 1986 2006 by Bhaswati Sengupta Working women have won enormous progress in breaking through
THE STATE OF WORKING FLORIDA
 1 THE STATE OF WORKING FLORIDA 2 LABOR DAY SEPTEMBER 3, 2012 THE STATE OF WORKING FLORIDA 2012 by BERNARDO OSEGUERA ACKNOWLEDGEMENTS Special thanks to Emily Eisenhauer and Alayne Unterberger who reviewed
Inclusive growth and development founded on decent work for all
 Inclusive growth and development founded on decent work for all Statement by Mr Guy Ryder, Director-General International Labour Organization International Monetary and Financial Committee Washington D.C.,
FISCAL POLICY INSTITUTE
 FISCAL POLICY INSTITUTE Learning from the 90s How poor public choices contributed to income erosion in New York City, and what we can do to chart an effective course out of the current downturn Labor Day,
How Have Hispanics Fared in the Jobless Recovery?
 How Have Hispanics Fared in the Jobless Recovery? William M. Rodgers III Heldrich Center for Workforce Development Rutgers University and National Poverty Center and Richard B. Freeman Harvard University
Wages and Inequality: How resetting rules of labor market generated wage stagnation and inequality
 June 2015 Wages and Inequality: How resetting rules of labor market generated wage stagnation and inequality The Great Polarization University of Utah September 2018 Larry Mishel Distinguished Fellow,
Labor markets in the Tenth District are
 Will Tightness in Tenth District Labor Markets Result in Economic Slowdown? By Ricardo C. Gazel and Chad R. Wilkerson Labor markets in the Tenth District are tighter now than at any time in recent memory.
Executive Summary. Figures provided by the U.S. Census Bureau 1 demonstrate that teen employment prospects are dismal:
 Executive Summary As the Great Recession persists, unemployment remains a key concern in Montana and the nation as a whole. Although the jobs situation in Montana is somewhat better than the national average,
RESEARCH BRIEF: The State of Black Workers before the Great Recession By Sylvia Allegretto and Steven Pitts 1
 July 23, 2010 Introduction RESEARCH BRIEF: The State of Black Workers before the Great Recession By Sylvia Allegretto and Steven Pitts 1 When first inaugurated, President Barack Obama worked to end the
STATEMENT OF LEON R. SEQUEIRA ASSISTANT SECRETARY FOR POLICY U.S
 STATEMENT OF LEON R. SEQUEIRA ASSISTANT SECRETARY FOR POLICY U.S. DEPARTMENT OF LABOR BEFORE THE HOUSE JUDICIARY SUBCOMMITTEE ON IMMIGRATION, CITIZENSHIP, REFUGEES, BORDER SECURITY, AND INTERNATIONAL LAW
The Racial Dimension of New York s Income Inequality
 The Racial Dimension of New York s Income Inequality Data Brief, March 2017 It is well-known that New York State has one of the highest degrees of income inequality among all fifty states, and that the
$15. Bigger paychecks, more good jobs, & thriving communities. Why raising the minimum wage is good for everyone in North Carolina.
 Bigger paychecks, more good jobs, & thriving communities March 2019 Why raising the minimum wage is good for everyone in North Carolina By ALLAN FREYER, DIRECTOR A FOUR-PART SERIES FROM $15 per hour by
BY Rakesh Kochhar FOR RELEASE MARCH 07, 2019 FOR MEDIA OR OTHER INQUIRIES:
 FOR RELEASE MARCH 07, 2019 BY Rakesh Kochhar FOR MEDIA OR OTHER INQUIRIES: Rakesh Kochhar, Senior Researcher Jessica Pumphrey, Communications Associate 202.419.4372 RECOMMENDED CITATION Pew Research Center,
The Great Recession and its aftermath: What role do structural changes play?
 Washington Center for Equitable Growth The Great Recession and its aftermath: What role do structural changes play? By Jesse Rothstein June 2015 Overview The last seven years have been disastrous for many
Policy brief ARE WE RECOVERING YET? JOBS AND WAGES IN CALIFORNIA OVER THE PERIOD ARINDRAJIT DUBE, PH.D. Executive Summary AUGUST 31, 2005
 Policy brief ARE WE RECOVERING YET? JOBS AND WAGES IN CALIFORNIA OVER THE 2000-2005 PERIOD ARINDRAJIT DUBE, PH.D. AUGUST 31, 2005 Executive Summary This study uses household survey data and payroll data
STATE OF WORKING FLORIDA
 STATE OF WORKING FLORIDA 2017 The State of Working Florida 2017 analyzes the period from 2005 through 2016 and finds that while Florida s economic and employment levels have recovered from the Great Recession
The ten years since the start of the Great Recession have done little to address
 BUDGET & TAX CENTER December 2017 ENJOY READING THESE REPORTS? Please consider making a donation to support the Budget & tax Center at www.ncjustice.org MEDIA CONTACT: PATRICK McHUGH 919/856-2183 patrick.mchugh@ncjustice.org
LABOUR MARKET SLACK. Article published in the Quarterly Review 2019:1, pp
 LABOUR MARKET SLACK Article published in the Quarterly Review 019:1, pp. 37-1 BOX : LABOUR MARKET SLACK 1 The labour market in Malta has experienced a strong recovery in recent years, registering a marked
Deconstructing Structural Unemployment
 Deconstructing Structural Unemployment John Schmitt and Kris Warner March 2011 Center for Economic and Policy Research 1611 Connecticut Avenue, NW, Suite 400 Washington, D.C. 20009 202 293 5380 www.cepr.net
Real Wage Trends, 1979 to 2017
 Sarah A. Donovan Analyst in Labor Policy David H. Bradley Specialist in Labor Economics March 15, 2018 Congressional Research Service 7-5700 www.crs.gov R45090 Summary Wage earnings are the largest source
Rewriting the Rules of the Market Economy to Achieve Shared Prosperity. Joseph E. Stiglitz New York June 2016
 Rewriting the Rules of the Market Economy to Achieve Shared Prosperity Joseph E. Stiglitz New York June 2016 Enormous growth in inequality Especially in US, and countries that have followed US model Multiple
Government data show that since 2000 all of the net gain in the number of working-age (16 to 65) people
 people") CENTER FOR IMMIGRATION STUDIES June All Employment Growth Since Went to Immigrants of U.S.-born not working grew by 17 million By Steven A. Camarota and Karen Zeigler Government data show that since all
CENTER FOR IMMIGRATION STUDIES June All Employment Growth Since Went to Immigrants of U.S.-born not working grew by 17 million By Steven A. Camarota and Karen Zeigler Government data show that since all
Deconstructing Structural Unemployment
 Deconstructing Structural Unemployment John Schmitt and Kris Warner March 2011 Corrected Version May 24, 2011 Center for Economic and Policy Research 1611 Connecticut Avenue, NW, Suite 400 Washington,
This Expansion Looks Familiar
 1 of 4 2/14/2007 8:28 AM February 13, 2007 This Expansion Looks Familiar By EDUARDO PORTER and JEREMY W. PETERS It is five years into an economic expansion and most Americans are still waiting for their
SUMMARY LABOUR MARKET CONDITIONS POPULATION AND LABOUR FORCE. UNRWA PO Box Sheikh Jarrah East Jerusalem
 UNRWA PO Box 19149 Sheikh Jarrah East Jerusalem +97225890400 SUMMARY The Gaza labour market in secondhalf 2010 (H2 2010) showed growth in employment and unemployment relative to H2 2009. Comparing H1 and
An Equity Assessment of the. St. Louis Region
 An Equity Assessment of the A Snapshot of the Greater St. Louis 15 counties 2.8 million population 19th largest metropolitan region 1.1 million households 1.4 million workforce $132.07 billion economy
The likely scale of underemployment in the UK
 Employment and Welfare: MW 446 Summary 1. The present record rates of employment are misleading because they take no account of the underemployed those who wish to work more hours but cannot find suitable
Globalization: It Doesn t Just Happen
 Conference Presentation November 2007 Globalization: It Doesn t Just Happen BY DEAN BAKER* Progressives will not be able to tackle the problems associated with globalization until they first understand
BLS Spotlight on Statistics: Union Membership In The United States
 Cornell University ILR School DigitalCommons@ILR Federal Publications Key Workplace Documents 9-2016 BLS : Union Membership In The United States Megan Dunn Bureau of Labor Statistics James Walker Bureau
CURRENT ANALYSIS. Growth in our own backyard... March 2014
 93619 CURRENT ANALYSIS March 14 Composition of the Canadian population % of total adult population 15+ 8 6 4 2 14.1.9 14.9 42.5 * Labour Force Participation Rate % of Population in the Labour Force 69
The Changing Face of Labor,
 The Changing Face of Labor, 1983-28 John Schmitt and Kris Warner November 29 Center for Economic and Policy Research 1611 Connecticut Avenue, NW, Suite 4 Washington, D.C. 29 22-293-538 www.cepr.net CEPR
Backgrounder. This report finds that immigrants have been hit somewhat harder by the current recession than have nativeborn
 Backgrounder Center for Immigration Studies May 2009 Trends in Immigrant and Native Employment By Steven A. Camarota and Karen Jensenius This report finds that immigrants have been hit somewhat harder
Growth in the Foreign-Born Workforce and Employment of the Native Born
 Report August 10, 2006 Growth in the Foreign-Born Workforce and Employment of the Native Born Rakesh Kochhar Associate Director for Research, Pew Hispanic Center Rapid increases in the foreign-born population
In class, we have framed poverty in four different ways: poverty in terms of
 Sandra Yu In class, we have framed poverty in four different ways: poverty in terms of deviance, dependence, economic growth and capability, and political disenfranchisement. In this paper, I will focus
Update ,000 Missing Jobs: Wisconsin s Lagging Sectors
 The State of Working Wisconsin 33,000 Missing Jobs: Wisconsin s Lagging Sectors Painfully Slow: Wisconsin s Recovery Weaker than even the National Recovery The 2007 recession, the Great Recession, is now
Part 1: Focus on Income. Inequality. EMBARGOED until 5/28/14. indicator definitions and Rankings
 Part 1: Focus on Income indicator definitions and Rankings Inequality STATE OF NEW YORK CITY S HOUSING & NEIGHBORHOODS IN 2013 7 Focus on Income Inequality New York City has seen rising levels of income
Poverty Amid Renewed Affluence: The Poor of New England at Mid-Decade
 Volume 2 Issue 2 Article 3 6-21-1986 Poverty Amid Renewed Affluence: The Poor of New England at Mid-Decade Andrew M. Sum Northeastern University Paul E. Harrington Center for Labor Market Studies William
DEMOCRATS AND ECONOMIC GROWTH
 DEMOCRATS AND ECONOMIC GROWTH This data is compiled by offsetting a President s Administration by a year to account for the fact that the Federal budget for any given fiscal year is drafted and passed
What s so Scary about a Recession? A Long-term View of the State of Working Oregon
 Executive Summary 204 N. First St., Suite C PO Box 7 Silverton, OR 97381 www.ocpp.org 503-873-1201 fax 503-873-1947 Labor Day, September 3, 2001 What s so Scary about a Recession? A Long-term View of the
Increasing to the United States Minimum Wage: An Ethical Discussion
 Increasing to the United States Minimum Wage: An Ethical Discussion by: Christopher L. Schilling Section I: Introduction It is my claim the federal minimum wage is not only beneficial to American workers,
THE STATE OF THE UNIONS IN 2011: A PROFILE OF UNION MEMBERSHIP IN LOS ANGELES, CALIFORNIA AND THE NATION 1
 THE STATE OF THE UNIONS IN 2011: A PROFILE OF UNION MEMBERSHIP IN LOS ANGELES, CALIFORNIA AND THE NATION 1 Lauren D. Appelbaum UCLA Institute for Research on Labor and Employment 2 Ben Zipperer University
Ames Economic Outlook, 3 rd Quarter, 2015 Peter F. Orazem Iowa State University Ames Labor Market
 Ames Economic Outlook, 3 rd Quarter, 2015 Peter F. Orazem Iowa State University Ames Labor Market Ames has completed the best five years of employment growth since Iowa Workforce Development first began
Speech given by Mervyn King, Governor of the Bank of England. At Salts Mills, Bradford, Yorkshire 13 June 2005
 1 Speech given by Mervyn King, Governor of the Bank of England At Salts Mills, Bradford, Yorkshire 13 June 2005 All speeches are available online at www.bankofengland.co.uk/publications/pages/speeches/default.aspx
Wage Gap Widens as Wages Fail to Keep Pace with Productivity
 Index: 2000 = 100 Wage Gap Widens as Wages Fail to Keep Pace with Productivity Michael Renner January 30, 2013 T he economic crisis in 2008 was one of the harsher signs that economic globalization has
An economic profile of Right-to-Work states
 ILLINOIS POLICY JANUARY 2015 An economic profile of Right-to-Work states Paul Kersey, Director of Labor Policy The problem Unions are powerful in Illinois, and the state allows them to sign contracts with
LEFT BEHIND: WORKERS AND THEIR FAMILIES IN A CHANGING LOS ANGELES. Revised September 27, A Publication of the California Budget Project
 S P E C I A L R E P O R T LEFT BEHIND: WORKERS AND THEIR FAMILIES IN A CHANGING LOS ANGELES Revised September 27, 2006 A Publication of the Budget Project Acknowledgments Alissa Anderson Garcia prepared
The Future of Inequality: The Other Reason Education Matters So Much
 The Future of Inequality: The Other Reason Education Matters So Much The Harvard community has made this article openly available. Please share how this access benefits you. Your story matters. Citation
An Equity Profile of the Southeast Florida Region. Summary. Foreword
 An Equity Profile of the Southeast Florida Region PolicyLink and PERE An Equity Profile of the Southeast Florida Region Summary Communities of color are driving Southeast Florida s population growth, and
The State of the Nation s Housing 2010
 3 Demographic drivers With the nation hammered by a fierce housing downturn and a severe recession, household growth slowed in the second half of the 2s led primarily by a retreat in immigration. But even
Meanwhile, the foreign-born population accounted for the remaining 39 percent of the decline in household growth in
 3 Demographic Drivers Since the Great Recession, fewer young adults are forming new households and fewer immigrants are coming to the United States. As a result, the pace of household growth is unusually
3Demographic Drivers. The State of the Nation s Housing 2007
 3Demographic Drivers The demographic underpinnings of long-run housing demand remain solid. Net household growth should climb from an average 1.26 million annual pace in 1995 25 to 1.46 million in 25 215.
Patrick Adler and Chris Tilly Institute for Research on Labor and Employment, UCLA. Ben Zipperer University of Massachusetts, Amherst
 THE STATE OF THE UNIONS IN 2013 A PROFILE OF UNION MEMBERSHIP IN LOS ANGELES, CALIFORNIA AND THE NATION 1 Patrick Adler and Chris Tilly Institute for Research on Labor and Employment, UCLA Ben Zipperer
Quarterly Labour Market Report. February 2017
 Quarterly Labour Market Report February 2017 MB14052 Feb 2017 Ministry of Business, Innovation and Employment (MBIE) Hikina Whakatutuki - Lifting to make successful MBIE develops and delivers policy, services,
The Minimum Wage Debate Part II
 The Minimum Wage Debate Part II The Albany Times Union carried an article on March 24 detailing the connections between researchers who produced the reports for and against a minimum wage increase that
This analysis confirms other recent research showing a dramatic increase in the education level of newly
 CENTER FOR IMMIGRATION STUDIES April 2018 Better Educated, but Not Better Off A look at the education level and socioeconomic success of recent immigrants, to By Steven A. Camarota and Karen Zeigler This
Pennsylvania Population on the Move:
 Center for Economic and Community Development Penn State University Park, PA December 2018 Pennsylvania Population on the Move: 2000-17 A Graphic Update 2000-17 Population Labor Force Household Income
Don t Call It a Comeback
 STATE OF WORKING NORTH CAROLINA Don t Call It a Comeback State policy choices have violated the promise of hard work for North Carolinians 6 1 20 ta, Siro, r e on ort hns ll ra F o d J n n e lexa ario
The Great Laissez-Faire Experiment
 AP PHOTO/CHARLES REX ARBOGAST The Great Laissez-Faire Experiment American Inequality and Growth from an International Perspective By David R. Howell December 2013 WWW.AMERICANPROGRESS.ORG Section 1: Introduction
The Future of Inequality
 The Future of Inequality As almost every economic policymaker is aware, the gap between the wages of educated and lesseducated workers has been growing since the early 1980s and that change has been both
International Monetary and Financial Committee
 International Monetary and Financial Committee Thirty-Fifth Meeting April 22, 2017 IMFC Statement by Guy Ryder Director-General International Labour Organization Weak outlook for jobs at heart of uncertain
University of California Institute for Labor and Employment
 University of California Institute for Labor and Employment The State of California Labor, 2002 (University of California, Multi-Campus Research Unit) Year 2002 Paper Weir Income Polarization and California
Labor Force Statistics Vol. 1: Unemployment and Underemployment Report (Q1-Q3 2017)
") Labor Force Statistics Vol. 1: and Underemployment Report (Q1-Q3 2017) Report Date: December 2017 Contents Summary 1 Definition and Methodology 3 Labor Force and Non-Labor Force and Underemployment 3 8
Labor Force Statistics Vol. 1: and Underemployment Report (Q1-Q3 2017) Report Date: December 2017 Contents Summary 1 Definition and Methodology 3 Labor Force and Non-Labor Force and Underemployment 3 8
New York Saw Boost in Restaurant Worker Wages and Employment after Tipped Minimum Wage Increase
 New York Saw Boost in Restaurant Worker Wages and Employment after Tipped Minimum Wage Increase A Policy Brief by the Institute for Policy Studies and Restaurant Opportunities Centers United January 4,
Ghana Lower-middle income Sub-Saharan Africa (developing only) Source: World Development Indicators (WDI) database.
 Source: World Development Indicators (WDI) database.") Knowledge for Development Ghana in Brief October 215 Poverty and Equity Global Practice Overview Poverty Reduction in Ghana Progress and Challenges A tale of success Ghana has posted a strong growth performance
Knowledge for Development Ghana in Brief October 215 Poverty and Equity Global Practice Overview Poverty Reduction in Ghana Progress and Challenges A tale of success Ghana has posted a strong growth performance
San Francisco Economic Strategy Update: Phase I Findings
 San Francisco Economic Strategy Update: Phase I Findings Ted Egan, Ph.D., Chief Economist Controller's Office of Economic Analysis May 21 th, 2012 1 City and County of San Francisco Introduction Proposition
Executive summary. Part I. Major trends in wages
 Executive summary Part I. Major trends in wages Lowest wage growth globally in 2017 since 2008 Global wage growth in 2017 was not only lower than in 2016, but fell to its lowest growth rate since 2008,
The Latino Electorate in 2010: More Voters, More Non-Voters
 April 26, 2011 The Latino Electorate in 2010: More Voters, More Non-Voters Mark Hugo Lopez, Associate Director FOR FURTHER INFORMATION CONTACT: Pew Hispanic Center 1615 L St, N.W., Suite 700 Washington,
INTERIOR DESIGN BILLINGS INDEX
 THE ASID INTERIOR DESIGN BILLINGS INDEX 3RD QUARTER REPORT Y TEMBER 20 HIGHLIGHTS Third quarter ASID survey results show positive, but cooling trend The American Society of Interior Designers (ASID) Interior
Falling Real Wages. Stephen Machin*
 CASE Welfare Policy and Analysis Seminar, 22 October 2014. Falling Real Wages Stephen Machin* * Department of Economics, University College London and Centre for Economic Performance, London School of
Migrants Fiscal Impact Model: 2008 Update
 11 April 2008 Migrants Fiscal Impact Model: 2008 Update Report by Access Economics Pty Limited for Department of Immigration and Citizenship TABLE OF CONTENTS EXECUTIVE SUMMARY... i 1. Introduction...
Benefits of a Strong Labor Market
 CHAPTER 3 Benefits of a Strong Labor Market THE NATION'S LABOR MARKET is performing at record levels: the number of workers employed is at an all-time high, the unemployment rate is at a 30-year low, and
The State of Working Connecticut 2011: Wages, Job Sector Changes, and the Great Recession
 The State of Working Connecticut 2011: Wages, Job Sector Changes, and the Great Recession Sarah Esty Orlando Rodriguez, M.A. December 2011 Produced with the generous support of the Melville Charitable
Using data provided by the U.S. Census Bureau, this study first recreates the Bureau s most recent population
 Backgrounder Center for Immigration Studies December 2012 Projecting Immigration s Impact on the Size and Age Structure of the 21st Century American Population By Steven A. Camarota Using data provided
The United States Trade Deficit Issue with China and its Economic Effects in 2016
 The United States Trade Deficit Issue with China and its Economic Effects in 2016 Item Type text; Electronic Thesis Authors Jiang, Yuanzhi Publisher The University of Arizona. Rights Copyright is held
HAS GROWTH PEAKED? 2018 growth forecasts revised upwards as broad-based recovery continues
 HAS GROWTH PEAKED? 2018 growth forecasts revised upwards as broad-based recovery continues Regional Economic Prospects May 2018 Stronger growth momentum: Growth in Q3 2017 was the strongest since Q3 2011
Several defining factors will set the pace
 FMl s 1995 Construction Outlook By Michael A. O Brian and Thomas R. Loy Several defining factors will set the pace for continued economic prosperity for the nation and the construction industry in 1995.
Poverty in New York City, 2005: More Families Working, More Working Families Poor
 : More Families Working, More Working Families Poor A CSS Annual Report September 2006 Mark Levitan, Senior Policy Analyst After four consecutive increases, the nation s poverty rate has stabilized at
CH 19. Name: Class: Date: Multiple Choice Identify the choice that best completes the statement or answers the question.
 Class: Date: CH 19 Multiple Choice Identify the choice that best completes the statement or answers the question. 1. In the United States, the poorest 20 percent of the household receive approximately
Rural and Urban Migrants in India:
 Rural and Urban Migrants in India: 1983-2008 Viktoria Hnatkovska and Amartya Lahiri July 2014 Abstract This paper characterizes the gross and net migration flows between rural and urban areas in India
MADE IN THE U.S.A. The U.S. Manufacturing Sector is Poised for Growth
 MADE IN THE U.S.A. The U.S. Manufacturing Sector is Poised for Growth For at least the last century, manufacturing has been one of the most important sectors of the U.S. economy. Even as we move increasingly
Inequality in the Labor Market for Native American Women and the Great Recession
 Inequality in the Labor Market for Native American Women and the Great Recession Jeffrey D. Burnette Assistant Professor of Economics, Department of Sociology and Anthropology Co-Director, Native American
THE MEASURE OF AMERICA
 THE MEASURE OF AMERICA American Human Development Report 2008 2009 xvii Executive Summary American history is in part a story of expanding opportunity to ever-greater numbers of citizens. Practical policies
Financial Crisis. How Firms in Eastern and Central Europe Fared through the Global Financial Crisis: Evidence from
 Public Disclosure Authorized Public Disclosure Authorized Public Disclosure Authorized Public Disclosure Authorized World Bank Group Enterprise Note No. 2 21 Enterprise Surveys Enterprise Note Series Introduction
destination Philadelphia Tracking the City's Migration Trends executive summary
 destination Philadelphia October 6, 2010 executive summary An analysis of migration data from the Internal Revenue Service shows that the number of people moving into the city of Philadelphia has increased
SCHOOLS OF ECONOMICS. Classical, Keynesian, & Monetary
 SCHOOLS OF ECONOMICS Classical, Keynesian, & Monetary CLASSICAL THEORY Also known as Neo- Classical Supply Side Trickle Down Free Trade FIVE CLASSICAL ECONOMIC BASICS In the long run, competition forces
10/7/2013 SCHOOLS OF ECONOMICS. Classical, Keynesian, & Monetary. as Neo- Classical Supply Side Trickle Down Free Trade CLASSICAL THEORY
 SCHOOLS OF ECONOMICS Classical, Keynesian, & Monetary CLASSICAL THEORY Also known as Neo- Classical Supply Side Trickle Down Free Trade 1 FIVE CLASSICAL ECONOMIC BASICS In the long run, competition forces
Monthly Census Bureau data show that the number of less-educated young Hispanic immigrants in the
 Backgrounder Center for Immigration Studies July 2009 A Shifting Tide Recent Trends in the Illegal Immigrant Population By Steven A. Camarota and Karen Jensenius Monthly Census Bureau data show that the
EPI BRIEFING PAPER. Immigration and Wages Methodological advancements confirm modest gains for native workers. Executive summary
 EPI BRIEFING PAPER Economic Policy Institute February 4, 2010 Briefing Paper #255 Immigration and Wages Methodological advancements confirm modest gains for native workers By Heidi Shierholz Executive
SUMMARY LABOUR MARKET CONDITIONS !!! !!!!!!!!!!!!!!!!!!!!!!! POPULATION AND LABOUR FORCE. UNRWA PO Box Sheikh Jarrah East Jerusalem
 UNRWA PO Box 19149 Sheikh Jarrah East Jerusalem +97225890400 SUMMARY Contrary to media reports of a flourishing West Bank economy, evidence from the second half of 2010 shows deteriorating labour market
The labor market in Japan,
 DAIJI KAWAGUCHI University of Tokyo, Japan, and IZA, Germany HIROAKI MORI Hitotsubashi University, Japan The labor market in Japan, Despite a plummeting working-age population, Japan has sustained its
OLDER INDUSTRIAL CITIES
 Renewing America s economic promise through OLDER INDUSTRIAL CITIES Executive Summary Alan Berube and Cecile Murray April 2018 BROOKINGS METROPOLITAN POLICY PROGRAM 1 Executive Summary America s older
Global Employment Trends for Women
 December 12 Global Employment Trends for Women Executive summary International Labour Organization Geneva Global Employment Trends for Women 2012 Executive summary 1 Executive summary An analysis of five
Insecure work and Ethnicity
 Insecure work and Ethnicity Executive Summary Our previous analysis showed that there are 3.2 million people who face insecurity in work in the UK, either because they are working on a contract that does