CHAPTER TWO: MAPPING DEPRIVATION
|
|
|
- Joan Taylor
- 5 years ago
- Views:
Transcription
1 CHAPTER TWO: MAPPING DEPRIVATION INTRODUCTION It is of great importance when developing neighbourhood renewal policies that the meaning of neighbourhood deprivation is clearly understood. Unfortunately, the term area deprivation can have at least three different meanings: 1. A compositional meaning, whereby an area is considered to be deprived if it contains a large number of poor people. In this case, the spatial effects are entirely due to the concentration of poor people in a given area there are no independent area effects. 2. A collective meaning, whereby an area is considered to be deprived because if it contains a lot of poor people a social miasma may exist. That is, a concentration of poor people will exert a collective influence, above and beyond their individual circumstances, for example, it may be difficult to find a job if you live in a deprived area because employers are prejudice against people from poor areas. Although, this is a commonly held belief there is relatively little (other than anecdotal) evidence to support it. 3. A public goods or environmental meaning, whereby an area is considered deprived because it lacks facilities (roads, hospitals, schools, libraries, etc.) or because it suffers from high pollution levels. These three meanings of area deprivation are separate and distinct, but are often confused. For example the Government s neighbourhood renewal strategy confuses all these three different meanings of neighbourhood deprivation and the Index of Multiple Deprivation confuses two of them (e.g. poor people and poor services). Unfortunately, the polices necessary to effectively help an area with a lot of poor people may be different from the policies needed to help an area with poor services. Similarly, a different set of policies may be effective at reducing area stigma, since not all poor areas are stigmatised and not all stigmatised areas contain a lot of poor people. It is also essential to be clear on the definition of area deprivation that is being used when attempting to develop measures to identify the poorest areas, since the three types of area deprivation have different geographies. For example, on the national scale the majority of poor areas which contain poor people are found in the major cities (Inner London, Bristol, Plymouth, etc). Whereas the majority of areas with poor access to services are often the remoter rural areas where lower proportions of poor people live. The inner cities by contrast often have very good levels of public services. It makes little scientific sense to include both measures of poor people and poor access to services in a single national index as in the IMD 2000 since the higher weighting given to the service domain the more rural areas will appear
2 deprived and conversely the higher the weightings given to the domains that measure poor people the more the cities will appear deprived.
3 INDICES OF LOCAL DEPRIVATION (ILD) 2000 The ILD 2000 are measures of deprivation for all 8,414 wards in England. They describe a range of indicators classified in six main domains of deprivation: Income Employment Health Deprivation and Disability Education, Skills and Training Housing Geographical Access to Services In addition to these six domains, the 2000 ILD also contains a supplementary Child Poverty Index. The 2000 Index of Multiple Deprivation (IMD) combines the six main domains within a single deprivation score for each area. The 2000 IMD uses up-to-date information from 33 indicators to describe deprivation at ward level (a detailed listing of the ILD 2000 indicators is presented in Appendix II). Most of the indicators can be updated regularly and so form the basis for a dynamic index. In addition to the Domain Indices, the overall ward level Index of Multiple Deprivation brings this substantial amount of knowledge and information together for the first time at a small geographical level. Methodology For the Income and Employment domains, the scores are presented as a simple rate, as these domains represent the percentage of the population affected by this type of deprivation. This is also the case with the Child Poverty Index. The Health, Housing, Education and Access domains could not be combined in this way for two reasons: 1 The individual indicators may be measured in different ways. For example, in the Health Domain it would not be appropriate to simply add a standardised mortality ratio to a proportion of people receiving Attendance Allowance as these are on different metrics. 2 There might be overlap between indicators within a domain. A simple combination of these indicators could result in double counting. Instead, these four domains were each combined using Factor Analysis (see Noble et al, 2000 for a detailed description of the statistical procedures used to generate the IMD). Factor Analysis is a statistical procedure which attempts to deal with both the problems outlined above 1. 1 Factor analysis attempts to identify underlying variables, or factors, that explain the pattern of correlations within a set of observed variables. Factor analysis is often used in data reduction to identify a small number of factors that explain most of the variance observed in a much larger number of manifest variables.
4 Once the six separate domains scores for every ward have been calculated, it is then possible to combine these into an overall index. However, as with the indicators, the domains cannot be simply added because they are not all on the same scale. In order to combine the domains, they must first be standardised to a uniform metric by ranking the domain scores. Secondly, it is important to ensure that each domain is transformed to a common distribution. This is necessary because combining domains with different distributions can result in misleading results with some domains having unanticipated disproportionate effects on the overall index score. From the outset, the DETR proposed that the Income and Employment Domains should carry more weight than the other domains (Noble et al, 2000). It was also proposed that the most robust domains should carry the most weight. This means that the contribution of each domain to the overall Index varies as follows: Income 25% Employment 25% Health Deprivation and Disability 15% Education, Skills and Training 15% Geographical Access to Services 10% Housing 10% It must be stressed that neither the six domains or their weightings are the result of scientific analysis they are mainly reflections of the Government s priorities and data availability. ILD 2000 DEPRIVATION IN CORNWALL Income and Employment The scores for the Income and Employment Domains (as well as Child Poverty and Multiple Deprivation) are rates. So, for example, if a ward scores 38.6 in the Income Domain, this means that 38.6% of the ward s population are Income Deprived. The same applies to the Employment Domain. In the 20% most income deprived Cornish wards at least 28% of the population is income deprived. It is also instructive to explore how Cornwall compares with the rest of England. The 2000 ILD assigns a rank to each of the eight indices for all 8,414 wards in England. The most deprived ward for each index is given a rank of 1 and the least deprived ward is given a rank of 8,414. Figure 2.1 illustrates the distribution of Income Deprivation in Cornwall by showing the distribution of Cornish wards within the Income Deprivation ranking for English wards.
5 Figure 2.1: ILD Income Deprivation Rank, 2000 (quintiles) As Figure 2.1 shows, most Cornish wards fall within the most deprived two fifths of the Income Deprivation ranking for England, although deprivation is most concentrated in West Cornwall (Kerrier and Penwith). Figure 2.2: ILD Employment Deprivation Rank, 2000 (quintiles) The spatial distribution of Employment Deprivation in Cornwall reveals a similar picture. Overall, in one fifth of wards, at least 15% of the population are classified by
6 the 2000 ILD as employment deprived. Again, high levels of employment deprivation are concentrated in the west of Cornwall, as Figure 2.2 (above) illustrates. As with income, Cornwall fares poorly compared with the rest of England on the Employment Deprivation Index. Indeed, none of the Cornish wards fell within the least deprived fifth of English wards on this measure and only eight within the next fifth of the distribution, as Figure 2.2 (above) shows. Housing, Health and Education Deprivation scores for the Housing, Health, Education and Access to Services Domains are not rates. Within each domain, the higher the score, the more deprived the ward 2. Housing deprivation in Cornwall is concentrated mainly in western Cornwall although the pattern of deprivation is somewhat more dispersed as Figure 2.3 shows: Figure 2.3: ILD Housing Deprivation Rank, 2000 (quintiles) However, as with income and employment deprivation, few wards perform well in comparison with the rest of England, with only four wards falling within the least housing-deprived fifth of English wards. Comparing health deprivation in Cornwall with the rest of England suggests an even more depressing picture. None of the Cornish wards are ranked within the least health-deprived fifth of English wards and the majority fall within the most deprived two fifths of the distribution. Again, the majority of the most severely healthdeprived wards are in Kerrier and Penwith, as Figure 2.4 (overleaf) illustrates. 2 However, the factor scores should not be compared between domains as they have different minimum and maximum values and ranges. To compare between domains, the ranks should be used.
7 Figure 2.4: ILD Health Deprivation Rank, 2000 (quintiles) In terms of educational disadvantage, the picture is slightly more encouraging. As Figure 2.5 shows, educational deprivation within Cornwall is less spatially concentrated than for many other domains, although again some of the most deprived wards are in Kerrier: Figure 2.5: ILD Educational Deprivation Rank, 2000 (quintiles) Overall and in comparison with the rest of England, the Cornish wards fare better in terms of educational deprivation than for economic (income, employment) and social (housing, health) deprivation. Fewer Cornish wards fall within the most deprived
8 fifth of the distribution for educational deprivation, although many of these are in Kerrier. Access to Services Perhaps unsurprisingly given its remote rural location, Cornwall as a whole fares poorly in terms of the accessibility of local services compared with the rest of England, as Figure 2.6 shows: Figure 2.6: Access to Services Rank, 2000 (quintiles)
9 Child Poverty As with the Income and Employment Indices, the scores for the Child Poverty Index are rates so the deprivation scores represent the percentage of children within each ward currently living in poverty. Figure 2.7: Child Poverty Rank, 2000 (quintiles) In one fifth of Cornish wards, more than 43% of children are currently living in poverty, according to this measure. As Figure 2.7 shows, the most severe concentrations of child poverty are in Kerrier and Penwith. However, as the figure also illustrates, child poverty is quite widespread throughout Cornwall in comparison with the rest of England. Only seven of the Cornish wards are ranked within the least deprived two fifths of the distribution for this indicator and the majority are within the most deprived two fifths of English wards for child poverty. Multiple Deprivation In 80% of Cornish wards, 20% of the population is experiencing multiple deprivation and, in more than one fifth, over a third of the population is experiencing multiple deprivation, according to this measure. Comparing the scores for Cornish wards with the rest of England reveals the extent of multiple deprivation in Cornwall. Only five of the 133 Cornish wards were amongst the least deprived two fifths of English wards and the great majority were amongst the most deprived two fifths for this measure, as Figure 2.8 (overleaf) shows. Within Cornwall multiple deprivation is again spatially concentrated within the districts of Kerrier and Penwith.
10 Figure 2.8: ILD Index of Multiple Deprivation Rank, 2000 (quintiles)
11 CRIME AND NEIGHBOURHOOD RENEWAL Introduction Crime and disorder have been acknowledged by central Government as an important feature of deprivation and a key theme within the context of neighbourhood renewal (SEU, 2001a). However, adequate data on crime was not available during the review of the 2000 ILD and this domain was therefore not included within the final indices (DETR, 2000b). One of the reasons that a crime domain was not included in the final index of multiple deprivation was because of the detailed comments from Christina Pantazis, at the University of Bristol, who reviewed the problems of measurement of the crime domain proposals. Many commentators assume that all poor areas suffer from high levels of crime. However the relationship between crime, poverty and area is much more complicated than this. This section draws heavily on Christina s analysis with additional material on the situation in West Cornwall from the research team. Crime, Poverty and Space The interest in crime and poor localities has a long history. Henry Mayhew s (1862) comprehensive survey of Victorian London, provided detail on various rookeries (slum criminal quarters); whilst concern with the rise of dangerous poor led to a focus on various specific localities (see Morris 1957 for further details). Spatial analyses undertaken in the 1970s and 1980s revealed strong connections between the location of poverty and the occurrence of crime. Baldwin and Bottom (1976), in their classic Sheffield study, found a high concentration of offenders on deprived council estates, whilst Herbert (1977) also found links between poverty, social deprivation, substandard housing and crime. Following the inner-city riots in the 1980s, a number of commentators made links between deprivation and public disorder. Specifically, left realist criminologists such as Kinsey and Young (1986) put forward the theory of relative deprivation to explain rising rates of crime and disorder. Poverty and Crime: some recent evidence Recent research into crime and disadvantage in Merseyside, in north west England demonstrated that rates of recorded crime and repeat burglaries were significantly higher in the most disadvantaged areas (Hirshfield and Bowers, 1996). Furthermore, the level of social cohesion was thought to influence the recorded crime rate, so that disadvantaged areas lacking social cohesion experienced far greater levels of crime than similarly disadvantaged areas with higher levels of cohesion. Home Office research confirms the link between crime and poor areas. Findings from the combined 1984, 1988 and 1992 British Crime Survey demonstrate the link between some poor areas and specific types of crime such as burglary and robbery (Mayhew and Maung 1992). Figure 8 shows the relative crime rates (national average = 100) for burglary and robbery, for residents of different ACORN neighbourhood
12 groups (CACI, 1992). Mixed inner metropolitan areas and less well off and poorest council estates suffer from relatively high crime rates. Mixed inner metropolitan areas have the highest rates of muggings and robbery, whilst the poorest council areas have the highest rates of burglary. These ACORN neighbourhoods are characterised by low-income households. On the other hand, high status, non-family areas which are characterised by households with well above average incomes, also suffer from high crime rates, and agricultural areas and older terraced housing, which typically contain many low-income households, have respectively very low and average burglary and robbery rates. Figure 2.9 Indexed crime rates for combined 1984, 1988, and 1992 British Crime Survey by ACORN Agricultural areas Mod fam, high income Old hse, Intermediat Rich suburban Better-off retired Old terraced housing Better-off council Less well-off counci Poorest council Mixed Inner Metro High status, non-fam Burglary Mugging/Robbery More recent evidence, based on the 1996 and 1998 British Crime Surveys, confirms the link between poor areas and crimes such as burglary, violence and vehicle-related theft (Mirrlees et al. 1998). Figure 2.10 shows the proportion of households and adults who have experienced burglary, vehicle-related theft and violence by ACORN neighbourhood groups (CACI, 1992). Striving areas (neighbourhoods with local
13 authority and multi-ethnic, low-income households) contain the highest proportion of victims in relation to all three types of crime. Twenty three percent of people in striving areas experienced vehicle-related theft in the previous year. A further 9% and 7% had experienced burglary and violence, respectively. However, rates of victimisation are also high amongst the population in rising areas (neighbourhoods containing affluent urbanites; prosperous professionals in metropolitan areas; and better-off executives, in inner city areas). Thus, the proportions of victims in rising areas were 19%, 8% and 6% for vehicle-related crime, burglary and violence respectively. The lowest rates of crime exist in thriving areas which typically contain a relatively higher proportion of elderly people. Figure 2.10 Proportion of households/adults who are victims of burglary, vehicle-related theft and violence by ACORN (1996 & 1998 British Crime Survey) % victims once or more Thriving Expanding Rising Settling Aspiring Striving ACORN Burglary Vehicle-related Violence Much of the Home Office research into poor areas has highlighted the extent of crime in areas containing large council estates (Hope, 1986). Hope and Hough (1988) attempted to tease whether it is tenure itself which is associated with crime, or the ecological distribution of tenure types between different neighbourhoods (page 41).
14 Their re-analysis of the 1984 British Crime Survey demonstrated that it is the latter which important: it is the interaction between individual tenure and the predominant tenure of the neighbourhood which is important, especially the concentration of council tenure in small residential areas, that is on estates (Hope and Hough 1988: 41). Overall, council tenants had a greater chance of experiencing burglary compared with owner-occupiers. However, council tenants in non-council areas had a risk of burglary around the national average. The greater crime risk faced by council tenants was largely associated with neighbourhoods that were dominated by council housing. Thus, council tenants on estates were particularly vulnerable. Even between estates which were predominantly council-owned, there was a considerable variation in risks of crime. Council tenants in the poorest council areas have a rate of burglary fives as that of tenants on the better-off estates and those in predominantly non-council areas (Table 2.1). At the same time residents of poor council housing area were twice as likely to be very worried about becoming victims of burglary in the coming year, as those in those better off areas. Table 2.1 Number of burglaries (including attempts) per 1,000 households by tenure ecology (1984 British Crime Survey) Burglaries per 1,000 households All owner occupiers 34 All council tenants 55 Better-off council tenants 38 Average council tenants 66 Poor council tenants 190 Source: Hope and Hough (1988) Most studies linking crime with poor areas fail to address whether the main victims of crime are poor people. It is misleading to assume that poor people live in poor areas only, or that only poor people live in poor areas. By avoiding these assumptions we may ask the question who are the main victims of crime in poor areas? It may be, for example, that the victims of crime are disproportionately the better off who live in poor areas. In other words, social scientists need to be aware of the pitfalls of the ecological fallacy (Robinson 1950; Baldwin, 1979). This refers to instances in which inappropriate inferences about relationships at the individual level are made on the basis of aggregate data obtained at the area level. In such situations, individuals are assumed to have the same characteristics of the areas in which they live. Many of the early ecology studies of juvenile delinquency fell into the trap of the ecological fallacy (Polk, 1957; Willie, 1967). In Britain, inappropriate conclusions were made about immigrants and their propensity to commit crime based on recorded crime data showing that crime was highest in areas with an immigrant population (Wallis and Maliphant, 1967). While there is limited discussion of the ecological fallacy in the criminological literature, there is a danger that current assumptions about poverty and crime are failing to take into account the full effects of the fallacy. Poverty and crime: exploring the ecological fallacy
15 This next section examines the impact of poverty at the area level, and the extent to which there are differences in risks of victimisation between different income households using the 1992 British Crime Survey and the 1991 Census. It confirms the correlation between crime and area poverty, although the relationship between crime and poverty at the individual level is more ambiguous. The 1991 Census was used to construct a deprivation index known as the Breadline Britain index in order to link it to the 1992 British Crime Survey. Any census based index will comprise variables that are, at best, proxy indicators of deprivation because none of the questions in the 1991 census was specifically designed to measure poverty or deprivation. The Breadline Britain Index is based upon the characteristics of households and individuals found to be living in poverty from the results of the 1990 Breadline Britain survey (Gordon, 1995; Gordon and Forrest 1995). The findings confirm the importance of area poverty in determining risks of victimisation. Figure 2.11 demonstrates the risks of victimisation according to whether households are in areas of below average poverty or above average poverty (as defined by the Breadline Britain index using the 1991 Census). Forty-five percent of households in areas of above average poverty suffered victimisation in the previous year, compared with only 35% of those households in areas of below average poverty. Figure 2.11 Percent of households experiencing total crime, household crime, burglary, theft around the dwelling and household vandalism in the previous year Percent Total crime Household crime Burglary Dwelling theft Vandalism Note: 1992 BCS: Core sample: weighted data and 1991 Census Type of crime Below average poverty Above average poverty Sources: 1992 British Crime Survey, 1991 Census of Population Households in poor areas are 1.8 times more likely to experience household crime (which includes burglary, theft around the dwelling, vandalism) compared with
16 households in areas with below average poverty levels. A similar pattern can be observed in relation to the separate components of household property crime. In comparison with households in areas of below average poverty, households in poor areas are 2.5 times more likely to be burgled and 1.5 times more likely to experience theft around the dwelling and vandalism. Having established the correlation between area poverty and victimisation, Figure 2.12 illustrates the risks of experiencing total crime amongst different income households within poor area and non-poor areas. It shows that regardless of area poverty levels, there is a positive relationship between total victimisation and household income. In areas of below average poverty, the richest households experience the highest levels of victimisation (49%). They are more than twice as likely to experience some type of victimisation than households in the poorest households. There is a similarly positive relationship between household income and victimisation in areas with above average poverty. Sixty four percent of the richest households experience crime, compared with only 35% of the poorest households. Richer households are more likely to experience total victimisation because a large proportion of crime is vehicle-related, and vehicle ownership is higher amongst richer households than in poor households. Figure 2.12 Percent of households experiencing total crime by gross annual income groups and area poverty (1992 British Crime Survey and 1991 Census). Percent Below average Area poverty Above average < 5,000 5,000-9,999 10,000-14,999 Note: 1992 BCS: Core sample: weighted data and 1991 Census 15,000-19,999 20,000-29,999 30,000+ The next figure (Figure 2.13) examines the relationship between the risk of experiencing household property crime according to household income group and
17 area poverty. Unlike the previous figure the positive relationship between victimisation and income is absent. Instead Figure 2.13 shows that regardless of area poverty levels, there is little difference in victimisation risks amongst the different income groups. In areas of below average poverty, victimisation risks range from 11% to 14%, whereas in areas of above average poverty, the victimisation risks for households are between 19% to 24%.
18 Figure 2.13 Percent of households experiencing household property crime by gross household income group and area poverty (1992 British Crime Survey and 1991 Census) Percent Below average Area poverty Above average < 5,000 5,000-9,999 10,000-14,999 15,000-19,999 20,000-29,999 30,000+ Note: 1992 BCS: Core sample: weighted data and 1991 Census The conclusion that can be drawn from these analyses is that it is often richer households in poorer areas that are victims of crime. If Neighbourhood Renewal projects in poor areas are effective in reducing crime levels this will be of obvious benefit to the community as a whole but it may also be of greater benefit to the richer households than the poorer households. This should be borne in mind when establishing expenditure priorities. Criminal Statistics: Notifiable Offences The Criminal Statistics England and Wales are published annually, together with volumes of supplementary information. The Criminal Statistics provides detail on the number of offences recorded by the police, otherwise known as notifiable offences. This information is routinely available at police force area level and regional level. Information is also contained on offender-based data such as offenders found guilty or cautioned, otherwise known as known offenders. Statistics on those found guilty and cautioned are presented by offence group and by police force area, with separate tables for indictable 3 and summary offences 4. 3 Those offences tried by judge and jury at the Crown Court. 4 Those offences tried at Magistrates Courts.
19 Notifiable offences relate to those offences that the police are required to record. The Criminal Statistics provide information for different offence groupings, but not for other (non-notifiable) offences. This information is available for the 43 police force areas. The Crime and Disorder Act of 1998 places a new statutory duty on local authorities and the police to produce an audit of crime and disorder, and to develop and implement a crime safety strategy. The result of this is that crime data is now being made available at a more localised level. For example, in Kerrier and Penwith data on notifiable crimes are available for police beat areas and this report has analysed the latest available data. However there are a number of serious limitations with using the Crime and Disorder Audit data to measure crime at small area level. Firstly, Police statistics are collected at beat level but these areas do not necessarily relate to other administrative boundaries such as parishes or wards. Even higher level police boundaries do not necessarily correspond with district or other administrative boundaries. There are other concerns relating to the recording and reporting of police data. Offences recorded by the police represent only a subset of total crime committed. According to the British Crime Survey there are four times as many crimes than the police record (Mirrlees-Black et al. 1998). This is mainly because only 44% of crimes are reported to the police. The majority of crimes are therefore not reported to the police. Reporting varies considerably by type of offence. Thefts of cars are most often reported: 97% were in Burglaries in which something was stolen were also reported (85%). Theft from the person and vandalism were the least likely offences to be reported: 35% and 26% respectively. The most common reason for not reporting crimes is that they are seen as too trivial, or involved too small a loss to warrant police attention. Unreported thefts from vehicles, no loss burglaries and vandalism were particularly likely to be seen as too trivial to report. For violence such as wounding and robbery, the most common reason for not reporting was that the victims felt that the matter was private or had dealt with it themselves. Furthermore, not all reported crimes are recorded by the police. In 1997 the British Crime Survey estimated that about 54% of all reported crimes were recorded (Mirrlees-Black et al. 1998). Again the recording varies according to offence type. Thefts of cars and burglaries with loss were the most likely offences to be recorded, attempted vehicle related thefts and violence (wounding and robbery) the least likely. There are a number of reasons for this discrepancy, including police discretion. The police may not record a complaint because of their compliance with victims wishes not to proceed. Other incidents may be regarded as too trivial to warrant formal action, or the police may feel the report is mistaken or disingenuous, or there is insufficient evidence to suggest a crime has been committed. However, the main reason for non-recording is due to the strict Home Office guidelines that Police Forces must follow. However, from April 2002 new guidelines for ethical crime recording should result in crimes being recorded as initially reported, which should lead to some improvements in the statistics.
20 Finally, considerable fluctuations over time in levels of recorded crime are evident when mapping crime at a very small spatial scale such as the ward or parish. This means that any given spatial distribution of crime levels even on an annual basis will be characterised by substantial random changes. Addressing these issues would ideally involve undertaking a large-scale local victimisation survey similar to the British Crime Survey. However, in the absence of such data all these problems should be acknowledge in interpreting available crime statistics. Therefore the following results on crime in West Cornwall need to be interpreted with caution when drafting neighbourhood renewal policies.

21 Methodology In Kerrier, police beat areas are coterminous with parish boundaries. However, there is some divergence between police beats and parish boundaries in Penwith with only approximately two thirds of police beats being coterminous with parish boundaries, effectively constituting sub-divisions within parishes. In these cases and for the whole of Kerrier, it has thus been possible to aggregate total crime statistics to parish level. However, in some areas of Penwith, beat boundaries are unclear and do not correspond with parish boundaries (ie Ludgvan, Madron East, Madron West, Towednack). These areas are therefore excluded in the spatial analyses presented below. Findings During , 52,399 incidents were reported to police across Kerrier and Penwith. Of these, only a small proportion (18.3%) were considered by police to be sufficiently serious to be classified as crimes. In addition to these reported crimes, total crime also includes crimes identified through police investigations. Figures 2.14 and 2.15 below illustrate the frequency of total crimes for the period April 1998 to January 2001 for Kerrier and Penwith respectively. Figure 2.14: Total Crime in Kerrier, Source: Kerrier Crime and Disorder Audit, 2001 In Kerrier, 5150 crimes were recorded during or 56 crimes per 1,000 people (based upon CDRP population estimates). Figure 2.9 (above) is suggestive of a longterm decline in levels of total crime from over 500 in April 1998 to just over 400 in January However, as noted above, and given the substantial fluctuations evident over this period, this general decline should be treated with caution.

22 Figure 2.15: Total Crime in Penwith, Source: Penwith Crime and Disorder Audit, 2001 In Penwith, 4443 crimes were recorded during or 74 crimes per 1,000 people (based upon CDRP population estimates). Figure 2.10 (above) is also indicative of a long-term decline in levels of total crime from over 500 in April 1998 to 350 in January Again, however, this general decline should be treated with caution given the substantial fluctuations from month to month e.g. recorded crime was over 600 in September 1999 and then halved to 300 in April 2000 before rising again. In general, the highest levels of recorded crime are concentrated in the more populous areas of West Cornwall (as would be expected). In Penwith, approximately one third of total recorded crime is concentrated in Penzance and Hayle and St Ives each account for around 13% of the recorded total in Penwith. Similarly, in Kerrier most crime occurs in the more densely populated areas, with Cambourne accounting for nearly one third (32%), and Redruth nearly one fifth (18%), of the recorded total for the district. Controlling for the disparity in population between the more populous large towns in the region and smaller settlements in more remote rural areas has a levelling effect on the spatial distribution across west Cornwall. Figure 2.16 below shows total recorded crime per 1,000 population aggregated to parish level across west Cornwall 5. On this basis police beats within the larger coastal towns of Penzance, St. Ives and Hayle, and the Camborne, Pool, Redruth area recorded higher numbers of recorded crimes per 1,000 population than rural areas although the disparity between urban and rural areas is considerably reduced. However, it must be noted that some of the victims of crime, (particularly in costal towns) will have been tourists, so the adjustment that has been made for population size will overestimate the true crime rates in the tourist areas. 5 The population weighting used here is based upon Office for National Statistics 1998 mid year population estimates.

23 Figure 2.16: Total recorded crime in Kerrier and Penwith by parish per 1,000 population, 2000/01 6 Source: Kerrier and Penwith Crime and Disorder Audits, 2001 In 2000/01 the incidence of reported crime per 1,000 population in the parishes of Penzance (93), Camborne (84), Pool (112), and Hayle (90) was considerably higher than for those rural parishes with the lowest levels of recorded crime per 1,000 population over this period namely St. Martin (11), Zennor (12), Perranuthnoe (14), Sancreed (15). However, it must be strongly emphasised that the levels of recorded crime throughout west Cornwall remain considerably lower than in most other areas of England and Wales. Recorded crime statistics provided by the Home Office suggest that the incidence of crime in all the main categories is lower in rural areas than in urban areas 7. Levels of recorded crime in 2001 in the rural areas of the South West were lower than in urban areas within the region, and levels of crime are generally lower than in other rural areas in England for almost all categories of crime, as Table 2.2, below, shows. 6 Excluding the following police beat areas: Ludgvan, Madron East, Madron West, Towednack beats. 7 Data is collected for Crime Reduction Partnership areas which are generally linked to Local Authority areas, although some may be larger and some smaller. The data cannot be compared directly to data from previous years which used Basic Command Units (BCU) to report since BCU boundaries do not all coincide with Local Authority ones.
 and Home Office, 2001 To conclude, crime in the rural South West in general and in Kerrier and Penwith")
24 Table 2.2: Recorded Offences per 1,000 population, year to March 2001 Source: Countryside Agency (2001b) and Home Office, 2001 To conclude, crime in the rural South West in general and in Kerrier and Penwith in particular is much less of a problem than in other parts of England and Wales. Crime rates in west Cornwall are some of the lowest in the UK. ILD 2000 DEPRIVATION IN KERRIER AND PENWITH As the 2000 DETR report suggests, deprivation is made up of separate dimensions, (or domains ) of deprivation (DETR, 2000a). The extent and distribution of these different forms of deprivation varies between places at both local and regional levels. Table 2.3 summarises the pattern of deprivation at ward level across the six main domains of the 2000 ILD for West Cornwall. Table 2.3: ILD Deprived Wards in Kerrier and Penwith, by Deprivation Domain, 2000 Income Employment Housing Health Education Services Kerrier Penwith English Ward Ranking No % No % Most deprived 10% Most deprived 20% Most deprived 10% Most deprived 20% Most deprived 10% Most deprived 20% Most deprived 10% Most deprived 20% Most deprived 10% Most deprived 20% Most deprived 10% Most deprived 20% As Table 2.3 shows, income and employment deprivation are widespread in West Cornwall, with the great majority of wards in Penwith falling within the most
 of the wards within the 20% most health deprived English wards.")
25 deprived 20% of English wards for both income and employment. Health deprivation is also a significant problem in West Cornwall - especially in Penwith - with four fifths (81%) of the wards within the 20% most health deprived English wards. Comparison with the other four Cornish Local Authorities again reveals the extent of deprivation in West Cornwall (see Appendix II). Effective targeting of regeneration spending involves first identifying those areas experiencing the worst deprivation. A full listing of all the wards in Kerrier and Penwith experiencing deprivation, as measured by the DETR s Domains of Deprivation is given in Appendix II. Those wards ranked within the most deprived 20% of English wards on the DETR s Index of Multiple Deprivation (IMD) are illustrated in Figure 2.17: Figure 2.17: IMD Deprived Wards in West Cornwall, 2000 In mid-1998, those wards falling within the 10% most IMD deprived English wards contained a resident population of 40,400 people and those within the most IMD deprived 20% contained 85,500 people. These figures represent 26.9% and 57.0%, respectively, of the resident population of Kerrier and Penwith according to 1998 mid-year population estimates. All seven of the west Cornish wards classified within the 10% most IMD deprived English wards have been identified by central Government as eligible for Neighbourhood Renewal funding.
26 SMALL AREA MEASURES OF DEPRIVATION A primary task of this research was to identify the poorest neighbourhoods in West Cornwall at small area level e.g. using areas that are smaller than electoral wards. This required a considerable amount of new research work as no predominantly rural area in the country has yet successfully managed to do this within the neighbourhood renewal framework. Methodology The measurement of deprivation at the sub-ward level is constrained both by data limitations and by the appropriateness of deprivation indicators in a rural context. The 1991 Census provides the only reliable data at the sub-ward level for the whole of the UK. One of the main uses of Census statistics is in the construction of deprivation indices, since they form a key element in the allocation of local government and health resources. However, none of the 1991 Census questions was specifically designed to measure deprivation so any Census-based index will be comprised of variables which are at best proxy measures of deprivation (Payne et al, 1996). Moreover, since such indices need to be nationally representative, their construction tends to under-emphasise the distinctive needs of people living in remoter rural areas. Seven indicators derived from the 1991 Census of Population were finally selected. Their appropriateness in the Cornish context is discussed in more detail below under Findings. These measures approximate to the six domains of deprivation (plus the supplementary child poverty index) identified by the DETR and included within the ward level 2000 Index of Local Deprivation: Poverty rate (Income) 8 Child poverty rate (Supplementary) Unemployment rate (Employment) Percent of people aged 18 and over with no post school qualifications (Education) Limiting Long Term Illness/Disability rate (Health) Percent of households with no central heating (Housing) Percent of households with no car (Access to services) Finally, on the basis of these measures, it was possible to construct a scale of multiple deprivation. First, the scores for each Enumeration District were ranked for each measure. Secondly and following the approach adopted by the DETR in the construction of the Index of Multiple Deprivation (IMD) at a ward level, the different domains were weighted to broadly reflect the weightings used in the construction of the DETR s 2000 Index of Multiple Deprivation. This ensured that the final multiple deprivation index was constructed in a similar way to the 2000 IMD used to identify 8 The poverty and child poverty measures are derived from the 1990 Breadline Britain survey (Gordon and Pantazis, 1997) and applied to 1991 Census data (Gordon, 1995; Gordon and Loughran, 1997). These measures are considered to be amongst the most accurate available by many authors (eg Lee et al, 1995; Burrows and Rhodes, 1998; Saunders, 1998).
27 priority districts eligible for Neighbourhood Renewal funding. The following weighting was used:
28 Poverty 20% Child poverty 20% Unemployment 20% Standardised Illness Ratio 12% Post-school educational qualifications 12% Central heating 8% Access to a car 8% Enumeration Districts were then ranked according to their score on this cumulative index and a cumulative population variable constructed. On this basis, it was possible to identify the most deprived Enumeration Districts for any population threshold (in this case the 33% level). It was decided by the steering committee that the research team should identify the poorest areas in West Cornwall in which a third of the population lived. These would represent the primary target areas for receiving Neighbourhood Renewal funding. Mapping Deprivation at the Sub-ward Level For each of the individual indicators described below, an interpolation procedure known as Inverse Distance Weighting (IDW) has been used to map the distribution of deprivation in West Cornwall. There are many advantages to taking spatial data beyond a purely descriptive display method, such as the thematic mapping of points using colours (ie a choropleth map). Deprivation is not constrained by Census boundaries, that is, deprivation usually does not dramatically fall from high levels on one side of an Enumeration District boundary to low levels on the other. IDW interpolation smoothes the gradations in levels of deprivation across Enumeration Districts to generate a more realistic model of deprivation. It also enables a spatial analysis of change over time in socio-economic data. Interpolation is a mathematical process used to estimate values between known point observations. The IDW procedure converts point data into continuous grid layers ( a trend surface) by calculating a value for each grid node by examining surrounding data points lying within a defined search radius. The node value is calculated by averaging the weighted sum of all the points, the weight being a function of inverse distance. Thus, data points that lie progressively farther from the node influence the computed value far less than those lying closer to the node. A technical account of IDW interpolation is given in Appendix II. (1) (1) (2) (3) Northwood Geoscience
29 In illustration (1) above, 24 points are arranged regularly with attribute values ranging from 0 to 2. Any numeric attribute can be represented in 3D form, as depicted in the second illustration. This image is actually a rendered grid generated using IDW interpolation by sampling only one data point and using a very small display radius equal to the width of a single column. However, grids are usually used to build a continuous surface that connects data points in space, effectively removing gaps in the representation of data. IDW achieves this by generating a moving average or smoothing of the data, as shown in illustration (3). This kind of trend surface methodology is made necessary because of Spatial Autocorrelation. Areas next to each other are likely to be more similar than areas further away. Spatial autocorrelation can be defined as the clustering pattern in the spatial distribution of a variable which is due to the very fact that the occurrences are physically close together, that is, that they are in geographical proximity. They are not independent of each other, but are linked. The data are spatially dependent. Spatial autocorrelation is widespread: rich people move to areas where other rich people live; disease can spread from one neighbour to another, etc. If the values in a poverty or health cluster are more alike than would be due to random processes, there exists a positive autocorrelation; if they are less alike than would occur through random processes, there exists a negative autocorrelation. Findings Poverty As the 2000 Indices of Local Deprivation suggest high levels of poverty are endemic across much of west Cornwall. Figure 2.18 (below) shows the distribution of scores for each Enumeration District in west Cornwall for the poverty index. For each Enumeration District the score represents the percentage of households living in poverty as defined by the Breadline Britain in the 1990s Survey 9 (Gordon and Pantazis, 1997) and applied to the 1991 Census data (see Gordon, 1995). The areas highlighted in Figures 2.18 to 2.24 represent the upper quartile of scores for each of the deprivation indicators selected. As Figure 2.18 shows poverty in west Cornwall is concentrated in much of west Penwith (especially the coastal towns of Penzance and Newlyn, St. Ives, St. Just, and Hayle), as well as in the Camborne, Pool and Redruth area, and the Lizard peninsula. 9 In the Breadline Britain in the 1990s survey poverty was defined scientifically using the consensual method e.g. in order to be poor a household had to have both a low income and a standard of living that was below the minimum acceptable to the majority of the British population.
30 Figure 2.18: Poverty rate (%) in Kerrier and Penwith by ED (most deprived quartile) Source: 1991 Census of Population The child poverty index measures the percentage of poor households with children based on the poverty index derived from the Breadline Britain in the 1990s Survey and applied to the 1991 Census data. As such the pattern is slightly different to the overall poverty index described in Figure 2.18 (above). As Figure 2.19 shows, the distribution of child poverty in west Cornwall is slightly more spatially concentrated than for poverty amongst the adult population, with significant clusters of child poverty in some of the more remote rural settlements such as the St. Buryan area, and in St. Keverne and the Lizard peninsula. However, the larger towns (Penzance and Newlyn, Camborne, Pool and Redruth, Hayle, and St. Just) are also characterised by high rates of child poverty. Figure 2.19: Child Poverty Rate (%) in Kerrier and Penwith by ED (most deprived quartile)
31 Source: 1991 Census of Population Health The Standardised Illness Ratio (SIR) measures the incidence of illness (morbidity) standardised by age and sex, where a score of 100 represents the average health of the population of England and Wales. Thus a score of 167 across an Enumeration District means that residents are 67% more likely to experience a long term illness, health problem or handicap which limits their daily activities or the work they can do compared with the average for England & Wales. Conversely, a score of 50 means that residents are less likely to experience illness compared with the average for England & Wales. As Figure 2.20 (below) shows, ill health in west Cornwall is concentrated mainly in north Kerrier. The Enumeration Districts in west Cornwall with the highest scores (ie. within the upper quartile of the distribution) are predominantly in the Camborne, Pool, Redruth area. Smaller pockets of ill health are also evident in the large coastal towns of Penzance and Newlyn, St. Ives, and Hayle, as well as in the Pendeen area, and the Lizard peninsula. Figure 2.20: Standardised Illness Ratio in Kerrier and Penwith by ED (most deprived quartile)
32 Source: 1991 Census of Population Unemployment The Census indicator of unemployment is a more accurate measure of worklessness than Claimant Count estimates since the latter only includes economically active individuals in receipt of unemployment-related benefits. According to this measure the most substantial areas of worklessness are in north Penwith and north Kerrier as a whole, as well as in Penzance and southern Lizard, as Figure 2.21 (below) shows. Unemployment is a particular problem in the larger towns (St. Ives, Hayle, Camborne, Pool and Redruth).
33 Figure 2.21: Unemployment Rate (%) in Kerrier and Penwith by ED (most deprived quartile) Source: 1991 Census of Population Education The distribution of educational disadvantage, as measured by the percentage of individuals without post-school qualifications (degrees, professional and vocational qualifications), is very different than for poverty, child poverty, and unemployment. The distribution of individuals with no post-school educational qualifications is much more dispersed, with significant clusters in many of the smaller and more remote rural settlements across Penwith and especially Kerrier, as Figure 2.22 (below) indicates. This pattern partly reflects the different age profile of rural areas in comparison with the larger towns. Demographic change means that rural communities are increasingly characterised by greater concentrations of older residents compared with larger towns. Since educational attainment also reflects patterns of generational change it is to be expected that educational attainment would be relatively low in many isolated rural communities with ageing populations. However many of the Enumeration Districts in west Cornwall with the highest scores for educational under-achievement are also concentrated in the larger coastal towns of St. Ives, St. Just, and Hayle, as well as across the Camborne, Pool and Redruth area.
34 Figure 2.22: Individuals with No Post-School Qualifications (%) in Kerrier and Penwith by ED, (most deprived quartile) Source: 1991 Census of Population Housing The distribution of households lacking central heating in west Cornwall again differs significantly from the key indicators described above - namely poverty, child poverty, and unemployment. The Enumeration Districts with the greatest proportion of households lacking this basic amenity are concentrated predominantly in west Penwith and especially in the Penzance and Newlyn area, as well as in St. Ives, and St.Buryan.
35 Figure 2.23: Households with No Central Heating (%) in Kerrier and Penwith by ED (most deprived quartile) Source: 1991 Census of Population Access to Services Access to a car is a key dimension of access to community services in rural areas, especially since historical and new data reveal an overall trend of declining geographical availability for some essential services in many rural areas (Countryside Agency, 2001 see Chapter 4). Strikingly, the percentage of households in west Cornwall without access to a car closely reflects the distribution of poverty amongst the adult population (see Figure 2.18). As Figure 2.24 (below) shows, levels of access to a car are lowest in the larger towns (St. Ives, St. Just, Penzance and Newlyn, Hayle, and Camborne, Pool, and Redruth). However, there are also substantial rural areas (eg. west Penwith, the Lizard peninsula) where lack of access to a car is also a significant problem, especially given the remote rural location of these settlements.
36 Figure 2.24: Households with No Access to a Car (%) in Kerrier and Penwith by ED (most deprived quartile) Source: 1991 Census of Population IDENTIFYING PRIORITY AREAS Using the methodology described above it was then possible to map deprivation at a small area level using a cumulative index of deprivation which combines the Census indicators described above, as illustrated in Figure 2.25 (below). The most significant concentrations of deprivation produced by this procedure are in the larger settlements chiefly Camborne, Pool, Redruth, St. Ives, Penzance, and St. Just. However, mapping deprivation at Enumeration District level also reveals smaller pockets of deprivation in rural settlements such as the Lizard area 10, Pendeen, and the Land s End area 10 It should be noted that the Lizard area may well contain a greater numbers of areas of need than these statistics reveal. The highly seasonal nature of work on the Lizard (particularly flower picking and tourism) combined with the influence of the nearby large RAF base and the high number of second homes may obscure the true extent of need in statistical analysis.
, 1991 Census Source: 1991 Census of Population Ranking Enumeration Districts according to their score on this cumulative index meant")
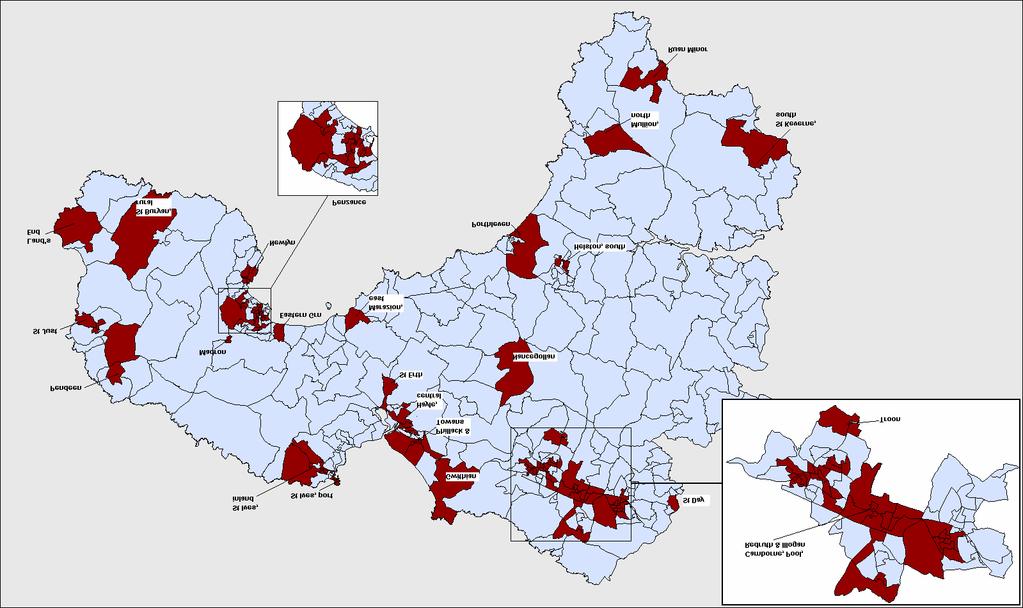
37 Figure 2.25: Cumulative index of deprivation in west Cornwall (IDW method), 1991 Census Source: 1991 Census of Population Ranking Enumeration Districts according to their score on this cumulative index meant it was then possible to identify the most deprived Enumeration Districts for any population threshold (in this case the 33% level as determined by the West Cornwall LSP). The priority areas for NRF funding as determined by this procedure are shown in Figure 2.26, below. A larger scale map of the priority areas with area labels is included in Appendix II. The priority areas are mainly concentrated in the Camborne, Pool, Redruth area, Penzance area, St Ives area, Hayle area, Newlyn area, Helston area, St Just area, Porthleven area, Hayle & Towans, Troon area and Pendeen areas (see Appendix II for details). However, there is also some evidence of priority need in the Lizard area. Figure 2.26: Priority Areas at 33% Population Threshold, 1991 Census
38
39 POOR CONSUMERS AND SOCIAL ENTREPRENEURS Market research companies have created a multi- million (billion?) pound geodemographics industry in Britain which attempts to classify small areas on the basis of the consumer behaviour of the people who live there. This kind of commercial information can be useful to a scientific study in two respects: 1. Geo-demographics data can be used to help validate the measures of deprivation used in this study by examining the fit between this index and the market research data. 2. Market researchers tend to be much more interested in identifying rich and middle-class areas than most academics (for the obvious commercial reasons) so these data may be useful in identifying where the highest concentrations of potential social entrepreneurs live. One such data source is the Experian database of household and neighbourhood types developed as part of the Great Britain MOSAIC project. GB MOSAIC classifies all Great Britain households into 52 distinct lifestyle types which comprehensively describe their socio-economic and socio-cultural behaviour. A MOSAIC type is assigned to each of the 1.6 million postcodes in Great Britain. The type assigned is the one that most closely describes the characteristics of those households and the individuals living there. Methodology A GB MOSAIC type is assigned to each household based upon a large number of statistical measures, originating from different sources and relating either to the individual person, their household, postcode, or other geographic unit such as Census Enumeration Districts or postal sectors. Each year, the data is refreshed (except Census data, which was gathered in 1991) and the GB MOSAIC type assigned to each postcode or household is re-evaluated and, in some instances, changed where the statistical characteristics have altered (for example, due to movements of people or new buildings). A detailed description of the clustering technique used to generate these household types is given in Appendix II. Using the GB MOSAIC profiles, it was possible to construct variables which broadly correspond to indicators of rural poverty, as well the identification of key stakeholders in terms of civic involvement and community regeneration. The following clusters (or household types) were identified as pertinent to the investigation of rural poverty in the West Cornish context: Low rise pensioners (D15) Low rise subsistence (D16) Peripheral poverty (D17) Rural disadvantage (K48) The following clusters (or household types) were identified as pertinent to the identification of potential social entrepreneurs in the west Cornish context:
40 Clever capitalists (A4) Ageing professionals (A5) Small town business (A6) Chattering classes (H36) High spending greys (I48) Findings The areas highlighted in Figures 2.26 and 2.27 represent the upper quartile of the distribution measuring the concentration of social entrepreneurs and rural poor respectively within each postal sector (ie. as a percentage of the total population). As Figure 2.26 shows, households defined as potential social entrepreneurs using the GB MOSAIC classification are concentrated in the coastal areas of Kerrier and Penwith principally around St. Ives, in the south of the Land s End peninsula, and in the west of the Lizard peninsula. Interestingly, comparing the distribution of these community animateurs with the geographical distribution of community organisation (see Figure 4.16) reveals an essentially inverse relationship namely, those areas characterised by high levels of community organisation contain few households defined here as social entrepreneurs. This pattern may reflect the low population densities of the areas containing high concentrations of social entrepreneurs. Community organisation tends to occur in populous areas chiefly major towns which act as nodes in the development of community networks due to their accessibility and physical infrastructure such as meeting halls and other venues. It is likely therefore that social entrepreneurs live outside these areas in more remote settlements and travel in to the main population centres. Alternatively the real social entrepreneurs in west Cornwall may not belong to any of these middle-class professional groups, but may be largely composed of poorer and/or younger social groups. Figure 2.26: Social Entrepreneurs in West Cornwall by Postcode Sector, 2000 Source: GB MOSAIC Experian
, as well as in north Kerrier (principally in Camborne and Redruth), as Figure 2.27 (below) shows. Comparing the distribution of poor consumers with social entrepreneurs (Figure 2.")
41 Households defined as poor consumers using the GB MOSAIC classification are concentrated largely in west Penwith (especially in the St. Just area), as well as in north Kerrier (principally in Camborne and Redruth), as Figure 2.27 (below) shows. Comparing the distribution of poor consumers with social entrepreneurs (Figure 2.26, above) again shows an inverse relationship such that in those areas with high concentrations of poverty as identified by GB MOSAIC social entrepreneurs are relatively scarce. This demonstrates the internal consistency of the GB MOSAIC classification. However comparing the distribution of poor consumers with the geographical distribution of poverty using 1991 Census data (Figure 2.18) reveals the limitations of market research approach to social classification. There is some degree of consistency between the two approaches in the areas identified as containing large proportions of poor households. As Figure 2.27 reveals, in both approaches west Penwith figures prominently, as well as north Kerrier (especially Camborne and Redruth). Figure 2.27: Poor Consumers in West Cornwall by Postcode Sector, 2000 Source: GB MOSAIC Experian However, in contrast with the 1999 Census analyses, smaller predominantly rural settlements (eg. in the Lizard peninsula and in the Marazion area) are overlooked using a classification based upon GB MOSAIC. This inconsistency between Census based and GB MOSAIC based approaches is partly a result of the larger spatial scale of UK postal sectors in comparison with Enumeration Districts, which means that smaller pockets of deprivation within otherwise relatively affluent are often missed. However, it also reflects the different priorities of market research, which focus upon predicting consumer behaviour rather than upon the scientific measurement of poverty and social exclusion. These findings emphasise the fact that geo-demographic market researchers are primarily interested in the location of middle income and richer social groups, whereas social scientific research has often concentrated on mapping the distribution of poorer social groups.
Rural Wiltshire An overview
 Rural Wiltshire An overview March 2010 Report prepared by: Jackie Guinness Senior Researcher Policy, Research & Communications Wiltshire Council Telephone: 01225 713023 Email: Jackie.guinness@wiltshire.gov.uk
Residential & labour market connections of deprived neighbourhoods in Greater Manchester & Leeds City Region. Ceri Hughes & Ruth Lupton
 Residential & labour market connections of deprived neighbourhoods in Greater Manchester & Leeds City Region Ceri Hughes & Ruth Lupton 1 Contents 1. Introduction... 3 1.1 Overview of the report... 3 1.2
Compare Your Area User Guide
 Compare Your Area User Guide October 2016 Contents 1. Introduction 2. Data - Police recorded crime data - Population data 3. How to interpret the charts - Similar Local Area Bar Chart - Within Force Bar
POLICY BRIEFING. Poverty in Suburbia: Smith Institute report
 Poverty in Suburbia: Smith Institute report Sheila Camp, LGIU Associate 8 May 2014 Summary The Smith Institute's recent report "Poverty in Suburbia" examines the growth of poverty in the suburbs of towns
Ward profile information packs: Ryde North East
 % of Island population % of Island population Ward profile information packs: The information within this pack is designed to offer key data and information about this ward in a variety of subjects. It
ARTICLES. Poverty and prosperity among Britain s ethnic minorities. Richard Berthoud
 Poverty and prosperity among Britain s ethnic minorities Richard Berthoud ARTICLES Recent research provides evidence of continuing economic disadvantage among minority groups. But the wide variation between
12 Socio Economic Effects
 12 Socio Economic Effects 12.1 Introduction This chapter considers the socio-economic impact of Edinburgh Tram Line One during its construction and operation. Two main aspects of the scheme are considered:
POVERTY, INEQUALITY AND JUSTICE
 Volume 3 Number 3 November 2015 ISSN 2052-7950 9 772052 795005 POVERTY, INEQUALITY AND JUSTICE 8 Scottish Justice Matters : November 2015 Illustration: Jamie from HMP Shotts POVERTY, INEQUALITY AND JUSTICE
Poverty and inequality: Is York typical?
 Radical Statistics 2013 Poverty and inequality: Is York typical? Jonathan Bradshaw 1 In Poverty: a Study of Town Life Seebohm Rowntree (1901) wrote Having satisfied myself that the conditions of life obtaining
Did you sleep here last night? The impact of the household definition in sample surveys: a Tanzanian case study.
 Did you sleep here last night? The impact of the household definition in sample surveys: a Tanzanian case study. Tiziana Leone, LSE Ernestina Coast, LSE Sara Randall, UCL Abstract Household sample surveys
Assessing change in levels of deprivation in the GoWell study areas
 Assessing change in levels of deprivation in the GoWell study areas August 2015 Summary An analysis of changes in rates of employment deprivation between 2002 and 2011 was undertaken for the GoWell study
Preliminary Effects of Oversampling on the National Crime Victimization Survey
 Preliminary Effects of Oversampling on the National Crime Victimization Survey Katrina Washington, Barbara Blass and Karen King U.S. Census Bureau, Washington D.C. 20233 Note: This report is released to
Community Well-Being and the Great Recession
 Pathways Spring 2013 3 Community Well-Being and the Great Recession by Ann Owens and Robert J. Sampson The effects of the Great Recession on individuals and workers are well studied. Many reports document
Poverty profile and social protection strategy for the mountainous regions of Western Nepal
 October 2014 Karnali Employment Programme Technical Assistance Poverty profile and social protection strategy for the mountainous regions of Western Nepal Policy Note Introduction This policy note presents
ASPECTS OF MIGRATION BETWEEN SCOTLAND AND THE REST OF GREAT BRITAIN
 42 ASPECTS OF MIGRATION BETWEEN SCOTLAND AND THE REST OF GREAT BRITAIN 1966-71 The 1971 Census revealed 166,590 people* resident in England and Wales who had been resident in Scotland five years previously,
Section 1: Demographic profile
 Section 1: Demographic profile Geography North East Lincolnshire is a small unitary authority covering an area of 192km 2. The majority of the resident population live in the towns of Grimsby and Cleethorpes
! # % & ( ) ) ) ) ) +,. / 0 1 # ) 2 3 % ( &4& 58 9 : ) & ;; &4& ;;8;
 ) ) ) ) +,. / 0 1 # ) 2 3 % ( &4& 58 9 : ) & ;; &4& ;;8;") ! # % & ( ) ) ) ) ) +,. / 0 # ) % ( && : ) & ;; && ;;; < The Changing Geography of Voting Conservative in Great Britain: is it all to do with Inequality? Journal: Manuscript ID Draft Manuscript Type: Commentary
! # % & ( ) ) ) ) ) +,. / 0 # ) % ( && : ) & ;; && ;;; < The Changing Geography of Voting Conservative in Great Britain: is it all to do with Inequality? Journal: Manuscript ID Draft Manuscript Type: Commentary
Cornwall. Personal Details: Comment text: Uploaded Documents: Stephen Reynolds. Postcode:
 Cornwall Personal Details: Name: Stephen Reynolds E-mail: Postcode: Organisation Name: SHED (Save Heamoor from Excess Development) Comment text: Attached is a proposal for ward boundaries for the current
Sleepwalking towards Johannesburg? Local measures of ethnic segregation between London s secondary schools, /9.
 Sleepwalking towards Johannesburg? Local measures of ethnic segregation between London s secondary schools, 2003 2008/9. Richard Harris A Headline Headteacher expresses alarm over racial segregation in
how neighbourhoods are changing A Neighbourhood Change Typology for Eight Canadian Metropolitan Areas,
 how neighbourhoods are changing A Neighbourhood Change Typology for Eight Canadian Metropolitan Areas, 1981 2006 BY Robert Murdie, Richard Maaranen, And Jennifer Logan THE NEIGHBOURHOOD CHANGE RESEARCH
QUALITY OF LIFE QUALITY OF LIFE SURVEY 2016 Executive Summary and Research Design
 QUALITY OF LIFE QUALITY OF LIFE SURVEY 2016 Executive Summary and Research Design Quality of Life Survey 2016 Executive Summary and Research Design A joint project between the following New Zealand councils
Statistics Update For County Cavan
 Social Inclusion Unit November 2013 Key Figures for Cavan Population 73,183 Population change 14.3% Statistics Update For County Cavan Census 2011 Shows How Cavan is Changing Population living in 70% rural
HOUSEHOLD LEVEL WELFARE IMPACTS
 CHAPTER 4 HOUSEHOLD LEVEL WELFARE IMPACTS The household level analysis of Cambodia uses the national household dataset, the Cambodia Socio Economic Survey (CSES) 1 of 2004. The CSES 2004 survey covers
Sentencing Chronic Offenders
 2 Sentencing Chronic Offenders SUMMARY Generally, the sanctions received by a convicted felon increase with the severity of the crime committed and the offender s criminal history. But because Minnesota
The National Citizen Survey
 CITY OF SARASOTA, FLORIDA 2008 3005 30th Street 777 North Capitol Street NE, Suite 500 Boulder, CO 80301 Washington, DC 20002 ww.n-r-c.com 303-444-7863 www.icma.org 202-289-ICMA P U B L I C S A F E T Y
bulletin 139 Youth justice in Australia Summary Bulletin 139 MArch 2017
 Bulletin 139 MArch 2017 Youth justice in Australia 2015 16 Summary This bulletin examines the numbers and rates of young people who were under youth justice supervision in Australia during 2015 16 because
Police and Crime Needs Assessment. Karen Sleigh Chief Inspector Andy Burton
 Police and Crime Needs Assessment Karen Sleigh Chief Inspector Andy Burton January 2015 Summary of Nottinghamshire s Police and Crime Needs Assessment Annual assessment of crime and community safety in
How s Life in Switzerland?
 How s Life in Switzerland? November 2017 On average, Switzerland performs well across the OECD s headline well-being indicators relative to other OECD countries. Average household net adjusted disposable
How s Life in the Czech Republic?
 How s Life in the Czech Republic? November 2017 Relative to other OECD countries, the Czech Republic has mixed outcomes across the different well-being dimensions. Average earnings are in the bottom tier
The 2016 Minnesota Crime Victimization Survey
 The 2016 Minnesota Crime Victimization Survey Executive Summary and Overview: August 2017 Funded by the Bureau of Justice Statistics Grant Number 2015-BJ-CX-K020 The opinions, findings, and conclusions
How s Life in the United Kingdom?
 How s Life in the United Kingdom? November 2017 On average, the United Kingdom performs well across a number of well-being indicators relative to other OECD countries. At 74% in 2016, the employment rate
NAZI VICTIMS NOW RESIDING IN THE UNITED STATES: FINDINGS FROM THE NATIONAL JEWISH POPULATION SURVEY A UNITED JEWISH COMMUNITIES REPORT
 NAZI VICTIMS NOW RESIDING IN THE UNITED STATES: FINDINGS FROM THE NATIONAL JEWISH POPULATION SURVEY 2000-01 A UNITED JEWISH COMMUNITIES REPORT December, 2003 INTRODUCTION This April marked the fifty-eighth
People. Population size and growth. Components of population change
 The social report monitors outcomes for the New Zealand population. This section contains background information on the size and characteristics of the population to provide a context for the indicators
District Demographic Profile: Ipswich
 District Demographic Profile: All data is sourced from Office of National Statistics (ONS). The data sets provided cover a range of different periods and these are highlighted next to charts as appropriate.
Crime, place and explaining rural hotspots
 International Journal of Rural Crime, 1: 21-43, 2007 Copyright 2007 Centre for Rural Crime, University of New England Crime, place and explaining rural hotspots R.I. MAWBY Professor of Criminology and
A Socio-economic Profile of Ireland s Fishery Harbour Centres. Castletownbere
 A Socio-economic Profile of Ireland s Fishery Harbour Centres Castletownbere A report commissioned by BIM Trutz Haase* and Feline Engling May 2013 *Trutz-Hasse Social & Economic Consultants www.trutzhasse.eu
poverty, social exclusion and welfare in rural places Paul Milbourne School of City and Regional Planning Cardiff University, UK
 poverty, social exclusion and welfare in rural places Paul Milbourne School of City and Regional Planning Cardiff University, UK definitional issues relative poverty defined in terms of modal income levels
How s Life in Austria?
 How s Life in Austria? November 2017 Austria performs close to the OECD average in many well-being dimensions, and exceeds it in several cases. For example, in 2015, household net adjusted disposable income
Black and Minority Ethnic Group communities in Hull: Health and Lifestyle Summary
 Black and Minority Ethnic Group communities in Hull: Health and Lifestyle Summary Public Health Sciences Hull Public Health April 2013 Front cover photographs of Hull are taken from the Hull City Council
A Socio economic Profile of Ireland s Fishing Communities. The FLAG South West Region including Castletownbere Harbour Centre
 A Socio economic Profile of Ireland s Fishing Communities The FLAG South West Region including Castletownbere Harbour Centre Trutz Haase and Feline Engling May 2013 Table of Contents 1 Introduction...
How s Life in France?
 How s Life in France? November 2017 Relative to other OECD countries, France s average performance across the different well-being dimensions is mixed. While household net adjusted disposable income stands
Monitoring data from the Tackling Gangs Action Programme. Paul Dawson
 Monitoring data from the Tackling Gangs Action Programme Paul Dawson 1 Summary The Tackling Gangs Action Programme (TGAP) was a six-month initiative, which was announced in September 2007 to target and
The Economic and Social Outcomes of Children of Migrants in New Zealand
 The Economic and Social Outcomes of Children of Migrants in New Zealand Julie Woolf Statistics New Zealand Julie.Woolf@stats.govt.nz, phone (04 931 4781) Abstract This paper uses General Social Survey
How s Life in Poland?
 How s Life in Poland? November 2017 Relative to other OECD countries, Poland s average performance across the different well-being dimensions is mixed. Material conditions are an area of comparative weakness:
Economic and Social Council
 United Nations E/CN.15/2014/5 Economic and Social Council Distr.: General 12 February 2014 Original: English Commission on Crime Prevention and Criminal Justice Twenty-third session Vienna, 12-16 April
Telephone Survey. Contents *
 Telephone Survey Contents * Tables... 2 Figures... 2 Introduction... 4 Survey Questionnaire... 4 Sampling Methods... 5 Study Population... 5 Sample Size... 6 Survey Procedures... 6 Data Analysis Method...
How s Life in the United States?
 How s Life in the United States? November 2017 Relative to other OECD countries, the United States performs well in terms of material living conditions: the average household net adjusted disposable income
Rural Manitoba Profile:
 Rural Manitoba Profile: A Ten-year Census Analysis (1991 2001) Prepared by Jennifer de Peuter, MA and Marianne Sorensen, PhD of Tandem Social Research Consulting with contributions by Ray Bollman, Jean
UK notification to the European Commission to extend the compliance deadline for meeting PM 10 limit values in ambient air to 2011
 UK notification to the European Commission to extend the compliance deadline for meeting PM 10 limit values in ambient air to 2011 Racial Equality Impact Assessment (England) August 2009 1. The EU Ambient
How s Life in Hungary?
 How s Life in Hungary? November 2017 Relative to other OECD countries, Hungary has a mixed performance across the different well-being dimensions. It has one of the lowest levels of household net adjusted
UTS:IPPG Project Team. Project Director: Associate Professor Roberta Ryan, Director IPPG. Project Manager: Catherine Hastings, Research Officer
 IPPG Project Team Project Director: Associate Professor Roberta Ryan, Director IPPG Project Manager: Catherine Hastings, Research Officer Research Assistance: Theresa Alvarez, Research Assistant Acknowledgements
How s Life in New Zealand?
 How s Life in New Zealand? November 2017 On average, New Zealand performs well across the different well-being indicators and dimensions relative to other OECD countries. It has higher employment and lower
THE LITERACY PROFICIENCIES OF THE WORKING-AGE RESIDENTS OF PHILADELPHIA CITY
 THE LITERACY PROFICIENCIES OF THE WORKING-AGE RESIDENTS OF PHILADELPHIA CITY Prepared by: Paul E. Harrington Neeta P. Fogg Alison H. Dickson Center for Labor Market Studies Northeastern University Boston,
Human Development Indices and Indicators: 2018 Statistical Update. Eritrea
 Human Development Indices and Indicators: 2018 Statistical Update Briefing note for countries on the 2018 Statistical Update Introduction Eritrea This briefing note is organized into ten sections. The
Ignorance, indifference and electoral apathy
 FIFTH FRAMEWORK RESEARCH PROGRAMME (1998-2002) Democratic Participation and Political Communication in Systems of Multi-level Governance Ignorance, indifference and electoral apathy Multi-level electoral
Assessing the impact of the Sentencing Council s Burglary offences definitive guideline
 Assessing the impact of the Sentencing Council s Burglary offences definitive guideline Summary An initial assessment of the Sentencing Council s burglary offences definitive guideline indicated there
How s Life in Slovenia?
 How s Life in Slovenia? November 2017 Slovenia s average performance across the different well-being dimensions is mixed when assessed relative to other OECD countries. The average household net adjusted
Human Development Indices and Indicators: 2018 Statistical Update. Pakistan
 Human Development Indices and Indicators: 2018 Statistical Update Briefing note for countries on the 2018 Statistical Update Introduction Pakistan This briefing note is organized into ten sections. The
NATIONAL HOUSEHOLD SURVEY: LABOUR FORCE, EMPLOYMENT, AND INCOME
 Clause No. 15 in Report No. 1 of was adopted, without amendment, by the Council of The Regional Municipality of York at its meeting held on January 23, 2014. 15 2011 NATIONAL HOUSEHOLD SURVEY: LABOUR FORCE,
Lived Poverty in Africa: Desperation, Hope and Patience
 Afrobarometer Briefing Paper No. 11 April 0 In this paper, we examine data that describe Africans everyday experiences with poverty, their sense of national progress, and their views of the future. The
An Experimental Analysis of Examinations and Detentions under Schedule 7 of the Terrorism Act 2000
 Equality and Human Rights Commission Briefing paper 8 An Experimental Analysis of Examinations and Detentions under Schedule 7 of the Terrorism Act 2000 Karen Hurrell Equality and Human Rights Commission
How s Life in Ireland?
 How s Life in Ireland? November 2017 Relative to other OECD countries, Ireland s performance across the different well-being dimensions is mixed. While Ireland s average household net adjusted disposable
Life in our villages. Summary. 1 Social typology of the countryside
 Life in our villages Summary The traditional view of villages is one of close-knit communities. Policymakers accordingly like to assign a major role to the social community in seeking to guarantee and
Crime and Justice in the United States and in England and Wales,
 U.S. Department of Justice Office of Justice Programs Bureau of Justice Statistics Crime and Justice in the and in and Wales, 1981-96 In victim surveys, crime rates for robbery, assault, burglary, and
Patterns of Housing Voucher Use Revisited: Segregation and Section 8 Using Updated Data and More Precise Comparison Groups, 2013
 Patterns of Housing Voucher Use Revisited: Segregation and Section 8 Using Updated Data and More Precise Comparison Groups, 2013 Molly W. Metzger, Assistant Professor, Washington University in St. Louis
Assessing the impact of the Sentencing Council s Environmental offences definitive guideline
 Assessing the impact of the Sentencing Council s Environmental offences definitive guideline Summary Analysis was undertaken to assess the impact of the Sentencing Council s environmental offences definitive
Human Development Indices and Indicators: 2018 Statistical Update. Cambodia
 Human Development Indices and Indicators: 2018 Statistical Update Briefing note for countries on the 2018 Statistical Update Introduction Cambodia This briefing note is organized into ten sections. The
Housing and the older ethnic minority population in England
 Housing and the older ethnic minority population in England Nigel de Noronha February 2019 www.raceequalityfoundation.org.uk Housing and the older ethnic minority population in England Summary This briefing,
Human Development Indices and Indicators: 2018 Statistical Update. Indonesia
 Human Development Indices and Indicators: 2018 Statistical Update Briefing note for countries on the 2018 Statistical Update Introduction Indonesia This briefing note is organized into ten sections. The
Changing Times, Changing Enrollments: How Recent Demographic Trends are Affecting Enrollments in Portland Public Schools
 Portland State University PDXScholar School District Enrollment Forecast Reports Population Research Center 7-1-2000 Changing Times, Changing Enrollments: How Recent Demographic Trends are Affecting Enrollments
Chile s average level of current well-being: Comparative strengths and weaknesses
 How s Life in Chile? November 2017 Relative to other OECD countries, Chile has a mixed performance across the different well-being dimensions. Although performing well in terms of housing affordability
Count me in Results of a national census of inpatients in mental health hospitals and facilities in England and Wales.
 Count me in Results of a national census of inpatients in mental health hospitals and facilities in England and Wales November 2005 First published in December 2005 2005 Commission for Healthcare Audit
1. A Regional Snapshot
 SMARTGROWTH WORKSHOP, 29 MAY 2002 Recent developments in population movement and growth in the Western Bay of Plenty Professor Richard Bedford Deputy Vice-Chancellor (Research) and Convenor, Migration
The problem of growing inequality in Canadian. Divisions and Disparities: Socio-Spatial Income Polarization in Greater Vancouver,
 Divisions and Disparities: Socio-Spatial Income Polarization in Greater Vancouver, 1970-2005 By David F. Ley and Nicholas A. Lynch Department of Geography, University of British Columbia The problem of
How s Life in the Netherlands?
 How s Life in the Netherlands? November 2017 In general, the Netherlands performs well across the OECD s headline well-being indicators relative to the other OECD countries. Household net wealth was about
DRAFT V0.1 7/11/12. Sheffield 2012: JSNA Demographics Background Data Report. Data to support the refresh of JSNA 2012
 DRAFT V0.1 7/11/12 Sheffield 2012: JSNA Demographics Background Data Report Data to support the refresh of JSNA 2012 Ann Richardson Public Health Analysis Team NHS Sheffield 722 Prince of Wales Road Sheffield
197 Total stop & searches. Positive searches (82) (includes arrests) 42% 25% Arrests (49)
 (includes arrests) 42% 25% Arrests (49)") 1 197 Total stop & searches 42% Positive searches (82) 25% Arrests (49) Population: 93% White & 7% 128 6 54 2 8 Hampshire s 74% Non-s 26% 27 35 52 65% White 31% 145 Non- During the third quarter of 218/19
1 197 Total stop & searches 42% Positive searches (82) 25% Arrests (49) Population: 93% White & 7% 128 6 54 2 8 Hampshire s 74% Non-s 26% 27 35 52 65% White 31% 145 Non- During the third quarter of 218/19
EUROBAROMETER 62 PUBLIC OPINION IN THE EUROPEAN UNION
 Standard Eurobarometer European Commission EUROBAROMETER 6 PUBLIC OPINION IN THE EUROPEAN UNION AUTUMN 004 Standard Eurobarometer 6 / Autumn 004 TNS Opinion & Social NATIONAL REPORT EXECUTIVE SUMMARY ROMANIA
How s Life in Estonia?
 How s Life in Estonia? November 2017 Relative to other OECD countries, Estonia s average performance across the different well-being dimensions is mixed. While it falls in the bottom tier of OECD countries
How s Life in Australia?
 How s Life in Australia? November 2017 In general, Australia performs well across the different well-being dimensions relative to other OECD countries. Air quality is among the best in the OECD, and average
Ethnic minority poverty and disadvantage in the UK
 Ethnic minority poverty and disadvantage in the UK Lucinda Platt Institute for Social & Economic Research University of Essex Institut d Anàlisi Econòmica, CSIC, Barcelona 2 Focus on child poverty Scope
Attitudes towards Refugees and Asylum Seekers
 Attitudes towards Refugees and Asylum Seekers A Survey of Public Opinion Research Study conducted for Refugee Week May 2002 Contents Introduction 1 Summary of Findings 3 Reasons for Seeking Asylum 3 If
Sentence THE SENTENCING GUIDELINES NEWSLETTER MAY 2005 ISSUE 02
 the Sentencing Guidelines Council MAY 2005 ISSUE 02 The Sentencing Guidelines Council is acutely aware of the growing need for research and statistical information about sentencing as sentencers and local
Sri Lanka. Country coverage and the methodology of the Statistical Annex of the 2015 HDR
 Human Development Report 2015 Work for human development Briefing note for countries on the 2015 Human Development Report Sri Lanka Introduction The 2015 Human Development Report (HDR) Work for Human Development
7 ETHNIC PARITY IN INCOME SUPPORT
 7 ETHNIC PARITY IN INCOME SUPPORT Summary of findings For customers who, in 2003, had a Work Focused Interview as part of an IS claim: There is evidence, for Ethnic Minorities overall, of a significant
Fear of Crime in NDC areas: How do perceptions relate to reality?
 New Deal for Communities National Evaluation Fear of Crime in NDC areas: How do perceptions relate to reality? Christina Beatty Mike Grimsley Paul Lawless Julie Manning Ian Wilson Centre for Regional Economic
Spain s average level of current well-being: Comparative strengths and weaknesses
 How s Life in Spain? November 2017 Relative to other OECD countries, Spain s average performance across the different well-being dimensions is mixed. Despite a comparatively low average household net adjusted
West of England Local Enterprise Partnership Economic Overview. 1. Introduction
 West of England Local Enterprise Partnership Economic Overview 1. Introduction 1.1 This data report provides evidence for a number of key economic indicators in relation to social inclusion and diversity.
IV. Residential Segregation 1
 IV. Residential Segregation 1 Any thorough study of impediments to fair housing choice must include an analysis of where different types of people live. While the description of past and present patterns
II. Roma Poverty and Welfare in Serbia and Montenegro
 II. Poverty and Welfare in Serbia and Montenegro 10. Poverty has many dimensions including income poverty and non-income poverty, with non-income poverty affecting for example an individual s education,
Summary and conclusions
 Summary and conclusions Ethnic concentration and interethnic relations 1. Does the neighbourhood have an impact on interethnic relations? This study is concerned with the question of whether the ethnic
How s Life in Canada?
 How s Life in Canada? November 2017 Canada typically performs above the OECD average level across most of the different well-indicators shown below. It falls within the top tier of OECD countries on household
Census Limerick Metropolitan Area Socio-Economic and Demographic Profile
 Census 2016 Limerick Metropolitan Area Socio-Economic and Demographic Profile Helen Fitzgerald Co-ordinator Research, Monitoring and Communications, PAUL Partnership, Unit 25a Tait Business Centre, Dominic
AHURI Research & Policy Bulletin
 AHURI Research & Policy Bulletin ISSUE 74 June 2006 ISSN 1445-3428 Are housing affordability problems creating labour shortages? Up until 2001 there was little direct evidence that housing affordability
How s Life in Belgium?
 How s Life in Belgium? November 2017 Relative to other countries, Belgium performs above or close to the OECD average across the different wellbeing dimensions. Household net adjusted disposable income
Standing for office in 2017
 Standing for office in 2017 Analysis of feedback from candidates standing for election to the Northern Ireland Assembly, Scottish council and UK Parliament November 2017 Other formats For information on
A New Sound in the Suburbs
 A New Sound in the Suburbs Is Poverty Decentralising in Scottish Cities? By Leo Kavanagh, Duncan Lee and Gwilym Pryce Presented by Gwilym Pryce, Sheffield Methods Institute Research funded by ESRC AQMEN
How s Life in the Slovak Republic?
 How s Life in the Slovak Republic? November 2017 Relative to other OECD countries, the average performance of the Slovak Republic across the different well-being dimensions is very mixed. Material conditions,
Community Profile for Growing Together operational area
 Community Profile for Growing Together operational area The physical environment Location The Growing Together operational area is located in the north-east of Northampton. It consists of four estates
Embargoed until 00:01 Thursday 20 December. The cost of electoral administration in Great Britain. Financial information surveys and
 Embargoed until 00:01 Thursday 20 December The cost of electoral administration in Great Britain Financial information surveys 2009 10 and 2010 11 December 2012 Translations and other formats For information