African Conflict Baselines and Trends
|
|
|
- Denis Mathews
- 5 years ago
- Views:
Transcription


1 African Conflict Baselines and Trends Armed Conflict Location and Event Dataset (ACLED): Overview, Uses & Applications Clionadh Raleigh Caitriona Dowd Andrew Linke March
.")


2 Practice Products for the CCVRI Improving Measurement in DFID Crime, Conflict & Violence Programming This document is one of a series of Practice Products developed under the Conflict, Crime, and Violence Results Initiative (CCVRI). The full set of products is intended to support DFID country offices and their partners to develop better measures of programme results in difficult conflict and fragile environments. DFID recognises the need to focus on the results of its work in developing countries. To this end, DFID strives to account better for our efforts on behalf of UK taxpayers, offering clarity regarding the value and impact of our work. The Results Initiative operates under the assumption that we will achieve our development objectives with our national partners more effectively if we generate collectively a clear picture of the progress being made. Within DFID, the Conflict Humanitarian and Security Department has established a partnership with a consortium of leading organisations in the fields of conflict, security and justice to develop more effective approaches to the use of data in the design, implementation and evaluation of programmes that contribute to reducing conflict, crime and violence. In addition to producing these Practice Products, the consortium has established a Help Desk function to provide direct and customized support to country offices as they endeavour to improve measurement of results in local contexts. The Help Desk can be accessed by contacting helpdesk@smallarmssurvey.org. The views expressed in this Practice Product are the sole opinions of the authors and do not necessarily reflect the opinions of all consortia partners. This Practice Product does not reflect an official DFID position. Members of the consortium 2
3 Document Summary Title: Armed Conflict Location and Event Dataset (ACLED): Overview, Uses & Applications Purpose and intended use of this document: The purpose of this document is to inform policymaking through the provision of a reliable evidence base of disaggregated conflict data and analysis on conflict patterns. This is done through 1) an overview of conflict trends on the African continent, including shifts in the types, agents and levels of conflict over time; 2) an introduction to the concepts of conflict baselines, trend lines and deviations; 3) a detailed analysis of select country case studies for reference; and 4) a series of exercises designed for practitioner use in conflict analysis, based on the ACLED dataset. Key questions this document addresses: What are the new patterns of conflict across African states? How can analysis highlight the spatial and temporal patterns of distinct violence occurring across countries? How does violence affect the development project environment? Key messages/essential take aways : Evidence based analysis of conflict across African states is possible with highly disaggregated information. However, violence patterns can only be understood in terms of the context in which it occurs. This report considers the recent patterns and geographies of conflict across Africa and engages with three new realities of political violence: (1) Despite evidence suggesting civil war is decreasing across Africa, other forms of equally lethal political violence are increasing; a country s rate of local, or informal, political violence can often reach the event counts of a typical civil war, with similar fatality levels; (2) The perpetrators of political violence are more diverse than typically analysed in conflict literature, and these actors are also shifting to reflect a greater localization and informalization of violence. Several types of actors (government, militaries, rebels, militias, rioters) have discrete goals and strategies and pursue these with a low level of spatial overlap between active spaces. (3) Across states, different actors are responsible for particular forms of violence, yet these actors take advantage of the cumulative instability caused by each other, which accounts for periodic high levels of temporal overlap. Intended audience of this document (including assumed skill level): The intended audience for this paper is staff of DFID who can benefit from evidence based analysis and guiding principles; or who can use the concepts and exercises outlined to conduct analysis and monitor dynamic changes in conflicts and conflict-affected environments. The analysis provided does not require specialist knowledge of specific conflict actors, groups or contexts. The exercises outlined require access to Microsoft Excel, and at least intermediate skills in using the programme. Some knowledge of introductory statistical concepts is beneficial in conducting the exercises outlined. Key topics/tags: Conflict, political violence, Africa, analysis Authors and their organisations: Prof. Clionadh Raleigh is a professor at Trinity College Dublin (University of Sussex as of September 2013). She is the creator and director of the ACLED project; her research focuses on the political geography of African states, conflict analysis, and the social and political consequences of climate change. Caitriona Dowd is a PhD student at Trinity College Dublin and the head research manager for the ACLED project. Her work focuses on Islamist political violence across African states. Andrew Linke is a PhD student at the University of Colorado, Boulder. He is a researcher on the ACLED project and his research concerns the spatial analysis for African violence, with a focus on Kenya. Cross-references to other documents in the series: The ACLED website (acleddata.com) contains additional documents (codebook, special reports, monthly trend reports, raw data), interactive maps, interactive graphs and research papers. 3
4 Table of Contents Introduction... 5 Useful Definitions... 5 Baseline and Trendline Information from ACLED... 7 Country Cases Nigeria Zimbabwe Kenya DR-Congo Guiding Principles Nigeria Zimbabwe Kenya DR-Congo Summation Appendices Appendix I: Desk Assessments and Analysis Appendix II: Codebook and User Manual
5 Introduction The Armed Conflict Location & Event Dataset (ACLED) project codes reported information on the location, date and other characteristics of politically violent events in unstable and warring states. ACLED s mission is to provide standardised, disaggregated data on violent political conflict in developing countries for academic, policy and public use. To do so, ACLED collects, publishes and analyses a unique dataset of disaggregated violent political conflict covering fifty of the world s most unstable countries. Historical and monthly real-time data is collected and published for the entire African continent, while data for shorter periods of interest in a range of other countries is also available. This data serves as a basis for academic research, as well as providing an evidence base for international development and humanitarian practitioners, policy makers and the public. The ACLED project produces a range of outputs, including publishing the raw data from collected reports through its website in a standardised, systematic, geo-referenced and verifiable format; writing and circulating a monthly Conflict Trends report which analyses conflict events in the preceding month in a range of African countries; and producing a range of maps for the visualisation of geo-referenced conflict data. The purpose of this document is to inform policy-making through the provision of a reliable evidence base of disaggregated conflict data and analysis on conflict patterns. This is done through (1) an overview of conflict trends on the African continent, including shifts in the types, agents and levels of conflict over time; (2) an introduction to the concepts of conflict baselines, trend lines and deviations; (3) a detailed analysis of selected country case studies for reference; and 4) a series of exercises designed for practitioner use in conflict analysis, based on the ACLED dataset. This paper does not seek to directly address or engage with specific policies or approaches to conflict or conflict-affected environments in or by the Department for International Development (DFID). Rather, the purpose is to introduce an empirical evidence base (the ACLED dataset) and fundamental concepts (directional change, baselines, trendlines) and exercises which can be utilised in the analysis of conflict and conflict-affected environments, as well as in the assessment of policies or practices. Throughout the paper, potential linkages to or implications for policy-making are highlighted for consideration. The intended audience for this paper is staff of DFID who can benefit from the analysis and guiding principles outlined; or who can use the concepts and exercises outlined to conduct analysis and monitor dynamic changes in conflicts and conflict-affected environments. The analysis provided does not require specialist knowledge of specific conflict actors, groups or contexts. The exercises outlined require access to Microsoft Excel, and at least intermediate skills in using the programme. Some knowledge of introductory statistical concepts is beneficial in conducting the exercises outlined herein. Useful Definitions ACLED defines political violence as the use of force by a group with a political purpose or motivation. This definition is used to operationalise political violence through its constituent events and produce a comprehensive overview of all forms of political conflict within and across states. A politically violent event is a single altercation where (often) force is used by one or more groups for a political end; although some non-violent events including protests and broader non-violent activity are included in the dataset to capture the potential precursors or critical junctures of a conflict. The fundamental unit of observation in ACLED is the interaction of actors in an event. Events occur between designated actors for example, a rebel group, a militia or a government force at a specific, geo-referenced location, on a specific day. ACLED recognises a range of conflict actors, the most important of which are defined below: Governments are defined as internationally recognised regimes in assumed control of a state. Government actors are defined by ACLED as a series of separate regimes rather than a uniform body, e.g. Military Forces of Democratic Republic of Congo ( ). 5
6 Rebel groups are defined as political organisations whose goal is to counter an established national governing regime by violent acts. Rebel groups have a stated political agenda for national power, are acknowledged beyond the ranks of immediate members, and use violence as their primary means to pursue political goals. Militias are politically violent groups which do not have a stated aim of obtaining national power. They may engage in conflict with an established national governing regime, or operate in conjunction with or on behalf of government forces or elites. ACLED distinguishes between political militias, associated with particular political organisations, factions or leaders; and communal militias, associated with particular communal, ethno-linguistic or location groups. Rioters and protesters are demonstrators involved in violent (rioters) or non-violent groupings. Civilians are unarmed individuals or group(s) of individuals. Civilians and protesters are distinguished in the dataset as the only non-violent actors: they cannot perpetrate violence against other actors or engage in battles. All actors in the dataset are recorded by a standardised name (e.g., LRA: Lord s Resistance Army) and an interaction code, referring to the actor type (e.g., rebel group, communal militia, civilians). The term interaction is used throughout this paper in reference to engagement between different actor types in a conflict setting. For example, a complex conflict may involve distinct armed groups, but there may be two dominant interactions (government forces and rebels; rebels and militias). ACLED categorises all events in the dataset as one of the following types of conflict event: Battles are conflict events between two armed groups. They are sub-divided into categories based on whether or not territory is exchanged between the contesting forces. Civilians and protesters cannot participate in battles. Riots/Protests are demonstrations against a government institution. Riots are distinguished by their spontaneous or unorganised character and the use of violence. Protests are non-violent events. Violence against civilians involves violence by an armed group against an unarmed civilian population. Events in which armed groups which attack non-combatants, non-violent protesters or other civilians are categorised as such. Non-violent conflict events include a range of activities that does not involve active fighting but is within the context of a conflict, including recruitment of combatants, troop movement, peace talks, and arrests of high-ranking officials or group leaders. The purpose of this event type inclusion is to capture pivot events within campaigns of political violence. This paper introduces and uses several concepts in analysis of conflict patterns and trends. The most important of which include: Baselines are rates and ratios of violence over a time period, an area or a characteristic of an area. Determining a baseline rate of conflict is necessary in order to note change, internal variability and volatility in violence. Baselines are meant to provide a reference point from which to capture a pattern in conflict over a defined period. Trendlines indicate direction and speed of movement of different types of violence. In particular, a trendline can assess how volatile a baseline is, and at which periods increases or decreases occur within a defined time frame (for example, seasonal variations). Standard deviation is a statistical measure which represents the amount values vary from the average (mean). A low standard deviation would suggest values are concentrated around the average (they are all similar), while a high standard deviation would indicate that there is a wide dispersal of values (there is considerable range). 6
 indicates that the positive measures in two sets of values increase in tandem with each other (e.g. education and age); a negative and high correlation (between -.")
7 Correlations are measures of how closely two values track each other. The range is between -1 and +1: a positive and high correlation (between.75 and 1) indicates that the positive measures in two sets of values increase in tandem with each other (e.g. education and age); a negative and high correlation (between -.75 and 1) indicates that a one set of values increases, the other decreases (e.g. as populations increase, house sizes decrease). More information on the exact specifications for the dataset construction, definitions, actors, locations, interactions and event types, please consult the attached Appendix I: Desk Assessments and Analysis. The User Manual in the Appendix II is a brief review of the main data; while the Codebook is a detailed discussion of all aspects of the data collection and coding and is available from For more information on secondary source materials, a working paper specifically on source materials, ACLED Data Sources, is also in the Appendix II. Baseline and Trendline Information from ACLED The levels and forms of conflict across the developing world are changing in response to political and economic volatility within countries. Map 1 presents an overview of new patterns of recent political violence across African states. It clearly displays hotspots in Mogadishu, Goma and Harare, while the continent displays a consistent and widespread rate of political violence. Map 1: Recent Political Violence across Africa ( ) 1 1 A heatmap displays the aggregated range of conflict events where lighter to darker indicates higher rates of political violence aggregate records in locations. This is a continental comparison, meaning the rates of conflict are not based on country specific records, but how the aggregate number of violent events that have occurred within a location compare to all other locations across the continent. Low violence rates are indicated in a blue tone, medium rates in a green tone, high rates in yellow and the highest in red. 7


8 Africa is home to a range of violence in that is distributed across rural and urban areas, perpetrated by a variety of groups, subject to quick changes in leadership, prone to splintering, and often strongly shaped by the ethno-regional characteristics of states. In addition, states are often distinctive in the types of violent conflict that dominate their patterns of political violence. Graph 1 below shows the actual distribution by year and the relative distribution by type of violence occurring on the continent. Despite a relatively consistent showing of battles and violence against civilians, rioting and protesting are clearly on the rise across states. Non-violent activity refers to other important information that often sets the context for further violent action (e.g. rebel recruitment drives, arrests etc.). Graph 1: Breakdown of Violence across Africa 2 This report considers the recent patterns and geographies of conflict across Africa and engages with three new realities of political violence: (1) Despite evidence suggesting civil war is decreasing across Africa, other forms of equally lethal political violence are increasing (see Graph 1); a country s rate of local, or informal, political violence can often reach the event counts of a typical civil war, with similar fatality levels; (2) The perpetrators of political violence are more diverse than typically analysed in conflict literature, and these actors are also shifting to reflect a greater localization and informalization of violence (see Graph 2). Several types of actors (government, militaries, rebels, militias, rioters) have discrete goals and strategies and pursue these with a low level of spatial overlap between active spaces. (3) Across states, different actors are responsible for particular forms of violence, yet these actors take advantage of the cumulative instability caused by each other, which accounts for periodic high levels of temporal overlap. 2 Number of Records refers to the total number of daily, location specific, politically violent events that occurred within a state. These are aggregated by year across countries. 8
, Democratic Republic of Congo 1997 2001 (Kabila, L.")
9 Graph 2: Who is Committing Violence? 3 Governments are defined as internationally recognized regimes in assumed control of a state. Government actors are defined by ACLED as a series of separate regimes rather than a uniform body (e.g. Congo/Zaire (Mobutu), Democratic Republic of Congo (Kabila, L.) and Democratic Republic of Congo (Kabila, J.). Rebel groups are defined as political organisations whose goal is to counter an established national governing regime by violent acts. Rebel groups have a stated political agenda for national power, are acknowledged beyond the ranks of immediate members, and use violence as their primary means to pursue political goals. Militias are more difficult to assess since they can be created for a specific purpose or during a specific time period (e.g. Janjaweed) and may be associated with an ethnic group, but not entirely represent it (e.g. Kenyan Luo ethnic militias). ACLED s definition of organised political groups included militias operating in conjunction or in alliance with a recognized government, political elite, and rebel organisation or opposition group. These groups are typically supported, armed by, or allied with a political elite and act towards a goal defined by these elites or larger political movements. Whereas opposition parties often have a militia arm, groups such as the Sudanese Janjaweed or Serbian Tigers work as supplements to government power. These groups are not subsumed into the category of government or opposition, but are considered as an armed associated wing and represented in the political militia category in Graph 2. Alternatively, ethnic militias can be long-term policing units, such as those common among Somali clans. ACLED coders distinguish between ethnic militias involved in communal violence (militias against each other) and those involved in conflict with governing forces (e.g. Karamojong violence in Uganda). Riots are violent, spontaneous groupings populated by rioters. These activities are coded as riots if the spontaneous civilian actors become violent against people or property. Protests are non-violent spontaneous groupings with protesters. However, should violence be used against protesters, this is considered violence against civilians. Should protesters become violent, this action is considered a riot. Protesters and civilians are 3 Number of Records refers to the total number of daily, location specific, politically violent events that occurred within a state. These are aggregated by year across various main actor types. 9
10 the only unarmed actors included by ACLED. These groups are either the direct victims of armed violence or are organized groups protesting peacefully. This report presents brief conflict analyses before suggesting practical implementation of on-the-ground analysis. Both the analyses and the implementation are guided by baseline assessments and trigger patterns. Baseline assessments are common tools across development and humanitarian organisations, but not often used in academic work or cross-country comparisons. However this report utilises baseline assessments in order to observe the volatility in all types of political violence as a response to spatial, temporal and demographic characteristics of states. Four states are chosen to exemplify the main patterns of violence and the architecture of crisis across Africa presently. The choice of selected states reflects the disaggregation of data and distinctions between ratios of violent events to fatalities, per capita rates, size of state, number of actors, number of hotspot locations and different types of violent interaction for the past fifteen years. In short, the report suggests that country violence patterns can be grouped into distinctive categories including (1) Multiple Conflict Transition State (e.g. Nigeria); (2) Repressive, Centralized Control State (e.g. Zimbabwe); (3) Public and Elite Instability State (e.g. Kenya); (4) Conflicted and Fragile State (e.g. DR- Congo). In all cases, violence patterns are distinctive in their actors, sequencing, involvement of civilians and responses from governments. These specific patterns have clear implications for programming and offer different scenarios for intervention, conflict management and peace building. Using simple methodologies, practioners can determine the nature and patterns of local to national political violence. Further, they can assess the rate of change across regions, types of violence and actors. With this information, practitioners can better assess factors such as civilian population vulnerability across time, space and social groups; the reach of violent actors throughout sub-national spaces; anomalies in the rate and frequency of rioting activity or other civil unrest; and security risk in highly volatile environments, using a reliable evidence base for policy, programming and intervention decisions. Baseline Literatures and Use Both baselines and assessments are frequently used by development and humanitarian practitioners and policy-makers to detect a starting point from which a comparison can be made and to explore the variations in causes, correlates, triggers and feedback loops of conflict. The difference between assessment and baselines is that an assessment is an exploration of realities and underlying contexts, while a baseline looks at trends, triggers and changes during a defined time period. By using baselines, an analyst can determine how varied and volatile conflict is across time and space, and how sensitive a conflict is to triggers (World Bank Conflict Analysis Framework- CAF, 2002). 4 Comparative baselines are possible due to the availability of event-level conflict data. Reducing conflicts to discrete events means that we can interpret the dynamics of violence, and more information can be deduced from aggregating events in different ways. For example, instead of noting that the LRA is a rebel group active in Northern Uganda and neighboring states, an atomic 5 view of this conflict involves over 3,500 discrete events, over four countries and nineteen thousand recorded fatalities. Using a baseline to compare time periods (e.g. yearly violence totals), an analyst can identify new potential activity and inter-relationships across violence types. They can allow an analyst to predict both event rates and fatality levels across unstable countries. Given baseline information, we can determine the volatility of actions, actors, events, interaction and fatalities. Baselines are rates and ratios of violence over a time period, an area or a characteristic of an area. Determining a baseline rate of conflict is necessary in order to note change, internal variability and volatility in violence. Baselines are meant to provide a reference point from which to capture a pattern in conflict over a defined period. 4 Baseline or assessment analyses by humanitarian and development organisations present conflict as dynamic systems with several relevant scales of analysis. This is the basis for the conflict tree assessments in which roots are static factors, the tree trunk is manifest issues- or topics- and the leaves are triggers. Other analysis tools are actor focused. 5 Event data is frequently collected in atomic form- meaning that a standard unit forms the basis for the dataset. In ACLED, each event occurs on a specific day, in a specific location by named actors. These can be aggregated to capture a campaign of violence. Other datasets present a campaign based unit where the information is aggregated by time and space. For example, the LRA activity would be recorded as single daily events in an atomic set, which in a campaign dataset, LRA activity would be aggregated over time and space (e.g. LRA activity in Northern Uganda in 2005). Comparisons across countries and times can be made with atomic data, but is significantly more difficult with campaign events. 10
11 The trends in violence display directions (increase or decrease) and degrees of variation in response to triggers. Triggers can be elections, GDP changes, government shifts, and/or disasters. However, individual events and types of conflict are highly responsive to previous rates of violence and concurrent types of violence. For example, across areas that witness an increase in civil war events (events involving government and rebel group conflict), may experience subsequent increases in events involving militia groups, as groups tend to coalesce in rebel-affected areas. Trendlines indicate direction and speed of movement of different types of violence. In particular, a trendline can assess how volatile a baseline is, and at which periods increases or decreases occur within a defined time frame (seasonal variations?). Country Cases We review recent shifts in political violence through baseline assessments and trend analysis using four African states. Kenya, Zimbabwe, Nigeria and DR-Congo are the states chosen, which exemplify the main patterns of violence and the architecture of crisis across Africa. These states differ in their ratios of violent events to fatalities, per capita rates, size of state, number of actors, number of hotspot locations and different types of violent interaction for the past fifteen years. Each state is emblematic of other states, largely similar in how the main types of violence evolve. All measures are per capita and relative to all other African states during the same time period. Hence Kenya has a high incidence of events based on its population, although the event total over time are lower than that of Nigeria, which has a substantially larger population (please see Table 1). Table 1: Cases of Political Violence Country Events from Fatalities from Number of Distinct Conflict Groups Main Type Nigeria Low High Low Multiple types of actors, activities and goals throughout a densely populated state Zimbabwe High Low Low Government repression and suppression throughout the state Kenya High High Low Intercommunal and political militia violence DR-Congo High High High Post-civil war but multiple and persistent threats Similar Cases Sudan, Ethiopia, and Ivory Coast Swaziland, Namibia, Guinea-Bissau Uganda, South Sudan South Sudan, Somalia In comparing these states to each other and to other similar conflict scenarios, we attempt to link patterns of conflict in terms of action and/or political context. For example, Kenyan violence is similar to South Sudan, as are some component of DR-Congo violence. These states differ on the number of active actors per capita, and the types of actors (at various periods, DR-Congo and South Sudan have been home to several rebel groups), yet the rate of violence across these states can be remarkably similar. South Sudan has a high number of actors, but has a mix of conflict patterns found most clearly in Kenya (as much of the present violence with Sudan is being fought on disputed territory, which is categorised separately to the violence occurring in undisputed South Sudanese territory in the ACLED dataset, both Kenya and South Sudan are home to high numbers of political and communal militias). In the following section, we will investigate the intricacies of the conflict patterns within each state, and across states, before suggesting guiding principles for each type of violence. Nigeria From , Nigeria has experienced 2,849 events of political violence. Given the large population of Nigeria, the per-capita rate of political violence in Nigeria is relatively low. Despite this low per capita rate, the fatality rate in Nigeria is one of the highest in Africa. While Nigerian conflict does not necessarily lead to higher numbers of casualties than elsewhere, more conflict events taking place in Nigeria report fatalities than 11
12 those in many other states. In addition, compared to the number of people in the state, there are few conflict groups. This, combined with the fatality result, suggests that Nigerian actors committing fatal violence are more clustered and organised than those found in other states. These patterns are similar to those found in Sudan, Ethiopia and the Ivory Coast. Baselines: Violence is increasing in Nigeria and, over time, has shifted from a southern civil war to a central and northern militia contest. Political violence has increased by a factor of three from to , yet fatality averages have remained stable over this time period, with an average of five fatalities per event. As a result, the number of events and the fatality levels in Nigeria are not correlated. The main conclusion of the past 15 years in Nigeria is that there has been a change in violence from a contained, southern conflict to a dispersed and diffuse campaign by several militia actors operating in central and northern areas (see Table 2). Table 2: Nigeria Political Violence Tallies Events Fatalities Nigeria Average SD Range Average SD Range Baseline Details: In Nigeria, battles between opposing groups are the most frequent type of political violence. However, violence against civilians is also a common occurrence, and increasingly so in recent years. Indeed, violence against civilians constitutes more events by proportion in highly violent years than do battles. Hence when violence increases in Nigeria, it is civilians who bear that cost. Overall however, battles and violence against civilians is highly correlated across the past 15 years. Indeed, the number of distinct types of interactions (the number of different types of groups engaging one another in conflict) and where (exact location of violence) are also highly correlated with the number of events. 6 This implies that conflict events increase alongside an expansion in the territory in which they occur, and the number of different types of interactions (between militias, rebels, civilians, etc.) engaged in violent conflict. This is in contradistinction to a more contained violent context in which an increase in violent conflict events is associated with the intensification of violence in a specified geographic area or along preexisting interactions. In the past 15 years, when violence has increased, the number of actors, actions and locations of violence have similarly increased, indicating that groups take advantage of collective instability to pursue a wider range of actions in new locations. The geography of Nigeria s violence supports the notion that more events drive increase in locations and actors (in different parts of the state). However conflicts are becoming more common due to increased and more diffuse events, such as those being perpetrated by Nigeria s newest major threat, Boko Haram, whose organisation and strategies require senior level organisation and cooperation. In absolute terms, the most active areas of Nigeria include: Delta, Lagos, Rivers, Plateau, and Bayelsea. The areas with the most fatalities include: Plateau, Kano, Delta, Borno, Lagos. The areas with the most actors include: Taraba, Kano, Nassarawa, Benue, and Kaduna. Over the past 15 years, the increase in actors is largely due to the high numbers of distinct ethnic groups involved in communal, local, violence. However, distinct ethnic and communal groups are differentially vulnerable to violence. If the average citizen is a member of the The Ukwuani-Aboh-Ndo (Kwala) group, they have the highest risk of violence three times that of the Igbo or the Yoruba and far higher than that of the Hausa (six times). The Hausa group s general risk is lower than the norm, despite being an ethnic community in Kano where fatalities are the highest in the country. By administrative zone, the Delta, Borno 6 Correlations rates to events are 91% for interactions and 87% for locations. 12
13 and Federal Capital regions have the highest ratio of events per capita. For fatalities, Kano has by far the highest ratio- for each event in Kano; there are higher fatalities than in other areas of the country; Taraba and Delta follow this at distance. The lowest ratio of events to fatalities, per capita, is Kano and Taraba. Trends & Triggers: Nigerian violence patterns were unresponsive to national level changes in key indicators including elections, oil price, GDP rates and institutional change. However, the volatility in political violence event rates was positively correlated to GDP change rates, albeit somewhat weakly. This indicates two important caveats in relation to Nigeria: (1) different types of violence have different trigger correlations; and any relationship between violence and triggers is not evident when violence rates in regions are combined. For example, riots may be highly responsive to oil prices (and other forms of violence not responsive), but the remaining forms of Nigerian violence are not. Since riots constitute a small part of the overall violence rate in Nigeria, the relationship has limited significance for conflict in Nigeria in total. Further, correlations for active groups are no clearer but no group type (rebel, militia, etc.) is driven correlations with external trigger forces. There is far more evidence that (2) violence responds to violence on the local level and in real-time, meaning that once violence starts in a region, it begins a violence cycle which encourages other forms of violence and actors. Interactive Patterns and Simultaneous Occurrence 7 A citizen of Nigeria faces the following risks: if they live in a region that has recently experienced a politically violent event, it is more likely than not to have been committed by a militia (53%); the event is equally likely to have been an act of violence against civilians (40%) over a battle between two forces (39%). The event is somewhat unlikely to have been a riot (18%). The state s military may be involved, as their actions occur in the same regions and months as militia actions up to 50% of the time; however, government actions are most predictable in areas where militias have previously been active (54%). Hence, the government seems willing to engage in battles, particularly against militias, but not in violent conduct against citizens (occurring less than 20% of the time in regions where the government is active). Further underscoring that the Nigerian military consistent responsiveness is lacking, they are less likely to be active in the same administrative units for several months. Despite an on-going civil war, a citizen of Nigeria is unlikely to experience a rebel event. Rebel actions are a small (6%) proportion of all violence in Nigeria and highly clustered in space and time- a location which is rebel active is likely (14 times national rate) to experience a repeat rebel action. Again, the government is highly responsive to such opposition groups -the government is twice as likely to respond in these areas as in other parts of the state, possibly due to the resource wealth in the active areas. Hence, the basic pattern suggests that rebel actions are both highly clustered in Delta and under active suppression by the government. This renders rebel action a relatively unlikely occurrence in Nigeria. Despite the dominance of militia activity in Nigeria s violence pattern, the types of militias and their overall risk to civilians and the state differs. To the average citizen of Nigeria, the presence of political militias is concerning, as more than half of their actions are against civilians and their actions are grounded in space, in that they repeat actions in the same areas for several months (underscoring these individual groups largely local focus). If militias are active in a region, there is an immediate threefold increase in the risk of violence against civilians compared to national averages, and a continued, but lessened risk (1.5 times) of violence against civilians in that region in following months. In comparison, communal militia violence defined as acts of violence perpetrated by locally, communally or ethnically defined militant groups is highly clustered and repeated. In areas and months where a communal militia event occurs, the following month and same location has a seven times higher likelihood of a communal action event occurring compared to the country at large. However, these groups are much more likely to engage in interactive battles with other communal groups- 74% of their activity are battles, and 24% are violence against civilians. They neither pose a risk to the state (as evidence by the general non-response to such actions) nor pose a serious risk outside of an immediate ethnic area. Rioting is clustered and not 7 These statistics were devised by aggregating distinct forms of violence into the month and administrative zone in which they occurred (events are originally recorded as occurring at specific dates in distinct town locations). 13
14 associated with other forms of violence. It largely predicts itself and locations with recent riots have a threefold risk of repeat over national rates. Summary: Nigeria is a highly active state that has made a transition in the past fifteen years towards more political violence, in more areas of the state and conducted by more diffuse and local actors. However, several key groups namely Boko Haram and strong region-wide militia groups are responsible for attacks with high fatalities. Most militia groups are active within small areas and most violence by militia groups is largely against civilians, and elicits a strong response by the government. However, the diffuse nature of the groups means that the government is not responsive to all (and indeed many work in collusion with local governing elites). Finally, communal militia groups are responsible for high actor numbers in smaller and peripheral parts of the nation, but these actions are distinctly local events between violent groups. This country has both multiple conflicts and is in transition to a more dominant form of militia conflict. This indicates a greater degree of conflict diffusion, more actors, and unfortunately, in this case, a higher degree of fatalities. These findings can inform policy and programming in several meaningful ways. The shift in violence from a relatively contained conflict in terms of geography and actors to a more diffuse one may have implications for development, conflict management, and peace building interventions, particularly where the main arenas of violence have shifted geographically. A reliable evidence base which highlights the increased use of violence against civilians in conflict, and its prominence in high-violence years, speaks to changes in civilian population vulnerability, and may have implications for policy choices in protection, and potentially humanitarian response in the event of population movement. Tracking patterns in state response to violence by non-state actors may highlight important gaps in capacity, reach and/or political will, particularly where state response or engagement with violent non-state actors is concentrated geographically or in response to particular types of violence. Zimbabwe In comparison to other states across Africa, Zimbabwe has a high violence rate for its population. However, its reported fatality rate is exceedingly small, as are the number of active actors. This is due to a campaign of repression across the state perpetrated by a select cabal of groups, the dominant group being the Zimbabwean state/military/chief party. These patterns are largely similar to other centralized states remaining in Africa which are largely subject to military style rule. Violence increased in Zimbabwe from 2002, and since that time has stayed stable and high at an average of 300 plus events per year. This average largely disguises the more than 800 events which take place during Zimbabwe election years (2002, 2008). Reported fatality levels are exceedingly small, at an average of 22 deaths a year due to political violence. This fatality rate is extremely low despite the main form of violence in Zimbabwe being violence against civilians from both government and militia groups. High rates of violence and small fatality totals support two important political objectives in Zimbabwe. First, violence keeps civilians in a state of constant repression and fear of political parties and violent wings. Second, the low fatality level prevents too much intrusion from foreign parties (governments, donors, agencies). A campaign of intimidation and repression has shaped the current political culture in Zimbabwe to the benefit of the government (see Table 3). Table 3: Zimbabwe Political Violence Tallies Events Fatalities Zimbabwe Average SD Range Average SD Range Violence against civilians (VAC) accounts for the high levels of violence in Zimbabwe, and in similar (but less intense) southern Africa states. Over 80% of all political violence undertaken in Zimbabwe each year is VAC, 14
15 and the most frequent perpetrators of this violence are militias, followed by the government. Among these militias, however, are pro-government armed groups, a fact which may mask the overall control the government exercises over violence against civilians and political violence more broadly in Zimbabwe. Other acts, including riots, protests and battles, are infrequent occurrences in general. Few groups perpetrate the violence that takes place in Zimbabwe. There are a low overall number of interactions in the state (at an average of 8 a year compared to 16 in Nigeria). There are multiple locations that regularly experience violence. Indeed the higher the violence total, the more diffuse the violence is (57 locations on average a year). There is a high overlap in which administrative zones are the most violent, have the highest number of distinct active groups, and clustered fatalities: The areas with the most actors are Harare; Mashonalands (East, Central and West); and Bulawayo. Harare has by far the largest number of records and fatalities, followed by Mashonalands (East and Central); Manicaland; and Mashonaland West. Location matters in Zimbabwe: Harare has 85 times the violence of the lowest area. However, it has twice the mean amount of violence across Zimbabwe. The Shona ethnic group have a 40 times higher rate than the Tonga group, and twice the normal rate of that across the state overall. They have four times the rate of the next closest, which is the Nsenga. Interactive Patterns and Simultaneous Occurrence A citizen of Zimbabwe is most likely to experience an act of violence by a militia, but is unlikely to be killed. If the region in which a citizen lives becomes active, it is far more likely that a militia conducts the violence (68%) than the government (25%). If a citizen does live in a militia active area, it is highly likely that militia will repeat actions in the same administrative zone (88%) in subsequent months. Compared with other states, Zimbabwe actions display very specific sequencing of violent actions. Although militias are quite active, and indeed are the main force behind the violence as it occurs in Zimbabwe, government action actually shapes what kind of actions occur and where. There is a very low rate of militia action in areas where government forces have recently been present. This indicates that while the government is contracting out much of its repression, it seeks not to be seen as colluding with militias, nor do militias challenge government authority in areas where they are active. In addition, the government is specific about which actions it responds to. Compared to other states, Zimbabwe has a lower riot re-occurrence rate at 46%: it is as likely than not that an area that experienced a riot may have another in the next year. Riots are slightly more likely following a government action in a region, but are less likely if militias are active or have been active in that region. In addition, the risk of violence against civilians is highest in areas that have recently experienced a riot, although this is likely to be by government forces and not by militia forces. The government responds by punishing groups that have actively opposed it through riots or protests, but is unlikely to instigate attacks on inactive civilians. That role is left to militia groups, hence militia groups are pre-emptive in that they search out and nullify opposition. The government is largely reactive, and in doing so manages the public perception of its own role in creating instability. Zimbabwe has few external triggers, like other states. However, the rate of violence is positively correlated to elections (with increases of %). Violence due to elections does not bode well for future years, notably The recent evidence suggests that 2013 will experience a two to three fold rise in violence during the year, but there is also an indication that the main players will have changed before that point. Indeed, with speculation that President Mugabe will be unfit to hold office due to age and ill health, internal competition within the ZANU-PF party could change the rate, geography and type of violence during the election season. As in the Kenyan case, it is evident that the rate and level of violence is shaped by the degree of opposition and incumbent competition. However, in years where the internal competition within the ruling party has dominated the election cycle, the violence has often been shaped by local determining issues (e.g. opposition candidates). Zimbabwe is similar to other centralized and repressive states, and indeed such states go through difficult transition periods, involving coups, suppressed opposition and complicated successions. As is evident from Guinea Bissau in 2012, these states find the move to democracy challenging, especially for the civilians. 15
16 This analysis offers several insights for policy makers and practitioners. The geographic profile of Zimbabwean violence is heavily urban: rural violence profiles may suggest issues with state absence and reach, but urban violence has implications for state building in areas such as credibility and legitimacy. Urbanconcentrated violence may also inform development and livelihood-building priorities focusing on urban vulnerability. The prevalence of violence against civilians and the dominant role of militias in perpetrating it highlights not only civilian vulnerability, but also potential entry-points for security sector reform, disarmament and demobilization. Finally, links between elections, internal and external competition, and violence patterns can sever as an evidence base for policy making and preparedness in future. Kenya Kenya has experienced over 2,500 events of political violence in the past 15 years. This total is high in two respects: given the population of Kenya, it indicates that a Kenyan has a higher chance of experiencing a violent event compared to citizens of other states; and these rates are especially high for a state without a civil war. Compared to other states, the fatality rate is high, yet the number of actors involved is relatively low, despite the persistently high rate of pastoralist violence. Violence in Kenya is volatile in comparison to other states. While the election years of saw a drastic increase in violence and brought new attention to the range and form of Kenyan violence, the average rate of violence is 185 events a year (similar to Nigeria) rising in the recent past (average rate of 264 since 2007). Hence, in event number terms, the distinction between pre- and post-2007 is less relevant, as is the distinct between election and non-election years. Kenya has a high rate of political violence that transcends simply categorization; for example some election years are quite peaceful, others have been quite violent. Despite the relative persistence in event numbers, fatality totals are highly volatile in Kenya. Recent years have witnessed the highest death rates (at 1071 in 2007) and also the lowest (113 in 2009), since ACLED has recorded data. The rate of events and the magnitude of fatalities are highly correlated. A high violence year will lead to higher than average deaths across Kenya, whereas a low violence year will experience fewer deaths. The rate of death does differ by action: for every event where a communal militia attacks civilians, there are on average 4.28 deaths. Events in which the government attacks a communal militia result in four deaths. Events involving political militias produce two deaths on average (see Table 4). Table 4: Kenyan Political Violence Tallies Events Fatalities Kenya Average SD Range Average SD Range , ,071 Kenya, unlike Nigeria, does not have an active civil war but it does have the same average number of interactions (at 16 per year) and has the same number of average active locations a year (at 84). Its violence and those who conduct it are highly correlated and equally active across the state. Kenya s violence pattern is remarkably consistent across actors and types, barring the actions of rebels. Battles, violence against civilians, actions by governments, political militias, communal militias and rioting each amount to 30% of all actions 8. Yet, the variety of interactions and the locations in which they occur are positively correlated: a more diffuse violence pattern means more types of violence are occurring more frequently. This is a primary distinction from Nigerian violence, where the interactions, locations and events are not as strongly correlated. Indeed, the persistence of Kenya s violence indicates that it is, in part, factored into political manoeuvring within that state. It is part of how the state functions, instead of being shock treatment as it appears in Nigerian locations. 8 This is possible as each of these events is a combination of different aggregating factors in ACLED: ACLED can categorize by event type (e.g. violence against civilians, battles, riots) and by group type (political militias, governments, communal militias). 16
17 There are, on average, 69 episodes of violence against civilians a year in Kenya ( ). The average number of battles is 56; the average number of riots and protests is 55. Fatalities for battles are about 149 a year; 33 for rioting; and 216 for violence against civilians. Volatile years of VAC are highly associated with the generally volatile or high activity years. The most common politically violent action in Kenya is a political militia group attacking civilians, yet the most fatal actions are by small ethnically distinct communal militia groups who kill at almost double the mean rate of political militia groups. Unlike political militias, communal militia activities are largely predictable in time and space (in part because they constitute a greater share of Kenya s violence compared to other states with communal activity): there is a distinct increase in violence towards the end of the year in Kenya and in January. January has by far the highest (double the normal) rates and fatalities are also almost double the normal rates. The Rift Valley is the most fatal, followed by other areas which high rates of violent interactions between mainly pastoral groups (Eastern and North Eastern). Although communal militias conduct an equal share of the violence (30%), they are over-represented in actors and locations because such violence is often locally contained and distinct by ethnic community, hence it takes the form of multiple discrete and somewhat unrelated events. Political militias are organised for longer term goals, and hence there are fewer actors and actions that are more coordinated with political shifts in the state at large. Interactive Patterns and Simultaneous Occurrence An average Kenyan citizen is relatively safe if living in a rural area and not a member of a pastoralist group. However, this safety is largely contingent upon which ethno-regional community she is a member of and whether it is an election year. Despite popular conceptions, in contrast to Zimbabwe election years, there is not a defined pattern to the increased violence. Over the three elections held in Kenya in 1997, 2002 and 2007, different patterns of violence have been evident and 2002 have minimal divergences from typical years; yet 2007 saw an over 300% increase. However, fatality levels vacillate in line with political contexts. In 1997 there was a minimal increase in fatalities; the 2002 election experienced a high rate of fatalities and events in the preceding year (2001). In , both fatalities and events were very high. Each election shows different patterns from the last. This is in part due to differences in pre or post-election violence conducted in Kenya s past three elections. Indeed, those patterns are reflective of the election environment, competition, and issues for the ruling party. In each of Kenya s three elections, the main issue has differed (who can vote, electoral votes, suppressing opposition, suppressing opposition alliances, land issues etc.). This is not the case in Zimbabwe, nor in Nigeria s relatively consistent agreement on power sharing between North and South for the presidency. Given the stable rates of activity, risk levels are consistent but not definitive nor predictable beyond chance in active areas. However, three important messages are evident from a risk analysis: (1) a region with a recent political militia action is three times more likely to experience another over the national average, and almost three times more likely to experience either a battle or violence against civilians; (2) much of political militia violence is against civilians or other groups; but (3) the government responds at high rates mainly to non-civilian related events. Communal violence is largely clustered within local communities. These groups have an equal cooccurrence of battles and violence against civilians and a very high repeated risk of action (5.5 times the national average). In contrast to other states with communal violence, Kenyan communal militias attack civilians more often, although other patterns, including a low degree of overlap with other forms of violence and low government response, are similar to other states (e.g. Nigeria). The ratio of number of events per person is highest for the homelands of the Borana group (7 times the risk of the Kikuyu, the plurality group in Kenya; 3.5 times the risk of the Turkana), and followed by the Dassanach, Sidamo, and with about half their rate is the Burji. Rioters are equally likely to engage with the government and only slightly less likely than militia groups to be confronted directly by government forces. In Kenya, much of the violence is an integral part of the present political machinations of the government. This is evident in how violence is both used and constrained with Kenya: political militias work to actively 17
18 promote or hinder change on the local or national level, and often work in collusion with governments who cannot engage in violence against opposition directly, but respond to assist in battles with pro-government groups. The government suppresses violence not in its direct interest and ignores other forms of violence (including communal contests). Kenya is a classic case of both public (e.g. rioting) and elite (government and militia based) instability and violence. These findings suggest several important points for policy makers and practitioners. The persistence of Kenyan political violence suggests it has become a normalised part of institutional and political manoeuvring in the country: this has implications for priorities in terms of state building, citizen education, and supporting transparency and participation in the political process. The relative predictability of communal violence in Kenya, in addition to its very high rate of fatalities, might provide several opportunities for interventions that focus on peace building, conflict management and livelihood opportunities in the most affected rural areas. In turn, patterns of government responsiveness to communal violence and engagement with communal militias may highlight gaps in capacity and/or political will, as well as issues with physical access to and coverage in rural areas. DR-Congo DR-Congo is an exceedingly violent state, and similar to both Somalia and South Sudan in the rate of percapita violence, the level of fatalities experienced and the vast number of groups who engage in violence for political means. By all measures, DR-Congo experiences high, fatal, diffuse and disorganised political violence at a rate similar to the civil war officially fought from DR-Congo is a case of classic civil war and post-civil war conflict and characterized by all forms of violence, barring rioting. In 2012, DR-Congo has returned to civil war although this conflict is a continuation of transition violence, and does not represent a new civil war as was experienced in Violence in DR-Congo has stayed at a stable rate despite the cessation of a formal civil war in Indeed since that time, violence has increased slightly to 305 average events a year. However, the rate of fatalities in a civil war is over four times the post-civil war rate (fatalities typically increase by 400% during civil wars). Despite the cessation of conflict formally, multiple actors and types of groups still are active in DR-Congo; there is far more variation in the violence activity (barring riots/protests) compared to other states, and in general, the patterns of DR-Congo are more reflective of how failed, failing, and weak states experience violence (see Table 5). Table 5: Dr-Congo Political Violence Tallies Events Fatalities DR-Congo Average SD Range Average SD Range ,676 11, , ,806 1, , ,996 2, , ,926 7, ,630 The most common act of violence in DR-Congo is battles between opposing armed forces. The average number of battles per year is 140, and the average number of fatalities that occur by year in those is 1,194. Sub-types of battles include events where the government loses or regains territory from a rebel force. Both forms are rare (the former at 29 and the latter at 20 per year), yet given the complex nature of the DR-Congo conflict, the distinctions are acknowledged. In particular, the fatality levels differ significantly. In the act of rebels overtaking territory, the rate of violence is 325 deaths a year, while government regaining territory leads to 92 deaths a year. Yet, if considering fatalities, it is critical to note that although VAC amounts to 90 events a year on average, the fatality rate is more than double the average battle rate at 2719 per year. DR-Congo violence displays a distinct geography that is highly correlated to actors and actions: On the country level, the most active and most violent places are North and South Kivu, where there is a strong correlation between number of events and number of fatalities. Across all administrative districts, the rate of correlation is very high at 98%. 18
19 There is a distinct geography to the risk of violence and fatalities even in high conflict areas: North Kivu s smaller administrative zones are where the highest events totals are found; however, proximate Maniema has by far the highest fatalities. South-Kivu is more fatal than North Kivu, and Ituri events have more fatalities per event than both of the Kivus. These areas also have the highest actor numbers; the number of actors is important as it signifies the market for violence. In a dominated market (e.g. Zimbabwe) there is little to no space for a new group to emerge due to few groups dominating and repressing new groups. In a saturated market, few new actors can find traction to engage in violence if their actions are indistinct from others, no elite will sponsor the violence due to having several alternate choices, and no community may need additional armed actors. However, the rate of actors in DR-Congo indicates an open market, where groups can enter the violence market and carve out some space, support, funds, and imperative. This indicates that present groups have not managed to dominate or ally/represent communities for broad based support. This is particularly evident in South Kivu, which has 64 recorded separate actors at close to 2.5 times the rate of active actors than the country as a whole. The Kivus have 42 additional actors in its conflict over the country as a whole. North-Kivu has the most at 50 (double the national rate), and Ituri has 30 which is the next closest. Interactive Patterns and Simultaneous Occurrence In classic civil war form, government actions largely co-occur with rebel actions; while only 23% co-occur with militias. Battles are eight times more likely when governments are involved in action, while violence against civilians is largely a rebel phenomenon, with slightly less response from governments. Militia actions are slightly more likely in places and times with governments, but other types of group activity are not more or less likely. Rebel groups have a high rate of reoccurrence and tend to organise in ways to interact with government forces and attacking civilians. These actions are relatively scattered compared with other forms of violence. In contrast, militias are actively trying to carve out a space within the violence market (see above) and half of the actions of these groups co-occur with government actions. Militia actions are more diffuse, with only half of the active areas experiencing a repeat action. Militias appear to be following the main action and engaging in battles with each other, governments, rebels and relatively rarely with civilians (at 25% cooccurrence rate). The need to carve out an active space through battles may be due to (1) the high number of opposition actors in this war; (2) the large spaces in which these opposition groups are operating. Communal violence is characterized by high rates of battles and reactions to rebel incursions. In situations where rebels have recently been active, the rate of communal violence increases, although not against rebels. There is also a very high rate of repeated communal actions, as is clear from all communal, and often local, violence. In short, within this war, violence against civilians is largely a rebel phenomenon; militias are actively pursuing and/or are in pursuit of government forces; government forces are spread out and subject to interactions with a wide range of actions and actors, except for communal violence. Rebels bring violence to new local spaces, which lead to increases in local disputes. DR-Congo s main issue is the rate of actors engaging in local conflict. The reaction to most shifts in violence is the creation of a new front with distinct actors. Such a domino pattern is persistent, as seen in the rate of violence currently fought within the state. These patterns may inform policy making and practice in several ways. In such a complex and highly volatile conflict environment, baselines and data can be useful in the identification and ordering of priorities, based on particular patterns in activity, fatalities or anomalous directional change. For example, the dominance of rebel groups in acts of violence against civilians may offer some basis for the strategic prioritisation of civilian protection resources in rebel-active rather than militia-active areas. Patterns in the emergence and activity of communal militias may also highlight gaps in state capacity or trends in their engagement with civilian populations in particular areas which may demand particular attention. 19
20 Guiding Principles Nigeria The most violent forms of conflict in Nigeria are predictable if using the following five guiding principles: 1. When violence increases in Nigeria, civilians will bear that cost. 2. When violence increases in Nigeria, the increase is likely to be concentrated in the centre and the north of the states. The geography of Nigeria s violence supports the notion that more events drive increase in locations and actors. However conflicts are becoming more common due to increased local events, not coordinated single-opposition group effects (as in, groups show limited contagion and diffusion. Instead, new groups tend to emerge to conduct violence in a locality). 3. Rebel actions are both highly clustered in Delta and under active suppression by the government. This renders rebel action a relatively unlikely occurrence in Nigeria. 4. If political militia actions occur in an administrative region of the state, this will likely be in the form of violence against civilians. Governments do respond to violence against civilians, although this response is likely to be a short term solution. 5. A geography of risk does exist in Nigeria in response to ethnicity and region: civilians are most at risk in Kano and Taraba, although Hausa groups in Kano have one of the lowest risks. This indicates that Nigeria s violence is specifically targeted towards select groups even within violent areas. Zimbabwe The political situation in Zimbabwe is predictable using the following five guiding principles: 1. During election years, violence will increase by a factor of Harare, followed by the Mashonaland districts, will experience more violence than the rest of the state. Harare will experience twice the mean number of events than the rest of the state combined. 3. Ethnicity is not a large factor in Zimbabwe s violence compared to region. 4. Violence against civilians is likely to be perpetrated by a government supported or allied militia. This violence is largely pre-emptive. 5. There is a sequencing effect in the military s reaction to violence: If the government has been active in a region during month 1, there is a higher risk that the region will also have a riot in month 2, and that this region will experience violence against civilians by the government in month 3. Kenya The most violent forms of conflict in Kenya are predictable using the following five guiding principles: 1. An increase in violence will lead to an increase in violent location, violence types, fatalities, and violent actors. A decrease will lead to a drop in those characteristics. Violence does not cluster in high-conflict years, but is spread across the state and perpetrated by the government, political militias, communal militias and rioters. 2. Communal violence is responsible for the highest rate of battles and fatalities in comparison to all other general groups, but it is not a singular, organised threat. Communal militias are over-represented in actors and locations, because such violence is often local and distinct; hence it is takes the form of multiple discrete and somewhat un-related events. Areas with competing local militia will experience high than average battle rates, VAC rates and fatality rates. 3. However, high violence by communal actors will not create an automatic government response. The government is likely to respond to battles between political militias over any other form of violence. The government s lowest response rate is to communal contests, which have the highest fatality rates. 20
21 4. The strength of the opposition will determine the amount and scale of violence during election years. Elections do not automatically lead to more violence. In the three elections that have occurred in Kenya in 1997, 2002 and 2007, the change in violence and fatality rates were in line with the distinct political manoeuvring and challenges faced by the central government. In 1997 and 2002, the government faced legitimacy challenges and voting count challenges from its main base and allies. The violence was directed towards securing the largest proportion of available votes that would secure the government s position. In 2007, the government faced an equally strong opposition and in entering a run-off, both the government and the opposition needed to suppress the opposing supporters in order to win the second round. Elections with strong opposition are much more violent than with weaker oppositions. 5. Kenyan violence will respond to seasons: communal militia activities are largely predictable in time and space (in part because they constitute a larger share of Kenya s violence compared to other states with communal activity). As a result of high communal violence, there is a distinct increase in violence towards the end of the year and in January. Januaries have double the event fatality rates of the remaining months of the year; possibly due to the seasons- cattle raiding is more lucrative right before the rainy season than the dry season, when extra cattle are a burden. DR-Congo The most violent forms of conflict in DR-Congo are predictable using the following five guiding principles: 1. A domino effect is evident in highly violent spaces in DR-Congo. When an area opens to rebels, there are higher rates of non-rebel violence in subsequent months, meaning that militia violence increases in subsequent months. However this violence is still clustered within the Eastern part of the state. 2. Rebels are the main perpetuators of violence against civilians. 3. Militias are attempting to carve out niches and spaces for activity in DR-Congo, where the violence market remains open. 4. Government forces respond to rebel violence, but follow a diffuse strategy of trying to cover significant space with limited actions. To supplement, government tends to co-opt local militias to control areas. 5. The Kivus are the crucible of violent actions in the Congo; even during periods where the political issues are national, they are far more likely to lead to increased violence in the Kivus than in the capital. Surrounding areas tend to engage in local, often communal, conflict, albeit at a very high rate. Summation In summary, this analysis details how the use of data can provide practitioners with useful and accessible tools to detect variations in conflict patterns, types, triggers and correlates. Conflict dynamics are often unique to the environments and circumstances in which they occur. Using tools like disaggregated data and baselines for countries, regions, and time periods, allows a practitioner to extract that pivotal information as and when needed. In this report, four classic country level cases are summarized, and suggestive of ways in which the broad lessons of one country can be applied to the conflict framework and policy implementation in others. However, as noted above, the specifics of a conflict must be understood in tandem with broad patterns of transition, fragility, multiple conflicts and repressive state structures. Below are some basic tools for an analyst. These are designed to place useable tools and information into the hands of practitioners. Several of the examples above used these basic tools and data to create the guiding principles. 21
22 Appendices Appendix I: Desk Assessments and Analysis Three short analyses are designed to assist practitioners in understanding a conflict landscape as it emerges. These exercises are informed by the examples of the four states: as noted in the guiding principles, the most important facets of Nigeria s violence are new locations of conflict and the groups perpetuating violence against civilians (where and who). In Kenya s case, the time of the year, the type of violence and what issues surround major events (such as an election) shape the violence (when, what and who). In DR-Congo, the place and actors arising are also critical, but engage in different types of violence compared to Nigeria (where, who, what). In the Zimbabwean case, it is critical to understand sequencing which is evident in that state s violence (when, what, and where). Inputs The inputs for these analyses include event level data which is (1) as close to real-time as possible; (2) incorporating all types and manner of political violence; (3) spatially referenced and (4) categorized by violence type and group type. ACLED provides real time data for all African states which can be downloaded for all countries from at acleddata.com, and real-time data can be downloaded at ccaps.strauss.edu/conflict. These data are available at the beginning of each month for the previous months. These data include the following columns and can be divided clearly into who, what, where, when. Who: Actor 1- an actor in a conflict event Actor 2- an actor in a conflict event Allies of Actors 1 and 2 allies of actors in a conflict event Inter1- the categorization of actor 1 (see codebook) Inter2- the categorization of actor 2 What: Event Type- seven types of events, including three types of battles, are possible Interaction- a code detailing the type of groups which are interacting (e.g. gov t versus militiasee appendix) Fatalities- the number of reported fatalities for an event Program Where: Country Administrative Regions 1, 2, 3 Location Name Coordinates (Latitude and Longitude) When: Event Date Month Year These analyses can be done with a basic excel program; three are described here. The first involves pivot tables, which can aggregate data in different ways to display possible patterns. Pivot tables reorganise and cluster data based on the who, what, when, where noted above. The second exercise involves creating ratios and correlations. A ratio is a meaningful number that can be used to compare the intensity and frequency of events across time periods or space. For example, the ratio of fatalities to events in DR-Congo may be 20 per event, whereas in Kenya it may be 5. We can say that based on this statistic, DR-Congo violence is four times more fatal than Kenyan violence. Another way of understanding patterns in data is to use correlations: a correlation is the rate at which variables behave in the same manner. As defined above, there are positive (0- >+1) and negative correlations (0-> -1). If we are in interested in the correlation between events and fatalities, we could see whether they co-vary: if events and fatalities have a 90% (.90) correlation over a set time period, then we can say that as events go up, we can be very sure that fatalities with also rise. If the correlation is -70% (-.7), we can say that as events (or fatalities) rise, the number of fatalities (or events) decreases. These variables would have a negative correlation. Only those above.75 (in either direction) are strong. Correlation variables are not causal, they simply detect a pattern. Correlations also do not come with significance levels, so we cannot say whether we can be confident in a correlation at all times; it is an instructive measure, not definitive. 22
 in a time period.")
23 The final analysis is creating standardized scores to determine baseline and volatility. A standard score is also known as a Z score, and gives an interpretation of the strength of a deviation from the mean (average) in a time period. For example, the violence in Zimbabwe during an election in 2002 has a 2.6 Z score. This is both a high score (if it were a normal year, the score would be close to 0), and abnormal (as scores this high indicate a sharp aberration in a pattern). We can use this number to how unusual a time period or an area is with the use of these scores. Pivot Tables A pivot table will allow you to summarize data quickly and in various ways. It is a simple excel based tool. The steps to using one are listed below. Tracking Actors Steps: 1. Download the data for the country you are interested in. Make sure that you have downloaded the complete time period in which you are interested. 2. Open excel and import your data. 3. On the right edge of your data, create a column called pivot (by simply writing that in the headings row, and then place a 1 in the first data row. Right click and select copy of that 1. Then highlight the remaining cells below, and while highlighted, right click and select paste. All the rows in that column should now have a 1 in them. 4. Go to the insert tab on the contents ledge, and choose Pivot Table. 5. A pivot table (see below) will provide you with many options. The main ones are which variable you want as the row (organising variable), which you want as the column (summary variable) and which you want as the value (the most important include sum, count, average, minimum, maximum). You use these rows and columns to devise the information you are interested in and can assist you in creating ratios etc. 23


24 Pivot tables enable you to drag and drop into the columns and rows, or to place the variables in the lower right of the table under rows and values. Below we work through some examples: A. Finding the When and Who and How Many Create pivot table and drag Year into the row column; drag Actor 1 into the Value field. You will see a summary of numbers by year. This is the distinct count of ACTOR1 values recorded in each year. You will also see that the Year is now recorded under the Rows box and Actor 1 is recorded under the values box. If you right click on ACTOR1 in the box, and choose Value Field Settings you can change count to average etc. However, ACTOR1 is a name and does not actually account for the number of actors (for that, you would also need ACTOR2 and get rid of overlaps). If we move (through the drag and drop) ACTOR1 into the Rows box, we see now that we have a list of all actors (by name) for each year. This makes more sense. If you have created a pivot field, you can now drop that into the Values box and you will get a summary of the number of events each ACTOR1 was involved in by year. You can also drop Fatalities into the pivot table to get another assessment (make sure this is done as a SUM, not an average). Alternatively, you could remove ACTOR1 and instead place EVENT TYPE in this space. This will give you an estimate of how common and fatal each event was in each year. If you are interested in only one Actor or only one Event Type, select this one and right click to use the FILTER command. 24

25 B. Finding the Where and What You would follow the same procedure (only using the WHERE variables) if you wanted to determine the rate of violence by location. If you wanted to know when, where, and how much, you would place these variables in this order in the row areas. Alternatively, you could place the month/year in the row area, and the locations (Administrative districts or town names) in the column area, and the pivot or fatalities variable in the values column. Making Graphs and Charts You are able to make several types of graphs and charts using pivot tables by using the excel menu on the top of the sheet. Using Data for Ratios, Correlations and Z scores: Ratios, correlations and Z Scores can only be done on numeric data. That said, numeric data can be divided into categories before running ratio and correlation exercises. This first step can be done in a pivot table, or you can sort on the excel sheet columns and determine the ratio, correlations and Z scores in the following way: 1. Create numeric columns using a pivot table- for example; you may have listed the rate of violence by month as well as the fatalities. You can copy the values that the pivot table has created and then paste them into a new sheet. 2. Once in a new excel sheet, you can do the following exercises: In a new column, write RATIO at the top of one column, CORRELATION at the top of the next and Z Score1 and Z Score2 at the top of the third and final column. In the ratio column, divide the number of your interest by the second number: e.g. fatalities divided by events. In the correlations column, write the following: = CORREL 25
26 Excel will automatically ask you for a list of the referenced numbers. Highlight all the first column- e.g. highlights all the values you have listed for fatalities once you have clicked inside of the parentheses, type in a comma, and then repeat for the events values). Your correlation command should look like this: =CORREL (C2:C20, D2:D20) This command should result in a rate that is either positive or negative and between -1 and +1. The closer to either -1 or +1, the stronger the covariance of these variables. Finally, so the Z score, you will need to create the mean and standard deviation of both columns. This is quite straightforward: In another row, write average1 and in the next cell write =average (here place the highlighted range of the variable you are interested in finding the average of E.g. B2:B20). Repeat for the second row of data you need to find the average of. In another set of rows, write sd 1 and sd2 below it. The formula for standard deviation is =STDEV(here place the highlighted range of the variable). Repeat for the second variable. Then go back to the Zscore column and in the next blank cell write: =STANDARDIZE() Excel will ask for the following information: the data point (e.g. B2 from the variable you are interested in), the mean (average) of that variable and the standard deviation of that variable). Make sure to write in the average and the standard deviation- do not just click on the value in its cell). The equation should say: =standardize(b2, Average, SD) Press enter and then drag that until the end of the column. Repeat for the next set of data you would like to standardize. From these pieces of data, you can do the following: Ratio: compare between times, events, countries ratios of two numeric variables such as fatalities and events, locations and actors Correlations: determine whether variables act together or in a similar manner over times or spaces Z scores: determine how unlikely, unusual, normal or flat events, fatalities, actor numbers, location numbers 26

27 are over a time period, an area, over an active period of an actor etc. A Z score of 0 means that this unit conforms to the average over a time period or space. A Z score of +1 means that it is slightly larger than the average. A Z score of 2 or above signifies an unusually high score. A Z score of 3 or above is a rare and very unusual deviation. The same strength conclusions applies for negative scores. Image 1: Map of Kenyan Political Violence By Administrative Regions This image provides an overview of political violence in Kenya by event count in each administrative area. It suggests that political violence is spread across the state with a high number of events concentrated in the central and north-western regions. 27
 has continued to climb since this")
28 Image 2: Kenyan interactions, locations, records and fatalities: This image charts Kenyan interactions, locations, records and fatalities. The four factors appear quite correlated, each spiking in , although the number of interactions (the type of groups engaging in violence with one another) has continued to climb since this period, while the other factors experienced a sharp drop. Fatalities and records are particularly well correlated (with the exception of a drop in fatality levels in 1999), suggesting that as violence rates increase, so too do fatalities. An alternative scenario might involve an increase in fatality levels with an intensification of violence without a concomitant rise in its overall level. 28

29 Image 3: Nigerian violence concentrated by location This image presents standardized elipses displaying the difference between 1997 violence areas (in purple) and 2011 violence areas (in red). There has been a distinct shift northwards in recent years. Since 2001, a shift to north-north-east violence has been pronounced. The violence is more rural now than it was when conducted by rebels and in the southern areas. The map shows ethnic community homelands. 29

30 Images 4, 5 and 6: Violence in Nigeria ( ) 30
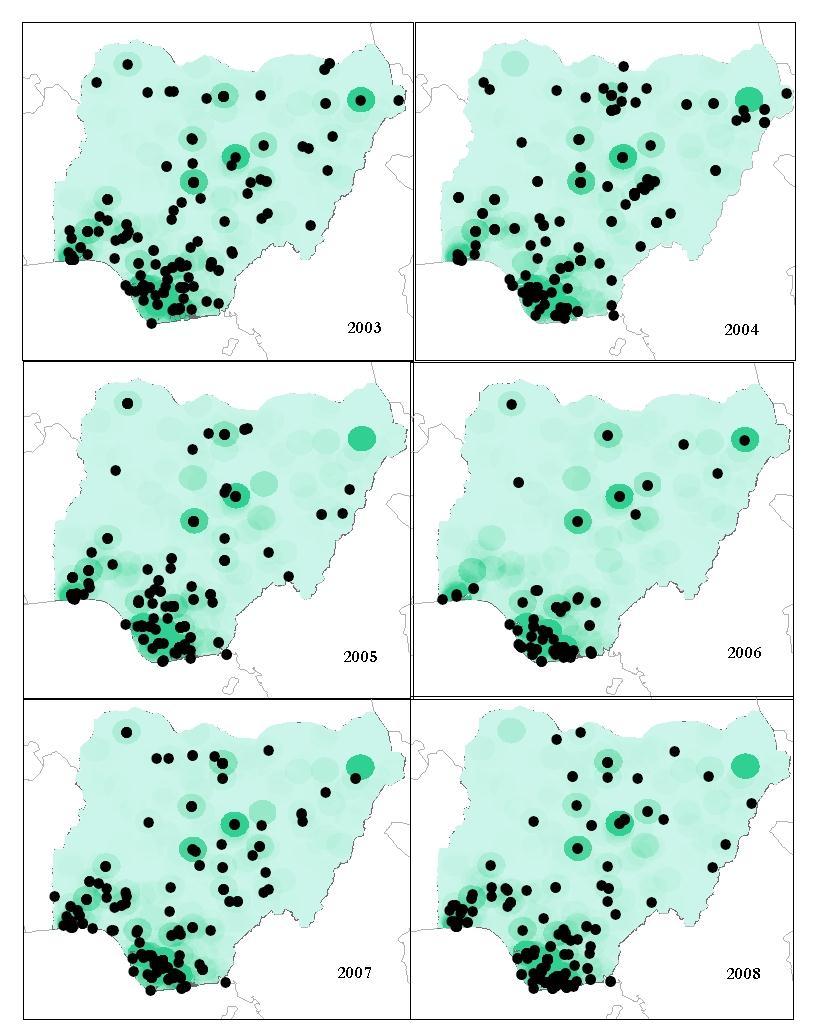
31 31

32 The information in these maps displays three clear geographical factors in Nigeria s violence: 1. There has been a distinct shift northwards in recent years. Since 2001, a shift to north-northeast violence has been pronounced and 2004 display patterns that resurged from The expansion of violence is largely due to non-rebel forces including militias, communal groups and rioting. 3. Relative to its size, Nigeria s violence is highly clustered. 32

33 Image 7: Zimbabwe violence over time ( ) Zimbabwe violence is both widespread and yet clustered in the large Shona ethno-linguistic homeland of the centre-northeast. The capital and major cities experience far more violence even as a ratio of violence per capita than other areas of the state. Violence has increased substantially after 2000, to decline in (although still more widespread than in earlier years). As most violence in Zimbabwe is governmentsupported or sponsored violence against civilians and threats to opposition supporters, these map show a high baseline and spatial risk to civilians. 33
34 Image 8: Zimbabwe violence records and fatalities ( ) This graph shows how violence events and fatalities are relatively highly correlated in Zimbabwe. They mirror one another until (an exceptionally violent period), where fatalities, which are generally quite low in Zimbabwe, remain so in spite of the sharp increase in violence records. In , however, records and fatalities spike in equal proportion, with fatalities reaching a record high for the entire period of over and 2008 are election years. 34
35 Appendix II: Codebook and User Manual ACLED DOWNLOAD AND USE ACLED is designed to present a realistic assessment of violent political activity within a state. For that reason, data downloaded from ACLED is likely to look different than other, complementary, conflict datasets. This is a brief on how to download and read these files. FILES Downloading Files are in xls and shapefile format. The xls sheet can be opened by any office package. Click on the xls link to download the file. A compatible document with a general description of the violence within the chosen state is also provided for select cases as well as a review of the active groups in particular countries and regions. The shapefile will require a GIS package or others than can read spatial data (e.g. R). File Contents Data are available by country from Jan 1997-Dec 2011 and countries can be joined as the same columns appear in each state file. Additional regional or actor sets are available where particularly unstable regions are reported together. For example, activity from Sudan, Chad and Central African Republic can be downloaded, or activity for all of Africa, select rebel groups, pre 1997 Sierra Leone and Liberian conflicts, only civil wars, only violence against civilians, etc. Variable and File Structure The file structure is the same for all downloaded files. Events are atomic, in that they are recorded by day and location, actor and event type. For example, if a battle between a government and rebel group occurs over three days in one town, this is recorded as three separate events in ACLED. If during that time, there are reports of violence against civilians in the same town, this is recorded as a separate event, as the actors and event type are different. Data can be aggregated by month, regions, or event types using pivot tables. Information in a downloaded file Column Name Column Description Notes GWNO Country Identification Number from Gleditsch and Ward (2000) Event ID Country A unique identifier for each event Is associated with country id short name. This cannot be sorted as the country name distorts the sequence. Event ID No Country A unique identifier for each event This can be sorted, and is without country abbreviation based on event date Event Date Recorded as Day/Month/Year Year Time Precision Year of event occurrence Notes the specificity of the event date Number corresponds to likelihood of correct date 1-day 2-week 3-month 1 is the default 35
36 Event Type Actor 1 Ally Actor 1 Inter1 Actor 2 Ally Actor 2 Inter2 Interaction Country Region 1 Region 2 Region 3 Location Name Coordinates Eight types of events are coded for. 1-battle- no territory exchanged (Dyadic) 2-battle rebels win territory (Dyadic) 3-battle government regains territory (Dyadic) 4- base or HQ established 5-nonviolent activity by rebels 6-rioting 7-violence against civilians (Dyadic) 8-Nonviolent acquisition of territory First Actor. If a dyadic event, this will be accompanied by a second actor. If a monadic event, no second actor necessary Ally of actor 1 if reported. Ally for one specific event Number corresponding to the type of actor Second Actor. If a dyadic event, there will be an Actor 1 Ally of actor 2 if reported. Ally for one specific event Number corresponding to the type of actor Coded as an interaction between actor types, and recorded as lowest joint number 1-Government/Military/Police 2-Rebel group 3-Political Militia 4-Communal Militia 5-Rioters 6-Protestors 7-Civilians 8-Other (e.g. Regional groups such as AFICOM; or UN) Country name where event took place Administrative region 1 where event occurred according to global administrative database (updated in 2012) Administrative region 2 where event occurred according to global administrative database (updated in 2012) Administrative region 3 where event occurred according to global administrative database (updated in 2012) Specific place name of event location Latitude and longitude Longer description below See Actor Type designation below See Actor Type designation below See interaction numbers below. Only main actor is coded. See Actor Type designation below See Actor Type designation below See interaction numbers below. Only main actor is coded. See Interactions below and in codebook e.g. When the action is between a government and a rebel group, this will be coded as 12; when a political militia attacks civilians, it is coded as 37. Based on GIS operation Based on GIS operation Based on GIS operation 36
37 Geoprecision Source Notes Fatalities Additional Region Notes Notes the specificity of the event location Publication from where the event information is gathered Notes coder deemed relevant to the event Number or estimate of fatalities due to event. These are frequently different across reports. The region information from the news report Number corresponds to likelihood of correct location 1-town or immediate surroundings 2-part of ADM 2 region 3-regional capital The general name of the source is provided Recorded as number if reported. Lowest number reported if records differ or vague estimate is provided. However, if reports mention several, many, or plural civilians and no other reference, this is recorded as 10. If report mentions dozens, this is recorded as 12. If report mentions hundreds, this is recorded as 100. If summarized fatalities are reported, but events occurred across several days or in multiple locations simultaneously, total number is divided and recorded by day or by location. This information is not standardized, as reports often provide various administrative names with locations. ADDITIONAL INFORMATION In ACLED, conflict actors include rebels, militias, and organised political groups who interact over issues of political authority (i.e. territorial control, government control, access to resources, etc.). ACLED recognizes a range of actors including governments, rebels, militias, ethnic groups, active political organisations, and civilians. Political violence is understood as the use of force by a group with a political purpose or motivation. ACLED defines political violence through its constituent events, the intent of which is to produce a comprehensive overview of all forms of political conflict within and across states. A politically violent event is a single altercation where often force is used by one or more groups for a political end, although some instances- including protests and non-violent activity- are included to capture the potential pre-cursors or critical junctures of a conflict. Actors Governments are defined as internationally recognized regimes in assumed control of a state. Government actors are defined by ACLED as a series of separate regimes rather than a uniform body (e.g. Congo/Zaire (Mobutu), Democratic Republic of Congo (Kabila, L) and Democratic Republic of Congo (Kabila, J) as opposed to Congo/Zaire (1962- present)). As the strength, capacity and policies of governments can vary widely from one regime to the next, ACLED designates governments by their leading regimes. This enables researchers to captures the differences in government involvement 37
38 and reaction to violence. As militaries are a direct arm of the government, these actors are noted as Military Forces of State, 19xx-19xx. Mutinies of militaries are coded as Mutiny of Military Forces of State, 19xx-19xx. Rebel groups are defined as political organisations whose goal is to counter an established national governing regime by violent acts. Rebel groups have a stated political agenda for national power, are acknowledged beyond the ranks of immediate members, and use violence as their primary means to pursue political goals. Rebel groups often have predecessors and successors due to diverging goals within their membership. ACLED tracks these evolutions. Militias are more difficult to assess since they can be created for a specific purpose or during a specific time period (i.e. Janjaweed) and may be associated with an ethnic group, but not entirely represent it (i.e. Kenyan Luo ethnic militias). ACLED s definition of organised political groups includes militias operating in conjunction or in alliance with a recognized government, political elite, and rebel organisation or opposition group. These groups are typically supported, armed by, or allied with a political elite and act towards a goal defined by these elites or larger political movements. Whereas often opposition parties will have a militia arm, groups such as the Sudanese Janjaweed or Serbian Tigers work as supplements to government power. These groups are not subsumed into the category of government or opposition, but are noted as an armed associated wing. When these groups operate with another type of group (e.g. military, rebel etc) this alliance during each event is noted. Militias are recorded by their stated name. In some cases, an unidentified armed group perpetrates political violence; the default assumption in ACLED is that such groups can be considered militias and their activity coded under unidentified armed group. 9 Within the unidentified armed group designation, it is also possible to specify a country of origin if it is known, such as unidentified armed group (Sudan). Alternatively, ethnic militias can be long-term policing units, such as those common among Somali clans. ACLED coders distinguish between active ethnic militias involved in communal violence (militias against each other) as opposed to violence with governing forces that are outside of a civil war context (i.e. Karamonjong violence in Uganda). If an ethnic militia is formed to engage in intra or inter communal violence, such groups are designated ethnic group x militia. Riots are violent, spontaneous grouping populated by rioters. These activities are coded as riots if the spontaneous civilian actors become violent against people or property. Protests are non-violent spontaneous groupings with protesters. However, should violence be used against protesters, this is considered violence against civilians. Should the protesters become violent, this action is considered a riot. Protesters and civilians are the only unarmed actors included by ACLED. These groups are either the direct victims of armed violence or are recognized groups protesting peacefully. Both protesters and civilians are general categories and are noted as Protesters (Country X) or Civilians (Country X). If either rioters, protesters, or civilians are associated with a named group, that group is recorded in the ally column. Small categories of other actors include hired mercenaries, security firms and their employees, UN or external forces. They are noted by their name and actions. In conclusion, all actors have an official name, 10 a stated political purpose and use violence or protest for political means. Organisations must be cohesive and are not assembled for single events, with the exception of riots and protests. Further, the events in which they are involved must be connected to each other as a means to achieve a larger political purpose. This necessary and sufficient definition of actors allows us to track a range of movements. 9 Often such activity is designed to be unidentified, since most of unidentified activity is violence against civilians for a political purpose. 10 Barring the unidentified category. 38
39 Event Types ACLED Event Types Event Number Event Type Event Description 1 Battle-No Change of Location Control A battle where control of the contested location does not change. This is the most common event. If the government controls an area, fights with rebels and wins, this is the correct code. If rebels control a location and maintain control after fighting with government forces, this is the correct code. If two rebel groups are fighting and the group in control of the location retains its authority, this is the correct code. 2 Battle- Rebel Control Location A battle where rebels win control of location. This is the correct code if, after fighting with another force, a rebel group acquires control. If two rebel groups fight and the group that did not begin with control acquires it, this is the correct code. 3 Battle Government Regains Control 4 Headquarters or Base Establishment A battle in which the government regains control of a location. This event type is used solely for government re-acquisition of control. A rebel group establishes a base or headquarters. This event can be non- violent, but must be coded when a permanent or semipermanent base is established. 5 Non-Violent Activity by a Conflict Actor This event records activity by groups that does not involve active fighting but is within the context of the war/dispute. For example recruitment drives, arrests, incursions or rallies. 6 Rioting/Protesting Protest describes a group involved in a public meeting against a government institution. Rioting is a violent, unorganised form of protest. The actors involved are noted as protestors (country) or rioters (country). 7 Violence Against Civilians Violence against civilians occurs when any armed group attacks unarmed civilians within a larger conflict. Rebels, governments, and militias can all commit violence against civilians. This is the only event that involves civilians. 8 Non-Violent Transfer of Location This event describes situations in which rebels Control or government s acquire control of a location without engaging in a violent act. Please see the codebook for further information. 39
40 Interactions Interaction codes note the types of actors who interact, without reference to the type of event. All actors fall into 1 of 8 categories (including governments, rebels, civilians etc.): Government or mutinous force = 1 Rebel force =2 Political militia= 3 Ethnic militia = 4 Rioters= 5 Protesters = 6 Civilians = 7 Outside/external force (e.g. UN) =8 An ethnic militia is associated with a direct ethnic community and no other identifier. For example, the Turkana, Pokot, or many Somali militias are described as armed units for ethnic group contest and protection. These are referred to as communal in the interaction column. These local and ethnically bounded groups are considered distinct from militia groups that operate as armed and violent wings of government, opposition groups, the forces of political elites or a religious organisation. These political militia groups tend to not be associated with defined ethnic communities; they also operate outside of ethnic homelands and for goals other than the promotion of ethnic interests. The Mungiki of Kenya, War Veterans Group in Zimbabwe, Boko Haram of Nigeria, and Mayi-Mayi of DR-Congo are examples of these groups. The remaining group identifiers are covered in section 2. A single number represents the one/two group interaction. This is the basis of the INTERACTIONS column. INTERACTION numbers are always the smallest possible number. Those with a 0 are for single actor events. The codes include: 10- SOLE MILITARY ACTION 11- MILITARY VERSUS MILITARY 12- MILITARY VERSUS REBELS 13- MILITARY VERSUS POLITICAL MILITIA 14- MILITARY VERSUS COMMUNAL MILITIA (these include all ethnic militias) 15- MILITARY VERSUS RIOTERS 16- MILITARY VERSUS PROTESTERS 17- MILITARY VERSUS CIVILIANS 18- MILITARY VERSUS OTHER 20- SOLE REBEL ACTION (e.g. base establishment) 22- REBELS VERSUS REBELS 23- REBELS VERSUS POLITICAL MILIITA 24- REBELS VERSUS COMMUNAL MILITIA 25- REBELS VERSUS RIOTERS 26- REBELS VERSUS PROTESTERS 40
41 27- REBELS VERSUS CIVILIANS 28- REBELS VERSUS OTHERS 30- SOLE POLITICAL MILITIA ACTION 33- POLITICAL MILITIA VERSUS POLITICAL MILITIA 34- POLITICAL MILITIA VERSUS COMMUNAL MILITIA 35- POLITICAL MILITIA VERSUS RIOTERS 36- POLITICAL MILITIA VERSUS PROTESTERS 37- POLITICAL MILITIA VERSUS CIVILIANS 38- POLITICAL MILITIA VERSUS OTHERS 40- SOLE COMMUNAL MILITIA ACTION 44- COMMUNAL MILITIA VERSUS COMMUNAL MILITIA 45- COMMUNAL MILITIA VERSUS RIOTERS 46- COMMUNAL MILITIA VERSUS PROTESTERS 47- COMMUNAL MILITIA VERSUS CIVILIANS 48- COMMUNAL MILITIA VERSUS OTHER 50- SOLE RIOTER ACTION 55- RIOTERS VERSUS RIOTERS 56- RIOTERS VERSUS PROTESTERS 57- RIOTERS VERSUS CIVILIANS 58- RIOTERS VERSUS OTHERS 60- SOLE PROTESTER ACTION 66- PROTESTERS VERSUS PROTESTERS 67- PROTESTERS VERSUS CIVILIANS 68-PROTESTERS VERSUS OTHER 80- SOLE OTHER ACTION * NOTE- CIVILIANS CANNOT ATTACK CIVILIANS OR OTHER ACTOR GROUPS USE ACLED data can be used in a variety of statistical packages. It is particularly useful for a user to have knowledge of spatial data and programs. When converted into a dbf, these data can be uploaded into GIS. In csv format, they can be integrated into programs such as SpatialKey, and in xml format can be used in Google Earth. 41
42 ACLED Data Sources July 2012 ACLED relies on a variety of sources to produce its dataset. These include news reports, NGO and governmental agency publications, security alerts and published texts or books. Sources include international, regional and national contents. The twenty most common sources in ACLED inform over 82.4% of events. The top ten make up 72.5% of events; and the top five make up 57.5%. Overall, Violence against civilians makes up 42.3% of violence reported in ACLED; Riots/Protests make up 15.7%; Non violent activity makes up 7.3% of events; and Battles constitute 42.3% of events. Some sources diverge from this significantly. The top ten sources and breakdown by event reporting are listed below. Source Battles VAC Riots/Protests Non violent BBC 53.5% 35.7% 6.8% 3.9% Reuters 50.6% 29.8% 14.9% 4.5% Agence France Presse 43.9% 32.8% 19.5% 3.6% NSP / SPAS 57.2% 30.3% 8.4% 3.8% All Africa 35.6% 44.2% 16.8% 3.2% Zimbabwe Human Rights NGO Forum 0.7% 92.28% 4.7% 2.1% Associated Press 42.5% 32.8% 18.1% 6.5% Xinhua 56.1% 32.8% 6.5% 4.4% IRIN 53.1% 28.3% 13.6% 4.8% Africa Research Bulletin 57.8% 30.1% 5.9% 6.1% Over the fifteen years of the dataset, the number of discrete sources has increased significantly, an increase which is highly correlated to the number of events. Year Number of sources Number of events

43 The number of records and number of sources are highly correlated: Figure 1: Number of events and number of discrete data sources, The top ten countries with the highest and lowest number of discrete sources are listed below. 10 countries with most discrete sources Democratic Republic of the Congo Somalia Nigeria Libya Egypt Kenya Sudan Zimbabwe Algeria South Africa 10 countries with least discrete sources Djibouti Equatorial Guinea Botswana Gabon Guinea Bissau Benin Eritrea Lesotho Malawi Swaziland The number of discrete sources per country is represented in the map below. As is clear, North, East and Central Africa have a higher number of discrete sources than West and Southern regions of the continent. 2

44 Figure 2: Countries by discrete number of sources (8 100), all years. When organised by type, international sources including international press wire services, global news agencies, and national sources published outside the country in question clearly constitute the majority of ACLED sources, although the proportion these sources represents ranges from 41.6% in 2008 to 78.5% in National sources have constituted a growing proportion of sources over the fifteen years of the dataset s coverage, reaching 34.4% of data sources in Regional sources including Africa specific news and analysis sources have constituted approximately 8.1% of sources over the course of the dataset. In all years, news sources make up the largest share of sources. The proportion they make up, however, varies from 56.5% in 2008 to 86.2% in The relevance of NGO reports, and security reports from dedicated security analysis organisations has grown over the course of the dataset s coverage. 3
Armed Conflict Location & Event Data Project (ACLED)
") Armed Conflict Location & Event Data Project (ACLED) Guide to Dataset Use for Humanitarian and Development Practitioners January 2017 Further information and maps, data, trends, publications and contact
Armed Conflict Location & Event Data Project (ACLED) Guide to Dataset Use for Humanitarian and Development Practitioners January 2017 Further information and maps, data, trends, publications and contact
ACLED Actors and Interactions
 ACLED Actors and Interactions ACLED recognizes a range of actors including governments, rebels, militias, ethnic groups, active political organizations, external forces, and civilians. In ACLED, politically
Armed Conflict Location and Event Data Project (ACLED) Codebook 3 Released in Clionadh Raleigh Andrew Linke Caitriona Dowd. University of Sussex
 Codebook 3 Released in Clionadh Raleigh Andrew Linke Caitriona Dowd. University of Sussex") Armed Conflict Location and Event Data Project (ACLED) Codebook 3 Released in 2014 Clionadh Raleigh Andrew Linke Caitriona Dowd University of Sussex University of Colorado, Boulder Centre for the Study
Armed Conflict Location and Event Data Project (ACLED) Codebook 3 Released in 2014 Clionadh Raleigh Andrew Linke Caitriona Dowd University of Sussex University of Colorado, Boulder Centre for the Study
Armed Conflict Location & Event Data Project (ACLED) Codebook Version 8 (2017)
 Codebook Version 8 (2017)") Armed Conflict Location & Event Data Project (ACLED) Codebook Version 8 (2017) Table of Contents Introduction and Brief Description... 4 Definitions of ACLED events... 6 Table 1: ACLED Event Types... 7
Armed Conflict Location & Event Data Project (ACLED) Codebook Version 8 (2017) Table of Contents Introduction and Brief Description... 4 Definitions of ACLED events... 6 Table 1: ACLED Event Types... 7
Data Comparison 2: All Country Years and a Focus on Nigeria and South Africa
 Data Comparison 2: All Country Years and a Focus on Nigeria and South Africa This second data comparison includes a brief review of all datasets and two case comparisons of Nigeria and South Africa. Both
Armed Conflict Location and Event Dataset (ACLED) Codebook
 Codebook") Armed Conflict Location and Event Dataset (ACLED) Codebook Clionadh Raleigh, Andrew Linke & Håvard Hegre Centre for the Study of Civil War, International Peace Research Institute, Oslo (PRIO) 1 Table of
Armed Conflict Location and Event Dataset (ACLED) Codebook Clionadh Raleigh, Andrew Linke & Håvard Hegre Centre for the Study of Civil War, International Peace Research Institute, Oslo (PRIO) 1 Table of
CONFLICT TRENDS (NO. 22) REAL-TIME ANALYSIS OF AFRICAN POLITICAL VIOLENCE, JANUARY 2014
 REAL-TIME ANALYSIS OF AFRICAN POLITICAL VIOLENCE, JANUARY 2014") Welcome to the January 2014 issue of the Armed Conflict Location & Event Data Project (ACLED) Conflict Trends. Each month, ACLED researchers gather, analyse and publish data on political violence in Africa
Welcome to the January 2014 issue of the Armed Conflict Location & Event Data Project (ACLED) Conflict Trends. Each month, ACLED researchers gather, analyse and publish data on political violence in Africa
CONFLICT TRENDS (NO. 14): REAL-TIME ANALYSIS OF AFRICAN POLITICAL VIOLENCE, MAY 2013
: REAL-TIME ANALYSIS OF AFRICAN POLITICAL VIOLENCE, MAY 2013") ACLED is a publicly available database of political violence, which focuses on conflict in African states. Data is geo-referenced and disaggregated by type of violence and a wide variety of actors. Further
ACLED is a publicly available database of political violence, which focuses on conflict in African states. Data is geo-referenced and disaggregated by type of violence and a wide variety of actors. Further
CONFLICT TRENDS (NO. 18) REAL-TIME ANALYSIS OF AFRICAN POLITICAL VIOLENCE, SEPTEMBER 2013
 REAL-TIME ANALYSIS OF AFRICAN POLITICAL VIOLENCE, SEPTEMBER 2013") Welcome to the September issue of the Armed Conflict Location & Event Dataset (ACLED) Conflict Trends. Each month, ACLED researchers gather, analyse and publish data on political violence in Africa in
Welcome to the September issue of the Armed Conflict Location & Event Dataset (ACLED) Conflict Trends. Each month, ACLED researchers gather, analyse and publish data on political violence in Africa in
February 2013 USER GUIDE TO THE CCAPS MAPPING TOOL
 February 2013 USER GUIDE TO THE CCAPS MAPPING TOOL TABLE OF CONTENTS About the CCAPS Program...1 Introduction...2 Getting Started...4 Using Filters...4 Viewing Features...5 Using Advanced Filters...8 SCAD
A Major Challenge to the Sustainable Development Goals. Andrew Mack and Robert Muggah
 A Major Challenge to the Sustainable Development Goals Andrew Mack and Robert Muggah The Sustainable Development Goals (SDGs) which were adopted at the UN Summit in September last year, contain a goal
Select Publically Available Conflict and Violence Datasets- Regional Typology Overview (October, 2015)
") Dataset ACLED GTD Igarapé INSCR/CSP -MEPV INSCR/CSP- HCTB RDWTI UCDP- GED Title and Igarapé Institute Institution Homicide Monitor Website Armed Conflict Location Event Dataset Project (ACLED) www.acleddata.
Dataset ACLED GTD Igarapé INSCR/CSP -MEPV INSCR/CSP- HCTB RDWTI UCDP- GED Title and Igarapé Institute Institution Homicide Monitor Website Armed Conflict Location Event Dataset Project (ACLED) www.acleddata.
Unemployment and underemployment data
 Helpdesk Report Unemployment and underemployment data Laura Bolton Institute of development Studies 23 November 2016 Question Identify the number (absolute and as a proportion of the working age population)
chapter 1 people and crisis
 chapter 1 people and crisis Poverty, vulnerability and crisis are inseparably linked. Poor people (living on under US$3.20 a day) and extremely poor people (living on under US$1.90) are more vulnerable
OCHA Regional Office for Central and East Africa Displaced Populations Report January June 2008, ISSUE 3
 OCHA Regional Office for Central and East Africa Displaced Populations Report January, ISSUE 3 United Nations Office for the Coordination of Humanitarian Affairs Introduction This report contains updated
The African strategic environment 2020 Challenges for the SA Army
 The African strategic environment 2020 Challenges for the SA Army Jakkie Cilliers Institute for for Security Studies, Head Office Pretoria 1 2005 Human Security Report Dramatic decline in number of armed
IEP BRIEF. Positive Peace: The lens to achieve the Sustaining Peace Agenda
 IEP BRIEF Positive Peace: The lens to achieve the Sustaining Peace Agenda EXECUTIVE SUMMARY The April 2016 resolutions adopted by the United One of Positive Peace s value-adds is its Nations Security Council
Tables and Graphs. Figure 1: a) distribution violence per month - total; b) distribution Kenema/Kailahun (orange) vs. all other districts (blue)
 distribution violence per month - total; b) distribution Kenema/Kailahun (orange) vs. all other districts (blue)") Tables and Graphs 10% 9% 8% 7% 6% 5% 4% 3% 2% 1% 0% 0 1 2 3 4 5 6 7 8 9 10 11 12 Figure 1: a) distribution violence per month - total; b) distribution Kenema/Kailahun (orange) vs. all other districts (blue)
Tables and Graphs 10% 9% 8% 7% 6% 5% 4% 3% 2% 1% 0% 0 1 2 3 4 5 6 7 8 9 10 11 12 Figure 1: a) distribution violence per month - total; b) distribution Kenema/Kailahun (orange) vs. all other districts (blue)
AMNESTY INTERNATIONAL MEDIA BRIEFING
 AMNESTY INTERNATIONAL MEDIA BRIEFING AI index: AFR 52/002/2012 21 February 2012 UK conference on Somalia must prioritize the protection of civilians and human rights On 23 February 2012, the UK government
Results from the Afrobarometer Round 5 Survey in NIGERIA
 Results from the Afrobarometer Round 5 Survey in NIGERIA 3 of 4 Public Release events 5 th August, 2013 Lagos, Nigeria www.nationalpartner.org 1 What is the Afrobarometer? The Afrobarometer (AB) is a comparative
Agent Modeling of Hispanic Population Acculturation and Behavior
 Agent of Hispanic Population Acculturation and Behavior Agent Modeling of Hispanic Population Acculturation and Behavior Lyle Wallis Dr. Mark Paich Decisio Consulting Inc. 201 Linden St. Ste 202 Fort Collins
Violent Crime in Massachusetts: A 25-Year Retrospective
 Violent Crime in Massachusetts: A 25-Year Retrospective Annual Policy Brief (1988 2012) Issued February 2014 Report prepared by: Massachusetts Executive Office of Public Safety and Security Office of Grants
Violence Affecting Women and Girls in the Eight NSRP Target States
 Violence Affecting Women and Girls in the Eight NSRP Target States Quarterly Report 4 February April 215 July 9, 215 The following report summarizes the main findings as detailed in three memos produced
CENTER FOR URBAN POLICY AND THE ENVIRONMENT MAY 2007
 I N D I A N A IDENTIFYING CHOICES AND SUPPORTING ACTION TO IMPROVE COMMUNITIES CENTER FOR URBAN POLICY AND THE ENVIRONMENT MAY 27 Timely and Accurate Data Reporting Is Important for Fighting Crime What
I. Summary Human Rights Watch August 2007
 I. Summary The year 2007 brought little respite to hundreds of thousands of Somalis suffering from 16 years of unremitting violence. Instead, successive political and military upheavals generated a human
Dynamics of Indigenous and Non-Indigenous Labour Markets
 1 AUSTRALIAN JOURNAL OF LABOUR ECONOMICS VOLUME 20 NUMBER 1 2017 Dynamics of Indigenous and Non-Indigenous Labour Markets Boyd Hunter, (Centre for Aboriginal Economic Policy Research,) The Australian National
OCHA Regional Office for Central and East Africa
 Displaced Populations Report 1 J a n u a r y J u n e 2 0 0 7, I S S U E 1 United Nations Office for the Coordination of Humanitarian Affairs Major Findings By mid-2007, the IDP population in the CEA region
SHOULD THE UNITED STATES WORRY ABOUT LARGE, FAST-GROWING ECONOMIES?
 Chapter Six SHOULD THE UNITED STATES WORRY ABOUT LARGE, FAST-GROWING ECONOMIES? This report represents an initial investigation into the relationship between economic growth and military expenditures for
Session 5: Violence and Conflict Trends in Africa
 Session 5: Violence and Conflict Trends in Africa Mr. John Clifton Dr. Paul Williams Impact through Insight Violence & Conflict Trends in Africa Prof. Paul D. Williams George Washington University May
Just War or Just Politics? The Determinants of Foreign Military Intervention
 Just War or Just Politics? The Determinants of Foreign Military Intervention Averyroughdraft.Thankyouforyourcomments. Shannon Carcelli UC San Diego scarcell@ucsd.edu January 22, 2014 1 Introduction Under
Telephone Survey. Contents *
 Telephone Survey Contents * Tables... 2 Figures... 2 Introduction... 4 Survey Questionnaire... 4 Sampling Methods... 5 Study Population... 5 Sample Size... 6 Survey Procedures... 6 Data Analysis Method...
Highlights and Overview
 Highlights and Overview OCHA OCHA POliCy AND studies series saving lives today AND tomorrow MANAgiNg the RisK Of HuMANitARiAN CRises 1 Highlights 1 Today we know that: The number of people affected by
EAST AND HORN OF AFRICA
 EAST AND HORN OF AFRICA 2014-2015 GLOBAL APPEAL Chad Djibouti Eritrea Ethiopia Kenya Somalia South Sudan Sudan Uganda Distribution of food tokens to Sudanese refugees in Yida, South Sudan (May 2012) UNHCR
COUNTRY OPERATIONS PLAN. Country: Uganda
 COUNTRY OPERATIONS PLAN Country: Uganda Planning Year: 2004 1.1 Context and Beneficiary Populations Part I: Executive - Summary UNHCR s presence in Uganda dates back from the 1960s. Though the earlier
Overview of UNHCR s operations in Africa
 Overview - Africa Executive Committee of the High Commissioner s Programme 19 February 2014 English Original: English and French Standing Committee 59 th meeting Overview of UNHCR s operations in Africa
Libya s Migrant Report
 DISPLACEMENT TRACKING MATRIX (DTM) Libya s Migrant Report ROUND 14 September - October 2017 Eshaebi/IOM 2017: Sabratha intervention 1 P a g e MIGRANTS IN LIBYA KEY FINDINGS I, SEPTEMBER - OCTOBER 2017
Draft Regional Analysis for the Greater Horn of Africa, an IGAD-OCHA partnership
 Draft Regional Analysis for the Greater Horn of Africa, an IGAD-OCHA partnership Presentation to Inter-Agency Steering Committee 21 May 2015 Background Context OCHA-IGAD MOU signed on 26 March 2014 to
DISPLACEMENT TRACKING MATRIX (DTM) Round IX Report - April, 2016 DISPLACEMENT HIGHLIGHTS
 Round IX Report - April, 2016 DISPLACEMENT HIGHLIGHTS") DISPLACEMENT TRACKING MATRIX (DTM) Round IX Report - April, 2016 DISPLACEMENT HIGHLIGHTS 2,155,618 individuals (352,840 households) were identified in Adamawa, Bauchi, Benue, Taraba, Yobe, Nasarawa, Plateau,
DISPLACEMENT TRACKING MATRIX (DTM) Round IX Report - April, 2016 DISPLACEMENT HIGHLIGHTS 2,155,618 individuals (352,840 households) were identified in Adamawa, Bauchi, Benue, Taraba, Yobe, Nasarawa, Plateau,
Conflict Early Warning. Mechanism (CEWARN)
") Conflict Early Warning and Response Mechanism (CEWARN) Conflict Early Warning and Response Mechanism (CEWARN) CEWARN - IGAD s Conflict Early Warning and Response Mechanism - was established in 2002 on
Conflict Early Warning and Response Mechanism (CEWARN) Conflict Early Warning and Response Mechanism (CEWARN) CEWARN - IGAD s Conflict Early Warning and Response Mechanism - was established in 2002 on
Office of the Special Representative for Children and Armed Conflict
 Office of the Special Representative for Children and Armed Conflict Input to the Universal Periodic Review of the Human Rights Council Report on the Democratic Republic of the Congo 13 April 2009 A. Grave
CONFLICT TRENDS (NO. 16) REAL-TIME ANALYSIS OF AFRICAN POLITICAL VIOLENCE, JULY 2013
 REAL-TIME ANALYSIS OF AFRICAN POLITICAL VIOLENCE, JULY 2013") ACLED is a publicly available database of political violence, which focuses on conflict in African states. Data is geo-referenced and disaggregated by type of violence and a wide variety of actors. Further
ACLED is a publicly available database of political violence, which focuses on conflict in African states. Data is geo-referenced and disaggregated by type of violence and a wide variety of actors. Further
THE POLITICAL ECONOMY OF REGIONAL INTEGRATION IN AFRICA
 THE POLITICAL ECONOMY OF REGIONAL INTEGRATION IN AFRICA THE AFRICAN UNION Jan Vanheukelom EXECUTIVE SUMMARY This is the Executive Summary of the following report: Vanheukelom, J. 2016. The Political Economy
Somali refugees arriving at UNHCR s transit center in Ethiopia. Djibouti Eritrea Ethiopia Kenya Somalia Uganda. 58 UNHCR Global Appeal
 Somali refugees arriving at UNHCR s transit center in Ethiopia. Djibouti Eritrea Ethiopia Kenya Somalia Uganda 58 UNHCR Global Appeal 2010 11 East and Horn of Africa Working environment UNHCR The situation
Rebel Finance and Sexual Violence
 Rebel Finance and Sexual Violence Justin Conrad, James Igoe Walsh & Beth Elise Whitaker University of North Carolina at Charlotte November 14, 2015 (UNC Charlotte) PSSA 2015 1 / 12 Sexual Violence in Wartime
Preliminary Effects of Oversampling on the National Crime Victimization Survey
 Preliminary Effects of Oversampling on the National Crime Victimization Survey Katrina Washington, Barbara Blass and Karen King U.S. Census Bureau, Washington D.C. 20233 Note: This report is released to
JOINT STRATEGY Stabilization through community-driven safety and socio-economic recovery in Somalia
 JOINT STRATEGY Stabilization through community-driven safety and socio-economic recovery in Somalia 1. INTRODUCTION This strategic programmatic note, presented by the Danish Refugee Council (DRC) and the
INTERNATIONAL AID SERVICES
 INTERNATIONAL AID SERVICES Creating a positive reaction Humanitarian Strategy Year 2013-2015 Our mission is to save lives, promote self-reliance and dignity through human transformation, going beyond relief
Gaps and Trends in Disarmament, Demobilization, and Reintegration Programs of the United Nations
 Gaps and Trends in Disarmament, Demobilization, and Reintegration Programs of the United Nations Tobias Pietz Demobilizing combatants is the single most important factor determining the success of peace
Statement by the President of the Security Council
 United Nations Security Council Distr.: General 10 December 2014 Original: English (E) 101214 *1466928* Statement by the President of the Security Council At the 7334th meeting of the Security Council,
X Conference of Forte de Copacabana International Security A European South American Dialogue
 8 Edmont Mulet has been Assistant Secretary-General for Peacekeeping Operations and Head of the Office of Operations since August 2007. From 14 January 2010, he took on the function of Acting Special Representative
The Central Mediterranean route: Deadlier than ever
 GLOBAL MIGRATION DATA ANALYSIS CENTRE D A T A B R I E F I N G S E R I E S The Central Mediterranean route: Deadlier than ever ISSN 2415-1653 Issue No. 3, June 2016 1 in 23 die in the Mediterranean in the
Ethnic Diversity and Perceptions of Government Performance
 Ethnic Diversity and Perceptions of Government Performance PRELIMINARY WORK - PLEASE DO NOT CITE Ken Jackson August 8, 2012 Abstract Governing a diverse community is a difficult task, often made more difficult
RESEARCH ON HUMANITARIAN POLICY (HUMPOL)
") PROGRAMME DOCUMENT FOR RESEARCH ON HUMANITARIAN POLICY (HUMPOL) 2011 2015 1. INTRODUCTION The Norwegian Government, through the Ministry of Foreign Affairs, has committed funding for a four-year research
PROGRAMME DOCUMENT FOR RESEARCH ON HUMANITARIAN POLICY (HUMPOL) 2011 2015 1. INTRODUCTION The Norwegian Government, through the Ministry of Foreign Affairs, has committed funding for a four-year research
Nigeria heads for closest election on record
 Dispatch No. 11 27 January 215 Nigeria heads for closest election on record Afrobarometer Dispatch No. 11 Nengak Daniel, Raphael Mbaegbu, and Peter Lewis Summary Nigerians will go to the polls on 14 February
Book Review. Foreign Direct Investment and the Regional Economy
 Book Review Foreign Direct Investment and the Regional Economy edited by Jonathan Jones and Colin Wren Ashgate Publishing Co., Burlington, USA, 2006 pp. 260 reviewed by Prodromos Prodromidis * The book
Internal Displacement Monitoring Centre (IDMC) SOUTH SUDAN
 SOUTH SUDAN") Internal Displacement Monitoring Centre (IDMC) SOUTH SUDAN Global Report on Internal Displacement (GRID 2018) Conflict displacement Figures analysis SOUTH SUDAN - Contextual update Stock: 1,899,000 New
Internal Displacement Monitoring Centre (IDMC) SOUTH SUDAN Global Report on Internal Displacement (GRID 2018) Conflict displacement Figures analysis SOUTH SUDAN - Contextual update Stock: 1,899,000 New
THE WAGES OF WAR: How donors and NGOs can build upon the adaptations Syrians have made in the midst of war
 THE WAGES OF WAR: How donors and NGOs can build upon the adaptations Syrians have made in the midst of war FEBRUARY 2018 The scale of death and suffering in Syria is monumental. What began as a series
Civil Society Organizations in Montenegro
 Civil Society Organizations in Montenegro This project is funded by the European Union. This project is funded by the European Union. 1 TABLE OF CONTENTS EVALUATION OF LEGAL REGULATIONS AND CIRCUMSTANCES
African Agency: Transnational Security Challenges. Migration, Health and Climate Change. Executive Summary
 African Agency: Transnational Security Challenges. Migration, Health and Climate Change Executive Summary African Agency: Transnational Security Challenges. Migration, Health and Climate Change was a one
City of Janesville Police Department 2015 Community Survey
 City of Janesville Police Department 2015 Community Survey Presentation and Data Analysis Conducted by: UW-Whitewater Center for Political Science & Public Policy Research Susan M. Johnson, Ph.D. and Jolly
Presentation Script English Version
 Presentation Script English Version The presentation opens with a black screen. When ready to begin, click the forward arrow. The nations of sub-saharan Africa are poised to take off. Throughout the continent,
ROBOTROLLING ISSUE 2 ROBOTROLLING CENTRE OF EXCELLENCE CENTRE OF EXCELLENCE
 ROBOTROLLING 2017. ISSUE 2 ROBOTROLLING PREPARED AND BY THE PREPARED BYPUBLISHED THE NATOSTRATEGIC STRATEGIC COMMUNICATIONS NATO COMMUNICATIONS CENTRE OF EXCELLENCE CENTRE OF EXCELLENCE Executive Summary
Government Briefing Note for Oireachtas Members on UK-EU Referendum
 Government Briefing Note for Oireachtas Members on UK-EU Referendum Summary The process of defining a new UK-EU relationship has entered a new phase following the decision of the EU Heads of State or Government
Freedom in Africa Today
 www.freedomhouse.org Freedom in Africa Today Those who care about the fate of freedom in our world should focus on its condition in Africa today. Sub- Saharan Africa in 2006 presents at the same time some
SUBJECT: Preventing Mass Atrocities: Resilient Societies, State Capacity, and Structural Reform
 Policy Memo DATE: October 30, 2013 SUBJECT: Preventing Mass Atrocities: Resilient Societies, State Capacity, and Structural Reform Over the past decade, building resilient societies has emerged as an important
Evaluating Integrated Conservation & Development at Bwindi Impenetrable National Park, Uganda. Julia Baker 29 th November 2012 Oxford Brookes
 Evaluating Integrated Conservation & Development at Bwindi Impenetrable National Park, Uganda Julia Baker 29 th November 2012 Oxford Brookes Conservation Policy Priorities for managing protected areas
Compare Your Area User Guide
 Compare Your Area User Guide October 2016 Contents 1. Introduction 2. Data - Police recorded crime data - Population data 3. How to interpret the charts - Similar Local Area Bar Chart - Within Force Bar
Labor Force Statistics Vol. 1: Unemployment and Underemployment Report (Q1-Q3 2017)
") Labor Force Statistics Vol. 1: and Underemployment Report (Q1-Q3 2017) Report Date: December 2017 Contents Summary 1 Definition and Methodology 3 Labor Force and Non-Labor Force and Underemployment 3 8
Labor Force Statistics Vol. 1: and Underemployment Report (Q1-Q3 2017) Report Date: December 2017 Contents Summary 1 Definition and Methodology 3 Labor Force and Non-Labor Force and Underemployment 3 8
Security and Sustainable Development: an African Perspective
 Security and Sustainable Development: an African Perspective Funmi Olonisakin A consensus has emerged in recent years among security thinkers and development actors alike, that security is a necessary
Report on community resilience to radicalisation and violent extremism
 Summary 14-02-2016 Report on community resilience to radicalisation and violent extremism The purpose of the report is to explore the resources and efforts of selected Danish local communities to prevent
Poverty profile and social protection strategy for the mountainous regions of Western Nepal
 October 2014 Karnali Employment Programme Technical Assistance Poverty profile and social protection strategy for the mountainous regions of Western Nepal Policy Note Introduction This policy note presents
DISPLACEMENT TRACKING MATRIX (DTM) Round VII Report - December 2015 DISPLACEMENT HIGHLIGHTS
 Round VII Report - December 2015 DISPLACEMENT HIGHLIGHTS") DISPLACEMENT TRACKING MATRIX (DTM) Round VII Report - December 2015 DISPLACEMENT HIGHLIGHTS 2,151,979 individuals (313,575 households) were identified in Adamawa, Bauchi, Benue, Borno, Gombe, Taraba, Yobe,
DISPLACEMENT TRACKING MATRIX (DTM) Round VII Report - December 2015 DISPLACEMENT HIGHLIGHTS 2,151,979 individuals (313,575 households) were identified in Adamawa, Bauchi, Benue, Borno, Gombe, Taraba, Yobe,
Slums As Expressions of Social Exclusion: Explaining The Prevalence of Slums in African Countries
 Slums As Expressions of Social Exclusion: Explaining The Prevalence of Slums in African Countries Ben C. Arimah United Nations Human Settlements Programme (UN-HABITAT) Nairobi, Kenya 1. Introduction Outline
The Department of State s Annual Report on Terrorism
 The Department of State s Annual Report on Terrorism Testimony of Raphael F. Perl Specialist in International Affairs Foreign Affairs, Defense, and Trade Division Congressional Research Service Before
The implications of the escalation in Abia
 September 2017 NIGERIA The implications of the escalation in Abia Disclaimer The information contained in this report is only up-to-date as at 18 September, 2017. Some of it is subject to change during
Survey Report on a New Security Council Resolution on Women and Peace and Security. Global Network of Women Peacebuilders (GNWP)
") Survey Report on a New Security Council Resolution on Women and Peace and Security Conducted by Global Network of Women Peacebuilders (GNWP) Researchers: Prativa Khanal and Runhan Tian September 2017 GNWP
Survey Report on a New Security Council Resolution on Women and Peace and Security Conducted by Global Network of Women Peacebuilders (GNWP) Researchers: Prativa Khanal and Runhan Tian September 2017 GNWP
Political Instability in Zimbabwe: Planning for Succession Contingencies
 Political Instability in Zimbabwe: Planning for Succession Contingencies George F. Ward, Jr. Political instability and potential violence are ever-present threats in Zimbabwe. The country s nonagenarian
The Crime Drop in Florida: An Examination of the Trends and Possible Causes
 The Crime Drop in Florida: An Examination of the Trends and Possible Causes by: William D. Bales Ph.D. Florida State University College of Criminology and Criminal Justice and Alex R. Piquero, Ph.D. University
Results from the Afrobarometer Round 5 Survey in NIGERIA
 Results from the Afrobarometer Round 5 Survey in NIGERIA 1 of 4 Public Release events 22nd/May/13, Lagos, Nigeria www.nationalpartner.org 1 What is the Afrobarometer? The Afrobarometer (AB) is a comparative
IIRC Stakeholder Feedback Survey
 IIRC Stakeholder Feedback Survey The Survey Summary of approach The IIRC Stakeholder Feedback Survey was sent on 25 May 2016 to around 10,000 stakeholders taken from the IIRC s central database. It was
Area based community profile : Kabul, Afghanistan December 2017
 Area based community profile : Kabul, Afghanistan December 207 Funded by In collaboration with Implemented by Overview This area-based city profile details the main results and findings from an assessment
Number of countries represented for all years Number of cities represented for all years 11,959 11,642
 Introduction The data in this report are drawn from the International Congress Calendar, the meetings database of the Union of International Associations (UIA) and from the Yearbook of International Organizations,
JUBA - SOUTH SUDAN FEBRUARY 2014
 FACTSHEET #1: UN HOUSE JUBA - SOUTH SUDAN FEBRUARY 2014 CONTEXT This fact sheet presents the key findings of a recent REACH assessment in the UN House Protection of Civilians (PoC) area. The motivations
Original: English Geneva, 28 September 2011 INTERNATIONAL DIALOGUE ON MIGRATION The future of migration: Building capacities for change
 International Organization for Migration (IOM) Organisation internationale pour les migrations (OIM) Organización Internacional para las Migraciones (OIM) INFORMAL CONSULTATIONS ON INTERNATIONAL DIALOGUE
International Conference on Information Disclosure, Accountability and Inclusive Growth and Governance in the Extractive Industry
 International Conference on Information Disclosure, Accountability and Inclusive Growth and Governance in the Extractive Industry Venue: Maputo, Mozambique Date: 4-5 September 2018 The Centre for Public
Further key insights from the Indigenous Community Governance Project, 2006
 Further key insights from the Indigenous Community Governance Project, 2006 J. Hunt 1 and D.E. Smith 2 1. Fellow, Centre for Aboriginal Economic Policy Research, The Australian National University, Canberra;
BOOK SUMMARY. Rivalry and Revenge. The Politics of Violence during Civil War. Laia Balcells Duke University
 BOOK SUMMARY Rivalry and Revenge. The Politics of Violence during Civil War Laia Balcells Duke University Introduction What explains violence against civilians in civil wars? Why do armed groups use violence
Overview SEEKING STABILITY: Evidence on Strategies for Reducing the Risk of Conflict in Northern Jordanian Communities Hosting Syrian Refugees
 SEEKING STABILITY: Evidence on Strategies for Reducing the Risk of Conflict in Northern Jordanian Communities Hosting Syrian Refugees Overview Three years into the Syrian Civil War, the spill-over of the
Update of UNHCR s operations in Africa
 Update - Africa Executive Committee of the High Commissioner s Programme 13 March 2018 English Original: English and French Standing Committee 71 th meeting Update of UNHCR s operations in Africa A. Situational
Evidence-Based Policy Planning for the Leon County Detention Center: Population Trends and Forecasts
 Evidence-Based Policy Planning for the Leon County Detention Center: Population Trends and Forecasts Prepared for the Leon County Sheriff s Office January 2018 Authors J.W. Andrew Ranson William D. Bales
THE POLITICAL ECONOMY OF REGIONAL INTEGRATION IN AFRICA
 THE POLITICAL ECONOMY OF REGIONAL INTEGRATION IN AFRICA INTERGOVERNMENTAL AUTHORITY ON DEVELOPMENT (IGAD) Bruce Byiers EXECUTIVE SUMMARY This is the Executive Summary of the following report: Byiers, B.
II. The role of indicators in monitoring implementation of Security Council resolution 1325 (2000)
") United Nations S/2010/173 Security Council Distr.: General 6 April 2010 Original: English Women and peace and security Report of the Secretary-General I. Introduction 1. On 5 October 2009, the Security
United Nations S/2010/173 Security Council Distr.: General 6 April 2010 Original: English Women and peace and security Report of the Secretary-General I. Introduction 1. On 5 October 2009, the Security
DETERMINANTS OF THE LONG TERM ECONOMIC GROWTH OF NATIONS IN THE ERA OF THE CRYSTALLIZATION OF THE MODERN WORLD SYSTEM
 DETERMINANTS OF THE LONG TERM ECONOMIC GROWTH OF NATIONS IN THE ERA OF THE CRYSTALLIZATION OF THE MODERN WORLD SYSTEM A Senior Scholars Thesis by NIHAD MANSIMZADA Submitted to Honors and Undergraduate
! # % & ( ) ) ) ) ) +,. / 0 1 # ) 2 3 % ( &4& 58 9 : ) & ;; &4& ;;8;
 ) ) ) ) +,. / 0 1 # ) 2 3 % ( &4& 58 9 : ) & ;; &4& ;;8;") ! # % & ( ) ) ) ) ) +,. / 0 # ) % ( && : ) & ;; && ;;; < The Changing Geography of Voting Conservative in Great Britain: is it all to do with Inequality? Journal: Manuscript ID Draft Manuscript Type: Commentary
! # % & ( ) ) ) ) ) +,. / 0 # ) % ( && : ) & ;; && ;;; < The Changing Geography of Voting Conservative in Great Britain: is it all to do with Inequality? Journal: Manuscript ID Draft Manuscript Type: Commentary
INTERNAL SECURITY. Publication: November 2011
 Special Eurobarometer 371 European Commission INTERNAL SECURITY REPORT Special Eurobarometer 371 / Wave TNS opinion & social Fieldwork: June 2011 Publication: November 2011 This survey has been requested
Estimates of crisis-attributable mortality in South Sudan, December 2013-April 2018
 Estimates of crisis-attributable mortality in South Sudan, December 2013-April 2018 FAQ Document September 2018 Table of Contents 1. Who undertook this study?... 2 2. Who funded the study?... 2 3. What
UCDP Non-state Actor Dataset Codebook
 UCDP Non-state Actor Dataset Codebook Version 1-2009 Lotta Harbom & Ralph Sundberg Uppsala Conflict Data Program (UCDP) Department of Peace and Conflict Research, Uppsala University When using the data,
RESEARCH REPORT ITU INTERNATIONAL MODEL UNITED NATIONS United Nations Security Council VISION WITH ACTION. The situation in Nigeria
 ITU INTERNATIONAL MODEL UNITED NATIONS 2016 VISION WITH ACTION United Nations Security Council The situation in Nigeria RESEARCH REPORT Yasemin Melek Introduction Nigeria has been one of the countries
The National Citizen Survey
 CITY OF SARASOTA, FLORIDA 2008 3005 30th Street 777 North Capitol Street NE, Suite 500 Boulder, CO 80301 Washington, DC 20002 ww.n-r-c.com 303-444-7863 www.icma.org 202-289-ICMA P U B L I C S A F E T Y
Managing Civil Violence & Regional Conflict A Managing Global Insecurity Brief
 Managing Civil Violence & Regional Conflict A Managing Global Insecurity Brief MAY 2008 "America is now threatened less by conquering states than we are by failing ones. The National Security Strategy,