Framework Document 2002
|
|
|
- Beverley Bryant
- 6 years ago
- Views:
Transcription
1 Background Paper to the 2002 Corruption Perceptions Index Framework Document 2002 The Corruption Perceptions Index is a composite index. The data used this year were compiled between 2000 and Comparisons to last year s index should be based on scores. However, such comparisons can be misleading because of methodological changes between years. This document describes the data that entered into the index, discusses how corruption is defined by our sources and relates the perceptions gathered to reality. A new methodology was used for standardizing the data and for determining confidence intervals. Both these issues are described here in detail. PD Dr. Johann Graf Lambsdorff Transparency International (TI) and Göttingen University July 2002 The author is utmost indebted to Walter Zucchini, Göttingen, for methodological innovations. Thanks also to Brad Efron, Susan Rose-Ackerman and Lynn Gale for helpful comments.
2 1. The methodology Transparency International (TI) publishes its annual Corruption Perceptions Index (CPI) since This index has developed into a leading indicator in social sciences. As in previous years, this framework document provides an in-depth explanation of the methodology and measurement precision. The goal of the CPI is to provide data on extensive perceptions of corruption within countries. The CPI is a composite index, making use of surveys of businesspeople and assessments by country analysts. It consists of credible sources using diverse sampling frames and different methodologies. These perceptions enhance our understanding of real levels of corruption from one country to another. As pointed out in previous framework documents, unbiased, hard data continue to be difficult to obtain and usually raise problematic questions with respect to validity. International surveys on perceptions therefore serve as the most credible means of compiling a ranking of nations. Overall, 15 sources could be included in the 2002 CPI, originating from 9 independent institutions. The complete list of sources is presented in the appendix. All in all, the number of countries in the CPI increased from 91 last year to 102. Sources in 2002 Prior to selecting sources guidelines have been set up which organize the underlying decision making process. These include the actual criteria that a source needs to meet in order to qualify for inclusion as well as organizational guidelines on how the final decision is reached with the help of the Transparency International Steering Committee. This process aimed at making the final decision as transparent and robust as possible. As a result of this it was decided that the 2002 CPI includes data from the following sources: The World Economic Forum (WEF) The Institute for Management Development, Lausanne (IMD) PricewaterhouseCoopers (PwC) the World Bank's World Business Environment Survey (WBES) The Economist Intelligence Unit (EIU) Freedom House, Nations in Transit (FH) the Political and Eonomic Risk Consultancy, Hong Kong (PERC) Gallup International on behalf of Transparency International (TI/GI) the State Capacity Survey by Columbia University (CU) An essential condition for inclusion is that a source must provide a ranking of nations. This condition is not met if a source conducts surveys in a variety of countries but with varying methodologies. Comparison from one country to another are not feasible in this case and a ranking cannot be produced. Another condition is that sources must measure the overall level of corruption. This is violated if aspects of corruption are mixed with issues other than corruption such as political instability or nationalism or if changes are measured instead of levels of corruption. For example, the index Corruption in Government from the International Country Risk Guide (ICRG), conducted by the Political Risk Services (PRS), did not meet these requirements, albeit being widely used in research as a measure of levels of corruption. It does not determine a country s level of corruption but the political risk involved in corruption. As pointed out to us by the ICRG-editor, these two issues can differ considerably, depending on whether there exists a high or low tolerance towards corruption. Corruption only leads to political instability if it is not tolerated. Due to this, the data by PRS-ICRG did not qualify for inclusion in the CPI. However, TI hopes to include a modified set of data by PRS in the future. The 2002 CPI combines assessments from the past three years to reduce abrupt variations in scoring that might arise due to
3 random effects. Some sources, such as TI/GI, WBES and PwC, provided only one recent survey. Others such as PERC, WEF and IMD conducted various surveys between 2000 and 2002, which are all included. In addition to its Global Competitiveness Report (GCR), the WEF also published the Africa Competitiveness Reports (ACR) in 2000, which is also included. While this averaging is valuable for the inclusion of surveys, it is inappropriate for application to the data compiled by country experts. Such assessments as compiled by FH, CU and EIU are conducted by a small number of country experts who regularly analyze a country's performance, counterchecking their conclusions with peer discussions. Following this systematic evaluation, they then consider a potential upgrading or downgrading. As a result, a country's score changes rather seldom and the data shows little year-to-year variation. Changing scores in this case are the result of a considered judgement by the organization in question. To then go back and average the assessments over a period of time would be inappropriate. On the other hand, in the case of elite surveys an averaging o- ver various years produces a useful smoothing effect. While some annual data may contain random errors, these do not necessarily carry over into the next year. Year-to-year comparisons Comparisons to the results from previous years should be based on a country s score, not its rank. A country s rank can change simple because new countries enter the index and others drop out. A higher score is an indicator that respondents provided better ratings, while a lower score suggests that respondents revised their perception downwards. However, year-to-year comparisons of a country's score do not only result from a changing perception of a country's performance but also from a changing sample and methodology. With differing respondents and slightly differing methodologies, a change in a country's score may also relate to the fact that different viewpoints have been collected and different questions been asked. The index asked. The index primarily provides an annual snapshot of the views of businesspeople, with less of a focus on year-to-year trends. However, to the extent that changes can be traced back to a change in the results from individual sources, trends can cautiously be identified. Noteworthy examples of a downward trend between 2001 and 2002 are Argentina, Ireland and Moldova. The considerable decline in their scores does not result from technical factors actual changes in perceptions are therefore likely. With the same caveats applied, on the basis of data from sources that have been consistently used for the index, improvements can be observed for the Dominican Republic, Hong Kong, Russia, Slovenia and South Korea. 2. Validity All sources generally apply a definition of corruption such as the misuse of public power for private benefit, for example bribing of public officials, kickbacks in public procurement, or embezzlement of public funds. Each of the sources also assesses the extent of corruption among public officials and politicians in the countries in question: In 2002 the IMD asks respondents to assess whether bribing and corruption prevail or do not prevail in the economy. The WEF asks in its 2002 Global Competitiveness Report in your industry, how commonly would you estimate that firms make undocumented extra payments or bribes connected with import and export permits, public utilities and contracts, business licenses, tax payments, loan applications, influencing of laws and policies, and getting favorable judicial decisions. A slightly different question had been posed in 2000 and 2001 and in the Africa Competitiveness Report The PERC asks in 2001 How do you rate corruption in terms of its quality or
4 contribution to the overall living/working environment. A slightly different question had been asked previously. The EIU defines corruption as the misuse of public office for personal (or party political) financial gain and aims at measuring the pervasiveness of corruption. Corruption is one of over 60 indicators used to measure country risk and forecasting. PwC asks for the frequency of corruption in various contexts (e.g. obtaining import/export permits or subsidies, avoiding taxes). FH determines the "level of corruption" without providing further defining statements. The WBES asks two questions with respect to corruption, one determining the "Frequency of bribing" and another one relating to "corruption as a constraint to business". Columbia University asks for the severity of corruption within the state. Gallup International on behalf of Transparency International asks How common are bribes to politicians, senior civil servants, and judges and how significant of an obstacle are the costs associated with such payments for doing business? The terms "prevalence", "commonness", "frequency", "constraint ", "contribution to working environment" and severity are closely related. They all refer to some kind of degree of corruption, which is also aim of the CPI. This common feature of the various sources is particularly important in view of the fact that corruption comes in different forms. It has been suggested in numerous publications that distinctions should be made between these forms of corruption, e.g. between nepotism and corruption in the form of monetary transfers. Yet, none of the data included in the CPI emphasize one form of corruption at the expense of other forms. The sources can be said to aim at measuring the same phenomenon. As also emphasized in the framework documents of previous years, the sources do not distinguish between administrative and political corruption. The term "degree of corruption" may imply different things. In particular, it may relate to the frequency of bribes or the size of bribes. But we know from the results of our sources that frequency and the size of bribes tend to correlate highly (as expounded in the framework documents of previous years). In countries where corruption is frequent it also amounts to a high fraction of firms' revenues. In sum, the term degree of corruption seems to equally reflect the two aspects, frequency of corruption and the total value of bribes paid. 3. Perceptions and reality While the sources all aim at measuring the degree of corruption, the sample design differs considerably. The data by IMD, WBES, PwC and WEF largely sample residents (sometimes also from multinational companies). In contrast, the data by PERC, FH, TI/GI, CU and EIU largely relate to expatriates. Whether this difference between samples may lead to different outcomes still requires scientific study. For the purposes of the CPI it added to the robustness of the resulting figures, since the data correlate well, irrespective of whether expatriates or residents had been polled. This correlation suggests that there being different samples makes no great difference to the results. Interpreting perceptions As the data collected relates to perceptions rather than to real phenomena, it has to be considered whether such perceptions improve our understanding of what real levels of corruption may be. Since actual levels of corruption cannot be determined directly, perceptions may be all we have to guide us. However, this approach is undermined to at least some extent, if the perceptions gathered are biased. Such a potential bias might originate from the particular cultural background of respondents. Depending on whether the sample consist of locals or ex-
5 patriates, this suggests two potential biases to be relevant. Imagine that being asked to assess the level of corruption, a local estimates a high level of corruption in the country of residence. Such an assessment would be a valid contribution to the CPI only if the respondent makes the assessment as a result of comparisons with the levels of corruption perceived in other countries. But this is not necessarily the viewpoint taken by the respondent. A respondent may also assign high levels by comparing corruption to o- ther (potentially less pressing) problems facing the country, or by evaluating it according to a high ethical standard (e.g. which assumes any kind of gift-giving to a public official to be corrupt and not culturally acceptable). In the case of such an outlook, a high degree of observed corruption may reflect a high standard of ethics rather than a high degree of real misbehavior. Perceptions would be a misleading indicator for real levels of corruption. This bias can occur particularly if only locals are surveyed, each assessing only the level of perceived corruption in their own countries. If respondents are asked to assess foreign countries or to make comparisons between a variety of countries, this bias should not occur. Respondents will, in this case, compare a foreign country with their home country or with an even larger set of countries. They will be forced to apply the same definition of corruption and make use of the same ethical standard for all countries, which produces valid comparative assessments. However, in this context a second type of bias might arise, originating from the potential dominance of a particular cultural heritage in the sample questioned or because expatriates lack a proper understanding of a country's culture. The results would be meaningless to locals who have a different understanding and definition of corruption. While samples of expatriates are susceptible to this kind of bias, surveys which question local residents clearly avoid it. The strength of the CPI rests with the idea that we include surveys which are not susceptible to the first type of bias. Particularly these are EIU, TI/GI, CU, FH and PERC. Since the data provided by these sources refers to assessments by expatriates, they are subject to a homogeneous definition of corruption and a consistent ethical standard. In case of TI/GI respondents have been asked to compare between different countries. This ensures that a consistent e- thical standard is applied. The CPI also incorporates the data from the IMD, WEF, PwC and WBES. Since these refer to assessments made largely by local residents, they are less likely to represent the perception of a certain cultural heritage. The second type of bias can clearly be rejected for these sources. Since the data from the EIU, TI/GI, CU, FH and PERC correlate well with the other data, there seems to be no support for the suggestion that they might be influenced by the second type of bias. Similarly, since the data by the IMD, WEF, PwC and WBES correlate well with data from the other five institutions; the notion that the first type of bias might be present is clearly not supported. The validity of the sources is mutually confirmed and no hint is found for the existence of a bias in our data. Another criticism of the CPI was that expatriates surveyed are often western businesspeople. The viewpoint of less developed countries seemed underrepresented. TI/GI now surveys respondents from less developed countries, asking them to assess the performance of industrial countries. This balances the sample; yet, as shown in the correlations, it does not bring about noteworthy different results. Thus, the comparative assessments gathered in the CPI do not disproportionately reflect the perceptions of western businesspeople. In sum, it seems that residents tend to have a consistent ethical standard with regard to assessments of corruption, while expatriates do not tend to impose an i- nappropriate ethical standard or to lack cultural insights. Our approach clearly suggests that the perceptions gathered are a
6 helpful contribution to the understanding of real levels of corruption. As was also explained in detail in the 2001 framework document, the perceptions gathered well relate to actual experience made and less to hearsay The index Standardizing Since each of the sources uses its own scaling system, aggregation requires a standardization of the data before each country s mean value can be determined. This standardization is carried out in two steps. Until 2001 a simple means and standard deviation approach was adopted for step 1. The aim was to ensure that inclusion of a source consisting of a certain subset of countries should not change the mean and standard deviation of this subset of countries in the CPI. In 2001 the 2000 CPI was the starting point for standardization, except for older sources that were already standardized previously (where the standardized values determined in previous years were utilized). Standardization meant that the mean and standard deviation of a new source must take the same value as the respective subset in the 2000 CPI. With S'(j,k) being the original value provided by source k to country j, the standardized value, S(j,k), was determined by S(j, k) = [ S'(j,k) - SD(2000 CPI) Mean(S' (k)] + SD(S' (k)) Mean(2000 CPI) where the means and standard deviations (SD) for the source k and the 2000 CPI have been determined for the joint subset of countries. After standardizing each source, the simple average was taken for each country. 1 See Lambsdorff, J. Graf (2001) Framework Document., Background Paper 2001 Corruption Perceptions Index: The step 2 is a final standardization of the average values determined previously. Taking the average implies that the resulting index has a standard deviation across countries which is smaller than that of the CPI of previous years. In order to avoid a year-to-year trend towards a continuously smaller diversity of assessments, the scores had to be stretched. This ensured that the standard deviation of countries in the index 2 remained constant over time. This approach was subject to intense debate this year. It was decided that a modified approach should be used for step 1: matching percentiles. Instead of equalizing means and standard deviations, the ranks (and not the scores) of countries is the only information processed from our sources. For this technique again the common subsamples of a new source and the previous year s CPI are determined. Then, the largest value in the CPI is taken as the standardized value for the country ranked best by the new source. The second largest value is given to the country ranked second best, etc. 3 Imagine that a new sources ranks UK best, Singapore second, Venezuela third and Argentina fourth. In the 2001 CPI these countries obtained the scores 9.2, 8.3, 3.5 and 2 More precisely, we should talk about the standard deviation of a common sub-sample of countries in the index. 3 In case two countries share the same rank, their standardized value is the simple mean of the two respective scores in the CPI. The scores for countries where no CPI value was available are determined by referring to neighbor countries in the source s ranking. Linear interpolation is applied to their scores, suggesting that if a source assigns such a country a score close to the upper neighbor, also its standardized value is closer to that of this neighbor. If such a country is ranked best (or worst) by a source it would have only one neighbor, not two. The second neighbor is constructed by using the highest (or lowest) attainable score by the source and the CPI value 10 (or 0). This approach guarantees that all values remain within the range between 10 and 0.
7 2.8. Matching percentiles would now assign UK the best score of 9.2, Singapore 8.3, Venezuela 3.5 and Argentina 2.8. Matching percentiles is superior in combining indices that have different distributions. But, as it makes use of the ranks, and not the scores of sources, this method looses some of the information inherent in the sources. What tipped the balance in favor of this techniques is its capacity to keep all reported values within the bounds from 0 to 10: All countries in the CPI obtain scores between 0 (very corrupt) and 10 (highly clean). While we report these absolute bounds, the previous standardization provided no guarantee that all values remained within these bounds. In effect, equalizing means and standard deviations can bring about standardized values above 10 or below 0. This has indeed happened in the past with e.g. Finland obtaining standardized scores above 10. Last year, standardized values for Bangladesh of 1.7 have led to confusion among observants. Matching percentiles, on the other hand, guarantees that all standardized values are within these bounds. This results because any standardized value is taken from the previous year s CPI, which by definition is restricted to the aforementioned range. In sum, matching percentiles has the disadvantage of wasting some information by processing only the ranks reported by sources. Yet, this disadvantage seems to be offset because 1) the approach is free of assumptions regarding the distribution of sources, and 2) all standardized values remain within the range from 0 to 10. Step 2 Having obtained standardized values that are all within the reported range, a simple average from these standardized values can be determined. As already argued before, the resulting index has a standard deviation which is smaller than that of the CPI of previous years. Without a second adjustment there would be a trend towards a continuously smaller diversity of scores. If, e.g., Finland were to repeat its score from the previous year, it would have to score best in all sources listing this country. If it scores second to best in any source, the standardized value it obtains after using matching percentiles and aggregation would be lower than its current score. Thus, given some heterogeneity among sources, it seems inevitable that Finland s score would deteriorate. The opposite would be true of Bangladesh, which would obtain a better score if it is not consistently rated worst by all its sources. A second standardization is required in order to avoid a continuous trend to less diversity among scores. However, applying a simple mean and standard deviation technique might a- gain bring about values that are beyond our range from 0 to 10. The proposal would therefore be to apply a more complicated standardization for this second step: A betatransformation. The idea behind this monotonous transformation is to increase the standard deviation to its desired value, but to keep all values within the range from 0 to 10. Each value (X) is therefore transformed according to the following function: 1 α 1 β 1 10 ( X /10) (1 X /10) dx 0 This beta-transformation is available in standard statistics programs. The crucial task is to find the parameters α and β so that the resulting mean and standard deviation of the index have the desired values. An algorithm has been determined that carries out this task. Applying this approach to the 2002 CPI, the change in the scores is depicted by figure 1. The parameters were α= and β= As shown in the figure, scores between 5 and 10 are increased slightly, while those between 0 and 5 are lowered. This effect makes sure that the previous standard deviation is preserved. Yet, once a score of 10 has been reached, the score is not further increased. Equally, a score of 0 is not further decreased. This guarantees that all values remain within the range. The beta transformation is first applied to all values that were standardized in step 1. Afterwards the average of these are computed to determine a country s score. In
8 Change due to transformation our publication we also report the high-low range. This refers to all standardized values after carrying out the beta-transformation. This procedure ensured that the high-low range is consistently related to a country s mean value. All these values remain within the range from 0 to 10. While the methodological adjustments were considerable, their impact on the outcome was rather small. Had the 2002 CPI been determined with the previous methodology, the result would correlate with our current one. In spite of the methodological modifications, there exists a high numerical continuity of the CPI. 4 Reliability and Precision Figure 1: Beta Transformation CPI-score prior to transformation A ranking of countries may easily be misunderstood as measuring the performance of a country with absolute precision. This is certainly not true. Since its start in 1995 TI has provided data on the standard deviation and the amount of sources contributing to 4 Matching percentiles as compared to a linear transformation provided a particularly unfavorable score for Tunisia, bringing a- bout a deterioration of about 0.5 in its final score. the index. This data already serves to illustrate the inherent imprecision. Also the high-low range is provided in the main table. This depicts the highest and the lowest values provided by our sources, so as to portray the whole range of assessments. However, no quick conclusions should be derived from this range to the underlying precision with which countries are measured. Countries which were assessed by 3 or 12 sources can have the same minimum and maximum values, but in the latter case we can feel much more confident about the country s score. In order to arrive at such measures of precision, other statistical methods are required. The strength of the CPI is based on the concept that a combination of data sources combined into a single index increases the reliability of each individual figure. As in previous years, the 2002 CPI includes all countries for which at least three sources had been available. The idea of combining data is that the nonperformance of one source can be balanced out by the inclusion of at least two other sources. This way, the probability of misrepresenting a country is seriously lowered. This is valid even in case the sources are not totally independent of each other. Such partial dependency may arise if some respondents are aware of other people's perception of the level of corruption, or of other sources contributing to the CPI. An indicator for the overall reliability of the 2000 CPI can be drawn from the high correlation between the sources. Since the standardization approach makes use only of the ranks (and not the scores) provided by the sources, we report Kendall s rank correlation. Referring only to countries included

9 in the CPI, this data is in table 1. 5 As the correlations on average are 0.7, the sources do not differ considerably in their assessment of levels of corruption. It should be noted that the rank correlation is lower than the more commonly used Pearsoncorrelation, which is 0.84 on average for the various sources. In addition to these correlations, the reliability of each individual country score can be determined. The larger the number of sources and the lower the standard deviation between the sources, the more reliable is the value for a country. The relatively large standard deviation for Poland of 1.1 signifies that 95% of the sources ranged be- 5 Abbreviations relate to the sources used, Africa Competitiveness Report (ACR) of the World Economic Forum, Economist Intelligence Unit (EIU), Freedom House (FH), Global Competitiveness Report (GCR) of the World Economic Forum, Institute for Management Development (IMD), Political and Economic Risk Consultancy (PERC), PricewaterhouseCoopers (PwC), World Business Environment Survey of the World Bank (WBES), Gallup International on behalf of Transparency International (TI/GI) and Columbia University (CU). between a value of 1.8 and 6.2. In contrast, the low standard deviation for Canada of 0.2 means that 95% of the scores range between 8.6 and 9.4. Confidence range We have been providing readers with the additional information on the confidence range for some years now. These were based on the determination of the standard error for a country s average score and a resulting parametric assessment of a 95 confidence range. This approach required the assumption that there is no imprecision associated with the source s values and that these values are independent of each other. Another strong assumption required is that errors are normally distributed. While it is statistically difficult to relax the first two assumptions, one can relax the assumption of a normal distribution and apply tests which are valid throughout any type of distribution. Another drawback of the older confidence ranges was, again, that they sometimes violated the given range from 0 to 10. For example, while in 2001 Bangladesh had a score of 0.4, its 95% confidence range was between 3.6 and 4.4. For Finland, on the other hand, the range went as high as This type of a range is confusing even for an expert. Since it is in contradiction to
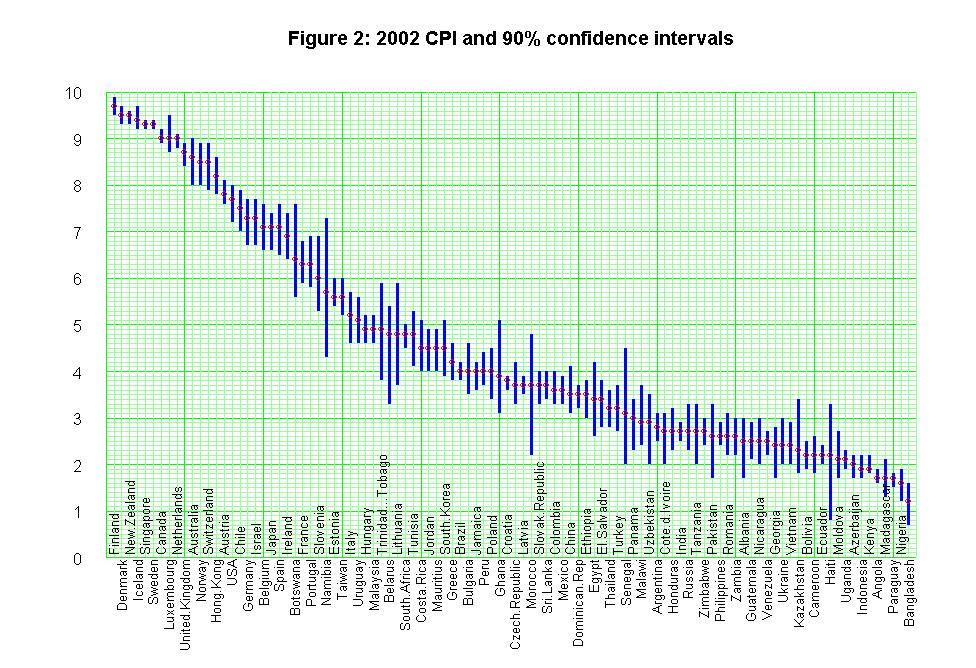
10 the official range reported, the public is e- qually disoriented. In order to restrict the confidence range to our pre-specified limits, this year we introduce a different approach: a nonparametric approach applying the bootstrap methodology. The principal idea of such a bootstrap confidence range is to resample the sources of a country with replacement. If five source values (3, 5, 4, 4.5, 4.2) had been given, an example of such a sample would be (5, 5, 4.2, 3, 3). A sufficiently large number of such samples (in our case 10,000) are drawn from the available vector of sources and the sample mean is determined in each case. Based on the distribution of the resulting means, inferences on the underlying precision can been drawn. The lower (upper) bound of a 90% confidence range is then determined as the value where 5% of the sample s means are below (above) this critical value. In addition to the percentile method just described, more complicated approaches exist. First, the confidence levels can be adjusted if (on a- verage) the mean of a bootstrap sample is smaller than the observed mean. The relevant parameter is called z 0. Another adjustment is to assume the standard deviation also to be dependent on the mean of the bootstrap sample. The relevant parameter is a. If both these adjustments are considered, the resulting approach is called a bootstrap- BC a -method (bias-corrected-accelerated). A precise description of this approach can be obtained from Efron and Tibshirani (1993, chap. 14.3, 22.4 and 22.5). 6 One concern with the BC a approach is that it is throwing a lot of machinery at very few observations. Due to statistical considerations, a simple method might prove superior. Brad Efron had therefore suggested the use of a BCapproach for our purpose. In this case, z 0 is determined endogenously from the bootstrap sample but a is set equal to zero. There are two interesting characteristics of the resulting confidence range. 1) When requiring a 90% confidence range (which allows with 5% probability that the true value is below and with 5% probability that the value is above the determined confidence range) the upper (lower) bound will not be higher (lower) than the highest (lowest) value provided by a source. This implies that our range from 0 to 10 will never be violated. 2) The confidence range remains valid even if the data (i.e. the standardized values for a given country) are not normally distributed. The range is even free of assumptions with regard to the distribution of these data. It should not be ignored that confidence ranges cannot be very solid when only very few sources are available. This is true for any methodology applied. Regardless of whether a normal distribution is assumed or a bootstrap approach is taken, the confidence range must not be overrated when only 3 sources exist. It serves only as a rough guide in this case. Above that, there can arise boundary effects when only 3 or 4 sources exist. Since only 10 different combinations are possible in the case of 3 sources, a 5% confidence point can hit one resulting boundary. If this is the case, the BCapproach could produce at random two different values for the upper (or the lower) confidence point. These boundary effects have been identified and, if existent, the more conservative range is reported in the table. The resulting confidence range is reported in our publications. It is also graphically illustrated in figure 2. On the web-sites and we provide the complete data for each country: the score, amount of sources contributing, standard deviation, high-low range, the confidence range and the amount of independent institutions that contributed to an average value. 6 See Efron, B. and R. Tibshirani (1993), An Introduction to the Bootstrap, Chapman & Hall: New York and London:
11
12 Appendix: Survey sources for the TI Corruption Perceptions Index (CPI) 2002 Number Source Columbia University (CU) Political & Economic Risk Consultancy Name State Capacity Survey Asian Intelligence Issue Year Internet address Who was surveyed? analysts, academics and journalists) US-resident country experts (policy Expatriate business executives Subject asked Severity of corruption within the state Extent of corruption in a way that detracts from the business environment for foreign companies How do you rate corruption in terms of its quality or contribution to the o- verall living/working environment? Number of replies 251 1,027 ca. 1,000 Coverage 121 countries 14 countries Number Source Institute for Management Development, IMD, Switzerland Name World Competitiveness Yearbook Year Internet address www02.imd.ch/wcy Who was surveyed? Executives in top and middle management; domestic and international companies Subject asked Bribing and corruption exist in the public sphere Bribing and corruption exist in the economy Number of replies 4,160 3,678 3,532 Coverage 47 countries 49 countries Number 7 8 Source World Bank PricewaterhouseCoopers Name World Business Environment Survey Opacity Index Year Internet address info.worldbank.org/governance/wbes/index1. html Who was surveyed? Subject asked Senior managers "Frequency of bribing" and "corruption as a constraint to business" CFOs, equity analysts, bankers and PwC staff Frequency of corruption in various contexts (e.g. obtaining import/export permits or subsidies, avoiding taxes) Number of replies 10,090 1,357 Coverage 79 countries 7 34 countries 7 The survey was carried out in 81 countries, but data for two countries was insufficient.
13 Number Source Economist Intelligence Unit Freedom House World Economic Forum Name Country Risk Service and Nations in Transit Africa Competitiveness Country Forecast Report Year Internet address Expert staff Assessment by US academic Senior business leaders; Who was surveyed? assessment (expatriate) experts and FH staff domestic and international Subject asked Assessment of the pervasiveness of corruption (the misuse of public office for private or political party gain) among public officials (politicians and civil servants) Levels of corruption companies How problematic is corruption? Are irregular, additional payments required? In large amounts? Number of replies Not applicable Not applicable 1,800 Coverage 115 countries 27 transition economies 26 countries Number Source World Economic Forum Name Global Competitiveness Report Year Internet address Who was surveyed? Senior business leaders; domestic and international companies Subject asked Undocumented extra payments connected with import and export permits, public utilities and contracts, business licenses, tax payments or loan applications are common/not common. In addition to questions mentioned left: payments connected to favorable regulations and judicial decisions Number of replies 4,022 ca. 4,600 ca Coverage 59 countries 76 countries 80 countries Number 15 Source Gallup International on behalf of Transparency International Name Corruption Survey Year 2002 Internet address /index.html#bpi Who was surveyed? Senior businesspeople from 15 e- merging market economies How common are bribes to politicians, senior civil servants, and judges Subject asked and how significant of an obstacle are the costs associated with such payments for doing business? Number of replies 835 Coverage 21 countries
Framework Document 2003
 Background Paper to the 2003 Corruption Perceptions Index The Corruption Perceptions Index is a composite index. The data used this year were compiled between 2001 and 2003. 17 surveys of businesspeople
The Transparency International
 The Transparency International Corruption Perceptions Index 1999 Framework Document Dr. Johann Graf Lambsdorff on behalf of Transparency International, October 1999 1. The Methodology 1.1 Introduction
TI Corruption Perception Index 1996
 Dr. Johann Graf Lambsdorff Volkswirtschaftliches Seminar Universität Göttingen Tel: +49-30-3438200 Platz der Göttinger Sieben 3 Fax: +49-30-3470 3912 Tel: +49-551-397298 email: ti@transparency.org Fax:
Corruption Perceptions Index 2011 Long Methodological Brief
 Corruption Perceptions Index 2011 Long Methodological Brief Transparency International s (TI) Corruption Perceptions Index 1 (CPI) is an aggregate indicator that ranks countries in terms of the degree
A view from the Inside at Transparency International. entrusted power for private gain WHAT the abuse of ISentrusted power for private gain the
 Fighting Corruption: A view from the Inside at Transparency International Susan Côté-Freeman, Transparency International Utilities & Energy Compliance & Ethics Conference Houston, Texas 1 March 2011 power
Corruption Perceptions Index 2011 Full Source Description. Sources included in the CPI 2011:
 Corruption Perceptions Index 2011 Sources included in the CPI 2011: 1. African Development Bank Governance Ratings 2010 2. Asian Development Bank Country Performance Assessment 2010 3. Bertelsmann Foundation
Transparency International Corruption Perceptions Index 2003
 Transparency International Corruption Perceptions Index 2003 http://www.transparency.org Transparency International Secretariat Otto-Suhr-Allee 97-99, 10585 Berlin, Germany Tel: +49-30-3438 2010 Fax: +49-30-3470
NEW ZEALAND BEST, INDONESIA WORST IN WORLD POLL OF INTERNATIONAL CORRUPTION
 PRESS RELEASE EMBARGOED UNTIL SATURDAY 15 JULY 1995 AT 0400 HRS GMT NEW ZEALAND BEST, INDONESIA WORST IN WORLD POLL OF INTERNATIONAL CORRUPTION New Zealand, Denmark, Singapore and Finland come out as the
Transparency International Corruption Perceptions Index 2003
 Transparency International Corruption Perceptions Index 2003 http://www.transparency.org Transparency International Secretariat Otto-Suhr-Allee 97-99, 10585 Berlin, Germany Tel: +49-30-3438 2010 Fax: +49-30-3470
GLOBAL CORRUPTION PERCEPTION INDEX (CPI) 2017 published 21 February
 2017 published 21 February") GLOBAL CORRUPTION PERCEPTION INDEX (CPI) 2017 published 21 February 2018 www.transparentnost.org.rs www.transparency.org/cpi Corruption Perception Index for 2017 Global (180 states/territories) agregate
GLOBAL CORRUPTION PERCEPTION INDEX (CPI) 2017 published 21 February 2018 www.transparentnost.org.rs www.transparency.org/cpi Corruption Perception Index for 2017 Global (180 states/territories) agregate
Improving the accuracy of outbound tourism statistics with mobile positioning data
 1 (11) Improving the accuracy of outbound tourism statistics with mobile positioning data Survey response rates are declining at an alarming rate globally. Statisticians have traditionally used imputing
Corruption Perceptions Index 2017: Full Source Description 13 data sources were used to construct the Corruption Perceptions Index (CPI) 2017:
 2017:") Corruption Perceptions Index 2017: Full Source Description 13 data sources were used to construct the Corruption Perceptions Index (CPI) 2017: 1. African Development Bank Country Policy and Institutional
Corruption Perceptions Index 2017: Full Source Description 13 data sources were used to construct the Corruption Perceptions Index (CPI) 2017: 1. African Development Bank Country Policy and Institutional
Corruption Perceptions Index 2016: Full Source Description 13 data sources were used to construct the Corruption Perceptions Index 2016:
 Corruption Perceptions Index 2016: Full Source Description 13 data sources were used to construct the Corruption Perceptions Index 2016: 1. African Development Bank Governance Ratings 2015 2. Bertelsmann
University of Groningen. Corruption and governance around the world Seldadyo, H.
 University of Groningen Corruption and governance around the world Seldadyo, H. IMPORTANT NOTE: You are advised to consult the publisher's version (publisher's PDF) if you wish to cite from it. Please
Unit 4: Corruption through Data
 Unit 4: Corruption through Data Learning Objectives How do we Measure Corruption? After studying this unit, you should be able to: Understand why and how data on corruption help in good governance efforts;
The 2017 TRACE Matrix Bribery Risk Matrix
 The 2017 TRACE Matrix Bribery Risk Matrix Methodology Report Corruption is notoriously difficult to measure. Even defining it can be a challenge, beyond the standard formula of using public position for
Egypt s Administrative Corruption Perception Index February 2018
 Egypt s Administrative Corruption Perception Index 2016 February 2018 Egypt s Administrative Corruption Perception Index Definition of Administrative Corruption The term of administration corruption is
Table 1-1. Transparency International Corruption Perceptions Index 2005 and Corruption Perceptions Global Corruption Barometer 2004: Correlations
 Table 1-1 Transparency International Corruption Perceptions Index 2005 and Corruption Perceptions Global Corruption Barometer 2004: Correlations Global Corruption Barometer Variables TI Corruption Perceptions
Perceptions of Corruption in Mass Publics
 Perceptions of Corruption in Mass Publics Sören Holmberg QoG WORKING PAPER SERIES 2009:24 THE QUALITY OF GOVERNMENT INSTITUTE Department of Political Science University of Gothenburg Box 711 SE 405 30
2017 Edelman Trust Barometer. Presentation to EuroPCom November 2017
 2017 Edelman Trust Barometer Presentation to EuroPCom November 2017 Trust in Retrospect 2001 2002 2003 2004 2005 2006 2007 2008 2009 Rising Influence of NGOs Fall of the Celebrity CEO Earned Media More
TI s Corruption Perceptions Index (CPI)
") ADB-OECD Anti-Corruption Initiative for Asia and the Pacific 5th regional anti-corruption conference Beijing, September 28-30, 2005 How can public opinion surveys assist in preparing anti-corruption reform?
ADB-OECD Anti-Corruption Initiative for Asia and the Pacific 5th regional anti-corruption conference Beijing, September 28-30, 2005 How can public opinion surveys assist in preparing anti-corruption reform?
The objective of the survey "Corruption in Estonia: a survey of three target groups" is to find answers to the following questions:
 Introduction The objective of the survey "Corruption in Estonia: a survey of three target groups" is to find answers to the following questions: 1) how is corruption defined and to what extent it is condemned;
WEF GLOBAL COMPETITIVENESS REPORT: GEORGIA
 2011-2012 WEF GLOBAL COMPETITIVENESS REPORT: GEORGIA FINAL Tuesday, July 03, 2012 This publication was produced for review by the United States Agency for International Development. It was prepared by
Migration and Integration
 Migration and Integration Integration in Education Education for Integration Istanbul - 13 October 2017 Francesca Borgonovi Senior Analyst - Migration and Gender Directorate for Education and Skills, OECD
Achieving Corporate Integrity
 Achieving Corporate Integrity Dr Mark Lovatt Transparency International Malaysia ti-malaysia@transparency.org.my www.transparency.org.my Integrity Unsinkable Titanic s current state How is integrity compromised?
2007/ACT/WKSP1/016 Corruption Control in Singapore Effective National Anti-Corruption Strategies: Prosecuting High-Level Corruption
 2007/ACT/WKSP1/016 Corruption Control in Singapore Effective National Anti-Corruption Strategies: Prosecuting High-Level Corruption Submitted by: Singapore Workshop on Strengthening Cooperation Mechanisms
More and more corruption?
 1 Validity of the CPI, Passau 23-25 June 2005 DIES OECONOMICUS VI 23-25 June 2005 University of Passau Organized by Transparency International Germany and the Passau University On the occasion of 10 years
31% - 50% Cameroon, Paraguay, Cambodia, Mexico
 EStimados Doctores: Global Corruption Barometer 2005 Transparency International Poll shows widespread public alarm about corruption Berlin 9 December 2005 -- The 2005 Global Corruption Barometer, based
2017 Edelman Trust Barometer. European Union
 2017 Edelman Trust Barometer European Union 2017 Edelman Trust Barometer Methodology Online Survey in 28 Countries General Online Population Informed Public Mass Population 17 years of data 33,000+ respondents
Volume 30, Issue 1. Corruption and financial sector performance: A cross-country analysis
 Volume 30, Issue 1 Corruption and financial sector performance: A cross-country analysis Naved Ahmad Institute of Business Administration (IBA), Karachi Shahid Ali Institute of Business Administration
Daniel Kaufmann, Brookings Institution
 Corruption in transition: reflections & implications from governance empirics Daniel Kaufmann, Brookings Institution Presentation at the opening plenary session on Measurement & Consequences of Corruption
The interaction effect of economic freedom and democracy on corruption: A panel cross-country analysis
 The interaction effect of economic freedom and democracy on corruption: A panel cross-country analysis Author Saha, Shrabani, Gounder, Rukmani, Su, Jen-Je Published 2009 Journal Title Economics Letters
Measuring Corruption: Myths and Realities
 Measuring Corruption: Myths and Realities Daniel Kaufmann, Aart Kraay, and Massimo Mastruzzi, TheWorld Bank Draft, May 1 st, 2006 There is renewed interest in the World Bank, and among aid donors and aid
The evolution of the EU anticorruption
 DEVELOPING AN EU COMPETENCE IN MEASURING CORRUPTION Policy Brief No. 27, November 2010 The evolution of the EU anticorruption agenda The problem of corruption has been occupying the minds of policy makers,
Report. Transparency International Global Corruption Barometer 2005
 Report on the Transparency International Global Corruption Barometer 2005 Embargoed until 9 December 2005 Release date: 9 December 2005 Policy and Research Department Transparency International International
LABOUR-MARKET INTEGRATION OF IMMIGRANTS IN OECD-COUNTRIES: WHAT EXPLANATIONS FIT THE DATA?
 LABOUR-MARKET INTEGRATION OF IMMIGRANTS IN OECD-COUNTRIES: WHAT EXPLANATIONS FIT THE DATA? By Andreas Bergh (PhD) Associate Professor in Economics at Lund University and the Research Institute of Industrial
Daniel Kaufmann, Brookings Institution
 Reset Within Russia?: A Comparative Governance Perspective Daniel Kaufmann, Brookings Institution Presentation at the Public Conference The Risks of the Reset, at the Heritage Foundation, Washington, D.C.,
2017 Edelman Trust Barometer. Susanne Marell CEO Edelman.ergo
 2017 Edelman Trust Barometer Susanne Marell CEO Edelman.ergo 1 Trust Index A world of distrust Average trust in institutions, General Population, 2016 vs. 2017 Trusters (60-100) Neutrals (50-59) Distrusters
Impact Of Economic Freedom On Economic Development: A Nonparametric Approach To Evaluation
 Impact Of Economic Freedom On Economic Development: A Nonparametric Approach To Evaluation Andrea Vondrová, Ing., PhD Elena Fifeková, Ing., PhD University of Economics, Faculty of National Economy, Department
The Sudan Consortium African and International Civil Society Action for Sudan. Sudan Public Opinion Poll Khartoum State
 The Sudan Consortium African and International Civil Society Action for Sudan Sudan Public Opinion Poll Khartoum State April 2015 1 Table of Contents 1. Introduction... 3 1.1 Background... 3 1.2 Sample
Report on the Transparency International Global Corruption Barometer 2006
 Report on the Transparency International Global Corruption Barometer 2006 Embargoed until Thursday 7 December 2006 at 10:00 GMT; 11:00 CET; 5:00 EST Release date: 7 December 2006 Policy and Research Department
CORRUPTION PERCEPTIONS INDEX CORRUPTION PERCEPTIONS INDEX (CPI) 2015 SURVEY RESULTS
 2015 SURVEY RESULTS") CORRUPTION PERCEPTIONS INDEX CORRUPTION PERCEPTIONS INDEX (CPI) 2015 SURVEY RESULTS Date: 27th January 2016 (Wednesday) Time: 11.00am Venue: Royal Selangor Club, Bukit Kiara CORRUPTION PERCEPTIONS INDEX
CORRUPTION PERCEPTIONS INDEX CORRUPTION PERCEPTIONS INDEX (CPI) 2015 SURVEY RESULTS Date: 27th January 2016 (Wednesday) Time: 11.00am Venue: Royal Selangor Club, Bukit Kiara CORRUPTION PERCEPTIONS INDEX
MEASUREMENT TOOL Since 1995 Perceptions Public sector corruption Aggregate index Compare countries 178 in Awareness raising Country level
 BRIBE FAVOURITE PAYERS CORRUPTION INDEX 2011 Since 1995 Perceptions Public sector corruption Aggregate index Compare countries 178 in 2010 - Awareness raising Country level attention Research 2nd November
Gender preference and age at arrival among Asian immigrant women to the US
 Gender preference and age at arrival among Asian immigrant women to the US Ben Ost a and Eva Dziadula b a Department of Economics, University of Illinois at Chicago, 601 South Morgan UH718 M/C144 Chicago,
PRESS STATEMENT ON THE RELEASE OF THE CORRUPTION PERCEPTIONS INDEX (CPI) 2015
 2015") GHANA INTEGRITY INITIATIVE (GII) Local Chapter of Transparency International PRESS STATEMENT ON THE RELEASE OF THE CORRUPTION PERCEPTIONS INDEX (CPI) 2015 Accra, 27 January, 2016 Transparency International,
GHANA INTEGRITY INITIATIVE (GII) Local Chapter of Transparency International PRESS STATEMENT ON THE RELEASE OF THE CORRUPTION PERCEPTIONS INDEX (CPI) 2015 Accra, 27 January, 2016 Transparency International,
Confidence Intervals*
 Transparency International Corruption Perceptions Index A country or territory s indicates the degree of public sector corruption as perceived by business people and country analysts, and ranges between
The Wage Effects of Immigration and Emigration
 The Wage Effects of Immigration and Emigration Frederic Docquier (UCL) Caglar Ozden (World Bank) Giovanni Peri (UC Davis) December 20 th, 2010 FRDB Workshop Objective Establish a minimal common framework
Exploring relations between Governance, Trust and Well-being
 Exploring relations between Governance, Trust and Well-being Using recent Gallup WorldPoll data Robert Manchin Gallup Europe Asia-Pacific Conference on Measuring Well-Being and Fostering the Progress of
Corruption continues to deprive societies around the world
 PRESS RELEASE This is Passau University s press release on the Corruption Perceptions Index 2004. Please also obtain the official press release by Transparency International at: transparency.org/surveys/index.html#cpi
Special Eurobarometer 470. Summary. Corruption
 Corruption Survey requested by the European Commission, Directorate-General for Migration and Home Affairs and co-ordinated by the Directorate-General for Communication This document does not represent
GSU Research Day Research Day 2017
 Governors State University OPUS Open Portal to University Scholarship GSU Research Day Research Day 2017 Apr 7th, 9:30 AM - 10:00 AM Business Ethics Perceptions of Russian Working Adults: Do Age, Gender,
DANISH TECHNOLOGICAL INSTITUTE. Supporting Digital Literacy Public Policies and Stakeholder Initiatives. Topic Report 2.
 Supporting Digital Literacy Public Policies and Stakeholder Initiatives Topic Report 2 Final Report Danish Technological Institute Centre for Policy and Business Analysis February 2009 1 Disclaimer The
Can We Measure the Power of the Grabbing Hand?
 Policy Research Working Paper 8299 WPS8299 Can We Measure the Power of the Grabbing Hand? A Comparative Analysis of Different Indicators of Corruption Alexander Hamilton Craig Hammer Public Disclosure
What is good governance: main aspects and characteristics
 KYRGYZSTAN What is good governance: main aspects and characteristics Roman Mogilevsky Center for Social and Economic Research CASE-Kyrgyzstan Presentation at the Roundtable VIII of the Fostering Global
Global Corruption Barometer 2010 New Zealand Results
 Global Corruption Barometer 2010 New Zealand Results Ben Krieble TINZ Summer Intern www.transparencynz.org.nz executive@transparency.org.nz Contents Executive Summary 3 Summary of global results 4 Summary
Vancouver Police Community Policing Assessment Report Residential Survey Results NRG Research Group
 Vancouver Police Community Policing Assessment Report Residential Survey Results 2017 NRG Research Group www.nrgresearchgroup.com April 2, 2018 1 Page 2 TABLE OF CONTENTS A. EXECUTIVE SUMMARY 3 B. SURVEY
Civil and Political Rights
 DESIRED OUTCOMES All people enjoy civil and political rights. Mechanisms to regulate and arbitrate people s rights in respect of each other are trustworthy. Civil and Political Rights INTRODUCTION The
Do Institutions have a Greater Effect on Female Entrepreneurs?
 Do Institutions have a Greater Effect on Female Entrepreneurs? Saul Estrin LSE, CEPR, IZA And Tomasz Mickiewicz University College, London 1 Slides for presentation at Female Entrepreneurship: Constraints
โอกาสและความท าทายของประเทศไทยในอนาคต
 โอกาสและความท าทายของประเทศไทยในอนาคต Thailand 22 Apirak Kosayodhin Apirak Kosayodhin Advisor to Prime Minister of Thailand Thailand has significantly changed in the past 2 years Improved quality of life
Best Practices for Curbing Corruption in Asian Countries
 Best Practices for Curbing Corruption in Asian Countries Jon S.T. Quah, Ph.D. Vice-President, Asian Association for Public Administration Anti-Corruption Consultant, Singapore Email: jonstquah@gmail.com
TRANSPARENCY INTERNATIONAL BOSNIA AND HERZEGOVINA CRINIS STUDY. Study of the Transparency of Political Party Financing in BiH
 TRANSPARENCY INTERNATIONAL BOSNIA AND HERZEGOVINA 2010 CRINIS STUDY Study of the Transparency of Political Party Financing in BiH CRINIS STUDY Study of the Transparency of Political Party Financing in
Working women have won enormous progress in breaking through long-standing educational and
 THE CURRENT JOB OUTLOOK REGIONAL LABOR REVIEW, Fall 2008 The Gender Pay Gap in New York City and Long Island: 1986 2006 by Bhaswati Sengupta Working women have won enormous progress in breaking through
GIA s 41 Annual Global End of Year Survey: ECONOMICALLY MORE DIFFICULT YEAR TO COME
 GIA s 41 Annual Global End of Year Survey: ECONOMICALLY MORE DIFFICULT YEAR TO COME The World s first (launched in 1977) and leading Global Barometer on prosperity, hope and happiness, covering this year
Harper numerically surpasses Trudeau in weekly Nanos tracking for first time since early June (Released 07/16/2014)
") Weekly Nanos Party Power Index Tracking (period ending July 11 th, 2014) released July 16 th, 2014 Harper numerically surpasses Trudeau in weekly Nanos tracking for first time since early June (Released
Weekly Nanos Party Power Index Tracking (period ending July 11 th, 2014) released July 16 th, 2014 Harper numerically surpasses Trudeau in weekly Nanos tracking for first time since early June (Released
ANNUAL SURVEY REPORT: BELARUS
 ANNUAL SURVEY REPORT: BELARUS 2 nd Wave (Spring 2017) OPEN Neighbourhood Communicating for a stronger partnership: connecting with citizens across the Eastern Neighbourhood June 2017 1/44 TABLE OF CONTENTS
Table of Contents. List of Figures 2. Executive Summary 3. 1 Introduction 4
 Table of Contents List of Figures 2 Executive Summary 3 1 Introduction 4 2 Innovating Contributions 5 2.1 Americans 5 2.2 Australia, New Zealand and Pacific 6 2.3 Europe, Africa and Middle East 7 2.4 Japan
Governance and the City:
 Governance and the City: Global Determinants of Urban Performance and Implications from an International Perspective Daniel Kaufmann, Frannie Léautier & Massimo Mastruzzi The World Bank Institute http://worldbank.org/wbi/governance/
Introduction: Summary of the Survey Results
 Introduction: Summary of the Survey Results The following is a chapter-by-chapter summary of the main points that became apparent as a result of this survey. The design of the survey form is similar in
The Effect of Corruption on Investment Growth: Evidence from Firms in Latin America, Sub-Saharan Africa, and Transition Countries*
 Review of Development Economics, 13(2), 200 214, 2009 DOI:10.1111/j.1467-9361.2009.00507.x The Effect of Corruption on Investment Growth: Evidence from Firms in Latin America, Sub-Saharan Africa, and Transition
BY Amy Mitchell, Katie Simmons, Katerina Eva Matsa and Laura Silver. FOR RELEASE JANUARY 11, 2018 FOR MEDIA OR OTHER INQUIRIES:
 FOR RELEASE JANUARY 11, 2018 BY Amy Mitchell, Katie Simmons, Katerina Eva Matsa and Laura Silver FOR MEDIA OR OTHER INQUIRIES: Amy Mitchell, Director, Journalism Research Katie Simmons, Associate Director,
Skill Classification Does Matter: Estimating the Relationship Between Trade Flows and Wage Inequality
 Skill Classification Does Matter: Estimating the Relationship Between Trade Flows and Wage Inequality By Kristin Forbes* M.I.T.-Sloan School of Management and NBER First version: April 1998 This version:
Harper numerically surpasses Trudeau in preferred PM on Nanos tracking for first time in four months (Released 11/12/2014)
") Weekly Nanos Party Power Index Tracking (period ending November 7 th, 2014) released November 12 th, 2014 Harper numerically surpasses Trudeau in preferred PM on Nanos tracking for first time in four months
Weekly Nanos Party Power Index Tracking (period ending November 7 th, 2014) released November 12 th, 2014 Harper numerically surpasses Trudeau in preferred PM on Nanos tracking for first time in four months
Sources of information on corruption in Ethiopia
 www.transparency.org www.cmi.no Sources of information on corruption in Ethiopia Query Please provide me with sources of information on corruption in Ethiopia. Note: This query was treated as an urgent
Economic Growth, Foreign Investments and Economic Freedom: A Case of Transition Economy Kaja Lutsoja
 Economic Growth, Foreign Investments and Economic Freedom: A Case of Transition Economy Kaja Lutsoja Tallinn School of Economics and Business Administration of Tallinn University of Technology The main
Do You Know Your Data? Measurement Validity in Corruption Research. Angela Hawken and Gerardo L. Munck *
 Do You Know Your Data? Measurement Validity in Corruption Research Angela Hawken and Gerardo L. Munck * September 19, 2009 Abstract: After making a case that more attention needs to be given to the quality
Mapping Policy Preferences with Uncertainty: Measuring and Correcting Error in Comparative Manifesto Project Estimates *
 Mapping Policy Preferences with Uncertainty: Measuring and Correcting Error in Comparative Manifesto Project Estimates * Kenneth Benoit Michael Laver Slava Mikhailov Trinity College Dublin New York University
A COMPARISON OF ARIZONA TO NATIONS OF COMPARABLE SIZE
 A COMPARISON OF ARIZONA TO NATIONS OF COMPARABLE SIZE A Report from the Office of the University Economist July 2009 Dennis Hoffman, Ph.D. Professor of Economics, University Economist, and Director, L.
AMERICAN JOURNAL OF UNDERGRADUATE RESEARCH VOL. 3 NO. 4 (2005)
") , Partisanship and the Post Bounce: A MemoryBased Model of Post Presidential Candidate Evaluations Part II Empirical Results Justin Grimmer Department of Mathematics and Computer Science Wabash College
, Partisanship and the Post Bounce: A MemoryBased Model of Post Presidential Candidate Evaluations Part II Empirical Results Justin Grimmer Department of Mathematics and Computer Science Wabash College
ARTICLES. European Union: Innovation Activity and Competitiveness. Realities and Perspectives
 ARTICLES European Union: Innovation Activity and Competitiveness. Realities and Perspectives ECATERINA STǍNCULESCU Ph.D., Institute for World Economy Romanian Academy, Bucharest ROMANIA estanculescu@yahoo.com
Influence of Consumer Culture and Race on Travel Behavior
 PAPER Influence of Consumer Culture and Race on Travel Behavior JOHANNA P. ZMUD CARLOS H. ARCE NuStats International ABSTRACT In this paper, data from the National Personal Transportation Survey (NPTS),
Networks and Innovation: Accounting for Structural and Institutional Sources of Recombination in Brokerage Triads
 1 Online Appendix for Networks and Innovation: Accounting for Structural and Institutional Sources of Recombination in Brokerage Triads Sarath Balachandran Exequiel Hernandez This appendix presents a descriptive
DEFINING AND MEASURING CORRUPTION AND ITS IMPACT
 DEFINING AND MEASURING CORRUPTION AND ITS IMPACT MANUEL BALÁN ASSISTANT PROFESSOR POLITICAL SCIENCE AND INTERNATIONAL DEVELOPMENT MCGILL UNIVERSITY MANUEL.BALAN@MCGILL.CA September 29, 2017 Objectives
A GAtewAy to A Bet ter Life Education aspirations around the World September 2013
 A Gateway to a Better Life Education Aspirations Around the World September 2013 Education Is an Investment in the Future RESOLUTE AGREEMENT AROUND THE WORLD ON THE VALUE OF HIGHER EDUCATION HALF OF ALL
Democracy and Development: An Appraisal of Nigeria s Position in the Democracy Index
 Democracy and Development: An Appraisal of Nigeria s Position in the Democracy Index PHILIP, Chimobi Omoke Economics Department Covenant University Tel: 08037432483 E-mail: Philip.omoke@covenantuniversity.edu.ng
Why is The Effect Corruption on Economic Growth Less Harmful in Some Developing Countries Than in Others?
 J. Basic. Appl. Sci. Res., 2(6)5971-5976, 2012 2012, TextRoad Publication ISSN 2090-4304 Journal of Basic and Applied Scientific Research www.textroad.com Why is The Effect Corruption on Economic Growth
Corruption and Agricultural Trade. Trina Biswas
 Corruption and Agricultural Trade Trina Biswas Selected Paper prepared for presentation at the International Agricultural Trade Research Consortium s (IATRC s) 2015 Annual Meeting: Trade and Societal Well-Being,
Indices of Social Development
 Indices of Social Development 4th OECD World Forum 16-19 October 2012 Ellen Webbink Contents Why social development indices? How the indices are composed Progress since launch Why does social development
As with other areas of comparative political inquiry, analyses of political
 Lancaster and Montinola 3 Comparative Political Corruption: Issues of Operationalization and Measurement* Thomas D. Lancaster and Gabriella R. Montinola As with other areas of comparative political inquiry,
Telephone Survey. Contents *
 Telephone Survey Contents * Tables... 2 Figures... 2 Introduction... 4 Survey Questionnaire... 4 Sampling Methods... 5 Study Population... 5 Sample Size... 6 Survey Procedures... 6 Data Analysis Method...
WHAT IS PUBLIC OPINION? PUBLIC OPINION IS THOSE ATTITUDES HELD BY A SIGNIFICANT NUMBER OF PEOPLE ON MATTERS OF GOVERNMENT AND POLITICS
 WHAT IS PUBLIC OPINION? PUBLIC OPINION IS THOSE ATTITUDES HELD BY A SIGNIFICANT NUMBER OF PEOPLE ON MATTERS OF GOVERNMENT AND POLITICS The family is our first contact with ideas toward authority, property
STATISTICS BRIEF URBAN PUBLIC TRANSPORT IN THE 21 ST CENTURY
 STATISTICS BRIEF URBAN PUBLIC TRANSPORT IN THE 21 ST CENTURY This Statistics Brief is an abridged version of the extensive report, Urban Public Transport in the 21 st Century, available on the UITP MyLibrary
PEOPLE FEEL THAT THE OF CORRUPTION CLIMATE IS INTENSIFYING
 PEOPLE FEEL THAT THE OF CORRUPTION CLIMATE IS INTENSIFYING The majority of people living in a selection of 14 Eastern- and Central-European countries do not consider bribes as a natural and ordinary part
Federal Liberals score highest on Nanos Party Power Index Trudeau and Harper trending up on qualities of a good leader (Released 08/27/2014)
") Weekly Nanos Party Power Index Tracking (period ending August 22 nd, 2014) released August 27 th, 2014 Federal Liberals score highest on Nanos Party Power Index Trudeau and Harper trending up on qualities
Weekly Nanos Party Power Index Tracking (period ending August 22 nd, 2014) released August 27 th, 2014 Federal Liberals score highest on Nanos Party Power Index Trudeau and Harper trending up on qualities
Executive summary 2013:2
 Executive summary Why study corruption in Sweden? The fact that Sweden does well in international corruption surveys cannot be taken to imply that corruption does not exist or that corruption is not a
Cross-Country Intergenerational Status Mobility: Is There a Great Gatsby Curve?
 Cross-Country Intergenerational Status Mobility: Is There a Great Gatsby Curve? John A. Bishop Haiyong Liu East Carolina University Juan Gabriel Rodríguez Universidad Complutense de Madrid Abstract Countries
Chapter 10: Long-run Economic Growth: Sources and Policies
 Chapter 10: Long-run Economic Growth: Sources and Policies Yulei Luo SEF of HKU February 13, 2012 Learning Objectives 1. Define economic growth, calculate economic growth rates, and describe trends in
SECTION 10: POLITICS, PUBLIC POLICY AND POLLS
 SECTION 10: POLITICS, PUBLIC POLICY AND POLLS 10.1 INTRODUCTION 10.1 Introduction 10.2 Principles 10.3 Mandatory Referrals 10.4 Practices Reporting UK Political Parties Political Interviews and Contributions
Photo by photographer Batsaikhan.G
 Survey on perceptions and knowledge of corruption 2017 1 2 Survey on perceptions and knowledge of corruption 2017 This survey is made possible by the generous support of Global Affairs Canada. The Asia
Corruption in Kenya, 2005: Is NARC Fulfilling Its Campaign Promise?
 Afrobarometer Briefing Paper No.2 January Corruption in Kenya, 5: Is NARC Fulfilling Its Campaign Promise? Kenya s NARC government rode to victory in the 2 elections in part on the coalition s promise
NANOS. Ideas powered by world-class data. Liberals 41, Conservatives 31, NDP 15, Green 6 in latest Nanos federal tracking
 Liberals 41, Conservatives 31, NDP 15, Green 6 in latest Nanos federal tracking Nanos Weekly Tracking, ending September 14, 2018 (released September 18, 2018-6 am Eastern) NANOS Ideas powered by world-class