1 Work-Related Deaths Decline in Population Estimates for Alaska. 13 Alaska's Employment Scene
|
|
|
- Jocelin Parks
- 5 years ago
- Views:
Transcription


1 ALASKA ECONOMIC October 994

 465-4500.")


2 ALASKA ECONOMIC Contents Al(~ska Ecntlnnlic Trends is a mnnthl! pub icntionclealing with a variety ofeconomic related issues in the state. Alaska Economic Trendy is funded by thc Alaska Employment Service and publishec by the Alaska Department of Labor Research and Analysis Section, P.O. Bo: 2550, Juneau, Alaska Telephone: (907) Telefax: ( , Editor's Note: The views presented in gues articles in Alclska Ecortoniic Tremi.7 do no necessarily reflect the views of the Alaska Department of Labor. Walter J. Ifickrl. Governor, State of Alaskn C.W. Maklcn, Cornmissinner, Depnrlmcnl of Labor Cl~uck Caldndl, Chief. Rcsearch and Analysis J. Petmelope Goforth, Editor October 994 Volume 4 Number 0 lssn *. Work-Related Deaths Decline in Population Estimates for Alaska 3 Alaska's Employment Scene Alaska's Economy Still Plugging Away Employment Scene Tables: 4 Nonagricultural Wage and Salary Employment-Alaska & Anchorage 4 Hours and Earnings for Selected Industries 5 Nonagricultural Wage and Salary Employment in Other Economic Regio~ 6 Unemployment Rates by Region and Census Area This publication, released by the Department of Labor's Alaska Employment Service and Research and Analysis Section, was produced at a cost of $.6 per copy. Cover design by Jim Fowler &* ADC ~n Printed and disvibuted by ASETS: a wcational training, 7 center and employment program.
3 Decline in 993 by Talitha Lukshin vv ork-related injury deaths in Alaska declined by 38% in 993. According to the Department of Labor, Census of Fatal Occupational Injuries (CFOI), a Bureau of Labor Statistics program conducted with the Alaska Department of Labor, occupational fatalities dropped from ninety-one in 992 to sixty-six in 993,'This census counts occupational fatalities including the self-employed, civilian and military government employees as well as all private sector wage and hour employees. Except for violent acts, every event category (which describes the manner in which the injury was inflicted) showed a drop or stayed the same from 992 to 993. (See Figure.) The most startling change was the dramatic increase of violent acts throughout many industry sectors in 993. Four violent acts were recorded in 992, of which two were homicide shootings. ( See Table.) Of these two, one involved a robbery motive. Surprisingly, that number rose to eleven homicides in 993, over five times higher than the previous year. (See Table 2.) Of these eleven, only three apparently involved a robbery motive. The circumstances of a twelfth death are still unknown, but it appears to be self-inflicted according to investigating troopers. Good weather and an increased emphasis on safety were the two reasons for the decrease cited by Lieutenant Chris Honse of the Fishing Vessel Safety office of the United States Coast Guard (USCG). New safety regulations enforced by the USCG were implemented in Alaska beginning in September of 99. The most significant change has been the requirement of immersion suits for all crews on commercial fishing vessels operating in Alaska. Since September of 992, survival craft have also been required for documented vessels or those vessels over five net tons operating in the state. Comparing lives saved with lives lost data supplied by the USCG safety office, a significant downward trend emerged. In 992, eighty-seven lives were saved, but thirtyfive lives were lost. In 993, sixty-nine lives were saved, and eighteen were lost. However, seventy lives have been saved so far in 994, but only eight have been lost as of 7/8/94. Of the eight fishers that have died so far this year, only one has been lost after sinking and three have been lost overboard. Violent Acts Increase Dramatically from 992 to 993 Talitha Lukshin is a statistical technician in the Occupational Safety and Health Survey Unit of the Research & Analysis Section of the Alaska Department of Labor. She is located in Juneau. 'An occupational fatality is counted in the CFOI program if the incident occurs on or off the employer's premises and the person was there to work or if the event or exposure was related to work. Commercial fishing fatalities continue to decline The largest decline occurred in the commercial fishing industry where thirty-five fatalities occurred in 992, dropping to twentythree in 993. Of the fishers that died in 992, seven fell from vessels, and twenty-six were lost on vessels that capsized or sank. These two event categories accounted for 94% of the thirty-five fatalities. In 993, however, these events accounted for 78% of the fishing fatalities; five fell from vessels and thirteen perished after boats capsized or sank. Water Vehicle Struck By Motor Vehicle Falls Landslides Caught In Equipment Other - I Fatality Counts Source: 992 and 993 CFOI Program. Alaska Department of Labor, Research & Analysis Section. Alaska Economic Trends October 994
4 Census of Fatal Occupational Injuries, Alaska 992 Event Grouping ' Cause Total Cases Occupation SIC Industry Water Vehicle Fall from Vessel Sinking Deckhands Deckhands Commercial Fishing Transportation, Water Commercial Fishing Transportation, Water Aircraft Pilots Pilot Loggers Manager Guide Geologists Biologist Military Transportation, Air Logging Logging Logging, Recreational Services Minerals Services Environmental Quality Armed Forces Struck By Crab Pot Log Root Wad Choker Roof Truss Pulley Truck Driver Logger Logger Clergy* 2/ Secretary* Logging Religious Organizations Holding Offices Motor Vehicle Snowmachine accident Pedestrian Struck By Pedestrian Struck By Fell fromstruck By Broke through ice Bus Truck Dozer Caretaker* Bus Driver Mechanic Dozer Opr Hotel, Camp Transportation, School Bus Heavy Construction, Hwy. Heavy Construction, exp. Hwy Violent Act NR 3 Self Inflicted Shooting Shooting NR Guide* Guard Police NR NR Hotel, Camp Business Services Police Protection Falls From Roof Into Crevasse Police Guide Police Protection Recreation Services Landslides Caught in 2 Loggers Operator Logging Lead & Zinc Ores Operating Equipment Truck Driver 6 Heavy Construction, Hwy. Other Drowning Drowning NR Confined Space Overdose Choked, gastric contents Unknown NR Guide Processor NR Processor Diver Manufacturing, Seafood Commercial Fishing Recreational Services Manufacturing, Seafood Manufacturing, Seafood Manufacturing, Seafood Armed Forces Note: Occupational injury related death must occur during the reference year and in the reference state, or reference state issues a death certificate. An incident or exposure resulting in death must have occurred while a person is in a work status. A work relationship exists if an event or exposure results in fatal injury to a person: on the employer's premises and the person was there to work; or OM the employe& premises and the person was there to work, or the event or exposure was related to the person's work or status as an employee. /Event is coded using the Occupational Injury and Illness Classification Structure (OIICS) 2/ The National Institute of Occupational Salety & Health also maintains an occupational fatalities database for Alaska. The counts differedin that the four occupational cases marked with ' were not counted as part of the 87 reported by NlOSH for 992. CFOl did not capture one case involving a miner killed while returning to his claim. 3 NR; cannot be released. Any data obtained from other than public inlomation sources such as newspapers, OSHA, US Coast Guardand Workers' Compensation reports cannot be released. Source: 992 and 993 CFOl Program, Alaska Department ollabor, Research & Analysis Section. 2 Alaska Economic Trends October 994
5 T a b I e e 2 Census of Fatal Occupational Injuries, Alaska 993 Total Cases rent Grouping Cause Occupation SIC Water Vehicle Fall from Vessel 5 Sinking 3 Hit by Wave Manager Hatchery Tech. Deckhand Industry Commercial Fishing Fish Hatcheries Fish Hatcheries Commercial Fishing Transportation, Water Aircraft Pilots Pilots Managers Guides Guide Military Transportation, Air Logging Business Associations Recreational Services Hotel, Camps Commercial Fishing Armed Forces Struck By Crab Pot Concrete Slab Tree Contractor Logger Commercial Fishing Construction, General Building Logging Motor Vehicle Pedestrian Struck By Pedestrian Struck By Fell from Head-on collision Hwy. Truck Forklift Forklift Bus Logger Logger Bus Driver Logging Logging Commercial Fishing Transportation, Interurban Violent Act Shooting Stabbing Bombing Pilot Sec. Guard Health Aide Painter Night Manager Taxi Drivers Forester Miner Processors Military Transportation, Air Business Services Health Services Construction, Painting Grocery Stores Transportation, Local Environmental Quality Metal Mining Manufacturing, Food Armed Forces Falls From Ladder From Equip. Carpenter NR 2/ Educational Services Manufacturing, Pulp Mill Landslides Logger 24 Logging Explosion Gas Fumes Welder 09 Commercial Fishing Note: Occupational inpry related death must occur during the reference year and in the reference slate, or reference state issues a death certificate. An incident or exposure resulting in death must have occurred while a person 6 in a work status. A work relationship exists ilan event or exposure results in fatal injury to a person: on the employer's premises and the person was there to work; or ofl the employer's premises and the person was there to work, or the event or exposure was related to the person's work or status as an employee. I/ Event is coded using the Occupational Injury and Illness Classification Structure (OIICS). 2 NR; cannot be released. Any data obtained from other than public information sources such as newspapers, OSHA, US Coast Guard and Workers' Compensation reports cannot be released. Source: 992 and 993 CFOl Program, Alaska Department of Labor, Research & Analysis Section Alaska Economic Trends October 994 3
6 Whereas the number of lives lost due to vessel sinking has dramatically declined, the event category of lost overboard has remained high. The water transportation sector also experienced two fatalities because of falls from vessels in 992 as well as one sinking of a tug vessel involving three fatalities. In 993, however, only one fatality involving a crew member struck by a wave was recorded. Aircraft fatalities decline while crashes increase The number of occupational fatalities in- ' National Transportation volving aircraft dropped from twenty-six to Safety Board, Safety twenty-two; however, this decline is deceiv- 4. I994 to the ~ederi ing in that the number of crashes actually Aviation Administration, roie from ten in 992 to sixteen in 993. Military related fatalities due to aircraft crashes fell from eight to three, but the actual number of crashes rose from one to two. ~ecommendation Letter. Ma,, Flshmg Manufactur~ng. Wood Transportation Manufacturing. Seafood Recreatton Sewlces Construct~on The number of guides killed while flying also rose dramatically from one in 992 to six in 993. Guides piloting aircraft are particularly at risk according to George Cabelnic of the National Transportation Safety Board (NTSB). "In many cases, guides are landing Fatality Counts Decline in Most of the Major Industry Sectors Mlnlng Busmess Sewlces I? Recreallonal Camp Government Fatality Counts Source 992 and 993 CFOl Program, Alaska Department of Labor, Research & Analys~s Section on and taking off from unprepared surfaces," Cabelnic explained. "Also, while spotting game from an airplane, they can become distracted from flying." Guides piloting passengers to lodges accessible only by plane have also come under NTSB scrutiny. Over approximately a two-year period, the NTSB investigated twenty-nine crashes involving both guide services and lodge operations, which resulted in fourteen fatalities. Presently, entry into pilot guide or aero lodge operations is not restricted. All that is required of a certificated private pilot is an aircraft and a willing client, according to safety recommendations submitted by an NTSB report to the Federal AviationAdministration (FAA). 2Despite this lack of restriction, interviews with survivors and next-ofkin revealed a perception that the safety of the operations would be comparable to that of commercial aviation. The report highlighted the operational variables ofhigh altitudes withvast weather and terrain extremes in areas with marginal or nonexistent weather reporting that are commonplace for these operations. The findings of the report were that the relationship between the level of pilot training, qualifications and experience and the number of accidents warranted an increased level of requirement standards. Little change in air transportation losses Seven pilots were lost in the air transportation sector in both 992 and 993. However in 993, one of the seven was a homicide related death. As a proportion of the whole, aircraft crash fatalities among pilots in the air transportation sector accounted for about 8% in 992, increasing to % in 993. In addition, employees in other industry sectors and various occupations were also lost as passengers. In 992, two geologists employed in mineral services were killed in crashes as was a biologist working for the state. Also, managers operating airplanes to transport themselves in a work status are at risk. Managers were lost in both 992 and 993 in this type of occupational fatality event. 4 Alaska Economic Trends October 994
7 Transportation fatalities fluctuated across sectors Logging occupation fatalities fall in 993 Dropping from five to one, the chgnge in water transportation offset an increase in the interurban highway portion of this sector, which showed a decline overall. The highway transportation fatality increase was due to the shooting deaths of two cab drivers. Only one highway fatality was determined to be occupationally related in both of the census years. As mentioned earlier, air transportation related fatalities remained the same from 992 to 993. Helicopter logging crashes increase, then drop The logging industry dropped to third place in counts of fatal injuries in 993. (See Figure 2.) Aircraft crashes accounted for seven ofthe twelve deaths or 58% in 992 and three of the seven, or 43% in 993. Nine of these ten crashes were related to helicopter logging crashes that occurred between February 992 and May 993. The high number of fatalities related to helicopter logging triggered an investigation by the Alaska Federal-State Interagency Collaborative Working Group on the Prevention of Occupational Traumatic njuries.weeting in July of 993, the work group issued six recommendations. And by July of this year, a Centers for Disease Control & Prevention, Morbidity and Mortality Weekly Report4 (MMWR), was released by members of that group. Presenting startling calculations, the MMWR reported the fatality rate for long-line helicopter pilots (estimated to be fifty in the state) rose to approximately five thousand deaths per 00,000 pilots. (This is after adjusting to an annual average.) The NTSB probable cause findings were also presented in that report as, "... improper operational and/or maintenance practices." The MMWR concluded that these findings "reflected a lack of inspections of long-line helicopter logging operations." Since this intense interagency investigative effort, no additional crashes have been reported as of mid-july, 994. Logging occupations dropped below pilots and guides in 993 and recorded the same number of fatalities as the manager occupational category. (See Figure 3.) Of the two helicopter logging crashes that occurred in 993 involving fatalities, no logging crew were lost unlike in 992 when five were lost in the one incident. In other event categories for logging occupations such as choker setters, tree fallers etc., the count remained at four for both years. The number of logging fatalities due to landslides dropped from two to one. In addition, the category struck by (which excludes equipment-related events) dropped from two incidents in 992 to one in 993. Tragically, in 993, two loggers were hit and killed by equipment that was operating around them. Seafood processing fatalities remain low Except for two homicide stabbings, no other occupational fatalities were reported in the seafood processing sector in 993. The two workers were stabbed on their vessel in a homicide related incident and were counted Logging Occupations Pilot and Guide Occupational Fatality Counts Increase in 993 Pilots Deckhands Fatality Counts ' The Alaska Federal-Safety Interagency Collaborative Working Group on the Prevention of Occupational Traumatic Injuries is comprised of representatives from the NTSB, FAA, CDC's National Institute for Occupational Safety and Health, Occupational Safety and Health Administration. United States Coast Guard, United States Forest Service and the Alaska Departments of Health and Social Services and Labor. ' Morbidity and Mortality Weekly Report (MMWR), Centers for Disease Control and Prevention, Vol. 43No 26, July 8, 994. Source: 992 and 993 CFOt Program, Alaska Department of Labor, Research & Analysis Section Alaska Economic Trends October Guides Land Vehicle 0p.lDrivers Seafood Processors ManagerslAdrninistralion Guards, exc. public Miners Carpenters & Painters I I


8 as part of the census. This sector generally excludes harvesting and is classified as manufacturing, miscellaneous food preparation category 209 of the standard industrial classification (SIC) manual. The CFOI count tends to be high for this Alaska industry since an employee who is there in a workrelated status and who dies on or off the employer's premises will be counted in this census. Many seafood processors house employees onboard or at their work sites. In 992, two ofthe four fatalities involved an overdose and a choking on gastric contents. Two other fatalities in the seafood processing sector occurred in 992 and happened on barge processing operations. One involved an individual who fell while boarding. Hand rails were not in place on the gangplank and the winds were gusting to 50 knots causing chill factors of 33 below zero. The other involved a confined space incident investigated by the USCG where the operator of an ice barge entered a ballast tank and died due to oxygen depletion. The oxygen level was reported in a newspaper account to be 4% percent below the minimum needed to support life. Occupational Deaths Higher in Coastal Areas in 992 Causes of construction industry deaths vary Although no building construction deaths occurred in 992, three workers in heavy construction (a mechanic, a dozer operator and a truck driver) were killed when they were struck by or caught in the equipment they were working around, according to reports provided by the Occupational Safety and Health Administration (OSHA). In the struck by cases, one involved a worker standing in front of a truck as the driver drove off and the other involved an operator stepping onto the tracks that subsequently moved, causing him to fall in the path of the moving equipment. The third case involved a worker who crawled under a dump truck while it was running and was caught in the drive shaft. No heavy construction industry fatalities were counted in 993, but a self-employed building contractor and a painter were killed on the job that year. The contractor entered a trench to work on a sewer line when a concrete slab collapsed on him and the trench filled with dirt. The painter was shot by a coworker at a remote work site while he was working. State OSH jurisdiction covers about 0% of CFOI fatalities Of the occupational fatalities counted by the census and investigated by the Alaska Department of Labor, Occupational Safety and Health (OSH) unit, a slight drop from eight to seven was noted. Although higher as a percentage in 993, these OSH investigated fatalities remained around 0 percent of all occupational fatalities counted by the census. It should be noted that homicide shooting~ such as those which occurred in 993, are investigated by the Department of Public Safety. Occupational fatalities concentrated in coastal areas Source: 992 and 993 CFOI Program, Alaska Department of Labor, Research & Analysis Section. Fishing-related deaths affected all but a few of the coastal areas, stretching from Ketchikan to Nome. ( See Figures 4 & 5.) All of the fatalities along the Aleutian Chain and the Bristol Bay census areas occurred on the 6 Alaska Economic Trends October 994


9 water and in the fishing and seafood processing sectors in 992. Seven falls from vessels occurred in these areas for that year; the other two in that event category happened in Southeast Alaska. Due to a 'combination of the logging, fishing and aircraft related fatalities, Southeast had the highest number of occupational fatalities in 992. However, in 993, the Southcentral part of the state darkened due to a combination of violent acts and airplane crashes involving guides. No specific pattern is evident in relation to air craft crashes for either of the census years. In 993, crashes occurred in ten different census areas and nine areas in 992. Alaska differs greatly from the 992 national CFOI In Alaska, aircraft and water vehicle events accounted for slightly over 7 percent of the total occupational fatalities in 992 and 65% of the total for 993. The percentage for the same event categories accounted for roughly 7.6% of the 992 CFOI national data, gathered from all fifty states. The violent act event category accounted for only 4% of the total 992 occupational fatalities in Alaska, but the CFOI national data showed 20% in this category. However, in 993, this event category in Alaska rose significantly to 8%. Based on a percentage comparison, Alaska fatalities were below the nation in all other event groups in 992. National data for 993 was not available in time for this article. The number of self-employed killed on the job rose in 993, from ten deaths or % of the total census in 992 to fifteen deaths, or 23%, the following year. This is much higher than their general representation in the work force and despite the downward fatality trend in other employment status groups., pilots and guides were the self-employed occupations with fatalities in 992. In addition to these, the occupational make-up in 993 also included a contractor, a miner, and a security guard. Since no annual self-employment estimates are available for Alaska, it is impossible to calculate reliable fatality rates for this group. Experimental occupational fatality rates provide basis of analysis Data from the Occupational Database (ODB) provided the number of individuals employed in an occupation during the third quarter of each of the census years. The ODB consists of employment coded by occupations for all employees contributing to the unemployment tax program of the Department of Labor. The third quarter was chosen since it is the Occupational Deaths Rise in Southcentral Area in 993 Worker characteristics show more men killed on the job In 992,98% and in 993,97% ofthe workers killed on the job were men. This is dramatically higher than their 58% representation in the labor force. (See Table 3.) A percentage comparison of population by age groups with fatal occupational injuries also seems to indicate that workers in the age group 45 to 55 were at a slightly higher risk in both 992 and 993 than their representation in the Alaska population would suggest. Workers in the age group 35 to 44 also appeared to be at a higher risk than their representation in 992 when 33% of those workers were fishers; this equalized again in 993.?* \- A m 0 tea xm Source: 992 and 993 CFOI Program, Alaska Department of Labor, Research & Analysis Section. Alaska Economic Trends October 994 7
10 Worker Characteristics Age Groups Total Employment Status Civilian, exc self employed Self Employed Armed Forces Total Gender of Workers Men Women Total Percentage Comparison of CFOI Cases Worker Characteristics to the 990 Census 990 Census CFOI 992 Number Percent Cases Percent Source: 990 Census of Populalion and Housing compared to the 992 & 993 CFOI Program, Departmenlol Labor, Research & Analysis Section. CFOI 993 Cases Percent Logging occupations have long been a high risk occupation, but with the introduction of helicopter logging, new occupational risks were also introduced. The occupational risk was high in both 992 and 993 for loggers employed by helicopter companies classified as SIC Safety professionals have successfully targeted the risk in helicopter logging and rates are expected to be lower in 994. Logging occupations among the traditional logging companies reporting as SIC 24 had a fatality rate drop from thirty-sev- en to twenty-six per 0,000 workers between the two census years. This is due in part to an occupahighest quarter of employment for Alaska. tional employment increase and one less fa- Isolating one quarter allows a closer approx- tality. imation to the actual number of occupational positions. The fatality counts of CFOI Pilots in the air transportation sector experiwere then adjusted for only in-state report- enced a higher fatality rate per 0,000 pilots ing employers and their respective SIC clas- in 993 than in 992. The rate increased due sification so that a comparison could be made. to helicopter logging crashes. Aircraft inci- (See Table 4.) dents also placed guides at a higher occupational fatality risk in both 992 and 993. This data must be used with caution since a Using the rate analysis for comparison, the single incident can cause an occupational occupational risk for guides was slightly highrate to multiply many times. For example, er than for traditional loggers in 993 as was supervisor, marine operations, was zero per also indicated in the occupational fatality 0,000 in 992 but rose to 833 per 0,000 in count ranking in Figure after one incident. This is due to the low number of workers in this specialized Workers in occupations on or near the ocean field. The other limitation is the time series or in the air are at significant risk. Given the is only two years, far too short for trend low level of employment in some of these analysis. However, by benchmarking the sectors, the rates will tend to be high from a fatality counts to an occupational employ- single incident. This occupational risk is real ment number, associated occupational risks and validates precautions presented by the can be identified. various agencies involved in making safety recommendations. 8 Alaska Economic Trends October 994
11 Nores: ~arcurarrng rararrry rares oy occupanons wrmm an ~nousrrycrassrrrcar~on s an expenmenrar mernoo ro evaruare raraiiry oara. ns rare was carcurareo as (N/WJ x IU,UUU, where N is equal lo the number of occupational falal injuries, adjusted to maintain consistency with W, which s the number of Alaskan employees, obtained from the DOL, Research and Analysis, Occupational Data base, except where marked with a '. This data base consists of occupational classifications for all individual workers reported in the industry ciassihcation of the employer reporting lo the Departmenl of Labor, Unemployment Tax Insurance Program (DOL, UI Program) during the third quaflerof the census year. This result is then multiplied by 0,000 for companson and analysis. The third quarter has the highesl level of employmenl for the slate so it is used lo minimize double counting individuals in those positions that experienced turnover. This database does not include the self employed. Transportation, Water, SIC 44 employment is not available for companies reporting to other states so the CFOl data includes only those fatalities that occurred at companies that report to Alaska. Occupational employment data forpolicemen in the State of Alaska was obtained from the Departmenl of Public Safely, Alaska Police Standards Council, Annual Departmenlal Questionnaire, 992 and 993. The count includes both Alaska Slate Troopers and the municipality employmenl. The SIC coding of this table is in accordance with how the individual companies report to the DOL, UI program. SIC coding of the CFOl cases as presented in Table and Table 2, represents the Industry operation in which the fatality occurred. This table, however, reflects the industryin which the employer reported so that the occupational employment can be compared. Source: 992 and 993 CFOI Program. Alaska Department of Labor, Research & Analysis Section. Conclusion Good data makes good policy and timely policy can save lives. The swift action of the State-Federal Interagency Work Group to address the sudden increase in helicopter logging crashes has no doubt saved lives. Thelobbying efforts to change USCG regulations regarding the commercial fishing industry began in the late 980s. In 993 and now in 994, the effects of those efforts are apparent. However, government involvement can influence occupational safety only so much. Random homicide shootings, as counted in the CFOI 993 data, indicate that violent acts in the workplace without motive will be difficult, if not impossible, to address. It has been said that "what we are to be, we are becoming." Even in Alaska, there is little doubt that our society is becoming more violent. Alaska Economic Trends October 994 9


12 993 Population Estimates 4 ~ Alaska r by Greg Williams Greg Williams is the state demographer with the Research & Analysis Section, Administrative Services Division, Alaska Department of Labor. He is located in Juneau. T he Alaska Department of Labor recently released estimates for places, boroughs and census areas for 993. Almost all areas of the state grew in population between 990 and 993. These estimates will be published in the next edition of Alaska Population Overview. Table shows the populations, rates of change, natural increase and migration trends. Almost all of Alaska's twenty-seven census areas have gained population since the 990 census. Between 990 and 993 the greatest overall growth occurred in Anchorage (2,958), Matanuska-Susitna Borough (6,253), Fairbanks North Star Borough (4,708), Kenai Peninsula Borough (3,609) and Juneau Borough (2,07). Only the new Yakutat Borough (-4) lost population over the period. The fastest average annual rates of growth occurred in Haines Borough (4.97%), Matanuska-Susitna Borough (4.49%), Kodiak Island Borough (3.70%), North Slope Borough (3.70%), Wade Hampton Census Area (3.5%), and Bristol Bay Borough (3.42%). While Anchorage accounted for 4.4% of the state's population in 993, it accounted for 44.7% of the population growth since 990. In the years , Alaska gained 49,57 persons. Migration accounted for 37.5% (8,426) of the growth; natural increase 62.5%. In general, in the Northern, Interior and Southwestern regions of the state growth was almost completely through natural increase (births minus deaths). The areas that gained the most through migration were Anchorage Borough (8,727), Matanuska-Susitna Borough (4,505, Kenai Peninsula Borough (,73, Kodiak Island Borough (886, Juneau Borough (808), and Ketchikan Gate- way Borough (509). The areas that lost population through migration were Yukon- Koyukuk Census Area (-203, Nome Census Area (-6), Bethel Census Area (-79), Aleutians West Census Area (-67), Yakutat Borough (-35) and Northwest Arctic Borough (- 29). In general, people moved out of the more rural areas of the state. The Anchorage Matanuska-Susitna, Gulf Coast and Southeast Regions show the strongest gains through migration. Military cutbacks have slowed the growth of Fairbanks North Star Borough and Aleutians West Census Area (Adak). Table 2 shows populations and rank ofalaska cities over,000 population. Alaska had twenty-six cities with over,000 persons in 993. Over half (58%) of these cities are in the 3-4,000 range. None lost population between 990 and 993. The greatest numerical growth since 990 occurred in Anchorage (2,958), Fairbanks (2,438, Juneau (2,07), Unalaska (,228), and Kodiak (,063). The highest average annual rates of growth were found in Unalaska (0.2%), Cordova (6.37% mostly through a large annexation), Haines (6.3%), Craig (5.59%), Kodiak (4.74%), Barrow (4.27%) and Sand Point (4.06%). In addition, there are another fifteen unincorporated communities with populations over,000: College (2,429, Sterling (4,550, Adak Station (4,07, Eielson AFB (3,787), Nikiski (2,954), Meadow Lakes (2,948), Butte (2,54), Kodiak Station (2,06), BigLake(,738), Fritz Creek(l,6), Metlakatla (,527), Fort Greely (,34), Tok (,088), Salamatof(l,Ol9), and Anchor Point (,06). Almost 75% of the population of Alaska lived in communities of over,000 persons in Alaska Economic Trends October 994
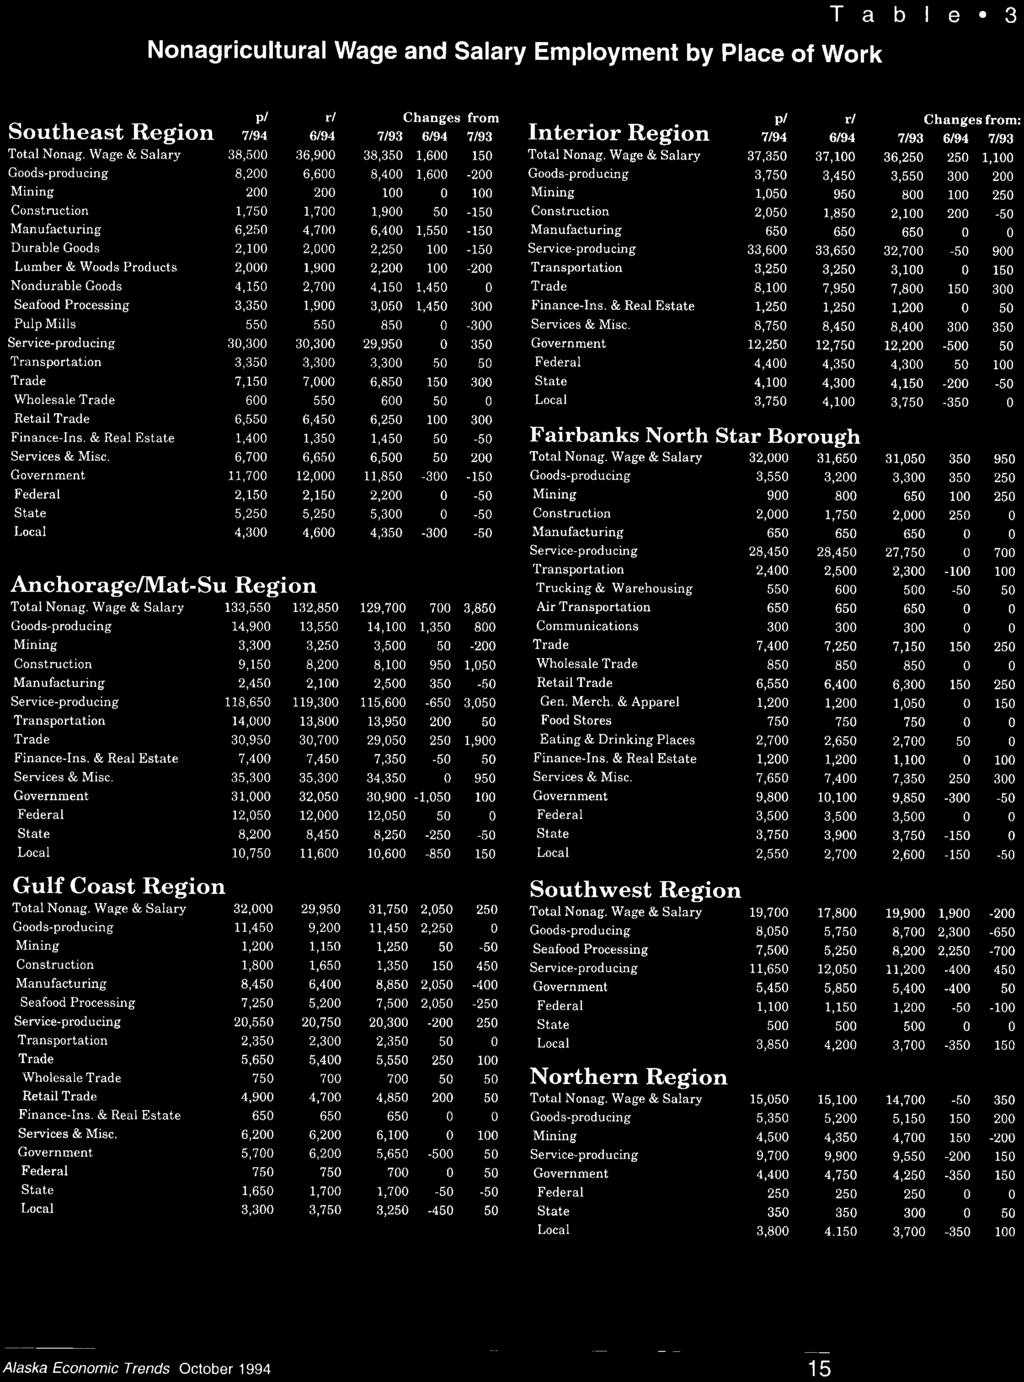
13 Population for Boroughs and Census Areas by Labor Market Regions Labor Market Area Average July Annual 993 Rate of Natural Net Population Change Change Increase Migration Estimate Census Count April 990 STATEOFALASKA 599,200 49, ,73 8,426 AnchorageIMatanuska-Susitna Region 294,232 28, ,979 3,232 Anchorage Borough 248,296 2, ,23 8,727 Matanuska-Susitna Borough 45,936 6, ,748 4,505 Gulf Coast Region 70,07 6, ,064 2,944 Kenai Peninsula Borough 44,4 3, ,878,73 Kodiak Island Borough 5,02, Valdez-Cordova Census Area 0, Interior Region 97,370 5, , Denali Borough, Fairbanks North Star Borough 82,428 4, ,707 Southeast Fairbanks Census Area 6, Yukon-Koyukuk Census Area 6, Northern Region 22,37, ,65 06 Nome Census Area 8, North Slope Borough 6, Northwest Arctic Borough 6, Southeast Region 74,8 Haines Borough 2,489 Juneau Borough 28,822 Ketchikan Gateway Borough 4,923 Prince Of Wales-Outer Ketchikan C.A. 6,923 Sitka Borough 9,052 Skagway-Hoonah-Angoon Census Area 3,83 Wrangell-Petersburg Census Area 7,468 Yakutat Borough 69 Southwest Region Aleutians East Borough Aleutians West Census Area Bethel Census Area Bristol Bay Borough Dillingham Census Area Lake & Peninsula Borough Wade Hampton Census Area Source: Alaska Depaflment of Labor, Research & Analysis Section, Demographics Unit. Alaska Economic Trends October 994
14 Alaska Cities by Size City July April 993 City 990 Population Rank Census Estimate 993 Population City Rank 990 Change Average ~nnuk Percent Growth Anchorage cityhorough Fairbanks city Juneau cityhorough Sitka cityhorough Ketchikan city Kodiak city Kenai city Bethel city Wasilla city Valdez city Unalaska city Barrow city Homer city Soldotna city Nome city Petersburg city Palmer city Kotzebue city Seward city Wrangell city Cordova city Dillingham city Haines city Craig city North Pole city Sand Point city ,958 2,438 2, , , Source: Alaska Department of Labor, Research & Analysis Section, Demographics Unit. 2 Alaska Economic Trends October 994
alaska's economy moved forword in spite of recent bad economic news. In fact the trends thus far this year are similar to the 993 experience.")

 Employment boosts from the state's seasonal industries are the main reason for these declines.")

15 Alaska's Economv Still PIucnaima Away US-?- - by Neal Fried '. here were 4,800 more jobs this July than there were a year ago. (See Table l.)alaska's economy moved forword in spite of recent bad economic news. In fact the trends thus far this year are similar to the 993 experience. It was a decent summer Construction, retail trade, tourism and the service industry continue to move ahead at a rapid clip (see September's Alaska Economic Trends). The transportation and the finance industries are moving forward-albeit in second gear. The public sector and nonoil mining industry are stuck in neutral. And employment in the fish processing, oil and timber industries is still travelling in reverse. Unemployment rates around the state continued their summer trend of declines, falling from 7.5% in June to 6.7% in July. (See Table 4.) Employment boosts from the state's seasonal industries are the main reason for these declines. Nearly all of the regions in the state experienced declining joblessness. The coastal regions of the state, dominated by fishing activity, had the lowest unemployment rates. Kodiak enjoyed the highest monthly improvement, where the unemployment rate fell from 9.4% in June to 4.% in July. Kodiak's considerable salmon harvest was responsible for most of this improvement. are making greater use of contract workers many of whom are employees of temp help/ contract work agencies and are counted in business services. Not all contract workers are counted in business services. Some are self-employed. Others are counted in such sectors as engineering and management services, security, etc. Engineering and management services also boosted the service industry's employment. A healthy construction season and the Alyeska pipeline rehabilitation project kept their numbers above year-ago levels. Public sector employment in neutral Total public sector employment in Alaska came in below year-ago levels in July. Employment in both the federal and state government dropped, with local government's job count up only marginally. During the year the federal government's job numbers Neal Fried is a labor economist with the Research & Analysis Section, Administrative Services Division, Alaska Department of Labor. He is located in Anchorage. Strong Growth in Business Services Contract work boosts employment The service industry's job count is,500 ahead of year-ago levels. The big mover in the service industry is business services, especially the rise in temporary and contract help services. (See Figure ). For example, Manpower Inc., the nation's largest temporary employment service, moved into the Anchorage and Fairbanks markets in January. Growth in the contract work arena is also expanding. Some oil industry employers ' Seven month average. Source: Alaska Department of Labor, Research & Analysis Section Alaska Economic Trends October 994 3


16 Nonagricultural Wage and Salary Employment by Place of Work Alaska Total Nonag. Wage & Salary Goods-producing Minimg Construction Manufacturing Durable Goods Lumber &Wood Products Nondurable Goods Seafood Processing Pulp Mills Service-producing Transportation Trucking & Warehousing Water Transportation Air Transportation Communications Trade Wholesale Trade Retail Trade Gen. Merch. & Apparel Food Stores Eating &Drinking Places Finance-Ins. &Real Estate Services & Misc. Hotels & Lodging Places Health Services Government, Federal State Local Municipality of Anchorage p! rl Changes from PI rl Changes from 7/94 6/94 7/93 6/94 7/93 7/94 6/94 7/93 6/94 7/93 Total Nonag. Wage & Salary Goods-producing Mining Construction Manufacturing Serviceproducing Transportation Air Transportation Communications Trade Wholesale Trade Retail Trade Gen. Merch. & Apparel Food Stores Eating & Drinking Places Finance-Ins. & Real Estate Services & Misc. Hotels & Lodging Places Health Services Government Federal State Local Alaska Hours and Earnings for Selected Industries Average Weekly Earnings Average Weekly Hours Average Hourly Earnings PI - PI r/ PI r/ Mining...Mining... $,20.82 $, $, Construction...,79.22,57.36, Manufacturing Seafood Processing Trans., Cornrn. & Utilities Trade Wholesale Retail Finance-Ins. & R.E Noles to Tables -3: Tables &2- Prepared in cooperation with the U.S. Department of Labor, Bureau of Labor Statistics. Table 3- Prepared in part with funding from the Alaska Slate Employmenl Security Division. Governmenl includes employees of public school systems and the University of Alaska. Average hours and earnings estimates are based on data for fullandpart-time production workers (manufacturing) and nonsupewisory workers (nonmanufacturing). Averages are for gross earnings and hours paid, including overtime pay and hours. p/denotes preliminary estimates. Benchmark: March 993 ddenoles revised eslimales 4 Alaska Economic Trends October 994


17


18 have gradually drifted downward. These declines are in both the civilian military and nonmilitary sectors. Small base closures and base reductions around the state took their toll. Part of the reason for the weak showing in state government this year was a slower fire fighting season. If fire fighter employment is extracted, state government employment in July would be even with last year's levels. The broad expansion of Alaska's public sector over the past three decades now appears to be an article of the past. Declining oil revenues and a strong effort at the federal level to downsize ensure this continuing trend. Salmon harvest strong, employment down Alaska's salmon harvest this year is above average and prices for most of the species have crept upward-good news for salmon fishers. These healthy catch levels are not reflected in higher fish processing employment, however. One reason is that last year in July some processors in Southwest Alaska processed more bottomfish; but because of shorter seasons this year, they have fewer workers. Also some processors did not hire as many workers this year in anticipation of a decreased catch; their smaller crews worked longer hours. According to hours and earnings data, the average number of weekly hours worked in seafood processing grew from 5.2 hours in July of last year to 62.9 hours this year. (See Table 2.) Low cost of living increase The Bureau oflabor Statistics reported that Anchorage's cost of living index registered its smallest semiannual increase since 986. For the first time since 989 it dropped below the nation's rate. The semiannual (January-June) consumer price index for all urban consumers (CPI-U) rose 2.% over the same period last year. The small hike in Anchorage's index reflects moderate economic growth, intense retail competition, and small increases in housing costs. Housing, responsible for about 40 percent of the index's weight, climbed by.8% in Anchorage. Level or small changes in the vacancy rates, economic uncertainty, declines in utility costs, and other factors keep Anchorage's housing costs in check. A testament to the competitive retail environment is evident in T a b l e 0 4 Unemployment Rates by Region & Census Area Percent Unemployed Alaska Statewide AnchoragelMat-Su Region Muni cipality of Anchorage Mats u Borough Gulf ( Coast Region Kenai Peninsula Borough Kodiak Island E Valdez-Cordova Interior Regio Denali Borough Fairbanks North Star Borough Southeast Fairbanks Yukon-Koyukuk Northern Region Nome North Slope Borough Northwest Arctic Borough Southeast Region Haines Borough Juneau Borough Ketchikan Gateway Bor. Pr. of Wales-Outer Ketch Sitka Borough Skagway-Yakutat-Angoon Wrangell-Petersburg Southwest Region Aleutians East Borough Aleutians West Bethel Bristol Bay Borough Dillingham Lake & Peninsula Borough Wade Hampton Seasonally Adjusted Rates Alaska Statewide United States p/ denotes preliminary estimates r/ denotes revised estimates Benchmark: March 993 Comparisons between different tme periods are not as meaningful as other time series published by the Alaska Department of Labor. The official definition of unemployment currently in place excludes anyone who has made no attempt to find work in the four-week period up to and including the week that ~ncludes the 2th of each month. Most Alaska economists believe that Alaska's rural localities have proportionately more of these discouraged workers. Source: Alaska Department of Labor, Research & Analysis Section. food and clothing prices. Food prices actually fell by 0.03% in Anchorage and apparel prices fell by 2.7%. Medical costs did climb faster than overall price-increasing by 3.9%. However, this represents the second smallest increase since Alaska Economic Trends October 994


19 Alaska Employment Service Anchorage: Phone Kotzebue: Phone Bethel: Phone Nome: Phone Dillingham: Phone Tok: Phone Eagle River: Phone Valdez: Phone Mat-Su: Phone Kenai: Phone Fairbanks: Phone Homer: Phone Kodiak: Phone Seward: Phone Juneau: Phone Petersburg: Phone Sitka: Phone Ketchikan: Phone /82/83 Glennallen: Phone Alaska Economic Regions he mission of the Alaska Employment Service is to promote employment and economic stability by responding to the needs of employers and job seekers.
Chapter 5. The Remote Rural Economy
 Chapter 5. The Remote Rural Economy Nearly 150 small, mostly Native villages are scattered across the remote expanses of northern, interior, western, and southwestern Alaska. This remote part of the state
Kenai Peninsula : The Borough Awakens
 Kenai Peninsula : The Borough Awakens or does it hit the snooze button for another 5 minutes? Brought to you by: Alyssa Rodrigues Economist KPB Growth Continues to outpace State Percent job growth 16.5%
Brynn Keith Director, Administrative Services. Sara Whitney Editor and Graphics Artist. QCEW: A reliable employment series to follow
 April 2012 Volume 32 Number 4 ISSN 0160-3345 To contact us for more information, a free subscription, mailing list changes, or back copies, e-mail trends@alaska.gov or call (907) 465-4500. Brynn Keith
Frank H. Murkowski, Governor of Alaska Greg O Claray, Commissioner
 March 2006 Volume 26 Number 3 ISSN 0160-3345 To contact us for more information, a free subscription, mailing list changes or back copies, email us at trends@labor.state.ak.us or call (907) 465-4500. Alaska
Current Native Employment and Employment Trends
 SUMMARY: EXPANDING JOB OPPORTUNITIES FOR ALASKA NATIVES Alaska s Native people need more jobs. In 1994, the Alaska Natives Commission reported that acute and chronic unemployment throughout Alaska s Native
BYLAWS ALASKA MUNICIPAL LEAGUE ARTICLE I. Associate and Affiliate Membership
 BYLAWS ALASKA MUNICIPAL LEAGUE Adopted: November 12, 1991 Amended: August 3, 1994 Amended: November 20, 2005 Amended: August 12, 2009 ARTICLE I Associate and Affiliate Membership Any unincorporated community,
An Overview of the Alaska Board of Fisheries Process
 An Overview of the Alaska Board of Fisheries Process for House Fisheries, February 1, 2018 John Jensen, Chair Alaska Board of Fisheries Boards Support Section, Alaska Dept. Fish and Game 907-465-4110 website:
Oil and Gas Industry Employment
 January 2012 Revised Final Report Oil and Gas Industry Employment on Alaska s North Slope PREPARED FOR Senate Finance Committee Alaska State Legislature PREPARED BY Oil and Gas Industry Employment on Alaska
Labor Supply Factors and Labor Availability for the Geneva (Fillmore County) Labor Area
 Labor Area") Labor Supply Factors and Labor Availability for the Geneva (Fillmore County) Labor Area June 2015 Prepared by: Kenneth M. Lemke, Ph.D. Economist Nebraska Public Power District 1414 15 th Street - P.O.
Labor Supply Factors and Labor Availability for the Geneva (Fillmore County) Labor Area June 2015 Prepared by: Kenneth M. Lemke, Ph.D. Economist Nebraska Public Power District 1414 15 th Street - P.O.
Building the Next Pipeline 4. Alaska s 2008 Population 13. Employment Scene 20
 May 2009 Volume 29 Number 5 ISSN 060-3345 To contact us for more information, a free subscription, mailing list changes or back copies, email Trends@alaska. gov or call (907) 465-4500. Alaska Economic
Alaska's Native Population:
 Alaska's Native Population: An Updated Profile By Greg Williams Native & Non-Native P opulation Estimates, 1980-87: The proportion of non-natives dropped 2.8% between 1980 & 1987 T his article presents
Juvenile Justice Referrals in Alaska,
 Justice Center University of Alaska Anchorage October 2013, AJSAC 13-10 Juvenile Justice Referrals in Alaska, 2003 2013 Khristy Parker, MPA, Research Professional Brad A. Myrstol, PhD, AJSAC Director This
INSTRUCTIONS: HOW TO ASK THE COURT TO APPOINT A GUARDIAN FOR AN ADULT. Introduction
 INSTRUCTIONS: HOW TO ASK THE COURT TO APPOINT A GUARDIAN FOR AN ADULT Introduction Appointing a guardian for a person is a serious matter. It takes away the person s freedom to make many of the important
Legislative Update. House Speaker Bryce Edgmon s. Speaker Edgmon leading the floor session on Wednesday.
 House Speaker Bryce Edgmon s Legislative Update Volume XII, No. 6 February 23rd, 2018 House ADF&G Budget Focuses on Management for More Fishing The budget process during session begins with a host of Finance
POLICIES OF THE ASSOCIATION OF ALASKA SCHOOL BOARDS
 POLICIES OF THE ASSOCIATION OF ALASKA SCHOOL BOARDS ORIGINALLY ADOPTED AUGUST 20, 1983 1111 West 9th Street Juneau, Alaska 99801 ASSOCIATION OF ALASKA SCHOOL BOARDS POLICY MANUAL CONTENTS Chapter 1 Chapter
Post-Secondary Education, Training and Labour September Profile of the New Brunswick Labour Force
 Post-Secondary Education, Training and Labour September 2018 Profile of the New Brunswick Labour Force Contents Population Trends... 2 Key Labour Force Statistics... 5 New Brunswick Overview... 5 Sub-Regional
Labor Supply Factors and Labor Availability for the Fillmore County, Nebraska Labor Area
 Labor Supply Factors and Labor Availability for the Fillmore County, Nebraska Labor Area September 2018 Prepared by: Kenneth M. Lemke, Ph.D. Economist Nebraska Public Power District 1414 15 th Street -
Anchorage At 90: Changing Fast, With More to Come
 At 90: Changing Fast, With More to Come June 2005 UA Research Summary No. 4 By Scott Goldsmith, Lance Howe, and Linda Leask Institute of Social and Economic Research University of Alaska It was in 1915
The U.S. Economy and Alaska Migration
 The U.S. Economy and Alaska Migration By Neal Fried, Economist A historical connection between the two orth to Alaska N Way up north, (North to Alaska.) Way up north, (North to Alaska.) North to Alaska,
ALASKAN OPINIONS ON GLOBAL WARMING
 NASA Tony Weyiouanna, Sr. ALASKAN OPINIONS ON GLOBAL WARMING Larry Hinzman James Higgins Anthony Leiserowitz Principal Investigators 1 : Dr. Anthony Leiserowitz Decision Research & The Center for Research
Occupational Fatalities Involving Hispanic Workers in the Construction Industry
 Open Journal of Safety Science and Technology, 2013, 3, 1-7 http://dx.doi.org/10.4236/ojsst.2013.31001 Published Online March 2013 (http://www.scirp.org/journal/ojsst) Occupational Fatalities Involving
University of Alaska Initiates Crime and Arrest Reporting
 Summer 1992 UNIVERSITY OF ALASKA ANCHORAGE Vol. 9, No. 2 University of Alaska Initiates Crime and Arrest Reporting John E. Angell The first system-wide crime statistics for the University of Alaska were
SUMMARY: ECONOMIC ASSESSMENT OF NATIONAL WILDLIFE REFUGES IN SOUTHWESTERN ALASKA
 SUMMARY: ECONOMIC ASSESSMENT OF NATIONAL WILDLIFE REFUGES IN SOUTHWESTERN ALASKA This report presents an economic assessment of the National Wildlife Refuges in Southwestern Alaska. Those refuges cover
Brynn Keith Director, Administrative Services. Sam Dapcevich Cover Artist. Mali Abrahamson, an Alaska Department of Labor and Workforce
 September 2011 Volume 31 Number 9 ISSN 0160-3345 To contact us for more information, a free subscription, mailing list changes, or back copies, e-mail trends@alaska.gov or call (907) 465-4500. Alaska Economic
During the early 1990s, recession
 Employment Transitions in Oregon s Wood Products Sector During the 1990s Ted L. Helvoigt, Darius M. Adams, and Art L. Ayre ABSTRACT New data indicate that only 51 percent of workers displaced from the
Economic Impacts of the South Denali Implementation Plan
 Economic Impacts of the South Denali Implementation Plan prepared for: National Park Service and Planning and Land Use Department, Matanuska-Susitna Borough prepared by: Steve Colt Nick Szymoniak Institute
Low-Skill Jobs A Shrinking Share of the Rural Economy
 Low-Skill Jobs A Shrinking Share of the Rural Economy 38 Robert Gibbs rgibbs@ers.usda.gov Lorin Kusmin lkusmin@ers.usda.gov John Cromartie jbc@ers.usda.gov A signature feature of the 20th-century U.S.
Jobs, natural resources, and community resilience: A survey of southeast Alaskans about social and environmental change
 University of New Hampshire University of New Hampshire Scholars' Repository The Carsey Institute at the Scholars' Repository Research Institutes, Centers and Programs 9-27-2011 Jobs, natural resources,
Working with the Alaska Board of Fisheries: Guidance for Fishermen
 Working with the Alaska Board of Fisheries: Guidance for Fishermen Table of Contents Introduction 1 The Alaska Board of Fisheries 1 Advisory Committees 2 Alaska s Constitutional Provisions 3 Format of
Business Meeting Agenda & Information
 Alaska Municipal League 67 th Annual Business Meeting Packet Hotel Captain Cook, Anchorage, Alaska Friday, November 17, 2017 9:00 a.m. 11:00 a.m. Business Meeting Agenda & Information Board of Directors
FACTS ABOUT WORKER SAFETY AND HEALTH
 FACTS ABOUT WORKER SAFETY AND HEALTH - 2008 This year marks the 38 th anniversary of the enactment of the Occupational Safety and Health Act. The Act - which guarantees every American worker a safe and
INSTITUTE OF SOCIAL, ECONOMIC AND GOVERNMENT RESEARCH
 INSTITUTE OF SOCIAL, ECONOMIC AND GOVERNMENT RESEARCH UNIVERSITY OF ALASKA, FAIRBANKS, ALASKA 99701 RESEARCH NOTE NO. G l JULY, 1970 ELECTORAL BEHAVIOR OF ALASKA NATIVE VILLAGES Gordon Scott Harrison*
Data and Models for Alaskan Migration
 [THIS FILE INCLUDES SOME EDITS AND CONSOLIDATION - EDDIEH 12042018] Thank you for attending this talk about Alaska migration data and models. I ll first give some background and overview info, about what
An Equity Profile of the Southeast Florida Region. Summary. Foreword
 An Equity Profile of the Southeast Florida Region PolicyLink and PERE An Equity Profile of the Southeast Florida Region Summary Communities of color are driving Southeast Florida s population growth, and
STATE OF ALASKA DEPARTMENT OF LABOR OCCUPATIONAL SAFETY AND HEALTH REVIEW BOARD P.O. BOX JUNEAU, AK 99802
 STATE OF ALASKA DEPARTMENT OF LABOR OCCUPATIONAL SAFETY AND HEALTH REVIEW BOARD P.O. BOX 21149 JUNEAU, AK 99802 STATE OF ALASKA, DEPARTMENT OF LABOR, DIVISION OF LABOR STANDARDS AND SAFETY, OCCUPATIONAL
[Docket No. FWS R7 SM ; FXFR FF07J00000; FBMS
 This document is scheduled to be published in the Federal Register on 03/23/2018 and available online at https://federalregister.gov/d/2018-05848, and on FDsys.gov 3411 15 P; 4333 15 P DEPARTMENT OF AGRICULTURE
LEFT BEHIND: WORKERS AND THEIR FAMILIES IN A CHANGING LOS ANGELES. Revised September 27, A Publication of the California Budget Project
 S P E C I A L R E P O R T LEFT BEHIND: WORKERS AND THEIR FAMILIES IN A CHANGING LOS ANGELES Revised September 27, 2006 A Publication of the Budget Project Acknowledgments Alissa Anderson Garcia prepared
Alaska Federation of Natives 2014 Annual Convention Resolution 14 46
 Alaska Federation of Natives 2014 Annual Convention Resolution 14 46 TITLE: RESOLUTION ENDORSING MARK BEGICH AS CANDIDATE FOR THE OFFICE OF THE UNITED STATES SENATOR FOR ALASKA The Alaska Federation of
Queensland s Labour Market Progress: A 2006 Census of Population and Housing Profile
 Queensland s Labour Market Progress: A 2006 Census of Population and Housing Profile Issue No. 9 People in Queensland Labour Market Research Unit August 2008 Key Points Queensland s Labour Market Progress:
Policy brief ARE WE RECOVERING YET? JOBS AND WAGES IN CALIFORNIA OVER THE PERIOD ARINDRAJIT DUBE, PH.D. Executive Summary AUGUST 31, 2005
 Policy brief ARE WE RECOVERING YET? JOBS AND WAGES IN CALIFORNIA OVER THE 2000-2005 PERIOD ARINDRAJIT DUBE, PH.D. AUGUST 31, 2005 Executive Summary This study uses household survey data and payroll data
Part 1: Focus on Income. Inequality. EMBARGOED until 5/28/14. indicator definitions and Rankings
 Part 1: Focus on Income indicator definitions and Rankings Inequality STATE OF NEW YORK CITY S HOUSING & NEIGHBORHOODS IN 2013 7 Focus on Income Inequality New York City has seen rising levels of income
Population and Dwelling Counts
 Release 1 Population and Dwelling Counts Population Counts Quick Facts In 2016, Conception Bay South had a population of 26,199, representing a percentage change of 5.4% from 2011. This compares to the
COMMENTS ON THE IMPACT OF THE GOOD FRIDAY EARTHQUAKE ON THE ALASKAN ECONOMY
 Northwest Embayment, WaxellRidge,ChugachMountains,Alaska One of several massive landslides seen in September 1964 by the Arctic Institute of North America and American Geographical Society aerial reconnaissance
SUMMARY LABOUR MARKET CONDITIONS !!! !!!!!!!!!!!!!!!!!!!!!!! POPULATION AND LABOUR FORCE. UNRWA PO Box Sheikh Jarrah East Jerusalem
 UNRWA PO Box 19149 Sheikh Jarrah East Jerusalem +97225890400 SUMMARY Contrary to media reports of a flourishing West Bank economy, evidence from the second half of 2010 shows deteriorating labour market
This memo was published originally as Appendix C to the 1996 Report of the Governor s Advisory Task Force on Civil Justice Reform.
 This memo was published originally as Appendix C to the 1996 Report of the Governor s Advisory Task Force on Civil Justice Reform. M E M O R A N D U M TO: FROM: Governor s Task Force on Civil Justice Reform
THE STATE OF THE UNIONS IN 2011: A PROFILE OF UNION MEMBERSHIP IN LOS ANGELES, CALIFORNIA AND THE NATION 1
 THE STATE OF THE UNIONS IN 2011: A PROFILE OF UNION MEMBERSHIP IN LOS ANGELES, CALIFORNIA AND THE NATION 1 Lauren D. Appelbaum UCLA Institute for Research on Labor and Employment 2 Ben Zipperer University
Recent immigrant outcomes employment earnings
 Recent immigrant outcomes - 2005 employment earnings Stan Kustec Li Xue January 2009 Re s e a r c h a n d E v a l u a t i o n Ci4-49/1-2010E-PDF 978-1-100-16664-3 Table of contents Executive summary...
Latino Workers in the Ongoing Recession: 2007 to 2008
 Report December 15, 2008 Latino Workers in the Ongoing Recession: 2007 to 2008 Rakesh Kochhar Associate Director for Research, Pew Hispanic Center The Pew Hispanic Center is a nonpartisan research organization
Juneau Transportation Survey
 Juneau Transportation Survey Funded jointly by: City and Borough of Juneau and First Things First Alaska Foundation March 2018 Juneau Transportation Survey Funded jointly by: City and Borough of Juneau
City of Surrey. Preface. Labour Force Fact Sheet
 City of Labour Force Fact Sheet Preface Statistics Canada conducts its Census of Population every five years with the most recent census having occurred in 2006. The Census provides information on the
Inequality in Labor Market Outcomes: Contrasting the 1980s and Earlier Decades
 Inequality in Labor Market Outcomes: Contrasting the 1980s and Earlier Decades Chinhui Juhn and Kevin M. Murphy* The views expressed in this article are those of the authors and do not necessarily reflect
MINUTES SENATE FINANCE COMMITTEE February 27, :03 AM. Co-Chair Gary Wilken convened the meeting at approximately 9:03 AM.
 MINUTES SENATE FINANCE COMMITTEE February 27, 2003 9:03 AM TAPES SFC-03 # 11, Side A SFC 03 # 11, Side B CALL TO ORDER Co-Chair Gary Wilken convened the meeting at approximately 9:03 AM. PRESENT Senator
Quarterly Labour Market Report. February 2017
 Quarterly Labour Market Report February 2017 MB14052 Feb 2017 Ministry of Business, Innovation and Employment (MBIE) Hikina Whakatutuki - Lifting to make successful MBIE develops and delivers policy, services,
SUMMARY LABOUR MARKET CONDITIONS POPULATION AND LABOUR FORCE. UNRWA PO Box Sheikh Jarrah East Jerusalem
 UNRWA PO Box 19149 Sheikh Jarrah East Jerusalem +97225890400 SUMMARY The Gaza labour market in secondhalf 2010 (H2 2010) showed growth in employment and unemployment relative to H2 2009. Comparing H1 and
Release of 2006 Census results Labour Force, Education, Place of Work and Mode of Transportation
 Backgrounder Release of 2006 Census results Labour Force, Education, Place of Work and Mode of Transportation On March 4, 2008 Statistics Canada released further results from the 2006 census focusing on
Current Native Employment and Employment Trends S-1 Promising Approaches to Increasing Native Hire S-4
 TABLE OF CONTENTS SUMMARY: EXPANDING JOB OPPORTUNITIES FOR ALASKA NATIVES Current Native and Trends S-1 Promising Approaches to Increasing Native Hire S-4 I. NATIVE EMPLOYMENT: THE CURRENT CONTEXT The
33 USC NB: This unofficial compilation of the U.S. Code is current as of Jan. 4, 2012 (see
 TITLE 33 - NAVIGATION AND NAVIGABLE WATERS CHAPTER 40 - OIL POLLUTION SUBCHAPTER II - PRINCE WILLIAM SOUND PROVISIONS 2732. Terminal and tanker oversight and monitoring (a) Short title and findings (1)
Alaska Department of Administration Office of Public Advocacy. Senate Finance Budget Subcommittee Rick Allen, Director OPA February 21, 2012
 Alaska Department of Administration Office of Public Advocacy Senate Finance Budget Subcommittee Rick Allen, Director OPA February 21, 2012 Mission Statement The Office of Public Advocacy (OPA) provides
The Role of the Oil and Gas Industry in Alaska s Economy
 The Role of the Oil and Gas Industry in Alaska s Economy Prepared for: Alaska Oil and Gas Association (AOGA) Prepared by: McDowell Group, Inc. Anchorage Juneau AOGA Educational Seminar December 21, 2014
Occupational Safety in the Marine Cargo Handling Industry. The Fundamental Parts of the Equation and The Current Experience
 Occupational Safety in the Marine Cargo Handling Industry The Fundamental Parts of the Equation and The Current Experience How The Issues Are Presented Visually [Through PowerPoint Slides] Oral Narrative
Immigrant Employment by Field of Study. In Waterloo Region
 Immigrant Employment by Field of Study In Waterloo Region Table of Contents Executive Summary..........................................................1 Waterloo Region - Part 1 Immigrant Educational Attainment
Patrick Adler and Chris Tilly Institute for Research on Labor and Employment, UCLA. Ben Zipperer University of Massachusetts, Amherst
 THE STATE OF THE UNIONS IN 2013 A PROFILE OF UNION MEMBERSHIP IN LOS ANGELES, CALIFORNIA AND THE NATION 1 Patrick Adler and Chris Tilly Institute for Research on Labor and Employment, UCLA Ben Zipperer
Characteristics of Poverty in Minnesota
 Characteristics of Poverty in Minnesota by Dennis A. Ahlburg P overty and rising inequality have often been seen as the necessary price of increased economic efficiency. In this view, a certain amount
STRENGTHENING RURAL CANADA: Fewer & Older: The Coming Population and Demographic Challenges in Rural Newfoundland & Labrador
 STRENGTHENING RURAL CANADA: Fewer & Older: The Coming Population and Demographic Challenges in Rural Newfoundland & Labrador An Executive Summary 1 This paper has been prepared for the Strengthening Rural
Endogenous Employment growth and decline in South East Queensland
 Endogenous Employment growth and decline in South East By Alistair Robson 1 UQ Social Research Centre, Institute of Social Science, University of Abstract: The South East region has been recording strong
[Docket No. FWS R7 SM ; FXFR FF07J00000; Subsistence Management Regulations for Public Lands in Alaska and
 This document is scheduled to be published in the Federal Register on 05/17/2017 and available online at https://federalregister.gov/d/2017-09967, and on FDsys.gov 3410 11 P; 4333 15 P DEPARTMENT OF AGRICULTURE
GROWTH OF LABOR ORGANIZATION IN THE UNITED STATES,
 GROWTH OF LABOR ORGANIZATION IN THE UNITED STATES, 1897-1914 SUMMARY I. Lack of adequate statistics of trade-union membership in the United States; American Federation of Labor reports, 779. New York Department
A COMPARISON OF ARIZONA TO NATIONS OF COMPARABLE SIZE
 A COMPARISON OF ARIZONA TO NATIONS OF COMPARABLE SIZE A Report from the Office of the University Economist July 2009 Dennis Hoffman, Ph.D. Professor of Economics, University Economist, and Director, L.
ECONOMY MICROCLIMATES IN THE PORTLAND-VANCOUVER REGIONAL ECONOMY
 MICROCLIMATES IN THE PORTLAND-VANCOUVER REGIONAL by Sheila Martin, Director of the Institute of Portland Metropolitan Studies, Portland State University 1 Introduction The Regional Labor Market Portland-Vancouver
Labor Force Characteristics by Race and Ethnicity, 2015
 Cornell University ILR School DigitalCommons@ILR Federal Publications Key Workplace Documents 9-2016 Labor Force Characteristics by Race and Ethnicity, 2015 Bureau of Labor Statistics Follow this and additional
Labor markets in the Tenth District are
 Will Tightness in Tenth District Labor Markets Result in Economic Slowdown? By Ricardo C. Gazel and Chad R. Wilkerson Labor markets in the Tenth District are tighter now than at any time in recent memory.
The Maori Population A Profile of the Trends Within Iwi Rohe
 The Maori Population A Profile of the Trends Within Iwi Rohe Report on Tauranga Moana Iwi Rohe Report prepared for Te Puni Kōkiri by Kaipuke Consultants Ltd 9 June 2009 The Maori Population A Profile of
BLS Spotlight on Statistics: Union Membership In The United States
 Cornell University ILR School DigitalCommons@ILR Federal Publications Key Workplace Documents 9-2016 BLS : Union Membership In The United States Megan Dunn Bureau of Labor Statistics James Walker Bureau
THE STATE OF THE UNIONS IN 2009: A PROFILE OF UNION MEMBERSHIP IN LOS ANGELES, CALIFORNIA AND THE NATION 1
 THE STATE OF THE UNIONS IN 2009: A PROFILE OF UNION MEMBERSHIP IN LOS ANGELES, CALIFORNIA AND THE NATION 1 Lauren D. Appelbaum UCLA Institute for Research on Labor and Employment Ben Zipperer University
The Challenge of Local Permit Ownership in Alaska Salmon Fisheries
 The Challenge of Local Permit Ownership in Alaska Salmon Fisheries Gunnar Knapp Professor of Economics Institute of Social and Economic Research University of Alaska Anchorage 3211 Providence Drive Anchorage,
A Profile of CANADiAN WoMeN. NorTHerN CoMMuNiTieS
 A Profile of CANADiAN WoMeN in rural, remote AND NorTHerN CoMMuNiTieS DeMogrAPHiC Profile in 2006, the last census year for which data are currently available, approximately 2.8 million women resided in
Riverside Labor Analysis. November 2018
 November 2018 The City of Labor Market Dynamics and Local Cost of Living Analysis Executive Summary The City of is located in one of the fastest growing parts of California. Over the period 2005-2016,
RIS 3 Sicily SICILY IN PILLS
 RIS 3 Sicily 2014-2020 SICILY IN PILLS FARO, Portugal, July 4th 2013 Sicily is the largest Italian region, with a surface of 8,5% of the whole national territory. It is the fourth most populated region
Demographic Data. Comprehensive Plan
 Comprehensive Plan 2010-2030 4 Demographic Data Population and demographics have changed over the past several decades in the City of Elwood. It is important to incorporate these shifts into the planning
Changing Times, Changing Enrollments: How Recent Demographic Trends are Affecting Enrollments in Portland Public Schools
 Portland State University PDXScholar School District Enrollment Forecast Reports Population Research Center 7-1-2000 Changing Times, Changing Enrollments: How Recent Demographic Trends are Affecting Enrollments
San Francisco Economic Strategy Update: Phase I Findings
 San Francisco Economic Strategy Update: Phase I Findings Ted Egan, Ph.D., Chief Economist Controller's Office of Economic Analysis May 21 th, 2012 1 City and County of San Francisco Introduction Proposition
Immigrants strengthen Colorado s economy, generating $42 billion of activity in 2011
 Immigrants strengthen Colorado s economy, generating $42 billion of activity in 2011 February 14, 2013 By Christopher Stiffler Economist Executive Summary The foreign-born population is a growing presence
FOR IMMEDIATE RELEASE
 ! FOR IMMEDIATE RELEASE May 3, 2018 Contact: Sage Welch 415.453.0430 New studies track low-wage earners fleeing California, even as the number of low-paying jobs increase High-wage earners continue to
Rural Pulse 2016 RURAL PULSE RESEARCH. Rural/Urban Findings June 2016
 Rural Pulse 2016 RURAL PULSE RESEARCH Rural/Urban Findings June 2016 Contents Executive Summary Project Goals and Objectives 9 Methodology 10 Demographics 12 Research Findings 17 Appendix Prepared by Russell
Backgrounder. This report finds that immigrants have been hit somewhat harder by the current recession than have nativeborn
 Backgrounder Center for Immigration Studies May 2009 Trends in Immigrant and Native Employment By Steven A. Camarota and Karen Jensenius This report finds that immigrants have been hit somewhat harder
Re s e a r c h a n d E v a l u a t i o n. L i X u e. A p r i l
 The Labour Market Progression of the LSIC Immigrants A Pe r s p e c t i v e f r o m t h e S e c o n d Wa v e o f t h e L o n g i t u d i n a l S u r v e y o f I m m i g r a n t s t o C a n a d a ( L S
Appendix A: Economic Development and Culture Trends in Toronto Data Analysis
 Appendix A: Economic Development and Culture Trends in Toronto Data Analysis Introduction The proposed lenses presented in the EDC Divisional Strategy Conversation Guide are based in part on a data review.
The Demography of the Territory s
 The Demography of the Territory s Midtowns : Jabiru (Issue No.201401) The Northern Institute, 2013: This material is submitted for peer review. Correct citation is necessary. KEY FINDINGS The West Arnhem
Byram Police Department
 Byram Police Department 2018 Annual Report www.byrampolice.net ~ www.facebook.com/byrampd Offices (601) 372-7747 ~ Non-Emergency Dispatch (601) 372-2327 141 Southpointe Drive, Byram, MS 39272 BYRAM POLICE
How Have Hispanics Fared in the Jobless Recovery?
 How Have Hispanics Fared in the Jobless Recovery? William M. Rodgers III Heldrich Center for Workforce Development Rutgers University and National Poverty Center and Richard B. Freeman Harvard University
SPECIAL RELEASE. EMPLOYMENT SITUATION IN NATIONAL CAPITAL REGION January 2012 Final Results
 Republic of the Philippines NATIONAL STATISTICS OFFICE National Capital Region Number: 2013-07 SPECIAL RELEASE EMPLOYMENT SITUATION IN NATIONAL CAPITAL REGION January 2012 Final Results The Labor Force
Public Attitudes Survey Bulletin
 An Garda Síochána Public Attitudes Survey Bulletin 218 Research conducted by This bulletin presents high level findings from the third quarter of the Public Attitudes Survey conducted between July and
Macro CH 21 sample questions
 Class: Date: Macro CH 21 sample questions Multiple Choice Identify the choice that best completes the statement or answers the question. 1. Which of the following conducts the Current Population Survey?
8AMBER WAVES VOLUME 2 ISSUE 3
 8AMBER WAVES VOLUME 2 ISSUE 3 F E A T U R E William Kandel, USDA/ERS ECONOMIC RESEARCH SERVICE/USDA Rural s Employment and Residential Trends William Kandel wkandel@ers.usda.gov Constance Newman cnewman@ers.usda.gov
REGION III GENERAL BYLAWS Last Revised: January 2017
 REGION III GENERAL BYLAWS Last Revised: January 2017 ARTICLE 1: NAME This organization shall be known as Region III of the Alaska Schools Activities Association, otherwise known as ASAA. ARTICLE II: PURPOSE
The Economic Impact of Oaklawn Hospital on the Marshall Area
 Reports Upjohn Research home page 2010 The Economic Impact of Oaklawn Hospital on the Marshall Area George A. Erickcek W.E. Upjohn Institute, erickcek@upjohn.org Citation Erickcek, George. 2010. "The Economic
REGIONAL. San Joaquin County Population Projection
 Lodi 12 EBERHARDT SCHOOL OF BUSINESS Business Forecasting Center in partnership with San Joaquin Council of Governments 99 26 5 205 Tracy 4 Lathrop Stockton 120 Manteca Ripon Escalon REGIONAL analyst june
Note: To simplify our process Alaska Press Club memberships are no longer associated with contest entries.
 ALASKA PRESS CLUB CONTEST (For journalism published or broadcast in 2018) Early Entry Deadline: Jan. 25, 2019 at 6 p.m. $15 each Late Entry Deadline: Feb. 8, 2019 at 6 p.m. $20 each Note: To simplify our
Characteristics of the underemployed in New Zealand
 Characteristics of the underemployed in New Zealand focuses on the proportion of underemployment for part-time workers. It brings in underemployment rates and levels to provide context. We explore personal,
Public Attitudes Survey Bulletin
 An Garda Síochána Public Attitudes Survey Bulletin 218 Research conducted by This bulletin presents high level findings from the second quarter of the Public Attitudes Survey conducted between April and