Australian Jobs profile for Nov Qtr. 2013
|
|
|
- Briana Potter
- 5 years ago
- Views:
Transcription

1 Australian Jobs profile for Nov Qtr Prepared by Australian Development Strategies Pty Ltd This report has been prepared as an educational and public relations exercise and has not been designed as an advisory tool for business and we take no responsibility for those who use it for these purposes. The sampling errors for smaller Labour Force regions are often large and the raw figures used cannot be easily adjusted for seasonal trends. The statistical significance of the profiles also need to be considered. We repeat, caution is urged in any interpretation of these statistics. We acknowledge and thank the Australian Bureau of Statistics for the provision of original data, Dr Otto Hellwig of MDS for the HES microsimulation modelling and Phil Henry of Business Geographics for the mapping. Copyright Australian Development Strategies
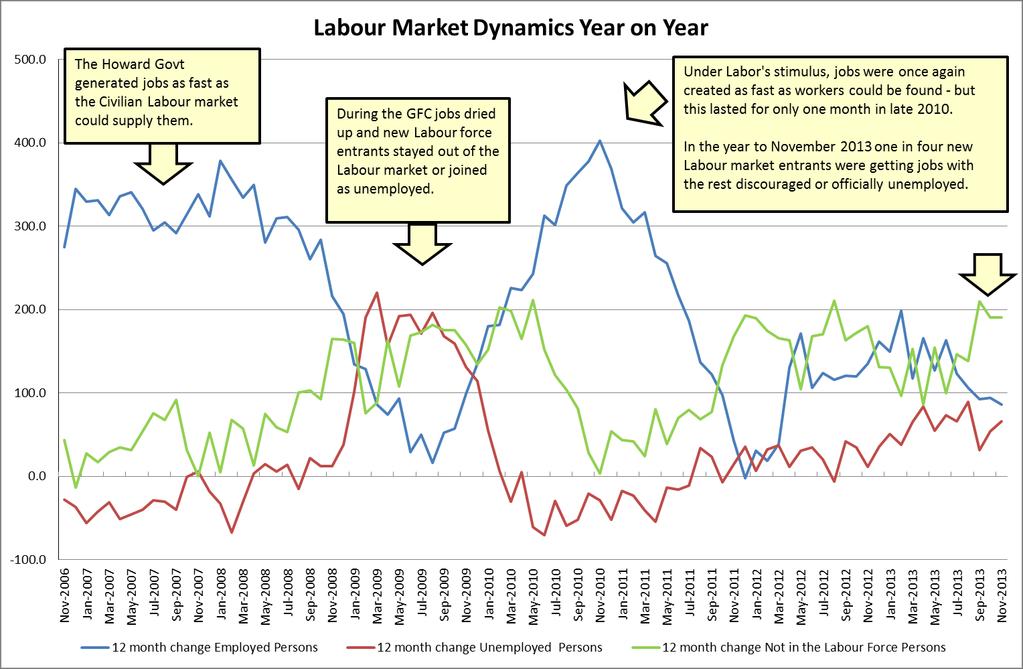
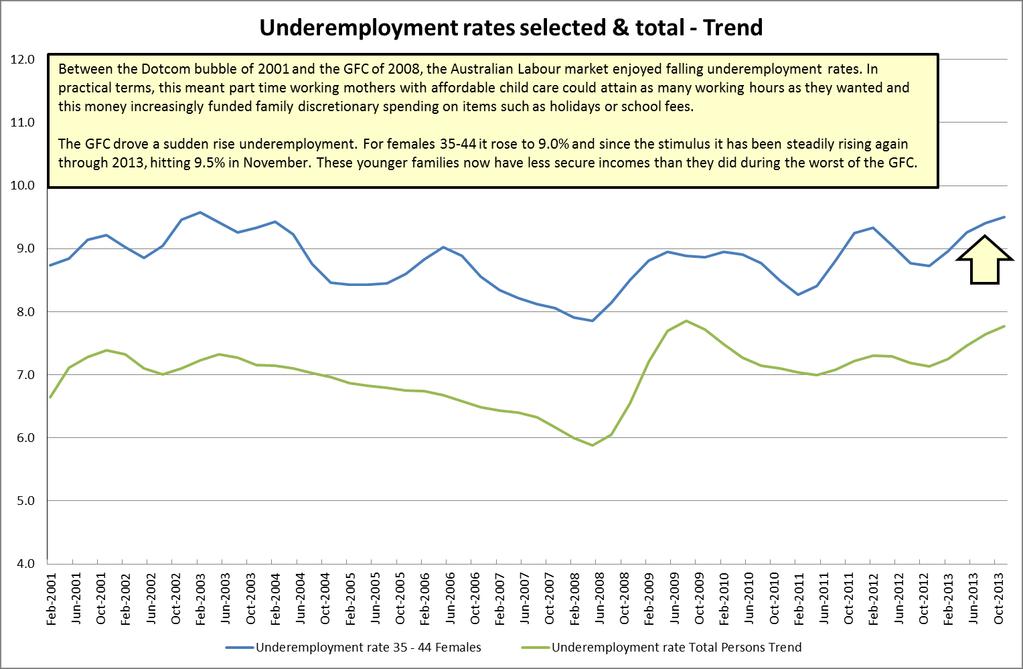
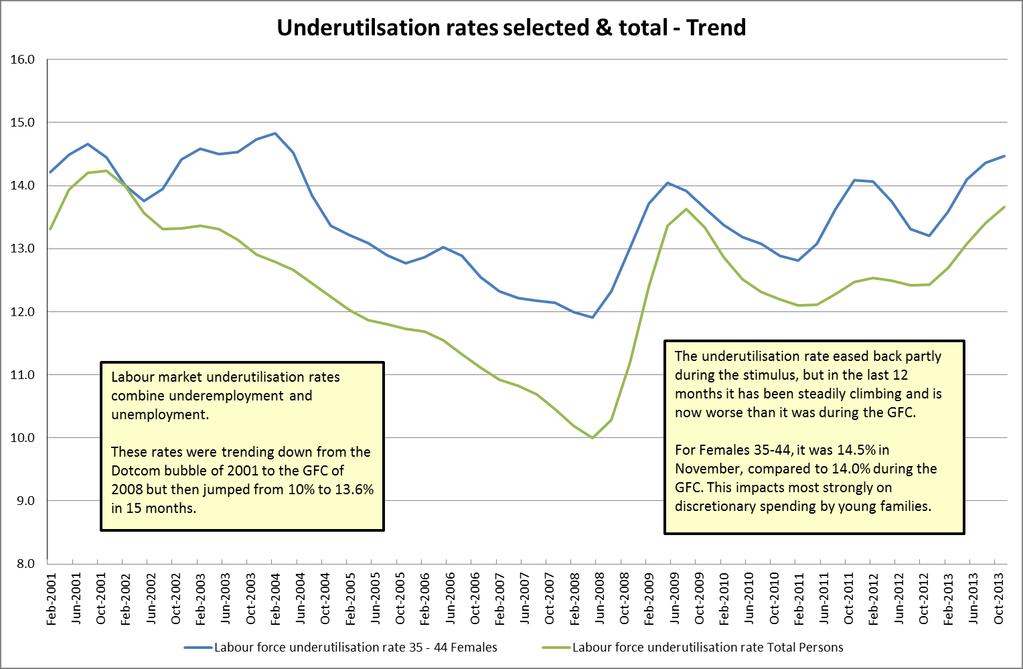
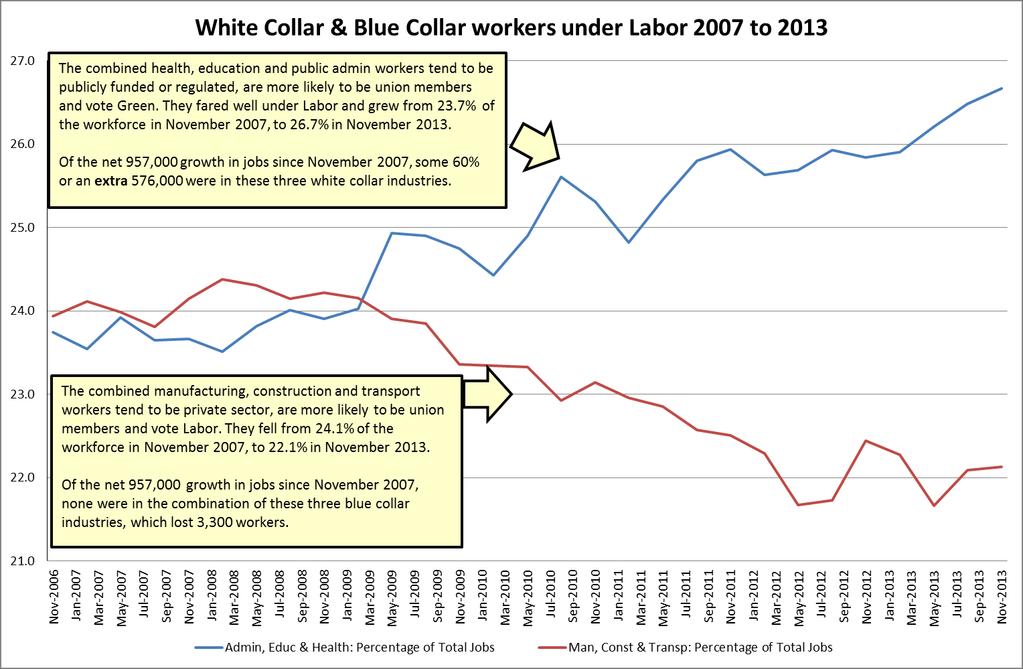
2 Executive Summary The Rudd Labor Government in November 2007 inherited a labour market which was generating almost as many jobs as could be provided annually by growth in the civilian population 15 years and over. Australia s participation rate was 65.2 percent and rising and the unemployment rate was 4.1 percent and falling. Between November 2007 and November 2013 we had the Global Financial Crisis and the Stimulus which temporarily returned job creation to Howard Government levels in late The six years of Labor Governments also saw the end of Workchoices, extensive re-regulation of the labour market and the creation of Fair Work Australia. By November 2013, the labour market was generating jobs for only one in four potential new entrants to the workforce. When benchmarked against figures for November 2007, the participation rate was down 0.8 percent and the official unemployment was up by 1.3 percent. Underemployment, which mainly affects part time working women, was at 7.8 percent compared to 7.9 percent during the worst days of the GFC. Particularly affected by underemployment were females aged 35 to 44, the group which funds consumer spending in younger middle class Australian families. Labour force underutilisation (which equals underemployment plus unemployment) was running at 13.7 percent in November 2013, compared to 13.6 percent during the GFC. Six out of ten or 576,000 of the additional 957,000 persons employed between November 2007 and November 2013, obtained jobs in the combined industries of health, education and public administration. These combined industries grew from 23.7 percent of the workforce in November 2007, to 26.7 percent of the workforce in November These predominantly white collar jobs tend to be publicly funded or regulated, are strongly unionised and show in our election profiles as equally strong Green voters. By contrast, the combined industries of manufacturing, construction and transport are more likely to be employed in the private sector, are relatively unionised and show in our election profiles as strong Labor voters. These three industries shared in none of the additional 957,000 jobs created during six years of Labor Governments and in fact lost a combined 3,300 workers. Their combined share of employed persons fell from 24.1 percent in November 2007 to 22.1 percent in November Copyright Australian Development Strategies
3 Both of these industry groupings started six years of Labor Governments in November 2007 with about 2,500,000 workers. The white collar group reached 3,100,000 by November 2013, while the blue collar group stayed on 2,500,000 and when Kevin Rudd lost office they were 600,000 jobs behind their white collar counterparts. This shedding of these blue collar construction, manufacturing and transport jobs under Labor was concentrated in certain labour force regions in outlying suburbs such as Gold Coast North in Queensland, or Fairfield-Liverpool in NSW. But conventional unemployment rates did not capture the real loss of employment opportunities in these regions as many joined the hidden unemployed, while more mobile workers moved to regions of higher labour demand in WA. The best example of this trend, Gold Coast North, was losing up to one in four employees at times during the period November 2007 to November 2013, but returning an unemployment rate of zero percent, which invalidates the unemployment rate as an economic indicator in the current economic climate. To neutralise the impact of hidden employment changes, these labour market profiles now place a higher priority on participation rates across the regions and pay more attention to underemployment and underutilisation at the national level. Participation rates used in the current study equal employed persons plus officially unemployed persons as a percentage of the civilian population aged 15 plus. This means a rise in participation rates could be due to a rise in unemployment, but this is tightly defined by the ABS as persons available to start work in the reference week. Given the high levels of discouraged workers and hidden unemployed in the current Australian Labour Market, a rise in official unemployment rates in some of our depressed regions like Gold Coast North and Fairfield-Liverpool would be a sign of growing confidence in the economy rather than the reverse. For all these reasons, we have settled on participation rates as the most effective current measure of the state of the labour market at the regional level. This data is only available in original form, rather than seasonally adjusted, so we use comparable original national figures where relevant and control for seasonal factors by comparing one month with the same month of the preceding year to produce Year on Year figures. Copyright Australian Development Strategies
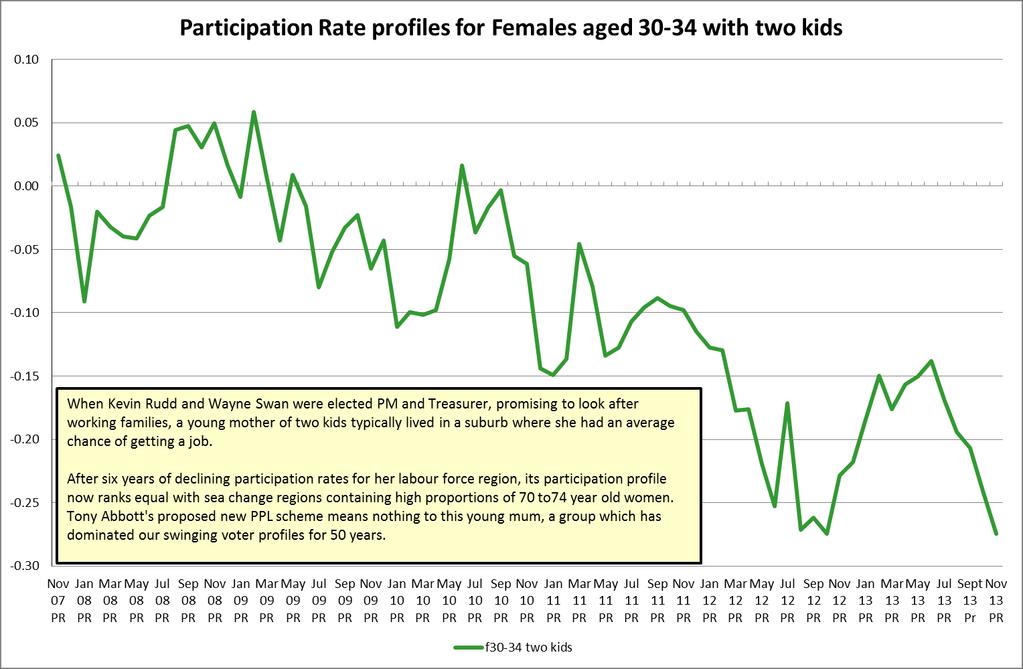
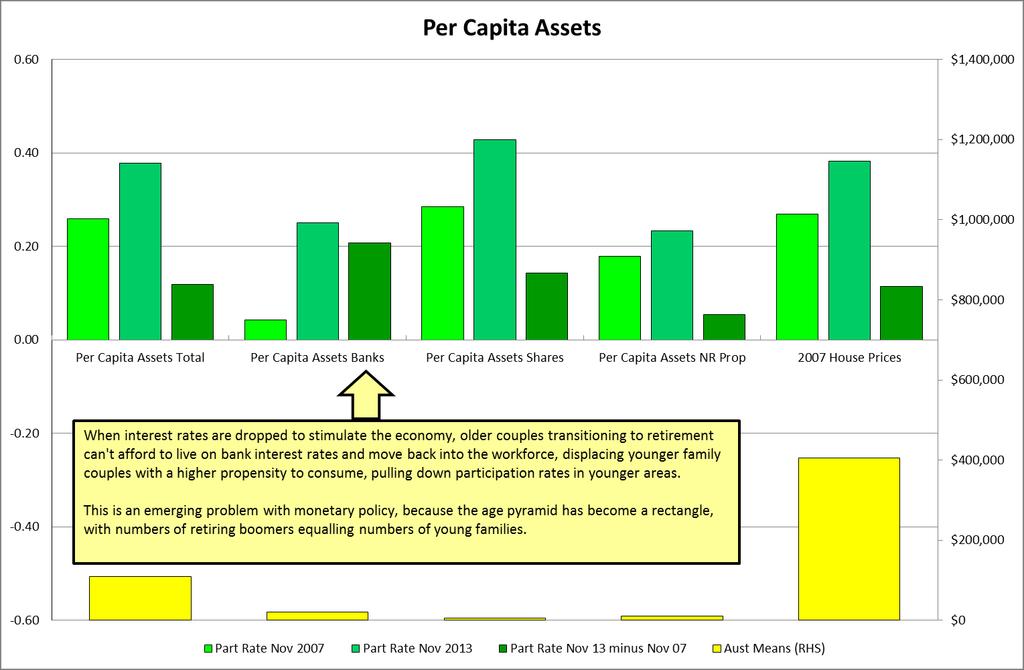
4 When we ranked the 69 regions to show the greatest drop in participation rates in Table 5 we noted that the 18 hardest hit regions included seven of the 14 Queensland regions, indicating the serious decline of the Queensland labour market over the past six years due to a contraction of the tourist sector, a drop in population growth and a loss of building and manufacturing jobs. The other regions in this table had similar problems. We also saw a range of outer urban and adjoining rural areas across most states. This is where we traditionally find large proportions of the more activist religions, such as Pentecostals and Mormons. Of some political interest on the demographic side of this table was the presence of middle income families, four bedroomed McMansions and year old mothers of two children. These demographics represent the classic swinging voter group and no Government can expect to be reelected if it presides over a fall in participation rates for this key group. In Table 6 we ranked the 69 regions to show the biggest gains in participation rates between November 2007 and November We noted only two of Queensland s 14 regions had positive participation rate growth and both of these benefitted from mining or gas jobs. FIFO mining jobs also made an impact in the WA regions in the table. We also saw some encouraging jobs growth in old rust belt regions in the Illawarra and Hunter. Whenever interest rates are cut we always see rises in participation rates for older workers and some of their even older dependents featured in this table. Low interest rates mean they need to find to work to compensate for lower transition to retirement incomes sourced from bank deposits. The biggest groups gaining jobs in terms of population numbers would be the inner city regions of Sydney, Melbourne and Perth and these include men working in CBD hospitality jobs taking a taxi to work from their single person, two roomed home unit. Using modelling and in cooperation with Business Geographics we projected the November 2007 Participation Rate, the November Quarter 2013 Participation Rate and the changes from 2007 to 2013, using postcodes as a convenient unit. These are presented as an online map in The Australian. The maps confirmed the general broad brush picture painted by the regional tables, but they allow a somewhat more fine grained interpretation. What we detected is that the inner city regions, typically the relevant CBD postcode, suffered a decline in participation rates from 2007 to The growth in participation rates and presumably jobs, took place in the suburbs just outside CBD postcodes. This gain in jobs then tapered off as we moved further out from the CBD and we then saw broad arcs of job losses in outlying commuter suburbs where real estate is cheapest, commutes are at their most difficult and where suburbs merge with the bush. Copyright Australian Development Strategies
5 We projected these trends onto 2013 Federal electorates and in Table 7 show the 12 electorates with the biggest gains in Participation Rates at top left, and the 12 electorates with the biggest falls in Participation Rates at top right. Table 7 also shows the State, the ALP 2PP 2013 vote and the final primary vote for the Green candidate. We see the electorates gaining jobs under Labor tended to be wealthy inner city seats with high Green votes, while the electorates losing jobs under Labor were lower income outer urban seats with few Green voters. For the 12 seats which grew increasingly prosperous under Labor, the Green vote averaged almost 16 percent. For the 12 seats which lost jobs under Labor the Green vote averaged only 6.4 percent. The correlation between Green primary votes and the improvement in Participation Rates was 0.78 and significant to 99.9 percent confidence levels. It seems reasonable to infer from the evidence in this table and above, that the biggest beneficiaries of rising participation rates under the Labor Governments of 2007 to 2013 were Green voters rather than either classic swinging voters or traditional Labor voters. More evidence is provided on these points in demographic profile charts for blue collar voters, swinging voters and Green voters and their relevant sub groups. Copyright Australian Development Strategies
6 Method and Presentation This profile is based on jobs data collected by the Australian Bureau of Statistics. The primary source is the monthly Labour Force survey by Regions ( ), but includes national data from , detailed quarterly data from , earnings by industry Job Vacancies Australia and Demographic Statistics We have also made some use of ABS data on underemployment and labour underutilisation. As detailed data is only available in Original form, we use this, unless otherwise stated to be Trend or Seasonally Adjusted. The modelling used by ADS compares this cross section of data with our Elaborate database and uses inferential statistics to project these sample results onto all Australian postcodes and Commonwealth Electoral Divisions. Material in the ADS Elaborate database is based on data from the ABS Census, Electoral Commissions, Household Expenditure Surveys modelled by MDS Data Systems, data on home loan arrears and a wide range of published data on political and economic behaviour. We present here, in Correlation Tables, the correlation between our database and the relevant jobs figures by region. The correlations have been ranked to typically show those which are normally significant to 95 percent or more (0.23). In other words, there s a five percent probability the correlations in the table are due to chance. The higher the correlation, plus or minus, the lower the probability it is due to chance. The Correlation Charts should be read the same way as the worm debating chart the zero line is neutral and the score heightens as the correlation increases its distance above or below the zero line. A positive correlation shown well above the zero line means that the demographic group in question is concentrated in the postcodes with high levels of the relevant jobs figure. A negative correlation well below the zero line means they re concentrated in suburbs where the jobs figure is lower. Many of the cultural variables like religion or ethnicity are useful descriptors and appear in the correlations, but only a few of them persist through higher levels of statistical number crunching and drive behaviour. But if we talk about any variable at length or in detail, it s usually because it has turned out to be important at the subsequent modelling stage. These drivers can be occupation, qualification, age, welfare dependence, previous unemployment, home loan arrears etc. Given the current growth in hidden unemployment across labour market regions, we are increasingly finding workforce participation and employment growth to be a stronger guide to the health of regional labour markets than the traditional unemployment rate. In fact the lowest unemployment rate of zero at the end of 2012 could be found in Gold Coast North region which also had the biggest 12 month drop in employment, as workers dropped out of the local workforce or moved to another region. This has caused us to place a higher priority on employment growth and participation rates and to pay more attention to underemployment and underutilisation. Copyright Australian Development Strategies
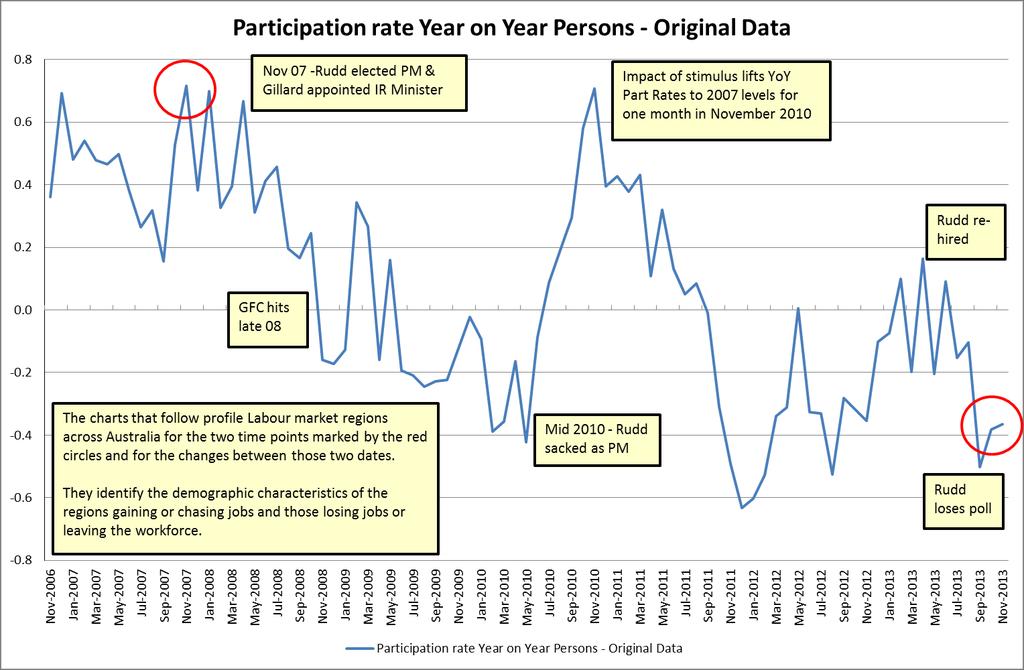
7 Month & Year Employed total Persons Unemploy ed total Persons Labour Force Persons Not in Labour Force Persons Civilian population Persons Unemploy ment rate Persons Particip ation rate Persons 12 month change Employed Persons 12 month change Unemployed Persons 12 month change Labour Force Persons 12 month change Not in the Labour Force Persons 12 month change Civilian population Persons 12 month change Unemployment rate Persons 12 month change Participati on rate Persons Nov Nov Nov Nov Nov Nov Nov Table 1. National labour market summary (shown in 000s). The November figures for each year are in the left hand columns (green headings) and the Year on Year figures are in the right hand columns (blue headings). As we can see from the top row of data, the Rudd Government in November 2007 inherited a labour market which was generating Year on Year almost as many jobs as could be provided annually by growth in the civilian population 15 years and over. In November 2008, as the GFC hit, the Labour market was still performing well enough to generate jobs for more than half of the annual increase in the civilian population. To maintain a steady participation rate and keep unemployment in check, the economy needs to generate about 230,000 extra jobs per year. By November 2009, the Global Financial Crisis (GFC) had impacted on the labour market and the economy was only generating jobs for one quarter of the annual growth in the civilian population. The rest were joining the unemployed or the hidden unemployed not officially in the Labour force. The stimulus brought about a recovery for November 2010 and unemployment numbers Year on Year were falling. The participation rate was also on the rise. And then stimulus faded and re-regulation of the Labour market impacted strongly on new jobs growth. In November 2013, shown at bottom right, the Labour market was back in the GFC doldrums and once again generating jobs for only one in four potential new entrants to the workforce. The participation rate was down 0.8 percent and unemployment was up by 1.3 percent. Copyright Australian Development Strategies
8 8
9 9
10 10
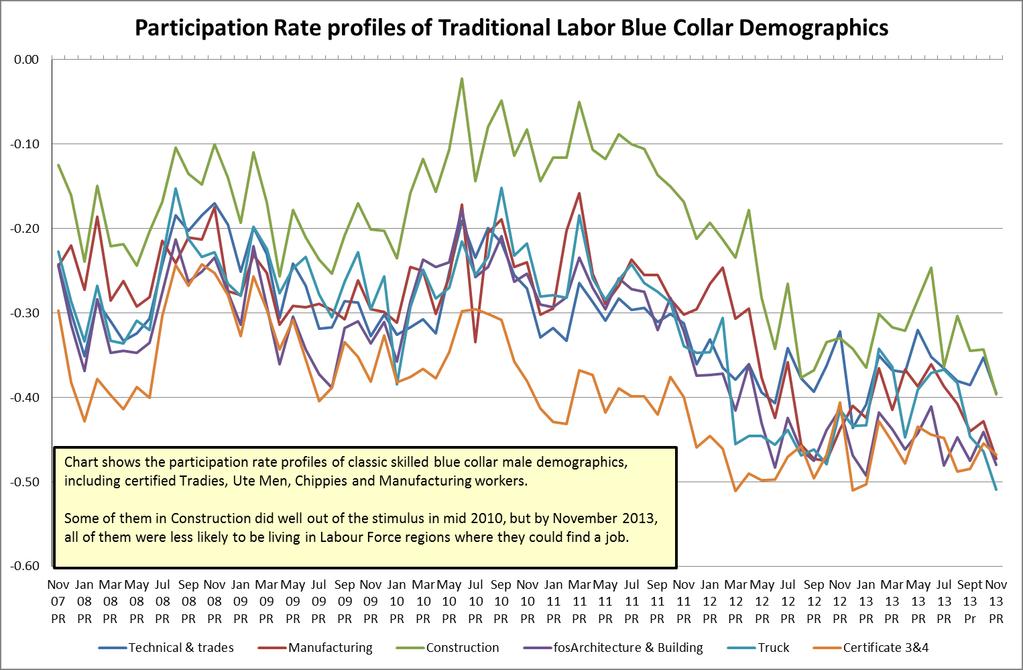
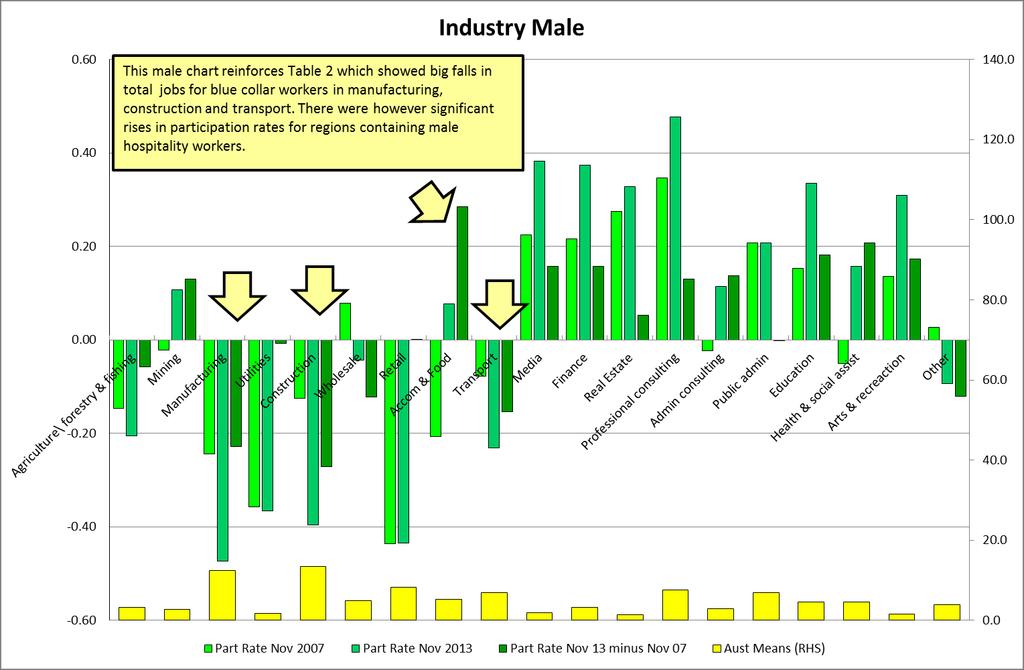
11 Quarter & Year Agricult Mining Manufact Utilities Construction Wholesale Retail Accom Real & Food Transp Media Finance Estate Nov Nov Nov Nov Nov Nov Nov Profess consult Admin consult Public admin Educat Health & social assist Arts & Rec Other Servic Nov 13 minus Nov Percent Tot Emp Percent Tot Emp Percent 13 minus Percent Union Table 2. This table shows quarterly employment levels by industry in 000 s for employed persons in column two of Table 1, above. We saw in Table 1 that there were 10,677,000 employed persons in November 07 and this number is broken into 19 major industry groups in row two. Rows three to eight show the same breakdown for employed persons in November 2008, 2009, 2010, 2011, 2012 and Bottom rows show breakdowns for each major industry group for employment changes from 2007 to 2013, the percentage of total persons employed in each industry group in 2007, the percentage of total persons employed in each industry group in 2013, the change in the percentage employed in each industry group from 2007 to 2013 and percentage of each industry group in unions in The table therefore shows the raw data included in the tables below. It also shows the way in which the major industries have waxed and waned over the six years of Labor Governments from 2007 to 2013 and the extent to which union membership may have been relevant. In the chart below we show how six industries fared under the Rudd and Gillard Governments. We look first at three classic skilled and semi-skilled blue collar industries of manufacturing, construction and transport. Compared to the rest of the mainly private sector, these three industries combined are strongly unionised, dominate our Labor voter profiles and play a leading role in Labor party factions. We would expect them to fare well under Labor Governments which ended Workchoices and re-regulated the Labour market. We also look at the predominantly public sector funded or regulated industries of health, education and public administration. These white collar union workers are strongly unionised but have traditionally played a lesser role in the ALP factions and appear instead in high profile roles at the ACTU. Unlike the blue collar group, these white collar workers feature strongly in Green voting profiles. Copyright Australian Development Strategies
12 12
13 Labour Force Regions Nov-2007 Nov-2013 PR Nov 13 minus Nov 07 Inner Sydney NORTHERN TERRITORY Inner Melbourne Brisbane City Inner Ring Mackay-Fitzroy-Central West North Perth AUSTRALIAN CAPITAL TERRITORY Eastern Suburbs Sydney Balance WA Lower Northern Sydney Outer Eastern Melbourne East Perth Central Northern Sydney Central Perth Northern Beaches NSW Southern Melbourne Brisbane City Outer Ring Darling Downs-South West Part Rate Nov 13 Aust Part Rate Part Rate minus Demographic Variables Means Nov 2007 Nov 2013 Nov 07 Females Employed full time Med personal income $ Wages Income Per Capita $24, Females earning weekly $ Females earning weekly $ Median family income $1, Families earning weekly $ Families earning weekly $ Median household income $1, Personal Loan Debt Per Capita $4, Females earning weekly $ Males Employed full time Families earning weekly $ Males earning weekly $ Males aged Credit Card Debt Per Capita $1, Invest Loan Debt Per Capita $12, Total Income Per Capita $36, Table 3. Labour Force Regions with the highest Participation Rates in November 2013 are shown above left. Above right are the demographic groups disproportionately represented in these regions. The regions are colour coded for each state and the income groups are also colour coded. Shades of blue refer to higher income groups. Regions with the strongest local workforces and high economic demand tend to be in the inner cities of our major capitals and contain full time workers with very high levels of both incomes and debt from a variety of sources. These high wages would include the white collar groups in the table 2 and the chart directly above. A second group of high participation rate regions in West Australia, the NT and Queensland include those benefiting directly and indirectly from the 138,300 mining and gas industry jobs created between 2007 and Copyright Australian Development Strategies
14 Labour Force Regions Nov-2007 Nov-2013 PR Nov 13 minus Nov 07 Gold Coast North SRS Wide Bay-Burnett Richmond-Tweed and Mid-North Coast Illawarra excluding Wollongong Fairfield-Liverpool Inner Eastern Melbourne West Moreton Mersey-Lyell SRS Tas Southern Tas Northern and Western SA All Gippsland Central Western Sydney Wollongong SRS Northern SRS Tas South Eastern NSW Western Adelaide Canterbury-Bankstown Newcastle SRS Part Rate Nov 13 Aust Part Rate Part Rate minus Demographic Variables Means Nov 2007 Nov 2013 Nov 07 Females Not in labour force Males Not in labour force Families earning weekly $ Govt Cash Income Per Capita $3, Families earning weekly $ Aged Pensioners Families earning weekly $ Males earning weekly $ Females earning weekly $ Carer Allowance recipients Females earning weekly $ Males earning weekly $ Males earning weekly $ Families earning weekly $ Female Industry Retail Persons Married Rent Assistance Men aged Table 4. Labour Force Regions with the lowest Participation Rates in November 2013 are shown above left and above right are the demographic groups located disproportionately in these regions. Income groups are colour coded in our database and lower income quartiles are in shades of pink. We are looking here at older sea change regions along the eastern states such as Wide Bay in Queensland or the Richmond Tweed area of northern N SW, both with high concentrations of aged pensioners and carers. There are former industrial regions too such as Newcastle and Wollongong, with high numbers of female retail workers and rent assistance instead of lost skilled blue collar jobs in manufacturing. These are joined by three of the four regions in Tasmania as a melancholy reminder of Tasmania s lost industrial base since Australia was opened to competition from international markets. This future now awaits the car manufacturing regions of Adelaide and Melbourne. Copyright Australian Development Strategies
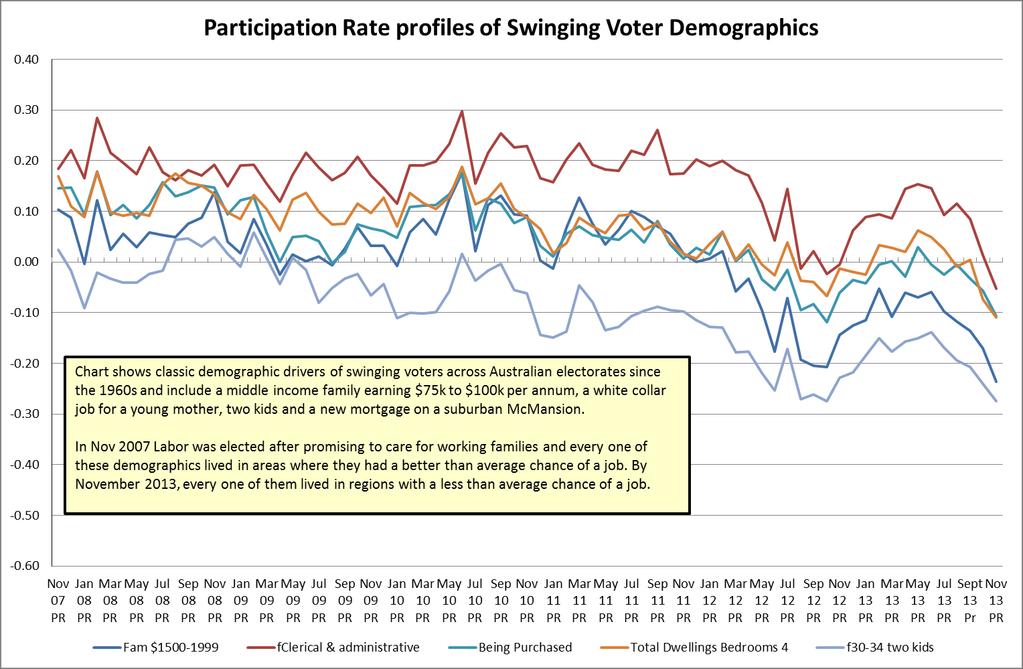
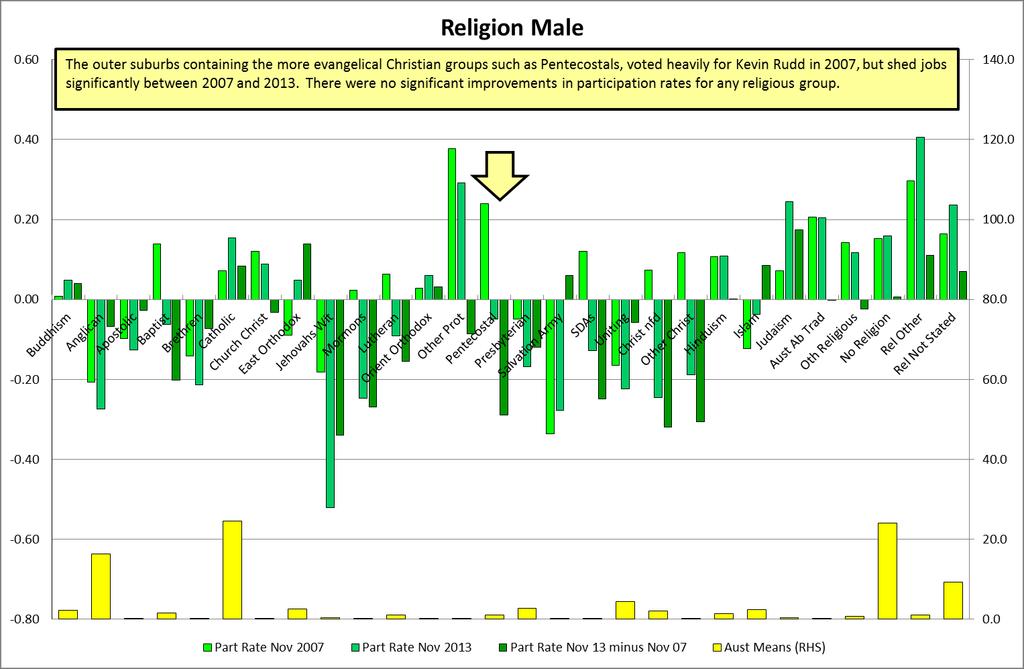
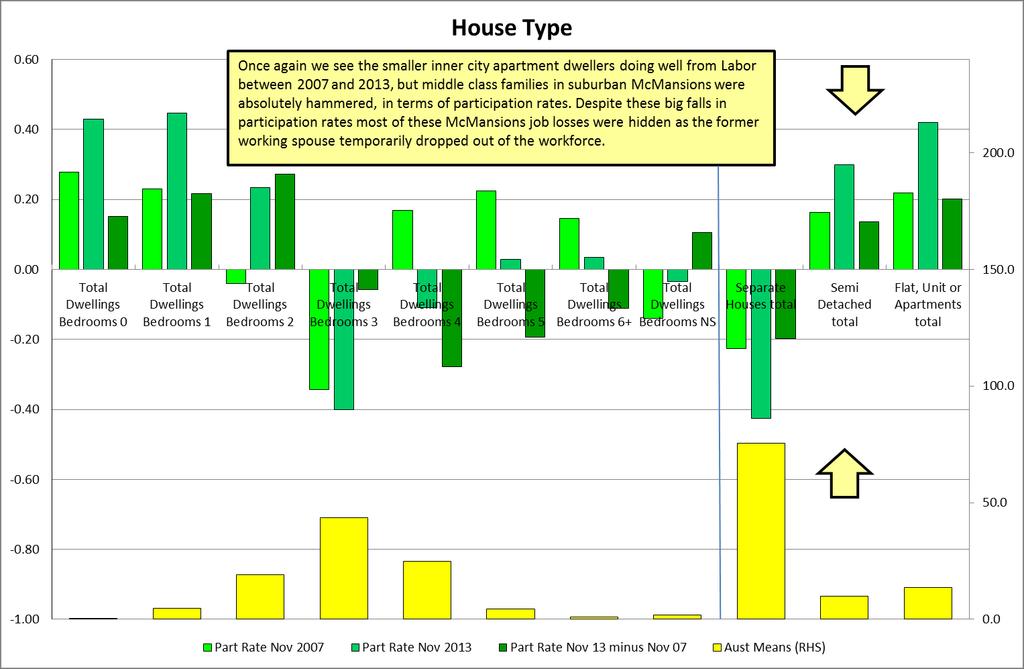
15 Labour Force Regions Nov-2007 Nov-2013 PR Nov 13 minus Nov 07 Gold Coast North SRS West Moreton Inner Eastern Melbourne Outer South Western Sydney North Brisbane Balance Murray-Murrumbidgee South West Perth All Gippsland Far North Qld Fairfield-Liverpool Balance WA South Eastern NSW Northern and Western SA Barwon-Western District Wide Bay-Burnett South and East Brisbane Greater Hobart Sunshine Coast Part Rate Nov 13 Aust Part Rate Part Rate minus Demographic Variables Means Nov 2007 Nov 2013 Nov 07 Families earning weekly $ Males Jehovahs Witness Males earning weekly $ Males Christians not fully defnined Female Industry Construction Females aged Females Christian not fully defined Females aged no kids Males Other Christian Females Pentecostal Females aged two kids Males earning weekly $ Females Mormons Males Pentecostal Separate House Bedrooms Homes Three Cars Persons aged Not Married Work Commute Truck Table 5. Labour Force Regions with the biggest fall in Participation Rates between November 2007 and November 2013 and the groups located within these regions. The table shows regions doing it relatively tough in 2013 compared to 2007and they include a disproportionate number of Queensland regions which appear to have suffered from a contraction of the tourist sector, a drop in population growth and a loss of building jobs. We also see a range of outer urban and adjoining rural areas, across most states, where we traditionally find large proportions of the more activist religions, such as Pentecostals and Mormons. Of some political interest are the middle income ranges in the top right of the table and the presence of four bedroomed McMansions and year old mothers of two children. We are looking here at middle class outer suburban Australian. No Government can expect to be re-elected if it presides over a fall in participation rates for these classic swinging voter groups. Copyright Australian Development Strategies
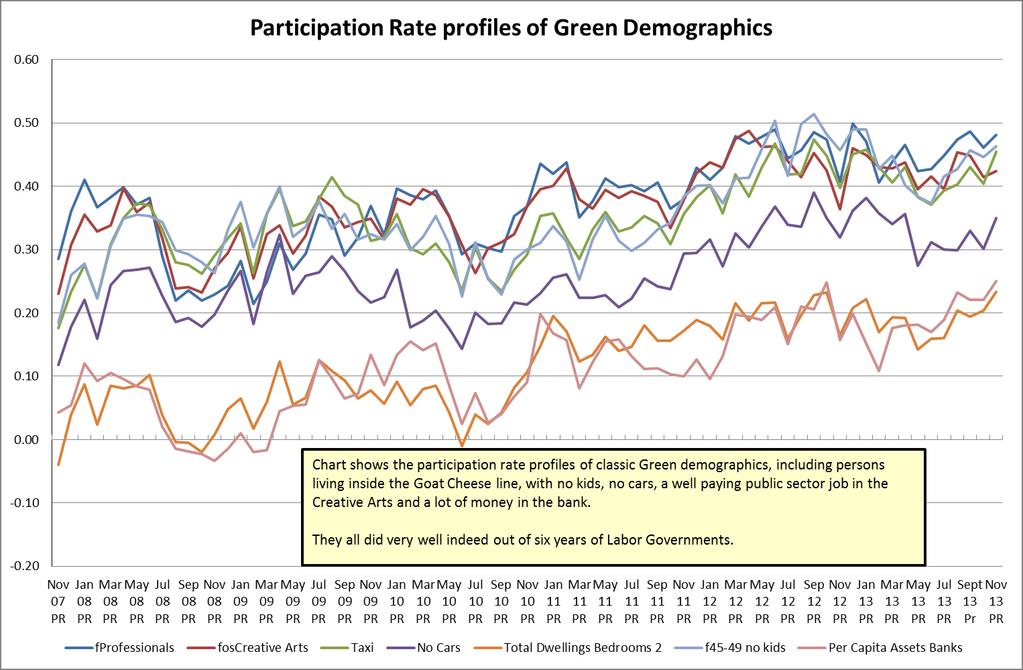
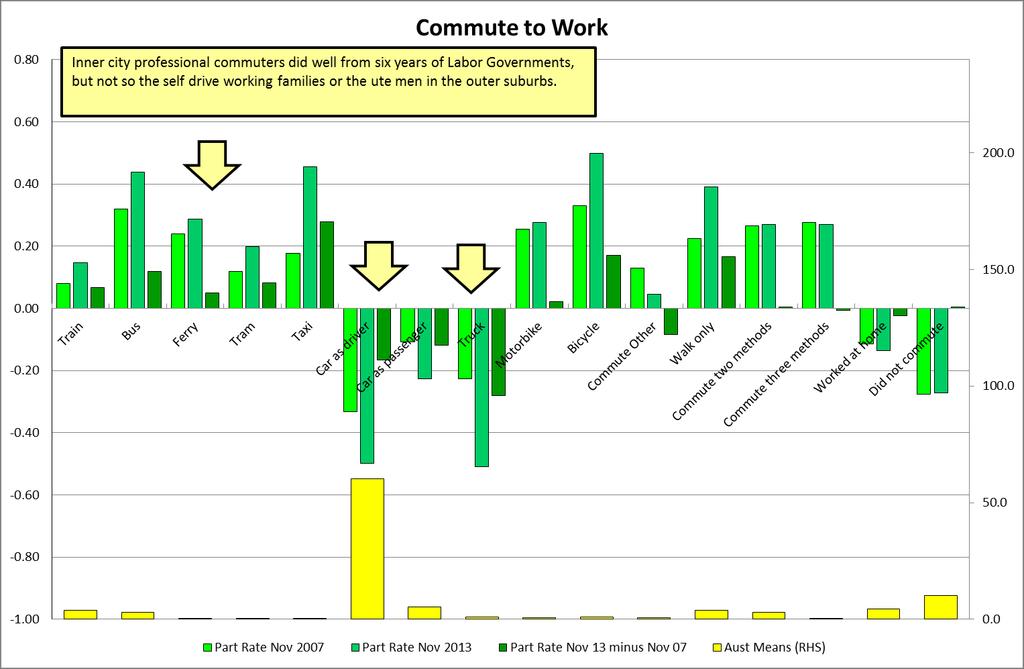
16 Labour Force Regions Nov-2007 Nov-2013 PR Nov 13 minus Nov 07 Far West NSW Illawarra excluding Wollongong Inner Sydney East Perth Eastern Suburbs Sydney Southern Melbourne Lower Northern Sydney Canterbury-Bankstown North Western Melbourne Darling Downs-South West Hunter excluding Newcastle Central Perth Western Adelaide Wollongong SRS Loddon-Mallee Outer Western Melbourne Inner Melbourne Mackay-Fitzroy-Central West Part Rate Nov 13 Aust Part Rate Part Rate minus Demographic Variables Means Nov 2007 Nov 2013 Nov 07 Youth Allowance F/T Student Females aged one kid Homes One Car Females aged Single Person Home Females aged one kid Male Industry Accom & Food Females aged 85+ one kid Work Commute Taxi Females aged no kids Females aged no kids Total Dwellings Bedrooms Females aged one kid Females aged one kid Females aged no kids Females aged no kids Females aged two kids Persons aged Not Married Table 6. Labour Force Regions with the biggest gains in Participation Rates between November 2007 and November 2013 are shown at top left and the groups located disproportionately within these regions are at top tight. The more obvious points to note are the lack of Queensland maroon in the top right. Only two of Queensland s 14 regions had positive participation rate growth and both of these benefitted from mining or gas jobs. FIFO mining jobs also made an impact in the two WA regions. We also see jobs growth in old rust belt regions in the Illawarra and Hunter. Whenever interest rates are cut we always see rises in participation rates for the older workers (and their even older dependents) shown at the top right. Low interest rates mean they need to find to work to compensate for lower transition to retirement incomes from bank deposits. The biggest group in terms of population numbers would be the inner city regions of Sydney, Melbourne and Perth and these include the men working in CBD hospitality jobs taking a taxi to work from their single person, two roomed home unit. Copyright Australian Development Strategies
17 Pred Part Rate Nov 13 minus Nov 07 Seat STATE Pred Part Rate Nov 13 minus Nov 07 ALP 2013 Green Pmy Vote Pred Part Pred Part Rate Nov Rate Nov ALP 2013 Green Pmy Vote Pred Part Pred Part Rate Nov Rate Nov Seat STATE 2PP Sept PP Sept Grayndler NSW Rankin QLD North Sydney NSW Longman QLD Wills VIC Canning WA Warringah NSW Bruce VIC Wentworth NSW Menzies VIC Hindmarsh SA Pearce WA Batman VIC Chifley NSW Cunningham NSW Scullin VIC Goldstein VIC Brand WA Richmond NSW Calwell VIC Denison TAS Blair QLD Griffith QLD Gorton VIC Table 7. We used statistical modelling to project the regional Labour market figures onto 2013 election boundaries and Table 7 above, shows the 12 electorates with the biggest gains in Participation Rates at top left, and the 12 electorates with the biggest falls in Participation Rates at top right. We also show the State, the ALP 2PP 2013 vote the day after the election and the final primary vote for the Green candidate. We see here the electorates gaining jobs under Labor tended to be wealthy inner city seats with high Green votes, while the electorates losing jobs under Labor were lower income outer urban seats with few Green voters. For the 12 seats which grew increasingly prosperous under Labor at top left, the Green vote averaged almost 16 percent. For the 12 seats which lost jobs under Labor the Green vote averaged only 6.4 percent. The correlation between Green primary votes and the improvement in Participation Rates was 0.78 and significant to 99.9 percent confidence levels. It seems reasonable to infer from the evidence in this table and above, that the biggest beneficiaries of rising participation rates under the Labor Governments of 2007 to 2013 were Green voters rather than either classic swinging voters or traditional Labor voters. More evidence is provided below. Copyright Australian Development Strategies
18 18
19 19
20 20
21 21
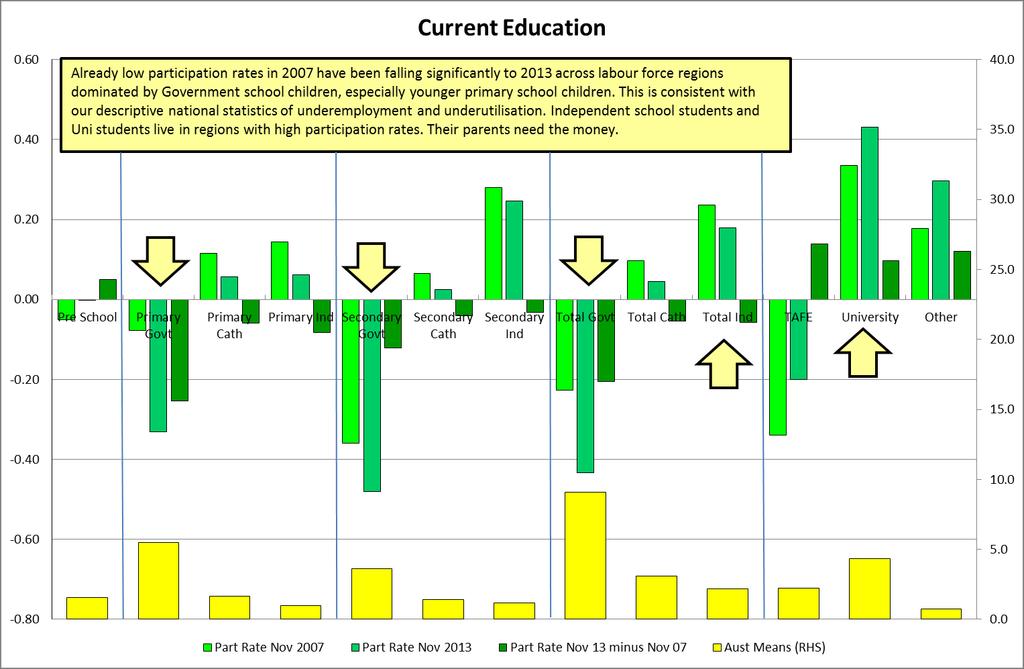
22 Labour Market Change Charts The following charts show correlations between some of the variables in our database and the Participation Rates for November 2007, November 2013 and the change in Participation Rates from 2007 to A strong positive correlation between a given variable and the 2013 Participation Rate means that persons in the relevant demographic group tend to live in Labour Market regions which had very high Participation Rates in Any correlation more than plus or minus 0.2 from the zero line is significant to 90 percent confidence interval, which means there is a ten percent chance the result is due to random factors and doesn t mean anything at all. If the correlation is.23 the confidence interval is 95 percent, 0.30 is 99 percent and 0.38 is 99.9 percent. In the Current Education chart below we see the correlation between University Students and 2013 Participation Rates is 0.43, well above the zero line in the Chart. This means University students tend to live in regions with very high Participation Rates. These could be close to the CBD or in wealthy areas further out from the CBD, depending on whether the student is living near an inner city university or at home. TAFE Students however are negatively correlated with Participation Rates, which means in their case that they are probably living at home in a lower Participation Rate region with their parents. We also see positive correlations between Participation Rates and Independent school students but negative correlations with Government school students. We can infer that the parents of Government School Students live in low Participation Rate regions, while the Independent school parents live in high Participation Rate areas. In terms of changes in Participation Rates between 2007 and 2013, we see that Government Primary School parents were less likely to be in the Labour force in 2013 than they were in In other words, the working families with kids in Government schools that Labor allegedly set out to serve faithfully in 2007 were the ones most disadvantaged by six years of Labor Governments. Copyright Australian Development Strategies
23 23
24 24
25 25
26 26
27 27
28 28
29 29
30 30
31 31
32 32
33 33
34 34
35 35
36 36
37 37
38 38
Queensland s Labour Market Progress: A 2006 Census of Population and Housing Profile
 Queensland s Labour Market Progress: A 2006 Census of Population and Housing Profile Issue No. 9 People in Queensland Labour Market Research Unit August 2008 Key Points Queensland s Labour Market Progress:
Trends across Australian Education sectors:
 Trends across Australian Education sectors: Census Results 2006 to 2011(16) ABS School Census 1998 to 2016 My School Fees 1998 to 2016 Ind profile 2011 minus 2006 Independent Sector market share shifted
The Northern Territory s Non-resident Workforce - one Census on (Issue No )
") Demography and Growth Planning The Northern Institute The Northern Territory s Non-resident Workforce - one Census on (Issue No. 201304) The Northern Institute, 2013: This material is submitted for peer
Demography and Growth Planning The Northern Institute The Northern Territory s Non-resident Workforce - one Census on (Issue No. 201304) The Northern Institute, 2013: This material is submitted for peer
bulletin 139 Youth justice in Australia Summary Bulletin 139 MArch 2017
 Bulletin 139 MArch 2017 Youth justice in Australia 2015 16 Summary This bulletin examines the numbers and rates of young people who were under youth justice supervision in Australia during 2015 16 because
AHURI Research & Policy Bulletin
 AHURI Research & Policy Bulletin ISSUE 74 June 2006 ISSN 1445-3428 Are housing affordability problems creating labour shortages? Up until 2001 there was little direct evidence that housing affordability
Chapter Ten: The Inner Metropolitan Republic. Malcolm Mackerras
 Chapter Ten: The Inner Metropolitan Republic Malcolm Mackerras Perhaps it may be best to start with these overall voting statistics of the republic referendum. First, there were 12,392,040 electors enrolled
Annual Wage Review
 Annual Wage Review 2010-11 CCIQ Submission in Reply to Fair Work Australia Annual Wage Review 2010-11 29 April 2011 1.0 INTRODUCTION 1.1 As the peak business organisation in Queensland, the Chamber of
CAEPR Indigenous Population Project 2011 Census Papers
 CAEPR Indigenous Population Project 2011 Census Papers Paper 10 Labour Market Outcomes Matthew Gray, a Monica Howlett b and Boyd Hunter c a. Professor of Public Policy and Director, CAEPR b. Research Officer,
The demographic diversity of immigrant populations in Australia
 The demographic diversity of immigrant populations in Australia Professor James Raymer School of Demography Research School of Social Sciences Mobility Symposium, Department of Immigration and Border Protection
Economic correlates of Net Interstate Migration to the NT (NT NIM): an exploratory analysis
: an exploratory analysis") Research Brief Issue 04, 2016 Economic correlates of Net Interstate Migration to the NT (NT NIM): an exploratory analysis Dean Carson Demography & Growth Planning, Northern Institute dean.carson@cdu.edu.au
Research Brief Issue 04, 2016 Economic correlates of Net Interstate Migration to the NT (NT NIM): an exploratory analysis Dean Carson Demography & Growth Planning, Northern Institute dean.carson@cdu.edu.au
State-nominated Occupation List
 State-nominated Occupation List Industry skills requirement through state-nominated skilled migration APRIL 2016 Page 1 RESTAURANT & CATERING AUSTRALIA Restaurant & Catering Australia (R&CA) is the national
The Northern Territory s Non- Resident Workforce
 Research Brief 201204 The Northern Territory s Non- Resident Workforce Dean Carson Flinders University (1) Andrew Taylor Charles Darwin University (2) (1) Flinders University Rural Clinical School / Poche
Characteristics of the underemployed in New Zealand
 Characteristics of the underemployed in New Zealand focuses on the proportion of underemployment for part-time workers. It brings in underemployment rates and levels to provide context. We explore personal,
Where tradies work: A regional analysis of the labour market for tradespeople
 Where tradies work: A regional analysis of the labour market for tradespeople CENTRE FOR LABOUR MARKET RESEARCH, UNIVERSITY OF CANBERRA Phil Lewis Michael Corliss A NATIONAL VOCATIONAL EDUCATION AND TRAINING
Release of 2006 Census results Labour Force, Education, Place of Work and Mode of Transportation
 Backgrounder Release of 2006 Census results Labour Force, Education, Place of Work and Mode of Transportation On March 4, 2008 Statistics Canada released further results from the 2006 census focusing on
Economic vulnerability in Australia, : an employment perspective
 NATIONAL VOCATIONAL EDUCATION AND TRAINING RESEARCH PROGRAM OCCASIONAL PAPER Economic vulnerability in Australia, 2002 12: an employment perspective Michelle Circelli John Stanwick NATIONAL CENTRE FOR
Pacific Economic Trends and Snapshot
 Pacific Economic Trends and Snapshot September 213 Report to Ministry of Business, Innovation, and Employment Contents 1. Key points... 3 2. Demographic trends... 5 3. Qualifications and skills... 7 4.
Quarterly Labour Market Report. February 2017
 Quarterly Labour Market Report February 2017 MB14052 Feb 2017 Ministry of Business, Innovation and Employment (MBIE) Hikina Whakatutuki - Lifting to make successful MBIE develops and delivers policy, services,
RESEARCH BRIEF: The State of Black Workers before the Great Recession By Sylvia Allegretto and Steven Pitts 1
 July 23, 2010 Introduction RESEARCH BRIEF: The State of Black Workers before the Great Recession By Sylvia Allegretto and Steven Pitts 1 When first inaugurated, President Barack Obama worked to end the
CUP - City User Population Research
 CUP - City User Population Research 2003-2013 Key insights from a decade of CUP surveys Contents Background... 2 Methodology... 2 Executive Summary... 3 Glossary of Terms... 4 Key Insights All City Users...
Mapping migrants: Australians wide-ranging experiences of immigration
 No. 13 December 2018 Mapping migrants: Australians wide-ranging experiences of immigration Charles Jacobs Mapping migrants: Australians wide-ranging experiences of immigration Charles Jacobs POLICY Paper
Planning for Queensland s Future Population and Economy
 > Planning for Queensland s Future Population and Economy Chamber of Commerce & Industry Queensland Population & Infrastructure Blueprint March 2010 CONTENTS 1.0 Overview and recommendation strategies
Community Profile of Adelaide Metropolitan area
 Paper# : 2079 Session Title : GIS - Supporting Decisions in Public Policy Community Profile of Adelaide Metropolitan area By adipandang.yudono@postgrads.unisa.edu.au Abstract The paper presents a community
District Demographic Profile: Ipswich
 District Demographic Profile: All data is sourced from Office of National Statistics (ONS). The data sets provided cover a range of different periods and these are highlighted next to charts as appropriate.
Social and Demographic Trends in Burnaby and Neighbouring Communities 1981 to 2006
 Social and Demographic Trends in and Neighbouring Communities 1981 to 2006 October 2009 Table of Contents October 2009 1 Introduction... 2 2 Population... 3 Population Growth... 3 Age Structure... 4 3
Electoral Snakes and Ladders
 Electoral Snakes and Ladders Anyone who has played snakes and ladders knows that, just before the winning square, there is always a big bad snake s head, to take the would be winner right back to square
Population and Dwelling Counts
 Release 1 Population and Dwelling Counts Population Counts Quick Facts In 2016, Conception Bay South had a population of 26,199, representing a percentage change of 5.4% from 2011. This compares to the
Marginal Seat Disaster for Labor
 Marginal Seat Disaster for Labor A special JWS Research Poll of 4,070 voters in 54 key federal marginal seats commissioned by ECG Advisory Solutions and the Australian Financial Review shows a two party
Who lives where: Brisbane
 May 2013 Who lives where: Brisbane Productive Cities: Supplementary Maps Jane-Frances Kelly and Peter Mares Grattan Institute Support Grattan Institute Report No. 2013-8, MTH 2013 Founding members Program
Research Brief Issue RB02/2018
 Research Brief Issue RB02/2018 The Northern Territory s non-resident workforce in 2016 Ms Anita Maertens Northern Institute/College of Indigenous Futures, Arts and Society anita.maertens@cdu.edu.au Dr
Statistics Update For County Cavan
 Social Inclusion Unit November 2013 Key Figures for Cavan Population 73,183 Population change 14.3% Statistics Update For County Cavan Census 2011 Shows How Cavan is Changing Population living in 70% rural
In class, we have framed poverty in four different ways: poverty in terms of
 Sandra Yu In class, we have framed poverty in four different ways: poverty in terms of deviance, dependence, economic growth and capability, and political disenfranchisement. In this paper, I will focus
ENDOGENOUS EMPLOYMENT GROWTH AND DECLINE IN SOUTH EAST QUEENSLAND
 Australasian Journal of Regional Studies, Vol. 14, No. 1, 2008 95 ENDOGENOUS EMPLOYMENT GROWTH AND DECLINE IN SOUTH EAST QUEENSLAND Alistair Robson UQ Social Research Centre, Institute of Social Science,
POLICY BRIEFING. Poverty in Suburbia: Smith Institute report
 Poverty in Suburbia: Smith Institute report Sheila Camp, LGIU Associate 8 May 2014 Summary The Smith Institute's recent report "Poverty in Suburbia" examines the growth of poverty in the suburbs of towns
POPULATION STUDIES RESEARCH BRIEF ISSUE Number
 POPULATION STUDIES RESEARCH BRIEF ISSUE Number 2008021 School for Social and Policy Research 2008 Population Studies Group School for Social and Policy Research Charles Darwin University Northern Territory
SPECIAL REPORT. TD Economics ABORIGINAL WOMEN OUTPERFORMING IN LABOUR MARKETS
 SPECIAL REPORT TD Economics ABORIGINAL WOMEN OUTPERFORMING IN LABOUR MARKETS Highlights Aboriginal women living off-reserve have bucked national trends, with employment rates rising since 2007 alongside
Australian Catholic Bishops Conference Pastoral Research Office
 Australian Bishops Conference Pastoral Research Office Mass attendance in Australia: A critical moment A report based on the National Count of Attendance, the National Church Life Survey and the Australian
Trends in Labour Supply
 Trends in Labour Supply Ellis Connolly, Kathryn Davis and Gareth Spence* The labour force has grown strongly since the mid s due to both a rising participation rate and faster population growth. The increase
UTS:IPPG Project Team. Project Director: Associate Professor Roberta Ryan, Director IPPG. Project Manager: Catherine Hastings, Research Officer
 IPPG Project Team Project Director: Associate Professor Roberta Ryan, Director IPPG Project Manager: Catherine Hastings, Research Officer Research Assistance: Theresa Alvarez, Research Assistant Acknowledgements
Immigration Visa Guide for rehabilitation counsellor
 Immigration Visa Guide for rehabilitation counsellor A UNIT OF BRAIN DRAIN CONSULTANTS PRIVATE LIMITED Complete Immigration Visa Guide for rehabilitation counsellor A2Z Immi Support Services Index 1. An
Australian Indigenous Employment Disadvantage: What, why and where to from here?
 Journal of Economic and Social Policy Volume 5 Issue 2 Article 2 1-1-2001 Australian Indigenous Employment Disadvantage: What, why and where to from here? Rae Norris University of the Sunshine Coast Follow
LOCAL STRATEGIC ASSESSMENT 2018
 NORTH EAST FIFE LOCAL STRATEGIC ASSESSMENT 2018 Fife Council Research Team 1. Overview The Local Strategic Assessment provides an overview of how a Local Area is doing. It collates and updates a wide range
Immigration Visa Guide for Librarian
 Immigration Visa Guide for Librarian A UNIT OF BRAIN DRAIN CONSULTANTS PRIVATE LIMITED Complete Immigration Visa Guide for Librarian A2Z Immi Support Services Index 1. An Insight to Report 1 1.1 Report
Immigration Visa Guide for civil engineering draftsperson
 Immigration Visa Guide for civil engineering draftsperson A UNIT OF BRAIN DRAIN CONSULTANTS PRIVATE LIMITED Complete Immigration Visa Guide for civil engineering draftsperson A2Z Immi Support Services
Immigration Visa Guide for Welfare Worker
 Immigration Visa Guide for Welfare Worker A UNIT OF BRAIN DRAIN CONSULTANTS PRIVATE LIMITED Complete Immigration Visa Guide for Welfare Worker A2Z Immi Support Services Index 1. An Insight to Report 1
Knowledge is Power: Measuring the Competitiveness of Global Sydney
 Knowledge is Power: Measuring the Competitiveness of Global April 2013 Contents Global Competitiveness Index P.1 Knowledge-intensive industries P.5 Highly-skilled occupations P.7 Workers qualifications
Western Sydney Job Deficit Analysis. Final Report
 Western Sydney Job Deficit Analysis Final Report September 2016 Table of contents 1. Introduction... 4 1.1 Disclaimer... 4 2. Are there enough jobs?... 5 3. Where are the deficits by industry?... 9 3.1
How s Life in Australia?
 How s Life in Australia? November 2017 In general, Australia performs well across the different well-being dimensions relative to other OECD countries. Air quality is among the best in the OECD, and average
Attitudes to Nuclear Power Are they shifting?
 Attitudes to Nuclear Power Are they shifting? Research Paper No. 43 May 2007 Andrew Macintosh and Clive Hamilton Summary In March this year, The Australian newspaper carried several stories that suggested
Community Social Profile Cambridge and North Dumfries
 Community Trends for 2013 in Cambridge, North Dumfries, Wellesley, Wilmot and Woolwich Community Social Profile - Cambridge and North Dumfries Published December 2014 Community Social Profile Cambridge
Fiscal Impacts of Immigration in 2013
 www.berl.co.nz Authors: Dr Ganesh Nana and Hugh Dixon All work is done, and services rendered at the request of, and for the purposes of the client only. Neither BERL nor any of its employees accepts any
Job Displacement Over the Business Cycle,
 cepr CENTER FOR ECONOMIC AND POLICY RESEARCH Briefing Paper Job Displacement Over the Business Cycle, 1991-2001 John Schmitt 1 June 2004 CENTER FOR ECONOMIC AND POLICY RESEARCH 1611 CONNECTICUT AVE., NW,
Immigration Visa Guide for ICT Project Manager
 Immigration Visa Guide for ICT Project Manager A UNIT OF BRAIN DRAIN CONSULTANTS PRIVATE LIMITED Complete Immigration Visa Guide for ICT Project Manager A2Z Immi Support Services Index 1. An Insight to
Endogenous Employment growth and decline in South East Queensland
 Endogenous Employment growth and decline in South East By Alistair Robson 1 UQ Social Research Centre, Institute of Social Science, University of Abstract: The South East region has been recording strong
City of Surrey. Preface. Labour Force Fact Sheet
 City of Labour Force Fact Sheet Preface Statistics Canada conducts its Census of Population every five years with the most recent census having occurred in 2006. The Census provides information on the
Immigration Visa Guide for Footballer
 Immigration Visa Guide for Footballer A UNIT OF BRAIN DRAIN CONSULTANTS PRIVATE LIMITED Complete Immigration Visa Guide for Footballer A2Z Immi Support Services Index 1. An Insight to Report 1 1.1 Report
Riverside Labor Analysis. November 2018
 November 2018 The City of Labor Market Dynamics and Local Cost of Living Analysis Executive Summary The City of is located in one of the fastest growing parts of California. Over the period 2005-2016,
Immigration Visa Guide for glazier
 Immigration Visa Guide for glazier A UNIT OF BRAIN DRAIN CONSULTANTS PRIVATE LIMITED Complete Immigration Visa Guide for glazier A2Z Immi Support Services Index 1. An Insight to Report 1 1.1 Report Introduction
Characteristics of Poverty in Minnesota
 Characteristics of Poverty in Minnesota by Dennis A. Ahlburg P overty and rising inequality have often been seen as the necessary price of increased economic efficiency. In this view, a certain amount
POLL DATA HIGHLIGHTS SIGNIFICANT DIFFERENCES BETWEEN REGISTERED DEMOCRATS AND REPUBLICANS.
 - - - - - - e THE INDEPENDENT AND NON-PARTISAN STATEWIDE SURVEY OF PUBLIC OPINION ESTABLISHED IN 947 BY MERVIN D. FIELD. 234 Front Street San Francisco 94 (45) 392-5763 COPYRIGHT 978 BY THE FIELD INSTITUTE.
LEFT BEHIND: WORKERS AND THEIR FAMILIES IN A CHANGING LOS ANGELES. Revised September 27, A Publication of the California Budget Project
 S P E C I A L R E P O R T LEFT BEHIND: WORKERS AND THEIR FAMILIES IN A CHANGING LOS ANGELES Revised September 27, 2006 A Publication of the Budget Project Acknowledgments Alissa Anderson Garcia prepared
OFFICE OF THE CONTROLLER. City Services Auditor 2005 Taxi Commission Survey Report
 OFFICE OF THE CONTROLLER City Services Auditor 2005 Taxi Commission Survey Report February 7, 2006 TABLE OF CONTENTS INTRODUCTION 3 SURVEY DATA ANALYSIS 5 I. The Survey Respondents 5 II. The Reasonableness
Telephone Survey. Contents *
 Telephone Survey Contents * Tables... 2 Figures... 2 Introduction... 4 Survey Questionnaire... 4 Sampling Methods... 5 Study Population... 5 Sample Size... 6 Survey Procedures... 6 Data Analysis Method...
The State of. Working Wisconsin. Update September Center on Wisconsin Strategy
 The State of Working Wisconsin Update 2005 September 2005 Center on Wisconsin Strategy About COWS The Center on Wisconsin Strategy (COWS), based at the University of Wisconsin-Madison, is a research center
Immigration Visa Guide for clinical psychologist
 Immigration Visa Guide for clinical psychologist A UNIT OF BRAIN DRAIN CONSULTANTS PRIVATE LIMITED Complete Immigration Visa Guide for clinical psychologist A2Z Immi Support Services Index 1. An Insight
Socio-Economic Profile
 LOCAL HEALTH AREA 7 - Socio-Economic Profile Powell River Comox Cumberland Denman Island Hornby Island Qualicum CENSUS POPULATION LAND AREA POPULATION DENSITY Number % of Region Sq. Km. % of Region Persons
THE LITERACY PROFICIENCIES OF THE WORKING-AGE RESIDENTS OF PHILADELPHIA CITY
 THE LITERACY PROFICIENCIES OF THE WORKING-AGE RESIDENTS OF PHILADELPHIA CITY Prepared by: Paul E. Harrington Neeta P. Fogg Alison H. Dickson Center for Labor Market Studies Northeastern University Boston,
Backgrounder. This report finds that immigrants have been hit somewhat harder by the current recession than have nativeborn
 Backgrounder Center for Immigration Studies May 2009 Trends in Immigrant and Native Employment By Steven A. Camarota and Karen Jensenius This report finds that immigrants have been hit somewhat harder
Migration (IMMI 18/037: Regional Certifying Bodies and Regional Postcodes) Instrument 2018
 Instrument 2018") Migration (IMMI 18/037: Regional Certifying Bodies and Regional Postcodes) Instrument 2018 I, Alan Tudge, Minister for Citizenship and Multicultural Affairs, make the following instrument. Dated 15 March
Migration (IMMI 18/037: Regional Certifying Bodies and Regional Postcodes) Instrument 2018 I, Alan Tudge, Minister for Citizenship and Multicultural Affairs, make the following instrument. Dated 15 March
An analysis of demographic processes which presently represent important policy areas in Australian cities and regions
 An analysis of demographic processes which presently represent important policy areas in Australian cities and regions Graeme J Hugo ARC Australian Professorial Fellow, Professor of Geography and Director
Ward profile information packs: Ryde North East
 % of Island population % of Island population Ward profile information packs: The information within this pack is designed to offer key data and information about this ward in a variety of subjects. It
NATIONAL POPULATION PLAN FOR REGIONAL AUSTRALIA
 NATIONAL POPULATION PLAN FOR REGIONAL AUSTRALIA February 2019 KNOWLEDGE POLICY PRACTICE KEY POINTS People vote with their feet and many are showing strong preferences for living in regions. Enhancing liveability
Education and employment for young Aborigines. A.E. Daly No.38/1993 ISSN ISBN
 Education and employment for young Aborigines A.E. Daly No.38/1993 ISSN 1036-1774 ISBN 0 7315 1712 1 SERIES NOTE The Centre for Aboriginal Economic Policy Research (CAEPR) was established in March 1990
Le Sueur County Demographic & Economic Profile Prepared on 7/12/2018
 Le Sueur County Demographic & Economic Profile Prepared on 7/12/2018 Prepared by: Mark Schultz Regional Labor Market Analyst Southeast and South Central Minnesota Minnesota Department of Employment and
Equality Awareness in Northern Ireland: General Public
 Equality Awareness in Northern Ireland: General Public Equality Awareness Survey General Public 2016 Table of Contents 1. Introduction... 1 2. Social Attitudes and Perceptions of Equality... 11 3. Perception
Youth Prosperity Forum
 Youth Prosperity Forum Sunshine Coast November 2013 Presenter: Ivan Neville Branch Manager Labour Market Research and Analysis Branch Population Profile Region Adult Population (15+) Growth 2008 to 2013
The State of Rural Minnesota, 2019
 P.O. Box 3185 Mankato, MN 56002-3185 (507)934-7700 www.ruralmn.org The State of Rural Minnesota, 2019 January 2019 By Kelly Asche, Research Associate Each year, the Center for Rural Policy and Development
Sector briefing: 2011 Census night homelessness estimates
 Sector briefing: 2011 Census night homelessness estimates Key points 13 November 2012 The number of people identifiable as experiencing homelessness on Census night 2011 increased by 17% from 89,728 people
CITY USER PROFILE 15 ADELAIDE CITY COUNCIL RESEARCH REPORT
 CITY USER PROFILE 15 ADELAIDE CITY COUNCIL RESEARCH REPORT CONTENTS What is the City User Profile and why do we do it? p. 03 How is CUP data collected? p. 03 What are some of the key findings from CUP
The case for an inwork progression service
 The case for an inwork progression service 1 Contents 1. Introduction 2. Underemployment in the UK 3. Individual characteristics 4. Industry 5. Recommendations 2 Summary of findings Scale of underemployment:
Corporate. Report COUNCIL DATE: April 28, 2008 NO: R071 REGULAR COUNCIL. TO: Mayor & Council DATE: April 28, 2008
 Corporate NO: R071 Report COUNCIL DATE: April 28, 2008 REGULAR COUNCIL TO: Mayor & Council DATE: April 28, 2008 FROM: General Manager, Planning and Development FILE: 6600-01 SUBJECT: 2006 Census Information
Centre for Economic Policy Research
 Australian National University Centre for Economic Policy Research DISCUSSION PAPERS ON THE RISK OF UNEMPLOYMENT: A Comparative Assessment of the Labour Market Success of Migrants in Australia Prem J.
Migrants Fiscal Impact Model: 2008 Update
 11 April 2008 Migrants Fiscal Impact Model: 2008 Update Report by Access Economics Pty Limited for Department of Immigration and Citizenship TABLE OF CONTENTS EXECUTIVE SUMMARY... i 1. Introduction...
Race, Ethnicity, and Economic Outcomes in New Mexico
 Race, Ethnicity, and Economic Outcomes in New Mexico Race, Ethnicity, and Economic Outcomes in New Mexico New Mexico Fiscal Policy Project A program of New Mexico Voices for Children May 2011 The New Mexico
Immigration Visa Guide for ICT Security Specialist
 Immigration Visa Guide for ICT Security Specialist A UNIT OF BRAIN DRAIN CONSULTANTS PRIVATE LIMITED Complete Immigration Visa Guide for ICT Security Specialist A2Z Immi Support Services Index 1. An Insight
EMBARGOED UNTIL THURSDAY 9/5 AT 12:01 AM
 EMBARGOED UNTIL THURSDAY 9/5 AT 12:01 AM Poverty matters No. 1 It s now 50/50: chicago region poverty growth is A suburban story Nationwide, the number of people in poverty in the suburbs has now surpassed
Labor Supply Factors and Labor Availability for the Geneva (Fillmore County) Labor Area
 Labor Area") Labor Supply Factors and Labor Availability for the Geneva (Fillmore County) Labor Area June 2015 Prepared by: Kenneth M. Lemke, Ph.D. Economist Nebraska Public Power District 1414 15 th Street - P.O.
Labor Supply Factors and Labor Availability for the Geneva (Fillmore County) Labor Area June 2015 Prepared by: Kenneth M. Lemke, Ph.D. Economist Nebraska Public Power District 1414 15 th Street - P.O.
ARTICLES. Poverty and prosperity among Britain s ethnic minorities. Richard Berthoud
 Poverty and prosperity among Britain s ethnic minorities Richard Berthoud ARTICLES Recent research provides evidence of continuing economic disadvantage among minority groups. But the wide variation between
How Have Hispanics Fared in the Jobless Recovery?
 How Have Hispanics Fared in the Jobless Recovery? William M. Rodgers III Heldrich Center for Workforce Development Rutgers University and National Poverty Center and Richard B. Freeman Harvard University
IX. Differences Across Racial/Ethnic Groups: Whites, African Americans, Hispanics
 94 IX. Differences Across Racial/Ethnic Groups: Whites, African Americans, Hispanics The U.S. Hispanic and African American populations are growing faster than the white population. From mid-2005 to mid-2006,
how neighbourhoods are changing A Neighbourhood Change Typology for Eight Canadian Metropolitan Areas,
 how neighbourhoods are changing A Neighbourhood Change Typology for Eight Canadian Metropolitan Areas, 1981 2006 BY Robert Murdie, Richard Maaranen, And Jennifer Logan THE NEIGHBOURHOOD CHANGE RESEARCH
CENSUS ANALYSIS. St. BRENDAN s PARISH, FLEMINGTON 2011 Census Details
 CENSUS ANALYSIS The Pastoral Research Office of the Australian Catholic Bishops Conference, auspiced by the Australian Catholic University in Fitzroy, has in January released the 2011 census data for each
How s Life in Hungary?
 How s Life in Hungary? November 2017 Relative to other OECD countries, Hungary has a mixed performance across the different well-being dimensions. It has one of the lowest levels of household net adjusted
It s time for more politicians
 It s time for more politicians The number of members of Parliament and senators has not kept up with Australia s population growth. Increasing the number of federal parliamentarians would give parliamentarians
BLS Spotlight on Statistics: Union Membership In The United States
 Cornell University ILR School DigitalCommons@ILR Federal Publications Key Workplace Documents 9-2016 BLS : Union Membership In The United States Megan Dunn Bureau of Labor Statistics James Walker Bureau
University of California Institute for Labor and Employment
 University of California Institute for Labor and Employment The State of California Labor, 2002 (University of California, Multi-Campus Research Unit) Year 2002 Paper Weir Income Polarization and California
SACOSS ANTI-POVERTY WEEK STATEMENT
 SACOSS ANTI-POVERTY WEEK STATEMENT 2013 2 SACOSS Anti-Poverty Statement 2013 SACOSS ANTI-POVERTY WEEK 2013 STATEMENT The South Australian Council of Social Service does not accept poverty, inequity or
UNEMPLOYMENT IN AUSTRALIA
 UNEMPLOYMENT IN AUSTRALIA Professor Sue Richardson President Introduction Unemployment is a scourge in countries at all levels of economic development. It brings poverty and despair and exclusion from
A Demographic Profile
 Seventh-day Adventists in North America A Demographic Profile North American Division Secretariat Demographic Survey By Monte Sahlin and Paul Richardson November 2008 Introduction This report provides
rebuilding futures State of our Community Report Outer North Brisbane
 rebuilding futures State of our Community Report Outer North Brisbane www.campbellpage.org.au Who are we? Who is Campbell Page? Campbell Page provides employment, rehabilitation, training, and community