An analysis of demographic processes which presently represent important policy areas in Australian cities and regions
|
|
|
- Nigel Hunter
- 5 years ago
- Views:
Transcription


1 An analysis of demographic processes which presently represent important policy areas in Australian cities and regions Graeme J Hugo ARC Australian Professorial Fellow, Professor of Geography and Director of the Australian Population and Migration Research Centre, The University of Adelaide Kevin R Harris Australian Population and Migration Research Centre The University of Adelaide Prepared for National Growth Areas Alliance August 213 Australian Population and Migration Research Centre (APMRC) Incorporating GISCA Geography, Environment and Population School of Social Sciences Ground Floor, Napier Building, North Terrace University of Adelaide, SA 55 Ph: Fax: apmrc@adelaide.edu.au
2
3 3 CONTENTS 3 CONTENTS LIST OF TABLES... 4 EXECUTIVE SUMMARY... 8 CHAPTER 1. Introduction CHAPTER 2. Population change and ageing INTRODUCTION TOTAL POPULATION CHANGE, AGEING SUMMARY CHAPTER 3. International migration INTRODUCTION AUSTRALIAN AND OVERSEAS BORN MAIN BIRTHPLACE COUNTRIES OF MIGRANTS AGE STRUCTURE OF AUSTRALIAN BORN AND OVERSEAS BORN MULTICULTURAL DIVERSITY MIGRATION BY VISA CATEGORY COUNTRY OF BIRTH BY VISA CATEGORY SETTLEMENT TARGET GROUP VISA SUB CLASS SUMMARY CHAPTER 4. Internal migration INTRODUCTION MOBILITY SUMMARY CHAPTER 5. Households and families INTRODUCTION HOUSEHOLDS AND POPULATION GROWTH FAMILY COMPOSITION TENURE CHARACTERISTICS SUMMARY CHAPTER 6. POPULATION TRENDS WITH POLICY IMPLICATIONS APPENDICES
4 4 LIST OF TABLES Table 2:1: Population change, Alliance LGAs, Table 2:2: Proportion of population by cohort, NGAA LGAs, 21, 26 & Table 2:3: Population change by age, NGAA LGAs, and Table 2:4: Average annual change by age, NGAA LGAs, and Table 2:5: Change in cohort representation, Alliance LGAs, & Table 2:6: Dependent and Independent segments of the pop. 21, 26 & Table 3:1: Australian born and overseas born, NGAA LGAs, Table 3:2: Net overseas migration, NGAA LGAs, Table 3:3: Top Ten Birthplace Countries of Migrants, Alliance, Table 3:4: Age structure, Australian born and overseas born, NGAA LGAs, Table 3:5: Age structure, Australian born and overseas born, NGAA LGAs, Table 3:6: Australian, MES and NES born concentrations, NGAA LGAs, Table 3:7: Selected regions of birth, Persons, Table 3:8: Persons born in selected regions, Table 3:9: Australian born persons with overseas born parent, Table 3:1: Data maintained on DIAC Settlement Reporting Facility Table 3:11: Migration stream by visa category, Alliance LGAs, Table 3:12: Skilled migration entrants, Alliance LGAs, Table 3:13: Family migration entrants, Alliance LGAs, Table 3:14: Humanitarian migration entrants, Alliance LGAs, Table 3:15: Total Skilled, Family & Humanitarian Visas, Alliance LGAs, Table 3:16: Alliance LGAs ranked by skilled entrants, 21, 26, 212, Table 3:17: Alliance LGAs ranked by family entrants, 21, 26, 212, Table 3:18: Alliance LGAs ranked by humanitarian, 21, 26, 212, Table 3:19: Alliance LGAs ranked by total entrants, 21, 26, 212 and Table 3:2: Migration intakes compared with LGA share of state population, Table 3:21: Birthplace by visa category, NSW Alliance LGAs, Table 3:22: Birthplace by visa category, Victoria Alliance LGAs, Table 3:23: Birthplace by visa category, Queensland Alliance LGAs, Table 3:24: Birthplace by visa category, WA Alliance LGAs, Table 3:25: Birthplace by visa category, SA Alliance LGAs, Table 3:26: Settlement Target Group, Alliance LGAs, Table 4:1: Internal mobility, Alliance LGAs, Table 4:2: Internal mobility, Alliance LGAs,
5 5 Table 5:1: Household and Population growth, NGAA LGAs, Table 5:2: Average household size, NGAA LGAs, Table 5:3: Couple families with no children, NGAA LGAs, Table 5:4: Couple families with children, NGAA LGAs, Table 5:5: Single parent families, NGAA LGAs, Table 5:6: Lone households, NGAA LGAs, Table 5:7: Group households, NGAA LGAs, Table 5:8: Households in fully owned dwellings, NGAA LGAs, Table 5:9: Households in mortgaged dwellings, NGAA LGAs, Table 5:1: Households in rented accommodation, NGAA LGAs,
6 6 LIST OF FIGURES Figure 2.1: Intercensal Population Change, Age & Sex, NSW, 21 and Figure 2.2: Intercensal Population Change, Age and Sex, Victoria, 21 and Figure 2.3: Intercensal Population Change, Age and Sex, Queensland, 21 and Figure 2.4: Intercensal Population Change, Age and Sex, WA, 21 and Figure 2.5: Intercensal Population Change, Age and sex, SA, 21 and Figure 2.6: Intercensal Population Change, Age and Sex, Australia, 21 and Figure 2.7: Intercensal Population Change, Age and Sex, NSW, 26 and Figure 2.8: Intercensal Population Change, Age and Sex, Victoria, 26 and Figure 2.9: Intercensal Population Change, Age and Sex, Queensland, 26 and Figure 2.1: Intercensal Population Change, Age and Sex, WA, 26 and Figure 2.11: Intercensal Population Change, Age and Sex, SA, 26 and Figure 2.12: Intercensal Population Change, Age and sex, Australia, 26 and Figure 2.13: Age and Sex Structure, Alliance LGAs, NSW, 21 and Figure 2.14: Age and Sex Structures, Alliance LGAs, Victoria, 21 and Figure 2.15: Age and Sex Structures, Alliance LGAs, Queensland, 21 and Figure 2.16: Age and Sex Structures, Alliance LGAs, WA, 21 and Figure 2.17: Age and Sex Structures, Alliance LGAs, SA, 21 and Figure 2.18: Age and Sex Structures, Australia, 21 and Figure 2.19: Age and Sex Structures, Alliance LGAs, NSW, 26 and Figure 2.2: Age and sex structures, Alliance LGAs, Victoria, 26 and Figure 2.21: Age and Sex Structures, Alliance LGAs, Queensland, 26 and Figure 2.22: Age sex structures, Alliance LGAs, Western Australia, 26 and Figure 2.23: Age and Sex Structures, Alliance LGAs, South Australia, 26 and Figure 2.24: Age and sex structures, Australia, 26 and Figure 3.1: Australian and Overseas born age structure, Alliance LGAs, NSW, Figure 3.2: Australian and Overseas born age structure, Alliance LGAs, Vic, Figure 3.3: Australian and Overseas born age structure, Alliance LGAs, Qnslnd, Figure 3.4: Australian and Overseas born age structure, Alliance LGAs, WA, Figure 3.5: Australian and Overseas born age structure, Alliance LGAs, SA, Figure 3.6: Australian and Overseas born age structure, Alliance LGAs, NSW, Figure 3.7: Australian and Overseas born age structure, Alliance LGAs, Vic, Figure 3.8: Australian and Overseas born age structure, Alliance LGAs, Qnslnd, Figure 3.9: Australian and Overseas born age structure, Alliance LGAs, WA, Figure 3.1: Australian and Overseas born age structure, Alliance LGAs, SA,
7 7 Figure 3.11: Entrants by visa category, NSW Alliance members, Figure 3.12: Entrants by visa category, Victoria Alliance members, Figure 3.13: Entrants by visa category, Queensland Alliance members, Figure 3.14: Entrants by visa category, SA Alliance members, Figure 3.15: Entrants by visa category, WA Alliance members,
8 8 EXECUTIVE SUMMARY The period was one of unprecedented population growth in Australia the population increased by 1.89 million or 9.2 percent compared with 1.18 million (6.1 percent) between 21-6 (ABS, 213). This growth brought with it a number of challenges and opportunities for Australia. However, this growth is not randomly distributed across Australia. One of the main areas to have experienced this growth is the outer metropolitan areas of Australia s mainland capital cities. This report summarises some major dimensions of recent population dynamics in the local government areas located in these zones in Australian capitals which are part of the National Growth Areas Alliance. Understanding these population dynamics within Alliance LGAs is vital as they present a number of challenges and opportunities with important policy implications: The LGAs are absorbing a disproportionately large share of national growth in both population and households twice their proportionate share on average but greater in several LGAs. They are absorbing a disproportionate share of growth in the dependent children and youth groups. While they have a lower share of the nation s rapidly growing aged population, it is growing faster in Alliance LGAs than in the nation as a whole. Alliance LGAs absorb a disproportionately large share of new immigrants settling in Australia this is especially notable for humanitarian migrants, almost 1 in 3 of whom settle in these LGAs. Since these groups have especially significant needs of support in the early years of settlement, this represents an important feature of several of the LGAs. Alliance LGAs are characterised by immigrant settlement of particular groups including those from Mainly English Speaking backgrounds (especially young families), Indian background, Fijian and Philippines-born. More than half of residents in these areas are a migrant or the child of a migrant. Alliance LGAs have a disproportionately large share of persons who moved within Australia during the period. This is an important part of the changing dynamics of these areas and can create challenges for infrastructure and service provision. There is a dominance of working families with mortgages in these areas. There is a disproportionate representation of couples and single parent families with children. This Report aims to provide the NGAA with background information and data as a tool that can inform their representations to various levels of government on the need for appropriate infrastructure to accommodate changing population compositions with its membership group. Accordingly, the principal task for the Report is to prepare a narrative around a range of data relating to five key demographic processes: Population Change and Growth Ageing Ethnic Diversity Internal Mobility Households and Families
9 9 Population Increase and Growth Rates In 26 the NGAA council areas contained 14.7 percent of Australia s total population, however over the period they absorbed 3.4 percent of the nation s population growth. By 211 its share of the entire national population was 15.9 percent. The total NGAA population increased from 2.6 million in 21 to 3.4 million in 211. This represents an important mismatch because many allocations of resources are based on the census population rather than on growth. It is important to note that there is some variation between the NGAA council areas in their growth rates. Overall they grew at twice the rate (3.2 percent per annum) as the nation as a whole (1.6 percent per annum) over the period. While there were some areas which grew at below the national average growth rate, there were a number which grew at more than three times the national rate. Whereas the total population within the NGAA LGAs increased by around 321, persons between 21 and 26, the size of the increase in the ensuing period(26 to 211) was 57 percent greater than that for In terms of reasons for this, fertility and migration, both international and internal, are probably significant. With respect to fertility, in absolute terms, the years cohort increased nearly four times more during than in the previous five year period and, as would be expected, we also saw large increases in the years cohort, the group most likely responsible for the growth in the years cohort. Almost one in five Australian children aged in 211 live in the Alliance LGAs and indeed this is the case for all dependent age children and has major implications for the growth in demand for child care, education, recreation opportunities and other services. Ageing of the population The growth of the older population is both a challenge and an opportunity for any community. It is a challenge in terms of the greatly increased numbers of older people who will place pressure on a range of services at a time when workforce growth is slowing. However, it is an opportunity to harness the talents of older people in a way which can add to any area s sustainability, prosperity and equity goals. The ageing crunch in most areas will not hit until the 22s when the last of the baby boomers moves into older age - around a decade from now - but if the crunch is to be met successfully there must be appropriate planning and policy development now to put in place measures to accommodate the pressures generated by an ageing population. However it must also be remembered that increasingly older people are remaining in the workforce longer - particularly those engaged in the service industry and white collar employment- and this will slightly delay the shift in the dependency ratios as this group continue to work and pay taxes. It should be noted that the 65+ population are under-represented in the region as a whole with 11.5 percent of the nation s older people living in those areas. Nevertheless, there are some LGAs where there is an overrepresentation of older persons. Moreover there was a growth of the 65+ in all of the LGAs. It needs to be noted that the 65+ can face particular challenges. This means that accessibility to public transport and to services is sometimes more difficult than it is in middle and inner suburbs, and housing needs and preference may change over time. This can present challenges to older people who are living alone, who do not have access to a motor vehicle and/or who are still living in the large family home.
10 1 Two evolving elements associated with the growth of the older population in NGAA LGAs should be especially noted: There has been especially rapid growth of the years early baby boomers age group in Alliance LGAs. This presages an impending rapid expansion of the 65+ population as these residents potentially age in place in the future. There is an increasing pattern for aged care institutions to locate in NGAA LGAs to take advantage of availability of greenfield sites and cheaper land costs. The number of such institutions in the LGAs increased from 252 in 26 to 273 in 211. International Migration In Australia international migration has been a significant contributor to population growth from the 195s onwards. In 211, the number of overseas born in Australia was close to 5.3 million, representing 26 percent of the total Australian population. Between 21 and 26, net international migration to Australia was 311, 435, while in the following five year period to 211, net international migration was over 876,. In 211, at the Alliance level, 3.7 percent of the total population, almost one million people, were born overseas. This representation had increased from 27.2 percent of total population or almost 67,, in 21. Significantly, the overseas born in the total population, at the Alliance level, is around four percent higher than the levels of overseas born in the total Australian population. Therefore, at the total level, overseas born persons are a significant proportion of communities in most NGAA LGAs. It must be remembered though that the overseas-born population includes many people who have been living in Australia for a very long time, this is not related only to new migrants. However, it does show a representation of Australia s diversity. Between 21 and 26, net international migration within all the NGAA LGAs was just over 93, migrants. In the following period, , the significance of international migration in the Alliance LGAs increased enormously, with net international migration increasing by 15 percent to 233,52. Significantly, no LGA experienced net international migration loss indicating that migration plays a considerable role in population dynamics for Alliance LGAs and four LGAs, Wyndham, Casey, Wanneroo and Blacktown had increases of over 2, migrants between 26 and 211. At the Alliance level, the Australian born population comprised just short of two thirds of the total population, with Mainly English Speaking countries (MES) born migrants comprising 21.8 percent and persons from Non-English Speaking countries (NES) representing 12.5 percent of total population. Compared with the situation prevailing at the national level, the NGAA LGAs have a greater concentration than might be expected of MES born persons, while for the Australian and NES born populations, the Alliance levels are less than those prevailing within the greater Australian context. What this suggests is that MES born persons are attracted to Alliance LGAs in greater proportions than might be expected based on their share of the Australian population. However, this overconcentration of MES born persons is confined to Alliance LGAs situated in Queensland, Western Australia and South Australia. All the Alliance LGAs in New South Wales and Victoria have MES born concentrations less than the Australian level. In terms of NES born persons, most Alliance LGAs are above the national concentration, and in this case they are distributed more uniformly among the states. When the overall situation prevailing at the Alliance level is compared with that for Australia, it can be seen that in terms of where migrants come from, the Alliance situation is
11 11 fairly representative of the situation prevailing at the Australia level, with any difference being less than one percent. Generally Alliance LGAs had higher than expected levels of Australian born persons with an overseas born parent(s) second generation migrants. For the Alliance LGAs this represented 51.4 per cent of the Australian born population, compared to 39.1 per cent of the total Australian born population. This suggests that for most Alliance LGAs there is a strong and sustained connection to Australia s migration program, and that it is highly likely that this will have policy implications for these LGAs and potentially migration rates in the future as migrant settlement is often related to existing social networks and the development or existence of ethnic communities. In the 21 to 212 period, some 24,486 migrants with a skilled visa settled in the various member LGAs. This was nearly double the number of migrants arriving under the family reunion scheme. During the same period there were 19, migrants arriving in Australia indicating an intention to settle in an Alliance LGA. Finally, numbers arriving into Alliance LGAs under the government s humanitarian refugee scheme amounted to some 45,536 immigrants during the period In the report an estimate is also made of the share of the burden of settling migrants from different visa categories that is undertaken by Alliance LGAs. Each Alliance LGA s share of its state population in 211 is compared with its share of each of the three migration streams Humanitarian, Family and Skilled visa - arriving in their state for 211. The argument here is that if an LGA has a certain proportion of its state population it might be expected to receive a similar proportion of the state s migration intake. Where this does not occur, it indicates that certain processes are at work to cause an imbalance between proportion of state population and proportion of migration intake received. These imbalances can be an indication of the significant role LGAs carry in settling migrants into their areas. LGAs which received a share of family migration greater than might be expected on the basis of their share of state population were Blacktown, Liverpool, Casey, Hume, Whittlesea, Wanneroo, Cockburn and Kwinana. For skilled migration, LGAs receiving more immigrants with this visa category were Wyndham, Whittlesea, Wanneroo, Cockburn and Rockingham. In the case of humanitarian stream migrants, LGAs which appear to be shouldering the burden of this group, relative to their share of state population, are Blacktown, Liverpool, Casey, Wyndham, Hume, Logan, Wanneroo and Playford. Three LGAs had shares of each migration stream above their share of their state s population. These LGAs Wyndham, Whittlesea and Wanneroo are clear migrant reception centres within the Alliance, and in their strong migrant populations may raise a number on planning and policy issues within these jurisdictions. The mix of visa categories among immigrants settling in an area can have an important impact on demand for services. The data presented shows the mix of visa categories of permanent migrants arriving in Australia between 26 and 211 and settling in the Alliance LGAs. This shows an overall overrepresentation with one in five permanent migrants arriving in Australia over the period settling in the Alliance LGAs. Especially significant, however, is that 28.7 percent of all humanitarian arrivals settled in Alliance LGAs. This is particularly important because they are heavily dependent on assistance in their early years of settlement in Australia. Again, there are important variations between Alliance LGAs especially in relation to humanitarian migrant settlement.
12 12 Internal Mobility Australians are the most mobile society in the contemporary world. The 211 Census indicated that 15.8 percent of Australians had moved their permanent place of residence during the previous five years, the highest rate of residential mobility of any country. The data shows that, during the period, a group of LGAs Blacktown, Campbelltown, Liverpool, Penrith, Logan and Armadale which experienced net migration losses during the period. In these LGAs, net migration losses ranged from 2,115 (Armadale) to 1,741 (Blacktown). A second group of LGAs experienced substantial net migration gains. In these LGAs net gains from internal migration ranged from 11,56 in Casey to 17,386 in Moreton Bay. LGAs with gains between these extremes were Wyndham, Melton, Ipswich and Wanneroo. A third group of LGAs had only moderate to small growth from net internal migration, and included Whittlesea, Serpentine-Jarrahdale, Kwinana and Playford Any analysis of internal mobility will identify sinks and sources - areas that are attractive to people and areas that are unattractive for a variety of reasons. LGAs which experience gains are considered sinks - they have people pouring into them to take advantage of what they offer. These LGAs are attractive in a variety of ways and indicators of the reasons for population increase lies partly in examining the social characteristics (such as age, income, education) of the increasing population. In the same way, source LGAs are areas that experience population losses. These LGAs may have various drivers behind population loss such as loss of employment opportunities, lack of higher education options, poor commuter routes to cities, escalating property prices and so forth. In order for any community to understand their role as a sink or source location it is important to examine the social and demographic characteristics of population change over time. This will give some indication of who is leaving and/or who is arriving. Households and Families When Alliance data are compared with the situation prevailing at the Australia level, the comparisons are revealing. Household growth during the period was twice the rate which occurred at the Australia level, while in the following five year period to 212 average annual household growth was more than twice the rate prevailing in Australia. The same observations can be made in respect to average annual change in population. The clear conclusion is that in the NGAA LGAs population growth and household growth has been occurring at levels around twice those occurring at the wider Australia level. The NGAA membership comprises, therefore, LGAs that are accommodating huge population and associated household growth. Couple families with children are the dominant family type in Australian communities. While there was a slight downturn in the proportion of couple families with children across the Alliance LGAs when benchmarked against the situation prevailing in Australia the levels in the Alliance group are considerably higher than those prevailing at the Australia level. This shows the significance of this household type within the Alliance, and it is therefore an element of the LGAs demography that demands policy attention of various kinds. In the period, average annual growth in this family type was 1.4 percent, rising to 2.9 percent in the period. These levels are considerably higher than the levels prevailing for Australia as a whole at.3 and 1.4 percent respectively. In the NGAA LGAs lone households represented 17.6 percent of all households in 211, an increase of one percent on the concentration in 21. These levels are low when benchmarked against the situation for Australia, where the concentration of lone households
13 13 has remained fairly steady at around 23 percent between 21 and 211. Again, this is indicative of the strong representation of young families in the NGAA LGAs, with lower numbers of older people who predominate in the single person household category. However, the growth rate for this household type has been similar to that for couple only families. At the aggregate level, lone households grew by 3.8 percent between 21 and 26, declining marginally to 3.4 percent in the period. Compared with growth rates of the household type in Australia, those occurring in the Alliance are significant. Australia reported average annual growth of just 1.5 percent in the period, and 1.7 percent in the following five year period. It means that this household type is a developing phenomenon within the Alliance LGAs and one that may attract the attention of planners and policy makers within the various jurisdictions. At the aggregate level, it is clear that within the Alliance LGAs, the proportions of households living in fully owned housing has fallen from almost one third in 21 to just under a quarter in 211. This tendency has occurred in every LGA within the Alliance during the ten years to 211. The main driving factor in this trend has been an expanding housing market in these growth areas in which increasing numbers of households are in the mortgage repayment phase of their housing careers. The same tendencies can be noted at the Australia level, although nationally there are higher proportions of households owning their dwelling outright. This is to be expected because the Alliance comprises growth LGAs where outright ownership will be less than the number of relatively new households in the process of paying off their mortgage. It also points to the higher levels of young families (who are less likely to have paid off a mortgage) in Alliance LGAs compared to Australia as a whole. In Summary The following table highlights the key population figures that are impacting and shaping the Alliance LGAs today. Alliance LGAs as a Percent of Australia s Population as a Whole Source: ABS 211 Census Total population 15.9 Population growth Household Growth All migrants 19. Recent migrants 17.5 Persons aged Persons aged less than Single parent families 18.3 Internal migrants 16.5 Persons aged 19.4 Data are presented in this report, together with an accompanying narrative, to inform future policy analysis and strategies by the member LGAs of the NGAA. The report does not, therefore, have a key aim of necessarily providing policy and planning direction. Rather, it has been prepared as a tool that should be useful to planners in defining policy and direction within their respective jurisdictions.
14 14
15 15 CHAPTER 1. INTRODUCTION This report is a response to the National Growth Areas Alliance s (variously referred to as the NGAA or the Alliance) need for background information that can used as a tool to inform their representations to various levels of government on the need for appropriate infrastructure to accommodate changing population compositions in its member local government areas that have occurred as a result of a number of developing social and demographic processes. In the report, data collection has been confined to the 25 NGAA member LGAs (see Box 1). Box 1: The National Growth Alliance (NGAA) Local Government Areas New South Wales Victoria Queensland Western Australia South Australia Blacktown, Camden, Campbelltown, Liverpool and Penrith Casey, Cardinia, Wyndham, Melton, Hume and Whittlesea Moreton Bay, Logan and Ipswich Gosnells, Wanneroo, Swan, Cockburn, Mandurah, Serpentine-Jarrahdale, Kwinana, Armadale and Rockingham Mount Barker and Playford All data presented in this report is based on ABS Census data, both 211 Census data and Time Series data to indicate population trends from 21, 26 and The report is based around a range of data relating to four key demographic processes which presently represent important policy areas in Australian cities and regions, including areas embraced by the NGAA membership. These are: Ageing Ethnic Diversity Internal mobility Households and Families These data are presented, together with an accompanying narrative, to inform future policy analysis and strategies by the member LGAs of the NGAA. The report does not, therefore, have a key aim of necessarily providing policy and planning direction. Rather, it has been prepared as a tool that should be useful to planners in defining policy and direction within their respective jurisdictions. While providing a reasonably comprehensive commentary to accompany the data that have been assembled, it is not the role of the report to indicate areas of policy reforms, or approaches that might be taken to achieve these. However, that is not to 1 Please note that ABS Time Series data (using Place of Enumeration) and 211 Census data (through ABS Table Builder using Usual Place of Residence and excluding overseas visitors) is not available for Estimated Resident Population (ERP) data and therefore some population figures may be lower than those cited by the ABS for ERP. ERP population figures are based on census counts by place of usual residence (excluding overseas visitors in Australia), with an allowance for net census undercount, to which are added the number of Australian residents estimated to have been temporarily overseas at the time of the census. ERP figures are calculated as of the 3 th of June, not from the Census night figures in August.
16 16 say that some of the commentary may intuitively indicate areas demanding policy attention, either presently, or at some future time. The report begins with a consideration of population change during the period, including some commentary on the developing issue of ageing in Australia, Chapter Two. It then moves on in Chapter Three to a presentation of material related to international migration, because it is a significant contributor to population change in any area. In this section issues associated with multicultural diversity, the age structure of the overseas born, and the ageing process within this group is considered. This includes a comprehensive array of data relating to international migration, and the characteristics of migrants, collected by the Census. However, data on the migration, or visa, status of migrants cannot be gained from Census data. However, these migrant characteristics can have huge implications for planners and policy makers who want to meet the needs of migrants with particular social and economic characteristics associated with their visa status. Recognising this, the report has accessed data maintained by the Department of Immigration and Citizenship (DIAC) on its Settlement Reporting Facility (SRF). In Chapter Four the report explores how population in the member LGAs has changed through internal mobility, for both the and periods. Chapter Five provides an exploration of the social processes currently at work in Australia which significantly impact on the structure of households and families within communities. In this section, the report will identify a number of developing tendencies for households and families, based on evidence from the 21, 26 and 211 Censuses. Finally, Chapter Six presents a short précis of significant policy issues that Alliance LGHAs may wish to consider for future planning and resource allocation.
17 17 CHAPTER 2. POPULATION CHANGE AND AGEING 2.1 INTRODUCTION The principal aim in this chapter is to present a series of data relating to population change in the Alliance LGAs, along with a narrative designed to show and explain the main population trends occurring in each of the member LGAs. Wherever possible, the data are benchmarked against the situation prevailing in both the Alliance as a whole and for Australia. The emphasis is on trends through temporal change within each of the LGAs. The aim is to allow readers to identify any implications the data may present for them in their own contexts. In this chapter: We show absolute intercensal population change by age cohort within each Alliance LGA for both the and periods. Absolute numbers are often useful in determining whether or not policy action is necessary. Intercensal change data are also presented as proportions of total population to show the situation in each LGA with the impact of areal size of LGA eliminated. We look closely at change in various cohorts the very young, school aged children, the upper school/university/tafe and early workforce group, the early career workforce, the mature aged workforce, older workforce/early retirement group, young-old, old-old and the very old. Population ageing is examined, looking at cohorts whose representation in the total population has either increased, decreased or remained steady. This is important information in terms of understanding the ageing process in any area. 2.2 TOTAL POPULATION CHANGE, Table 2:1 shows total population numbers in each of the Alliance LGAs for each of 21, 26 and 211, as well as population change for the and periods. Data for population change are also compared with rates prevailing within the total Alliance membership and for Australia. The table shows that most LGAs have experienced substantial population change at each of the Censuses since 21. Three LGAs, Campbelltown, Penrith and Armadale experienced decline during the period, while all LGAs experienced growth in the following period to 211. In terms of average annual growth, there are a number of key points emerging from this table. Firstly, in the period 15 LGAs had growth rates that exceeded the level for all Alliance members. Further, all but four had growth rates greater than that prevailing for Australia. Hence, significant population growth was a feature of Alliance LGAs during the period. In the subsequent period, , 13 LGAs experienced growth at rates greater than that prevailing within the Alliance membership. Relative to growth at the Australia level, only two LGAs, Campbelltown and Penrith, had lower rates of growth in the period. Hence, during the period, Alliance LGAs generally experienced high rates of total population growth.
18 18 Table 2:1: Population change, Alliance LGAs, Source: ABS Time Series Profile, Local Government Area Population Population change Average annual change, % Blacktown (C) Camden (A) Campbelltown (C) Liverpool (C) Penrith (C) Casey (C) Cardinia (S) Wyndham (C) Melton (S) Hume (C) Whittlesea (C) Moreton Bay (R) Logan (C) Ipswich (C) Gosnells (C) Wanneroo (C) Swan (C) Cockburn (C) Mandurah (C) Serpentine-Jarrahdale (S) Kwinana (T) Armadale (C) Rockingham (C) Mount Barker (DC) Playford (C) Total Australian population When comparing absolute population numbers it may be that large LGAs may contain a bigger population. Comparing absolute population numbers across LGAs that vary in size may not necessarily be constructive or informative. However, it is the case that absolute population numbers may be of critical importance in terms of determining community need and the level of service provision required to meet this need. Hence, the series of age and sex structures below show, in absolute terms, the intercensal change by age cohort for each of the Alliance LGAs for the 21 to 26 period. The series is useful in terms of: Identifying the extent of population growth, or decline, in any cohort. Developing hypotheses to account for these trends. Generating policy to accommodate these trends. Comparing tendencies between member LGAs Benchmarking the situation in Alliance LGAs and that prevailing in Australia.
19 19 Figure 2.1: Intercensal Population Change, Age and Sex, New South Wales, 21 and 26 Source: ABS Time Series Profile, Blacktown, 21 and shaded Liverpool 21 and shaded 3, 2, 1, 1, 2, 3, 2, 15, 1, 5, 5, 1, 15, 2, Penrith 21 and shaded Campbelltown, 21 and shaded 2, 15, 1, 5, 5, 1, 15, 2, 15, 1, 5, 5, 1, 15, Camden, 21 and shaded 6, 4, 2, 2, 4, 6,
20 Figure 2.2: Intercensal Population Change, Age and Sex, Victoria, 21 and 26 Source: ABS Time Series Profile, Casey 21 and shaded Melton 21 and shaded 3, 2, 1, 1, 2, 3, 8, 6, 4, 2, 2, 4, 6, 8, 1, Cardinia 21 and shaded Hume 21 and shaded 6, 4, 2, 2, 4, 6, 15, 1, 5, 5, 1, 15, Wyndham 21 and shaded Whittlesea 21 and shaded 15, 1, 5, 5, 1, 15, 15, 1, 5, 5, 1, 15,
21 21 Figure 2.3: Intercensal Population Change, Age and Sex, Queensland, 21 and 26 Source: ABS Time Series Profile, Moreton Bay 21 and shaded Ipswich 21 and shaded 3, 2, 1, 1, 2, 3, 15, 1, 5, 5, 1, 15, Logan 21 and shaded 3, 2, 1, 1, 2, 3, Figure 2.4: Intercensal Population Change, Age and Sex, Western Australia, 21 and 26 Source: ABS Time Series Profile, Gosnells 21 and shaded Swan 21 and shaded 8, 6, 4, 2, 2, 4, 6, 8, 1, 5, 5, 1, Wanneroo 21 and shaded Cockburn 21 and shaded 15, 1, 5, 5, 1, 15, 8, 6, 4, 2, 2, 4, 6, 8,
22 22 Mandurah 21 and shaded Armadale 21 and shaded 6, 4, 2, 2, 4, 6, 6, 4, 2, 2, 4, 6, Serpentine-Jarrahdale 21 and shaded Rockingham 21 and shaded 1,5 1, 5 5 1, 1,5 8, 6, 4, 2, 2, 4, 6, 8, Kwinana 21 and shaded 2, 1,5 1, 5 5 1, 1,5 2, Figure 2.5: Intercensal Population Change, Age and sex, South Australia, 21 and 26 Source: ABS Time Series Profile, Mount Barker 21 and shaded Playford 21 and shaded 3, 2, 1, 1, 2, 3, 8, 6, 4, 2, 2, 4, 6, 8,
23 23 Figure 2.6 allows each of the preceding age sex intercensal change structures to be compared with the situation prevailing for Australia during the same period. Figure 2.6: Intercensal Population Change, Age and Sex, Australia, 21 and 26 Source: ABS Time Series Profile, Australia 21 and shaded (million) In the following graph series, the same approach as above is used to show actual intercensal change for each cohort for the 26 to 211 period. The series can be used in the same way as suggested for the pervious series, namely: Identifying the extent of population growth, or decline, in any cohort. Developing hypotheses to account for these trends. Generating policy to accommodate these trends. Comparing tendencies between member LGAs Benchmarking the situation in Alliance LGAs and that prevailing in Australia. However, in addition, the two series can be compared to determine the nature of population change in each of the cohorts between the and periods. For example, you can see in Figure 2.7 that while Blacktown and Camden have experienced population increases in all ages between 26 and 211, for Penrith and Campbelltown this growth has been in the older age cohorts only. Figure 2.7: Intercensal Population Change, Age and Sex, New South Wales, 26 and 211 Source: ABS Time Series Profile, Blacktown 26 and shaded Camden 26 and shaded 3, 2, 1, 1, 2, 3, 6, 4, 2, 2, 4, 6,
24 24 Campbelltown 26 and shaded 15, 1, 5, 5, 1, 15, Penrith 26 and shaded 15, 1, 5, 5, 1, 15, Liverpool 26 and shaded 2, 15, 1, 5, 5, 1, 15, 2, Figure 2.8: Intercensal Population Change, Age and Sex, Victoria, 26 and 211 Source: ABS Time Series Profile, Casey 26 and shaded Wyndham 26 and shaded 25,2,15,1, 5, 5, 1,15,2,25, 2, 15, 1, 5, 5, 1, 15, 2, Cardinia 26 and shaded 8, 6, 4, 2, 2, 4, 6, 8, Hume 26 and shaded 15, 1, 5, 5, 1, 15,
25 25 Melton 26 and shaded Whittlesea 26 and shaded 15, 1, 5, 5, 1, 15, 15, 1, 5, 5, 1, 15, Figure 2.9: Intercensal Population Change, Age and Sex, Queensland, 26 and 211 Source: ABS Time Series Profile, Moreton Bay 26 and shaded Ipswich 26 and shaded 4, 3, 2, 1, 1, 2, 3, 4, 15, 1, 5, 5, 1, 15, Logan 26 and shaded 3, 2, 1, 1, 2, 3, Figure 2.1: Intercensal Population Change, Age and Sex, Western Australia, 26 and 211 Source: ABS Time Series Profile, Gosnells 26 and shaded 1, 5, 5, 1, Serpentine-Jarrahdale 26 and shaded 2, 1,5 1, 5 5 1, 1,5 2,
26 26 Wanneroo 26 and shaded Kwinana 26 and shaded 15, 1, 5, 5, 1, 15, 3, 2, 1, 1, 2, 3, Swan 26 and shaded 1, 5, 5, 1, Armadale 26 and shaded 6, 4, 2, 2, 4, 6, Cockburn 26 and shaded 8, 6, 4, 2, 2, 4, 6, 8, Rockingham 26 and shaded 1, 5, 5, 1, Mandura 26 and shaded 6, 4, 2, 2, 4, 6,
27 27 Figure 2.11: Intercensal Population Change, Age and Sex, South Australia, 26 and 211 Source: ABS Time Series Profile, Mount Barker 26 and shaded Playford 26 and shaded 3, 2, 1, 1, 2, 3, 8, 6, 4, 2, 2, 4, 6, 8, Figure 2.12 allows each of the preceding age sex intercensal change structures to be compared with the situation prevailing for Australia during the same period. Figure 2.12: Intercensal Population Change, Age and sex, Australia, 26 and 211 Source: ABS Time Series Profile, Australia 26 and shaded (million) While comparing numbers over time within one LGA offers insight into population trends and change comparing absolute numbers between LGAs is usually not appropriate, due mainly to the varying areal sizes of LGAs. Appendix One shows population numbers for each of the NGAA LGAs by each age cohort at the 21, 26 and 211 Censuses. The table is essentially for reference, with its main intention to provide an indication of the magnitude of numbers in each cohort at each Census, and to give an initial indication of the nature of any change through time in any cohort. Accordingly, Table 2:2 converts the actual numbers in any cohort as a percentage of the LGA s total population. In the process, the concentrations in one LGA can properly be compared with those in other LGAs. The key attributes of Table 2:2 are that it allows for an indication of: the dominant cohorts in any LGA. the size of the young, school aged, youth, early workforce, pre-retirement, young-old and old-old cohorts to be gauged how these relative concentrations vary between the various Alliance LGAs. how these relative concentrations are changing temporally.
28 28 Table 2:2: Proportion of population in each cohort, NGAA LGAs, 21, 26 and 211 Source: ABS Time Series Profile, Local Government Area Blacktown (C) Camden (A) Campbelltown (C) Liverpool (C) Penrith (C) Casey (C) Cardinia (S) Wyndham (C) Melton (S) Hume (C) Whittlesea (C) Moreton Bay (R) Logan (C) Ipswich (C) Gosnells (C) Wanneroo (C) Swan (C) Cockburn (C) Mandurah (C) Serpentine-Jarrahdale (S) Kwinana (T) Armadale (C) Rockingham (C) Mount Barker (DC) Playford (C) Total Total Population Blacktown (C) Camden (A) Campbelltown (C) Liverpool (C) Penrith (C) Casey (C) Cardinia (S) Wyndham (C) Melton (S) Hume (C) Whittlesea (C) Moreton Bay (R) Logan (C) Ipswich (C) Gosnells (C) Wanneroo (C) Swan (C) Cockburn (C) Mandurah (C) Serpentine-Jarrahdale (S) Kwinana (T) Armadale (C) Rockingham (C) Mount Barker (DC) Playford (C) Total Temporal change (change over time) within each cohort can provide insights into the presence and extent of one or more social processes that may be occurring in any LGA. For example, increases in numbers aged years will indicate high fertility levels in the population, which should be matched by increases in the number of young persons in the early family formation stage of the life cycle. On the other hand, increasing proportions in
29 29 the older age cohorts will indicate that population ageing is occurring, along with a range of implications associated with this process. Hence, Table 2:3 shows the actual change of population in each cohort for the and periods. Table 2:3: Population change by age, NGAA LGAs, and Source: ABS Time Series Profile, Local Government Area Blacktown (C) Camden (A) Campbelltown (C) Liverpool (C) Penrith (C) Casey (C) Cardinia (S) Wyndham (C) Melton (S) Hume (C) Whittlesea (C) Moreton Bay (R) Logan (C) Ipswich (C) Gosnells (C) Wanneroo (C) Swan (C) Cockburn (C) Mandurah (C) Serpentine-Jarrahdale (S) Kwinana (T) Armadale (C) Rockingham (C) Mount Barker (DC) Playford (C) Total Total Population Blacktown (C) Camden (A) Campbelltown (C) Liverpool (C) Penrith (C) Casey (C) Cardinia (S) Wyndham (C) Melton (S) Hume (C) Whittlesea (C) Moreton Bay (R) Logan (C) Ipswich (C) Gosnells (C) Wanneroo (C) Swan (C) Cockburn (C) Mandurah (C) Serpentine-Jarrahdale (S) Kwinana (T) Armadale (C) Rockingham (C) Mount Barker (DC) Playford (C) Total Careful perusal across the rows enables the magnitude of change for each cohort during each period to be seen. It is not within the scope of this report to provide a commentary on change for each LGA, but at the Alliance level the following tendencies seem apparent. Firstly, whereas the total population within the NGAA LGAs increased by around 321, between
30 3 21 and 26, the size of the increase in the ensuing period was 57 percent greater than that for Secondly, in terms of reasons for this, fertility and migration, both international and internal, are probably significant. Within the individual cohorts, the following points at the Alliance level can be made: In absolute terms, the years cohort increased nearly four times more during than in the previous five year period. Large increases also occurred in the years cohort, the group most likely responsible for the growth in the years cohort. Lesser rates of change occurred for years and years cohorts, while lowest rates of change between and occurred in the, and cohorts. The growth in was less than that for the period for the years and years cohorts. This provides an indication of the kinds of trends and tendencies that are likely to be identified if the situation in each of the LGAs is carefully scrutinised. As can be seen in Appendix One however, actual numbers can be related to the areal size of the LGA, any real comparison between LGAs can only be made by using percentages, or other measures, that relate change to a rate of some kind. Hence, in Table 2:4, average annual change for each cohort in each LGA is shown for the two periods and This table can be used to provide some commentary on trends within the Alliance LGAs by age group over time. As an overview of these trends the following section looks at each age cohort within Alliance LGAs in turn. years cohort This cohort indicates the levels of fertility prevailing in any area. There were four LGAs which had negative average annual growth in the period Penrith, Campbelltown, Armadale and Playford. This did not occur in any of the LGAs in the following five year period. For all LGAs, average annual growth in this cohort was greater in the period than in the earlier period. Average annual growth rates of seven percent or greater during were reported in Cardinia, Armadale, Wanneroo, Melton, Mandurah, Kwinana, Wyndham and Serpentine-Jarrahdale. In the latter two LGAs, average annual growth was 1. and 11.6 percent respectively. Lowest growth rates during occurred in Campbelltown, Liverpool and Penrith. years cohort This cohort represents school aged children. Negative growth occurred during in Campbelltown, Penrith, Armadale and Playford. For Campbelltown and Penrith, negative growth continued during the following five years to 211. Unlike the situation for the years cohort, average annual growth in was not universally greater than that for the previous period. In more than half the LGAs, growth in was less than that in the period. In , the highest average annual growth rate was 6.3 percent in Melton, with rates slightly lower in Wyndham and Wanneroo. Rates less than one percent were reported for Logan, Playford, Hume, Blacktown and Liverpool.
31 31 Table 2:4: Average annual change by age, NGAA LGAs, and Source: ABS Time Series Profile, Local Government Area Blacktown (C) Camden (A) Campbelltown (C) Liverpool (C) Penrith (C) Casey (C) Cardinia (S) Wyndham (C) Melton (S) Hume (C) Whittlesea (C) Moreton Bay (R) Logan (C) Ipswich (C) Gosnells (C) Wanneroo (C) Swan (C) Cockburn (C) Mandurah (C) Serpentine-Jarrahdale (S) Kwinana (T) Armadale (C) Rockingham (C) Mount Barker (DC) Playford (C) Total Total Population Blacktown (C) Camden (A) Campbelltown (C) Liverpool (C) Penrith (C) Casey (C) Cardinia (S) Wyndham (C) Melton (S) Hume (C) Whittlesea (C) Moreton Bay (R) Logan (C) Ipswich (C) Gosnells (C) Wanneroo (C) Swan (C) Cockburn (C) Mandurah (C) Serpentine-Jarrahdale (S) Kwinana (T) Armadale (C) Rockingham (C) Mount Barker (DC) Playford (C) Total
32 32 years cohort This cohort represents upper school, university and TAFE students and early workforce entrants. This group reported negative growth in both intercensal periods in Campbelltown and Penrith, while in Armadale negative growth occurred in the period. Lower growth in than in occurred in Casey, Melton, Hume and Mount Barker. In the period average annual growth of five percent or greater occurred in Kwinana, Rockingham, Melton, Cardinia, Mandurah, Wyndham, Wanneroo and Serpentine-Jarrahdale. The highest average annual growth rates of 7.1 and 8.8 percent respectively were in Wanneroo and Serpentine-Jarrahdale years cohort This cohort mainly represents early career workforce and family formation. Negative growth occurred in Campbelltown, Liverpool, Penrith, Armadale and Playford between 21 and 26. However, no LGAs reported negative growth in this cohort during the following period. With the exception of Melton and Campbelltown, average annual growth in the period was greater than in the earlier period. Moreover, in this cohort, average annual growth was usually considerably more in the period than during the period. Growth rates greater than five percent per annum occurred in Mandurah, Whittlesea, Cardinia, Kwinana, Armadale, Serpentine-Jarrahdale, Wanneroo, Melton and Wyndham. Average annual growth of less than one percent between 26 and 211 occurred in Liverpool, Penrith and Campbelltown. years cohort Essentially, this group is the mature age work force of the community. In each of the two periods, only one LGA reported negative growth in this cohort. There were 17 LGAs in which growth in the period exceeded that recorded in the previous period. Average annual growth rates of five or more percent during the five years to 211 occurred in Cardinia, Serpentine-Jarrahdale, Melton, Rockingham, Wyndham and Wanneroo. Lowest rates were seen in Penrith and Campbelltown. years cohort This group comprises persons who are in the last years of employment and/or the early years of retirement. In both reporting periods, all LGAs experienced growth in this cohort. At the Alliance level, growth in the period was less than that for the earlier period. With the individual LGAs, this tendency was replicated in 23 of the 25 member LGAs. It means that generally there has been a slowing in the rate of growth of this cohort. In , growth rates of five percent or greater occurred in Swan, Camden. Whittlesea, Serpentine-Jarrahdale, Cardinia, Casey, Wanneroo, Wyndham and Melton. Lowest rates were in Logan, Moreton Bay and Playford.
33 33 As for the previous cohort, these tendencies provide a barometer of levels and rates of ageing that are likely to occur in the foreseeable future. These prevailing tendencies are an indication of the level of ageing in the community that is likely to occur as these groups age in place. years cohort This group can be defined as the retirees and young-old group in the community. At the Alliance level, average annual growth in the second period was greater than in the first, suggesting that the significance of this group in communities is increasing. Indeed, in 21 of the 25 member LGAs, growth in exceeded that in In , growth of five percent or greater occurred in 15 LGAs, while growth above seven percent occurred in Serpentine-Jarrahdale (7.8 percent), Mount Barker (8.4), Cardinia (8.9), Wyndham (9.) and Melton (12.3). Lowest rates were in Playford, Kwinana and Rockingham. years cohort This group represents the old-old group within any population. As noted for the years cohort, this group had, at the Alliance level, lower average annual growth in the period than in the previous period. This tendency was replicated for all but one of the member LGAs. Whereas between there were 16 LGAs with average annual growth of five percent or more for this cohort, in the next period only four LGAs reported growth of five percent or greater Hume, Whittlesea, Wanneroo and Melton. At face value, it would seem that the ageing process is becoming a developing phenomenon in Mount Barker, Playford, Liverpool, Cardinia, Rockingham, Gosnells, Cockburn, Swan, Wyndham, Hume, Casey, Whittlesea, Serpentine-Jarrahdale, Mandurah, Wanneroo and Melton. This observation is based on growth rates, but these need to be checked against actual values to determine whether the growth rate is off a low population base. The years cohort This group represents the oldest persons in any community. As was noted for the years and the years age cohorts, this group, at the Alliance level, had lower rates of growth in the second period than in the first. Within the LGAs, there were 16 LGAs where lower growth occurred during than in the earlier period. These observations notwithstanding, a particularly significant point with this cohort, not noticed in any of the preceding cohorts, is that growth rates of five percent or greater during the period occurred in 23 of the 25 member LGAs. In the following period, five percent or greater growth occurred in 2 of the member LGAs. In , growth rates of six percent or above occurred in Cardinia, Swan, Campbelltown, Logan, Camden, Melton, Blacktown, Mandurah, Casey, Wyndham, Whittlesea and Wanneroo. There is an important caveat that must be attached to any discussion about, or implications derived from, average annual growth rates: high rates of annual growth do not necessarily indicate the presence of significant processes that might be areas of interest for decision makers requiring policy responses or development. Therefore, if a tendency appears to be significant, based on growth rates, then its significance should be confirmed by looking at the
34 34 population numbers that created the rate. If the numbers are substantial, then the significance of the tendency can be confirmed and, if need be, addressed through policy development. 2.3 AGEING Australia s population, along with most of the Western world, is ageing. However, as with most population trends the ageing of our population is not evenly distributed. Careful scrutiny of the data presented in this section will allow aspects of population ageing to be identified. In some locations, the ageing process is more progressed, in others it is developing and will not be a planning or policy issue for some years to come. This section begins with a contextual discussion on a number of aspects of the ageing process in Australia. Then detailed data are presented to illustrate the extent of ageing in the Alliance LGAs at the total level, and within the Australian born and overseas born segments of the population. In relation to ageing, there are a number of key points that need to be made at the outset: Ageing is an important process of change in the structure of population, along with fertility, mortality and migration. It occurs when there is an increase in the proportion, and therefore numbers, of persons in older age cohorts and a converse reduction in the proportion of total population in the younger age groups. Thus ageing of the population has as much to do with fertility as it does with the number of people in the older age cohorts. For any jurisdiction, including the Alliance LGAs, anticipating future growth in the older population does not require any crystal ball gazing on the part of decision makers and policy makers. In most areas, most of their older population are already resident in the area which makes anticipation of future growth in older cohorts relatively simple. There is a tendency among decision makers, the general public and the media that ageing is a problem to be dealt with. However, the fact is that the ageing population in most areas will bring with them a wealth of talent, resources and social capital, and developing ways and means to harness this resource represents an opportunity for decision makers and policy development. During the next 25 years the proportion of persons aged 65 years and older will increase significantly within Australia, up to two time their current numbers, as will the their ratio to the population of working age. That is, ageing is going to have a huge impact on any community s dependency ratio the ratio of independent persons (generally workers) to dependent persons (school aged children, retired persons and persons otherwise not in the workforce). The growth of the older population is both a challenge and an opportunity for any community. It is a challenge in terms of the greatly increased numbers of older people who will place pressure on a range of services at a time when workforce growth is slowing. However, it is an opportunity to harness the talents of older people in a way which can add to any area s sustainability, prosperity and equity goals. The ageing crunch in most areas will not hit until the 22s when the last of the baby boomers moves into older age around a decade from now but if the crunch is to be met successfully there must be appropriate planning and policy development now to put in place measures to accommodate the pressures generated by an ageing population. In the following section, the change in the proportion of various age groups in each of the Alliance LGAs is presented for 21, 26 and 211. In this way, cohorts that are growing can be identified, as can those that are waning or remaining static. This approach allows also for a close examination of the situation in the older cohorts, which can indicate the state of
35 35 the ageing process in each LGA. The approach employed is a graphic one, which should enable readers to see the situation in the various Alliance LGAs. In Figure 2.13 to Figure 2.17 inclusive, males and females in each cohort is computed as a percentage of total population. The 21 age and sex structure is superimposed on that for 26, with the 21 structure shaded. Careful scrutiny of these structures will show cohorts whose representation in the total population has either increased, decreased or remained stagnant between the 21 and 26 Censuses. Figure 2.13: Age and Sex Structure, Alliance LGAs, New South Wales, 21 and 26 Source: ABS Time Series Profile, Blacktown 21 and 26 (21 shaded) Liverpool 21 and 26 (21 shaded) Percent Percent Camden 21 and 26 (21 shaded) Penrith 21 and 26 (21 shaded) Percent Percent Campbelltown 21 and 26 (21 shaded) Percent Note in particular the increase in the proportion of population aged 55 to 65 years as the baby boomer cohort move into older age. This is particularly noticeable here for Penrith and Campbelltown.
36 36 Figure 2.14: Age and Sex Structures, Alliance LGAs, Victoria, 21 and 26 Source: ABS Time Series Profile, Casey 21 and 26 (21 shaded) Melton 21 and 26 (21 shaded) Percent Percent Cardinia 21 and 26 (21 shaded) Hume 21 and 26 (21 shaded) Percent Percent Wyndham 21 and 26 (21 shaded) Whittlesea 21 and 26 (21 shaded) Percent Percent Again, Figure 2.14 shows that it is the baby boomer cohort moving into the late working life and early retirement years in the 211 to 26 census period that is domination the ageing of the Victorian Alliance LGAs. For some of these LGAs this increase is exacerbated by losses in younger age cohorts over the same period.
37 Cohrot 37 Figure 2.15: Age and Sex Structures, Alliance LGAs, Queensland, 21 and 26 Source: ABS Time Series Profile, Moreton Bay 21 and 26 (21 shaded) Ipswich 21 and 26 (21 shaded) Percent Percent Logan 21 and 26 (21 shaded) Percent Figure 2.16: Age and Sex Structures, Alliance LGAs, Western Australia, 21 and 26 Source: ABS Time Series Profile, Gosnells 21 and 26 (21 shaded) Swan 21 and 26 (21 shaded) Percent Percent Wanneroo 21 and 26 (21 shaded) Cockburn 21 and 26 (21 shaded) Percent Percent
38 38 Mandurah 21 and 26 (21 shaded) Armadale 21 and 26 (21 shaded) Percent Percent Serpentine-Jarrahdale 21 and 26 (21 shaded) Rockingham 21 and 26 (21 shaded) Percent Percent Kwinana 21 and 26 (21 shaded) Percent Figure 2.17: Age and Sex Structures, Alliance LGAs, South Australia, 21 and 26 Source: ABS Time Series Profile, Mount Barker 21 and 26 (21 shaded) Playford 21 and 26 (21 shaded) Percent Percent Note the significant increase in the proportion of the population in the 55 to 64 year age cohort for the Mount Barker LGA in South Australia and the Serpentine-Jarrahdale LGA in Western Australia.
39 39 Figure 2.18 allows each of the preceding age sex structures to be compared with the situation prevailing for Australia during the same period. Note the similar pattern as the baby boomer cohort moves into early older age. Figure 2.18: Age and Sex Structures, Australia, 21 and 26 Source: ABS Time Series Profile, Australia 21 and 26 (21 shaded) Percent Using the same approach employed to prepare the age and sex structures for 21 and 26, the following series of age and sex structures shows the situation in each of the NGAA LGAs for the 26 to 211 period. As in the previous series, the 26 structure is superimposed on that for 211, with the 26 structure shaded to show differences between cohorts at each year. Figure 2.19: Age and Sex Structures, Alliance LGAs, New South Wales, 26 and 211 Source: ABS Time Series Profile, Blacktown 26 and 211 (26 shaded) Campbelltown 26 and 211 (26 shaded) Percent Percent Camden 26 and 211 (26 shaded) Liverpool 26 and 211 (26 shaded) Percent Percent
40 4 Penrith 26 and 211 (26 shaded) Percent Note the continued passage of the baby boomers into older age as the proportion of the population in the 55 to 64 years group continues to increase and is now added to by an increase in the 65 to 74 year age cohort. Figure 2.2: Age and sex structures, Alliance LGAs, Victoria, 26 and 211 Source: ABS Time Series Profile, Casey 26 and 211 (26 shaded) Melton 26 and 211 (26 shaded) Percent Percent Cardinia 26 and 211 (26 shaded) Hume 26 and 211 (26 shaded Percent Percent Wyndham 26 and 211 (26 shaded) Whittlesea 26 and 211 (26 shaded) Percent Percent
41 41 Figure 2.21: Age and Sex Structures, Alliance LGAs, Queensland, 26 and 211 Source: ABS Time Series Profile, Moreton Bay 26 and 211 (26 shaded) Ipswich 26 and 211 (26 shaded) Percent Percent Logan 26 and 211 (26 shaded) Percent It is interesting to note that the Ipswich LGA does not reflect the general population trends and has no increase in the proportion of people in the older cohorts. However there is evidence of increases in both the 25 to 34 year age cohort and the age cohort (these are often linked due to the timing of family formation in Australia). Figure 2.22: Age sex structures, Alliance LGAs, Western Australia, 26 and 211 Source: ABS Time Series Profile, Gosnells 26 and 211 (26 shaded) Wanneroo 26 and 211 (26 shaded) Percent Percent Cockburn 26 and 211 (26 shaded) Swan 26 and 211 (26 shaded) Percent Percent
42 42 Mandurah 26 and 211 (26 shaded) Armadale 26 and 211 (26 shaded) Percent Percent Serpentine-Jarrahdale 26 and 211 (26 shaded) Rockingham 26 and 211 (26 shaded) Percent Percent Kwinana 26 and 211 (26 shaded) Percent Again, Western Australian Alliance LGAs appear to be going against the national trend with little evidence of growth in the proportion of older people but continued growth in the younger age groups. This may reflect W.A. s continued boom town population trends. A similar situation can be seen in Playford SA below; that may be linked to international migration in the region. Figure 2.23: Age and Sex Structures, Alliance LGAs, South Australia, 26 and 211 Source: ABS Time Series Profile, Mount Barker 26 and 211 (26 shaded) Playford 26 and 211 (26 shaded) Percent Percent
43 43 Figure 2.24 allows the age sex structures for 26 and 211 to be compared with the situation prevailing in Australia for the same time. Figure 2.24: Age and sex structures, Australia, 26 and 211 Source: ABS Time Series Profile, Australia 26 and 211 (26 shaded) Percent Careful analysis of the structures in Figure 2.19 to Figure 2.23 will show those cohorts whose representation in the total population has either increased, decreased or remained stagnant between the 26 and 211 Censuses. While a commentary could be provided for each of the 25 LGAs in the Alliance which detailed changes in each cohort for each of the two intercensal periods, this would be lengthy, with similar processes being mentioned many times as they occurred in a number of LGAs. Hence, we have left the development of any summary statements on changes in age and sex structures between 21 and 211 to the individual LGAs. Instead we have opted to summarise the changes for each of the LGAs in tabular form. In Table 2:5, the change in representation of each cohort between and are presented. In the table, a classification has been used for LGAs where the representation of any cohort has increased between Censuses, while cohorts whose representation has remained static, or decreased have been left in an unclassified state. That is, the table easily allows the identifications of cohorts whose representation in the total population has decreased or remained unchanged between and , while cohorts that have increased their representation in the total population have been graded in terms of the size of the change, with the orange shading representing the largest increases in population proportions. The following pertinent points can be made from the table for the period: During this period, the share of cohorts, and in the total population reduced significantly across most LGAs. The reduced representation of children aged - 4 years is due to lowered fertility, while the reduced presence of young children aged 5-14 years, and the other two cohorts may be due to reduced immigrant intakes during this period or the out-migration of family units. In the years cohort, 16 LGAs experienced either no change or a reduction in this cohort s proportion of total LGA population. The representation of the years cohort in the total population grew in more LGAs than not. This is the mature aged workforce, and its relative concentrations in 26 compared with 21 contrast with the trends in the younger workforce aged years. Between 21 and 26, the proportion of persons aged years in the total population increased substantially. In all Alliance LGAs, the increase in representation was.6 percent or greater, with the highest increase being 2.7 in Mount Barker. LGAs
44 44 with a change between 21 and 26 of two percent or greater were Campbelltown, Penrith, Melton, Moreton Bay, Logan, Gosnells, Mandurah, Serpentine-Jarrahdale, Armadale and Mount Barker. This cohort represented much of the baby boomer generation at this time and contains persons in either pre-retirement or early retirement ages, and in many respects changes in this cohort presages the development of an older population in the coming decades and the implications associated with the ageing process in these LGAs needs to be thoughtfully considered. Table 2:5: Change in cohort representation, Alliance LGAs, and Source: ABS Time Series Profile, Local government area Blacktown (C) Camden (A) Campbelltown (C) Liverpool (C) Penrith (C) Casey (C) Cardinia (S) Wyndham (C) Melton (S) Hume (C) Whittlesea (C) Moreton Bay (R) Logan (C) Ipswich (C) Gosnells (C) Wanneroo (C) Swan (C) Cockburn (C) Mandurah (C) Serpentine-Jarrahdale (S) Kwinana (T) Armadale (C) Rockingham (C) Mount Barker (DC) Playford (C) Alliance total Australia Local government area Blacktown (C) Camden (A) Campbelltown (C) Liverpool (C) Penrith (C) Casey (C) Cardinia (S) Wyndham (C) Melton (S) Hume (C) Whittlesea (C) Moreton Bay (R) Logan (C) Ipswich (C) Gosnells (C) Wanneroo (C) Swan (C) Cockburn (C) Mandurah (C) Serpentine-Jarrahdale (S) Kwinana (T) Armadale (C) Rockingham (C) Mount Barker (DC) Playford (C) Alliance total Australia
45 45 In the young-old group, aged, most LGAs experienced a moderate increase in their representation in the total population between 21 and 26. Only Rockingham, Mount Barker and Playford had a reduced representation of this cohort in total population in 26 compared with 21. Again, the increased representation between 21 and 26 is an indicator of the increasing phenomenon of ageing and the range of implications associated with it. This conclusion is reinforced by the trends between 21 and 26 for the years and the 85 years and older cohorts. For these two cohorts, every LGA had a higher representation in 26 than was the case five years earlier. The following tendencies can be discerned for the period: For most LGAs, the proportion of year olds in the total population was greater in 211 than had been the case in 26, reflecting chiefly an increase in the level of international migration during the previous five years (which consist mainly of younger cohorts of people at the family formation period in the life course). The only LGAs which did not experience an increase in relative concentrations were Camden, Campbelltown, Liverpool, Hume and Swan. The parents of young children are usually in the years cohort. Increases in the group were often matched with an increase in 211 of the concentration of persons aged in the total population. In the case of the years cohort, whereas between 21 and 26 only one LGA had a greater representation in the total population in 26 than in 21, in 211 there were eight LGAs which had a higher concentration of the cohort than was the case in 26. In the period there were fewer LGAs with higher concentrations of persons aged years than had been the case in the earlier period. This is indicative of the impact of lower numbers of younger persons born after the baby boom generation now moving through the age structure over time. This is also a time of career, housing and family consolidation for a lot of Australians and therefore is a less mobile population, hence historically there are not usually high numbers attributed to inmigration from other regions in this cohort. With the years and years cohorts, most LGAs experienced an increase in the relative concentrations of these age groups. However, whereas every LGA experienced relative growth in the years cohort during 21-26, there were eight LGAs in which a reversal occurred in the period. Similarly, during only three LGAs experienced relative decline in the proportion of people aged years, during this phenomenon occurred in seven LGAs. This trend may be indicative of people moving to new areas upon retirement, particularly re-location to high amenity sea change and tree change locations. The movement of people through the population age structure can be illustrated by the fact that in 15 LGAs, the change in relative concentration of persons aged years between 26 and 211 was greater than that recorded during the period. In terms of the two oldest cohorts, which recorded relative growth between 21 and 26 in all the Alliance LGAs, 16 LGAs reported a relative decline in the presence of persons aged years between 26 and 211, while nine reported the same tendency for the 85 years and older cohort. Growth in these age cohorts is expected to increase in future decades as the baby boomer cohort move into much older age and this needs to be considered in terms of future service provision. While the data presented above illustrates aspects of the changes that are occurring in the Australian age structure, especially in terms of reduced numbers of younger persons and
46 46 increased numbers of older persons associated with ageing of the population, the data in Table 2:6 gives a better impression of the proportions of various cohorts in the total population. It aggregates the population into three broad groups: Young children, school aged children and university/tafe students persons aged -19 years. It is understood that some persons aged 19 years may be in the workforce, but generally this group can be regarded as part of the dependent population. The working population, aged 2-64 years. Again, there are some qualifications associated with this group some persons in the group may still be full time students, and others may be retired. However, for all intents and purposes, this group can be regarded as the group in the community that is independent. Persons aged 65 years and older are generally regarded as retired, and therefore represent another component of the population that is considered dependent. Perusal of the table can identify LGAs where the young population is increasing. Where this is the case it will probably be due to a combination of migration, both international and internal, and increased fertility. It will also show those areas where the size of the working population is increasing. Where this is occurring it will be due to the presence of strong employment activity in the area. Alternatively, the area may be a dormitory or commuter regions with people working in other regions but residing here. Finally, the trends in the numbers and percentages of persons aged 65 years and over will give insights into any developing tendency to an ageing population. As has been mentioned earlier, this is a process that is going to increase over the next 2 years as the baby boomer generation, born between 1946 and 196, moves into the retirement stage of the life cycle. Table 2:6 presents dependency ratios for each of the Alliance LGAs at each of 21, 26 and 211. These ratios indicate the relationship between the dependent population (children, students and retirees) and the independent population (the workforce). The dependency ratio is the number of dependent persons for every 1 independent persons. Clearly, a high dependency ratio indicates a smaller workforce relative to greater numbers of young children, students and retired persons. In 211, there are a number of points that can be made in relation to dependency ratios during the period: At the Alliance level, dependency ratios have been trending downwards, from 69.6 percent in 21, through to 68.2 percent in 26 and to 67.4 in 211. This is the same kind of trend that can be identified for Australia as a whole. However, the levels of dependency within the Alliance are at slightly higher levels than those occurring for Australia. In 211, there were 11 LGAs with dependency ratios above the Alliance wide level Serpentine-Jarrahdale, Logan, Cardinia, Wanneroo, Mount Barker, Ipswich, Camden, Moreton Bay, Rockingham, Playford and Mandurah. The high dependency ratio of five of these LGAs is also linked to the highest levels of persons aged 65 years and older. In these cases there is a link between ageing and increasing dependency. In eight of the LGAs with dependency levels above that prevailing at the Alliance level, the corresponding proportion of persons aged -19 is above the prevailing proportion at the Alliance level. Here, therefore, there is a link between dependency proportions and the prevailing numbers of children and/or school and tertiary students. It is important to note that dependency ratios are mainly considered in terms of economic development and may not reflect the contributions dependent populations groups (such as
47 47 retirees) make to their communities in terms of volunteering, care giving, and independence (both economically and in terms of service needs). Table 2:6: Dependent and Independent segments of the population, 21, 26 & 211 Source: ABS Time Series Profile, Local government area Total Total Total population population population Blacktown (C) Camden (A) Campbelltown (C) Liverpool (C) Penrith (C) Casey (C) Cardinia (S) Wyndham (C) Melton (S) Hume (C) Whittlesea (C) Moreton Bay (R) Logan (C) Ipswich (C) Gosnells (C) Wanneroo (C) Swan (C) Cockburn (C) Mandurah (C) Serpentine-Jarrahdale (S) Kwinana (T) Armadale (C) Rockingham (C) Mount Barker (DC) Playford (C) Alliance total Australia Local government area Dependency Dependency Dependency ratio ratio ratio Blacktown (C) Camden (A) Campbelltown (C) Liverpool (C) Penrith (C) Casey (C) Cardinia (S) Wyndham (C) Melton (S) Hume (C) Whittlesea (C) Moreton Bay (R) Logan (C) Ipswich (C) Gosnells (C) Wanneroo (C) Swan (C) Cockburn (C) Mandurah (C) Serpentine-Jarrahdale (S) Kwinana (T) Armadale (C) Rockingham (C) Mount Barker (DC) Playford (C) Alliance total Australia
48 SUMMARY The underlying purpose of the analysis in this chapter has been to show that temporal change within each cohort can provide insights into the presence and extent of one or more social processes that may be occurring in any LGA. For example, increases in numbers aged years will indicate high fertility levels in the population, which should be matched by increases in the number of young persons in the early family stage of the life cycle. On the other hand, increasing proportions in the older age cohorts will indicate that population ageing is occurring, either at the early stages or more advanced, along with a range of implications associated with this process. Significantly, at the Alliance level, the years cohort increased in population numbers nearly four times more during than in the previous five year period and large increases also occurred in the years cohort, the group most likely responsible for the growth in the years cohort. Almost one in five Australian children aged in 211 live in the Alliance LGAs and indeed this is the case for all dependent age children and has major implications for the growth in demand for child care, education and other services. Among the other cohorts: Lesser rates of change occurred for years and years cohorts, while lowest rates of change between and occurred in the, and cohorts. The growth in was less than that for the period for the years and years cohorts. In terms of ageing, the chapter has provided data for each of the Alliance LGAs in the context that population ageing is an increasing phenomenon within the Australian population. In any jurisdiction, anticipating future growth in the older population does not require any crystal ball gazing on the part of decision makers and policy makers. In most areas, most of their older population are already resident in the area which makes anticipation of future growth in older cohorts are relatively simple process. With this in mind, the analysis provides policy makers in Alliance LGAs with a number of insights into the state of the ageing process in their jurisdiction, and a number of implications for policy determinations to meet this impending phenomenon. It should be noted that the 65+ population are under-represented in the region as a whole with 11.5 percent of the nation s older people living in those areas. Nevertheless, there are some LGAs where there is an overrepresentation of older persons. Moreover there was a growth of the 65+ in all of the LGAs. It needs to be noted that the 65+ can face particular challenges in these areas because they generally have relatively low population density. This means that accessibility to public transport and to services is more difficult than it is in middle and inner suburbs. This can present challenges to older people who do not have access to a motor vehicle. Two evolving elements associated with the growth of the older population in NGAA LGAs should be especially noted: There has been especially rapid growth of the years early baby boomers age group. This presages an impending rapid expansion of the 65+ population as these residents potentially age in place. There is an increasing pattern for aged care institutions to locate in NGAA LGAs to take advantage of availability of greenfield sites and cheaper land costs. The number of such institutions in the LGAs increased from 252 in 26 to 273 in 211.
49 INTRODUCTION CHAPTER 3. INTERNATIONAL MIGRATION In Australia international migration has been a significant contributor to population growth from the 195s onwards. In 211, the number of overseas born in Australia was close to 5.3 million, representing 26 percent of the total Australian population. Between 21 and 26, net international migration to Australia was 311, 435, while in the following five year period to 211, net international migration was over 876,. It is likely that these national tendencies have also occurred, to varying degrees, within the member LGAs of the NGAA. In the following sections, a number of aspects of international migration are examined in the context of the Alliance LGAs. In this chapter: The balance between Australian born and overseas born is examined. The distribution of overseas born in the Alliance LGAs and their temporal changes are presented. We look at net overseas migration and temporal change in the LGAs. The birthplace country of migrants in Alliance LGAs is examined. The top ten countries are indicated. This analysis shows the importance of the UK and New Zealand as the main countries of origin in Alliance LGAs, as well as the developing size of Indian migration after 26. The age structure of Australian born and overseas born persons in each LGA is presented for both 26 and 211. This is particularly significant because it shows how sizeable the overseas born population is in each LGA, as well as their position, vis-a-vis ageing, in the age structure. These tendencies identify LGAs where ageing is a developing phenomenon, as well as LGAs where migrants are a significant component of the ageing process. It also identifies LGAs where fertility levels are high. We look at the concept of multicultural diversity using measures of Australian born, persons from Mainly English Speaking (MES) countries and Non English Speaking (NES) countries, as well as discussing data related to region of birth, and the extent of Australian born persons with a mother and/or father born overseas. Data from the Department of Immigration and Multicultural Affairs Settlement Reporting Facility is used to show for each LGA the numbers in each visa category (family, skilled and humanitarian), the main source countries for migrants in each visa category, numbers of arrivals who are in the Settlement Target Group migrants who are eligible for settlement services from funding provided by the Settlement Grants Programme, and a comprehensive breakdown of migrants by visa sub class in each LGA for the period. We estimate the share of the migrant population each Alliance LGA undertakes in terms of accommodating Australia s migrant intake. 3.2 AUSTRALIAN AND OVERSEAS BORN In many parts of Australia international migration has made significant impacts on population change during the last decade. Table 3:1 shows the extent of this impact in each of the Alliance LGAs between 21 and 211. In 211, at the Alliance level, 3.7 percent of the total population was born overseas. This representation had increased from 27.2 percent of total population in 21. Significantly, the overseas born in the total population, at the
50 5 Alliance level, is around four percent higher than the levels of overseas born in the total Australian population. Therefore, at the total level, overseas born persons are a significant proportion of communities in most NGAA LGAs. Table 3:1: Australian born and overseas born, NGAA LGAs, LGA Name Australian born Overseas born Overseas born as % Total population Blacktown (C) Camden (A) Campbelltown (C) Liverpool (C) Penrith (C) Casey (C) Cardinia (S) Wyndham (C) Melton (S) Hume (C) Whittlesea (C) Moreton Bay (R) Logan (C) Ipswich (C) Gosnells (C) Wanneroo (C) Swan (C) Cockburn (C) Mandurah (C) Serpentine-Jarrahdale (S) Kwinana (T) Armadale (C) Rockingham (C) Mount Barker (DC) Playford (C) Alliance total Australia Among the individual LGAs, in 211 the highest proportion of overseas born persons in the total population occurred in Liverpool, where overseas born persons represented 42.5 percent of the population. Proportions greater than 4 percent also occurred in Wanneroo and Gosnells. These represent very high levels of overseas born presence in LGAs. However, significantly high proportions 32 percent or greater occurred in Blacktown, Casey, Wyndham, Whittlesea, Hume, Cockburn, Rockingham, Kwinana, Armadale and Swan. During the period, the largest increase in the representation of overseas born persons occurred in Wyndham. There, the overseas born proportion of total population was 23.8 percent in 21, which increased to 35.6 percent in 211. LGAs whose absolute percentage increase was more than five percent in the ten years from 21 were Melton, Gosnells, Wanneroo, Mandurah, Casey and Blacktown. These are LGAs where processes are at work within them to attract increasing numbers of overseas born, relative to the total population. Table 3:2 shows the extent of changes in net international migration in the Alliance LGAs between 21 and 211. Overseas born persons are heavily represented in the NGAA LGAs. In 21, there were just on 67, overseas born persons present, and this number increased to just over 763, in 26, settling on 997, in 211. In 211, the highest proportion of overseas born in the
51 51 Alliance was located in Blacktown (11.3 percent). Concentrations of six percent or greater occurred in Casey, Logan, Liverpool, Moreton bay and Wanneroo. Between 21 and 26, net international migration within all the NGAA LGAs was just over 93, migrants. Net international migration exceeded 1, migrants in Casey, Wanneroo and Blacktown LGAs, while more than 5, international migrants arrived in Moreton Bay, Wyndham, Melton and Hume. Of these seven LGAs, four are in Victoria, with one in each of New South Wales, Queensland and Western Australia. Net international migration decline occurred in Kwinana, Armadale, Penrith and Playford. Table 3:2: Net overseas migration, NGAA LGAs, In the following period, , the significance of international migration in the LGAs increased enormously. At the total Alliance level, net international migration increased 15 percent, from 93,346 to 233,52. Within the Alliance, the following key points emerged: LGA Name Overseas born Net International migration Average annual change, % Blacktown (C) Camden (A) Campbelltown (C) Liverpool (C) Penrith (C) Casey (C) Cardinia (S) Wyndham (C) Melton (S) Hume (C) Whittlesea (C) Moreton Bay (R) Logan (C) Ipswich (C) Gosnells (C) Wanneroo (C) Swan (C) Cockburn (C) Mandurah (C) Serpentine-Jarrahdale (S) Kwinana (T) Armadale (C) Rockingham (C) Mount Barker (DC) Playford (C) Alliance total Australia Net international migration increased by more than 2, migrants in Wyndham, Casey, Wanneroo and Blacktown between 26 and 211. Net migration increases greater than 1, migrants occurred in Moreton Bay, Logan, Whittlesea, Melton, Gosnells and Hume. Increases greater than 5, occurred in six other LGAs. Significantly, no LGA experience net international migration loss indicating that migration plays a considerable role in population dynamics for Alliance LGAs.
52 52 Table 3:2 also indicates average annual growth in net international migration in each of the LGAs. Average annual growth is not always directly related to absolute change in net international migration numbers. The following points are relevant for the period: In Melton, the average annual growth in net international migration was 11.9 percent, although its absolute net growth, at 11,16, was less than half the absolute growth reported in Casey. Average annual growth rates greater than five percent occurred in Wyndham, Wanneroo, Mandurah and Casey. In the following period, the highest growth rate of 13.9 percent occurred in Wyndham. Slightly lower rates occurred in Melton (9.6 percent), Wanneroo (9.), Cardinia (8.5), Mandurah (8.2), Kwinana (7.9) and Ipswich (7.8). In a further eight LGAs, average annual growth in net international migration during this period was five percent or greater. The lowest growth rates in this period occurred in Penrith and Campbelltown. At the Alliance level, average annual growth rates in net international migration are higher than those prevailing at the Australia level 1.7 times higher in the period and 1.5 times greater in the following period. There are many member LGAs with average annual change in net international migration considerably above the national levels. 3.3 MAIN BIRTHPLACE COUNTRIES OF MIGRANTS Australia draws it migration intake from a very large number of countries. Within the group of source countries, there are a number, such as the UK, New Zealand and a number of southeast Asian countries, which tend to dominate. However, further down the ranking, there is a marked mixture of countries contributing migrants to the various NGAA LGAs. Accordingly, it is not the intention here to detail the top ten migrant birthplace countries for each of the member LGAs. Rather, Table 3:3 shows the top ten birthplace countries for the Alliance as a whole. Table 3:3: Top Ten Birthplace Countries of Migrants, Alliance, United Kingdom United Kingdom United Kingdom New Zealand New Zealand New Zealand Philippines Philippines India Italy India Philippines India Italy South Africa Vietnam Fiji Italy Fiji Vietnam Fiji Germany South Africa Vietnam Netherlands Sri Lanka Sri Lanka Malta Germany China, excl SARs and Taiwan In 21, the UK born proportion in the total population was 7.1 percent, nearly three times the concentration of next ranked NZ. Concentrations of the next ranked birthplace countries, Philippines and Italy, were marginally above one percent. At the individual LGA level, the UK remains the dominant birthplace country in 21 of the 25 member LGAs, with NZ born persons ranked second in 14 of the LGAs. LGAs where UK born residents were not dominant were Blacktown (Philippines), Liverpool (Fiji), Hume (Turkey) and Whittlesea (Italy). LGAs where UK and/or NZ born were not second ranked were Liverpool (Vietnam), Casey (Sri Lanka), Cardinia (Netherlands), Wyndham (Italy),
53 53 Melton (Malta), Whittlesea (FYROM 2 ), Cockburn (Italy), Mount Barker (Germany) and Playford (Italy). Countries of birth ranked lower than third represent a myriad of countries, and the detail, presented in Appendix 2, is worthy of close scrutiny. At the 26 Census, the rankings remained unchanged, except that Italy and India exchanged rankings, with India moving to fourth rank. At the macro level, this is an indication of increasing migration from India, and Indian born persons locating in growth areas of major cities. At the individual LGA level, the situation identified for 21 remained largely unchanged for birthplace countries near the top of the rankings. The main changes occurring between 21 and 26 were that in Cardinia, where New Zealanders replaced persons from the Netherlands, with NZ born persons moving to second rank. In Wyndham, NZ moved up to second rank, while Italy, previously second ranked, dropped to fourth rank. Elsewhere: In Melton, the Philippines and Malta swapped rankings, although their relative concentrations were very similar. In Hume, the concentration of persons born in Iraq pushed each of UK and Italy down a ranking, with Iraq moving to second rank. In Logan, NZ born persons become the dominant birthplace group, replacing the UK. In summary, changes between 21 and 26 showed an increased presence of birthplace groups which have constituted an increasing proportion of the Australian migration stream in recent years. As well, the presence of New Zealand born persons is becoming more significant, especially in Logan, where it is the top ranked birth place group. Full details of the situation prevailing in each of the Alliance LGAs for 21 and 26 can be seen in Appendices 2 and 3. It can be seen in Table 3:3 that the general tendencies evident in 26 were again present in 211. However, the increasing dominance of India in the rankings is noteworthy. At the Alliance level, India s ranking increased from fourth in 26 to third in 211. Within the individual LGAs, the rise of India as a significant country of birth has been phenomenal. In Wyndham, it was the top ranked birthplace country, up from fifth ranking in 26. In virtually all the LGAs, it increased its ranking from 26. In the case of Moreton Bay, Logan, Ipswich and Playford, it did not rank among the top ten in 26. Only in Rockingham did its relative presence decline between 26 and 211. Details for the individual LGAs in 211 can be seen in Appendix 4, which shows that: In most of the LGAs, the United Kingdom remained the major country of origin. Generally, New Zealand ranked second in most of the LGAs. In Logan and Ipswich, New Zealand was the top ranked country of birth, displacing UK born persons to second rank. In Blacktown, the dominant birthplace groups were Philippines and India, relegating UK and New Zealand born to third and fourth rank respectively. In Liverpool, Fiji, Iraq, Vietnam, India, Lebanon and Philippines birthplaces ranked higher than persons from New Zealand and the UK. In Whittlesea, UK born persons ranked fifth behind Italy, FYROM, India and Greece born persons, while in Hume Iraq, Turkey and India born persons outnumbered those born in the UK. In Wyndham, persons born in India ranked number 1, ahead of those born in UK and New Zealand. 2 The Former Yugoslav Republic of Macedonia
54 Percent total population Percent total population Percent total population Percent total population 54 In summary, the general dominance of migrants from the UK in 211 is understandable as this country has been the traditional main source of migrants since the early post war years. New Zealand is consistently ranked highly because of the open door migration policy we have with NZ where visas are not required. Perusal of the table shows the influence of recent migration by a number of the Asian groups, especially those born in India and China. The rankings of some of the European groups Italians, Germans, Dutch and Greeks that were important in the early post war migration to Australia are now beginning to slip behind those of the newer groups as their numbers erode by death and emigration. The top ranking birthplace groups, outside the UK and New Zealand born, essentially represent the new face of immigration to Australia. 3.4 AGE STRUCTURE OF AUSTRALIAN BORN AND OVERSEAS BORN The impact of international migration on communities in Australia has been shown in the preceding sections. In this section, the age structure of overseas born population is examined, in comparison with the age structure of the Australian born. In the following graph series, the proportion of overseas born and Australian born in the total population for each age cohort is displayed, based on 26 Census data. The figure series show: The Australian born: overseas born ratios in each LGA. LGAs with a large overseas born component in their total population. The proportion of Australian born and overseas born in each age cohort. The age distribution of Australian born and overseas born. The impact of ageing in the Australian born and overseas born. While it is beyond the scope of this Report to prepare a commentary on the graph series for each LGA, a summary is presented in Table 3:4. Figure 3.1: Australian and Overseas born age structure, Alliance LGAs, New South Wales, 26 Source: ABS Census Data 26, Table Builder 2 Blacktown 2 Campbelltown 15 Overseas born 15 Overseas born Australian born Australian born Camden Overseas born 2 15 Liverpool Overseas born Australian born Australian born
55 Percent total population Percent total population Percent total population Percent total population Percent total population Percent total population Percent total population Penrith Overseas born Australian born 5 Figure 3.2: Australian and Overseas born age structure, Alliance LGAs, Victoria, 26 Source: ABS Census Data 26, Table Builder 2 Casey 2 Melton 15 Overseas born 15 Overseas born Australian born Australian born Cardinia Hume 15 Overseas born 15 Overseas born Australian born Australian born Wyndham 2 Whittlesea 15 Overseas born 15 Overseas born Australian born Australian born
56 Percent total population Percent total population Percent total population Percent total population Percent total population Percent total population Percent total population 56 Figure 3.3: Australian and Overseas born age structure, Alliance LGAs, Queensland, 26 Source: ABS Census Data 26, Table Builder 2 2 Moreton Bay Ipswich 15 Overseas born 15 Overseas born Australian born Australian born Logan Overseas born Australian born 5 Figure 3.4: Australian and Overseas born age structure, Alliance LGAs, Western Australia, 26 Source: ABS Census Data 26, Table Builder 2 Gosnells 2 Swan 15 Overseas born 15 Overseas born Australian born Australian born Wanneroo Cockburn 15 Overseas born 15 Overseas born Australian born Australian born
57 Percent total population Percent total population Percent total population Percent total population Percent total population Percent total population Percent total population Mandurah Overseas born Australian born 2 15 Armadale Overseas born Australian born Serpentine-Jarrahdale 2 Rockingham 15 Overseas born 15 Overseas born Australian born Australian born Kwinana Overseas born Australian born 5 Figure 3.5: Australian and Overseas born age structure, Alliance LGAs, South Australia, 26 Source: ABS Census Data 26, Table Builder 2 Mount Barker 2 Playford 15 Overseas born 15 Overseas born Australian born Australian born Table 3:4 shows the top ten LGAs in each age cohort for both the Australian born and overseas born populations in each LGA. These percentages are the proportion of each age group in the LGAs total population. The table shows that there are a number of LGAs which are dominated by Australian born population in all, or most age cohorts. These are Camden,
58 58 Campbelltown, Penrith, Cardinia, Moreton Bay, Ipswich and Mount Barker. It is also possible to identify LGAs which are in the top ten in the younger cohorts for the Australian born, including Melton, Hume, Swan, Cockburn, Kwinana and Armidale. There are also several LGAs that fall into the top ten for Australian born in the older age cohorts, in LGAs such as Mandurah, Serpentine-Jarrahdale and Rockingham. Specifically, LGAs with Australian born concentrations in the top ten for at least two of the oldest cohorts are Camden, Campbelltown, Penrith, Cardinia, Moreton Bay, Ipswich, Mandurah, Rockingham and Mount Barker. Table 3:4: Age structure, Australian born and overseas born, NGAA LGAs, 26 Source: ABS Census Data 26, Table Builder Australian born Percent Local government area Percent of total LGA population in cohort total population Blacktown (C) Camden (A) Campbelltown (C) Liverpool (C) Penrith (C) Casey (C) Cardinia (S) Wyndham (C) Melton (S) Hume (C) Whittlesea (C) Moreton Bay (R) Logan (C) Ipswich (C) Gosnells (C) Wanneroo (C) Swan (C) Cockburn (C) Mandurah (C) Serpentine-Jarrahdale (S) Kwinana (T) Armadale (C) Rockingham (C) Mount Barker (DC) Playford (C) Overseas born Percent Local government area Percent of total LGA population in cohort total population Blacktown (C) Camden (A) Campbelltown (C) (NSW) Liverpool (C) Penrith (C) Casey (C) Cardinia (S) Wyndham (C) Melton (S) Hume (C) Whittlesea (C) Moreton Bay (R) Logan (C) Ipswich (C) Gosnells (C) Wanneroo (C) Swan (C) Cockburn (C) Mandurah (C) Serpentine-Jarrahdale (S) Kwinana (T) Armadale (C) Rockingham (C) Mount Barker (DC) Playford (C)
59 Percent total population Percent total population Percent total population Percent total population 59 In the case of the overseas born population, there are several LGAs with top ten ranking in six or more age cohorts, including Liverpool, Whittlesea, Logan, Gosnells, Wanneroo and Rockingham. There are a number of LGAs which have top ten status for the three youngest age cohorts. These are areas where migration is contributing to high levels of fertility, and include Wyndham, Logan, Gosnells, Wanneroo and Rockingham. The table also indicates those LGAs where high proportions of overseas born are present in the older cohorts. In these LGAs, migrants are ageing and will potentially generate a range of demands that will need to be met as their ageing process continues. LGAs falling into this category are Liverpool, Whittlesea, Gosnells, Cockburn, Mandurah, Armadale, Rockingham and Playford. In the following graph series, from Figure 3.6 to Figure 3.1, data from the 211 Census have been used to show the age structure of both the Australian born and overseas born populations in each of the Alliance LGAs. In the series, the proportion of overseas born and Australian born in the total population for each age cohort, based on 211 Census data, is shown. As with the previous series using 26 data the 211 series show graphically: The Australian born: overseas born ratios in each LGA. LGAs with a large overseas born component in their total population. The proportion of Australian born and overseas born in each age cohort. The age distribution of Australian born and overseas born. The size of the older populations in each LGA, and the contribution made to these by both Australian born and overseas born. The impact of ageing in the Australian born and overseas born. Figure 3.6: Australian and Overseas born age structure, Alliance LGAs, New South Wales, 211 Source: ABS Census Data 211, Table Builder 2 15 Blacktown Overseas born 2 15 Campbelltown Overseas born Australian born Australian born Camden Overseas born 2 15 Liverpool Overseas born Australian born Australian born
60 Percent total population Percent total population Percent total population Percent total population Percent total population Percent total population Percent total population Penrith Overseas born Australian born 5 Figure 3.7: Australian and Overseas born age structure, Alliance LGAs, Victoria, 211 Source: ABS Census Data 211, Table Builder 2 2 Casey Melton 15 Overseas born 15 Overseas born Australian born Australian born Cardinia Hume 15 Overseas born 15 Overseas born Australian born Australian born Wyndham Whittlesea 15 Overseas born 15 Overseas born Australian born Australian born
61 Percent total population Percent total population Percent total population Percent total population Percent total population Percent total population Percent total population 61 Figure 3.8: Australian and Overseas born age structure, Alliance LGAs, Queensland, 211 Source: ABS Census Data 211, Table Builder 2 Moreton Bay 2 Ipswich 15 Overseas born 15 Overseas born Australian born Australian born Logan Overseas born Australian born 5 Figure 3.9: Australian and Overseas born age structure, Alliance LGAs, Western Australia, 211 Source: ABS Census Data 211, Table Builder 2 Gosnells 2 Swan 15 Overseas born 15 Overseas born Australian born Australian born Wanneroo 2 Cockburn 15 Overseas born 15 Overseas born Australian born Australian born
62 Percent total population Percent total population Percent total population Percent total population Percent total population Percent total population Percent total population Mandurah Armadale 15 Overseas born 15 Overseas born Australian born Australian born Serpentine-Jarrahdale Rockingham 15 Overseas born 15 Overseas born Australian born Australian born Kwinana Overseas born Australian born 5 Figure 3.1: Australian and Overseas born age structure, Alliance LGAs, South Australia, 211 Source: ABS Census Data 211, Table Builder 2 2 Mount Barker Playford 15 Overseas born 15 Overseas born Australian born Australian born Table 3:5 shows the top ten LGAs in each age cohort for both the Australian born and overseas born populations in each LGA. These percentages are the proportion of each age group in the LGAs total population. The table shows that there are five LGAs with top ten status in eight or more cohorts Australian born. These are Camden, Penrith, Cardinia, Ipswich and Mount Barker. LGAs which are in the top ten for two or more of the younger cohorts for the Australian born are Camden, Penrith, Cardinia, Melton, Hume, Ipswich, and serpentine- Jarrahdale. There are nine LGAs that fall into the top ten for Australian born in two or more
63 63 of the older age cohorts, including Camden, Penrith, Cardinia, Moreton Bay, Ipswich, Cockburn, Mandurah, Rockingham and Mount Barker. Table 3:5: Age structure, Australian born and overseas born, NGAA LGAs, 211 Source: ABS Census Data 211, Table Builder Australian born Percent Local government area Percent of total LGA population in cohort total population Blacktown (C) Camden (A) Campbelltown (C) Liverpool (C) Penrith (C) Casey (C) Cardinia (S) Wyndham (C) Melton (S) Hume (C) Whittlesea (C) Moreton Bay (R) Logan (C) Ipswich (C) Gosnells (C) Wanneroo (C) Swan (C) Cockburn (C) Mandurah (C) Serpentine-Jarrahdale (S) Kwinana (T) Armadale (C) Rockingham (C) Mount Barker (DC) Playford (C) Overseas born Percent Local government area Percent of total LGA population in cohort total population Blacktown (C) Camden (A) Campbelltown (C) Liverpool (C) Penrith (C) Casey (C) Cardinia (S) Wyndham (C) Melton (S) Hume (C) Whittlesea (C) Moreton Bay (R) Logan (C) Ipswich (C) Gosnells (C) Wanneroo (C) Swan (C) Cockburn (C) Mandurah (C) Serpentine-Jarrahdale (S) Kwinana (T) Armadale (C) Rockingham (C) Mount Barker (DC) Playford (C)
64 64 In the case of the overseas born population, there are several LGAs with top ten ranking in six or more age cohorts Blacktown, Liverpool, Hume, Gosnells, Cockburn and Rockingham. There are a number of LGAs which have top ten status for two or more of the youngest cohorts. These are areas where migration is contributing to high levels of fertility, and include Blacktown, Liverpool, Casey, Wyndham, Logan, Gosnells, Wanneroo, Swan, Cockburn, Mandurah, Kwinana and Rockingham. The table also indicates those LGAs where high proportions of overseas born are present in the older cohorts, and where migrants are ageing and will generate a range of demands that will need to be met as their ageing process continues. LGAs falling into this category are Liverpool, Hume, Whittlesea, Gosnells, Cockburn, Mandurah, Kwinana, Armadale, Rockingham and Playford. The tendencies identified are not exclusive, and scrutiny of the table is likely to reveal more, especially in terms of each specific LGA, and temporal changes can also be determined by close comparison of the results presented in Table 3:4 and Table 3: MULTICULTURAL DIVERSITY There are a number of indicators of multicultural diversity available from the Census. A first approach is to examine the balance in any area between persons born in Australia, and those born in mainly English speaking (MES) countries and non-english speaking (NES) countries. Table 3:6 shows the situation existing within the Alliance, and its individual LGAs, at the 211 Census. While this analysis could be undertaken using time series data prepared from the 21, 26 and 211 censuses, this has not been done because all the MES countries are not represented in this data set. Hence, the analysis is restricted to 211 data based on Place of Usual Residence. At the Alliance level, Australian born population comprised just short of two thirds of the total population, with MES born migrants comprising 21.8 percent and persons from NES countries representing 12.5 percent of total population. Compared with the situation prevailing at the national level, the NGAA LGAs have a greater concentration than might be expected of MES born persons, while for the Australian and NES born populations, the Alliance levels are less than those prevailing within the greater Australian context. What this suggests is that MES born persons are attracted to Alliance LGAs in greater proportions than might be expected based on their share of the Australian population. However, from Table 3:6 above, it is clear that this overconcentration of MES born persons is confined to Alliance LGAs situated in Queensland, Western Australia and South Australia. All the Alliance LGAs in New South Wales and Victoria have MES born concentrations less than the Australian level. In terms of NES born persons, most Alliance LGAs are above the national concentration, and in this case they are distributed more uniformly among the states. Among the individual LGAs, it is striking that 19 of the 25 member LGAs have concentrations of NES migrants greater than the Alliance average, and 18 have concentrations greater than the level prevailing in Australia. Concentrations greater than 3 percent occur in Liverpool (42.3 percent), Blacktown (36.3), Whittlesea (34.9), Hume (33.7), Casey (31.) and Wyndham (3.8). A further six LGAs have representations of NES migrants greater than 2 percent. The lowest levels occur in Serpentine-Jarrahdale and Mount Barker, which are among the more rural, or regional, of the Alliance LGAs.
65 65 Table 3:6: Australian, MES and NES born concentrations, NGAA LGAs, 211 Source: ABS Census Data 211, Table Builder Local Government Area Persons born in MES countries Australian born Persons born in NES countries Total population Persons born in MES countries Australian born Persons born in NES countries s Percent Blacktown (C) Camden (A) Campbelltown (C) Liverpool (C) Penrith (C) Casey (C) Cardinia (S) Wyndham (C) Melton (S) Hume (C) Whittlesea (C) Moreton Bay (R) Logan (C) Ipswich (C) Gosnells (C) Wanneroo (C) Swan (C) Cockburn (C) Mandurah (C) Serpentine-Jarrahdale (S) Kwinana (T) Armadale (C) Rockingham (C) Mount Barker (DC) Playford (C) Alliance total Australia In terms of the MES migrants, only two LGAs Rockingham and Wanneroo have concentrations greater than that prevailing at the Alliance level. It is interesting that the top ten MES migrant concentrations occur in LGAs located in Western Australia and Queensland. It is likely that these migrants, with their English speaking skills, may be responding to opportunities provided by resource development activities in these states. In the next section a number of additional indicators of multicultural diversity are examined, including proportion of the population born in Europe, Asia and Sub-Saharan Africa. In Table 3.7, actual numbers are presented for the various regions of birth. These tables allow the reader to see the variation between North-West Europe and Southern and Eastern Europe in relation to any consideration of persons born in Europe. The discussion, however, will be restricted to the variation between the broad regions of birth.
66 66 Table 3:7: Selected regions of birth, Persons, 211 Source: ABS Census Data 211, Table Builder Local Government Area North-West Europe Southern and Eastern Europe South-East Asia North-East Asia Southern and Central Asia Sub- Saharan Africa At the Alliance level, 11.2 percent of the population was drawn from European countries in 211, compared with 8.4 percent from Asia and 1.7 percent from sub-saharan Africa. In relation to migrants from Asia, there were eight LGAs with proportions greater than that prevailing at the Alliance level. The highest concentrations occurred in Blacktown (18.3 percent), Wyndham (15.5), Gosnells (15.1) and Casey (14.6). Perhaps more significant is the fact that in Blacktown, Liverpool, Casey, Wyndham and Gosnells the proportion of the total population from Asia is greater than that from Europe. Table 3:8 looks at the concentrations of persons from two of the major source regions for Australia s migrants Europe and Asia with Asia being a region which is supplying an increasing number of migrants to Australia. At the Alliance level, 11.2 percent of the population was drawn from European countries in 211, compared with 8.4 percent from Asia and 1.7 percent from sub-saharan Africa. In relation to migrants from Asia, there were eight LGAs with proportions greater than that prevailing at the Alliance level. The highest concentrations occurred in Blacktown (18.3 percent), Wyndham (15.5), Gosnells (15.1) and Casey (14.6). Perhaps more significant is the fact that in Blacktown, Liverpool, Casey, Wyndham, and Gosnells, the proportion of the total population from Asia is greater than that from Europe. Total Total population Blacktown (C) Camden (A) Campbelltown (C) Liverpool (C) Penrith (C) Casey (C) Cardinia (S) Wyndham (C) Melton (S) Hume (C) Whittlesea (C) Moreton Bay (R) Logan (C) Ipswich (C) Gosnells (C) Wanneroo (C) Swan (C) Cockburn (C) Mandurah (C) Serpentine-Jarrahdale (S) Kwinana (T) Armadale (C) Rockingham (C) Mount Barker (DC) Playford (C) Total
67 67 Table 3:8: Persons born in selected regions, 211 Source: ABS Census Data 211, Table Builder Local Government Area Europe Sub- Asia Saharan Africa Total Sub- Europe Asia Saharan Africa Percent Blacktown (C) Camden (A) Campbelltown (C) Liverpool (C) Penrith (C) Casey (C) Cardinia (S) Wyndham (C) Melton (S) Hume (C) Whittlesea (C) Moreton Bay (R) Logan (C) Ipswich (C) Gosnells (C) Wanneroo (C) Swan (C) Cockburn (C) Mandurah (C) Serpentine-Jarrahdale (S) Kwinana (T) Armadale (C) Rockingham (C) Mount Barker (DC) Playford (C) Alliance total Australia Total Total population As for migrants from sub-saharan Africa, there were nine LGAs in which levels were above that recorded for the Alliance as a whole. With the exception of Casey, these LGAs are all located in Western Australia. The highest representations of migrants from sub-saharan Africa were in Wanneroo (5. percent), Gosnells (3.3), Swan and Cockburn (each 2.9), Casey (2.6) and Armadale (2.5). When the overall situation prevailing at the Alliance level is compared with that for Australia, it can be seen that in terms of where migrants come from, the Alliance situation is fairly representative of the situation prevailing at the Australia level, with any difference being less than one percent. Another indicator of multicultural diversity within communities is the extent to which Australian born persons have a mother and/or father born overseas. Table 3:9 shows the prevalence of this phenomenon at the 211 Census.
68 68 Table 3:9: Australian born persons with overseas born parent, 211 Source: ABS Census Data 211, Table Builder Loca l Government Area The first point to note from the table is that within the Alliance there are some 1.17 million Australian born persons with an overseas born mother and/or father. Australian born persons with an overseas born father represent 27.3 percent of all Australian born persons, compared with 24.1 percent of Australian born persons with an overseas born mother. Each of the NGAA LGAs has a higher proportion of Australian born persons with an overseas born father than an overseas born mother. For Australian born persons with an overseas born father, the following points can be made: Australian born with: Father born overseas Mother born overseas Father born overseas Mother born overseas Parents born overseas Total Australian born population Percent Bl a cktown (C) Ca mden (A) Ca mpbel l town (C) (NSW) Li verpool (C) Penri th (C) Ca s ey (C) Ca rdi ni a (S) Wyndha m (C) Mel ton (S) Hume (C) Whi ttl es ea (C) Moreton Ba y (R) Loga n (C) Ips wi ch (C) Gos nel l s (C) Wa nneroo (C) Swa n (C) Cockburn (C) Ma ndura h (C) Serpentine-Ja rra hda l e (S) Kwi na na (T) Arma da l e (C) Rocki ngha m (C) Mount Ba rker (DC) Pl a yford (C) Al l i a nce total Aus tra l i a There are 11 LGAs in which the proportion of Australian born with an overseas born father is greater than the proportion at the Alliance level. Within this group, the highest proportion occurs in Liverpool, where 46.5 percent of Australian born persons had a father who was born overseas. In Whittlesea and Hume, the proportion was 39.2 percent, while in Melton, Blacktown and Wanneroo, more than one third of the Australian born population had a father who had been born overseas. Proportions greater than 3 percent occurred in Casey, Wyndham, Gosnells and Cockburn. In the case of Australian born persons with an overseas born mother, the same 11 LGAs have proportions above that prevailing at the Alliance level. Further, the top 16 LGAs are the

69 69 same as for Australian born with an overseas born father, except that Hume and Whittlesea exchange second and third rank. Table 3:9 also allows the situation prevailing in the Alliance to be benchmarked against that for Australia. This shows that the same five LGAs Cardinia, Moreton Bay, Ipswich, Mandurah and Mount Barker have levels of Australian born persons with an overseas born father or mother less than those prevailing at the Australian level. This means, therefore, that generally Alliance LGAs have higher than expected levels of Australian born persons with an overseas born parent(s). This suggests that for most Alliance LGAs there is a strong connection to Australia s migration program, and that it is highly likely that this will have policy implications for these LGAs and potentially migration rates in the future as migrant settlement is often related to existing social networks and the development or existence of ethnic communities. 3.6 MIGRATION BY VISA CATEGORY While the census provides a wealth of data on migration, it does not indicate the main visa category by which a migrant can enter Australia. The Department of Immigration and Citizenship (DIAC) maintains a settlement reporting facility (SRF) which provides a wealth of information provided by migrants on their visa application. Table 3:1 shows the data that is provided by the SRF. These data can be accessed at several levels of enumeration, from statistical local area, through LGAs and statistical divisions to the State. However, of all the data available from the SRF, there are only three sets which are unavailable from Census data. Table 3:1: Data maintained on DIAC Settlement Reporting Facility Source: DIAC 213 This section starts with a general overall picture of migration into the Alliance LGAs over the period , before presenting a detailed analysis for each Alliance LGA of migration stream data derived from the SRF. There are three main visa categories Family, Humanitarian and Skilled and in this section data are examined to show, for the NGAA LGAs, the type of visa that migrants used for entry into Australia. Within the Alliance, the dominant visa category in the period has been the Skilled visa. At the overall level, Table 3:11 presents a profile for each LGA showing the mix of visa categories that have occurred in the 12 year period to December 212. The main points from the table are that, at the Alliance level, skilled migration accounts for some 57 percent of all migrants arriving into the Alliance area, compared with a little over 3 percent for family reunion migration and 12.7 percent for humanitarian migration. At this point in the analysis, what is significant is that the levels of skilled and family reunion migration into Alliance LGAs is less than the levels arriving in Australia. In contrast, the extent of the humanitarian stream into Alliance LGAs is nearly four percent above the size of the humanitarian stream
70 7 arriving in Australia. This means that in over half the Alliance LGAs the size of the humanitarian intake during the period has been at levels significantly higher than the size of the humanitarian stream into Australia. Table 3:11: Migration stream by visa category, Alliance LGAs, Source: DIAC Local government area Family Skilled Human- Total Family Skilled Human- Total itarian itarian s Percentage Blacktown (C) Camden (A) Campbelltown (C) Liverpool (C) Penrith (C) Casey (C) Cardinia (S) Wyndham (C) Melton (S) Hume (C) Whittlesea (C) Moreton Bay (Estimate) Logan (C) Ipswich (C) Gosnells (C) Wanneroo (C) Swan (C) Cockburn (C) Mandurah (C) Serpentine-Jarrahdale ( Kwinana (T) Armadale (C) Rockingham (C) Mount Barker (DC) Playford (C) Total Australia Table 3:12 shows numbers of migrants entering each of the member LGAs for each year from 21 to 212. In the period under review, some 24,486 migrants with a skilled visa settled in the various member LGAs 3. This was nearly double the number of migrants arriving under the family reunion scheme, as shown in Table 3:13. During the period there were 19, migrants arriving in Australia and indicating an intention to settle in an Alliance LGA. Finally, numbers arriving under the government s humanitarian refugee scheme amounted to some 45,536 immigrants during the period, as indicated in Table 3:14. 3 An important caveat in the use of SRF data is that the location of any migrant is where they indicated they would live on their visa application. The database is not upgraded with any data after arrival. Hence, there will be cases where migrants settle in an area different from that indicated on the visa application form. It is also the case that migrants are subject to mobility from their original location at any time after their arrival.
71 71 Table 3:12: Skilled migration entrants, Alliance LGAs, Source: DIAC Local government area 212 Skilled, numbers Blacktown (C) Camden (A) Campbelltown (C) Liverpool (C) Penrith (C) Casey (C) Cardinia (S) Wyndham (C) Melton (S) Hume (C) Whittlesea (C) Moreton Bay (Estimate) Logan (C) Ipswich (C) Gosnells (C) Wanneroo (C) Swan (C) Cockburn (C) Mandurah (C) Serpentine-Jarrahdale (S) Kwinana (T) Armadale (C) Rockingham (C) Mount Barker (DC) Playford (C) Total Table 3:13: Family migration entrants, Alliance LGAs, Source: DIAC Local government area 212 Family, numbers Blacktown (C) Camden (A) Campbelltown (C) Liverpool (C) Penrith (C) Casey (C) Cardinia (S) Wyndham (C) Melton (S) Hume (C) Whittlesea (C) Moreton Bay (Estimate) Logan (C) Ipswich (C) Gosnells (C) Wanneroo (C) Swan (C) Cockburn (C) Mandurah (C) Serpentine-Jarrahdale (S) Kwinana (T) Armadale (C) Rockingham (C) Mount Barker (DC) Playford (C) Total
72 72 Table 3:14: Humanitarian migration entrants, Alliance LGAs, Source: DIAC Local government area 212 Humanitarian, numbers Blacktown (C) Camden (A) Campbelltown (C) Liverpool (C) Penrith (C) Casey (C) Cardinia (S) Wyndham (C) Melton (S) Hume (C) Whittlesea (C) Moreton Bay (Estimate) Logan (C) Ipswich (C) Gosnells (C) Wanneroo (C) Swan (C) Cockburn (C) Mandurah (C) Serpentine-Jarrahdale (S) Kwinana (T) Armadale (C) Rockingham (C) Mount Barker (DC) 1 1 Playford (C) Total Total migration from all three visa types is shown in Table 3:15. In the 12 years to 212, total number of entrants under the three schemes was a little over 361, distributed between the 25 Alliance local government areas. Table 3:15: Total Skilled, Family and Humanitarian entrants, Alliance LGAs, Source: DIAC Local government area 212 Total, numbers Blacktown (C) 2,275 2,364 2,934 3,478 3,863 3,85 7,824 3,982 3,64 2,612 2,348 1, Camden (A) Campbelltown (C) ,62 1,93 1,2 1, Liverpool (C) 1,712 1,551 1,728 1,791 2,145 2,5 4,49 2,5 2,138 1,495 1,795 1, Penrith (C) , Casey (C) 1,565 1,685 2,144 2,525 3,628 3,84 8,525 4,378 3,446 2,542 2,147 1, Cardinia (S) , Wyndham (C) ,42 1,781 2,769 3,422 7,858 3,978 3,569 2,637 2,24 1, Melton (S) , Hume (C) 94 1,248 1,419 1,23 1,475 1,892 4,14 2,132 2,28 1,562 1,832 1, Whittlesea (C) ,26 1,573 2,23 4,286 2,292 2,6 1,556 1,611 1, Moreton Bay (Estimate) Logan (C) ,218 1,343 3,48 1,443 1,482 1,364 1,17 1, Ipswich (C) , Gosnells (C) ,29 1,236 1, Wanneroo (C) 895 1,48 1,595 1,977 2,795 3,43 8,196 4,275 3,16 2,234 2,295 1, Swan (C) ,157 2,568 1,364 1, Cockburn (C) ,97 2,73 1,527 1,39 1,269 1, Mandurah (C) , Serpentine-Jarrahdale (S) Kwinana (T) Armadale (C) , Rockingham (C) ,271 3,368 1,77 1,293 1,4 1, Mount Barker (DC) Playford (C) , Total
73 73 In the following graph series, the data above have been presented for each LGA to show: Temporal trends within each of the LGAs. Variations between the LGAs Variations between the three visa categories Figure 3.11: Entrants by visa category, New South Wales Alliance members, Source: DIAC , 16, 14, 12, 1, 8, 6, 4, 2, Blacktown Total Skilled Humanitarian Family Year 1, 9, 8, 7, 6, 5, 4, 3, 2, 1, Liverpool Total Skilled Humanitarian Family Year Camden Total Humanitarian Skilled Family 4, 3,5 3, 2,5 2, 1,5 1, 5 Penrith Total Humanitarian Skilled Family Year Year 3, 2,5 Total Skilled Campbelltown 2, 1,5 Humanitarian Family 1, Year Figure 3.12: Entrants by visa category, Victoria Alliance members, Source: DIAC , 16, 14, 12, 1, Casey Total Humanitarian Skilled Family 2,5 2, 1,5 Cardinia Total Humanitarian Skilled Family 8, 6, 1, 4, 2, Year Year
74 74 18, 16, 14, 12, Wyndham Total Humanitarian Skilled Family 9, 8, 7, 6, Hume Total Humanitarian Skilled Family 1, 5, 8, 4, 6, 3, 4, 2, 2, 1, Year Year 4, 3,5 3, 2,5 2, 1,5 1, 5 Melton Total Humanitarian Skilled Family 9, 8, 7, 6, 5, 4, 3, 2, 1, Whittlesea Total Humanitarian Skilled Family Year Year Figure 3.13: Entrants by visa category, Queensland Alliance members, Source: DIAC , 1, 8, Total Humanitarian Moreton Bay Skilled Family 4, 3,5 3, 2,5 Total Humanitarian Ipswich Skilled Family 6, 2, 4, 2, 1,5 1, Year Year 7, 6, 5, 4, 3, 2, 1, Total Humanitarian Logan Skilled Family Year
75 75 For 211 data distribution, the ABS has used a set of LGA boundaries developed in 211. These include the Moreton Bay (R) local government area. Census data derived for 211, and those data sets from time series profiles prepared after the 211 Census, have used the Moreton Bay (R) local government area boundary. However, the DIAC SRF data has not made this adjustment, and it continues to use boundaries based on the 21 Australian Standard Geographic Classification (ASGC). Hence, SRF data for Moreton Bay have been estimated on the basis of data available in the SRF for Redcliffe, Pine Rivers and Caboolture. Figure 3.14: Entrants by visa category, South Australia Alliance members, Source: DIAC Mount Barker 2,5 Playford 5 4 Total Humanitarian Skilled Family 2, 1,5 Total Humanitarian Skilled Family 3 2 1, Year Year Figure 3.15: Entrants by visa category, Western Australia Alliance members, Source: DIAC 213 5, 4,5 4, 3,5 3, Gosnells Total Humanitarian Skilled Family 6, 5, 4, Swan Total Humanitarian Skilled Family 2,5 3, 2, 1,5 2, 1, 5 1, Year Year 18, 16, 14, 12, Wanneroo Total Humanitarian Skilled Family 6, 5, 4, Cockburn Total Humanitarian Skilled Family 1, 8, 3, 6, 2, 4, 2, 1, Year Year
76 76 3,5 3, 2,5 Total Humanitarian Mandurah Skilled Family 3,5 3, 2,5 Total Humanitarian Armadale Skilled Family 2, 2, 1,5 1,5 1, 1, Year Year Serpentine-Jarrahdale Total Skilled Humanitarian Family 8, 7, 6, 5, 4, 3, 2, Rockingham Total Humanitarian Skilled Family 5 1, Year Year 1,8 1,6 1,4 1,2 Kwinana Total Humanitarian Skilled Family 1, Year The graph series from Figure 3.11 to Figure 3.15 shows that all LGAs have a similar pattern, except for Campbelltown in New South Wales, in which: There is steady growth to 26. A big spike in settlement numbers occurred in 27 s declined steadily after 27 By 212, numbers of entrants are at similar levels to those prevailing in 21. In the case of Campbelltown, numbers in each of the categories increased steadily to 28, after which there was steady decline through to 212, by which time entrants numbers were similar to those prevailing in 21. It is clear from the graph series that not all LGAs have received the same number of migrants in each of the visa categories. The tables below (Table 3:16 to Table 3:19) show both the absolute differences between the LGAs and their ranking at 21, 26 and 212, and for total numbers for the period, for each of the migration categories, and the total migrant stream from all categories. However, scrutiny of each table can reveal an interesting story for each LGA in terms of: Change in numbers through time.
77 77 The impact of this on their ranking. Differences in their intake numbers for difference migration categories. The total contribution that the three main migration streams have made on their jurisdiction. Table 3:16: Alliance LGAs ranked by skilled entrants, 21, 26, 212 and Source: DIAC 213 Skilled migration programme Blacktown (C) 1219 Blacktown (C) 274 Wanneroo (C) 1287 Wanneroo (C) Casey (C) 735 Casey (C) 2336 Wyndham (C) 895 Casey (C) 2177 Wanneroo (C) 518 Wanneroo (C) 254 Blacktown (C) 746 Blacktown (C) 2592 Liverpool (C) 478 Wyndham (C) 2284 Cockburn (C) 655 Wyndham (C) 2369 Wyndham (C) 466 Moreton Bay (Estimate) 1348 Casey (C) 653 Moreton Bay (Estimate) Moreton Bay (Estimate) 446 Whittlesea (C) 1334 Rockingham (C) 633 Whittlesea (C) Logan (C) 332 Liverpool (C) 821 Whittlesea (C) 438 Rockingham (C) 1747 Cockburn (C) 297 Cockburn (C) 756 Moreton Bay (Estimate) 418 Cockburn (C) 9464 Campbelltown (C) 29 Logan (C) 641 Swan (C) 49 Liverpool (C) 7775 Whittlesea (C) 261 Campbelltown (C) 577 Gosnells (C) 352 Hume (C) 7765 Hume (C) 235 Hume (C) 822 Hume (C) 28 Swan (C) 7327 Penrith (C) 229 Rockingham (C) 182 Liverpool (C) 24 Gosnells (C) 6271 Rockingham (C) 213 Swan (C) 734 Mandurah (C) 238 Logan (C) 617 Swan (C) 213 Penrith (C) 378 Armadale (C) 236 Campbelltown (C) 489 Melton (S) 156 Gosnells (C) 434 Logan (C) 228 Mandurah (C) 488 Gosnells (C) 14 Melton (S) 483 Melton (S) 188 Melton (S) 4533 Ipswich (C) 124 Mandurah (C) 49 Ipswich (C) 188 Armadale (C) 4474 Armadale (C) 95 Armadale (C) 49 Penrith (C) 145 Ipswich (C) 4467 Mandurah (C) 72 Ipswich (C) 422 Campbelltown (C) 14 Penrith (C) 4185 Playford (C) 5 Cardinia (S) 244 Kwinana (T) 12 Cardinia (S) 244 Camden (A) 47 Camden (A) 93 Cardinia (S) 87 Kwinana (T) 2212 Mount Barker (DC) 33 Playford (C) 15 Playford (C) 38 Playford (C) 1231 Cardinia (S) 3 Kwinana (T) 18 Camden (A) 31 Mount Barker (DC) 94 Kwinana (T) 29 Mount Barker (DC) 14 Serpentine-Jarrahdale (S) 24 Camden (A) 93 Serpentine-Jarrahdale (S) 19 Serpentine-Jarrahdale (S) 63 Mount Barker (DC) 22 Serpentine-Jarrahdale (S) 618 Table 3:17: Alliance LGAs ranked by family entrants, 21, 26, 212 and Source: DIAC 213 Family migration programme Blacktown (C) 724 Blacktown (C) 1216 Blacktown (C) 87 Blacktown (C) 1466 Liverpool (C) 55 Casey (C) 995 Casey (C) 689 Casey (C) Casey (C) 452 Liverpool (C) 84 Wyndham (C) 622 Liverpool (C) 9553 Hume (C) 4 Wyndham (C) 748 Liverpool (C) 534 Wyndham (C) 9277 Moreton Bay (Estimate) 312 Whittlesea (C) 579 Whittlesea (C) 463 Hume (C) 7133 Whittlesea (C) 38 Wanneroo (C) 54 Hume (C) 448 Whittlesea (C) 6659 Campbelltown (C) 276 Hume (C) 534 Moreton Bay (Estimate) 341 Wanneroo (C) 6366 Logan (C) 251 Moreton Bay (Estimate) 517 Wanneroo (C) 326 Moreton Bay (Estimate) 624 Wyndham (C) 233 Campbelltown (C) 432 Logan (C) 311 Logan (C) 4899 Wanneroo (C) 229 Logan (C) 386 Swan (C) 236 Campbelltown (C) 4426 Penrith (C) 182 Swan (C) 32 Gosnells (C) 222 Penrith (C) 359 Swan (C) 147 Cockburn (C) 279 Cockburn (C) 217 Swan (C) 3411 Cockburn (C) 133 Penrith (C) 262 Campbelltown (C) 212 Cockburn (C) 3355 Ipswich (C) 131 Ipswich (C) 24 Ipswich (C) 197 Ipswich (C) 2958 Melton (S) 99 Melton (S) 23 Penrith (C) 183 Melton (S) 2859 Rockingham (C) 93 Gosnells (C) 197 Rockingham (C) 175 Gosnells (C) 2583 Gosnells (C) 85 Rockingham (C) 176 Melton (S) 172 Rockingham (C) 2573 Armadale (C) 6 Armadale (C) 149 Armadale (C) 124 Armadale (C) 175 Camden (A) 59 Mandurah (C) 16 Cardinia (S) 88 Mandurah (C) 1363 Mandurah (C) 41 Cardinia (S) 97 Playford (C) 84 Cardinia (S) 1223 Playford (C) 38 Playford (C) 96 Mandurah (C) 81 Playford (C) 1149 Cardinia (S) 36 Camden (A) 66 Kwinana (T) 65 Kwinana (T) 824 Kwinana (T) 26 Kwinana (T) 54 Camden (A) 3 Camden (A) 788 Mount Barker (DC) 2 Serpentine-Jarrahdale (S) 31 Serpentine-Jarrahdale (S) 13 Mount Barker (DC) 365 Serpentine-Jarrahdale (S) 8 Mount Barker (DC) 29 Mount Barker (DC) 13 Serpentine-Jarrahdale (S) 258
78 78 Table 3:18: Alliance LGAs ranked by humanitarian entrants, 21, 26, 212 and Source: DIAC 213 Humanitarian migration programme Liverpool (C) 675 Hume (C) 534 Logan (C) 447 Liverpool (C) 7 Casey (C) 371 Blacktown (C) 514 Hume (C) 397 Blacktown (C) 626 Blacktown (C) 324 Casey (C) 55 Liverpool (C) 341 Hume (C) 672 Hume (C) 257 Wyndham (C) 389 Blacktown (C) 34 Casey (C) 482 Wanneroo (C) 144 Liverpool (C) 38 Casey (C) 333 Logan (C) 471 Logan (C) 123 Wanneroo (C) 321 Wyndham (C) 247 Wyndham (C) 3425 Whittlesea (C) 116 Logan (C) 315 Whittlesea (C) 199 Wanneroo (C) 2683 Swan (C) 83 Playford (C) 282 Wanneroo (C) 189 Whittlesea (C) 1879 Cockburn (C) 7 Ipswich (C) 185 Ipswich (C) 126 Playford (C) 1756 Campbelltown (C) 55 Gosnells (C) 153 Gosnells (C) 126 Gosnells (C) 1257 Penrith (C) 5 Swan (C) 121 Playford (C) 115 Swan (C) 1153 Gosnells (C) 5 Whittlesea (C) 19 Kwinana (T) 64 Ipswich (C) 16 Melton (S) 42 Melton (S) 11 Penrith (C) 52 Penrith (C) 9 Wyndham (C) 41 Penrith (C) 88 Swan (C) 48 Melton (S) 791 Playford (C) 19 Armadale (C) 69 Campbelltown (C) 38 Campbelltown (C) 56 Armadale (C) 13 Cockburn (C) 62 Melton (S) 19 Cockburn (C) 517 Rockingham (C) 1 Moreton Bay (Estimate) 51 Cockburn (C) 16 Armadale (C) 436 Moreton Bay (Estimate) 9 Campbelltown (C) 5 Armadale (C) 13 Moreton Bay (Estimate) 318 Ipswich (C) 9 Cardinia (S) 42 Moreton Bay (Estimate) 13 Kwinana (T) 25 Kwinana (T) 7 Kwinana (T) 27 Rockingham (C) 4 Cardinia (S) 175 Camden (A) 6 Rockingham (C) 13 Mandurah (C) 2 Rockingham (C) 132 Cardinia (S) 2 Mandurah (C) 5 Cardinia (S) Mandurah (C) 85 Mandurah (C) 1 Camden (A) 2 Camden (A) Camden (A) 39 Mount Barker (DC) 1 Mount Barker (DC) Mount Barker (DC) Serpentine-Jarrahdale (S) 4 Serpentine-Jarrahdale (S) Serpentine-Jarrahdale (S) Serpentine-Jarrahdale (S) Mount Barker (DC) 1 Table 3:19: Alliance LGAs ranked by total entrants, 21, 26, 212 and Source: DIAC 213 All migration programmes Blacktown (C) 2,275 Casey (C) 3,84 Blacktown (C) 1,932 Blacktown (C) 4121 Liverpool (C) 1,712 Blacktown (C) 3,85 Wanneroo (C) 1,924 Casey (C) Casey (C) 1,565 Wyndham (C) 3,422 Wyndham (C) 1,819 Wanneroo (C) Hume (C) 94 Wanneroo (C) 3,43 Casey (C) 1,76 Wyndham (C) Wanneroo (C) 895 Whittlesea (C) 2,23 Hume (C) 1,146 Liverpool (C) 2441 Moreton Bay (Estimate) 767 Liverpool (C) 2,5 Liverpool (C) 1,132 Moreton Bay (Estimate) Wyndham (C) 744 Moreton Bay (Estimate) 1918 Whittlesea (C) 1,131 Hume (C) 2135 Logan (C) 77 Hume (C) 1,892 Logan (C) 1,7 Whittlesea (C) 2275 Whittlesea (C) 685 Logan (C) 1,343 Cockburn (C) 977 Logan (C) 1524 Campbelltown (C) 622 Rockingham (C) 1,271 Rockingham (C) 853 Rockingham (C) Cockburn (C) 52 Swan (C) 1,157 Moreton Bay (Estimate) 825 Cockburn (C) Penrith (C) 462 Cockburn (C) 1,97 Gosnells (C) 727 Swan (C) 1197 Swan (C) 443 Campbelltown (C) 1,62 Swan (C) 725 Gosnells (C) 1173 Rockingham (C) 319 Ipswich (C) 847 Ipswich (C) 558 Campbelltown (C) 9921 Melton (S) 297 Melton (S) 815 Mandurah (C) 47 Penrith (C) 8711 Gosnells (C) 275 Gosnells (C) 784 Campbelltown (C) 46 Ipswich (C) 8538 Ipswich (C) 266 Penrith (C) 728 Melton (S) 393 Melton (S) 8228 Armadale (C) 171 Armadale (C) 713 Penrith (C) 389 Armadale (C) 6656 Mandurah (C) 114 Playford (C) 528 Armadale (C) 387 Mandurah (C) 6455 Camden (A) 113 Mandurah (C) 522 Kwinana (T) 239 Playford (C) 415 Playford (C) 18 Cardinia (S) 386 Playford (C) 237 Cardinia (S) 3823 Cardinia (S) 7 Kwinana (T) 261 Cardinia (S) 175 Kwinana (T) 333 Kwinana (T) 62 Mount Barker (DC) 169 Camden (A) 67 Camden (A) 1773 Mount Barker (DC) 54 Camden (A) 161 Serpentine-Jarrahdale (S) 38 Mount Barker (DC) 139 Serpentine-Jarrahdale (S) 27 Serpentine-Jarrahdale (S) 94 Mount Barker (DC) 36 Serpentine-Jarrahdale (S) 883
79 79 Finally in this section, an estimate is made of the share of the burden of settling migrants that is undertaken by Alliance LGAs. In the table below, each Alliance LGA s share of its state population in 211 is shown, together with its share of each of migration streams arriving in their state for 211. The argument here is that if an LGA has a certain proportion of its state population it might be expected to receive that proportion of the state s migration intake. Where this does not occur, it indicates that certain processes are at work to cause an imbalance between proportion of state population and proportion of migration intake received. These imbalances can be an indication of the significant role that LGAs carry in the process of settling migrants into their areas. These imbalances will have implications for the respective local authorities. Table 3:2: Migration intakes compared with LGA share of state population, 211 Source: DIAC 213 Local government area LGA population as percent of State population, 211 Family Skilled Humanitarian Total LGA intake as percent of State intake, 211 Blacktown (C) Camden (A) Campbelltown (C) (NSW) Liverpool (C) Penrith (C) Cas ey (C) Cardinia (S) Wyndham (C) Melton (S) Hume (C) Whittles ea (C) Moreton Bay (R) Logan (C) Ips wich (C) Gos nells (C) Wanneroo (C) Swan (C) Cockburn (C) Mandurah (C) Serpentine-Jarrahdale (S) Kwinana (T) Armadale (C) Rockingham (C) Mount Barker (DC) Playford (C) LGAs which received a share of family migration greater than might be expected on the basis of their share of state population were Blacktown, Liverpool, Casey, Hume, Whittlesea, Wanneroo, Cockburn and Kwinana. For skilled migration, LGAs receiving more immigrants with this visa category were Wyndham, Whittlesea, Wanneroo, Cockburn and Rockingham. In the case of humanitarian stream migrants, LGAs which appear to be shouldering the burden of this group, relative to their share of state population, are Blacktown, Liverpool, Casey, Wyndham, Hume, Logan, Wanneroo and Playford. Three LGAs had shares of each migration stream above their share of their state s population. These LGAs Wyndham, Whittlesea and Wanneroo are clear migrant reception centres within the Alliance, and in their strong migrant populations may raise a number on planning and policy issues within these jurisdictions.
80 8 In a further four LGAs Blacktown, Liverpool, Casey and Cockburn intake levels were higher than these LGAs share of state population for two of the three migration streams. Clearly, these LGAs are also key reception areas for Australia s migration stream. 3.7 COUNTRY OF BIRTH BY VISA CATEGORY While the Census provides data on country of birth of migrants, and thereby gives insights into the extent of ethnic diversity in any area, the DIAC data provides data on the birthplace country of migrants who arrive via various migration streams 4. An examination of these data should indicate whether different visa categories draw their intakes from different countries. And, if this is so, there may be implications in terms of service provision and other responses in the communities in which these migrants choose to reside. In the following series of tables, the top ten source countries for each of the migration streams are presented for 21, 27 and , rather than 26, has been selected as a midpoint year because of the huge spike in migrant arrivals into most of the Alliance LGAs in this year, compared with the years on either side. These results allow for both an identification of birthplace country, and the numbers arriving from each country. Therefore, analysis of the tables, which show the top ten birthplace countries, will indicate the mix of countries from which migrants are drawn, as well as the numbers of migrants arriving from these countries. Table 3:21: Birthplace by visa category, New South Wales Alliance LGAs, Source: DIAC 213 Blacktown Family migration PHILIPPINES 148 INDIA 268 INDIA 147 INDIA 12 PHILIPPINES 199 PHILIPPINES 127 FIJI 59 FIJI 11 CHINA PEOPLES REP 83 CHINA PEOPLES 37 PAKISTAN 87 PAKISTAN 61 SRI LANKA 36 CHINA PEOPLES REP 73 FIJI 52 LEBANON 23 BANGLADESH 48 AFGHANISTAN 33 IRAQ 22 SRI LANKA 43 SRI LANKA 28 U.S.A. 21 MALAYSIA 24 SUDAN 18 THAILAND 2 AFGHANISTAN 23 EGYPT ARAB REP OF 17 TURKEY 17 INDONESIA 21 UNITED KINGDOM 17 Humanitarian migration SUDAN 55 SUDAN 83 IRAQ 114 AFGHANISTAN 49 IRAQ 36 IRAN 98 CROATIA 34 PAKISTAN 27 PAKISTAN 23 FORMER YUGOSLAV 26 AFGHANISTAN 2 AFGHANISTAN 22 BOSNIA-HERZEGOV 18 SIERRA LEONE 17 BHUTAN 12 IRAQ 18 SRI LANKA 17 SRI LANKA 12 SRI LANKA 15 IRAN 15 KUWAIT 9 IRAN 12 EGYPT ARAB REP OF 13 BURMA 8 SERBIA & MONTEN 12 CHINA PEOPLES REP 11 EGYPT ARAB REP OF 6 CHINA PEOPLES 9 LIBERIA 1 GUINEA 4 Skilled migration INDIA 334 INDIA 192 INDIA 199 PHILIPPINES 26 PHILIPPINES 468 PHILIPPINES 168 FIJI 22 FIJI 77 PAKISTAN 72 STH AFRICA REP 75 STH AFRICA REP 72 SRI LANKA 42 SRI LANKA 45 SRI LANKA 69 AUSTRALIA 36 INDONESIA 42 PAKISTAN 66 FIJI 29 CHINA PEOPLES 36 CHINA PEOPLES REP 57 EGYPT ARAB REP OF 25 PAKISTAN 34 BANGLADESH 46 UNITED KINGDOM 17 KOREA REP OF 27 UNITED KINGDOM 45 CHINA PEOPLES REP 16 BANGLADESH 2 NEPAL 3 NEW ZEALAND 14 Liverpool Family migration FIJI 79 VIETNAM 11 VIETNAM 95 LEBANON 69 FIJI 9 CHINA PEOPLES REP 53 VIETNAM 4 INDIA 64 FIJI 45 IRAQ 35 LEBANON 57 INDIA 45 PHILIPPINES 35 CHINA PEOPLES REP 52 IRAQ 43 INDIA 28 IRAQ 46 LEBANON 31 CHINA PEOPLES REP 25 PHILIPPINES 4 CAMBODIA 25 CAMBODIA 16 CAMBODIA 36 PHILIPPINES 21 FYR OF MACEDONIA 16 PAKISTAN 24 THAILAND 14 SERBIA & MONTENEGRO 14 INDONESIA 16 PAKISTAN 13 Humanitarian migration CROATIA 25 IRAQ 26 IRAQ 229 IRAQ 192 IRAN 2 IRAN 45 FORMER YUGOSLAVIA 76 DEM REP OF CONGO 14 KUWAIT 23 BOSNIA-HERZEGOVINA 48 SIERRA LEONE 14 EGYPT ARAB REP OF 12 IRAN 31 JORDAN 8 PAKISTAN 8 SUDAN 24 SUDAN 7 SYRIA 6 SERBIA & MONTENEGRO 16 AFGHANISTAN 6 AFGHANISTAN 5 AFGHANISTAN 14 AUSTRALIA 5 BURMA 4 AUSTRALIA 8 CHINA PEOPLES REP 5 CYPRUS 3 SIERRA LEONE 7 ZIMBABWE 5 TURKEY 2 Skilled migration FIJI 174 INDIA 274 INDIA 8 INDIA 89 FIJI 75 PAKISTAN 42 PAKISTAN 32 PHILIPPINES 52 FIJI 36 STH AFRICA REP 19 PAKISTAN 4 PHILIPPINES 14 CHINA PEOPLES REP 18 ZIMBABWE 38 EGYPT ARAB REP OF 13 PHILIPPINES 14 CHINA PEOPLES REP 35 SRI LANKA 7 MALAYSIA 13 EGYPT ARAB REP OF 25 AUSTRALIA 6 INDONESIA 11 BANGLADESH 16 UNITED ARAB EMIRATES 6 TAIWAN 11 STH AFRICA REP 16 NEW ZEALAND 5 ENGLAND 9 UNITED KINGDOM 16 CHINA PEOPLES REP 4 4 It is important to note here that New Zealand is not represented in this data as no visa is required for New Zealanders migrating to Australia.
81 81 Camden Family migration ENGLAND 9 UNITED KINGDOM 19 PHILIPPINES 6 UNITED KINGDOM 6 CHINA PEOPLES REP 12 UNITED KINGDOM 5 U.S.A. 5 INDIA 8 CHINA PEOPLES REP 4 IRELAND 3 LEBANON 7 IRAQ 2 KOREA REP OF 3 THAILAND 5 CAMBODIA 1 PHILIPPINES 3 U.S.A. 4 CANADA 1 THAILAND 3 ENGLAND 3 CHILE 1 FIJI 2 ROMANIA 3 FIJI 1 FMR U.S.S.R. 2 STH AFRICA REP 3 JORDAN 1 GERMANY 2 IRAN 2 LAOS 1 Humanitarian migration SOMALIA 5 ZIMBABWE 2 IRAQ 1 Skilled migration STH AFRICA REP 12 UNITED KINGDOM 41 KAZAKHSTAN 4 ENGLAND 4 CHINA PEOPLES REP 1 PAKISTAN 4 FIJI 4 STH AFRICA REP 9 SRI LANKA 4 INDIA 4 ENGLAND 7 FIJI 3 KENYA 3 ZIMBABWE 7 ZIMBABWE 3 SCOTLAND 3 IRELAND 6 ENGLAND 2 TAIWAN 3 INDIA 4 STH AFRICA REP 2 CHINA PEOPLES REP 2 MAURITIUS 4 UNITED KINGDOM 2 HONG KONG 2 SCOTLAND 4 AUSTRALIA 1 UNITED KINGDOM 2 AUSTRALIA 2 BANGLADESH 1 Penrith Family migration PHILIPPINES 21 PHILIPPINES 64 PHILIPPINES 28 U.S.A. 17 INDIA 42 FIJI 16 FIJI 12 CHINA PEOPLES REP 24 INDIA 16 INDIA 12 UNITED KINGDOM 2 CHINA PEOPLES REP 15 UNITED KINGDOM 12 PAKISTAN 15 PAKISTAN 9 LEBANON 1 THAILAND 15 GHANA 8 CHINA PEOPLES REP 9 FIJI 7 UNITED KINGDOM 8 CANADA 7 LEBANON 7 THAILAND 6 STH AFRICA REP 7 U.S.A. 7 EGYPT ARAB REP OF 5 PAKISTAN 5 ZIMBABWE 7 NIGERIA 5 Humanitarian migration AFGHANISTAN 16 SUDAN 17 IRAQ 15 IRAQ 7 IRAN 1 PAKISTAN 11 SRI LANKA 6 KENYA 6 IRAN 6 SUDAN 5 FIJI 4 SUDAN 6 AUSTRALIA 2 ZIMBABWE 4 AFGHANISTAN 5 CHINA PEOPLES REP 2 AFGHANISTAN 3 BHUTAN 4 FMR U.S.S.R. 2 DEM REP OF CONGO 3 SRI LANKA 4 FORMER YUGOSLAVIA 2 CONGO REPUBLIC 2 TURKEY 1 LEBANON 2 PAKISTAN 2 AUSTRALIA CONGO REPUBLIC 1 SRI LANKA 2 BANGLADESH Skilled migration PHILIPPINES 45 INDIA 169 PHILIPPINES 26 INDIA 42 UNITED KINGDOM 45 INDIA 24 STH AFRICA REP 3 PHILIPPINES 44 PAKISTAN 2 FIJI 18 CHINA PEOPLES REP 18 UNITED KINGDOM 11 UNITED KINGDOM 1 FIJI 17 SRI LANKA 1 INDONESIA 9 NEPAL 12 AUSTRALIA 8 NEPAL 9 ZIMBABWE 12 BANGLADESH 7 ENGLAND 8 SRI LANKA 9 FIJI 5 PAKISTAN 8 STH AFRICA REP 9 NIGERIA 5 CHINA PEOPLES REP 6 PAKISTAN 8 EGYPT ARAB REP OF 4 Campbelltown Family migration FIJI 31 INDIA 66 PHILIPPINES 3 PHILIPPINES 3 PHILIPPINES 64 CHINA PEOPLES REP 27 INDIA 28 FIJI 41 BANGLADESH 14 LEBANON 17 BANGLADESH 37 INDIA 14 INDONESIA 13 CHINA PEOPLES REP 29 PAKISTAN 14 BANGLADESH 12 PAKISTAN 22 FIJI 11 UNITED KINGDOM 12 LEBANON 19 SAMOA 7 U.S.A. 1 U.S.A. 17 CAMBODIA 5 CHINA PEOPLES REP 9 VIETNAM 11 LEBANON 5 PAKISTAN 8 MALAYSIA 8 NEPAL 5 Humanitarian migration FORMER YUGOSLAVIA 9 PAKISTAN 8 IRAN 1 SUDAN 9 BURMA 6 IRAQ 1 AFGHANISTAN 7 IRAQ 6 EGYPT ARAB REP OF 8 IRAQ 7 AFGHANISTAN 4 PAKISTAN 4 AUSTRALIA 4 SUDAN 4 AFGHANISTAN 3 BANGLADESH 4 CHINA PEOPLES REP 3 PAPUA NEW GUINEA 2 CHINA PEOPLES REP 4 ETHIOPIA 3 CYPRUS 1 IRAN 4 DEMOCRATIC REPUBLIC 2 AUSTRALIA BOSNIA-HERZEGOVINA 2 EGYPT ARAB REP OF 2 BANGLADESH GERMANY 1 GUINEA 2 BELGIUM Skilled migration INDIA 62 INDIA 245 INDIA 27 FIJI 34 BANGLADESH 5 PHILIPPINES 18 PHILIPPINES 34 PHILIPPINES 42 FIJI 17 STH AFRICA REP 3 FIJI 31 PAKISTAN 13 PAKISTAN 23 CHINA PEOPLES REP 3 BANGLADESH 12 BANGLADESH 18 ZIMBABWE 3 UNITED KINGDOM 1 CHINA PEOPLES REP 13 UNITED KINGDOM 22 SRI LANKA 6 INDONESIA 8 STH AFRICA REP 16 STH AFRICA REP 4 ENGLAND 6 INDONESIA 14 AUSTRALIA 3 MALAYSIA 5 PAKISTAN 14 COLOMBIA 3
82 82 There are a number of points emerging from Table 3:21: In Blacktown, the Philippines and India, and to a lesser extent Fiji, are the main source of family and skilled migrants Liverpool has consistently received large numbers of humanitarian migrants from Iraq, and to a lesser extent, Iran. In the other LGAs there is less of a concentration of migrants originating in two or three countries. For most LGAs, there is a difference between countries supplying humanitarian migrants and those supplying skilled migrants. Camden has a very low incidence of humanitarian migrants. Table 3:22: Birthplace by visa category, Victoria Alliance LGAs, Source: DIAC 213 Casey Family migration SRI LANKA 57 INDIA 171 INDIA 112 INDIA 49 AFGHANISTAN 125 AFGHANISTAN 91 FIJI 27 SRI LANKA 86 CHINA PEOPLES REP 75 PHILIPPINES 24 CHINA PEOPLES REP 62 SRI LANKA 59 UNITED KINGDOM 24 CAMBODIA 55 CAMBODIA 44 ROMANIA 2 PHILIPPINES 5 PAKISTAN 37 CHINA PEOPLES REP 19 UNITED KINGDOM 41 PHILIPPINES 35 U.S.A. 17 PAKISTAN 36 VIETNAM 2 AFGHANISTAN 12 VIETNAM 23 THAILAND 17 CAMBODIA 11 EGYPT ARAB REP OF 22 FIJI 13 Humanitarian migration AFGHANISTAN 197 AFGHANISTAN 276 AFGHANISTAN 233 SUDAN 45 PAKISTAN 37 PAKISTAN 44 CROATIA 33 SUDAN 34 IRAN 3 FORMER YUGOSLAVIA 22 IRAN 18 EGYPT ARAB REP OF 11 BOSNIA-HERZEGOVINA 19 IRAQ 16 SRI LANKA 11 EGYPT ARAB REP OF 13 KENYA 14 AUSTRALIA 2 AUSTRALIA 8 SRI LANKA 14 BURMA 1 SRI LANKA 8 BURMA 1 IRAQ 1 IRAQ 4 EGYPT ARAB REP OF 1 BURMA 3 ZIMBABWE 7 Skilled migration INDIA 222 INDIA 895 SRI LANKA 156 SRI LANKA 115 SRI LANKA 382 INDIA 155 STH AFRICA REP 5 CHINA PEOPLES REP 193 UNITED KINGDOM 37 FIJI 49 PHILIPPINES 182 CHINA PEOPLES REP 33 INDONESIA 24 UNITED KINGDOM 175 STH AFRICA REP 3 MAURITIUS 22 MAURITIUS 137 PHILIPPINES 26 PHILIPPINES 2 MALAYSIA 79 AUSTRALIA 22 SINGAPORE 2 STH AFRICA REP 72 MALAYSIA 21 MALAYSIA 18 SINGAPORE 45 NEW ZEALAND 14 UNITED KINGDOM 17 FIJI 4 PAKISTAN 14 Cardinia Family migration UNITED KINGDOM 6 UNITED KINGDOM 22 INDIA 13 INDIA 2 INDIA 16 THAILAND 12 PHILIPPINES 2 SRI LANKA 13 UNITED KINGDOM 1 THAILAND 2 PHILIPPINES 9 CHINA PEOPLES REP 8 U.S.A. 2 CHINA PEOPLES REP 7 PHILIPPINES 5 ZIMBABWE 2 INDONESIA 6 SUDAN 4 AFGHANISTAN 1 ENGLAND 4 U.S.A. 4 BANGLADESH 1 GERMANY 4 COLOMBIA 3 CANADA 1 MAURITIUS 4 STH AFRICA REP 3 CHILE 1 THAILAND 4 CANADA 2 Humanitarian migration AFGHANISTAN 1 SUDAN 15 FIJI 1 SRI LANKA 4 ETHIOPIA 3 KENYA 2 EGYPT ARAB REP OF 1 ERITREA 1 LIBERIA 1 UGANDA 1 Skilled migration STH AFRICA REP 9 UNITED KINGDOM 96 UNITED KINGDOM 14 ENGLAND 8 INDIA 75 SRI LANKA 13 KENYA 5 SRI LANKA 31 EGYPT ARAB REP OF 1 UNITED KINGDOM 3 PHILIPPINES 23 MALAYSIA 1 PHILIPPINES 2 MAURITIUS 17 INDIA 6 CYPRUS 1 MALAYSIA 13 AUSTRALIA 4 INDIA 1 BANGLADESH 12 ENGLAND 4 KOREA REP OF 1 ZIMBABWE 11 PHILIPPINES 4 STH AFRICA REP 8 SCOTLAND 4 SINGAPORE 7 GERMANY 3
83 83 Wyndham Family migration INDIA 24 INDIA 313 INDIA 157 UNITED KINGDOM 15 CHINA PEOPLES REP 71 CHINA PEOPLES REP 113 SRI LANKA 13 PHILIPPINES 59 PHILIPPINES 39 THAILAND 12 UNITED KINGDOM 38 VIETNAM 32 CHINA PEOPLES REP 11 VIETNAM 28 PAKISTAN 24 LEBANON 11 PAKISTAN 26 THAILAND 24 U.S.A. 11 LEBANON 22 ETHIOPIA 16 VIETNAM 1 THAILAND 21 INDONESIA 16 PHILIPPINES 8 BANGLADESH 18 MALAYSIA 14 ENGLAND 6 INDONESIA 18 SRI LANKA 13 Humanitarian migration FORMER YUGOSLAVIA 12 BURMA 296 BURMA 15 SUDAN 12 THAILAND 16 THAILAND 38 IRAQ 5 SUDAN 23 IRAN 35 AFGHANISTAN 4 SERBIA & MONTENEGRO 11 IRAQ 22 ETHIOPIA 2 ETHIOPIA 9 ETHIOPIA 14 SERBIA & MONTENEGRO 2 DEM REP OF CONGO 7 AFGHANISTAN 8 BURMA 1 IRAQ 7 ERITREA 5 CROATIA 1 SIERRA LEONE 7 PAKISTAN 4 ERITREA 1 SRI LANKA 7 SAUDI ARABIA 4 SRI LANKA 1 ZIMBABWE 6 EGYPT ARAB REP OF 3 Skilled migration INDIA 11 INDIA 872 INDIA 272 PHILIPPINES 52 CHINA PEOPLES REP 253 CHINA PEOPLES REP 14 INDONESIA 47 PHILIPPINES 248 PHILIPPINES 69 MALAYSIA 36 UNITED KINGDOM 176 PAKISTAN 61 STH AFRICA REP 25 MALAYSIA 15 UNITED KINGDOM 6 CHINA PEOPLES REP 24 SRI LANKA 94 AUSTRALIA 38 SINGAPORE 22 SINGAPORE 73 SRI LANKA 29 FIJI 16 INDONESIA 65 MALAYSIA 28 SRI LANKA 15 STH AFRICA REP 54 SINGAPORE 28 PAKISTAN 11 PAKISTAN 48 NEW ZEALAND 27 Melton Family migration INDIA 12 INDIA 52 INDIA 36 UNITED KINGDOM 8 CHINA PEOPLES REP 22 VIETNAM 16 VIETNAM 8 PHILIPPINES 2 PHILIPPINES 14 PHILIPPINES 7 VIETNAM 15 THAILAND 13 EGYPT ARAB REP OF 4 UNITED KINGDOM 12 CHINA PEOPLES REP 7 ENGLAND 4 U.S.A. 9 INDONESIA 7 FIJI 4 FYR OF MACEDONIA 8 SRI LANKA 7 INDONESIA 4 PAKISTAN 8 ALBANIA 6 LEBANON 4 SRI LANKA 8 LEBANON 6 SERBIA & MONTENEGRO 4 LEBANON 7 MALAYSIA 6 Humanitarian migration FORMER YUGOSLAVIA 19 SUDAN 18 BURMA 7 SUDAN 5 INDONESIA 17 IRAN 7 CROATIA 3 BURMA 1 AFGHANISTAN 1 INDIA 3 IRAQ 9 KUWAIT 1 BOSNIA-HERZEGOVINA 2 KENYA 7 PAKISTAN 1 DEM REP TIMOR-LESTE 2 EGYPT ARAB REP OF 6 STATELESS 1 IRAQ 2 ERITREA 5 SUDAN 1 AFGHANISTAN 1 LEBANON 5 GERMANY 1 IVORY COAST 3 KUWAIT 1 ETHIOPIA 2 Skilled migration INDIA 49 INDIA 237 INDIA 57 PHILIPPINES 14 PHILIPPINES 14 PHILIPPINES 41 SRI LANKA 13 SRI LANKA 4 SRI LANKA 17 STH AFRICA REP 8 UNITED KINGDOM 27 PAKISTAN 12 SINGAPORE 7 CHINA PEOPLES REP 21 AUSTRALIA 1 MALAYSIA 6 MALAYSIA 14 MAURITIUS 7 NIGERIA 6 EGYPT ARAB REP OF 12 NEW ZEALAND 7 PAKISTAN 6 AUSTRALIA 9 MALAYSIA 5 UNITED KINGDOM 6 BANGLADESH 8 IRAN 4 INDONESIA 5 FIJI 8 ZIMBABWE 4 Hume Family migration TURKEY 98 LEBANON 14 INDIA 65 LEBANON 61 TURKEY 94 LEBANON 53 IRAQ 41 INDIA 78 TURKEY 5 INDIA 26 IRAQ 71 IRAQ 28 PHILIPPINES 21 PHILIPPINES 31 PHILIPPINES 28 SRI LANKA 14 SRI LANKA 25 THAILAND 24 FIJI 13 SYRIA 18 SYRIA 22 SYRIA 13 PAKISTAN 17 SRI LANKA 18 UNITED KINGDOM 7 VIETNAM 17 PAKISTAN 14 CHINA PEOPLES REP 6 EGYPT ARAB REP OF 16 VIETNAM 12 Humanitarian migration IRAQ 165 IRAQ 329 IRAQ 295 IRAN 24 IRAN 17 BHUTAN 2 TURKEY 18 TURKEY 1 IRAN 19 FORMER YUGOSLAVIA 13 SYRIA 6 NEPAL 17 AUSTRALIA 5 AUSTRALIA 2 EGYPT ARAB REP OF 16 ERITREA 5 ETHIOPIA 2 AFGHANISTAN 12 VIETNAM 5 LEBANON 2 SYRIA 5 BOSNIA-HERZEGOVINA 4 SRI LANKA 2 TURKEY 3 SOMALIA 4 BAHRAIN 1 KUWAIT 2 CYPRUS 2 CHINA PEOPLES REP 1 PAKISTAN 2 Skilled migration INDIA 49 INDIA 341 SRI LANKA 6 SRI LANKA 42 SRI LANKA 116 INDIA 58 PHILIPPINES 19 PHILIPPINES 97 PAKISTAN 27 INDONESIA 15 UNITED KINGDOM 38 AUSTRALIA 21 FIJI 13 CHINA PEOPLES REP 33 UNITED KINGDOM 2 SINGAPORE 13 PAKISTAN 24 PHILIPPINES 17 UNITED KINGDOM 1 TURKEY 24 CHINA PEOPLES REP 1 TURKEY 9 STH AFRICA REP 22 LEBANON 7 U.S.A. 7 ZIMBABWE 21 SINGAPORE 7 FINLAND 6 FIJI 19 STH AFRICA REP 7 Whittlesea Family migration FYR OF MACEDONIA 42 INDIA 16 CHINA PEOPLES REP 9 VIETNAM 27 CHINA PEOPLES REP 83 INDIA 73 SRI LANKA 24 VIETNAM 42 VIETNAM 37 LEBANON 23 FYR OF MACEDONIA 35 FYR OF MACEDONIA 16 INDIA 19 SRI LANKA 27 IRAQ 16 CHINA PEOPLES REP 14 IRAQ 24 PHILIPPINES 15 IRAQ 14 LEBANON 24 SRI LANKA 12 PHILIPPINES 11 UNITED KINGDOM 17 UNITED KINGDOM 12 CAMBODIA 9 PHILIPPINES 13 GREECE 11 ITALY 7 ITALY 12 LEBANON 1 Humanitarian migration IRAQ 56 IRAQ 67 IRAN 119 IRAN 1 SRI LANKA 21 IRAQ 38 SUDAN 1 IRAN 2 SRI LANKA 1 FORMER YUGOSLAVIA 9 SIERRA LEONE 4 KUWAIT 8 SRI LANKA 5 AUSTRALIA 3 SYRIA 7 AUSTRALIA 4 BURMA 2 AFGHANISTAN 6 BOSNIA-HERZEGOVINA 4 ETHIOPIA 2 EGYPT ARAB REP OF 4 LEBANON 4 SUDAN 2 INDIA 3 SERBIA & MONTENEGRO 4 ZIMBABWE 2 AUSTRALIA 1 CROATIA 3 AFGHANISTAN 1 BURMA 1 Skilled migration INDIA 68 INDIA 567 INDIA 15 SRI LANKA 51 CHINA PEOPLES REP 178 CHINA PEOPLES REP 91 STH AFRICA REP 18 SRI LANKA 79 SRI LANKA 41 CHINA PEOPLES REP 17 UNITED KINGDOM 53 PAKISTAN 26 FYR OF MACEDONIA 16 PHILIPPINES 42 AUSTRALIA 25 INDONESIA 12 MALAYSIA 38 PHILIPPINES 21 PHILIPPINES 1 MAURITIUS 17 EGYPT ARAB REP OF 17 BANGLADESH 7 ZIMBABWE 17 UNITED KINGDOM 17 HONG KONG 6 SINGAPORE 16 IRAN 13 NIGERIA 6 VIETNAM 14 MALAYSIA 9
84 84 The main points from Table 3:22 are: In Casey, the dominant source countries for family migration, especially in 27 and 212, have been India and Afghanistan, and to a lesser extent Sri Lanka and China. Afghanistan has been the standout source country for humanitarian migrants, and this would seem to be having an impact on the numbers of family migration entrants. India and Sri Lanka are the standout source countries for skilled migrants. In Cardinia, the impact of humanitarian migration is low. The Sudan was the main source region in 27, but no humanitarian migrants indicated that they were going to live in Cardinia in 212. In Wyndham, even numbers of family migrants came from each of the top ten countries in 21. However, in 27, there was a huge spike in numbers from India, more than four times the number from next ranked China. In 212, India and China continue to be the dominant source countries for family migration. Humanitarian numbers from Burma and Thailand rose significantly in 27, and while numbers from these countries are lower in 212, they are still the dominant countries for humanitarian entrants to Wyndham. In 21, India provided the largest number of skilled migrants. Its numbers increased eight fold in 27, but more than 1 skilled entrants originated from China, Philippines, the UK and Malaysia. In 212, India and China or the top two origin countries for skilled migration into Wyndham. In Melton, India is the main source country for family migration, although numbers are low. Fir humanitarian migration, there is a mix of countries occupying number 1 and 2 spots in each of the years, but numbers in this category are also low. With skilled migration, India, Philippines and Sri Lanka are the main source countries. In 27 large numbers were received from India and the Philippines. Lebanon, Turkey, and to a lesser extent India, dominate the top ten for family migration in Hume. Iraq has been a consistent supplier of migrants in this stream at each of the years reviewed. Iraq is the standout origin country for humanitarian migrants in each year, along with Iran. India, Sri Lank and Philippines supplied large numbers of skilled migrants in 27, and in 212 India and Philippines continued this dominance, but at lower levels. In 27 and 212, the largest numbers of family migrants came from India, China, Vietnam and the Former Yugoslavian Republic of Macedonia. Humanitarian migrants were drawn predominantly from Iran, Iraq and Vietnam. In the case of skilled migrants, India, China and Sri Lanka are the main sources. In 27, India provided 567 skilled migrants to Whittlesea and a further 15 in 212. The numbers from China in these years were 178 and 91 respectively.
85 85 Table 3:23: Birthplace by visa category, Queensland Alliance LGAs, Source: DIAC 213 Moreton Bay (Estimate) Family migration UNITED KINGDOM 46 UNITED KINGDOM 128 PHILIPPINES 55 PHILIPPINES 34 PHILIPPINES 54 UNITED KINGDOM 5 U.S.A. 25 STH AFRICA REP 33 CHINA PEOPLES REP 3 ENGLAND 23 FIJI 27 STH AFRICA REP 22 STH AFRICA REP 16 U.S.A. 27 INDIA 14 CANADA 13 INDIA 26 U.S.A. 13 FIJI 13 ENGLAND 24 PAPUA NEW GUINEA 8 SOLOMON ISLANDS 1 CHINA PEOPLES REP 18 CANADA 7 THAILAND 1 THAILAND 18 NEW ZEALAND 7 FMR U.S.S.R. 8 CANADA 16 BRAZIL 5 Humanitarian migration IRAQ 3 SUDAN 5 IRAN 7 IRAN 2 ZIMBABWE 5 BURMA 2 AUSTRALIA 1 SRI LANKA 3 PAKISTAN 2 THAILAND 3 AFGHANISTAN 1 BURMA 2 THAILAND 1 IRAN 2 KENYA 2 ETHIOPIA 1 IRAQ 1 PAKISTAN 1 Skilled migration STH AFRICA REP 116 UNITED KINGDOM 798 UNITED KINGDOM 14 ENGLAND 74 STH AFRICA REP 199 STH AFRICA REP 67 UNITED KINGDOM 47 ENGLAND 124 PHILIPPINES 33 ZIMBABWE 27 INDIA 11 INDIA 28 FIJI 22 PHILIPPINES 78 NEW ZEALAND 28 GERMANY 13 ZIMBABWE 55 FIJI 18 IRELAND 13 IRELAND 31 SRI LANKA 15 NETHERLANDS 9 GERMANY 29 AUSTRALIA 12 TAIWAN 7 CHINA PEOPLES REP 28 MALAYSIA 1 U.S.A. 7 NETHERLANDS 19 ZIMBABWE 8 Ipswich Family migration UNITED KINGDOM 19 UNITED KINGDOM 37 PHILIPPINES 35 PHILIPPINES 17 INDIA 31 VIETNAM 24 VIETNAM 1 PHILIPPINES 25 INDIA 19 THAILAND 9 VIETNAM 25 ETHIOPIA 1 U.S.A. 9 CHINA PEOPLES REP 13 UNITED KINGDOM 9 ENGLAND 6 U.S.A. 12 SAMOA 7 CANADA 5 INDONESIA 9 U.S.A. 7 FIJI 5 JAPAN 9 CHINA PEOPLES REP 6 GERMANY 4 STH AFRICA REP 9 FIJI 6 STH AFRICA REP 4 CANADA 5 SUDAN 6 Humanitarian migration SUDAN 4 SUDAN 34 DEM REP OF CONGO 85 AFGHANISTAN 2 DEM REP OF CONGO 22 CUBA 15 IRAQ 2 TANZANIA 19 MALAWI 15 FORMER YUGOSLAVIA 1 KENYA 12 SRI LANKA 2 BURUNDI 1 STH AFRICA REP 2 UGANDA 9 UGANDA 2 ZIMBABWE 6 AFGHANISTAN 1 TOGO 4 BURMA 1 IRAN 3 BURUNDI 1 LIBERIA 3 ETHIOPIA 1 Skilled migration STH AFRICA REP 26 UNITED KINGDOM 126 PHILIPPINES 33 ENGLAND 12 INDIA 6 UNITED KINGDOM 31 FIJI 1 PHILIPPINES 46 INDIA 19 INDIA 8 STH AFRICA REP 29 NEW ZEALAND 15 UNITED KINGDOM 8 ZIMBABWE 23 AUSTRALIA 9 LITHUANIA 5 ENGLAND 17 STH AFRICA REP 9 SINGAPORE 5 CHINA PEOPLES REP 16 CHINA PEOPLES REP 8 CHINA PEOPLES REP 4 SRI LANKA 14 GERMANY 8 NIGERIA 4 FIJI 12 SRI LANKA 6 PHILIPPINES 4 GERMANY 8 BRAZIL 4 Logan Family migration PHILIPPINES 28 PHILIPPINES 45 CHINA PEOPLES REP 31 FIJI 24 CHINA PEOPLES REP 31 CAMBODIA 27 U.S.A. 15 CAMBODIA 24 THAILAND 24 UNITED KINGDOM 15 UNITED KINGDOM 24 PHILIPPINES 23 CAMBODIA 14 FIJI 22 PAKISTAN 19 ROMANIA 13 INDIA 22 VIETNAM 18 INDIA 11 U.S.A. 19 INDIA 17 STH AFRICA REP 1 THAILAND 17 UNITED KINGDOM 16 CHINA PEOPLES REP 8 STH AFRICA REP 16 FIJI 12 ENGLAND 8 KOREA REP OF 15 TAIWAN 11 Humanitarian migration FORMER YUGOSLAVIA 31 BURMA 12 AFGHANISTAN 149 PAKISTAN 2 BURUNDI 84 BURMA 117 BOSNIA-HERZEGOVINA 11 TANZANIA 76 IRAN 41 IRAQ 1 DEM REP OF CONGO 49 MALAYSIA 18 SUDAN 8 THAILAND 34 PAKISTAN 17 CROATIA 7 UGANDA 32 SOMALIA 17 GERMANY 6 SUDAN 27 SRI LANKA 13 CHINA PEOPLES REP 5 RWANDA 15 THAILAND 12 ERITREA 4 AFGHANISTAN 1 ETHIOPIA 9 IRAN 4 PAKISTAN 9 KENYA 9 Skilled migration STH AFRICA REP 14 UNITED KINGDOM 136 INDIA 44 ENGLAND 5 INDIA 14 UNITED KINGDOM 28 ZIMBABWE 25 PHILIPPINES 63 PHILIPPINES 21 INDIA 22 CHINA PEOPLES REP 54 CHINA PEOPLES REP 17 FIJI 15 STH AFRICA REP 48 PAKISTAN 14 CHINA PEOPLES REP 9 FIJI 25 STH AFRICA REP 12 TAIWAN 9 KOREA REP OF 18 AUSTRALIA 9 COLOMBIA 8 ROMANIA 17 KOREA REP OF 8 MALAYSIA 8 ENGLAND 15 NEW ZEALAND 8 KOREA REP OF 7 IRELAND 15 IRAN 7
86 86 In Table 3:23, the data for Moreton Bay have been derived by aggregating data from the three LGAs of Caboolture, Pine Rivers and Redcliffe. The reason for this has been explained earlier. Moreton Bay has predominantly drawn migrants from the family and skilled migration streams. In the former stream, the main supply countries have been the UK, Philippines, South Africa and China. In the case of the skilled migration stream, the United Kingdom and South Africa have been the main contributing countries in each of the years under review. During the more than ten years since 21, Moreton Bay has received few humanitarian migrants a handful from Iraq, Sudan and Iran. In contrast to Moreton Bay, Logan has received generally higher numbers from the humanitarian stream than from the other two streams. In 212, the main source countries for humanitarian migrants were Afghanistan and Burma, while in 27 Burma and Burundi had been the main supply countries for humanitarian migrants to Logan. The main source countries for family migrants have been varied Philippines and Fiji in 21, Philippines and China in 27 and in 212 China and Cambodia. The main source countries for skilled migrants were South Africa and England in 21, the UK and India in 27 and India, the UK and the Philippines in 212. Ipswich, too, has had a variety of countries contributing family migrants in each of the years surveyed, with the UK, Philippines, India and Vietnam featuring regularly. With skilled migration, the main countries have been the United Kingdom, India and the Philippines. With humanitarian migration, the Sudan was dominant in 21 and 27, while the Democratic Republic of the Congo was dominant in 27 and 212. In 212, 15 migrants from each of Cuba and Malawi indicated an intention to settle in Ipswich. Table 3:24: Birthplace by visa category, Western Australia Alliance LGAs, Source: DIAC 213 Gosnells Family migration PHILIPPINES 9 INDONESIA 23 INDIA 42 CHINA PEOPLES REP 8 UNITED KINGDOM 23 CHINA PEOPLES REP 4 INDONESIA 8 AFGHANISTAN 18 PHILIPPINES 25 UNITED KINGDOM 8 THAILAND 18 AFGHANISTAN 14 MALAYSIA 7 SINGAPORE 14 UNITED KINGDOM 11 INDIA 4 CHINA PEOPLES REP 13 THAILAND 8 FMR U.S.S.R. 3 MALAYSIA 11 BURMA 7 KENYA 3 BURMA 1 MALAYSIA 7 LEBANON 3 INDIA 1 INDONESIA 6 ENGLAND 2 PHILIPPINES 6 VIETNAM 6 Humanitarian migration AFGHANISTAN 13 BURMA 27 AFGHANISTAN 5 CROATIA 7 THAILAND 19 BURMA 23 SUDAN 7 DEM REP OF CONGO 14 IRAN 18 SOMALIA 6 AFGHANISTAN 13 PAKISTAN 12 BURMA 5 LIBERIA 7 SRI LANKA 9 ETHIOPIA 5 RWANDA 5 ETHIOPIA 7 ERITREA 2 IRAN 4 THAILAND 5 IRAQ 2 BURUNDI 3 ERITREA 1 AUSTRALIA 1 CAMEROON REP 3 SYRIA 1 EGYPT ARAB REP OF 1 GHANA 3 ALGERIA Skilled migration INDIA 21 INDIA 176 INDIA 131 INDONESIA 2 CHINA PEOPLES REP 96 PHILIPPINES 46 SINGAPORE 2 UNITED KINGDOM 93 CHINA PEOPLES REP 24 STH AFRICA REP 17 STH AFRICA REP 63 UNITED KINGDOM 17 MALAYSIA 11 PHILIPPINES 57 MALAYSIA 16 ENGLAND 1 MALAYSIA 47 SINGAPORE 15 SCOTLAND 8 SRI LANKA 22 STH AFRICA REP 15 JAPAN 4 ZIMBABWE 22 SRI LANKA 13 NORTHERN IRELAND 4 MAURITIUS 19 AUSTRALIA 9 UNITED KINGDOM 3 SINGAPORE 19 PAKISTAN 8 Wanneroo Family migration UNITED KINGDOM 42 UNITED KINGDOM 169 UNITED KINGDOM 63 ENGLAND 29 VIETNAM 53 VIETNAM 4 VIETNAM 19 STH AFRICA REP 39 INDIA 23 U.S.A. 1 ENGLAND 32 THAILAND 22 THAILAND 8 INDIA 25 STH AFRICA REP 17 CANADA 7 THAILAND 25 CHINA PEOPLES REP 12 INDONESIA 7 CHINA PEOPLES REP 23 PHILIPPINES 11 IRAQ 7 PHILIPPINES 19 CAMBODIA 9 STH AFRICA REP 7 FYR OF MACEDONIA 16 KENYA 9 FYR OF MACEDONIA 6 INDONESIA 16 SUDAN 8 Humanitarian migration SUDAN 32 SUDAN 68 BURMA 54 IRAQ 22 BURMA 47 IRAN 32 AFGHANISTAN 2 BURUNDI 16 AFGHANISTAN 3 CROATIA 14 ETHIOPIA 16 IRAQ 24 BURMA 12 DEM REP OF CONGO 15 DEM REP OF CONGO 17 SERBIA & MONTENEGRO 8 LIBERIA 15 PAKISTAN 7 CONGO REPUBLIC 7 THAILAND 14 THAILAND 7 FORMER YUGOSLAVIA 5 KENYA 11 MALAYSIA 6 ETHIOPIA 4 UGANDA 11 ETHIOPIA 4 EGYPT ARAB REP OF 3 IVORY COAST 9 KENYA 2 Skilled migration STH AFRICA REP 124 UNITED KINGDOM 1698 UNITED KINGDOM 642 ENGLAND 114 STH AFRICA REP 329 STH AFRICA REP 15 UNITED KINGDOM 48 ENGLAND 254 PHILIPPINES 63 ZIMBABWE 41 INDIA 13 INDIA 62 KENYA 24 ZIMBABWE 1 IRELAND 57 SINGAPORE 24 PHILIPPINES 67 ENGLAND 51 MALAYSIA 14 SCOTLAND 42 SCOTLAND 25 TAIWAN 12 KENYA 39 ZIMBABWE 24 ZAMBIA 12 IRELAND 38 AUSTRALIA 18 INDIA 11 SINGAPORE 32 KENYA 15
87 87 Swan Family migration UNITED KINGDOM 26 UNITED KINGDOM 42 PHILIPPINES 37 ENGLAND 13 VIETNAM 31 INDIA 27 VIETNAM 11 PHILIPPINES 28 VIETNAM 23 PHILIPPINES 8 THAILAND 23 THAILAND 22 INDIA 6 INDIA 16 UNITED KINGDOM 17 INDONESIA 6 CHINA PEOPLES REP 14 CHINA PEOPLES REP 11 U.S.A. 6 AFGHANISTAN 11 STH AFRICA REP 1 FMR U.S.S.R. 5 STH AFRICA REP 11 AFGHANISTAN 8 IRAQ 5 FYR OF MACEDONIA 9 ETHIOPIA 6 BURMA 4 ENGLAND 8 U.S.A. 5 Humanitarian migration IRAQ 14 SUDAN 22 AFGHANISTAN 16 AFGHANISTAN 11 AFGHANISTAN 15 IRAN 13 SUDAN 11 LIBERIA 11 BURMA 6 FORMER YUGOSLAVIA 9 IRAQ 8 MALAYSIA 5 CROATIA 8 RWANDA 7 TURKEY 3 CONGO REPUBLIC 6 BURMA 5 CONGO REPUBLIC 2 AUSTRALIA 5 DEMOCRATIC REPUBLIC 5 IRAQ 2 ERITREA 5 IRAN 5 PAKISTAN 1 BURMA 3 UGANDA 5 AUSTRALIA IRAN 3 SIERRA LEONE 4 BERMUDA Skilled migration STH AFRICA REP 5 UNITED KINGDOM 26 PHILIPPINES 91 ENGLAND 35 STH AFRICA REP 19 UNITED KINGDOM 76 INDIA 17 INDIA 95 INDIA 7 SINGAPORE 15 PHILIPPINES 56 STH AFRICA REP 37 UNITED KINGDOM 15 ZIMBABWE 55 IRELAND 17 ZIMBABWE 13 CHINA PEOPLES REP 5 SINGAPORE 12 MALAYSIA 9 KENYA 23 CHINA PEOPLES REP 11 INDONESIA 8 SCOTLAND 18 KENYA 9 IRELAND 8 MALAYSIA 15 ZIMBABWE 9 KENYA 7 IRELAND 14 AUSTRALIA 7 Mandurah Family migration ENGLAND 1 UNITED KINGDOM 3 UNITED KINGDOM 12 UNITED KINGDOM 8 PHILIPPINES 11 THAILAND 11 CANADA 3 THAILAND 8 PHILIPPINES 7 INDONESIA 3 STH AFRICA REP 7 U.S.A. 7 THAILAND 3 INDONESIA 6 CHINA PEOPLES REP 6 TAIWAN 2 CANADA 5 INDONESIA 6 CHILE 1 ENGLAND 5 IRELAND 5 COLOMBIA 1 MALAYSIA 4 INDIA 3 FMR U.S.S.R. 1 CHINA PEOPLES REP 3 BURMA 2 KOREA REP OF 1 VIETNAM 3 CANADA 2 Humanitarian migration AFGHANISTAN 1 SUDAN 3 IRAN 2 CHINA PEOPLES REP 1 ETHIOPIA 1 GHANA 1 TOGO 1 Skilled migration STH AFRICA REP 26 UNITED KINGDOM 245 UNITED KINGDOM 77 ENGLAND 15 STH AFRICA REP 73 INDIA 2 ZIMBABWE 5 ENGLAND 34 IRAN 16 KENYA 4 IRELAND 29 KOREA REP OF 15 SAMOA 4 PHILIPPINES 19 PHILIPPINES 15 UNITED KINGDOM 4 INDIA 18 STH AFRICA REP 14 CHINA PEOPLES REP 2 GERMANY 9 ENGLAND 13 GERMANY 2 SCOTLAND 9 IRELAND 12 INDIA 2 ZIMBABWE 9 U.S.A. 8 ZAMBIA 2 AUSTRALIA 7 AUSTRALIA 4 Cockburn Family migration UNITED KINGDOM 18 UNITED KINGDOM 45 PHILIPPINES 4 ENGLAND 11 CHINA PEOPLES REP 27 CHINA PEOPLES REP 28 CANADA 7 STH AFRICA REP 19 THAILAND 17 INDONESIA 7 INDIA 16 UNITED KINGDOM 16 CHINA PEOPLES REP 6 INDONESIA 14 INDIA 1 MALAYSIA 6 THAILAND 14 FMR U.S.S.R. 7 SINGAPORE 6 PHILIPPINES 11 STH AFRICA REP 7 PHILIPPINES 5 U.S.A. 11 INDONESIA 6 PORTUGAL 5 ENGLAND 1 KOREA REP OF 6 SERBIA & MONTENEGRO 5 IRELAND 1 COLOMBIA 5 Humanitarian migration CROATIA 36 UGANDA 8 IRAN 11 BOSNIA-HERZEGOVINA 9 SUDAN 6 SRI LANKA 2 SIERRA LEONE 6 DEM REP OF CONGO 5 AFGHANISTAN 1 FORMER YUGOSLAVIA 4 SIERRA LEONE 4 BURMA 1 AUSTRALIA 3 BURUNDI 3 PAKISTAN 1 ETHIOPIA 3 CONGO REPUBLIC 2 LIBERIA 3 KENYA 2 SYRIA 2 TANZANIA 2 AFGHANISTAN 1 AUSTRALIA 1 IRAN 1 BURMA 1 Skilled migration INDONESIA 76 UNITED KINGDOM 21 PHILIPPINES 16 SINGAPORE 4 INDIA 89 UNITED KINGDOM 132 ENGLAND 34 CHINA PEOPLES REP 86 CHINA PEOPLES REP 46 STH AFRICA REP 3 STH AFRICA REP 82 IRELAND 35 MALAYSIA 19 SINGAPORE 48 STH AFRICA REP 35 PAKISTAN 15 MALAYSIA 35 INDIA 32 UNITED KINGDOM 13 ZIMBABWE 33 MALAYSIA 19 CHINA PEOPLES REP 11 INDONESIA 25 SINGAPORE 16 SCOTLAND 1 PHILIPPINES 23 SRI LANKA 16 INDIA 8 SRI LANKA 18 AUSTRALIA 15 Serpentine-Jarrahdale Family migration UNITED KINGDOM 3 ENGLAND 3 PHILIPPINES 3 CANADA 1 UNITED KINGDOM 3 FMR U.S.S.R. 2 MALAYSIA 1 CANADA 2 U.S.A. 2 SINGAPORE 1 THAILAND 2 GERMANY 1 STH AFRICA REP 1 CHANNEL ISLANDS 1 MALAYSIA 1 THAILAND 1 ITALY 1 NETHERLANDS 1 KOREA REP OF 1 TAIWAN 1 PAKISTAN 1 UNITED KINGDOM 1 U.S.A. 1 ZIMBABWE 1 ZIMBABWE 1 Humanitarian migration IRAN 2 Skilled migration ENGLAND 6 UNITED KINGDOM 36 UNITED KINGDOM 11 UNITED KINGDOM 6 STH AFRICA REP 12 GERMANY 3 STH AFRICA REP 4 ENGLAND 7 SRI LANKA 2 AUSTRALIA 1 INDIA 5 STH AFRICA REP 2 PAPUA NEW GUINEA 1 SINGAPORE 5 AUSTRALIA 1 SWAZILAND 1 PHILIPPINES 4 BANGLADESH 1 ZIMBABWE 3 ENGLAND 1 JAPAN 2 INDIA 1 CHINA PEOPLES REP 1 PHILIPPINES 1 GERMANY 1 SINGAPORE 1
88 88 Kwinana Family migration UNITED KINGDOM 4 THAILAND 11 CHINA PEOPLES REP 1 INDONESIA 3 UNITED KINGDOM 1 INDIA 9 NETHERLANDS 3 INDIA 8 PHILIPPINES 9 ENGLAND 2 STH AFRICA REP 6 INDONESIA 7 THAILAND 2 JAPAN 5 THAILAND 4 U.S.A. 2 U.S.A. 5 MALAYSIA 3 CANADA 1 SERBIA & MONTENEGRO 4 CAMBODIA 2 CHILE 1 CHINA PEOPLES REP 3 CUBA 2 CHINA PEOPLES REP 1 FMR U.S.S.R. 3 IRAQ 2 FMR U.S.S.R. 1 SINGAPORE 3 SIERRA LEONE 2 Humanitarian migration CROATIA 2 IRAN 4 BURMA 1 AFGHANISTAN 1 SUDAN 3 IRAN 1 BOSNIA-HERZEGOVINA 1 LIBERIA 2 MALAYSIA 1 SERBIA & MONTENEGRO 1 RWANDA 2 AFGHANISTAN 9 SRI LANKA 1 CONGO REPUBLIC 1 ERITREA 8 SUDAN 1 TANZANIA 1 DEM REP OF CONGO 3 UGANDA 1 PAKISTAN 3 ARGENTINA SUDAN 3 AUSTRALIA IRAQ 2 BANGLADESH SOMALIA 2 Skilled migration ENGLAND 6 PHILIPPINES 41 PHILIPPINES 48 INDONESIA 5 UNITED KINGDOM 37 INDIA 9 STH AFRICA REP 5 STH AFRICA REP 33 STH AFRICA REP 9 IRELAND 3 ZIMBABWE 29 UNITED KINGDOM 9 ZIMBABWE 3 INDIA 24 IRELAND 4 KENYA 2 CHINA PEOPLES REP 13 BOTSWANA 3 AUSTRALIA 1 KOREA REP OF 9 SINGAPORE 3 JAPAN 1 CANADA 4 BANGLADESH 2 LIBERIA 1 HONG KONG 4 FMR U.S.S.R. 2 MALAYSIA 1 MALAYSIA 4 NIGERIA 2 Rockingham Family migration UNITED KINGDOM 36 UNITED KINGDOM 84 UNITED KINGDOM 44 ENGLAND 8 STH AFRICA REP 13 PHILIPPINES 29 INDONESIA 6 PHILIPPINES 12 THAILAND 18 PHILIPPINES 6 THAILAND 12 STH AFRICA REP 1 THAILAND 4 U.S.A. 12 INDIA 9 BRAZIL 3 ENGLAND 9 CHINA PEOPLES REP 6 GERMANY 3 CANADA 7 INDONESIA 5 AUSTRALIA 2 GERMANY 7 ENGLAND 3 CANADA 2 INDIA 7 GERMANY 3 MALAYSIA 2 NETHERLANDS 7 U.S.A. 3 Humanitarian migration CROATIA 7 ZIMBABWE 5 DEM REP OF CONGO 2 BOSNIA-HERZEGOVINA 2 AFGHANISTAN 3 IRAN 2 SERBIA & MONTENEGRO 1 DEM REP OF CONGO 2 KENYA 2 TANZANIA 2 BURUNDI 1 Skilled migration ENGLAND 96 UNITED KINGDOM 832 UNITED KINGDOM 36 STH AFRICA REP 4 ENGLAND 164 STH AFRICA REP 45 UNITED KINGDOM 28 STH AFRICA REP 145 ENGLAND 27 SCOTLAND 8 SCOTLAND 21 PHILIPPINES 27 ZIMBABWE 7 ZIMBABWE 2 IRELAND 24 NORTHERN IRELAND 5 IRELAND 17 SCOTLAND 19 SINGAPORE 5 INDIA 13 INDIA 16 WALES 5 BURMA 12 NEW ZEALAND 1 INDIA 3 PHILIPPINES 11 AUSTRALIA 9 THAILAND 3 BRIT. DEP. TERR. CITZ. 1 GERMANY 9 Armadale Family migration ENGLAND 12 UNITED KINGDOM 31 INDIA 25 UNITED KINGDOM 9 THAILAND 14 PHILIPPINES 16 THAILAND 7 PHILIPPINES 13 CHINA PEOPLES REP 12 FMR U.S.S.R. 3 INDONESIA 9 UNITED KINGDOM 9 PHILIPPINES 3 INDIA 8 THAILAND 7 INDONESIA 2 STH AFRICA REP 8 INDONESIA 5 NETHERLANDS 2 CHINA PEOPLES REP 7 U.S.A. 5 PAKISTAN 2 ENGLAND 6 AFGHANISTAN 3 PAPUA NEW GUINEA 2 JAPAN 5 BURMA 3 VIETNAM 2 VIETNAM 4 NIGERIA 3 Humanitarian migration FORMER YUGOSLAVIA 7 BURMA 16 AFGHANISTAN 5 BURMA 3 DEM REP OF CONGO 11 IRAN 4 ISRAEL 1 TANZANIA 8 BURMA 2 IVORY COAST 1 LIBERIA 6 PAKISTAN 1 SUDAN 1 AFGHANISTAN 5 SRI LANKA 1 BURUNDI 5 GUINEA 4 SIERRA LEONE 4 FORMER YUGOSLAVIA 3 SUDAN 3 Skilled migration ENGLAND 3 UNITED KINGDOM 14 INDIA 38 STH AFRICA REP 16 INDIA 92 UNITED KINGDOM 37 UNITED KINGDOM 1 STH AFRICA REP 52 PHILIPPINES 35 INDIA 7 PHILIPPINES 34 SRI LANKA 31 NORTHERN IRELAND 4 SINGAPORE 27 STH AFRICA REP 17 SINGAPORE 4 ZIMBABWE 27 SINGAPORE 11 U.S.A. 4 MALAYSIA 26 INDONESIA 9 ZIMBABWE 4 CHINA PEOPLES REP 23 KENYA 7 FR CZECHOSLOVAKIA 2 SRI LANKA 15 CHINA PEOPLES REP 6 INDONESIA 2 INDONESIA 12 IRELAND 6
89 89 From Table 3:24 it is clear that Gosnells draws its migrant intake heavily from the skilled migration stream. In 212, India supplied over 13 migrants to this stream, more than three times the number derived from the Philippines. In 27, India supplied 176 skilled migrants to Gosnells, compared with 96 from China. In comparison its family and humanitarian streams are small. In 212, the main source of family migrants has been from India and China. Smaller contributions have come from Indonesia and the United Kingdom. Afghanistan has been a major source for humanitarian migrants throughout the 21 to 212 period. In 212, apart from Afghanistan, the top four countries were Burma, Iran and Pakistan. In Wanneroo, skilled migration outperforms the other two streams by a huge margin. It has been dominated by two source countries the United Kingdom/England and South Africa at each of the years under review. In 27, there were four countries supplying more than 1 skilled migrants into Wanneroo The UK/England and South Africa, and India and Zimbabwe. Zimbabwe has been within the top eight source countries for each of the three years. The main family migration countries have been the UK, Vietnam and India. In the case of the humanitarian migration stream, Burma has been a key contributor in 27 and 212, Sudan in 21 and 27 and Afghanistan in 21 and 212. Like Wanneroo, Cockburn has also drawn heavily on migrants from the skilled migration stream. In 212, its main sources of skilled migrants were Philippines, UK and China, while in 27 skilled migrants were drawn heavily for the UK, India, China and South Africa. In comparison, smaller numbers of migrants were drawn from the family and humanitarian streams. The main source countries for family migration in 212 were the Philippines, China and Thailand, while for the humanitarian stream, greatest numbers came from Iran, with smaller contributions from Sri Lanka and Afghanistan. However, it is reasonable to suggest that, in 212, very few humanitarian migrants are attracted to Cockburn. In Swan, the UK/England and South Africa have been the main source countries for skilled migration. In recent years, India and the Philippines have also added sizeable numbers of skilled migrants to Swan. With family migration, Philippines was the main country of origin in 212. It has gradually increased its presence in both 21 and 27. Much the same tendency has occurred with India as a source country for family migration to Swan. Vietnam has been a key contributing country to family migration intakes at each of the three years under review. In terms of humanitarian migration, migrants from Afghanistan have been predominant in each of the three years. In 212, Iran was the second ranked country of origin for humanitarian migrants, while migrants from Sudan were top ranked in 27 and third ranked in 21. Skilled migrants to Mandurah have consistently originated in the United Kingdom/England. South Africa has also been a dominant source country, especially in 21 and 27, although its ranking declined to sixth in 212. As for the other migrant streams, they are relatively insignificant compared with the skilled stream. Indeed, it can be argued that Mandurah is not on the radar as far as humanitarian migrants are concerned. The same point can be made for humanitarian migrants in Serpentine-Jarrahdale. It received no humanitarian migrants in either of 21 and 212. Further, the United Kingdom/England has been the only country to supply double digit numbers of skilled migrants in each of the three years under review. In 212, only nine countries provided migrants under the family migration scheme. Top ranked Philippines provided just three migrants. It seems fair to say that population growth form international migration in Serpentine-Jarrahdale has, presently, limited potential.
90 9 Of all the Alliance LGAs in Western Australia, Rockingham has drawn most heavily on the skilled migration stream. In 27, the UK provided 832 migrants, with England providing a further 164, to this stream. In 212, the UK/England generated a further 387 skilled migrants into Rockingham. South Africa has also been a consistent provider in each of the three years under consideration. In terms of humanitarian migration, very few have been attracted to Rockingham. Likewise, numbers in the family migration stream have been low, albeit higher than those reported for humanitarian migration. Kwinana shows some similarities to Rockingham, in that skilled migration is the largest stream, although at levels much lower than those reported in Rockingham and Cockburn. The numbers arriving in Kwinana from the humanitarian and family migration streams are very low. In 212, the main countries supplying humanitarian migrants were Burma, Iran and Malaysia, each ranked equal first. In 212, China, India and the Philippines were the top ranked source countries for family migration. The UK did not rank in the top ten for family migration, which is unusual amongst all the Alliance LGAs. Finally, Armadale too is drawing its migrant intake heavily from the skilled migration stream, relative to the other streams. In 212, the main countries supplying skilled migrants to Armadale were India, UK, Philippines and Sri Lanka. South Africa had been in the top four in 21 and 27, but was relegated to fifth rank in 212. In terms of family migration, the top five source countries in 212 were India, Philippines, China, the UK and Thailand. The UK/England and Thailand were the top two in 21 and 27. As for humanitarian migration, numbers are very low, but in 212 the main source countries were Afghanistan, Iran and Burma. In 27, the largest numbers emanated from Burma, the Democratic Republic of the Congo and Tanzania. Table 3:25: Birthplace by visa category, South Australia Alliance LGAs, Source: DIAC 213 Mount Barker Family migration UNITED KINGDOM 8 UNITED KINGDOM 13 PHILIPPINES 4 ENGLAND 3 ENGLAND 3 STH AFRICA REP 2 PHILIPPINES 2 CHINA PEOPLES REP 2 ENGLAND 1 BOSNIA-HERZEGOVINA 1 JAPAN 2 FINLAND 1 CANADA 1 STH AFRICA REP 2 JAPAN 1 ETHIOPIA 1 FRANCE 1 THAILAND 1 INDIA 1 INDIA 1 VIETNAM 1 ISRAEL 1 IRELAND 1 WALES 1 KOREA REP OF 1 ISRAEL 1 ZAMBIA 1 THAILAND 1 NORTHERN IRELAND 1 Humanitarian migration IRAN 1 Skilled migration STH AFRICA REP 9 UNITED KINGDOM 5 UNITED KINGDOM 16 UNITED KINGDOM 8 ENGLAND 14 BULGARIA 1 ENGLAND 6 STH AFRICA REP 13 IRELAND 1 GERMANY 3 PHILIPPINES 11 NETHERLANDS 1 JAPAN 2 GERMANY 9 NORTHERN IRELAND 1 ZIMBABWE 2 BRIT. DEP. TERR. CITZ. 4 PHILIPPINES 1 AUSTRALIA 1 NETHERLANDS 4 NETHERLANDS 1 IRAN 3 NORTHERN IRELAND 1 CHINA PEOPLES REP 2 SINGAPORE 2 Playford Family migration PHILIPPINES 5 PHILIPPINES 16 PHILIPPINES 9 U.S.A. 5 VIETNAM 1 AFGHANISTAN 7 FIJI 3 AFGHANISTAN 9 RWANDA 7 STH AFRICA REP 3 UNITED KINGDOM 9 CHINA PEOPLES REP 6 THAILAND 3 FMR U.S.S.R. 8 SUDAN 6 UNITED KINGDOM 3 CAMBODIA 6 UNITED KINGDOM 6 MALAYSIA 2 INDONESIA 6 VIETNAM 4 ROMANIA 2 THAILAND 6 BURUNDI 3 VANUATU 2 U.S.A. 5 CAMBODIA 3 AUSTRALIA 1 INDIA 4 PAKISTAN 3 Humanitarian migration AFGHANISTAN 11 DEM REP OF CONGO 74 AFGHANISTAN 32 CROATIA 3 BURUNDI 71 IRAN 23 IRAQ 2 TANZANIA 67 NEPAL 21 AUSTRALIA 1 AFGHANISTAN 55 BHUTAN 2 FORMER YUGOSLAVIA 1 SUDAN 35 BURMA 11 SIERRA LEONE 1 IRAN 17 MALAYSIA 2 UGANDA 1 PAKISTAN 2 BURMA 8 AUSTRALIA 1 KENYA 6 DEM REP OF CONGO 1 IRAQ 5 LIBERIA 1 Skilled migration STH AFRICA REP 14 UNITED KINGDOM 43 POLAND 11 ENGLAND 11 PHILIPPINES 16 PAKISTAN 6 U.S.A. 8 INDIA 13 BANGLADESH 4 SINGAPORE 6 ENGLAND 1 INDIA 4 GERMANY 4 STH AFRICA REP 9 BURMA 2 FIJI 3 EL SALVADOR 8 ENGLAND 2 NORTHERN IRELAND 2 BANGLADESH 6 NETHERLANDS 2 SWITZERLAND 1 CHINA PEOPLES REP 6 CHINA PEOPLES REP 1 UNITED KINGDOM 1 CANADA 4 IRELAND 1 FIJI 4 PHILIPPINES 1
91 91 In Mount Barker, it is fair to say that in terms of the years under review migration has not played any significant role in its population growth. There have been virtually no migrants to Mount Barker under the humanitarian programme of the migration scheme, and arrivals via the other streams have been relatively small. In the 27 migration spike, experienced by all of the Alliance LGAs, Mount Barker did receive relatively large numbers of skilled migrants from the United Kingdom/England, South Africa and the Philippines. Playford is unique among Alliance member LGAs in that it is the only LGA in which the largest migration contribution to total population came from the humanitarian stream. In 212 it received significant numbers of humanitarian migrants from Afghanistan, Iran, Nepal, Bhutan and Burma. In 27, large numbers arrived from the Democratic Republic of the Congo, Burundi, Tanzania, Afghanistan and Sudan. In terms of skilled migration, in 27, largest numbers came from the UK/England, the Philippines and India. However, in 212, the largest numbers were from Poland, Pakistan, Bangladesh and India. With family migration, largest numbers in 212 were from the Philippines, Afghanistan, Rwanda, China, Sudan and the UK. Again, this is a mix of main origin countries that has not been noted in the other Alliance LGAs. 3.8 SETTLEMENT TARGET GROUP The DIAC Settlement Reporting Facility also provides data on numbers of migrants in the Settlement Target Group. The Settlement Target Group is a group of settlers eligible for settlement services. These services need to be provided near to the settlers, and therefore information on numbers of migrants in the Target Settlement Group must be relevant to decision makers in the local jurisdictions. Eligibility for settlement services requires migrants to meet the following criteria: Permanent Humanitarian stream settlers. Permanent Family stream settlers with low English proficiency Some temporary Family stream settlers with low English proficiency living in rural/regional locations. Dependants of permanent Skilled settlers with low English proficiency living in rural/regional locations. Dependants of some temporary Skilled settlers with low English proficiency living in rural/regional locations. Some permanent Other stream settlers. Settlers in this group are eligible for settlement services provided by the Settlement Grants Program service providers 5. Table 3:26 shows the proportion of migrants arriving in the Alliance LGAs in 212 who were eligible for settlement services. In 212, there were 19,236 migrants settling in the various Alliance LGAs. Of these, 2.7 percent were eligible for settlement services. The table allows for identification of Alliance LGAs which have a high proportion of humanitarian migrants, in particular, and migrants with low English proficiency. In doing so, the table identifies LGAs where teaching new migrants is an imperative as a means to encouraging integration into the community and being able to use a whole range of services available to them in the wider community. LGAs 5 For further information see Settlement Reporting Facility SRF Data Dictionary (External), Settlement Information Support Team, Settlement Research, Evaluation and Planning Section of the Department of Immigration and Citizenship (DIAC).
 of its intake eligible for services provided by the Settlement Grants Program. Logan and Hume, with 47 and 4.6 percent respectively of their 212 intake in the Settlement target Group.")

92 92 with the highest proportion of their migrant intake in the Settlement Target Group in 212 were: Playford, with more than half (54. percent) of its intake eligible for services provided by the Settlement Grants Program. Logan and Hume, with 47 and 4.6 percent respectively of their 212 intake in the Settlement target Group. Ipswich, Kwinana and Liverpool, where levels ranged from 25.3 percent to 37.7 percent. Casey, Whittlesea, Mandurah, Blacktown and Gosnells, which had proportions of new migrants in the settlement Target Group ranging from just over a fifth to just under a quarter. Of course, high proportions of migrants do not necessarily mean high demand for services, and the underlying figures need to be considered. However, although these are levels are for 212 only, it could be assumed that they have applied for most of this century, and cumulatively, therefore, these percentage occurrences could turn into significant numbers being eligible for services at the local level. And even where numbers on the ground may not be presently significant, the 212 proportions may be an indicator of increasing future demand than needs to be anticipated by policy makes within the jurisdictions. Table 3:26: Settlement Target Group, Alliance LGAs, 212 Source: DIAC 213
93 VISA SUB CLASS DIAC's Settlement reporting Facility also provides information on the Visa Sub Class of migrants arriving in Alliance LGAs. A Visa Subclass is a three digit code which identifies the visa holder s purpose in Australia. The Settlement Database (SDB) only collects data on permanent visas and settlement pathway temporary visas. As such, it does not provide data on visas such as the very newsworthy 457 visa. Further, some visa subclasses are no longer available. Visa subclass reports from the SRF are for a settler s most current SDB visa subclass. Error! Reference source not found.a comprehensive summary of the numbers of migrants in each of the visa sub classes in each of the Alliance LGAs, compiled for the period 27 to 212 inclusive can be found at Appendix Five. It is presented essentially as a database which key personnel in each of the member LGAs might use to understand the migration stream structure of migrants within their jurisdiction. A full description of each code together with its migration stream and category (temporary/permanent) can be found in Settlement Reporting Facility SRF Data Dictionary (External), prepared by the Settlement Information Support Team, Settlement Research, Evaluation and Planning Section of the Department of Immigration and Citizenship (DIAC), at pages inclusive. 3.1 SUMMARY Australia has experienced a substantial increase in ethnic diversity over recent decades and this process has been especially marked in the Alliance LGAs. Over the period there was a net migration gain of 233,52 in these areas (an excess of immigrants and emigrants) more than two times greater than over the 21-6 period. The net gain varied between individual LGAs but 8 had net gain in excess of 11,. Because of the sheer size of international migration to Australia it is not unrealistic to expect it to have so many impacts within different communities. This chapter has looked at just a selection of those impacts. In 211 the highest proportion of overseas born persons in the Alliance LGAs occurred in Liverpool, where overseas born persons represented 42.5 percent of the population. There were proportions greater than 4 percent in Wanneroo and Gosnells, and levels above 32 percent in Blacktown, Casey, Wyndham, Whittlesea, Hume, Cockburn, Rockingham, Kwinana, Armadale and Swan During the period, the largest increase in the representation of overseas born persons occurred in Wyndham, Melton, Gosnells, Wanneroo, Mandurah, Casey and Blacktown. These are LGAs where prevailing conditions, often associated with housing, attract increasing numbers of overseas born. While some LGAs did experience net international migration loss in the period, none did so in the following period. Migrants are drawn from a wide range of countries. An analysis of migrant birthplaces for 21, 26 and 211 has shown that in general the UK and New Zealand has been the greatest source of migrants for most of the Alliance LGAs. The decade to 211 has seen the emergence of a number of birthplace groups move towards top ranked status in the Alliance LGAs, including China and India. In 211, India was the top ranked birthplace in Wyndham, and had increased its top ten ranking in virtually all Alliance LGAs, and New Zealand was top ranked birthplace in Logan and Ipswich. As well as these trends, there are several other trends evident in 211: In most LGAs, the United Kingdom is the major birthplace group. Generally, New Zealand is ranked second.
94 94 In Blacktown, the dominant birthplace groups are Philippines and India, relegating UK and New Zealand born to third and fourth rank. In Liverpool, Fiji, Iraq, Vietnam, India, Lebanon and Philippines birthplaces rank higher than New Zealand and the UK. In Whittlesea, UK born persons rank fifth behind Italy, FYROM, India and Greece born persons, while in Hume Iraq, Turkey and India born persons outnumber those born in the UK. In Wyndham, persons born in India rank number 1, ahead of those born in UK and New Zealand. These trends are pertinent in defining the power of migration to generate an ongoing diversity. The general dominance of the UK is understandable as it has been a main source of migrants since the early post war years. More recently increased migration by a number of the Asian groups, especially those born in India and China, has impacted on the ethnic diversity in selected areas. The rankings of some of the European groups Italians, Germans, Dutch and Greeks that were important in the early post war migration to Australia are now beginning to slip behind those of the newer groups as their numbers erode by death and emigration. The top ranking birthplace groups, outside the UK and New Zealand born, essentially represent the new face of immigration to Australia. The chapter provided an assessment of the age structure of the Australian born and overseas populations in 26 and 211. The analysis showed not only the relativities between the two groups, but also the fact that migrants are making significant contributions to fertility levels and therefore natural increase in certain areas, and that Australia's migrant population is ageing in similar ways to the Australian born population. With a long term migration program which has drawn its migrants from a wide range of countries, multicultural, and ethnic, diversity has become a feature of the Australian social landscape. At the Alliance level, Australian born are around two thirds of the total population, while MES born are 21.8 percent and NES 12.5 percent. It is striking that 19 of the 25 member LGAs have concentrations of NES migrants greater than the Alliance average, with the most significant NES born concentrations being in Liverpool, Blacktown, Whittlesea, Hume, Casey and Wyndham The top ten MES concentrations are in Western Australia and Queensland LGAs and it may be that these migrants, with their English speaking skills, are responding to opportunities provided by resource development activities in these states. At the Alliance level, 11.2 percent of the population was drawn from European countries in 211, compared with 8.4 percent from Asia and 1.7 percent from sub-saharan Africa. In relation to migrants from Asia, the highest concentrations occurred in Blacktown, Wyndham, Gosnells and Casey. Moreover, in Blacktown, Liverpool, Casey, Wyndham, and Gosnells, the proportion of the total population from Asia is greater than that from Europe. As for migrants from sub-saharan Africa, the highest proportions of total population occurred, with the exception of Casey, in LGAs located in Western Australia - Wanneroo, Gosnells, Swan, Cockburn and Armadale. Within the Alliance there are some 1.17 million Australian born persons with an overseas born mother and/or father. Australian born persons with an overseas born father represent 27.3 percent of all Australian born persons, compared with 24.1 percent of Australian born persons with an overseas born mother. For Australian born persons with an overseas born parent, the highest proportions occur in Liverpool, Whittlesea, Hume, Melton, Blacktown and Wanneroo.
95 95 The mix of visa categories among immigrants settling in an area can have an important impact on demand for services. The data presented shows the mix of visa categories of permanent migrants arriving in Australia between 26 and 211 and settling in the Alliance LGAs. This shows an overall overrepresentation with one in five permanent migrants arriving in Australia over the period settling in the Alliance LGAs. Especially significant, however, is that 28.7 percent of all humanitarian arrivals settled in Alliance LGAs. This is particularly important because they are heavily dependent on assistance in their early years of settlement in Australia. Again, there are important variations between Alliance LGAs especially in relation to humanitarian migrant settlement. In an analysis of migrants by visa category, all the LGAs showed a similar pattern of change between 21 and 212, in that steady growth in all categories occurred to 26, followed by a large spike in numbers in 27, after which time, numbers declined steadily to 212, at which point numbers were very similar to those that prevailed in 21. The exception to this was Campbelltown in New South Wales, where numbers in each of the categories increased steadily to 28, after which there was steady decline through to 212. Although Census data has detailed information on country of birth, an opportunity was taken to examine the relationship between visa category and country of birth using data from the settlement reporting facility. From this, data were presented to show the top ten countries by birth for each of the visa categories. In 212, 2.7 percent of immigrants settling into Alliance LGAs were eligible for settlement services. LGAs with the highest proportion of their migrant intake in the Settlement Target Group in 212 were Playford, with more than half (54. percent) of its intake eligible for services provided by the Settlement Grants Program, Logan and Hume, Ipswich, Kwinana, Liverpool, Casey, Whittlesea, Mandurah, Blacktown and Gosnells. These LGAs have a high proportion of humanitarian migrants, in particular, and migrants with low English proficiency, and it is in these LGAs where teaching English, especially, to new migrants is an imperative as a means to encouraging integration into the community and being able to use a whole range of services available to them in the wider community.
96 96 CHAPTER 4. INTERNAL MIGRATION 4.1 INTRODUCTION Australians are the most mobile society in the contemporary world. The 211 census indicated that 15.8 percent of Australians had moved their permanent place of residence during the previous five years, the highest rate of residential mobility of any country. The impact of this mobility on population change and distribution is profound. This chapter uses data from the 26 and 211 Censuses to show for each of the Alliance LGAs the contribution made to population change by: Intrastate in and out migration Net intrastate migration Interstate in and out migration Net interstate migration Out migration In migration Net migration 4.2 MOBILITY It needs to be noted that this mobility may be understated to a degree, simply because the Census asks persons where they lived five years earlier, and not where have they lived from time to time during the previous five years. Further, Moreton Bay Regional Council did not exist in 26. As a result, its internal mobility for the period is an estimate, derived from 26 data for the LGAs of Caboolture, Redcliffe and Pine Rivers. In 211, Moreton Bay LGA was comprised of statistical local areas (SLAs) which, in 26, fell within the boundaries of Caboolture, Redcliffe and Pine Rivers LGAs. With this caveat, Table 4:1 summarises internal mobility for each of the Alliance LGAs during the five years to 26. There are a number of distinct patterns deriving from the table. Firstly, there is a group of LGAs which experienced net migration losses during the five year period that is more people leaving than arriving. These are Blacktown, Campbelltown, Liverpool, Penrith, Logan and Armadale. In these LGAs, net migration losses ranged from 2,115 (Armadale) to 1,741 (Blacktown). Net migration is a composite of intra state and interstate migration. All of these LGAs recorded net population loss to other parts of their respective states, and all lost population to interstate locations, with the exception of Logan, which experienced net population gain of 3,693 from interstate. The second group of LGAs are those which experienced substantial net migration gains during Net gains from internal migration in these LGAs ranged from 11,56 in Casey to 17,386 in Moreton Bay. Other LGAs with gains between these extremes were Wyndham, Melton, Ipswich and Wanneroo. Each of these LGAs received a significance part of their net migration growth from intrastate migration. In the case of Moreton and Ipswich, large increases also occurred from interstate migration 12,79 and 4,892 respectively while at the lower end the contribution from net migration from interstate was a little lower at 1,26 for Wanneroo. A third group of LGAs had only moderate to small growth from net internal migration, including Whittlesea, Serpentine-Jarrahdale, Kwinana and Playford.
97 97 Table 4:1: Internal mobility, Alliance LGAs, Local government area Total departures Total arrivals Net migration Intrastate departures Intrastate arrivals Net intrastate migration Interstate arrivals Interstate departures Net interstate migration Blacktown (C) Camden (A) Campbelltown (C) Liverpool (C) Penrith (C) Casey (C) Cardinia (S) Wyndham (C) Melton (S) Hume (C) Whittlesea (C) Moreton Bay (Estimate) Logan (C) Ipswich (C) Gosnells (C) Wanneroo (C) Swan (C) Cockburn (C) Mandurah (C) Serpentine-Jarrahdale (S) Kwinana (T) Armadale (C) Rockingham (C) Mount Barker (DC) Playford (C) Note: The Moreton Bay estimate is based on mobility data for Caboolture, Redcliffe and Pine Rivers LGAs. Source: ABS 26, TableBuilder, UR5P It is clear from an examination of the table that the net levels of internal mobility, intrastate mobility and interstate mobility is the result of literally thousands of persons arriving and departing from the LGAs. For example, in Wanneroo, the net migration level of 12,185 between was a result of more than 42, persons who moved in and out from intrastate locations and 5,5 persons who moved to, and from, interstate locations. If all these persons had identical social, ethnic, age and economic characteristics, then the mobility would result in no overall change to the LGAs social and economic fabric. However, where there are differences in the mix of movers, then there can be profound implications for LGAs in terms of social change, which will create a whole new range of issues that need to be met and resolved within the various jurisdictions. For example: changes in income levels between those leaving and those arriving may place varying demands on house sales or house rentals; or in the case of variations in the ages of those leaving and arriving if more younger families were leaving and were replaced by an older population there would be shifts in demands for schools, childcare, transport and aged care services. The situation prevailing in the ensuing period is presented in Table 4:2. As with the data; so too with the data, there are a number of distinct patterns deriving from the table. Again, there is a group of LGAs which experience net migration losses during the five year period, which include Blacktown, Campbelltown, Liverpool, Penrith, Logan and Gosnells. Apart from Gosnells, these are the same LGAs as those that experienced net migration losses during the period. However, in the
98 98 period, the LGAs have recorded lower net migration losses than in the earlier period, suggesting a slowing of population losses. With the exception of Blacktown, these LGAs also experienced net migration loss to other parts of their state. Blacktown, Campbelltown, Liverpool and Penrith also had net losses of population to interstate locations, while Logan and Gosnells did record net gains from interstate locations. Table 4:2: Internal mobility, Alliance LGAs, Local government area Total departures Source: ABS 211, Table Builder. Total arrivals Net migration Intrastate departures Intrastate arrivals Net intrastate migration Interstate arrivals Interstate departures Net interstate migration Blacktown (C) Camden (A) Campbelltown (C) Liverpool (C) Penrith (C) Casey (C) Cardinia (S) Wyndham (C) Melton (S) Hume (C) Whittlesea (C) Moreton Bay (R) Logan (C) Ipswich (C) Gosnells (C) Wanneroo (C) Swan (C) Cockburn (C) Mandurah (C) Serpentine-Jarrahdale (S) Kwinana (T) Armadale (C) Rockingham (C) Mount Barker (DC) Playford (C) The second group of LGAs are those which experienced substantial net migration gains during Net gains from internal migration in these LGAs ranged from 16,347 in Wyndham to 9,561 in Cardinia. Other LGAs with gains between these extremes were Melton, Whittlesea, Moreton Bay and Wanneroo. Each of these LGAs received a significant part of their net migration growth from intrastate migration, and in the case of Moreton Bay and Wyndham, a large component of their net migration gain also occurred from interstate migration 6,89 and 1,628 respectively. A third group of LGAs had only moderate to small growth from net internal migration, including Hume, Kwinana and Mount Barker. Net interstate migration to an area indicates that it has an attraction beyond local boundaries, whether for employment opportunities, environment or retirement reasons. While 18 of the Alliance LGAs reported net gains from interstate migration during , the largest gains occurred in Moreton Bay, Ipswich, Rockingham, Wyndham and Mandurah.
99 SUMMARY Any analysis of internal mobility will identify sinks and sources - areas that are attractive to people and areas that are unattractive for a variety of reasons. Where net internal mobility losses occur it means that there is uneasiness on the part of the population about their area. It may mean that the area is too large, in population terms, it's perhaps overcrowded and congested, infrastructure may be stressed as a result, its economic base may be inadequate and employment opportunities low. Any of these factors cause social degradation to increase, which in turn leads to a situation where those who can leave do so, and if they are replaced it is by a new population group with a new set of social characteristics. This is part of the process of succession in any area. As an example, between 21 and 26 the Sydney Statistical Division experienced net migration loss of more than 121, persons, which was made up by an equivalent gain from international migration. A little under half these movers shifted to elsewhere in NSW, to the Central coast or the north coast, and other areas in New South Wales. With them they took a certain set of social characteristics - probably nearing retirement, secure income, good job prospects and other characteristics that made it possible for them to escape what they saw as the expensive and busy lifestyle or rat race in Sydney. Those coming into Sydney to replace the departures came to take advantage of what Sydney offered - principally better employment and education opportunities, proximity and affinity to particular migrant groups, and potentially existing social networks. LGAs which experience gains are sinks - they have people pouring into them to take advantage of what they offer. These LGAs are attractive in a variety of ways. There is likely to be strong economic activity to employ the population, or there is a good transport system that allows a commuter population to get to work, they may have utility and high amenity, a good environment and housing opportunities and affordability. These areas receive most of their new population from intrastate mobility as (predominantly young) households arrive to take advantage of opportunities created in large housing developments on the outer edges of cities. There is a final type of sink LGA, which receives new population from both intrastate and interstate sources. In these LGAs their most significant asset is their environment - be it climate or landscape. These are the sea change and tree change localities throughout Australia, which are increasingly attractive to a demographic different from that attracted to the outer suburbs or repelled from larger urban locations. In order for any community to understand their role as a sink or source location it is important to examine population change over time. This will give some indication of who is leaving and/or who is arriving. For example, if it is the working age population leaving is that because of a lack of employment opportunities in the local area, is there an opportunity to link the community to better places of employment through an improved transport system, has family housing become unaffordable or in short supply, is there a good supply of quality education and child care? If it is an older population that is moving is that because of the lack of appropriate health care and other aged care services, or perhaps a lack of aged appropriate housing, are there opportunities to encourage more volunteering and stronger connections to the local community through social engagement? It must also be remembered that being a sink location comes with its own set of issues for example ensuring that infrastructure and services is able to keep up with the growing population.
100 1 CHAPTER 5. HOUSEHOLDS AND FAMILIES 5.1 INTRODUCTION In recent decades there have been significant changes in the way in which people group into households and families. Understanding the nature of these changes is important since demand and need for many goods and services is created by households rather than individuals. This is particularly relevant in any areas where the growth of households has outpaced the growth of population. Table 5:1 shows that in the 25 NGAA LGAs, growth in households exceeded population growth in each of the LGAs during the period. The largest differences between household growth and population growth occurred in Whittlesea, Campbelltown, Hume, Kwinana, Armadale and Playford. However, in the period, population growth exceeded household growth in eleven LGAs with the greatest differences occurring in Blacktown, Gosnells, Casey, Liverpool, Wanneroo, Rockingham and Playford. In this chapter: We look at the distribution of various family types both spatially within the Alliance LGAs and temporally, as recorded at the 21, 26 and 211 Censuses. We also assess the spatial and temporal distribution of the three main housing tenure types outright ownership, buying with a mortgage and rental. 5.2 HOUSEHOLDS AND POPULATION GROWTH The growth of households and population in each of the Alliance LGAs is shown for the period in Table 5:1. Of the nine LGAs where household growth exceeded population growth in the period, the main LGAs were Whittlesea, Cardinia and Mount Barker. At the same time, there were five LGAs in which population growth and household growth were balanced Campbelltown, Melton, Hume, Cockburn and Armadale. At the aggregate level, that is considering all the NGAA LGAs, it is clear that in the period household growth exceeded population growth, while in the ensuing period a balanced situation prevailed. Perhaps more importantly, the levels of household growth and population growth were each greater in than in the period. When Alliance data are compared with the situation prevailing at the Australia level, the comparisons are revealing. Household growth during the period was twice the rate which occurred at the Australia level, while in the following five year period to 212 average annual household growth was more than twice the rate prevailing in Australia. The same observations can be made in respect to average annual change in population. The clear conclusion is that in the NGAA LGAs population growth and household growth has been occurring at levels around twice those occurring at the wider Australia level. The NGAA membership comprises, therefore, LGAs that are accommodating huge population and associated household growth. The slight flattening of household growth in the period may be the result of a slowdown in housing development in these regions. However the increased growth rate in population suggests that much of the household formation in the period was related to growth in the younger year age cohort and the concurrent (and probable linked) growth in the year cohort. In other words, young families having more babies.
101 11 Table 5:1: Household and Population growth, NGAA LGAs, LGA Name Households Population Average annual change, % Average annual change, % Blacktown (C) Camden (A) Campbelltown (C) Liverpool (C) Penrith (C) Casey (C) Cardinia (S) Wyndham (C) Melton (S) Hume (C) Whittlesea (C) Moreton Bay (R) Logan (C) Ipswich (C) Gosnells (C) Wanneroo (C) Swan (C) Cockburn (C) Mandurah (C) Serpentine-Jarrahdale (S) Kwinana (T) Armadale (C) Rockingham (C) Mount Barker (DC) Playford (C) Alliance total Australia Source: ABS DataPacks 211, Time Series Profile, Table 14 Table 5:2 shows average household size at each of the previous three censuses. It is clear from this table that while there are some variations between individual LGAs, there has been relatively little change in average household size temporally. It might be expected that processes of ageing, increased divorce and/or separation and government policies designed to keep older people in their own homes for as long as possible should work to reduce the average size of households. The evidence does not seem to support this tendency in the NGAA LGAs but does support the assumption that household and population growth is linked more closely to young families. This is also borne out below with the above Australian average of households represented by couple families with children and may account for the generally steady average household size in the LGAs, that is more families and less couples or single households.
102 12 Table 5:2: Average household size, NGAA LGAs, LGA Name Average household size: Bl a cktown (C) Ca mden (A) Ca mpbel l town (C) Li verpool (C) Penri th (C) Ca s ey (C) Cardinia (S) Wyndha m (C) Mel ton (S) Hume (C) Whi ttl es ea (C) Moreton Ba y (R) Loga n (C) Ips wi ch (C) Gosnells (C) Wa nneroo (C) Swa n (C) Cockburn (C) Ma ndura h (C) Serpenti ne-ja rra hda l e (S) Kwi na na (T) Armadale (C) Rocki ngha m (C) Mount Ba rker (DC) Pl a yford (C) Tota l Source: ABS DataPacks 211, Time Series Profile, Table FAMILY COMPOSITION Within households there are a range of family configurations. In this section the changing representations of couple families, with and without children, single parent families and lone and group households are discussed. The dominant family type in any community is couple families, comprising couples with children and couples without children. In the NGAA LGAs, couples without children averaged 22.1 percent of all households in 21, increasing slightly to 23.2 percent in 211, while the percentage of households comprised as couples with children reduced from 41.9 percent in 21 to 38.6 percent in 211 Table 5:3 shows the distribution of couple families without children both temporally and among the NGAA LGAs.
103 13 Table 5:3: Couple families with no children, NGAA LGAs, LGA Name Blacktown (C) Camden (A) Campbelltown (C) Liverpool (C) Penrith (C) Casey (C) Cardinia (S) Wyndham (C) Melton (S) Hume (C) Whittlesea (C) Moreton Bay (R) Logan (C) Ipswich (C) Gosnells (C) Wanneroo (C) Swan (C) Cockburn (C) Mandurah (C) Serpentine-Jarrahdale (S) Kwinana (T) Armadale (C) Rockingham (C) Mount Barker (DC) Playford (C) Alliance total Australia Source: ABS DataPacks 211, Time Series Profile, Table 14 At the aggregate level, couple families with no children have increased in the ten year period to 211, form 22.1 percent to 23.2 percent of all households. This is reflective of a national and international tendency for couples to delay child birth to accommodate career and leisure options, at the expense of child rearing. Within the NGAA LGAs, 17 experienced increasing proportions of couple families with no children during the period, while five experienced declining proportions of this family type. There were only three LGAs in which the proportion of couple families without children remained steady. In terms of average annual change in this family type, the following points can be made: Percent all households: Average annual change: At the aggregate level, couple families without children grew by 3.6 percent annually in the period, and by 3.4 percent in the five years to 211. In the period, average annual change in the number of couple families without children was twice the rate recorded at the Australia level. In the ensuing five year period, Alliance growth in this demographic lagged the growth rate occurring at the wider Australia level. In both the and periods there were 12 LGAs which had growth above the aggregate level. Among LGAs with above aggregate level growth in either of the periods, eight had above the aggregate growth in each of the intercensal periods Cardinia, Wyndham,
104 14 Melton, and Hume in Victoria, Wanneroo and Mandurah in Western Australia and Mount Barker in South Australia. These are all outer suburbs with significant new housing development, which is clearly being bought by young couples at the pre child rearing stage of the life cycle or perhaps by older empty nester couples. All of the New South Wales LGAs have very low rates of average annual growth for this demographic during each of the intercensal periods. This is likely to reflect the higher proportions of migrants resident in these areas. Couple families with children are the dominant family type in Australian communities. The presence of this group in the NGAA LGAs is shown in Table 5:4. At the aggregate level, the percentage of couple families with children has declined slightly from 41.9 percent to 38.6 percent in the ten years between 21 and 211. However, it must be noted that this was still well above the Australian average. Unlike the situation with couple families without children, this tendency has occurred in all the NGAA LGAs except one Rockingham in Western Australia. In 211, all of the Victorian LGAs had concentrations of couple families with children above the aggregate level. In NSW, three of the five NGAA LGAs were above the aggregate level. This can explain the relatively low levels of couple families without children noted above for the NSW NGAA LGAs. When benchmarked against the situation prevailing in Australia the levels in the Alliance group are considerably higher than those prevailing at the Australia level. It shows the significance of this household type within the Alliance, and it is therefore an element of the LGAs demography that demands policy attention of various kinds. In the period, average annual growth in this family type was 1.4 percent, rising to 2.9 percent in the period. These levels are considerably higher than the levels prevailing for Australia as a whole. Four LGAs experienced negative annual growth during the period Campbelltown, Penrith, Armadale and Mount Barker while negative growth in the period occurred only in Campbelltown. There are several other points that can be made in terms of growth in this family type: 12 LGAs experienced growth greater than the aggregate level during 21-26, compared with 13 in the ensuing five year period. In the period the highest annual growth rates occurred in Melton (7.4 percent), Wanneroo (5.9) and Wyndham (4.3). These LGAs had continued high growth in the period, along with Rockingham. In the period, there were seven LGAs with average annual growth of five percent or more Wyndham, Melton, Wanneroo, Mandurah, Serpentine-Jarradale, Kwinana and Rockingham. These are clearly areas of high fertility within each of the states. Average annual growth rates of two percent or less occurred in Camden, Campbelltown, Liverpool, Penrith, Logan and Playford.
105 15 Table 5:4: Couple families with children, NGAA LGAs, LGA Name Percent all households: Average annual change: Blacktown (C) Camden (A) Campbelltown (C) Liverpool (C) Penrith (C) Casey (C) Cardinia (S) Wyndham (C) Melton (S) Hume (C) Whittlesea (C) Moreton Bay (R) Logan (C) Ipswich (C) Gosnells (C) Wanneroo (C) Swan (C) Cockburn (C) Mandurah (C) Serpentine-Jarrahdale (S) Kwinana (T) Armadale (C) Rockingham (C) Mount Barker (DC) Playford (C) Alliance total Australia Source: ABS DataPacks 211, Time Series Profile, Table 14 Single parent families are the fourth most dominant family type in the NGAA LGAs. At the aggregate level, their concentration has remained static at 13.2 percent at each census from 21, as shown in Table 5:5. The same tendency has occurred at the Australia level. However, compared with the Alliance, levels of one parent families are some three percent lower in Australia than within the Alliance. It means, therefore, that one parent families are a significant component of household structures in the Alliance LGAs. Only one LGA Wyndham has experienced no change in their level of one parent families between 21 and 211. Among the remainder, there is an even split between LGAs which have experienced growth in the percentage of all households which are single parent families, and those in which a decline has occurred. In 211, LGAs in which 14 percent or more of households were single parent families were Campbelltown (16.8 percent), Blacktown (15.2), Logan (14.4), Penrith and Ipswich (14.3) and Liverpool and Hume (14.). Low concentrations of 11 percent or less occurred in Cockburn, Mandurah, serpentine-jarrahdale, Rockingham and Mount Barker. Among the NGAA LGAs average annual growth for single parent families was 2.7 percent in the five years to 26, increasing to 3.2 percent in the period. Between 26 and 211 this family type grew at a faster rate than couple families with children, and almost as fast as couple families without children and lone person households. At the Australia level, average annual change in this household type was also greater in the period than
106 16 in the previous five year period. However, it is significant within the Alliance that growth rates are at much higher levels than those prevailing Australia wide. Table 5:5: Single parent families, NGAA LGAs, LGA Name Percent all households: Average annual change: Blacktown (C) Camden (A) Campbelltown (C) Liverpool (C) Penrith (C) Casey (C) Cardinia (S) Wyndham (C) Melton (S) Hume (C) Whittlesea (C) Moreton Bay (R) Logan (C) Ipswich (C) Gosnells (C) Wanneroo (C) Swan (C) Cockburn (C) Mandurah (C) Serpentine-Jarrahdale (S) Kwinana (T) Armadale (C) Rockingham (C) Mount Barker (DC) Playford (C) Alliance total Australia Source: ABS DataPacks 211, Time Series Profile, Table 14 Within the component LGAs, the following observations can be made: In 21-26, there were 11 LGAs whose average annual growth for single parent families was above the aggregate level. In the following period the number increased to 15. Those LGAs with above aggregate level growth in both the and periods were Casey, Cardinia, Wyndham, Melton, Whittlesea, Moreton Bay, Ipswich and Wanneroo. In these LGAs there are processes working which have caused high growth in the numbers of single parent families. What is significant, and which has not been observed for the previous family types, is the number of LGAs which went from below aggregate level growth in the period to above aggregate level growth in the following period to 211. These LGAs are Swan, Mandurah, Serpentine-Jarrahdale, Kwinana, Armadale, Rockingham and Playford. This may be related to a developing set of conditions related to housing that have encouraged growth in this family type; for example low cost housing developments or it may be related to rates of family separation. On the other hand, Camden and Liverpool went from having above aggregate level growth in the period to below aggregate level growth in the following five year period.
107 17 In the NGAA lone households represented 17.6 percent of all households in 211, an increase of one percent on the concentration in 21, as shown in Table 5:6. These levels are low when benchmarked against the situation for Australia, where the concentration of lone households has remained fairly steady at around 23 percent between 21 and 211. This household type is the third most represented household within the NGAA LGAs, after couple families with children and couple families without children. Table 5:6: Lone households, NGAA LGAs, LGA Name Percent all households: Average annual change: Blacktown (C) Camden (A) Campbelltown (C) Liverpool (C) Penrith (C) Casey (C) Cardinia (S) Wyndham (C) Melton (S) Hume (C) Whittlesea (C) Moreton Bay (R) Logan (C) Ipswich (C) Gosnells (C) Wanneroo (C) Swan (C) Cockburn (C) Mandurah (C) Serpentine-Jarrahdale (S) Kwinana (T) Armadale (C) Rockingham (C) Mount Barker (DC) Playford (C) Alliance total Australia Source: ABS DataPacks 211, Time Series Profile, Table 14 In more than three quarters of LGAs, the proportion of this household type has increased between 21 and 211. Its presence has decreased in four LGAs Ipswich, Serpentine- Jarrahdale, Kwinana and Rockingham, while in two Logan and Mount Barker their concentration has remained steady during the ten year period. Lone households are, therefore, a developing phenomenon within the NGAA. Indeed, 14 NGAA LGAs, or 56 percent of the Alliance, had concentrations of lone households within their jurisdictions above the aggregate level in 211. The growth rate for this household type has been similar to that for couple only families. At the aggregate level, lone households grew by 3.8 percent between 21 and 26, declining marginally to 3.4 percent in the period. Compared with growth rates of the household type in Australia, those occurring in the Alliance are significant. Australia reported average annual growth of just 1.5 percent in the period, and 1.7 percent in the following five year period. It means that this household type is a developing phenomenon within the Alliance LGAs and one that may attract the attention of planners and policy makers within the various jurisdictions.
108 18 In terms of average annual growth, the main points are: During 21-26, there were nine LGAs which had higher growth in lone households that reported at the aggregate level. This number increased to 11 in the following period. LGAs with higher than aggregate level growth in both periods were Cardinia, Wyndham, Melton, Hume, Whittlesea, Wanneroo and Mandurah. Most of these LGAs reported the same tendency for one parent families. Moreton Bay, Ipswich, Serpentine-Jarrahdale and Rockingham reported above aggregate level growth in the period, after reporting lower than aggregate growth in the preceding period. The opposite trend occurred in Casey. The final household type considered is the group household, and its spatial and temporal distribution among and within the Alliance LGAs is shown in Table 5:7. Group households generally represent Residential Aged Care, Hostels and Boarding Housing etc. At the aggregate level, group households represented 2.3 percent of all households at the 21 and 26 Censuses, increasing to 2.6 percent at the 211 Census. These levels are lower than those recorded for Australia, indicative of the younger population base found in most Alliance LGAs. Therefore, as a phenomenon this household type is not as widespread as elsewhere in Australia. Relative to the other family and household types, it is the least prevalent. In 19 of the 25 Alliance LGAs, the proportion of group households has increased between 21 and 211. The remaining six LGAs have split evenly between a decline and a steady state situation. Just over half the LGAs were below the aggregate level in 211, with a further two with group household levels at that of the aggregate. Ten LGAs had concentrations above the aggregate level. These results suggest that processes encouraging group household formation are quite concentrated, with levels of three percent or greater in 211 occurring in Logan, Ipswich, Gosnells, Kwinana and Playford. Between 21and 26, average annual growth of group households was 2.4 within the Alliance group, but this rate more than doubled to 5.4 percent in the period. As was the case with lone households, the average annual growth rates were considerably higher than those prevailing at the Australia level. These results suggest that group households are an emerging phenomenon within the NGAA LGAs, reflecting conditions mainly associated with the ageing of the population, housing affordability, and possibly youth unemployment or under employment. In terms of average annual growth, a number of points need to be made: In the period, four LGAs Campbelltown, Liverpool, Penrith and Logan experienced negative growth. Further, Camden and Playford had virtually no growth. There were 14 LGAs which reported above aggregate level growth between 21 and 26, with the highest growth occurring in Casey, Wyndham, Melton, Hume and Wanneroo. During the period , there were again 14 LGAs which had growth greater than that for the Alliance as a whole. In ten cases, LGAs with above aggregate level growth in also reported above aggregate level growth in These were Cardinia, Wyndham, Melton, Whittlesea, Ipswich, Wanneroo, Cockburn, Mandurah and Rockingham. These LGAs are, therefore, the LGAs within the Alliance where processes conducive to group households prevail.
109 19 Table 5:7: Group households, NGAA LGAs, LGA Name Percent all households: Average annual change: Blacktown (C) Camden (A) Campbelltown (C) Liverpool (C) Penrith (C) Casey (C) Cardinia (S) Wyndham (C) Melton (S) Hume (C) Whittlesea (C) Moreton Bay (R) Logan (C) Ipswich (C) Gosnells (C) Wanneroo (C) Swan (C) Cockburn (C) Mandurah (C) Serpentine-Jarrahdale (S) Kwinana (T) Armadale (C) Rockingham (C) Mount Barker (DC) Playford (C) Alliance total Australia Source: ABS DataPacks 211, Time Series Profile, Table 14 In Gosnells, Swan and serpentine-jarrahdale, growth in the period was substantially higher than that recorded for the earlier period. Indeed, they went from below aggregate level concentrations to above aggregate level concentrations. In these LGAs, changes have occurred which would seem to encourage the presence of group households within their jurisdictions. The four LGAs which had negative growth in have each reported positive growth in the following period, ranging from one percent to 4.2 percent. In the case of Camden and Playford, which had zero or negligible growth during 21-26, their growth in the following period was three percent for Camden and 8.7 percent for Playford. 5.4 TENURE CHARACTERISTICS For most Australian, their housing careers involve renting in the early days after leaving the family home, and subsequently moving into dwellings of various types as owner occupants, initially with a mortgage, but with time owning the property outright. In this section, the relative concentrations of households owning, buying or renting housing is considered for each of the Alliance LGAs, as well as examining how these various tenures have changes temporally during the period. Table 5:8 shows the prevailing situation for households who owned their housing outright at each of the Census for 21, 26 and 211. At the aggregate level, it is clear that within the Alliance LGAs, the proportions of households living in fully owned housing has fallen from almost one third in 21 to just under a quarter in 211. This tendency has occurred in every
110 11 LGA within the Alliance during the ten years to 211. The main driving factor in this trend has been an expanding housing market in these growth areas in which increasing numbers of households are in the mortgage repayment phase of their housing careers. The same tendencies can be noted at the Australia level, although nationally there are higher proportions of households owning their dwelling outright. This is to be expected because the Alliance comprises growth LGAs where outright ownership will be less than the number of relatively new households in the process of paying off their mortgage. Table 5:8: Households in fully owned dwellings, NGAA LGAs, LGA name Percent all households owned Average annual change, % Blacktown (C) Camden (A) Campbelltown (C) Liverpool (C) Penrith (C) Casey (C) Cardinia (S) Wyndham (C) Melton (S) Hume (C) Whittlesea (C) Moreton Bay (R) Logan (C) Ipswich (C) Gosnells (C) Wanneroo (C) Swan (C) Cockburn (C) Mandurah (C) Serpentine-Jarrahdale (S) Kwinana (T) Armadale (C) Rockingham (C) Mount Barker (DC) Playford (C) Alliance total Australia Source: ABS DataPacks 211, Time Series Profile, Table 18 In 211, there were 12 LGAs in which the proportion of fully owned dwelling was above the aggregate level, with the highest proportions occurring in Hume and Whittlesea in Victoria, and Mandurah and serpentine-jarrahdale in Western Australia. Levels less than 2 percent were reported in Wanneroo and Kwinana. Between 21 and 26, negative average annual growth of 1.8 percent occurred for the tenure type. In all likelihood, this indicated a changeover period in which long term owners sold out to new owners with a mortgage. It represented an aspect of intergenerational change, as the new generation of owner occupiers moved into the area. The same tendency, but at a greater negative rate, occurred in the wider Australian context. During this period, negative average annual growth occurred in all of the Alliance LGAs, with the exception of Melton, Wanneroo, Mandurah and Serpentine-Jarrahdale.
111 111 In the subsequent period, a turnaround occurred, with average annual growth increasing to 1.8 percent, reflecting increasing numbers of households paying off their mortgage and owning their property outright. A similar turnaround, but at a significantly lower rate, occurred for Australia. As a result, within the Alliance there were no LGAs in which negative average annual growth occurred. There were 13 LGAs with growth in this tenure type at levels higher than the aggregate level. Within this group of LGAs, average annual growth of three percent or greater occurred in Camden, Casey, Cardinia, Wyndham, Melton and Wanneroo. Lowest average annual growth in the period occurred in Blacktown, Penrith, Logan, Ipswich, Kwinana and Playford. The most prevalent tenure group within the NGAA LGAs comprises households who are in the process of paying off a mortgage with which they have purchased their dwelling. As Table 5:9 shows, within the Alliance the proportion of households owning their dwelling with a mortgage has increased significantly from 38.1 percent in 21 to 43.2 percent in 26 and further increasing to 43.7 percent in 211. These levels are much higher than those occurring within Australia. It is clear that the underlying process at work is the expansion of housing, especially in outer areas, being produced for consumption by the next generation of home owners who seek entry into the housing market using a mortgage facility of some kind. Of course, the market will comprise not only younger households commencing their housing career, but also a sizeable proportion of overseas born migrants. In 211 there were 14 LGAs in which the proportion of all households in dwellings bought with a mortgage was greater than the proportion prevailing at the aggregate level. In five of these Camden, Casey, Melton, Wanneroo and Serpentine-Jarrahdale the proportion of owner occupiers with a mortgage was greater than 5 percent of all households. In terms of average annual growth of this tenure, there are several points that need to be made: The average annual growth of housing bought with a mortgage between 21 and 26 was 5.4 percent. Compared with the average annual growth for fully owned housing during the same period, this represent a significant process in the housing market within Alliance LGAs. The growth rate during this period was virtually the same as that reported for the whole of Australia. Growth rates greater than seven percent were reported in the Victorian LGAs of Cardinia, Wyndham, Melton and Hume. Although average annual growth reduced to 3.4 percent in the period, it was nevertheless nearly twice the rate which occurred for fully owned housing. As well, the average annual growth in this period was 1.2 percent higher than that for Australia, indicating that growth in this tenure type accelerated in growth areas relative to the rest of Australia. There were four LGAs with growth rates greater than six percent Wyndham, Whittlesea, Wanneroo and Serpentine-Jarrahdale. Cardinia, Wyndham, Melton, Whittlesea and Wanneroo reported above aggregate level concentrations in both the and periods. More significant was the fact that all the Western Australian LGAs, barring Swan, had below aggregate level proportions in the period but above level proportions in the following period. This indicates that the housing boom fuelled by early housing career owners and migrants, both interstate and international, really got under way in the five years leading to 211. It may also be a reflection of Western Australia s position in Australia s two speed economy, in which WA is performing at a level much different from a number of the other states.
112 112 Table 5:9: Households in mortgaged dwellings, NGAA LGAs, LGA name Percent all households buying Average annual change, % Blacktown (C) Camden (A) Campbelltown (C) Liverpool (C) Penrith (C) Casey (C) Cardinia (S) Wyndham (C) Melton (S) Hume (C) Whittlesea (C) Moreton Bay (R) Logan (C) Ipswich (C) Gosnells (C) Wanneroo (C) Swan (C) Cockburn (C) Mandurah (C) Serpentine-Jarrahdale (S) Kwinana (T) Armadale (C) Rockingham (C) Mount Barker (DC) Playford (C) Alliance total Australia Source: ABS DataPacks 211, Time Series Profile, Table 18 Finally in this section, we consider the rental segment of the housing market. As Table 5:1 shows, in 211 households renting comprised 25.9 percent of all households, marginally higher than the levels prevailing in 21 and 26. The same tendencies, but at slightly higher levels, were reported for Australia. Among member LGAs, only in Camden, Campbelltown, Liverpool and Logan was the proportion of renting households lower in 211 than in 21. That is, in most of the LGAs, the proportion of households renting has increased in the ten year period to 211. At the macro level, this is in all likelihood due to housing affordability issues, as well as large numbers of relatively young households entering the housing market. At the aggregate level, average annual growth rates increased from 2.9 percent in the period to 4.7 percent for the five years to 211. These growth rates were considerably higher than those at the Australia level. These significantly higher growth rates for households in rental accommodation could represent the development of an increasingly relevant phenomenon in growth areas around Australia. Within the Alliance LGAs, the following points emerged during the period: In Logan the average annual growth rate was negative.3 percent, while very low growth in the tenure type occurred in Campbelltown, Penrith and Playford. There were 15 LGAs, or 6 percent of Alliance members, with average annual growth above that recorded at the aggregate level.
113 113 Growth of six percent or more per annum occurred in Casey, Cardinia, Wyndham, Melton, Wanneroo, Mandurah and Rockingham. During the period: 17 member LGAs had average annual growth greater than that reported at the aggregate level. Growth rates greater than eight percent occurred in Cardinia, Wyndham, Melton, Wanneroo and Serpentine-Jarrahdale. Table 5:1: Households in rented accommodation, NGAA LGAs, LGA name Percent all households renting Average annual change, % Blacktown (C) Camden (A) Campbelltown (C) Liverpool (C) Penrith (C) Casey (C) Cardinia (S) Wyndham (C) Melton (S) Hume (C) Whittlesea (C) Moreton Bay (R) Logan (C) Ipswich (C) Gosnells (C) Wanneroo (C) Swan (C) Cockburn (C) Mandurah (C) Serpentine-Jarrahdale (S) Kwinana (T) Armadale (C) Rockingham (C) Mount Barker (DC) Playford (C) Alliance total Australia All 15 LGAs with above aggregate growth during the period also recorded above aggregate level growth in the ensuing five year period. This tendency is absent from the preceding two tenure categories. Finally, in Logan the average growth rate was 3.2 percent compared with.3 in the period, while comparable rates in Cockburn were 5.4 and 2.6, and in Serpentine- Jarrahdale 9.2 and 1.4. Clearly, in these LGAs there has been a huge influx of renters into the housing market during the period.
114 SUMMARY In considering the composition of families in the Alliance LGAs, the following general tendencies were noted: In 211 couple families without children ranged from around one fifth to nearly one third of all households in the NGAA LGAs. These levels are at, or below, the level prevailing Australia wide. This is to be expected, as Alliance member LGAs are growth areas and the dominant family group will be young and in the early stages of raising a family. Further, in the period, average annual growth in this family group ranged from 1.1 percent in Liverpool to 6.4 percent in each of Melton and Whittlesea. Again, and for the same reasons, these levels are around, or below, the national level. Couple family with children are the dominant family type in the NGAA LGAs. However, their dominance is declining relative to the other family and household types, simply because growth in this family type is not matching that in the other family types. This notwithstanding, the levels of this family type within the Alliance are generally at levels well above those prevailing in the wider Australian community. This family type is characteristics of all growth areas on the fringes of Australian capital cities. The proportion of households comprising single parent families in 211 ranged from 9.1 percent to 17.1 percent. In a third of LGAs, growth above the aggregate level has been recorded in each census period since 21. More significantly, in seven LGAs, or 28 percent of Alliance LGAs, above aggregate level growth occurred in the period, compared with below aggregate growth in the previous period. In these LGAs there is clearly a developing tendency in terms of the concentration of single parent families within the total mix of families and households. This is all the more significant when compared with levels for Australia. Within Australia, single parent families comprise ten percent of all families. In 211, all Alliance LGAs were either at, or above this level. In terms of average annual growth in the period, 21 of the Alliance LGAs were above the national level. Lone households are a significant component of household composition in each of the Alliance LGAs. Their average annual growth in both the and periods shows similar tendencies to that for one parent families. In more than a quarter of Alliance LGAs this household type is a significant and growing phenomenon. However, the lone household demographic is low relative to the Australian benchmark. In 211, for example, the prevailing level in the Alliance was 17.6 percent compared with 23.1 at the Australia level. What is more significant is the growth rate of lone households in Alliance LGAs. In the period, their growth within the Alliance was 3.4 percent, double the rate for Australia. Therefore, it would seem that this household type is a developing phenomenon within the Alliance LGAs. Group households are the least prevalent household type in the Alliance. In the period, this household type had the lowest growth rate after couple families with children. However, in the period it reported the highest growth rate of all the family and household types considered. It is, therefore, an emerging phenomenon in many of the Alliance LGAs. As was the case with lone households, the presence of this family type in Alliance LGAs is lower than the prevailing level of around 3.9 percent in Australia. However, in terms of average annual growth rates, growth in the Alliance has been at rates up to double those occurring within the total Australian population.
115 115 The analysis of tenure characteristics of households has shown the following general tendencies: Outright ownership of housing has declined as a proportion of all households in the period, a tendency also present in the wider Australian community. Most significantly, most Alliance LGAs experienced negative average annual growth in the period, but at a rate less than that for Australia, before returning to positive growth in the ensuing five year period. Levels of outright ownership reflect those occurring at the wider Australia level, albeit at levels around about nine percent lower. More significantly, average annual growth in the recovery period has been more than three times greater than that for Australia. Households buying their property with a mortgage are the largest part of the housing market in the Alliance LGAs. At the Alliance level, this tenure category is significantly higher than the level for Australia. For example, in 211, 43.7 percent of dwellings in the Alliance were being purchased, compared with 33.3 percent within Australia. The Alliance has experienced large annual growth rates, especially in the five years to 26, before reducing to 3.4 percent per year during the period. In the period, average annual growth for the tenure type was 5.4 percent in the Alliance compared with 5.5 percent for Australia. In the ensuing period, growth in the Alliance outstripped that for Australia 3.4 percent compared with 2.2 percent. There are a handful of LGAs within the Alliance in which growth in the period has been greater than that which occurred in the earlier period. The rental housing sector is a significant component of the housing market. Within the Alliance, its share of the total market has slowly changed, so that in 211 it had a greater share of the housing market than did households in fully owned tenure. There has been a turnaround in relative proportions of fully owned and rented households during the ten years to 211. In 211, rental accommodation represented 25.9 percent of the housing stock, slightly lower than the 28.7 percent prevailing in Australia. The average annual growth of this tenure has been greater than that for Australia in both the and periods. During , average annual growth, at 4.7 percent, was considerably greater than the 2.6 percent rate recorded for Australia.
116 116 CHAPTER 6. POPULATION TRENDS WITH POLICY IMPLICATIONS The population dynamics of Alliance LGAs present a number of challenges and opportunities that require further thought and discussion amongst the Alliance LGAs. While this report is meant to provide data to fuel this discussion some key points can be made: The Alliance LGAs are absorbing a disproportionately large share of national growth in both population and households twice their proportionate share on average but greater in several LGAs. This requires significant lobbying at both the Federal and State level in order to ensure that resources are proportional to the growth. In particular Alliance LGAs are absorbing a disproportionate share of growth in the dependent children and youth groups. This means attention needs to focus on resources that meet the needs of this population group including adequate schools, childcare, safe open spaces and opportunities for employment for parents close to home or good commuting transport corridors. In addition it must be remembered that today s young families are tomorrow s older population, with the majority of Australians choosing to stay and age in place in the family home. This gives Alliance LGAs a glimpse at their future and the ability to consider advance planning for a changing population. While Alliance LGAs currently have a lower share of the nation s rapidly growing aged population, it is growing faster in Alliance LGAs than in the nation as a whole thus is indicative of the need for forward planning as the baby boomer generation moves into older age. Importantly, Alliance LGAs absorb a disproportionately large share of new immigrants settling in Australia this is especially marked for humanitarian migrants; almost one in three of whom settle in these LGAs. Since these groups have especially significant needs of support in the early years of settlement, this represents an important feature of several of the LGAs. Particular attention needs to go into coordinating and creating the resources that meet the needs of this population group. Alliance LGAs are characterised by immigrant settlement of particular groups including those from Mainly English Speaking backgrounds (especially young families), Indian background, Fijian and Philippines-born. More than half of residents in these areas are a migrant or the child of a migrant. Alliance LGAs have a disproportionately large share of persons who moved within Australia, both intrastate and interstate, during the period. This is an important part of the dynamics of these areas and creates challenges for infrastructure and service provision. Attention needs to be paid to the changing population trends within LGAs to better understand the drivers and implications of this internal population mobility. There is a dominance of working families with mortgages in these areas. There is a disproportionate representation of couples and single parent families with children. These groups are vulnerable to changing housing prices and employment opportunities.
117 117 APPENDICES Appendix 1: Population by Age, NGAA LGAs, 21, 26 and 211 Local Government Area Blacktown (C) Camden (A) Campbelltown (C) Liverpool (C) Penrith (C) Casey (C) Cardinia (S) Wyndham (C) Melton (S) Hume (C) Whittlesea (C) Moreton Bay (R) Logan (C) Ipswich (C) Gosnells (C) Wanneroo (C) Swan (C) Cockburn (C) Mandurah (C) Serpentine-Jarrahdale (S) Kwinana (T) Armadale (C) Rockingham (C) Mount Barker (DC) Playford (C) Total Total Population Blacktown (C) Camden (A) Campbelltown (C) Liverpool (C) Penrith (C) Casey (C) Cardinia (S) Wyndham (C) Melton (S) Hume (C) Whittlesea (C) Moreton Bay (R) Logan (C) Ipswich (C) Gosnells (C) Wanneroo (C) Swan (C) Cockburn (C) Mandurah (C) Serpentine-Jarrahdale (S) Kwinana (T) Armadale (C) Rockingham (C) Mount Barker (DC) Playford (C) Total
118 118 Appendix 2: Top ten birthplace countries, NGAA LGAs, 21 Local Government Area Top ten countries of birth, 21 Blacktown (C) Philip' UK NZ India Fiji Malta China * Sri Lanka Italy Lebanon % Tot Pop Camden (A) UK NZ Italy China * Germany Malta Philip' Ireland Nether Sth Afr % Tot Pop Campbelltown (C) UK NZ Philip' Fiji India Sth Afr Lebanon China * Germany Poland % Tot Pop Liverpool (C) Fiji Vietnam UK Italy Lebanon Philip' SE Europe nfd NZ Iraq India % Tot Pop Penrith (C) UK NZ Philip' India Malta Germany Italy Fiji Nether Sth Afr % Tot Pop Casey (C) UK Sri Lanka NZ India Italy SE Europe nfd Nether Philip' Poland Croatia % Tot Pop Cardinia (S) UK Nether NZ Italy Germany SE Europe nfd Croatia Ireland USA Sth Afr % Tot Pop Wyndham (C) UK Italy NZ Philip' Malta India SE Europe nfd Germany Greece FYROM % Tot Pop Melton (S) UK Malta Philip' NZ Italy SE Europe nfd Germany FYROM Croatia India % Tot Pop Hume (C) Turkey UK Italy Iraq Lebanon Malta Vietnam Philip' Sri Lanka NZ % Tot Pop Whittlesea (C) Italy FYROM Greece UK Vietnam Malta Lebanon India Sri Lanka NZ % Tot Pop Moreton Bay (R) UK NZ Nether Germany Sth Afr Philip' Italy USA Fiji Ireland % Tot Pop Logan (C) UK NZ Germany Philip' Nether Sth Afr SE Europe nfd Fiji Vietnam Ireland % Tot Pop Ipswich (C) UK NZ Vietnam Nether Germany Philip' Malaysia Fiji Ireland USA % Tot Pop Gosnells (C) UK NZ Malaysia India Italy Sth Afr Nether Singapore Ireland Germany % Tot Pop Wanneroo (C) UK NZ Vietnam Italy India Sth Afr FYROM Malaysia Ireland Germany % Tot Pop Swan (C) UK NZ Vietnam Italy India Malaysia Sth Afr Poland Croatia Singapore % Tot Pop Cockburn (C) UK Italy NZ Croatia Sth Afr Malaysia SE Europe nfd India Singapore Bos/Herz % Tot Pop Mandurah (C) UK NZ Nether Germany Sth Afr Ireland Italy India Philip' USA % Tot Pop Serpentine-Jarrahdale (S) UK NZ Nether Italy Germany Sth Afr Ireland Canada India USA % Tot Pop Kwinana (T) UK NZ Nether Germany Italy Sth Afr India Ireland Philip' Malaysia % Tot Pop Armadale (C) UK NZ Nether Italy Germany India Sth Afr Ireland Malaysia Philip' % Tot Pop Rockingham (C) UK NZ Sth Afr Nether Germany Ireland Italy India SE Europe nfd Philip' % Tot Pop Mount Barker (DC) UK Germany NZ Nether Italy USA Sth Afr Ireland India Canada % Tot Pop Playford (C) UK Italy Germany Vietnam Nether NZ Ireland Philip' Greece SE Europe nfd % Tot Pop Total Alliance UK NZ Philip' Italy India Vietnam Fiji Germany Nether Malta
119 119 Appendix 3: Top ten birthplace countries, NGAA LGAs, 26 Local Government Area Top ten countries of birth, 26 Blacktown (C) Philip' UK India NZ Fiji Malta Sri Lanka China * Lebanon Italy % Tot Pop Camden (A) UK NZ Italy China * Malta Germany Philip' Sth Afr Ireland Lebanon % Tot Pop Campbelltown (C) UK NZ Philip' Fiji India Lebanon Sth Afr China * Egypt Germany % Tot Pop Liverpool (C) Fiji Vietnam Iraq Lebanon Philip' UK Italy India NZ Croatia % Tot Pop Penrith (C) UK NZ Philip' India Malta Italy Fiji Germany Sth Afr Nether % Tot Pop Casey (C) UK Sri Lanka India NZ Philip' Italy China * Nether Sth Afr Poland % Tot Pop Cardinia (S) UK NZ Nether Germany Italy Sth Afr Sri Lanka India USA Ireland % Tot Pop Wyndham (C) UK NZ Philip' Italy India Malta Vietnam Sri Lanka Malaysia China * % Tot Pop Melton (S) UK Philip' Malta India NZ Italy FYROM Vietnam Croatia Germany % Tot Pop Hume (C) Turkey Iraq UK Italy Lebanon NZ Philip' Sri Lanka India Malta % Tot Pop Whittlesea (C) Italy FYROM Greece Vietnam UK India Sri Lanka Lebanon NZ Malta % Tot Pop Moreton Bay (R) UK NZ Sth Afr Germany Philip' Nether USA Fiji Italy Ireland % Tot Pop Logan (C) NZ UK Philip' Sth Afr Germany Nether Fiji Vietnam China * Cambodia % Tot Pop Ipswich (C) UK NZ Vietnam Nether Germany Philip' Sth Afr Fiji Malaysia USA % Tot Pop Gosnells (C) UK NZ Malaysia India Sth Afr Singapore Italy Nether Indonesia Philip' % Tot Pop Wanneroo (C) UK NZ Vietnam Sth Afr Italy India FYROM Ireland Malaysia Germany % Tot Pop Swan (C) UK NZ Vietnam India Italy Sth Afr Malaysia Philip' Croatia Singapore % Tot Pop Cockburn (C) UK Italy NZ Croatia Sth Afr Malaysia Singapore India China * Philip' % Tot Pop Mandurah (C) UK NZ Sth Afr Nether Germany Italy Ireland India Philip' USA % Tot Pop Serpentine-Jarrahdale (S) UK NZ Nether Sth Afr Germany Italy Ireland Canada India USA % Tot Pop Kwinana (T) UK NZ Sth Afr Germany Nether Philip' India Italy Croatia Ireland % Tot Pop Armadale (C) UK NZ Nether Italy Sth Afr India Germany Ireland USA Malaysia % Tot Pop Rockingham (C) UK NZ Sth Afr Nether Germany Ireland India Italy Philip' USA % Tot Pop Mount Barker (DC) UK Germany NZ Nether Sth Afr Italy USA Canada Ireland Philip' % Tot Pop Playford (C) UK Italy Germany NZ Nether Vietnam Philip' Greece Ireland Cambodia % Tot Pop Total Alliance UK NZ Philip' India Italy Fiji Vietnam Sth Afr Sri Lanka Germany
120 12 Appendix 4: Top ten countries of birth, NGAA LGAs, 211 Local Government Area Top ten countries of birth, 211 Blacktown (C) Philip' India UK NZ Fiji Sri Lanka China * Malta Lebanon Egypt % Tot Pop Camden (A) UK NZ Italy China * Philip' Sth Afr Malta Germany India Fiji % Tot Pop Campbelltown (C) UK NZ Philip' India Fiji China * Sth Afr Lebanon Egypt Vietnam % Tot Pop Liverpool (C) Fiji Iraq Vietnam India Lebanon Philip' NZ Italy UK Croatia % Tot Pop Penrith (C) UK NZ Philip' India Malta Fiji Italy Germany Sri Lanka China * % Tot Pop Casey (C) UK India Sri Lanka NZ Philip' China * Sth Afr Fiji Italy Croatia % Tot Pop Cardinia (S) UK NZ Nether India Germany Sri Lanka Italy Philip' Sth Afr USA % Tot Pop Wyndham (C) India UK NZ Philip' China * Italy Malaysia Sri Lanka Vietnam Malta % Tot Pop Melton (S) UK India Philip' NZ Malta Vietnam FYROM Italy Sri Lanka Croatia % Tot Pop Hume (C) Iraq Turkey India UK Italy Lebanon NZ Sri Lanka Philip' Malta % Tot Pop Whittlesea (C) Italy FYROM India Greece UK Vietnam China * Sri Lanka Philip' Lebanon % Tot Pop Moreton Bay (R) UK NZ Sth Afr Philip' Germany Nether India Fiji USA Ireland % Tot Pop Logan (C) NZ UK Philip' Sth Afr Fiji India Germany Nether China * Vietnam % Tot Pop Ipswich (C) NZ UK Philip' Vietnam India Sth Afr Nether Germany Fiji China * % Tot Pop Gosnells (C) UK NZ India Malaysia Sth Afr China * Singapore Philip' Indonesia Italy % Tot Pop Wanneroo (C) UK NZ Sth Afr Vietnam India Ireland Philip' Malaysia Italy FYROM % Tot Pop Swan (C) UK NZ India Vietnam Sth Afr Philip' Italy Malaysia Singapore Croatia % Tot Pop Cockburn (C) UK NZ Sth Afr Italy Philip' Croatia Malaysia India China * Singapore % Tot Pop Mandurah (C) UK NZ Sth Afr Philip' Nether India Germany Ireland USA Italy % Tot Pop Serpentine-Jarrahdale (S) UK NZ Sth Afr Nether Germany Italy Malaysia Ireland India USA % Tot Pop Kwinana (T) UK NZ Philip' Sth Afr India Germany Nether China * Malaysia Singapore % Tot Pop Armadale (C) UK NZ Sth Afr India Nether Philip' Malaysia Singapore Italy Germany % Tot Pop Rockingham (C) UK NZ Sth Afr Philip' Nether Germany Ireland India USA Italy % Tot Pop Mount Barker (DC) UK Germany NZ Nether Sth Afr USA Philip' Italy Canada Ireland % Tot Pop Playford (C) UK NZ Germany Vietnam Italy Philip' Nether India Ireland Cambodia % Tot Pop Total Alliance UK NZ India Philip' Sth Afr Italy Fiji Vietnam Sri Lanka China *


121 121 Appendix 5: Visa sub class (code), Alliance LGAs, s,
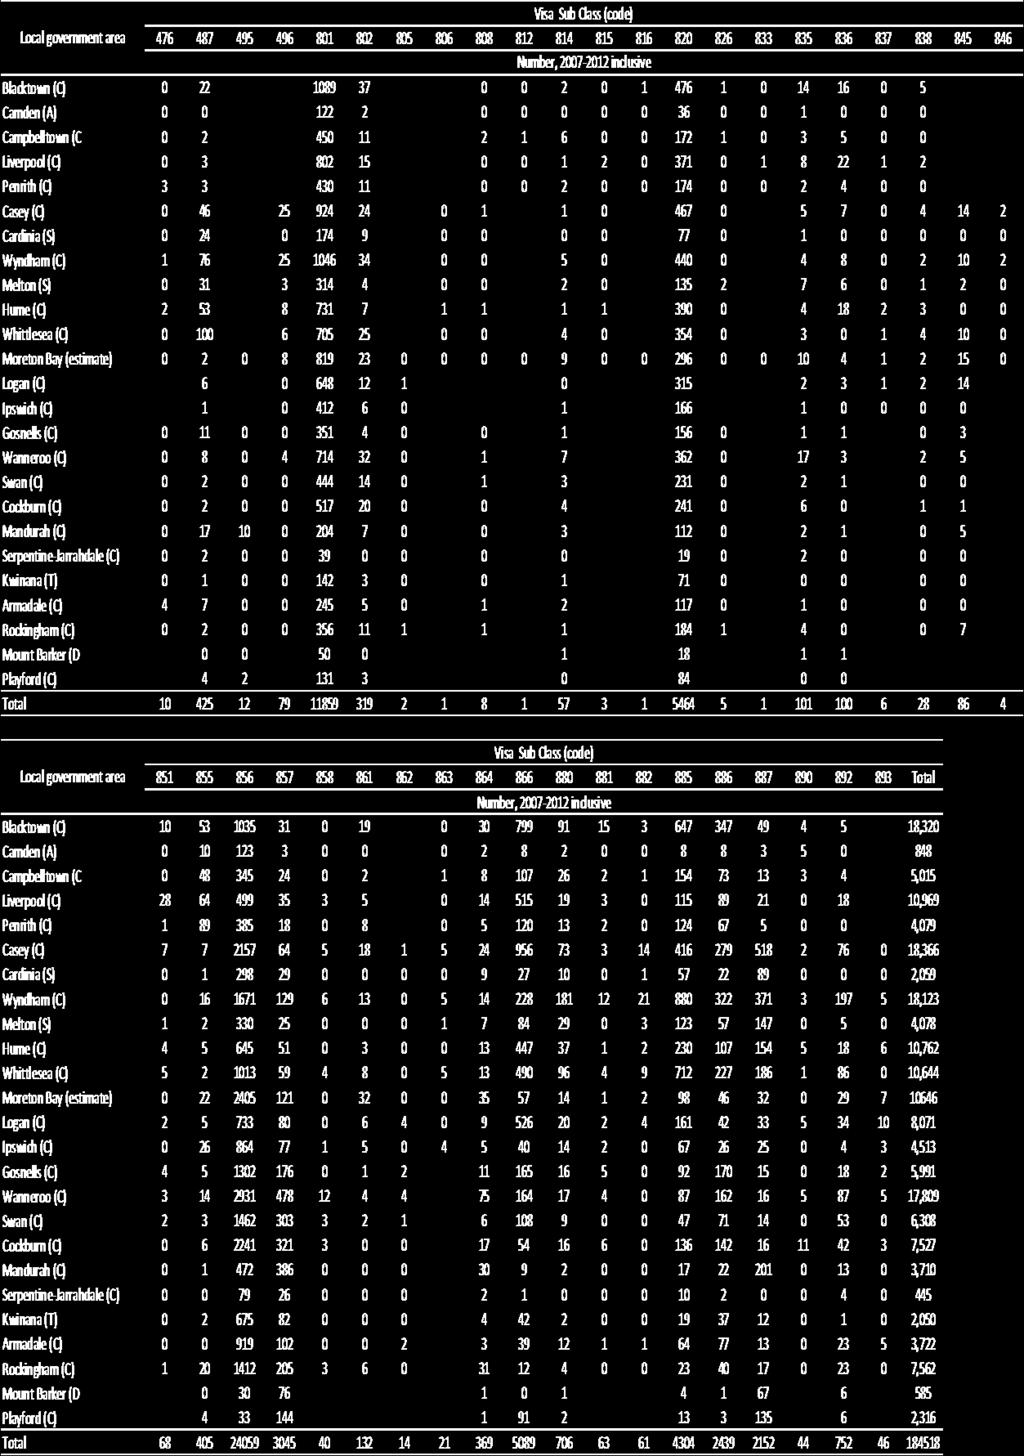
122 122
State of Australia s Fast Growing Outer Suburbs
 State of Australia s Fast Growing Outer Suburbs The economic & demographic transition of the Fast Growing Outer Suburbs Prepared for the NGAA February 2018 Disclaimer This Report is prepared only for use
Alice According to You: A snapshot from the 2011 Census
 Research Brief 201301 Alice According to You: A snapshot from the 2011 Census Pawinee Yuhun, Dr Andrew Taylor & James Winter The Northern Institute Charles Darwin University (Image source: Alice Springs
2014 Migration Update Report
 2014 Migration Update Report by Graeme Hugo ARC Australian Professorial Fellow and Professor of Geography, The University of Adelaide Presentation to 2014 Migration Update Conference, Adelaide 11 th September,
People. Population size and growth. Components of population change
 The social report monitors outcomes for the New Zealand population. This section contains background information on the size and characteristics of the population to provide a context for the indicators
DRAFT A POPULATION POLICY FOR BAROSSA-LIGHT
 DRAFT A POPULATION POLICY FOR BAROSSA-LIGHT Graeme Hugo, University Professorial Research Fellow, Professor of Geography, Director, The National Centre for Social Applications of GIS, Australian Institute
FACTBase Bulletin 22 October The Spatial Distribution of Employment in Metropolitan Perth, Matthew Tonts and Paul Plummer
 The Spatial Distribution of Employment in Metropolitan Perth, 1991-2011 Matthew Tonts and Paul Plummer Introduction Employment growth and unemployment rates are critical indicators of the performance of
Migration is a global phenomenon, one that includes adults, youth and children alike. And Australia is a country built on migration with almost 50%
 1 Migration is a global phenomenon, one that includes adults, youth and children alike. And Australia is a country built on migration with almost 50% of our population either a first-born or second-born
The Demography of the Territory s
 The Demography of the Territory s Midtowns : Jabiru (Issue No.201401) The Northern Institute, 2013: This material is submitted for peer review. Correct citation is necessary. KEY FINDINGS The West Arnhem
Talking Point: The missing migrants. Page 1
 Talking Point: The missing migrants Page 1 Executive Summary Higher rates of population growth in our big cities are not driven by Australians moving from the regions to the city. Regional Australia has
WHAT IS THE ROLE OF NET OVERSEAS MIGRATION IN POPULATION GROWTH AND INTERSTATE MIGRATION PATTERNS IN THE NORTHERN TERRITORY?
 WHAT IS THE ROLE OF NET OVERSEAS MIGRATION IN POPULATION GROWTH AND INTERSTATE MIGRATION PATTERNS IN THE NORTHERN TERRITORY? Kate Golebiowska and Dean Carson The key trend preventing the Northern Territory
The rise of Victoria. Victoria s population boom and changing urban landscape to 2036
 The rise of Victoria Victoria s population boom and changing urban landscape 1971 to 236 Table of contents Table of Tables... 3 Reimagining Victoria... 4 2 2 PART I The fastest growth in 4 years... 5 1971-21:
Research Brief Issue RB02/2018
 Research Brief Issue RB02/2018 The Northern Territory s non-resident workforce in 2016 Ms Anita Maertens Northern Institute/College of Indigenous Futures, Arts and Society anita.maertens@cdu.edu.au Dr
The demographic diversity of immigrant populations in Australia
 The demographic diversity of immigrant populations in Australia Professor James Raymer School of Demography Research School of Social Sciences Mobility Symposium, Department of Immigration and Border Protection
AN OVERVIEW OF MIGRATION TRENDS AND DEVELOPMENTS FOR SOUTH AUSTRALIA, AUSTRALIA AND GLOBALLY
 AN OVERVIEW OF MIGRATION TRENDS AND DEVELOPMENTS FOR SOUTH AUSTRALIA, AUSTRALIA AND GLOBALLY by Graeme Hugo ARC Australian Professorial Fellow, Professor of Geography and Director of the National Centre
MIGRATION UPDATE 2013
 MIGRATION UPDATE 2013 by Graeme Hugo ARC Australian Professorial Fellow and Professor of Geography, The University of Adelaide Presentation to 2013 Migration Update Conference, Adelaide 19 th September,
THE NORTHERN TERRITORY S RY S OVERSEAS BORN POPULATION
 STUDIES RESEARCH BRIEF ISSUE Number 2008010 School for Social and Policy Research 2008 Population Studies Group School for Social and Policy Research Charles Darwin University Northern Territory 0909 dean.carson@cdu.edu.au
Community Profile of Adelaide Metropolitan area
 Paper# : 2079 Session Title : GIS - Supporting Decisions in Public Policy Community Profile of Adelaide Metropolitan area By adipandang.yudono@postgrads.unisa.edu.au Abstract The paper presents a community
Britain s Population Exceptionalism within the European Union
 Britain s Population Exceptionalism within the European Union Introduction The United Kingdom s rate of population growth far exceeds that of most other European countries. This is particularly problematic
Population Dynamics in Regional Australia
 Population Dynamics in Regional Australia January, 2015 Level 2, 53 Blackall Street Barton ACT 2600 02 6260 3733 www.regionalaustralia.org.au The Regional Australia Institute Independent and informed by
CITY USER PROFILE 15 ADELAIDE CITY COUNCIL RESEARCH REPORT
 CITY USER PROFILE 15 ADELAIDE CITY COUNCIL RESEARCH REPORT CONTENTS What is the City User Profile and why do we do it? p. 03 How is CUP data collected? p. 03 What are some of the key findings from CUP
City of Greater Dandenong Our People
 City of Greater Dandenong Our People 2 City of Greater Dandenong Our People Contents Greater Dandenong people 4 Greater Dandenong people statistics 11 and analysis Population 11 Age 12 Unemployment Rate
People. Population size and growth
 The social report monitors outcomes for the New Zealand population. This section provides background information on who those people are, and provides a context for the indicators that follow. People Population
POPULATION STUDIES RESEARCH BRIEF ISSUE Number
 POPULATION STUDIES RESEARCH BRIEF ISSUE Number 2009040 School for Social and Policy Research 2009 This material has been submitted for peer review and should not be cited without the author s permission
Housing and Older Immigrants in Australia: Issues for the 21st Century
 Housing and Older Immigrants in Australia: Issues for the 21st Century Andrew Beer and Debbie Faulkner Centre for Housing, Urban and Regional Planning, University of Adelaide, 2 nd International Conference
This chapter examines the patterns and drivers of population
 CHAPTER 3 UNDERSTANDING THE DEMOGRAPHIC CHARACTER OF PERTH S POPULATION Amanda Davies INTRODUCTION This chapter examines the patterns and drivers of population growth in Perth and how this growth has shaped
POPULATION STUDIES RESEARCH BRIEF ISSUE Number
 POPULATION STUDIES RESEARCH BRIEF ISSUE Number 2008021 School for Social and Policy Research 2008 Population Studies Group School for Social and Policy Research Charles Darwin University Northern Territory
Trends in Labour Supply
 Trends in Labour Supply Ellis Connolly, Kathryn Davis and Gareth Spence* The labour force has grown strongly since the mid s due to both a rising participation rate and faster population growth. The increase
Fiscal Impacts of Immigration in 2013
 www.berl.co.nz Authors: Dr Ganesh Nana and Hugh Dixon All work is done, and services rendered at the request of, and for the purposes of the client only. Neither BERL nor any of its employees accepts any
UTS:IPPG Project Team. Project Director: Associate Professor Roberta Ryan, Director IPPG. Project Manager: Catherine Hastings, Research Officer
 IPPG Project Team Project Director: Associate Professor Roberta Ryan, Director IPPG Project Manager: Catherine Hastings, Research Officer Research Assistance: Theresa Alvarez, Research Assistant Acknowledgements
Changing Times, Changing Enrollments: How Recent Demographic Trends are Affecting Enrollments in Portland Public Schools
 Portland State University PDXScholar School District Enrollment Forecast Reports Population Research Center 7-1-2000 Changing Times, Changing Enrollments: How Recent Demographic Trends are Affecting Enrollments
THE IMPACT OF CHAIN MIGRATION ON ENGLISH CITIES
 Briefing Paper 9.13 www.migrationwatchuk.org THE IMPACT OF CHAIN MIGRATION ON ENGLISH CITIES Summary 1. Government proposals on chain migration have overlooked the most important factor - transcontinental
Where tradies work: A regional analysis of the labour market for tradespeople
 Where tradies work: A regional analysis of the labour market for tradespeople CENTRE FOR LABOUR MARKET RESEARCH, UNIVERSITY OF CANBERRA Phil Lewis Michael Corliss A NATIONAL VOCATIONAL EDUCATION AND TRAINING
Social and Demographic Trends in Burnaby and Neighbouring Communities 1981 to 2006
 Social and Demographic Trends in and Neighbouring Communities 1981 to 2006 October 2009 Table of Contents October 2009 1 Introduction... 2 2 Population... 3 Population Growth... 3 Age Structure... 4 3
Migrants Fiscal Impact Model: 2008 Update
 11 April 2008 Migrants Fiscal Impact Model: 2008 Update Report by Access Economics Pty Limited for Department of Immigration and Citizenship TABLE OF CONTENTS EXECUTIVE SUMMARY... i 1. Introduction...
Two of the key demographic issues that frame society around the globe today are migration and the ageing of the population. Every country around the
 1 Two of the key demographic issues that frame society around the globe today are migration and the ageing of the population. Every country around the globe is now facing an ageing population. And this
Demographics. Chapter 2 - Table of contents. Environmental Scan 2008
 Environmental Scan 2008 2 Ontario s population, and consequently its labour force, is aging rapidly. The province faces many challenges related to a falling birth rate, an aging population and a large
Western Sydney Job Deficit Analysis. Final Report
 Western Sydney Job Deficit Analysis Final Report September 2016 Table of contents 1. Introduction... 4 1.1 Disclaimer... 4 2. Are there enough jobs?... 5 3. Where are the deficits by industry?... 9 3.1
FECCA Submission to the Inquiry into regional skills relocation
 FECCA Submission to the Inquiry into regional skills relocation About FECCA The Federation of Ethnic Communities Councils of Australia (FECCA) is the national peak body representing the interests of Culturally
A Scoping Exercise Concerning the Needs of the Melton Sudanese Community
 A Scoping Exercise Concerning the Needs of the Melton Sudanese Community for Executive Summary February 2013 W S Couche Consultant COUCHE & Associates 237 Punt Rd Richmond 3121 Ph (03) 9428 4932 Email
NATIONAL POPULATION PLAN FOR REGIONAL AUSTRALIA
 NATIONAL POPULATION PLAN FOR REGIONAL AUSTRALIA February 2019 KNOWLEDGE POLICY PRACTICE KEY POINTS People vote with their feet and many are showing strong preferences for living in regions. Enhancing liveability
6. Population & Migration
 078 6. Population & Migration Between the September Quarter 2012 and the June Quarter 2017 South Australia had the lowest population growth rate of all mainland states. Over the coming years South Australia
Migrant population of the UK
 BRIEFING PAPER Number CBP8070, 3 August 2017 Migrant population of the UK By Vyara Apostolova & Oliver Hawkins Contents: 1. Who counts as a migrant? 2. Migrant population in the UK 3. Migrant population
INCOME MANAGEMENT: IMPACTS ON REFUGEE AND HUMANITARIAN ENTRANTS
 INCOME MANAGEMENT: IMPACTS ON REFUGEE AND HUMANITARIAN ENTRANTS May 2012 This paper provides background information about the new income management scheme that will come into effect on 1 July 2012 as well
Introduction CHRISTCHURCH CITY UPDATE 2000
 CHRISTCHURCH CITY UPDATE 2000 Introduction Christchurch City experienced significant population growth during the first half of the 1990s. This trend was fuelled by high levels of international migration,
Migrant Youth: A statistical profile of recently arrived young migrants. immigration.govt.nz
 Migrant Youth: A statistical profile of recently arrived young migrants. immigration.govt.nz ABOUT THIS REPORT Published September 2017 By Ministry of Business, Innovation and Employment 15 Stout Street
and with support from BRIEFING NOTE 1
 and with support from BRIEFING NOTE 1 Inequality and growth: the contrasting stories of Brazil and India Concern with inequality used to be confined to the political left, but today it has spread to a
Chapter One: people & demographics
 Chapter One: people & demographics The composition of Alberta s population is the foundation for its post-secondary enrolment growth. The population s demographic profile determines the pressure points
The Socio-Economic Status of Migrant Populations in Regional and Rural Australia and its Implications for Future Population Policy
 The Socio-Economic Status of Migrant Populations in Regional and Rural Australia and its Implications for Future Population Policy Simon J L Massey 1 and Nick Parr 1 (1) Department of Marketing and Management,
Population Outlook for the Portland-Vancouver Metropolitan Region
 Portland State University PDXScholar Institute of Portland Metropolitan Studies Publications Institute of Portland Metropolitan Studies 2007 Population Outlook for the Portland-Vancouver Metropolitan Region
Culturally and Linguistically Diverse Seniors in Western Australia: Trends and Issues
 Culturally and Linguistically Diverse Seniors in Western Australia: Trends and Issues Disclaimer: The information and advice within this document is provided voluntarily by the Office of Multicultural
Mapping migrants: Australians wide-ranging experiences of immigration
 No. 13 December 2018 Mapping migrants: Australians wide-ranging experiences of immigration Charles Jacobs Mapping migrants: Australians wide-ranging experiences of immigration Charles Jacobs POLICY Paper
The Future of North West Sydney
 The Future of North West Sydney AUGUST 2018 2 Contents Demographic & Education Trends in Sydney s North West 5 Methodology 7 Sydney s North West 8 Population growth 8 Age profile 9 Student enrolments 12
Chapter 8 Migration. 8.1 Definition of Migration
 Chapter 8 Migration 8.1 Definition of Migration Migration is defined as the process of changing residence from one geographical location to another. In combination with fertility and mortality, migration
Sector briefing: 2011 Census night homelessness estimates
 Sector briefing: 2011 Census night homelessness estimates Key points 13 November 2012 The number of people identifiable as experiencing homelessness on Census night 2011 increased by 17% from 89,728 people
The Maori Population A Profile of the Trends Within Iwi Rohe
 The Maori Population A Profile of the Trends Within Iwi Rohe Report on Tauranga Moana Iwi Rohe Report prepared for Te Puni Kōkiri by Kaipuke Consultants Ltd 9 June 2009 The Maori Population A Profile of
Government data show that since 2000 all of the net gain in the number of working-age (16 to 65) people
 people") CENTER FOR IMMIGRATION STUDIES June All Employment Growth Since Went to Immigrants of U.S.-born not working grew by 17 million By Steven A. Camarota and Karen Zeigler Government data show that since all
CENTER FOR IMMIGRATION STUDIES June All Employment Growth Since Went to Immigrants of U.S.-born not working grew by 17 million By Steven A. Camarota and Karen Zeigler Government data show that since all
Sustainable Australia Sustainable Communities. A Sustainable Population Strategy for Australia
 Sustainable Australia Sustainable Communities A Sustainable Population Strategy for Australia Commonwealth of Australia 2011 All data included in this document are presumed to be correct as received from
8. United States of America
 (a) Past trends 8. United States of America The total fertility rate in the United States dropped from 3. births per woman in 19-19 to 2.2 in 197-197. Except for a temporary period during the late 197s
MOBILITY OF THE VIETNAM-BORN IN SYDNEY: A RE-ASSESSMENT AFTER THE 2001 CENSUS
 MOBILITY OF THE VIETNAM-BORN IN SYDNEY: A RE-ASSESSMENT AFTER THE 2001 CENSUS Leonardo Carroll Vietnamese migrants to Australia have congregated in the poorer suburbs of Western Sydney, especially around
Subsequent Migration of Immigrants Within Australia,
 Population Research and Policy Review (2018) 37:1053 1077 https://doi.org/10.1007/s11113-018-9482-4 ORIGINAL RESEARCH Subsequent Migration of Immigrants Within Australia, 1981 2016 James Raymer 1 Bernard
MIGRATION FROM SOUTH AFRICA TO AUSTRALIA. Romy Gail Wasserman. B.A (Hons English/History) M.A (International Studies)
 M.A (International Studies)") MIGRATION FROM SOUTH AFRICA TO AUSTRALIA Romy Gail Wasserman B.A (Hons English/History) M.A (International Studies) Department of Geography, Environment and Population Faculty of Arts University of Adelaide
MIGRATION FROM SOUTH AFRICA TO AUSTRALIA Romy Gail Wasserman B.A (Hons English/History) M.A (International Studies) Department of Geography, Environment and Population Faculty of Arts University of Adelaide
The Development of Australian Internal Migration Database
 The Development of Australian Internal Migration Database Salut Muhidin, Dominic Brown & Martin Bell (University of Queensland, Australia) s.muhidin@uq.edu.au Abstract. This study attempts to discuss the
HUMAN CAPITAL LAW AND POLICY
 VOLUME 7, ISSUE 1, MARCH 17 IMMIGRATION IN BC: A COMPLEX TAPESTRY HIGHLIGHTS Immigration remains a key element in building a skilled workforce in BC and will play an even more significant role in the coming
Population and Dwelling Counts
 Release 1 Population and Dwelling Counts Population Counts Quick Facts In 2016, Conception Bay South had a population of 26,199, representing a percentage change of 5.4% from 2011. This compares to the
ATTITUDINAL DIVERGENCE IN A MELBOURNE REGION OF HIGH IMMIGRANT CONCENTRATION: A CASE STUDY
 ATTITUDINAL DIVERGENCE IN A MELBOURNE REGION OF HIGH IMMIGRANT CONCENTRATION: A CASE STUDY Andrew Markus and Arunachalam Dharmalingam Dingley Village and Springvale are two suburbs in South-Eastern Melbourne
State-nominated Occupation List
 State-nominated Occupation List Industry skills requirement through state-nominated skilled migration APRIL 2016 Page 1 RESTAURANT & CATERING AUSTRALIA Restaurant & Catering Australia (R&CA) is the national
Metro Vancouver Backgrounder Metro 2040 Residential Growth Projections
 Metro Vancouver 2040 - Backgrounder Metro 2040 Residential Growth Projections Purpose Metro Vancouver 2040 Shaping our Future, Metro s draft regional growth strategy, was released for public review in
1. A Regional Snapshot
 SMARTGROWTH WORKSHOP, 29 MAY 2002 Recent developments in population movement and growth in the Western Bay of Plenty Professor Richard Bedford Deputy Vice-Chancellor (Research) and Convenor, Migration
Housing Portland s Families A Background Report for a Workshop in Portland, Oregon, July 26, 2001, Sponsored by the National Housing Conference
 Housing Portland s Families A Background Report for a Workshop in Portland, Oregon, July 26, 2001, Sponsored by the National Housing Conference by Barry Edmonston and Risa Proehl Housing Portland s Families
A Snapshot of Current Population Issues in the Northern Territory
 Research Brief Issue RB06, 2016 A Snapshot of Current Population Issues in the Northern Territory Dr. Andrew Taylor Dr. Tom Wilson Demography and Growth Planning, Northern Institute andrew.taylor@cdu.edu.au
A Multicultural Northern Territory Statistics from the 2016 Census (and more!) Andrew Taylor and Fiona Shalley
 Andrew Taylor and Fiona Shalley") A Multicultural Northern Territory Statistics from the 2016 Census (and more!) Andrew Taylor and Fiona Shalley Todays discussion Part I Background and the NT s multicultural make-up Part II Key statistics,
A Multicultural Northern Territory Statistics from the 2016 Census (and more!) Andrew Taylor and Fiona Shalley Todays discussion Part I Background and the NT s multicultural make-up Part II Key statistics,
FUTURES NETWORK WEST MIDLANDS WORKING PAPER 1. Demographic Issues facing the West Midlands
 FUTURES NETWORK WEST MIDLANDS WORKING PAPER 1 Demographic Issues facing the West Midlands February, 2014 1 Preface This paper has been prepared by members of the Futures Network West Midlands a group comprising
Global Melbourne: A City of Diversity. International migration trends Globalisation and Cities Research Program
 Globalisation and Cities Research Program Global Melbourne: A City of Diversity International migration trends 2006-11 A research collaboration between the University of Canberra and the Commonwealth Department
Australian Catholic Bishops Conference Pastoral Research Office
 Australian Bishops Conference Pastoral Research Office Mass attendance in Australia: A critical moment A report based on the National Count of Attendance, the National Church Life Survey and the Australian
CAEPR Indigenous Population Project 2011 Census Papers
 CAEPR Indigenous Population Project 2011 Census Papers Paper 10 Labour Market Outcomes Matthew Gray, a Monica Howlett b and Boyd Hunter c a. Professor of Public Policy and Director, CAEPR b. Research Officer,
Response to the Department of Home Affairs consultation on Managing Australia's Migrant Intake
 Response to the Department of Home Affairs consultation on Managing Australia's Migrant Intake February 2018 Business Council of Australia February 2018 1 The Business Council of Australia draws on the
Planning for Queensland s Future Population and Economy
 > Planning for Queensland s Future Population and Economy Chamber of Commerce & Industry Queensland Population & Infrastructure Blueprint March 2010 CONTENTS 1.0 Overview and recommendation strategies
UNEMPLOYMENT IN AUSTRALIA
 UNEMPLOYMENT IN AUSTRALIA Professor Sue Richardson President Introduction Unemployment is a scourge in countries at all levels of economic development. It brings poverty and despair and exclusion from
Assessment of Demographic & Community Data Updates & Revisions
 Assessment of Demographic & Community Data Updates & Revisions Scott Langen, Director of Operations McNair Business Development Inc. P: 306-790-1894 F: 306-789-7630 E: slangen@mcnair.ca October 30, 2013
DRAFT V0.1 7/11/12. Sheffield 2012: JSNA Demographics Background Data Report. Data to support the refresh of JSNA 2012
 DRAFT V0.1 7/11/12 Sheffield 2012: JSNA Demographics Background Data Report Data to support the refresh of JSNA 2012 Ann Richardson Public Health Analysis Team NHS Sheffield 722 Prince of Wales Road Sheffield
City of Surrey. Preface. Labour Force Fact Sheet
 City of Labour Force Fact Sheet Preface Statistics Canada conducts its Census of Population every five years with the most recent census having occurred in 2006. The Census provides information on the
Humanitarian Youth Arrivals to NSW in Fact Sheet
 Humanitarian Youth Arrivals to NSW in 2012 1 Humanitarian Youth Arrivals to NSW in 2012 Introduction The information presented in this report1 is derived from statistics collated by the Department of
Sustainable cities, human mobility and international migration
 Sustainable cities, human mobility and international migration Report of the Secretary-General for the 51 st session of the Commission on Population and Development (E/CN.9/2018/2) Briefing for Member
What Lies Ahead: Population, Household and Employment Forecasts to 2040 April Metropolitan Council Forecasts to 2040
 The Metropolitan Council forecasts population, households and employment for the sevencounty Minneapolis-St. Paul region with a 30-year time horizon. The Council will allocate this regional forecast to
CUP - City User Population Research
 CUP - City User Population Research 2003-2013 Key insights from a decade of CUP surveys Contents Background... 2 Methodology... 2 Executive Summary... 3 Glossary of Terms... 4 Key Insights All City Users...
RMIT University, Melbourne, 3001, Australia for correspondence: Abstract
 Australasian Transport Research Forum 2017 Proceedings 27 29 November 2017, Auckland, New Zealand Publication website: http://www.atrf.info Interactions between residential relocation and commute patterns
ASPECTS OF MIGRATION BETWEEN SCOTLAND AND THE REST OF GREAT BRITAIN
 42 ASPECTS OF MIGRATION BETWEEN SCOTLAND AND THE REST OF GREAT BRITAIN 1966-71 The 1971 Census revealed 166,590 people* resident in England and Wales who had been resident in Scotland five years previously,
CENSUS BULLETIN #5 Immigration and ethnocultural diversity Housing Aboriginal peoples
 CENSUS BULLETIN #5 Immigration and ethnocultural diversity Housing Aboriginal peoples October 25, 217 Bulletin Highlights: 86.1 per cent of the Brampton s 216 surveyed population held a Canadian citizenship
MIGRATION BETWEEN THE ASIA-PACIFIC AND AUSTRALIA A DEVELOPMENT PERSPECTIVE
 MIGRATION BETWEEN THE ASIA-PACIFIC AND AUSTRALIA A DEVELOPMENT PERSPECTIVE by Graeme Hugo University Professorial Research Fellow Professor of Geography and Director of the National Centre for Social Applications
Headship Rates and Housing Demand
 Headship Rates and Housing Demand Michael Carliner The strength of housing demand in recent years is related to an increase in the rate of net household formations. From March 1990 to March 1996, the average
Population Projection Alberta
 Population Projection Alberta 215 241 Solid long term growth expected Alberta s population is expected to expand by about 2.1 million people by the end of the projection period, reaching just over 6.2
STRENGTHENING RURAL CANADA: Fewer & Older: Population and Demographic Crossroads in Rural Saskatchewan. An Executive Summary
 STRENGTHENING RURAL CANADA: Fewer & Older: Population and Demographic Crossroads in Rural Saskatchewan An Executive Summary This paper has been prepared for the Strengthening Rural Canada initiative by:
EMBARGOED UNTIL THURSDAY 9/5 AT 12:01 AM
 EMBARGOED UNTIL THURSDAY 9/5 AT 12:01 AM Poverty matters No. 1 It s now 50/50: chicago region poverty growth is A suburban story Nationwide, the number of people in poverty in the suburbs has now surpassed
Demographic Trends: 2012
 Demographic Trends: 2012 1 Crown copyright This work is licensed under the Creative Commons Attribution 3.0 New Zealand licence. You are free to copy, distribute, and adapt the work, as long as you attribute
,CHAPTER II SUMMARY OF THE MAIN RESULTS
 ,CHAPTER II SUMMARY OF THE MAIN RESULTS 2.1 The 19~Q!,.,Sfnsusdatabase amounts to perhaps the most extensive. and most important. source of planning infqnnation the Cayman Islands has ever had. The tables
Meanwhile, the foreign-born population accounted for the remaining 39 percent of the decline in household growth in
 3 Demographic Drivers Since the Great Recession, fewer young adults are forming new households and fewer immigrants are coming to the United States. As a result, the pace of household growth is unusually
Endogenous Employment growth and decline in South East Queensland
 Endogenous Employment growth and decline in South East By Alistair Robson 1 UQ Social Research Centre, Institute of Social Science, University of Abstract: The South East region has been recording strong
david e. bloom and david canning
 demographics and development policy BY B y late 2011 there will be more than 7 billion people in the world, with 8 billion in 2025 and 9 billion before 2050. New technologies and institutions, and a lot
Chapter 1: Changing Spatial Patterns of Immigrant Settlement
 Chapter 1: Changing Spatial Patterns of Immigrant Settlement Graeme Hugo Introduction While the major lineaments of post-war immigrant settlement remain, there have been some small, but nevertheless significant,
Information Sheet Youth Arrivals to Victoria
 Information Sheet Youth Arrivals to Victoria JULY 214 JUNE 215 The Centre for Multicultural Youth is a Victorian not-for-profit organisation supporting young people from migrant and refugee backgrounds.