POST-CONFLICT RECOVERY AND PEACEBUILDING
|
|
|
- Hugo Watts
- 5 years ago
- Views:
Transcription
1 WORLD DEVELOPMENT REPORT 2011 BACKGROUND PAPER POST-CONFLICT RECOVERY AND PEACEBUILDING Anke Hoeffler Syeda Shahbano Ijaz Sarah von Billerbeck October 10, 2010 The findings, interpretations, and conclusions expressed in this paper are entirely those of the authors. They do not necessarily represent the views of the World Development Report 2011 team, the World Bank and its affiliated organizations, or those of the Executive Directors of the World Bank or the governments they represent. *We would like to thank Caitlin Corrigan for excellent research assistance
2 Abstract: Civil wars are the most common type of large scale violent conflict. They are long, brutal and continue to harm societies long after the shooting stops. Post-conflict countries face extraordinary challenges with respect to development and security. In this paper we examine how countries can recover economically from these devastating conflicts and how international interventions can help to build lasting peace. We revisit the aid and growth debate and confirm that aid does not increase growth in general. However, we find that countries experience increased growth after the end of the war and that aid helps to make the most of this peace dividend. However, aid is only growth enhancing when the violence has stopped, in violent post-war societies aid has no growth enhancing effect. We also find that good governance is robustly correlated with growth, however we cannot confirm that aid increases growth conditional on good policies. We examine various aspects of aid and governance by disaggregating the aid and governance variables. Our analysis does not provide a clear picture of which types of aid and policy should be prioritized. We find little evidence for a growth enhancing effect of UN missions and suggest that case studies may provide better insight into the relationship between security guarantees and economic stabilization. 1
3 Content 1. Introduction 1.1 Patterns of Post-Conflict Economic Recovery: An Overview 1.2 Patterns of Post-Conflict Economic Recovery: A Closer Look 1.3 Patterns of Post-Conflict Recovery: Impact of Civil War on Socio-Political Outcomes 2. International Responses 2.1 Aid 2.2 UN Peace Keeping Missions Mission Duration Number of Operations Mission Expenditure 3. Effect of Aid and UN Missions on Post-Conflict Recovery 3.1 Aid and Post-Conflict Growth The Burnside and Dollar Model Modelling and Estimation Strategy 3.2 UN Missions and Post-Conflict Growth 4. Conclusions Tables Figures References Appendix 2
4 1. Introduction Today civil wars are the most common type of large scale violent conflict. Since World War II they have killed about 16 million people worldwide. In this paper we examine how countries can recover economically from these devastating conflicts and how we can make peace last. Our analysis is organised as follows. First, we provide some descriptive statistics to frame the issues. In the second section we describe the two main international responses to post-conflict recovery and peacebuilding: international aid and UN peacekeeping missions. The third section examines the effect of these two interventions on post-conflict recovery, and the last section concludes. 1.1 Patterns of Post-Conflict Recovery: An Overview In this section we examine how much damage civil wars cause. Civil wars are now the most common form of large-scale violent conflict. These wars are brutal and long: they have killed about 16 million people since World War II 1 and last on average about eight years Table 1 about here --- In our analysis we concentrate on the economic costs and the economic recovery process. In Table 1 we present the mean value of some key variables. During a civil war the economy contracts: countries at war receive less aid, spend more on the military, have a worse risk rating and experience more human rights violations. During the post-conflict decade countries experience a peace dividend: their economies grow at about three percent per annum, about one percentage point more than the average country. They also receive more aid, they are more democratic than before the war and their risk rating improves. However, their military expenditure remains raised: it is about 3.5 percent, compared to their pre-war expenditure of 3 1 Regan (2009). 2 Source: Kreutz (2010). We only wars that started after 1960 and that were internal armed conflict with an intensity of 2, ie a minimum of 1,000 battle related deaths per year. If we consider all civil wars since WW II the average length is about 7.5 years. 3
5 percent. In contrast to the improvements in growth, income and risk ratings, postconflict societies do not score well on other outcome variables. They are as unequal as before the war and human rights are frequently violated. The human rights situation is slightly worse than before the war and far worse than in the average country. The income per capita for individual civil war countries is depicted in Appendix Figure A1. The lightly shaded area indicates years of minor armed conflict, i.e. when 25-1,000 battle related deaths occurred. The darker shaded areas indicate years of civil war, i.e. when more than 1,000 battle related deaths occurred. Unsurprisingly, countries do not follow the same patterns. Table 2 summarizes the patterns found in Figure A1. Some countries exhibited a positive income growth trend throughout the period, growing before, during and after the war. Most of these countries are Asian. A number of countries experienced pronounced income collapses prior to the war. Most of these countries are African. A glance at the country graphs shows that most countries experience a strong recovery post-war. Only three countries have not experienced a recovery: Eritrea, Burundi and Liberia. It may be too early to tell whether Liberia is recovering from the war and in the case of Burundi the civil war was followed by years of minor armed conflict. --- Table 2 about here Patterns of Post-Conflict Recovery: A Closer Look After this initial assessment we use simple econometric analysis to gain a better understanding of the patterns of the economic loss incurred by civil war and the pattern of the recovery phase. The dependent variable is annual per capita GDP growth and we control for per capita income, aid (measured as a percentage of GNI), the CPIA score and regional dummies. For this analysis we are using annual data and estimate the model by OLS. In Table 3 column 1 we find that during the civil war the economy experiences a growth loss of about 1.6 percentage points a year. However, countries recover once the hostilities end, with the economy growing at an additional 0.97 percent during the first post-conflict decade. Given that the average civil war lasts eight years, the economy will only reach its pre-war level of income 14 years after the end of the conflict. 4
6 In these regressions we compare civil war years and post-war years to the average peace year. Another interesting comparison would be to exclude countries that remained peaceful throughout. We therefore also run the regressions for the 47 countries that experienced civil war at some time. The results are presented in Table A3 in the Appendix. The point estimates and standard errors are similar to the ones obtained by using the whole sample: growth is lower during the civil war (by about 1.5 percent) and during the post-conflict decade the economy experiences a peace dividend. This above average growth is strongest during the middle years of the postconflict decade. 3 In column 2 of Table 3 we investigate the time pattern of the post-conflict recovery by including a dummy variable for each post-conflict year. Only the fourth and sixth post-conflict year dummies are statistically significant. In column 3 we include three post-conflict dummies, one for the first three years, then for years four to six and finally years seven to ten. The significance of the years four to six dummy indicates that the post-conflict recovery is particularly strong during those years. In columns 4 to 6, we repeat the analysis with a slightly broader definition of civil war. Unlike for the first columns where we only considered observations of high conflict intensity (1,000 deaths per year) we now also include ACD year observations once the war had resulted in 1,000 deaths over the duration of the conflict. During this type of armed conflict the loss of income is lower and the post-conflict recovery pattern is more evenly spread over the entire post-conflict decade. Post-conflict countries seem to experience a more immediate peace dividend. In the last three columns of Table 3, we consider all country year observations that were characterized by armed conflict, irrespective of intensity levels. Any conflict that resulted in at least 25 deaths per year is included. Armed conflicts based on this 3 A further alternative estimation method would be to analyse this simple growth model by Within Groups (WG) estimation. This would also concentrate the analysis on the comparison within the group of war countries. However, since we use dummy variables for war and post-war years it is difficult to gain much information from the WG estimation. When we estimated the model by WG we found no evidence for a post-conflict recovery. 5
7 broad definition also cause a loss of growth of about 1.2 percentage points per year. However, we do not detect post-conflict recovery. --- Table 3 about here --- The results of Table 3 indicate that the loss of growth due to armed conflict and the recovery from it depend on the definition of armed conflict. As a robustness check we used different definitions of civil war provided by the World Bank. These checks are presented and discussed in the Appendix. Table 3 and the robustness checks suggest that we only detect a post-conflict recovery phase when we concentrate on armed conflicts with a high number of battle deaths (1,000 battle deaths). Categorising peace and war by a dummy variable leads to a coarse distinction that does not allow for some lower level of violence post-war. Case studies, for example Barron s WDR background paper of post-conflict regions in Indonesia, distinguishes more carefully between different levels of violence. In Table 4 we allow for the possibility of lower level violence in post-war situations. In the first column we repeat our war and post-war analysis for ease of comparison. In the second column we introduce a dummy variable, which takes a value of one if the country experienced lower levels of violence during the post-war decade (25-1,000 deaths annually). Out of our 326 post-war observations, about half experienced some level of violence during the post-war decade (157 observations). The coefficient on the post-war violence term is negative and significant. It is equal to the absolute size of the coefficient on the post-war dummy, i.e. when there is post-war violence there is no post-war recovery. 4 In column (3) we examine the different post-war periods. During the first three post-war years there is no peace dividend if the violence continues at lower levels. 5 Interestingly, these violence effects are not significant for the subsequent post-war years Table 4 about here Using an F-test we could not reject the hypothesis that the coefficients are equal in absolute size (p=0.80). 5 Using an F-test we could not reject the hypothesis that the coefficients are equal in absolute size (p=0.84). 6
8 1.3 Patterns of Post-Conflict Recovery: Impact of Civil War on Socio- Political Outcomes For the rest of our analysis we concentrate on the most restrictive definition of civil war, namely 1,000 battle related deaths per year. Using this high intensity definition of civil war, we now turn to a brief examination of the impact of war on other outcome variables. In Table 5 we investigate the relationship between civil war, democracy, risk rating and human rights. In the first two columns we examine the link between democracy and war. Our measure of democracy is the Combined Polity Score from the Polity IV dataset. 6 The score ranges from +10 (strongly democratic) to -10 (strongly autocratic). The coefficient on our civil war dummy is insignificant in both models. This is unsurprising since the construction of the polity score includes a measure of civil war by considering fragmentation (which often occurs in civil wars). It then follows that during the post-conflict period the polity score is higher than in comparable countries. The polity score is almost one point higher during the post-conflict decade. We then turn to an examination of ICRG risk ratings in columns 3 and 4. We use the composite rating from the International Country Risk Guide. It ranges from 0 (high risk) to 100 (low risk). 7 The ratings are only available from 1985 and are often missing for civil war countries, resulting in a loss of over 1,000 observations. A civil war decreases the rating by about 7.7 points. This difference is equivalent to the differences in the average scores for Uganda (52) and Tanzania or Ghana (59). This war effect lingers, and the first three post-conflict years are characterised by a further decrease of this index. The subsequent post-conflict years do not experience higher than normal risk ratings. In other words, although post-conflict countries experience a period of above average growth and economic opportunities, their ratings indicate that 6 Source: index.html). The data are described in Jaggers and Gurr (1995). 7 Composite Political, Financial, Economic Risk Rating for a country (CPFER) = 0.5 ( (Political Risk + Financial Risk + Economic Risk) 7
9 investment in these countries is risky. The reputation of instability and conflict seems difficult to shake off. In the next two columns we analyze the effect of war on the corruption index (this is part of the ICRG composite risk indicator). This indicator ranges from 0 to 6, higher values indicate a lower risk of corruption. Columns 5 and 6 show that countries are less corrupt during and after the civil war. This seems a counterintuitive result. In columns 6 and 7 we analyze the risk of the military running politics. Again, this is a sub-component of the ICRG risk. Since the military is not elected by anyone, its involvement in politics can be interpreted as a loss of democratic accountability. It is coded from 0 to 6; higher scores indicate lower risk. During the civil war the risk of the military being involved in politics is higher and this effect persists throughout the post-conflict decade. In the following two columns we consider the effect of civil war on the institutional strength and quality of the bureaucracy. This indicator is a sub-component of the ICRG risk rating and is scored on a 0 to 4 level. Higher values indicate better institutions and bureaucratic quality. During the civil war there does not seem to be any effect on this indicator, however the institutional and bureaucratic quality are lower post-conflict. In the last four columns we investigate human rights violations. We first use the Physical Integrity Rights Index, which is an additive index constructed from the Torture, Extrajudicial Killing, Political Imprisonment, and Disappearance indicators. It ranges from 0 (no government respect for these four rights) to 8 (full government respect for these four rights). 8 Unsurprisingly, civil wars go hand in hand with a deterioration of human rights, with the indicator about 3 points lower. The coefficients on the post-conflict human rights indicators show that peace does not restore human rights to average levels. Post-conflict countries have on average lower human rights records; however, the coefficients on the various post-conflict periods indicate that there is a relative improvement as the peace continues. 8 Details on the index construction and use can be found in Cingranelli and Richards (1999) and 8
10 We also use an indicator of political terror (Gibney et al, 2010) to examine the effect on human rights. This indicator ranges from 1-5, with higher values referring to a worse human rights situation. We find the previous results on human rights confirmed. ---Table 5 about here --- We perform two robustness checks on these results. First, we exclude the CPIA indicator from the regressions. Results in Table 5 may be biased due to a high correlation of the CPIA indicator and the other governance measures. Table A5.1 in the Appendix presents the results. The estimates are qualitatively very similar. The only difference is that we find weaker (insignificant) post-war effects in the models including polity and corruption. The other results hold but a number of regressions provide slightly higher point estimates for the war and post-war effects. Another robustness check is to limit our comparison to the 47 civil war countries. Table A5.2 in the Appendix on the whole confirms our results. The difference from the estimations using the entire sample is that the polity indicator is now significantly higher during the war (additional 1.3 points) as well as during the post-war period (additional 1.8 points) than in peace years. The ICRG indicator does not decrease by 7.7 points but only by about 4.6 points and is on average higher during the postconflict recovery, ie risk ratings go down during the civil war but tend to recover (ratings are about 2.6 points higher during the post-conflict decade). The other models provide qualitatively similar results to Table 5, some point estimates are slightly larger. To summarize, the analysis presented in Table 5 suggests that the economic recovery in post-conflict societies is not mirrored by an improvement in risk ratings and human rights. This is confirmed by our robustness checks; however, some of the additional results produced slightly higher point estimates. This suggests that our initial estimates may be conservative. 1.4 The Impact of the Duration of Leadership and Political Transitions on Economic Growth 9
11 In their seminal contribution, Jones and Olken (2005) find that a change in leadership has an impact on national growth rates. Many post-conflict situations are characterized by changes in leadership or even by political transitions. Since both may be important for post-conflict countries we examine these phenomena in Table Table 6 about here --- The duration of leadership is measured as the number of years a particular political leader has been in power (source: Archigos, Goemans et al 2009). The relationship with growth is non-linear. First, growth is higher under the new leader, but then becomes negative when the leader has been in power for a long time. The point in time in which the relationship switches from being positive to negative is at around 14 years. Growth may of course have an effect on the duration of leadership (Collier and Hoeffler, 2009) and unlike Jones and Olken (2005) we do not deal with any potential endogeneities. We also examine the effect of the durability of a political regime. This is independent from personal leadership, but scores how many years a particular political regime has lasted (source: Polity IV). Political stability is helpful for economic growth, but the effect is small. An extra year provides 0.02 percent extra growth. The effect of political transitions, defined as a three point change over a maximum of three years (source: Polity IV) have different effects depending on the direction of political change. We measure the growth in the five years after a transition. Positive transitions have no relationship with growth while negative transitions are associated with a decrease in economic growth. 2 International Responses In this section we examine two international responses in post-conflict situations: aid and UN peacekeeping missions. We only consider bilateral and multilateral aid, and we do not study the response from NGOs or military missions by coalitions of the willing. Other interventions, such as diplomatic efforts in peace building, are also not part of our study. 10
12 2.3 Aid One can potentially distinguish between Official Development Assistance (ODA) to poor developing countries and Official Aid (OA) to wealthier countries (for example Israel) and Newly Independent States of the Former Soviet Union. However, we consider all assistance and aid irrespective of recipient country and use the term aid to refer to all of these flows. Aid is defined as grants or loans to recipient countries that are undertaken by the official sector for the promotion of economic development and welfare. This definition of aid includes emergency and distress relief. Aid must be provided on concessional terms, with loans having a minimum grant element of 25 percent. Aid includes technical assistance but excludes grants, loans and credit for military purposes or transfers to individuals. Despite a recent increase of aid from countries belonging to the Organisation of Petroleum Exporting Countries (OPEC), China and India, about 95 percent of bilateral aid is provided by the Development Assistance Committee (DAC) members of the Organisation for Economic Cooperation and Development (OECD). 9 Due to lack of data we only consider multilateral aid from international agencies and bilateral aid from DAC members. As can be seen in Figure 1, the year 2005 saw the highest aid flow, about $87 billion worldwide. Figure 2 shows aid flows over the period In order to allow for comparability over such a long period we used the US deflator to derive constant aid flows. Aid reached a peak just after the end of the Cold War in 1991 ($56 billion) and exhibited a downward trend over the next ten years. Aid began to increase again in Figure 1 about here Figure 2 about here --- In Figure 3 we compare aid by purpose to countries at peace, war and post-war 10. We add all aid for the years 1995 until Aid for social and economic infrastructure 9 OECD (2007) 10 Aid data by purpose were obtained from the OECD Creditor Reporting System (accessed 18 March 2010). Aid data are provided as commitments and disbursements and only available from
13 makes up half of total aid. The main purpose of social infrastructure aid is to support education and health. However, there is also a small component earmarked for peacebuilding efforts. There is little difference in the aid for education, health and physical infrastructure for countries at peace, war or during the post-war decade. Despite their reconstruction needs post-war countries do not seem to receive more aid for economic infrastructure. However, there is a difference in the importance of humanitarian aid and debt forgiveness. Humanitarian aid only makes up about four percent of aid to peaceful countries but around nine to ten percent in war and post-war countries. Proportionally debt forgiveness is much higher for war countries (24 percent) than for peace countries (13 percent) and post-war countries (10 percent). Table 1 shows how important aid is from the recipients perspective. On average, aid makes up 7.2 percent of GNI. Since most country year observations are peaceful years, i.e. neither war nor post-war years, the average for peaceful years is similar at 6.9 percent. During a civil war countries receive less aid (6.2 percent) and more during the post-conflict decade (10.2 percent). UN missions seem to be accompanied with more aid. For all mission years the average is 8.2 percent and aid is more than double the average for post-war periods with UN missions (17.7 percent). 2.4 UN Peace Keeping Missions The United Nations Department of Peacekeeping Operations (DPKO) has undertaken a total of 63 peacekeeping missions since A full list is provided in Appendix Table A1. These missions are referred to as field missions and exclude Special Political Missions (SPM) administrated by DPKO for example the ongoing missions UNAMA in Afghanistan and BINUB in Burundi. In December 2009, there were 15 ongoing missions Mission Duration onwards. We would have preferred to use the disbursement data but since the data series have many missing observations we used the commitment data. We deflated the current dollar series by applying the GDP US deflator. 11 United Nations Department of Peacekeeping Operations List of Operations: , accessed 17 February
14 The average duration of a UN mission is 7.2 years. They range from one month (UNASOG, United Nations Aouzou Strip Observer Group in Chad, 1994) to 62 years (UNTSO, United Nations Truce Supervision Organisation in Egypt, Israel, Lebanon and Syria, 1948 until today). It is useful to separate missions into pre- and post-cold War missions, as the nature of the operations undertaken has shifted significantly. During the Cold War, the UN engaged in what is usually called traditional peacekeeping, in which the UN deployed a relatively small interposition force between warring parties, usually (though not always) in interstate conflicts. These troops were tasked with separating of forces, patrolling buffer zones, and monitoring ceasefire agreements, and they deployed under Chapter VI of the UN Charter in accordance with three principles: impartiality, the non-use of force (except in self-defence), and the consent of the parties. Peacekeeping personnel rarely engaged in the concurrent political processes, if any, being pursued to bring about a resolution to the conflict. Since the end of the Cold War, peacekeeping has been characterized by expanded mandates, broader tasks, and greater levels of coercion, and has taken place primarily in intrastate conflicts. In these cases, it has been acknowledged that the provision of security by blue helmets in the short-term is unlikely to hold if it is not accompanied by the reconstitution of political processes, humanitarian relief, broader efforts at reconciliation, accountability for atrocities, respect for human rights, and economic renewal. In short, the UN began to expand beyond traditional peacekeeping into multidimensional peacekeeping, or what is sometimes called peacebuilding. UN personnel were not simply maintaining or monitoring a balance between warring parties, they were actively engaging in efforts to transform conflict and bring about durable peace. This shift in focus also implies that the ultimate goal of peacekeeping was withdrawal that is, to achieve a level of reconstruction and reconciliation in which national actors could manage and resolve their own conflicts, without recourse to violence or to international intervention. Following the violence against UN troops in places like Somalia and Rwanda in the first half of the 1990s, peacekeepers were also increasingly deployed under Chapter 13
15 VII mandates, which authorizes them to use force against warring parties and eliminates the consent requirement. Nevertheless, it should be noted that even under Chapter VII the UN rarely, if ever, deploys without the consent of the government of the country in question (these rare cases are considered peace enforcement ), and still aims to act as an impartial third party that uses force as a last resort. However, despite the ongoing commitment to the troika of peacekeeping principles, the nature, goals, methodologies, and challenges of UN peacekeeping have changed notably since the end of the Cold War. Figure 4 shows the number of UN missions over time. Eighteen missions began before Five of these are still ongoing: UNTSO, UNMOGIP, UNIFCYP, UNDOF, and UNIFIL. These missions can be classified as traditional peacekeeping operations. These conflicts tend to be frozen, e.g. Cyprus, Jammu and Kashmir, Israel-Syria: levels of active fighting are low or non-existent, and, as described above, blue helmets are mostly maintaining a status quo rather than actively transforming the conflicts. The average duration of these pre-1990 missions is 15 years. --- Figure 4 about here --- Since 1990, there have been 45 missions. The average duration of these missions is 4.1 years, again clearly highlighting the shift in the nature of peacekeeping from the maintenance of stable if unresolved status quos to the active resolution of conflict and the more rapid withdrawal of peacekeeping forces Numbers of Operations The number of UN peacekeeping missions was, as noted, relatively low for the first three decades in which such operations were undertaken. After 1990, there was a stark increase in the number of missions authorized and deployed. As Figure 5 shows, the greatest jump took place between 1991 and 1993, when 15 new missions were deployed. Since then, the average number of missions ongoing in any given year has remained elevated at between 14 and Figure 5 about here
16 However, in 1994, just two new missions were authorized, representing a sudden drop in the number of new missions following the surge of the previous three years. This can be attributed to the botched international interventions in Somalia and Rwanda. The so-called Mogadishu Syndrome led to reluctance among the Western powers to risk the lives of their soldiers in messy faraway conflicts where there was little peace to keep in the first place. While debate persists about whether the end of the Cold War marked a change in the nature and number of wars around the world and is outside the scope of this paper, 12 our data clearly demonstrate a shift in the use of peacekeeping as an instrument for addressing war concurrent with the end of superpower rivalry. Despite the ebb and flow of new missions authorized in the first half of the 1990s described above, UN peacekeeping went from being an occasional instrument for interaction and coercion used by the international community after WWII to a frequently used tool for the resolution of violent conflict around the globe in the post-cold War era. This shift is also notable in the frequency of missions ending (see Figure 6). While those missions begun during the Cold War are all still ongoing, post-cold War missions are deployed temporarily and terminated once they are deemed to have achieved their specific goals. This reflects the thinking that peacekeeping is by definition temporary, that it is intended to be a short-term solution with the eventual resumption of post-conflict security provision and reconstruction by national authorities exclusively. --- Figure 6 about here Mission Expenditure Given the increase in numbers of missions deployed since the end of the Cold War, it is not surprising that the overall expenditure on UN peacekeeping operations has also 12 See Kaplan (1994), Kaldor (1999), Fearon and Laitin (2003). 15
17 increased. 13 In Figure 7 a large spike in expenditure can be noted in the early 1990s, reflecting the deployment of costly missions to Somalia and the former Yugoslavia. This high level of spending falls drastically in the mid- to late-1990s, before again climbing steadily. --- Figure 7 about here --- The steady increase in expenditures between the late 1990s and the present is notable, as it is not accompanied by drastic changes in the number of new missions deploying or ongoing missions ending. The increase in expenditures therefore indicates that missions are becoming more expensive. This is due to two reasons. First, the UN is taking on greater and more complex sets of tasks and second, larger numbers of military and civilian personnel are being deployed (see Figure 8). Indeed, some missions have incrementally increased their troop strength to cope with greater-thanexpected security challenges, thus explaining increases in expenditure despite consistency in the number of missions. --- Figure 8 about here --- To test whether missions became more complex over time, we coded broad tasks for each mission, including demobilization, disarmament, and reintegration (DDR), electoral assistance, and humanitarian/human rights coordination. As Figure 9 shows 25 percent of the UN PK missions included DDR, election monitoring as well as humanitarian tasks and 40 percent of missions included at least one of these tasks. The remaining 35 percent of missions did not cover special tasks. This also changed over time. Of the 18 missions that began before 1990, 14 missions did not cover any of these special tasks and none of the missions covered all of these tasks. Missions with a start date post-1990 are more complex. Sixteen out of the 45 missions covered all of the special tasks, a further 21 included at least one special task and only eight missions did not have any special component. The expansion of tasks fits with the shift from traditional to multidimensional peacekeeping discussed above. 13 We obtained the peacekeeping data from the UN and would like to thank Wayne Whiteside, Andrew Radford, and Damar Niamji with providing assistance in collecting and organising these data. 16
18 3 Effect of Aid and UN Missions on Post-conflict recovery We now turn to our empirical analysis of economic recovery after a civil war and examine whether aid and UN peacekeeping operations can support the recovery phase. 3.1 Aid and Post-Conflict Growth In this section we examine the role of aid in post-conflict recovery. Donors often state that their intention of providing aid is to (a) alleviate poverty and (b) improve governance. There are of course other motivations of why donors give aid, for example donor self-interest. Trade and geo-strategic interests play a major role in the allocation of aid (Alesina and Dollar, 2000; Berthélemy 2006a&b; Berthélemy and Tichit, 2004; Hoeffler and Outram, 2008). However, here we only examine the impact of aid on growth, which we use as a proxy of poverty alleviation, and the impact of aid on governance, which we measure by CPIA. Another related question is whether aid is more effective when governance is good (Burnside and Dollar, 2000) The Burnside and Dollar Model As a first step in the analysis of the effectiveness of aid in post-war societies we reexamine the Collier and Hoeffler (2004) results in Table 7. They used the Collier and Dollar (2002) data set, which covered six four-year periods: , until We are now able to use data for the periods 1978 until 2007, resulting in eight four-year periods and one three year period ( ). Unlike Collier and Dollar (2002) we do not have data for Using our data set we try to replicate the Collier and Dollar model without success (column 1). Since the ICRG institutional proxy was never significant in their model and puts a severe constraint on the number of observations we remove the variable in column 2. Again, we are not able to replicate the model. In the subsequent columns we test down by removing one insignificant variable at a time. This leads to the rejection of virtually all the findings by Collier and Dollar (2002). Aid is insignificant and does not display diminishing returns. Aid does not have a growth enhancing effect in good policy environments. Only the result that countries with better policies (higher CPIA) have higher growth is 17
19 confirmed and survives the testing down procedure (column 6). Interestingly, aid does have a positive effect on growth if we lag it by one period (column 7). We investigated whether the additional years made a difference by running the model on data up to 1997, but found very similar results. --- Table 7 about here --- We now turn to a discussion of the reasons why we are unable to confirm the main Collier and Dollar (2002) findings. The impact of development assistance on economic growth is one of the most disputed topics in the macroeconomics of development. Over the past decade the most hotly debated contribution has been the article by Burnside and Dollar (2000). They find that although aid has in general no impact on growth, aid is growth enhancing in good policy environments. In their regressions aid interacted with policy has a significant positive coefficient. They also include a quadratic aid term interacted with policy which has a significant negative coefficient. Burnside and Dollar (2000) interpreted these results as evidence that the impact of aid on growth is a positive function of the level of policy and a negative function of the level of aid (diminishing returns). In their models they use a policy index comprised of the budget surplus, inflation, and trade openness. Based on these results the authors advocate prioritizing countries with good policies in the allocation of aid. Collier and Dollar (2002) used the basic Burnside and Dollar (2000) specification of their aid-growth model but used the World Bank s Country Policy and Institutional Assessment, CPIA, indicator as a measure of policy. Using a slightly larger dataset Collier and Dollar (2002) confirmed the Burnside and Dollar (2000) results. The research by Burnside and Dollar (2000) received a lot of attention and continues to inform and influence policy makers. In academic circles their contribution has been discussed and re-examined in a large number of papers. In the Appendix we present a short overview of this debate. Roodman (2007b) and Beynon (2002, 2003) provide excellent and accessible overviews of the issues. There are essentially three econometric concerns with the Burnside and Dollar (2000) work: (1) their results do not seem to be robust to small changes in the sample, (2) aid is endogenous and thus 18
20 should be instrumented in the aid-growth models, and (3) omitted variables may be driving the results. Rajan and Subramanian (2008) use Generalized Method of Moments (GMM) techniques to address the endogeneity issues through instrumentation and deal with the omitted variable problem by estimating a model in first differences. They conclude that there is there is no robust positive relationship between aid and growth in the cross section. They also find no evidence that aid works better in better policy or geographical environments 14 or that certain forms of aid work better than others 15. As Roodman (2007a) states, the fragility of the aid-growth model results most likely reflect the general fragility of growth models. 16 After decades of cross-country growth empirics we have no certainties about the aid-growth nexus. This may be due to the limitations of the technology of cross-country growth regressions or possibly due to a weak or non-existent link between aid and growth. Perhaps aid is just not as important as investment, savings and governance in the development process Modelling and Estimation Strategy Since we cannot confirm the Collier and Dollar (2002) results, we proceed by using a parsimonious growth model to investigate the effects of aid. We address two main questions (1) whether aid has a significant impact on growth in a country that is classified as post-conflict and (2) whether aid has a significant impact on growth in the presence of good policies. We investigate these questions by first looking at the effects of total aid. We then opt for two different disaggregations of aid: (1) into three categories based on the timing of the impact (long impact aid, short impact aid and humanitarian aid, following Clemens et al (2004) and (2) into five different modalities of aid. 14 Daalgard, Hansen and Tarp (2004) suggest that aid affects growth positively outside the tropics and the work by Dayton-Johnson and Hoddinott (2003) indicates that although aid is growth enhancing for developing countries this relationship does not hold for Sub-Saharan Africa. 15 Clemens, Radelet and Bhavnani (2004) disaggregate aid and suggest that short impact aid does increase economic growth within four year periods. Short impact aid is defined as assistance not given for humanitarian reasons or assistance that aims to support democracy, the environment, health and education. 16 For an analysis of the robustness of cross-country growth regressions see Leamer (1983), Levine and Renelt (1992), and Sala-i-Martin (1997). 19
21 Interaction Terms For all three investigations, that is, for total aid, categories of aid by timing of impact and modalities of aid, it would be desirable to investigate policy and post conflict interactions together. However, the disaggregation of aid replaces one aid variable and two possible interaction terms with, for example, three aid variables and six possible interaction terms. Including a large number of interaction terms introduces problems of multicollinearity. Therefore, for each level of aid (total aid, disaggregated by long/short impact effects and by modality) we first look at the effects of aid in the presence of good policy and then the effects of aid during the post-conflict period. Instrumentation Strategy Estimating our model by OLS assumes that aid is exogenous. However, it is possible that countries with higher GDP growth attract more aid. Aid may thus be endogenous due to the presence of reverse causality, which will cast doubt on the unbiasedness of our OLS estimates. In order to control for this endogeneity, we make use of external instruments which closely follow the approach opted for by Tavares (2003) and Rajan and Subramanian (2008). Our basic idea for instrumentation is based on modelling the supply of aid. We posit that when donors increase their total aid budget, countries that are closer to donors receive more aid. We proxy closeness by four variables: (1) a dummy variable if donor and recipient have a common language; (2) a dummy if donor and recipient share the same religion; (3) the geographical distance and (4) a UN friend variable, scaled from -1 to +1 measuring the closeness in UN voting. We then interact these four variables with the amount of aid committed by the top 5 DAC donors to each recipient in each year (the top 5 DAC Donors are France, Germany, UK, USA and Japan) 17. Our instrumental variables are therefore of the form: IV drt Aid drt *c drt where Aid drt is the aid committed by donor d to recipient r in time period t and c drt is a variable that measures closeness between donor d and recipient r in time period t. Since we have five donors and four closeness variables, we can potentially construct twenty instrumental variables; however since no recipient country has neither 17 These five donors provide about two thirds of all bilateral aid (Hoeffler and Outram, 2008). 20
22 Japanese nor German as a main language we have only 18 potential instrumental variables (IVs). To construct IVs for long impact, short impact and humanitarian aid, and for the five different modalities of aid, we compute the proportion for the amount of aid committed as long impact, short impact, humanitarian and also as each of the five different modalities out of total aid by each donor for each year. 18 We then multiply these proportions with total aid committed by that donor in that year, i.e., Aid drt before interacting it with the closeness variables. Although each aid variable has potentially eighteen instrumental variables, we test these down in a first stage by regressing the endogenous aid variable on the specific instruments for that aid variable and all other exogenous variables. For the instrumental variables estimation, we only use the instruments that remain significant after this testing down procedure Results All regressions use data averaged over 4-year periods. We first look at the results for post conflict. In all these regressions, we use a post conflict dummy variable, which takes the value of 1 if the country is in the first decade post conflict and 0 otherwise. It is possible, in principle, to look at specific post conflict periods (1-3 years, 4-6 years, 7-10 years) and interact each one with the aid variable. However, this may give us problems with collinearity, hence we use the most comprehensive post-conflict variable (post-conflict decade). In Table 8 we find that although total aid does not have a significant impact on growth, it does have a positive, significant impact of about 0.1 percent additional growth if the country is recovering from civil war. When we instrument for this effect, it decreases in magnitude to about 0.05 percent but retains significance at the ten percent level. Therefore, even though aid may not have a significant impact on growth across the board, it is useful in countries that are recovering from conflict. In order to look at the soundness of our instruments, we look at the Kleibergen-Paap and Hansen-Sargan test statistics. The former allows us to check whether the equation is underidentified, i.e., whether we have enough instruments for the number of endogenous terms in the equation (these would include 18 A better approach might be to construct these ratios by donor-recipient-year. 21
23 both the aid variables and the aid*post conflict interaction terms). According to the Kleibergen-Paap statistic, we can reject the null of underidentification. The Hasen- Sargan test allows us to check whether the instruments are valid, i.e. whether they are sufficiently correlated with the endogenous variables; the low p-value on this test means that we cannot conclusively fail to reject the null of valid instruments, hence casting doubt on the strength of our instruments. This characterizes most of our IV estimations: in many regressions only one of the test statistics go in our favour. If we have valid instruments, then our equation appears to be underidentified. --- Table 8 about here --- Our instrumentation strategy can therefore be seen as an attempt to attribute causality to our results and to address the problems of endogeneity. However, our instruments are far from perfect. As suggested previously, some of the problems may be addressed by constructing better instruments. These would use actual data for the disaggregated aid variables by donor-recipient-year rather than using ratios constructed on the basis of donor-year data. Do the results still hold when we consider violent post-war situations? In Table 9 we add a variable for aid in violent post-war situations. We find that aid is significantly positive in post-war situations; however, in violent post-war societies aid is negative (column 2). The coefficients on post-war and violent post-war aid are equal in absolute size 19, in other words aid in violent post-war situations has no effect on growth. --- Table 9 about here --- Our results suggest that aid increases post-war growth in non-violent situations. So far we have only considered total aid. Is this positive effect of aid in post-war situations driven by a particular component of aid? We now turn to the examination of aid disaggregated (1) by short/long term impact and humanitarian aid (Table 10) and (2) by aid modality (Table 11). 19 χ 2 =1.07, p-value=
24 Our analysis presented in Table 10 suggests that long impact aid has a positive and significant impact on growth in post conflict countries of about 0.2 percent additional growth. Also, aid under the modality of technical cooperation has a significant impact on growth in post conflict countries of 0.9 percent extra growth (Table 11, column 2). This seems to suggest aid committed to education, health and technical assistance is likely to increase growth in the post-war decade. --- Table 10 about here Table 11 about here Is aid more effective in good policy environments? We also considered one of the key Burnside and Dollar (2000) results, namely that aid is more effective in good policy environments. We start our analysis in Table 8. Columns 3 and 4 show that total aid and its interaction with the CPIA indicator is insignificant. However, growth is higher in countries with better policies. The Kleibergen-Paap statistic allows us to reject the null of underidentification. We do not, however, conclusively fail to reject the null of valid instruments using the Hansen-Sargan test (p-value= 0.041). This casts some doubt on the validity of our instruments for total aid. 20 We now turn to an analysis how long/short term and humanitarian aid interacts with policy. In Table 9, column 4 we find that once instrumented, humanitarian aid is significant and has a positive impact on growth; increasing humanitarian aid by percent leads to a 3.5 percentage point increase in the growth rate of the recipient country; in a good policy environment however, humanitarian aid has a lower impact on growth. Since long impact and short impact aid both have an insignificant impact in the first IV regression, we assume that their impact is zero and run an IV regression only for humanitarian aid Table 9, column 5. We still find a significant impact of humanitarian 20 We also estimated the IV model using the Control Function approach (Imbens & Wooldridge, 2007; Söderbom et al, 2004). The predicted residuals are insignificant, this suggests that total aid is not endogenous and could be treated as exogenous. 23
25 aid on growth and a significant negative impact of humanitarian aid on growth in the presence of good policy. For both the IV regressions in columns (4) and (5), we can reject the null of underidentification based on the Kleibergen-Paap statistic and we fail to reject the null of weak instruments based on the Hansen-Sargan test; our equation is therefore identified and our instruments are valid. This suggests that not instrumenting for the different categories of aid is therefore misleading; it is possible that the three disaggregated aid categories are indeed endogenous. We checked the robustness of this result. We only consider instruments that are significant in the first stage regressions for long/short term and humanitarian aid. This may lead to a downward bias on the standard errors of the coefficient on humanitarian aid. However, when we used the same instruments for all three types of aid our coefficients differed only slightly. The Control Function approach also confirmed our initial IV results. What explains the significant impact of humanitarian aid on growth? Humanitarian aid is not provided to stimulate growth. Unlike most long impact or short impact aid, humanitarian aid is transferred mostly as material supplies (development food assistance forms more than half of total humanitarian aid). Material supplies are almost non-fungible by definition and cannot be subjected to corruption as easily as cash. Our results may suggest that if aid is committed in forms that make it less fungible and less liable to corruption, it is likely to have a higher impact on growth. In good policy environments, where corruption is low, the growth enhancing effect of humanitarian aid is less pronounced. It may also be important to point out that humanitarian aid is only committed in the event of an emergency or disaster. It is possible that economic activity may be revived in situations of very low levels of consumption. Furthermore, countries receiving humanitarian aid (including post-conflict countries) are likely to have a high potential for bouncing back from this period of low growth. The increase in economic activity that arises in the process of the delivery of humanitarian aid (demand for local transport, distribution and logistical support) may account for the increase in growth. 24
26 When we consider the effect of technical cooperation and the interaction with policy we find that technical cooperation seems to have a significantly negative effect on growth when instrumented (Table 10). However, this effect is less pronounced in the presence of good policy. Our test statistics, in this case, allow us to trust the validity of our instruments; however, our equation may be underidentified. We should also keep in mind that this model may be plagued by collinearity issues due to the large number of interaction terms and that we have fewer observations than for the other aid models in Table 8 and 9. We also investigated the related issues of the impact of regime transitions, duration of polity and leadership on growth and changes in policy. The full results are presented in the Appendix Tables A8 and 11 respectively. We find that aid has very little or no impact on growth when taking duration of regime/leadership into account. Aid does seem to have some small negative effect on growth following negative regime transitions. Aid has little or no impact on the CPIA indicator. We now examine how different aspects of domestic policy affect growth (Table 12). To recap, we find that higher CPIA scores are correlated with higher growth. However, we find no evidence that aid is growth enhancing in better policy environments (Tables 7 and 8) nor that an improvement in the CPIA score postconflict leads to an additional increase in growth (Table 12, columns 1). One important question for post-conflict countries is how to structure and sequence their policy reforms. The CPIA score is an average of the scores of the four categories of policies and institutions: Economic Management, Structural Policies, Policies for Social Inclusion/Equity and Public Sector Management and Institutions. Post-conflict countries face enormous challenges in terms of growth, poverty reduction and security but have very limited means to tackle these problems. 21 Given such limited means, a guide to what type of reforms should be prioritised is of considerable practical importance. The work by Collier and Hoeffler (2004) suggested that social policies for inclusion and equity were relatively more important than other policies postconflict. Their result was based on very few observations and we re-investigate the issue of the sequencing of policy using a larger sample of country-year observations. 21 Boyce and O Donnell (2007) provide an overview of the public finance issues in post-war societies. 25
27 We do not find any evidence that any particular policy reforms result in higher growth (column 3). Given these results we cannot provide any guidance on the prioritization and/or sequencing of policy and institutional reform. --- Table 12 about here UN Missions and Post-Conflict Growth We now turn to an examination of the possible growth enhancing effect of UN missions. In Table 13 we examine the contribution of UN peacekeeping missions to post-conflict recovery. Throughout this section we estimate the potential impact of UN peacekeeping missions on growth by OLS estimation. One important consideration is therefore whether UN missions are uncorrelated with the error term. If for example UN missions are more likely to be deployed to more stable countries with higher growth rates our estimates would overstate the effect of UN peacekeeping on growth. What exactly determines the deployment of UN peacekeeping missions has received some considerable debate (see for example Gilligan and Stedman, 2003). The empirical evidence analyzed by Doyle and Sambanis (2006) suggests that the UN decisions on whether to send peacekeepers are difficult to predict, i.e. providing some support for the assumption to treat the deployment decision as random in our model. Fortna (2008) finds that UN peacekeepers tend to deploy to the most difficult cases. If this is the case our results would be underestimating the true effect of UN peacekeeping. In light of this evidence we proceed with our OLS analysis and do not instrument for UN peacekeeping missions. Many missions are not taking place in post-conflict situations as defined above and thus we include a dummy for peacekeeping missions as well as an interaction term between the post-conflict dummy and peacekeeping missions. Neither the UN peacekeeping mission nor the interaction terms are significant (columns 1 and 2). In columns 3 and 4 we investigate whether peacekeeping missions are particularly effective during particular post-conflict years and find that they are growth enhancing during the first three years. The effect is substantial: if there is a UN peacekeeping mission growth is about 2.4 percent higher per year. 26
28 --- Table 13 about here --- In Table 14 we examine the effect of DDR programmes, electoral assistance, and humanitarian assistance in UN peacekeeping operations. In column 1 we include indicators showing whether UN peacekeeping operations included DDR, electoral, and humanitarian assistance during the post-conflict decade. We do not find any significance of the special programmes but since a large number of UN peacekeeping operations include several special programmes there may be a problem of multicollinearity. We thus examine only one special programme at a time in columns 2 to 4 and find some indication that electoral assistance is correlated with higher growth. We examine the timing of these special programmes and investigate whether the first three years post-conflict are crucial. Results from columns 6 and 8 indicate that electoral and humanitarian assistance are associated with higher growth during the first three years. There is little evidence to suggest that DDR programmes are correlated with growth. One interpretation may be that UN missions, and their special programmes, are chosen according to the economic prospects in the mission countries. If so, then the choice of whether or not to send a UN mission and whether or not to provide special assistance may be endogenous to economic growth. We have not instrumented for UN missions and thus have to be careful with our interpretation of the results. It might simply be the case that electoral assistance is only provided by the UN if the country is deemed to be sufficiently stable in economic and social terms to hold an election. --- Table 14 about here --- In Table 15 we investigate the effect of UN peacekeeping expenditure (columns 1 and 3). We only have data from 1988 onwards, and include a dummy for missing values in order to preserve our sample size in column 3. However, we find no relationship between UN peacekeeping expenditure and growth. We also investigate a possible relationship between UN peacekeeping personnel in columns 2 and 4 but reject the hypothesis of a significant relationship between personnel and growth. --- Table 15 about here
29 In Table 16 we investigate the effect of post-conflict domestic military expenditure. Countries with high military expenditure have lower growth, confirming a commonly found result in the literature (for example Deger and Smith, 1983 and more recently Dunne and Uye 2010). There is no such effect during the post-conflict decade. Military expenditure consists mainly of personnel expenditure in poor post-war countries. The armed forces may provide employment to young men who would otherwise struggle to find (formal) employment and military expenditure may act as a cushioning effect in post-war societies. Hence, there is no negative effect of military expenditure on growth in post-conflict societies. In the last column we investigate whether countries rich in subsoil assets recover more quickly and find some evidence for this hypothesis. We also examined whether this is a recent effect by excluding the most recent years characterized by a commodity boom. However, the results were qualitatively similar, ie it is unlikely to be driven by the most recent boom. --- Table 16 about here Conclusions In this paper we examine the economic recovery process in post-war societies and how this process can be supported. We concentrate our analysis on aid and UN peacekeeping missions and their potential role during the post-war period. On average civil wars last eight years. Their economies grow by about 1.6 percent less per year but do experience a peace dividend once the war ends. The economy then grows at an additional one percent. This average pattern means that the economy has only recovered, i.e. is back to pre-war income levels, 22 years after the war broke out. We examine the post-war decade and find evidence that the post-war recovery sets in slowly and is strongest around during the 4 th, 5 th and 6 th year after the end of the war. However, this peace dividend is not automatic. Our analysis is focused on civil wars, which we define as large-scale violent conflicts that caused a minimum of 1,000 deaths per annum. Many countries experience lower levels of violence. When 28
30 we account for post-war violence, we find that there is no peace dividend if violence continues after the end of the war. We also examined the effect of war on the country s risk rating. Unsurprisingly, during the war the risk ratings worsen but post-war the improvements in the ratings do not mirror the economic recovery. The ratings only show some improvement after two years of peace. Our empirical analysis confirms the commonly found result that contemporaneous aid does not increase growth. We only detect a modest positive effect of aid if we enter lagged aid. However, during the post-war decade aid has a small positive effect on growth, an extra one percent of aid (measured as a percent of GNI) provides an additional 0.05 percent growth per year throughout the post-war decade. Post-war countries receive more aid than peaceful countries and the returns with respect to growth seem to suggest that this is additional aid is a sensible allocation of resources. We also examine the impact of aid on post-war growth when the society experiences some violence. In these cases aid has no growth enhancing effect. If aid is given with the intention to encourage growth, policy makers should allocate aid to countries at peace, not countries that experience ongoing violence. A more detailed look at aid by purpose showed that post-war countries receive similar amounts of aid for social and economic infrastructure. The particular needs in terms of physical infrastructure reconstruction and rehabilitation do not seem to be matched by more aid for this purpose. However, an evaluation of community driven reconstruction (CDR) programmes suggests that communities often prioritize education and health over economic infrastructure projects. More than half of the participating communities in the Democratic Republic of Congo chose to rebuild schools. 22 This suggests that the allocation of aid for social versus economic infrastructure may be appropriate to meet the needs in war torn societies. However, more evidence is required to make a more comprehensive assessment of the allocation 22 Frey (2010). 29
31 of aid by purpose. We found very little evidence on which type of aid should be prioritized in post-war societies. In addition to the analysis of aid and growth we examined whether policy reforms can support the post-war recovery process. Although we find robust evidence that countries with good policies achieve higher growth we could not find evidence that aid is more effective in good policy environments. Post-war countries tend to have weak institutions and one of the important issues is how they should prioritise and sequence their policy and institutional reforms. We examined the sub-components of the CPIA score but found no evidence that the reform of any particular component (Economic Management, Structural Policies, Policies for Social Inclusion/Equity and Public Sector Management and Institutions) should be prioritized. One expenditure that is usually seen as wasteful due to its growth reducing effect is military expenditure. We examined whether this is the case for post-war countries. We found no evidence that military expenditure depresses growth post-war. This may be due to an employment effect. In poor countries most military expenditure is due to personnel costs and the armed forces may provide employment for young men who would otherwise have difficulties finding (formal) employment. We also examined whether UN peacekeeping missions contribute to the economic stabilization process. A number of countries have UN missions but are not classified as post-war countries. Thus, we can distinguish between a general and a post-war effect. We find no evidence that UN missions are associated with stronger growth. Over time UN missions have become more complex. We coded special programmes of UN missions and found that electoral and humanitarian assistance are correlated with higher growth during the first three years of post-conflict missions. There is no evidence that the DDR component of the missions is associated with higher growth. One problem with this analysis is that the deployment of UN missions and the design of special programmes may be endogenous to the economic stability of the country. We thus have to be careful with the interpretation of our results. It may simply be the case that electoral assistance is only provided to sufficiently politically stable countries. In these situations a peace dividend is also more likely, hence we find a positive relationship between electoral assistance and growth. Our results are also 30
32 drawn from a relative small number of observations and in future work it may be fruitful to analyse the impact of UN special programmes using more detailed case studies. 31
33 Table 1: Key Economic and Political Indicators during Peace, Civil War and Post-Conflict All Observ. Peace Civil War Postwar UN Mission Postwar UN mission All Observations growth GDP per capita (const $) GINI Aid (% of GNI) Milex (% of GDP) Polity (-10 to +10) ICRG (0-100) Physical Integrity (0-8) Civil War Countries growth GDP per capita (const $) GINI Aid (% of GNI) Milex (% of GDP) Polity(-10 to +10) ICRG (0-100) Physical Integrity(0-8) Notes: Growth is growth in per capita income. Polity score: higher scoring countries are more democratic. ICRG: higher scores correspond to lower risk. Physical Integrity: higher scoring countries have better human rights. 32
34 Table 2: Income Growth Experiences of Civil War Countries Growth throughout prewar, war, postwar Income collapse prior to the War No recovery post-war Timid recovery post-war Strong recovery postwar Columbia Algeria Burundi Chad Algeria India Burundi Eritrea* Georgia Angola Indonesia DRC Liberia Nicaragua Azerbaijan Nepal Congo Serbia&Mont. El Salvador Pakistan El Salvador South Africa Ethiopia Philippines Georgia Tajikistan Mozambique Sri Lanka Liberia Peru Sudan Sierra Leone Rwanda Turkey Sierra Leone Uganda Syria* Bosnia* Cambodia* Lebanon* Yemen* Note: For countries marked with an asterisk we have data for the post-war period, i.e. it is more difficult to make before and after comparisons. 33
35 Table 3: An Investigation of Annual Growth Rates during and post Armed Conflict (1) (2) (3) (4) (5) (6) (7) (8) (9) High intensity war High intensity war High intensity war War War War Armed Conflict &War Armed Conflict &War Armed Conflict &War lngdp t (0.116)*** (0.115)*** (0.116)*** (0.115)*** (0.115)*** (0.115)*** (0.116)*** (0.116)*** (0.116)*** Aid t (0.014)** (0.014)** (0.015)** (0.015)** (0.014)** (0.014)** (0.015)** (0.015)** (0.015)** CPIA t (0.167)*** (0.168)*** (0.167)*** (0.169)*** (0.169)*** (0.168)*** (0.169)*** (0.169)*** (0.169)*** Civil War (0.553)*** (0.554)*** (0.553)*** (0.342)* (0.342)* (0.342)* (0.303)*** (0.303)*** (0.303)*** Post-war _10 (0.350)*** (0.349)*** (0.234) S. Asia (0.278)*** (0.278)*** (0.278)*** (0.273)*** (0.272)*** (0.272)*** (0.274)*** (0.274)*** (0.274)*** E. Asia (0.311)*** (0.310)*** (0.310)*** (0.312)*** (0.314)*** (0.313)*** (0.311)*** (0.312)*** (0.312)*** C&E Europe (0.350)*** (0.352)*** (0.352)*** (0.345)*** (0.348)*** (0.346)*** (0.347)*** (0.348)*** (0.347)*** Post-war (0.658) (1.176)*** (0.745) Post-war (1.394) (1.202)** (0.734) Post-war (1.492) (0.979)* (0.559) Post-war (0.789)** (1.030) (0.556)* Post-war (0.793) (0.955)* (0.464) Post-war (0.930)** (0.904)* (0.552) Post-war (0.934) (1.525)*** (0.631) Post-war (1.105) (0.747) (0.570) Post-war (0.582) (0.897) (0.541) Post-war (1.066) (0.616) (0.629)** Post-war (0.686) (0.664)*** (0.415) Post-war (0.500)*** (0.562)* (0.326) Post-war (0.484) (0.442) (0.319) Constant (0.815)*** (0.813)*** (0.820)*** (0.824)*** (0.825)*** (0.822)*** (0.853)*** (0.858)*** (0.856)*** Observations R-squared Note: High intensity war: ACD wars with intensity level 2, war: ACD wars with cumulative intensity level 2, conflict&war: any conflict listed in ACD. Dependent variable: per capita income growth. Robust standard errors in parentheses.*, ** and *** indicate significance at 10%, 5% and 1%, respectively. 34
36 Table 4: The Impact of Violence on Post-War Growth (1) (2) (3) lngdp t (0.116)*** (0.115)*** (0.114)*** Aid t (0.014)** (0.014)** (0.014)** CPIA t (0.167)*** (0.167)*** (0.167)*** Civil War (0.553)*** (0.553)*** (0.554)*** Post-war (0.350)*** (0.452)*** Post-war violence (0.670)** Post-war (1.366)** Post-war violence (1.544)** Post-war (0.678)*** Post-war violence (0.945) Post-war (0.534) Post-war violence (1.134) S. Asia (0.278)*** (0.279)*** (0.281)*** E. Asia (0.311)*** (0.316)*** (0.313)*** C&E Europe (0.350)*** (0.351)*** (0.353)*** Constant (0.815)*** (0.810)*** (0.806)*** Observations R-squared Note: Dependent variable: per capita income growth. High intensity war: ACD wars with intensity level 2. Robust standard errors in parentheses.*, ** and *** indicate significance at 10%, 5% and 1%, respectively. 35
37 Table 5: Civil War and Socio-political Outcomes (1) (2) (3) (4) (5) (6) (7) (8) (9) (10) (11) (12) (13) (14) Polity Polity ICRG ICRG Corrupt. Corrup. Military in Gov. Military in Gov Bureauc. Bureauc. Physical Integrity Physical Integrity Political Terror Political Terror lngdp t (0.135)*** (0.135)*** (0.210)*** (0.207)*** (0.030)*** (0.030)*** (0.037)*** (0.037)*** (0.020)*** (0.020)*** (0.042)*** (0.042)*** (0.021)*** (0.021)*** Aid t (0.014)*** (0.014)*** (0.022)*** (0.021)*** (0.003)*** (0.003)*** (0.004)*** (0.004)*** (0.002) (0.002) (0.005)*** (0.005)*** (0.002)*** (0.002)*** CPIA t (0.156)*** (0.157)*** (0.281)*** (0.279)*** (0.033)*** (0.033)*** (0.049)*** (0.049)*** (0.024)*** (0.024)*** (0.047)*** (0.047)*** (0.022)*** (0.022)*** Civil War (0.405) (0.405) (0.833)*** (0.833)*** (0.094)*** (0.094)*** (0.134)*** (0.134)*** (0.076) (0.076) (0.120)*** (0.120)*** (0.058)*** (0.058)*** Post-war _10 (0.323)*** (0.645) (0.067)* (0.095)*** (0.056)*** (0.113)*** (0.053)*** Post-war (0.470)* (1.030)*** (0.096)* (0.142)*** (0.090)** (0.172)*** (0.071)*** Post-war (0.543) (0.868)** (0.099) (0.150)*** (0.081)* (0.191)*** (0.095)*** Post-war (0.570)** (1.120) (0.133) (0.166)*** (0.100)*** (0.164)*** (0.087)*** S. Asia (0.574)*** (0.576)*** (1.063) (1.080) (0.093)*** (0.093)*** (0.200) (0.202) (0.086)*** (0.086)*** (0.158)*** (0.158)*** (0.068)*** (0.068)*** E. Asia (0.407) (0.407) (0.605)*** (0.603)*** (0.078)* (0.078)* (0.106) (0.107) (0.060)*** (0.060)*** (0.126)*** (0.126)*** (0.059) (0.059) C&E Europe (0.352)*** (0.353)*** (0.550)*** (0.551)*** (0.079) (0.079) (0.079)*** (0.079)*** (0.046)* (0.046)* (0.094)*** (0.092)*** (0.051)*** (0.051)*** Constant (0.937)*** (0.939)*** (1.543)*** (1.524)*** (0.213) (0.212) (0.253)*** (0.253)*** (0.142)*** (0.143)*** (0.308)** (0.305)** (0.147)*** (0.146)*** Obs R-squared Note: Robust standard errors in parentheses.*, ** and *** indicate significance at 10%, 5% and 1%, respectively. 36
38 Table 6: Relationship between the Duration of Political Leadership, Political Transitions and Growth (1) (2) (3) (4) Ln GDP t (0.159)*** (0.163)*** (0.145)*** (0.116)*** Aid t (0.019)*** (0.020)*** (0.018)*** (0.015)** CPIA t (0.199)*** (0.201)*** (0.190)*** (0.171)*** S.Asia (0.280)*** (0.281)*** (0.285)*** (0.262)*** E.Asia (0.368)*** (0.367)*** (0.309)*** (0.310)*** C&E Europe (0.418)*** (0.415)*** (0.352)*** (0.349)*** Years in power (0.017) (0.046)** Years in power (0.001)*** Durable (0.007)*** Positive Transition (0.240) Negative Transition (0.472)** Constant (1.002)*** (1.014)*** (0.936)*** (0.852)*** Observations Note: Dependent variable: annual growth in per capita income. Note: Robust standard errors in parentheses.*, ** and *** indicate significance at 10%, 5% and 1%, respectively. Years in Power: years the country s leader has been in power (source: Archigos). Durable: Years the regime has lasted (source: Polity IV), positive/negative transition: first five years after a positive/negative transition (source: Polity IV). 37
39 Table 7: Replication Attempt of Collier&Dollar (2002) (1) (2) (3) (4) (5) (6) (7) Ln GDP (0.221)*** (0.231)*** (0.226)*** (0.211)*** (0.205)*** (0.141)*** (0.161)*** ICRG (0.016)*** Aid (0.181) (0.111) (0.081) (0.014) (0.013) (0.014) Aid (0.001) (0.001) Aid t (0.020)* CPIA (0.300)** (0.284)** (0.278)** (0.229)** (0.229)** (0.224)** (0.242)*** CPIA*Aid (0.047)* (0.027) (0.025) S.Asia (0.492)** (0.508)*** (0.502)*** (0.494)*** (0.466)*** (0.348)*** (0.346)*** EAsia (0.531) (0.546)*** (0.545)*** (0.534)*** (0.514)*** (0.448)*** (0.475)*** SSAfrica (0.459)** (0.476) (0.475) (0.475) (0.451) Mena (0.378) (0.415) (0.410) (0.404) C&E Europe (0.668)*** (0.595)*** (0.596)*** (0.594)*** (0.583)*** (0.573)*** (0.532)*** Constant (1.655)** (1.541)*** (1.345)*** (1.408)*** (1.338)*** (1.095)*** (1.185)*** Observations R-squared Note: Dependent variable: average annual growth in per capita income, based on four year periods. Robust standard errors in parentheses.*, ** and *** indicate significance at 10%, 5% and 1%, respectively. 38
40 Table 8: Total Aid and Growth (1) (2) (3) (4) OLS IV OLS IV ln GDP per capita * ** (0.278) (0.199) (0.258) (0.202) Total Aid (0.139) (0.060) (0.015) (0.021) Total Aid * CPIA (0.041) (0.017) Total Aid * Post Conflict (1-10) ** * (0.048) (0.030) CPIA ** *** ** *** (0.345) (0.209) (0.271) (0.150) Post Conflict (1-10) (0.557) (0.480) South Asia *** *** *** *** (0.539) (0.460) (0.541) (0.475) East Asia *** *** *** *** (0.591) (0.503) (0.572) (0.509) Sub Saharan Africa Middle East & North Africa Central & Eastern Europe (0.549) (0.377) (0.547) (0.376) (0.408) (0.393) (0.404) (0.404) *** *** *** *** (0.583) (0.779) (0.589) (0.774) Constant *** ** *** *** (1.490) (1.471) (1.608) (1.550) Observations R-squared Note: Dependent variable: average annual growth in per capita income, based on four year periods. Robust standard errors in parentheses.*, ** and *** indicate significance at 10%, 5% and 1%, respectively. For the IV regression in column (2), the Kleibergen-Paap statistic is 0 and the Hansen-J statistic is For the IV regression in column (3), the Kleibergen Paap statistic is 0 and the Hansen-J statistic is
41 Table 9: Aid and Growth in Violent Post-war Societies (1) (2) OLS IV Ln GDP per capita *** *** (0.161) (0.152) Aid (0.015) (0.018) CPIA ** *** (0.267) (0.144) Post Conflict (0.551) (0.426) Aid * Post-War *** *** (0.050) (0.033) Post-war violence*aid *** (0.070) (0.026) South Asia *** *** (0.337) (0.341) East Asia *** *** (0.448) (0.440) Central & Eastern Europe *** *** (0.568) (0.706) Constant *** *** (1.112) (1.139) Observations R-squared Note: Dependent variable: average annual growth in per capita income, based on four year periods. Robust standard errors in parentheses.*, ** and *** indicate significance at 10%, 5% and 1%, respectively. For the IV regression in column (2), the Kleibergen-Paap statistic is 0 and the Hansen-J statistic is
42 Table 10: Sectoral Aid and Growth (1) (2) (3) (4) (5) OLS IV OLS IV IV ln GDP per capita ** ** ** *** *** (0.273) (0.207) (0.286) (0.217) (0.241) Long Impact Aid *** (0.022) (0.032) (0.157) (0.189) Long Impact Aid * CPIA (0.047) (0.055) Long Impact Aid * Post Conflict (1-10) ** ** (0.099) (0.084) Short impact Aid ** (0.030) (0.039) (0.231) (0.159) Short impact Aid * CPIA (0.067) (0.047) Short Impact Aid * Post Conflict (1-10) (0.123) (0.090) Humanitarian Aid *** *** (0.105) (0.279) (1.118) (0.832) (0.954) Humanitarian Aid * CPIA *** * (0.346) (0.274) (0.318) Humanitarian Aid * Post Conflict (1-10) (0.439) (0.365) CPIA ** *** ** *** *** (0.247) (0.147) (0.336) (0.220) (0.343) Post Conflict (1-10) (0.635) (0.491) South Asia *** *** *** *** *** (0.563) (0.466) (0.578) (0.467) (0.510) East Asia *** *** *** *** *** (0.583) (0.502) (0.597) (0.521) (0.569) Sub Saharan Afria (0.554) (0.334) (0.557) (0.346) (0.414) Middle East & North Africa ** ** (0.409) (0.376) (0.413) (0.371) (0.408) Central & Eastern Europe *** *** *** *** *** (0.718) (0.838) (0.704) (0.941) (1.044) Constant *** *** *** *** *** (1.728) (1.560) (1.639) (1.692) (1.984) Observations R-squared Note: Dependent variable: average annual growth in per capita income, based on four year periods. Robust standard errors in parentheses.*, ** and *** indicate significance at 10%, 5% and 1%, respectively. For the IV regression in column (2),the Kleibergen-Paap statistic is 0.04 and the Hansen-J statistic is For the IV regression in column (4), the Kleibergen-Paap statistic is 0 and the Hansen-J statistic is For the IV regression in column (5), the Kleibergen-Paap statistic is 0 and the Hansen-J statistic is
43 Table 11: Different Aid Modalities and Growth (1) (2) (3) (4) (5) OLS IV OLS OLS IV ln GDP per capita ** * ** ** (0.406) (0.220) (0.399) (0.427) (0.225) CPIA *** ** (0.536) (0.226) (0.563) (0.657) (0.301) Post Conflict (1-10) (0.663) (0.530) Total Budget Support (0.051) (0.251) (0.058) (0.491) (0.902) Investment Projects * (0.095) (0.073) (0.107) (0.670) (0.393) Technical Cooperation * *** (0.075) (0.101) (0.079) (0.742) (1.332) Sectoral Programmes *** * * (0.057) (0.149) (0.063) (0.754) (0.814) Non Budget Support (Other) ** (0.058) (0.057) (0.074) (0.523) (0.301) Total Budget Support * CPIA (0.150) (0.250) Total Budget Support * Post Conflict (1-10) * (0.628) (0.417) Investment Projects*CPIA (0.191) (0.110) Inv Projects * Post Conflict (1-10) (0.360) (0.165) Technical Cooperation * CPIA *** (0.242) (0.373) Tech Cooperation * Post Conflict (1-10) ** ** (0.838) (0.418) Sectoral Programmes * CPIA * (0.245) (0.241) Sectoral Programmes * Post Conflict (1-10) (1.070) (0.492) Non Budget Support * CPIA ** (0.159) (0.089) Non Budget Support * Post Conflict (1-10) (0.186) (0.090) Constant ** (2.473) (1.625) (2.601) (2.426) (1.751) Observations R-squared Note: Dependent variable: average annual growth in per capita income, based on four year periods. Robust standard errors in parentheses.*, ** and *** indicate significance at 10%, 5% and 1%, respectively. Regressions include regional dummies (not reported). For the IV regression in column (2), the Kleibergen-Paap statistic is 0.89 and the Hansen-J statistic is For the IV regression in column (5), the Kleibergen-Paap statistic is 0.66 and the Hansen-J statistic is
44 Table 12: Policy Post-conflict (1) (2) (3) ln GDP (0.155)*** (0.156)*** (0.140)*** Aid (0.068) (0.072) (0.014) CPIA (0.293)** (0.295)** (0.236)** CPIA*Aid (0.020) (0.022) p-war1_ (2.420) (2.276) (0.657)** p-war1_10*aid (0.218) (0.035) p-war1_10*cpia (0.645) (0.617) p-war1_10*cpia*aid (0.066) South Asia (0.356)*** (0.360)*** (0.380)*** East Asia (0.462)*** (0.461)*** (0.465)*** C&Eastern Europe (0.579)*** (0.579)*** (0.503)*** CPIA_A (3.149)*** CPIA_B (3.558) CPIA_C (2.693)*** civil war (0.568)*** CPIA_A *p-war1_ (4.612) CPIA_B*p-war1_ (4.903) CPIA_C*p-cwar_ (4.864) CPIA missing dummy (8.184)*** Constant (1.114)*** (1.103)*** (8.474)*** Observations R-squared Note: Dependent variable: average annual growth in per capita income, based on four year periods. Robust standard errors in parentheses. *, ** and *** indicate significance at 10%, 5% and 1%, respectively. 43
45 Table 13: UN Peace Keeping Missions and Post-conflict Recovery (1) (2) (3) (4) ln GDP (0.138)*** (0.140)*** (0.140)*** (0.141)*** Aid (0.014) (0.014) (0.014) (0.014) CPIA (0.230)** (0.226)** (0.227)** (0.228)** civil war (0.556)*** p-war1_ (0.530)* (0.521) UN mission (0.436) (0.441) (0.435) (0.389) UN mission Post-war (0.917) (0.943) p-war1_ (0.740) (0.630) p-war4_ (1.049)** p-war7_ (0.760) UN mission p-war1_ (1.335)* (1.304)* UN_mission p-war4_ (1.541) UN_mission p-war7_ (1.284) South Asia (0.376)*** (0.353)*** (0.353)*** (0.350)*** East Asia (0.452)*** (0.461)*** (0.462)*** (0.453)*** C&Eastern Europe (0.572)*** (0.581)*** (0.584)*** (0.575)*** Constant (1.127)*** (1.102)*** (1.114)*** (1.130)*** Observations R-squared Note: Dependent variable: average annual growth in per capita income, based on four year periods. Robust standard errors in parentheses.*, ** and *** indicate significance at 10%, 5% and 1%, respectively. UN mission is a dummy variable. 44
46 Table 14: DDR, Electoral Assistance and Humanitarian Assistance (1) (2) (3) (4) (5) (6) (7) (8) ln GDP (0.140)*** (0.140)*** (0.141)*** (0.139)*** (0.141)*** (0.140)*** (0.142)*** (0.140)*** Aid (0.014) (0.014) (0.014) (0.014) (0.014) (0.014) (0.014) (0.014) CPIA (0.226)** (0.225)** (0.226)** (0.227)** (0.228)** (0.227)** (0.227)** (0.227)** p-c1_ (0.523) (0.523) (0.523) (0.522) UNmission (0.443) (0.442) (0.442) (0.443) (0.390) (0.390) (0.389) (0.390) un_p-c1_ (1.066) (0.918) (0.872) (1.117) DDR1_ (1.823) (1.349) ELEC1_ (1.885) (1.342)** HUM1_ (1.261) (1.291) p-c1_ (0.632) (0.631) (0.630) (0.631) un_p-c1_ (1.446) (1.288) (1.201) (1.562) DDR p-c1_ (1.734)*** (1.802) ELEp-c1_ (2.711)*** (1.877)** HUMp-c1_ (1.867) (1.919)* Constant (1.111)*** (1.111)*** (1.108)*** (1.105)*** (1.130)*** (1.130)*** (1.137)*** (1.127)*** Obs R-squared Note: Dependent variable: per capita income growth. Robust standard errors in parentheses.*, ** and *** indicate significance at 10%, 5% and 1%, respectively. Regressions include regional dummies (not reported). 45
47 Table 15: UN PK expenditure and personnel (1) (2) (3) (4) ln GDP (0.175)*** (0.175)*** (0.141)*** (0.141)*** Aid (0.016) (0.016) (0.014) (0.014) CPIA (0.347) (0.349) (0.222)*** (0.223)*** p.war (0.476)*** (0.472)*** (0.419) (0.416) ln UNexpenditure (0.059) (0.059) ln UNpersonnel (0.081) (0.080) missing_unexp (0.278)*** missing_unper (0.278)*** Constant (1.444)* (1.447)* (1.140)*** (1.142)*** Observations R-squared Note: Dependent variable: per capita income growth. Robust standard errors in parentheses. *, ** and *** indicate significance at 10%, 5% and 1%, respectively. Regressions include regional dummies (not reported). Missing UN expenditure/personnel are dummies indicating missing values. 46
48 Table 16: Military Expenditure, Natural Resources and Post-conflict Recovery (1) (2) (3) ln GDP (0.172) (0.139)*** (0.139)*** Aid (0.019) (0.014) (0.014) CPIA (0.237)** (0.218)*** (0.226)** p.war (0.833) (0.699) (0.438) Military expenditure (0.073)** (0.070)* Military expenditure* p.war1-10 (0.268) (0.254) Missing mil. exp (0.285)*** Subsoil_dummy (0.315) Subsoil* p.war (0.899)*** Constant (1.313) (1.141)*** (1.085)*** Observations R-squared Note: Dependent variable: per capita income growth. Robust standard errors in parentheses. *, ** and *** indicate significance at 10%, 5% and 1%, respectively. Regressions include regional dummies (not reported). 47
49 48

50 Figures Figure 2 49


51 Figure 3: Aid by Purpose Source: OECD Creditor Reporting System, own calculations for years

52 Figure 4 51
53 Figure 5 Figure 6 52


54 Figure 7 Figure 8 Note: UN accounting years run from July to June, i.e. values for 2000 denote the period July 2000 until June

55 Figure 9 54
56 References: Alesina Alberto, and David Dollar Who gives foreign aid to whom and why? Journal of Economic Growth 5(1): Arellano, Manuel, Bond, Stephen, Some tests of specification for panel data: Monte Carlo evidence and an application to employment equations. Review of Economic Studies 58: Berthélemy, J.-C a. Bilateral Donors Interest vs. Recipients Development Motives in Aid Allocation: Do All Donors Behave the Same? Review of Development Economics 10 (2): Berthélemy, J.-C. 2006b. Aid Allocation: Comparing Donors Behaviour Swedish Economic Policy Review 13: Berthélemy, J.-C., and A. Tichit Bilateral donors aid allocation decisions: A three-dimensional panel analysis. International Review of Economics and Finance 13: Beynon, Jonathan Poverty Efficient Aid Allocations Collier/Dollar Revisited, Economic and Statistics Analysis Unit, November 2003 ESAU Working Paper 2, Overseas Development Institute, London. Beynon, J Policy implications for aid allocations of recent research on aid effectiveness and selectivity, in Arvin, B.M. (ed.), New Perspectives on Foreign Aid and Development, Praeger, Westport,CT. Blundell, Richard and Steve Bond Initial conditions and moment restrictions in dynamic panel data models, Journal of Econometrics 87: Boyce, J.K. and M. O Donnell (eds.) Peace and the Public Purse: Economic Policies for Postwar Statebuilding. Boulder CO: Lynne Rienner Publishers. Burnside, Craig and David Dollar Aid, Policies, and Growth. American Economic Review 90(4): Chauvet, Lisa and Patrick Guillaumont Aid and Performances: A Reassessment. Journal of Development Studies 37(6) : Cingranelli, D.L. and D.L. Richards Measuring the Level, Pattern, and Sequence of Government Respect for Physical Integrity Rights. International Studies Quarterly 43(2): Clemens, Michael, Steven Radelet, and Rikhil Bhavnani Counting Chickens When They Hatch: The Short-Term Effect of Aid on Growth. Working Paper 44, Center for Global Development, Washington, DC, July
57 Collier, Paul and David Dollar Aid allocation and poverty reduction. European Economic Review 46: Collier, Paul, Anke Hoeffler, and Måns Söderbom, Post-conflict Risks, Journal of Peace Research 45: Collier, Paul and Anke Hoeffler, Aid, Policy and Growth in Post-Conflict Societies, European Economic Review 48(5): Collier, Paul; Lance Elliot, Håvard Hegre, Anke Hoeffler, Marta Reynal-Querol and Nicholas Sambanis, Breaking the Conflict Trap: Civil War and Development Policy, World Bank Policy Research Report. Oxford: Oxford University Press. Gibney, M., Cornett, L., & Wood, R., (2010) Political Terror Scale Date Retrieved, from the Political Terror Scale Web site: Dalgaard, C.-J. and Hansen, H On aid, growth and good policies, Journal of Development Studies. vol. 37, pp Dalgaard, Carl-Johan, Henrik Hansen, and Finn Tarp On the Empirics of Foreign Aid and Growth, The Economic Journal 114(496): Dayton-Johnson, Jeff and John Hoddinott Aid, policies and growth, redux Dalhousie University. mimeo Deger, Sadeet and Ron Smith Military Expenditure and Growth in Less Developed Countries. The Journal of Conflict Resolution 27(2): Dunne, J. Paul and Mehmet Uye Defence Spending and Development, Department of Economics, British University in Egypt and University of the West of England, mimeo. Doyle, Michael W. and Nicholas Sambanis, Making War and Building Peace: United Nations Peace Operations. Princeton: Princeton University Press. Easterly, William, Ross Levine, and David Roodman Aid, Policies, and Growth: Comment. American Economic Review 94(3): Fearon, James D. and Laitin, David D. (2003). Ethnicity, Insurgency, and Civil War. The American Political Science Review, Vol. 97, No. 1, p. 77. Fortna, Virginia Page Does Peacekeeping Work? Shaping Belligerents' Choices after Civil War. Princeton: Princeton University Press. Frey, J Evaluating the Impact of Community Driven Reconstruction Programs in Liberia and DR Congo, paper presented at the Network of Networks of Impact Evaluation (NONIE) Meeting in Bonn, March Gilligan, Michael and Stephen John Stedman Where Do the Peacekeepers Go? 56
58 International Studies Review 5 (4): Greene, William H., Econometric Analysis. Englewood Cliffs, NJ: Prentice- Hall. Hansen, Hendrik and Finn Tarp Aid and Growth Regressions, Journal of Development Economics: 64 (2): Hartzell, Caroline and Matthew Hoddie, Institutionalizing Peace: Power Sharing and Post-Civil War Conflict Management, American Journal of Political Science 47 (2): Hoeffler, Anke and Verity Outram Need, Merit or Self-Interest What Determines the Allocation of Aid? Centre for the Study of African Economies WPS/ Jones, Benjamin. F. and Benjamin A. Olken Do Leaders Matter? National Leadership and Growth Since World War II. Quarterly Journal of Economics 120: Kaplan, Robert D The Coming Anarchy: How Scarcity, Crime, Overpopulation, and Disease are Rapidly Destroying the Social Fabric of our Planet. Atlantic Monthly 44; Kaldor, Mary New and Old Wars: Organized Violence in a Global Era. Cambridge: Polity Press. Kreutz, Joakim How and When Armed Conflicts End: Introducing the UCDP Conflict Termination Dataset. Journal of Peace Research 47 (2): Leamer, Edward E Let s Take the Con out of Econometrics. American Economic Review 73(1): Levine, Ross and David Renelt A Sensitivity Analysis of Cross-Country Growth Regressions. American Economic Review 82(4): OECD (2007) 2006 Development Co-operation Report, Volume 8 (1), Paris: Organisation for Economic Co-operation and Development. Paris, Roland, At War s End: Building Peace after Civil Conflicts. Cambridge: Cambridge University Press. Rajan, Raghuram G. and Arvind Subramanian Aid and Growth: What Does the Cross-Country Evidence Really Show? Review of Economics and Statistics 90(4): Regan, Patrick Sixteen Million One. Boulder CO: Paradigm. Roodman, David. 2007a. The Anarchy of Numbers: Aid, Development, and Cross- Country Empirics. The World Bank Economic Review 21(2):
59 Roodman, David. 2007b. Macro Aid Effectiveness Research: A Guide for the Perplexed, Center for Global Development. Working Paper Number 134, December Toft, Monica Duffy Securing The Peace: The Durable Settlement of Civil Wars. Princeton NJ: Princeton University Press. Walter, Barbara F., Designing Transitions from Civil War: Demobilization, Democratization, and Commitments to Peace. International Security 24 (1): Main Data Sources: OECD Creditor Reporting System accessed 18 March 2010 Uppsala Conflict Data Program (UCDP) Conflict Termination dataset v.2.1, , described in Kreutz, Joakim. 2010, How and When Armed Conflicts End: Introducing the UCDP Conflict Termination Dataset," Journal of Peace Research 47 (2): Uppsala/PRIO Armed Conflict Database Data File as described in Gleditsch, Nils Petter; Peter Wallensteen, Mikael Eriksson, Margareta Sollenberg and Håvard Strand, Armed Conflict : A New Dataset, Journal of Peace Research 39(5): World Development Indicators World Bank Data File. 58
60 Appendix Table 1A: United Nations Peace Keeping Missions Acronym Mission name Start Closing Country(ies) date date UNTSO United Nations Truce Supervision Organization May-48 Present Egypt, Israel, Lebanon, Syria UNMOGIP United Nations Military Observer Jan-49 Present India, Pakistan Group in India and Pakistan UNEF I First United Nations Emergency Nov-56 Jun-67 Egypt Force UNOGIL United Nations Observation Group Jun-58 Dec-58 Lebanon in Lebanon ONUC United Nations Operation in the Congo Jul-60 Jun-64 Congo (DR Congo/Zaire) UNSF United Nations Security Force in West New Guinea Oct-62 Apr-63 West Papua (Indonesia) UNYOM United Nations Yemen Observation Jul-63 Sep-64 Yemen Mission UNFICYP United Nations Peacekeeping Force Mar-64 Present Cyprus in Cyprus DOMREP Mission of the Representative of the May-65 Oct-66 Dominican Republic Secretary-General in the Dominican Republic UNIPOM United Nations India-Pakistan Sep-65 Mar-66 India, Pakistan Observation Mission UNEF II Second United Nations Emergency Oct-73 Jul-79 Egypt Force UNDOF United Nations Disengagement Jun-74 Present Syria Observer Force UNIFIL United Nations Interim Force in Mar-78 Present Lebanon Lebanon UNGOMAP United Nations Good Offices Mission in Afghanistan and Pakistan May-88 Mar-90 Afghanistan, Pakistan UNIIMOG United Nations Iran-Iraq Military Aug-88 Feb-91 Iran, Iraq Observer Group UNAVEM I United Nations Angola Verification Jan-89 Jun-91 Angola Mission I UNTAG United Nations Transition Apr-89 Mar-90 Namibia Assistance Group ONUCA United Nations Observer Group in Central America Nov-89 Jan-92 Costa Rica, El Salvador, Guatemala, Honduras, Nicaragua MINURSO United Nations Mission for the Referendum in Western Sahara Apr-91 present Morocco (Western Sahara) UNIKOM United Nations Iraq-Kuwait Apr-91 Oct-03 Iraq, Kuwait Observation Mission UNAVEM II United Nations Angola Verification Jun-91 Feb-95 Angola Mission II ONUSAL United Nations Observer Mission in Jul-91 Apr-95 El Salvador El Salvador UNAMIC United Nations Advance Mission in Cambodia Oct-91 Mar-92 Cambodia 59
61 UNPROFOR United Nations Protection Force Feb-92 Mar-95 Croatia, Bosnia & Herzegovina, Macedonia UNTAC United Nations Transitional Mar-92 Sep-93 Cambodia Authority in Cambodia UNOSOM I United Nations Operation in Somalia Apr-92 Mar-93 Somalia I ONUMOZ United Nations Operation in Dec-92 Dec-94 Mozambique Mozambique UNOSOM II United Nations Operation in Somalia Mar-93 Mar-95 Somalia II UNOMUR United Nations Observer Mission Jun-93 Sep-94 Rwanda, Uganda Uganda-Rwanda UNOMIG United Nations Observer Mission in Aug-93 Jun-09 Georgia Georgia UNMIH United Nations Mission in Haiti Sep-93 Jun-96 Haiti UNOMIL United Nations Observer Mission in Sep-93 Sep-97 Liberia Liberia UNAMIR United Nations Assistance Mission Oct-93 Mar-96 Rwanda for Rwanda UNASOG United Nations Aouzou Strip May-94 Jun-94 Chad Observer Group UNMOT United Nations Mission of Observers Dec-94 May-00 Tajikistan in Tajikistan UNAVEM United Nations Angola Verification Feb-95 Jun-97 Angola III Mission III UNPREDEP United Nations Preventive Mar-95 Feb-99 Macedonia Deployment Force UNCRO United Nations Confidence May-95 Jan-96 Croatia Restoration Operation in Croatia UNMIBH United Nations Mission in Bosnia Dec-95 Dec-02 Bosnia & UNMOP UNTAES UNSMIH MINUGUA MONUA UNTMIH MIPONUH and Herzegovina United Nations Mission of Observers in Prevlaka United Nations Transitional Administration for Eastern Slavonia, Baranja and Western Sirmium United Nations Support Mission in Haiti United Nations Verification Mission in Guatemala United Nations Observer Mission in Angola United Nations Transition Mission in Haiti United Nations Civilian Police Mission in Haiti 60 Herzegovina Jan-96 Dec-02 Croatia, Federal Republic of Yugoslavia Jan-96 Jan-98 Croatia Jul-96 Jul-97 Haiti Jan-97 May-97 Guatemala Jun-97 Feb-99 Angola Aug-97 Dec-97 Haiti Dec-97 Mar-00 Haiti UNPSG UN Civilian Police Support Group Jan-98 Oct-98 Croatia MINURCA United Nations Mission in the Central African Republic Apr-98 Feb-00 Central African Republic UNOMSIL United Nations Observer Mission in Jul-98 Oct-99 Sierra Leone Sierra Leone UNMIK United Nations Interim Jun-99 Present Kosovo Administration Mission in Kosovo UNAMSIL United Nations Mission in Sierra Oct-99 Dec-05 Sierra Leone Leone UNTAET United Nations Transitional Oct-99 May-02 Timor-Leste Administration in East Timor MONUC United Nations Organization Nov-99 Present Democratic
62 Mission in the Democratic Republic Republic of Congo of the Congo UNMEE United Nations Mission in Ethiopia Jul-00 Jul-08 Ethiopia, Eritrea and Eritrea UNMISET United Nations Mission of Support May-02 May-05 Timor-Leste in East Timor UNMIL United Nations Mission in Liberia Sep-03 Present Liberia UNOCI United Nations Operation in Côte Apr-04 Present Cote d Ivoire d'ivoire MINUSTAH United Nations Stabilization Mission Jun-04 Present Haiti in Haiti ONUB United Nations Operation in Burundi Jun-04 Dec-06 Burundi UNMIS United Nations Mission in the Sudan Mar-05 Present Sudan UNMIT United Nations Integrated Mission in Aug-06 Present Timor-Leste Timor-Leste UNAMID African Union-United Nations Jul-07 Present Sudan Hybrid Operation in Darfur MINURCAT United Nations Mission in the Central African Republic and Chad Sep-07 Present Central African Republic, Chad Note: This list of 63 UN Peace Keeping Missions was accessed on 17 February This list excludes special missions, such as for example the current missions UNAMA (United Nations Assistance Mission in Afghanistan) and BINUB (United Nations Integrated Office in Burundi). 61
63 Table 1B: Classification of Aid Long Impact Aid Short Impact Aid Humanitarian Aid Social Infrastructure Transportation and Storage Humanitarian Aid Education Communications Development Food Assistance Health Energy Population & Reproductive Health Banking & Finance Water & Sanitation Banking (Other) Government & Civil Society Agriculture, Fishing & Forestry Other Social Infrastructure Mining & Industry Trade General Budget Support Multi sector Other Commodity Assistance General Environment Debt Other Multi Sector NGO Support Unallocated Note: Classification as in Clemens et al (2004). 62
64 63
65 Table A3.1: Robustness Checks: Civil War Countries Only (1) (2) (3) (4) (5) (6) (7) (8) (9) lngdppc_ (0.278) (0.279) (0.280) (0.281) (0.281) (0.280) (0.281) (0.281) (0.281) aid_per_ (0.037)** (0.037)** (0.038)** (0.038)* (0.037)* (0.037)* (0.038)** (0.037)** (0.038)** cpia_a_ (0.319)** (0.322)** (0.319)** (0.322)** (0.324)*** (0.322)*** (0.326)** (0.327)*** (0.326)*** civwar (0.574)*** (0.577)*** (0.574)*** (0.422) (0.423) (0.420) (0.429)* (0.431)* (0.429)* pc1_ (0.405)* (0.449)*** (0.438)** pc (0.714) (1.212)*** (1.136)* pc (1.425) (1.411)** (1.249) pc (1.371) (1.126)*** (0.979) pc (0.917) (1.205)* (0.926) pc (0.866) (0.895) (0.733) pc (0.975)* (1.053)** (0.829)** pc (0.930) (1.751)* (0.933) pc (1.088) (0.665) (0.815) pc (0.641) (1.164) (0.785) pc (1.092) (0.655)** (0.729) 64
66 pc1_ (0.680) (0.731)*** (0.680)** pc4_ (0.608)** (0.685)*** (0.569) pc7_ (0.534) (0.514) (0.503) Observations R-squared Note: Dependent variable annual growth rates. Regressions include and intercept and regional dummies (not reported). 65
67 66
68 Table A3.2: Additional Robustness Checks for Table 3, Columns 1-3 (1) (2) (3) ln GDP (0.116)*** (0.115)*** (0.116)*** Aid (0.014)** (0.014)** (0.015)** CPIA (0.167)*** (0.168)*** (0.167)*** civil war (0.528)*** (0.529)*** (0.528)*** p-c1_ (0.354)*** South Asia (0.276)*** (0.277)*** (0.277)*** East Asia (0.310)*** (0.309)*** (0.310)*** C&Eastern Europe (0.350)*** (0.351)*** (0.352)*** p-c (0.700) p-c (1.538) p-c (1.524) p-c (0.789)** p-c (0.781) p-c (0.901)** p-c (0.905) p-c (1.106) p-c (0.583) p-c (1.066) p-c1_ (0.727) p-c4_ (0.492)*** p-c7_ (0.480) Constant (0.814)*** (0.812)*** (0.819)*** Observations R-squared Note: Civil war is defined as major armed conflicts which resulted in a minimum of 1,000 battle related deaths per year. Unlike in Table 3 we define peace periods of one to two years between wars not as peace if some lower level violence continued. 67
69 Table A3.3: Robustness Check using World Bank Definition of Civil War (1) (2) (3) (4) (5) (6) (7) (8) (9) (10) (11) (12) Major war Major war Major war Medium Medium Medium Small war Small war Small war Minor war Minor war Minor war war war war ln GDP (0.116)*** (0.116)*** (0.117)*** (0.116)*** (0.116)*** (0.116)*** (0.116)*** (0.116)*** (0.116)*** (0.117)*** (0.117)*** (0.117)*** Aid (0.015)** (0.015)** (0.015)** (0.015)** (0.015)** (0.015)** (0.015)** (0.015)** (0.015)** (0.015)** (0.015)** (0.015)** CPIA (0.168)*** (0.168)*** (0.168)*** (0.168)*** (0.168)*** (0.168)*** (0.169)*** (0.169)*** (0.168)*** (0.169)*** (0.169)*** (0.169)*** civil war (0.429)*** (0.430)*** (0.429)*** (0.373)*** (0.374)*** (0.373)*** (0.347)*** (0.347)*** (0.347)*** (0.302)*** (0.303)*** (0.303)*** p-c1_ (0.318) (0.271) (0.261) (0.236) p-c (1.106) (0.842) (0.788) (0.740) p-c (1.268) (0.673) (0.807) (0.730) p-c (0.987) (0.804) (0.901) (0.559) p-c (0.789)* (0.937) (0.787) (0.549)* p-c (0.885) (0.536) (0.703) (0.454) p-c (0.790) (0.785) (0.659) (0.546) p-c (1.089) (1.307)* (0.718) (0.623) p-c (0.626) (0.606) (0.655) (0.570) p-c (0.748) (0.668) (0.611) (0.542) p-c (0.591) (0.552) (0.572) (0.630)** p-c1_ (0.663) (0.459) (0.482) (0.414) p-c4_ (0.487) (0.479) (0.429) (0.322) p-c7_ (0.422) (0.373) (0.340) (0.320) Observations R-squared
70 Note Table A3.3: regressions include an intercept and regional dummies. Major wars are defined as years that experienced at least one conflict that resulted in 1,000 battle deaths. Medium wars are defined as years that experienced at least one conflict that resulted in at least 500 battle deaths. Small wars are defined as years that experienced at least one conflict that resulted in at least 250 battle deaths. Minor wars are defined as years that experienced at least one conflicts that resulted in 25 battle deaths. 69
71 Table A5.1: Civil War and Socio-political Outcomes (Only Civil War Countries) (1) (2) (3) (4) (5) (6) (7) (8) (9) (10) (11) (12) (13) (14) Polity Polity ICRG ICRG Corrupt. Corrup. Military in Gov. Military in Gov Bureauc. Bureauc. Physical Integrity Physical Integrity Political Terror Political Terror lngdppc_ (0.218)*** (0.219)*** (0.435)*** (0.417)*** (0.052)*** (0.052)*** (0.053)*** (0.053)*** (0.032)*** (0.032)*** (0.080) (0.077) (0.037) (0.036) aid_per_ (0.022)*** (0.022)*** (0.036)** (0.034)*** (0.006)*** (0.006)*** (0.004) (0.005) (0.004)* (0.004)* (0.008)*** (0.008)*** (0.004) (0.004) cpia_a_ (0.222)*** (0.223)*** (0.501)*** (0.494)*** (0.057)*** (0.056)*** (0.062)*** (0.063)*** (0.040)*** (0.040)*** (0.086)*** (0.084)** (0.040) (0.039) civwar (0.450)*** (0.450)*** (0.965)*** (0.965)*** (0.102)*** (0.102)*** (0.152)** (0.152)** (0.082)*** (0.083)*** (0.141)*** (0.140)*** (0.066)*** (0.066)*** pc1_ (0.393)*** (0.870)*** (0.080)*** (0.120)** (0.065)*** (0.146)*** (0.067)*** sasia (0.560)*** (0.564)*** (1.213) (1.227) (0.097) (0.097) (0.252) (0.256) (0.084)*** (0.084)*** (0.200)*** (0.198)*** (0.088)** (0.088)* easia (0.610) (0.609) (1.288) (1.281) (0.134)*** (0.135)** (0.148)* (0.147)* (0.125) (0.125) (0.182) (0.185) (0.079)*** (0.079)*** eurasia (0.561)*** (0.563)*** (1.722) (1.718) (0.115)*** (0.116)*** (0.195)*** (0.193)*** (0.097) (0.097) (0.206)** (0.192) (0.098)*** (0.094)*** pc1_ (0.501)*** (1.157) (0.102)*** (0.157)*** (0.093)*** (0.186)*** (0.080)*** pc4_ (0.603)*** (1.070)*** (0.104)*** (0.167) (0.094) (0.218)*** (0.101)*** pc7_ (0.630)*** (1.241)*** (0.133)*** (0.175) (0.107)*** (0.200) (0.100) Constant (1.416)*** (1.423)*** (2.732)*** (2.632)*** (0.324)*** (0.323)*** (0.364)*** (0.362)*** (0.216)*** (0.218)*** (0.560)*** (0.547)*** (0.242)*** (0.237)*** Observations R-squared Note: Regressions include and intercept and regional dummies (not reported). Robust standard errors in parentheses. * significant at 10%; ** significant at 5%; *** significant at 1%, respectively. 70
72 Table A5.2: Civil War and Socio-political Outcomes (without CPIA as an explanatory variable) (1) (2) (3) (4) (5) (6) (7) (8) (9) (10) (11) (12) (13) (14) Polity Polity ICRG ICRG Corrupt. Corrup. Military in Gov. Military in Gov Bureauc. Bureauc. Physical Integrity Physical Integrity Political Terror Political Terror lngdppc_ (0.125)*** (0.125)*** (0.220)*** (0.217)*** (0.029)*** (0.029)*** (0.035)*** (0.035)*** (0.019)*** (0.019)*** (0.040)*** (0.039)*** (0.020)*** (0.020)*** aid_per_ (0.014)*** (0.014)*** (0.023)*** (0.022)*** (0.004)*** (0.003)*** (0.004)*** (0.004)*** (0.002) (0.002) (0.005)*** (0.005)*** (0.003)*** (0.002)*** civwar (0.386) (0.386) (0.910)*** (0.909)*** (0.090)* (0.090)* (0.126)*** (0.126)*** (0.076)*** (0.076)*** (0.116)*** (0.116)*** (0.056)*** (0.056)*** pc1_ (0.323)** (0.704)* (0.068) (0.099)*** (0.058)*** (0.115)*** (0.053)*** sasia (0.567)*** (0.568)*** (1.129)*** (1.150)*** (0.096) (0.096) (0.209)** (0.211)*** (0.091)*** (0.091)*** (0.155)*** (0.154)*** (0.066)** (0.066)** easia (0.382)** (0.382)** (0.583)*** (0.584)*** (0.084) (0.084) (0.099)*** (0.099)*** (0.059)*** (0.059)*** (0.122)*** (0.122)*** (0.057) (0.057) eurasia (0.353)*** (0.353)*** (0.574)*** (0.574)*** (0.076) (0.076) (0.075)*** (0.074)*** (0.049) (0.049) (0.095)*** (0.093)*** (0.051)*** (0.051)*** pc1_ (0.461) (1.152)*** (0.089) (0.148)*** (0.094)*** (0.171)*** (0.072)*** pc4_ (0.547) (1.020) (0.105) (0.156)*** (0.087)** (0.191)*** (0.095)*** pc7_ (0.582)** (1.108) (0.141) (0.172)*** (0.103)*** (0.173)*** (0.088)*** Constant (0.917)*** (0.918)*** (1.687)*** (1.664)*** (0.224)** (0.224)** (0.264)*** (0.264)*** (0.148)*** (0.148)*** (0.307)*** (0.303)*** (0.147)*** (0.145)*** Observations R-squared Note: Regressions include and intercept and regional dummies (not reported). Robust standard errors in parentheses. * significant at 10%; ** significant at 5%; *** significant at 1%, respectively. 71
73 Table A8: Impact of political transitions, duration of polity and leadership on growth Growth in Y (%) Growth in Y Growth in Y (%) Growth in Y Growth in Y (%) (IV) (%) (IV) (OLS) (%) (IV) (OLS) Ln GDP per capita ** (0.199) (0.183) (0.254) (0.197) (0.309) Total Aid ** * (0.020) (0.031) (0.015) (0.019) (0.026) CPIA *** *** ** *** * (0.154) (0.160) (0.278) (0.164) (0.308) Political pos Transition (1-5) *** ** Political neg transition (t-1 - t-5) Aid * pos Political Trans (1-5) Aid * neg political Trans (t-1 - t-5) Durability of Political Regime (0.355) (0.351) (0.472) (0.488) ** (0.041) (0.027) ** ** (0.052) (0.049) *** *** (0.009) (0.012) Total Aid * Durability *** ** (0.001) (0.001) Years in Power (0.074) Years in Power Squared (0.002) Aid * Years in Power (0.006) Aid * Years in Power Squared (0.000) South Asia *** *** *** *** *** (0.472) (0.443) (0.528) (0.458) (0.626) East Asia *** *** *** *** *** (0.483) (0.546) (0.558) (0.493) (0.583) Sub Saharan Africa (0.388) (0.370) (0.536) (0.373) (0.633) Middle East & North Africa Central & Eastern Europe * (0.390) (0.431) (0.409) (0.396) (0.418) *** *** *** *** *** (0.687) (0.608) (0.573) (0.758) (0.594) Constant ** ** ** ** (1.477) (1.402) (1.692) (1.553) (1.936) Observations R-squared Note: Robust standard errors in parentheses. * significant at 10%; ** significant at 5%; *** significant at 1%, respectively. For the IV regression in column (1),the Kleibergen-Paap statistic is 0 and the Hansen-J statistic is For the IV regression in column (2),the Kleibergen-Paap statistic is 0 and the Hansen-J statistic is For the IV regression in column (4),the Kleibergen-Paap statistic is 0 and the Hansen-J statistic is
74 Table 11: CPIA, Aid and Political Transitions ln GDP per capita CPIA (OLS) CPIA (IV) CPIA (OLS) CPIA (IV) CPIA (OLS) CPIA (IV) CPIA (OLS) CPIA (IV) *** *** *** *** *** *** *** *** (0.045) (0.047) (0.057) (0.050) (0.053) (0.034) (0.046) (0.045) Aid (t-1) ** * ** *** (0.004) (0.004) (0.006) (0.006) (0.004) (0.004) (0.004) (0.005) Post Conflict (1-10) Post Conflict *Aid (t-1) Years in Power Aid (t-1) * Years in Power ** (0.091) (0.095) * (0.005) (0.005) (0.007) (0.007) (0.001) (0.000) Durable ** *** (0.002) (0.002) Aid (t-1) * Durable Transition (1-5) Transition (t-1 - t-5) Aid (t-1) * Transition (1-5) Aid (t-1) * Transition (t-1- t-5) * (0.000) (0.000) ** (0.084) (0.080) ** ** (0.117) (0.117) (0.005) (0.005) South Asia *** *** *** *** *** *** *** *** (0.112) (0.118) (0.142) (0.125) (0.139) (0.110) (0.110) (0.109) East Asia *** *** *** *** *** *** *** *** (0.115) (0.115) (0.139) (0.131) (0.120) (0.110) (0.116) (0.114) Sub Saharan Africa Middle East & North Africa Central & Eastern Europe *** *** ** ** (0.108) (0.101) (0.143) (0.114) (0.123) (0.062) (0.108) (0.092) (0.111) (0.111) (0.134) (0.126) (0.115) (0.113) (0.111) (0.109) ** * ** (0.089) (0.102) (0.113) (0.129) (0.093) (0.101) (0.089) (0.098) Constant *** * * *** ** (0.368) (0.382) (0.465) (0.406) (0.421) (0.273) (0.374) (0.367) Observations R-squared Note: Robust standard errors in parentheses. * significant at 10%; ** significant at 5%; *** significant at 1%, respectively. For the IV regression in column (2),the Kleibergen-Paap statistic is 0 and the Hansen-J statistic is 0. For the IV regression in column (4),the Kleibergen-Paap statistic is 0 and the Hansen-J statistic is For the IV regression in column (6),the Kleibergen-Paap statistic is 0 and the Hansen-J statistic is 0. For the IV regression in column (8),the Kleibergen-Paap statistic is 0 and the Hansen-J statistic is
75 74
76 Further discussion of the Burnside and Dollar Model As discussed in Section there are three econometric concerns with the Burnside and Dollar (2000) work: (1) their results do not seem to be robust to small changes in the sample; (2) aid is endogenous and should be instrumented and (3) omitted variables may be driving the results. Sample Size Easterly, Levine and Roodman (2003) use the Burnside and Dollar (2000) specification and extend their dataset in time and country coverage. The interaction term aid/policy is only significant if the Burnside and Dollar (2000) sample is used but not if either more countries and/or more recent years are added. Daalgard and Hansen (2001) also examine the sensitivity of the Burnside and Dollar (2000) results to sample size and find that their key result, aid is growth enhancing in good policy environments, hinges on a few influential outliers: the exclusion of five observations seems critical to obtaining this key result. Using the full Burnside and Dollar (2000) sample Daalgard and Hansen (2001) obtain different results: aid has a positive effect on growth in any policy environment but exhibits diminishing returns. The interaction effect aid/policy is not significant, therefore questioning the policy suggestion that aid should be allocated to recipient countries with better policy environments. Endogeneity and Simultaneity In addition to the fragility of the results due to sample size researchers have been worried about endogeneity in the analysis of the relationship between aid and growth. For example, there could be reverse causation, donors may give more aid to growing economies to reward their economic performance or they may give less aid to them because they are perceived as less needy. In addition the estimations may suffer from omitted variable bias: for example good governance may affect both variables of interest, good governance raises growth and attracts aid. The endogeneity and simultaneity problems potentially create correlations between aid and growth in addition to any possible direct effects from aid on growth. Estimation techniques such as two or three stage last squares address the endogeneity problem while fixed effects estimation addresses the issue of omitted variables. Generalized Method of Moments 75
77 (GMM) techniques deal with the endogeneity issues through instrumentation and deal with the omitted variable problem by estimating a model in first differences. 23 Hansen and Tarp (2001) apply GMM estimation to the Burnside and Dollar (2000) model. Their results suggest that aid in all likelihood increases the growth rate, and this result is not conditional on good policy. However, there find decreasing returns to aid, and the estimated effectiveness of aid is highly sensitive to the choice of estimator and the set of control variables. Chauvet and Guillamont (2001) come to a similar conclusion. 23 See Arelano and Bond (1991) and Blundell and Bond (1998). 76
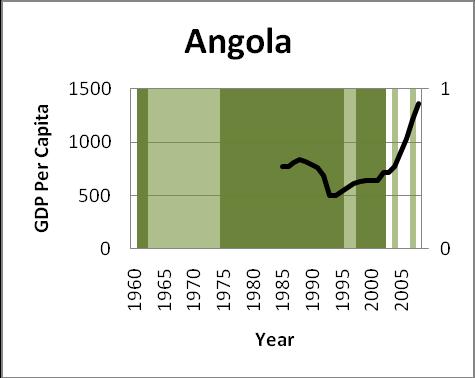
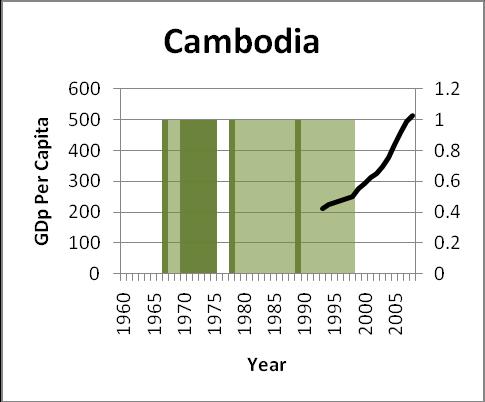
78 77
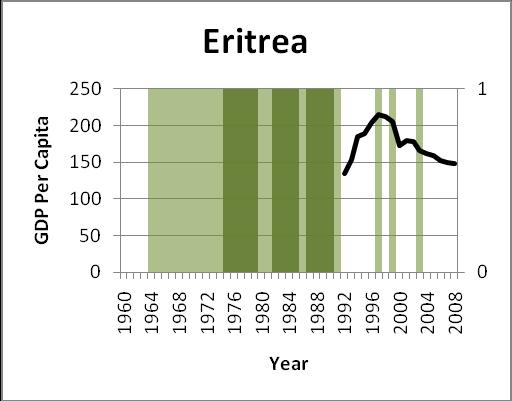
79 78

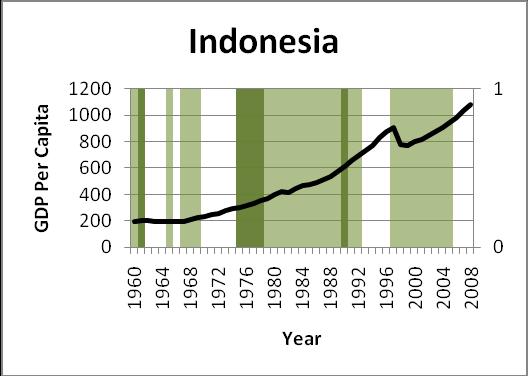
80 79

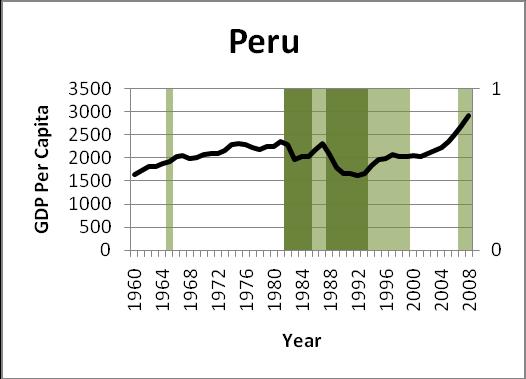
81 80
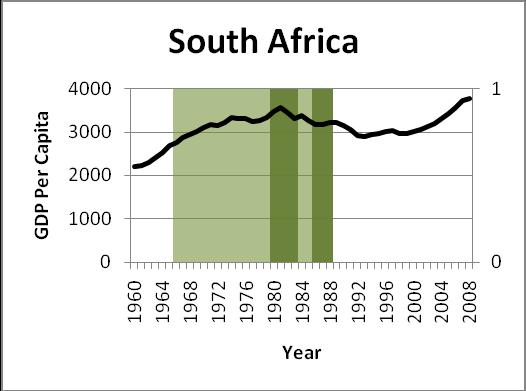
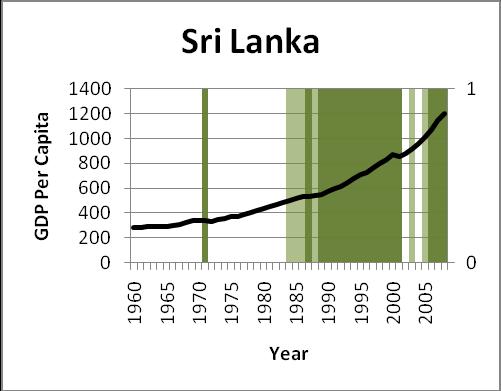
82 81
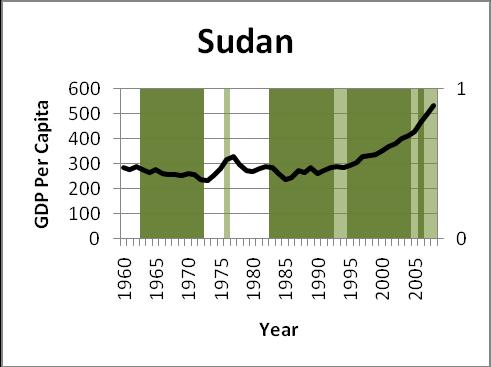
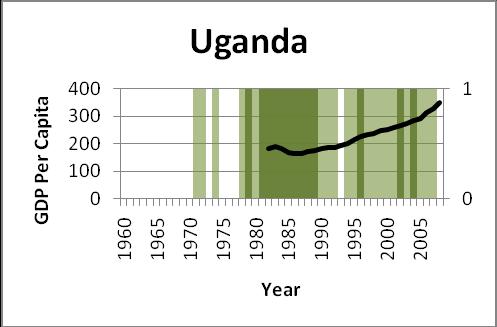
83 82
Handle with care: Is foreign aid less effective in fragile states?
 Handle with care: Is foreign aid less effective in fragile states? Ines A. Ferreira School of International Development, University of East Anglia (UEA) ines.afonso.rferreira@gmail.com Overview Motivation
Aid, Policy, and Growth in Post-Conflict Societies
 POLICY RESEARCH WORKING PAPER 2902 Aid, Policy, and Growth in Post-Conflict Societies Paul Collier Anke Hoeffler Public Disclosure Authorized Public Disclosure Authorized Public Disclosure Authorized Public
GENDER EQUALITY IN THE LABOUR MARKET AND FOREIGN DIRECT INVESTMENT
 THE STUDENT ECONOMIC REVIEWVOL. XXIX GENDER EQUALITY IN THE LABOUR MARKET AND FOREIGN DIRECT INVESTMENT CIÁN MC LEOD Senior Sophister With Southeast Asia attracting more foreign direct investment than
Under-five chronic malnutrition rate is critical (43%) and acute malnutrition rate is high (9%) with some areas above the critical thresholds.
 and acute malnutrition rate is high (9%) with some areas above the critical thresholds.") May 2014 Fighting Hunger Worldwide Democratic Republic of Congo: is economic recovery benefiting the vulnerable? Special Focus DRC DRC Economic growth has been moderately high in DRC over the last decade,
May 2014 Fighting Hunger Worldwide Democratic Republic of Congo: is economic recovery benefiting the vulnerable? Special Focus DRC DRC Economic growth has been moderately high in DRC over the last decade,
Impact of Foreign Aid on Economic Development in Pakistan [ ]
![Impact of Foreign Aid on Economic Development in Pakistan [ ]](/thumbs/92/107855430.jpg "Impact of Foreign Aid on Economic Development in Pakistan [ ]") MPRA Munich Personal RePEc Archive Impact of Foreign Aid on Economic Development in Pakistan [1960-2002] Ghulam Mohey-ud-din June 2005 Online at http:// mpra.ub.uni-muenchen.de/ 1211/ MPRA Paper No. 1211,
MPRA Munich Personal RePEc Archive Impact of Foreign Aid on Economic Development in Pakistan [1960-2002] Ghulam Mohey-ud-din June 2005 Online at http:// mpra.ub.uni-muenchen.de/ 1211/ MPRA Paper No. 1211,
Impact of Development and Humanitarian Aid on Economic Growth of Developing Countries
 Wageningen University and Research Centre Department of Social Sciences Development Economics Chair Group MSc Thesis Impact of Development and Humanitarian Aid on Economic Growth of Developing Countries
The U.S. Role in the Food Aid Picture
 The U.S. Role in the Food Aid Picture Shahla Shapouri USDA/Economic Research Service shapouri@ers.usda.gov Stacey Rosen USDA/Economic Research Service slrosen@ers.usda.gov Birgit Meade USDA/Economic Research
HOW ECONOMIES GROW AND DEVELOP Macroeconomics In Context (Goodwin, et al.)
") Chapter 17 HOW ECONOMIES GROW AND DEVELOP Macroeconomics In Context (Goodwin, et al.) Chapter Overview This chapter presents material on economic growth, such as the theory behind it, how it is calculated,
Chapter 17 HOW ECONOMIES GROW AND DEVELOP Macroeconomics In Context (Goodwin, et al.) Chapter Overview This chapter presents material on economic growth, such as the theory behind it, how it is calculated,
Impact of Human Rights Abuses on Economic Outlook
 Digital Commons @ George Fox University Student Scholarship - School of Business School of Business 1-1-2016 Impact of Human Rights Abuses on Economic Outlook Benjamin Antony George Fox University, bantony13@georgefox.edu
Supplemental Results Appendix
 Supplemental Results Appendix Table S1: TI CPI results with additional control variables (1) (2) (3) (4) lag DV press freedom presidentialism personalism lag TI CPI 0.578 0.680 0.680 0.669 (11.87) (22.90)
- 2 - II. FRAGILE STATES AND THE INTERNATIONAL AID ARCHITECTURE
 - 2 - selective enhancement of this support. Section V outlines how IDA supports fragile states through World Bank and donor-financed trust funds, as well as through the World Bank s budget. Section VI
Supplementary Material for Preventing Civil War: How the potential for international intervention can deter conflict onset.
 Supplementary Material for Preventing Civil War: How the potential for international intervention can deter conflict onset. World Politics, vol. 68, no. 2, April 2016.* David E. Cunningham University of
January final ODA data for an initial analysis of key points. factsheet
 January 2018 final ODA data for 2016 an initial analysis of key points factsheet Key facts This analysis is based on the 2016 official development assistance (ODA) data released by the Organisation for
Violent Conflict and Inequality
 Violent Conflict and Inequality work in progress Cagatay Bircan University of Michigan Tilman Brück DIW Berlin, Humboldt University Berlin, IZA and Households in Conflict Network Marc Vothknecht DIW Berlin
World Bank Policy Lending and the Quality of Public Sector Governance
 Policy Research Working Paper 7267 WPS7267 World Bank Policy Lending and the Quality of Public Sector Governance Lodewijk Smets Stephen Knack Public Disclosure Authorized Public Disclosure Authorized Public
Hungary. Basic facts The development of the quality of democracy in Hungary. The overall quality of democracy
 Hungary Basic facts 2007 Population 10 055 780 GDP p.c. (US$) 13 713 Human development rank 43 Age of democracy in years (Polity) 17 Type of democracy Electoral system Party system Parliamentary Mixed:
IEP BRIEF. Positive Peace: The lens to achieve the Sustaining Peace Agenda
 IEP BRIEF Positive Peace: The lens to achieve the Sustaining Peace Agenda EXECUTIVE SUMMARY The April 2016 resolutions adopted by the United One of Positive Peace s value-adds is its Nations Security Council
5.1 Assessing the Impact of Conflict on Fractionalization
 5 Chapter 8 Appendix 5.1 Assessing the Impact of Conflict on Fractionalization We now turn to our primary focus that is the link between the long-run patterns of conflict and various measures of fractionalization.
Openness and Internal Conflict. Christopher S. P. Magee Department of Economics Bucknell University Lewisburg, PA
 Openness and Internal Conflict Christopher S. P. Magee Department of Economics Bucknell University Lewisburg, PA 17837 cmagee@bucknell.edu Tansa George Massoud Department of Political Science Bucknell
Does Korea Follow Japan in Foreign Aid? Relationships between Aid and FDI
 Does Korea Follow Japan in Foreign Aid? Relationships between Aid and FDI Japan and the World Economy (Forthcoming) Sung Jin Kang, Korea Univ. Hongshik Lee, Korea Univ. Bokyeong Park, KIEP 1 Korea and
An Empirical Analysis of Pakistan s Bilateral Trade: A Gravity Model Approach
 103 An Empirical Analysis of Pakistan s Bilateral Trade: A Gravity Model Approach Shaista Khan 1 Ihtisham ul Haq 2 Dilawar Khan 3 This study aimed to investigate Pakistan s bilateral trade flows with major
The Effect of Foreign Direct Investment, Foreign Aid and International Remittance on Economic Growth in South Asian Countries
 St. Cloud State University therepository at St. Cloud State Culminating Projects in Economics Department of Economics 12-2016 The Effect of Foreign Direct Investment, Foreign Aid and International Remittance
Adopted by the Security Council at its 6266th meeting, on 28 January 2010
 United Nations Security Council Distr.: General 28 January 2010 Resolution 1910 (2010) Adopted by the Security Council at its 6266th meeting, on 28 January 2010 The Security Council, Recalling all its
Does Political Instability in Developing Countries Attract More Foreign Aid?
 International Journal of Economics and Finance; Vol. 8, No. 1; 2016 ISSN 1916-971X E-ISSN 1916-9728 Published by Canadian Center of Science and Education Does Political Instability in Developing Countries
DELIVERY. Channels and implementers CHAPTER
 6 CHAPTER DELIVERY Channels and implementers How funding is channelled to respond to the needs of people in crisis situations has implications for the efficiency and effectiveness of the assistance provided.
Twenty Years of UN Peacekeeping: Lessons Learned?
 Twenty Years of UN Peacekeeping: Lessons Learned? William Durch, Senior Associate, Stimson Center, Prepared for the NDIA conference on Security, Stabilization, Transition and Reconstruction Operations,
International Remittances and Brain Drain in Ghana
 Journal of Economics and Political Economy www.kspjournals.org Volume 3 June 2016 Issue 2 International Remittances and Brain Drain in Ghana By Isaac DADSON aa & Ryuta RAY KATO ab Abstract. This paper
Test Bank for Economic Development. 12th Edition by Todaro and Smith
 Test Bank for Economic Development 12th Edition by Todaro and Smith Link download full: https://digitalcontentmarket.org/download/test-bankfor-economic-development-12th-edition-by-todaro Chapter 2 Comparative
Volume 30, Issue 1. Corruption and financial sector performance: A cross-country analysis
 Volume 30, Issue 1 Corruption and financial sector performance: A cross-country analysis Naved Ahmad Institute of Business Administration (IBA), Karachi Shahid Ali Institute of Business Administration
The Correlates of Wealth Disparity Between the Global North & the Global South. Noelle Enguidanos
 The Correlates of Wealth Disparity Between the Global North & the Global South Noelle Enguidanos RESEARCH QUESTION/PURPOSE STATEMENT: What explains the economic disparity between the global North and the
Corruption and business procedures: an empirical investigation
 Corruption and business procedures: an empirical investigation S. Roy*, Department of Economics, High Point University, High Point, NC - 27262, USA. Email: sroy@highpoint.edu Abstract We implement OLS,
GOVERNANCE RETURNS TO EDUCATION: DO EXPECTED YEARS OF SCHOOLING PREDICT QUALITY OF GOVERNANCE?
 GOVERNANCE RETURNS TO EDUCATION: DO EXPECTED YEARS OF SCHOOLING PREDICT QUALITY OF GOVERNANCE? A Thesis submitted to the Faculty of the Graduate School of Arts and Sciences of Georgetown University in
The African strategic environment 2020 Challenges for the SA Army
 The African strategic environment 2020 Challenges for the SA Army Jakkie Cilliers Institute for for Security Studies, Head Office Pretoria 1 2005 Human Security Report Dramatic decline in number of armed
chapter 3 donors: who gives assistance?
 chapter 3 donors: who gives assistance? In 2017, volumes of international humanitarian assistance provided by government donors remained at similar levels to 2016. They also continued to be concentrated
Reanalysis: Are coups good for democracy?
 681908RAP0010.1177/2053168016681908Research & PoliticsMiller research-article2016 Research Note Reanalysis: Are coups good for democracy? Research and Politics October-December 2016: 1 5 The Author(s)
Is All Foreign Aid the Same? : An Empirical Comparison of the Effect of Multilateral and Bilateral Aid on Growth
 Undergraduate Economic Review Volume 12 Issue 1 Article 3 2015 Is All Foreign Aid the Same? : An Empirical Comparison of the Effect of Multilateral and Bilateral Aid on Growth Scott B. Jeffrey Davidson
April aid spending by Development Assistance Committee (DAC) donors in factsheet
 donors in factsheet") April 2017 aid spending by Development Assistance Committee (DAC) donors in 2016 factsheet In this factsheet we provide an overview of key trends in official development assistance (ODA) emerging from
April 2017 aid spending by Development Assistance Committee (DAC) donors in 2016 factsheet In this factsheet we provide an overview of key trends in official development assistance (ODA) emerging from
The transition of corruption: From poverty to honesty
 February 26 th 2009 Kiel and Aarhus The transition of corruption: From poverty to honesty Erich Gundlach a, *, Martin Paldam b,1 a Kiel Institute for the World Economy, P.O. Box 4309, 24100 Kiel, Germany
Should We Stay or Should We Go? Investigating the Impacts of Intervention on Post-War Development
 Skidmore College Creative Matter Economics Student Theses and Capstone Projects Economics 2018 Should We Stay or Should We Go? Investigating the Impacts of Intervention on Post-War Development Benjamin
Do Bilateral Investment Treaties Encourage FDI in the GCC Countries?
 African Review of Economics and Finance, Vol. 2, No. 1, Dec 2010 The Author(s). Published by Print Services, Rhodes University, P.O.Box 94, Grahamstown, South Africa Do Bilateral Investment Treaties Encourage
Policy Reform and Aid Effectiveness in Africa
 Policy Reform and Aid Effectiveness in Africa Mina BALIAMOUNE-LUTZ 1 Abstract This paper re-examines the good policy environment argument for aid effectiveness and allocation in Africa. It does so while
VULNERABILITY STUDY IN KAKUMA CAMP
 EXECUTIVE BRIEF VULNERABILITY STUDY IN KAKUMA CAMP In September 2015, the World Food Programme (WFP) and the United Nations High Commissioner for Refugees (UNHCR) commissioned Kimetrica to undertake an
Briefing Paper Pakistan Floods 2010: Country Aid Factsheet
 August 2010 Briefing Paper Pakistan Floods 2010: Country Aid Factsheet Pakistan is in the grips of a major natural disaster with severe flooding affecting an estimated three million people. As the government
Introduction: Definition and Scope of Conflict Economics
 1 Introduction: Definition and Scope of Conflict Economics For many people, in many places, violent or potentially violent conflict is part of the human experience. Headline stories of civil strife, insurgency,
WORKING PAPER SERIES
 INTERNATIONAL CENTRE FOR ECONOMIC RESEARCH WORKING PAPER SERIES M. Baliamoune Lutz POLICY REFORM AND AID EFFECTIVENESS IN AFRICA Working Paper No.19/2009 Policy Reform and Aid Effectiveness in Africa Mina
The Effect of Foreign Aid on the Economic Growth of Bangladesh
 Journal of Economics and Development Studies June 2014, Vol. 2, No. 2, pp. 93-105 ISSN: 2334-2382 (Print), 2334-2390 (Online) Copyright The Author(s). 2014. All Rights Reserved. Published by American Research
Figure 2: Proportion of countries with an active civil war or civil conflict,
 Figure 2: Proportion of countries with an active civil war or civil conflict, 1960-2006 Sources: Data based on UCDP/PRIO armed conflict database (N. P. Gleditsch et al., 2002; Harbom & Wallensteen, 2007).
Letter dated 20 December 2006 from the Chairman of the Peacebuilding Commission addressed to the President of the Security Council
 United Nations S/2006/1050 Security Council Distr.: General 26 December 2006 Original: English Letter dated 20 December 2006 from the Chairman of the Peacebuilding Commission addressed to the President
Full file at
 Chapter 2 Comparative Economic Development Key Concepts In the new edition, Chapter 2 serves to further examine the extreme contrasts not only between developed and developing countries, but also between
Armed Conflict Location & Event Data Project (ACLED)
") Armed Conflict Location & Event Data Project (ACLED) Guide to Dataset Use for Humanitarian and Development Practitioners January 2017 Further information and maps, data, trends, publications and contact
Armed Conflict Location & Event Data Project (ACLED) Guide to Dataset Use for Humanitarian and Development Practitioners January 2017 Further information and maps, data, trends, publications and contact
The effect of foreign aid on corruption: A quantile regression approach
 MPRA Munich Personal RePEc Archive The effect of foreign aid on corruption: A quantile regression approach Keisuke Okada and Sovannroeun Samreth Graduate School of Economics, Kyoto University, Japan 8.
A Long Term Approach To Bilateral Aid: The Case of Germany
 A Long Term Approach To Bilateral Aid: The Case of Germany George Andreopoulos City University of New York Giuliana Campanelli Andreopoulos William Paterson University Alexandros Panayides William Paterson
Impact of Japan s ODA Loan on Asian Economic Developments
 Impact of Japan s ODA Loan on Asian Economic Developments Ken-ichi RIETI/MoFA, Japan June 2001 4th GTAP Annual Conference Table of Contents Japanese Official Development Assistance (ODA) Aid Philosophy
- ISSUES NOTE - Joint Special Event on the Food and Economic Crises in Post-Conflict Countries
 - ISSUES NOTE - Joint Special Event on the Food and Economic Crises in Post-Conflict Countries Organized by the Economic and Social Council, Peacebuilding Commission, in partnership with the World Food
EFFECTS OF PROPERTY RIGHTS AND CORRUPTION ON GENDER DEVELOPMENT
 EFFECTS OF PROPERTY RIGHTS AND CORRUPTION ON GENDER DEVELOPMENT A Thesis submitted to the Graduate School of Arts and Sciences at Georgetown University in partial fulfillment of the requirements for the
Are Remittances More Effective Than Aid To Improve Child Health? An Empirical Assessment using Inter and Intra-Country Data
 Are Remittances More Effective Than Aid To Improve Child Health? An Empirical Assessment using Inter and Intra-Country Data Lisa Chauvet, Flore Gubert and Sandrine Mesplé-Somps 1 This version: 30 September
Implications of Peacebuilding and Statebuilding in United Nations Mandates 1
 Implications of Peacebuilding and Statebuilding in United Nations Mandates 1 I. Executive Summary Jake Sherman and Benjamin Tortolani 1. Over the past decade, the effectiveness of UN peacekeeping has been
7 ETHNIC PARITY IN INCOME SUPPORT
 7 ETHNIC PARITY IN INCOME SUPPORT Summary of findings For customers who, in 2003, had a Work Focused Interview as part of an IS claim: There is evidence, for Ethnic Minorities overall, of a significant
chapter 1 people and crisis
 chapter 1 people and crisis Poverty, vulnerability and crisis are inseparably linked. Poor people (living on under US$3.20 a day) and extremely poor people (living on under US$1.90) are more vulnerable
Sectoral Foreign Aid and Income Inequality
 International Journal of Economics and Finance; Vol. 5, No. 9; 2013 ISSN 1916-971XE-ISSN 1916-9728 Published by Canadian Center of Science and Education Sectoral Foreign Aid and Income Inequality Ruhaida
PRIVATE CAPITAL FLOWS RETURN TO A FEW DEVELOPING COUNTRIES AS AID FLOWS TO POOREST RISE ONLY SLIGHTLY
 The World Bank News Release No. 2004/284/S Contacts: Christopher Neal (202) 473-7229 Cneal1@worldbank.org Karina Manaseh (202) 473-1729 Kmanasseh@worldbank.org TV/Radio: Cynthia Case (202) 473-2243 Ccase@worldbank.org
Notes to Editors. Detailed Findings
 Notes to Editors Detailed Findings Public opinion in Russia relative to public opinion in Europe and the US seems to be polarizing. Americans and Europeans have both grown more negative toward Russia,
Abdurohman Ali Hussien,,et.al.,Int. J. Eco. Res., 2012, v3i3, 44-51
 THE IMPACT OF TRADE LIBERALIZATION ON TRADE SHARE AND PER CAPITA GDP: EVIDENCE FROM SUB SAHARAN AFRICA Abdurohman Ali Hussien, Terrasserne 14, 2-256, Brønshøj 2700; Denmark ; abdurohman.ali.hussien@gmail.com
Responding to conflict in Africa Mark Bowden February 2001
 Responding to conflict in Africa Mark Bowden February 2001 1. In 1990, the Secretary General of the OAU presented a report to the OAU council of Ministers on the changes taking place in the world and their
Human Development Indices and Indicators: 2018 Statistical Update. Eritrea
 Human Development Indices and Indicators: 2018 Statistical Update Briefing note for countries on the 2018 Statistical Update Introduction Eritrea This briefing note is organized into ten sections. The
KOREA S ODA AND SOUTHEAST ASIA
 KOREA S ODA AND SOUTHEAST ASIA Myeon Hoei Kim Associate Professor Hankuk University of Foreign Studies 1. Introduction: From a Recipient to a Donor Country In the wake of the devastating 1950 Korean War,
Corruption and quality of public institutions: evidence from Generalized Method of Moment
 Document de travail de la série Etudes et Documents E 2008.13 Corruption and quality of public institutions: evidence from Generalized Method of Moment Gbewopo Attila 1 University Clermont I, CERDI-CNRS
Overview. Main Findings. The Global Weighted Average has also been steady in the last quarter, and is now recorded at 6.62 percent.
 This Report reflects the latest trends observed in the data published in September. Remittance Prices Worldwide is available at http://remittanceprices.worldbank.org Overview The Remittance Prices Worldwide*
Crawford School of Economics and Government. Approach. Hidemi Kimura and Yasuyuki Todo
 Australia Japan Research Centre ANU College of Asia & the Pacific Crawford School of Economics and Government Is Foreign Aid a Vanguard of Foreign Direct Investment? A Gravity-Equation Approach Hidemi
IMF research links declining labour share to weakened worker bargaining power. ACTU Economic Briefing Note, August 2018
 IMF research links declining labour share to weakened worker bargaining power ACTU Economic Briefing Note, August 2018 Authorised by S. McManus, ACTU, 365 Queen St, Melbourne 3000. ACTU D No. 172/2018
Contiguous States, Stable Borders and the Peace between Democracies
 Contiguous States, Stable Borders and the Peace between Democracies Douglas M. Gibler June 2013 Abstract Park and Colaresi argue that they could not replicate the results of my 2007 ISQ article, Bordering
How the world views Britain 2017
 How the world views Britain 2017 Foresight issue 158 VisitBritain Research November 2017 1 Contents 1. Introduction and study details 2. Headline findings 3. Tourism, Culture and Welcome rankings 4. Tourism
Growth, Structural Transformation and Development
 Finn Tarp Keynote at The Third Voice of Social Sciences Conference (VSS) on Industrialization and Social Transformation University of Dar es Salaam, Tanzania, 24-25 November 2016 Growth, Structural Transformation
Guns and Butter in U.S. Presidential Elections
 Guns and Butter in U.S. Presidential Elections by Stephen E. Haynes and Joe A. Stone September 20, 2004 Working Paper No. 91 Department of Economics, University of Oregon Abstract: Previous models of the
The Determinants of Aid Allocation by Regional Multilateral Development Banks and United Nations Agencies
 International Studies Quarterly (2003) 47, 101 122 The Determinants of Aid Allocation by Regional Multilateral Development Banks and United Nations Agencies ERIC NEUMAYER London School of Economics and
Executive summary. Strong records of economic growth in the Asia-Pacific region have benefited many workers.
 Executive summary Strong records of economic growth in the Asia-Pacific region have benefited many workers. In many ways, these are exciting times for Asia and the Pacific as a region. Dynamic growth and
A COMPARISON OF ARIZONA TO NATIONS OF COMPARABLE SIZE
 A COMPARISON OF ARIZONA TO NATIONS OF COMPARABLE SIZE A Report from the Office of the University Economist July 2009 Dennis Hoffman, Ph.D. Professor of Economics, University Economist, and Director, L.
AID EFFECTIVENESS IN POST-CONFLICT COUNTRIES
 AID EFFECTIVENESS IN POST-CONFLICT COUNTRIES A DISSERTATION SUBMITTED TO THE SCHOOL OF INTERNATIONAL STUDIES (UNIVERSITY OF TRENTO) IN PARTIAL FULFILMENT OF THE REQUIREMENTS FOR THE DOCTORAL DEGREE IN
Economic Freedom and Economic Performance: The Case MENA Countries
 The Journal of Middle East and North Africa Sciences 016; () Economic Freedom and Economic Performance: The Case Countries Noha Emara Economics Department, utgers University, United States Noha.emara@rutgers.edu
Development aid, openness to trade and economic growth in Least Developed Countries: bootstrap panel Granger causality analysis
 Available online at www.sciencedirect.com Procedia - Social and Behavioral Sciences 62 ( 2012 ) 716 721 WC-BEM 2012 Development aid, openness to trade and economic growth in Least Developed Countries:
Discussion Paper Series A No.533
 Discussion Paper Series A No.533 The Determinants of Corruption in Transition Economies Ichiro Iwasaki (Institute of Economic Research, Hitotsubashi University), and Taku Suzuki (Faculty of Economics,
Working Paper Series Department of Economics Alfred Lerner College of Business & Economics University of Delaware
 Working Paper Series Department of Economics Alfred Lerner College of Business & Economics University of Delaware Working Paper No. 2004-03 Institutional Quality and Economic Growth: Maintenance of the
Volume 36, Issue 1. Impact of remittances on poverty: an analysis of data from a set of developing countries
 Volume 6, Issue 1 Impact of remittances on poverty: an analysis of data from a set of developing countries Basanta K Pradhan Institute of Economic Growth, Delhi Malvika Mahesh Institute of Economic Growth,
Corruption, Political Instability and Firm-Level Export Decisions. Kul Kapri 1 Rowan University. August 2018
 Corruption, Political Instability and Firm-Level Export Decisions Kul Kapri 1 Rowan University August 2018 Abstract In this paper I use South Asian firm-level data to examine whether the impact of corruption
INDEPENDENT EVALUATION GROUP INDONESIA: COUNTRY ASSISTANCE EVALUATION APPROACH PAPER
 April 26, 2006 Country Background INDEPENDENT EVALUATION GROUP INDONESIA: COUNTRY ASSISTANCE EVALUATION APPROACH PAPER 1. From the mid-1960s until 1996, Indonesia was a development success story. From
Adopted by the Security Council at its 7317th meeting, on 20 November 2014
 United Nations S/RES/2185 (2014) Security Council Distr.: General 20 November 2014 Resolution 2185 (2014) Adopted by the Security Council at its 7317th meeting, on 20 November 2014 The Security Council,
Just War or Just Politics? The Determinants of Foreign Military Intervention
 Just War or Just Politics? The Determinants of Foreign Military Intervention Averyroughdraft.Thankyouforyourcomments. Shannon Carcelli UC San Diego scarcell@ucsd.edu January 22, 2014 1 Introduction Under
IMPACT OF ASIAN FLU ON CANADIAN EXPORTS,
 JOINT SERIES OF COMPETITIVENESS NUMBER 21 MARCH 2 IMPACT OF ASIAN FLU ON CANADIAN EXPORTS, WITH SPECIAL REFERENCE TO WESTERN CANADA Dick Beason, PhD Abstract: In this paper it is found that the overall
Impact of Religious Affiliation on Economic Growth in Sub-Saharan Africa. Dean Renner. Professor Douglas Southgate. April 16, 2014
 Impact of Religious Affiliation on Economic Growth in Sub-Saharan Africa Dean Renner Professor Douglas Southgate April 16, 2014 This paper is about the relationship between religious affiliation and economic
IN THE UNITED STATES DISTRICT COURT FOR THE EASTERN DISTRICT OF PENNSYLVANIA
 IN THE UNITED STATES DISTRICT COURT FOR THE EASTERN DISTRICT OF PENNSYLVANIA Mahari Bailey, et al., : Plaintiffs : C.A. No. 10-5952 : v. : : City of Philadelphia, et al., : Defendants : PLAINTIFFS EIGHTH
Appendix: Uncovering Patterns Among Latent Variables: Human Rights and De Facto Judicial Independence
 Appendix: Uncovering Patterns Among Latent Variables: Human Rights and De Facto Judicial Independence Charles D. Crabtree Christopher J. Fariss August 12, 2015 CONTENTS A Variable descriptions 3 B Correlation
Determinants of International Emergency Aid
 Public Disclosure Authorized Policy Research Working Paper 4839 WPS4839 Public Disclosure Authorized Public Disclosure Authorized Determinants of International Emergency Aid Humanitarian Need Only? Guenther
ANALYSIS OF THE EFFECT OF REMITTANCES ON ECONOMIC GROWTH USING PATH ANALYSIS ABSTRACT
 ANALYSIS OF THE EFFECT OF REMITTANCES ON ECONOMIC GROWTH USING PATH ANALYSIS Violeta Diaz University of Texas-Pan American 20 W. University Dr. Edinburg, TX 78539, USA. vdiazzz@utpa.edu Tel: +-956-38-3383.
A Major Challenge to the Sustainable Development Goals. Andrew Mack and Robert Muggah
 A Major Challenge to the Sustainable Development Goals Andrew Mack and Robert Muggah The Sustainable Development Goals (SDGs) which were adopted at the UN Summit in September last year, contain a goal
UN Peacekeeping Overview & U.S. Support
 INTERNATIONAL DIPLOMACY & PUBLIC POLICY CENTER UN Peacekeeping Overview & U.S. Support by Thomas W. Jacobson President, International Diplomacy & Public Policy Center Visiting Fellow for, and brief published
Volume 35, Issue 1. An examination of the effect of immigration on income inequality: A Gini index approach
 Volume 35, Issue 1 An examination of the effect of immigration on income inequality: A Gini index approach Brian Hibbs Indiana University South Bend Gihoon Hong Indiana University South Bend Abstract This
Effects of Aid for Trade on Extensive and Intensive Margins of Greenfield FDI +
 Effects of Aid for Trade on Extensive and Intensive Margins of Greenfield FDI + Dung Ly-My 1 Kangwon National University, Republic of Korea Hyun-Hoon Lee 2 Kangwon National University, Republic of Korea
An Examination of China s Development Factors and Governance Indicators over the Period
 An Examination of China s Development Factors and Governance Indicators over the 1985-2012 Period Halil D. Kaya, PhD Associate Professor of Finance Northeastern State University Broken Arrow United States
A Note on International Migrants Savings and Incomes
 September 24, 2014 A Note on International Migrants Savings and Incomes Supriyo De, Dilip Ratha, and Seyed Reza Yousefi 1 Annual savings of international migrants from developing countries are estimated
INTERNATIONAL ACTIVISM. Based on Part V Why The Dramatic Decline In Armed Conflict? in Human Security Report, 2005, p
 INTERNATIONAL ACTIVISM Based on Part V Why The Dramatic Decline In Armed Conflict? in Human Security Report, 2005, p.145-158 Since the end of the colonial era there have been fewer and fewer international