Nordic inputs to the EU Green Paper on Territorial Cohesion
|
|
|
- Lauren Chase
- 6 years ago
- Views:
Transcription
1 Nordic inputs to the EU Green Paper on Territorial Cohesion Ole Damsgaard Alexandre Dubois Erik Gløersen Sigrid Hedin Daniel Rauhut Johanna Roto Peter Schmitt Jon Moxnes Steineke
2 Nordregio P.O. Box 1658 SE Stockholm, Sweden Nordic co-operation takes place among the countries of Denmark, Finland, Iceland, Norway and Sweden, as well as the autonomous territories of the Faroe Islands, Greenland and Åland. The Nordic Council is a forum for co-operation between the Nordic parliaments and governments. The Council consists of 87 parliamentarians form the Nordic countries. The Nordic Council takes policy initiatives and monitors Nordic co-operation. Founded in The Nordic Council of Ministers is a forum of co-operation between the Nordic governments. The Nordic Council of Ministers implements Nordic co-operation. The prime ministers have the overall responsibility. Its activities are co-ordinated by the Nordic ministers for co-operation, the Nordic Committee for co-operation and portfolio ministers. Founded in Stockholm, Sweden 2008
3 Contents Contents...3 Executive summary...5 Introduction...12 Nordic input to the Commission s Green Paper on Territorial Cohesion...12 What does territorial cohesion mean?...12 What policy instruments should be used to achieve territorial cohesion?...13 The aim of this discussion paper Geographic structures in the Nordic countries...16 Long distances...18 Extensive mountainous areas...19 Insular and coastal regions...22 Isolated border regions...23 Arctic- and sub-arctic climate...24 Sparsely populated regions...25 Urban pattern...26 Concluding remarks...38 Ageing...40 Immigration patterns...50 The economic development pattern...54 Conclusion Emerging challenges...59 Energy supply and demand...59 Climate change...67 Globalisation Proactive strategies for regional development in the Nordic countries...76 Innovation...76 Regional enlargement...82 A Nordic appreciation of Polycentricity...84 Concluding remarks Nordic inputs to European debates on Territorial Cohesion...88 References
4 4
5 Executive summary From the reduction of disparities to increasing territorial competitiveness This paper is a first attempt to discuss how the Nordic countries can better understand the challenges of territorial cohesion. The background to this question emerges from the new Lisbon Treaty s requirement to institutionalise the concept of territorial cohesion placing it alongside social and economic cohesion. This institutionalisation process requires that the European Union must define the concept more clearly than has hitherto been the case. Therefore a green paper on territorial cohesion is to be produced by the EU Commission in the autumn of A preliminary definition of territorial cohesion was recently provided in a speech by Commissioner Hübner. Based on a questionnaire to the Member States the Commissioner noted that a clear shift in perceptions had already taken place from the traditional understanding, usually viewed in terms of balanced development and the reduction of territorial disparities, towards a concept which underlies the importance of the use of territorial resources to increase competitiveness and reduce disparities. Another important question here concerns the policy instruments to be used to achieve territorial policy. From the point of view of the Commission, it seems that cohesion policy does not represent a new policy field for the Community, but rather an umbrella policy concept influencing the manner in which other policies are elaborated and implemented. A Nordic point of view Seen from a Nordic perspective these preliminary understandings should be further developed or channelled in a direction such that territorial cohesion policies need to focus on supporting the potential for local communities and regions to develop globally competitive activities. Territorially differentiated approaches to policy making are thus needed. This may involve a reconsideration of strategic connectivity issues though not necessarily in relation to the European core. The notion of balance between the Pentagon and the rest of Europe is not relevant for Norden, rather it is a question of strengthening local and regional territorial capital and enhancing every region in Norden s capacity to compete in global markets. Therefore different types of regions need different types of policy support. Another important point here concerns the need to reconsider the role of regional and local actors in the elaboration of regional development strategies. In other words, the EU s territorial cohesion-policy should facilitate the involvement of regions and help them to mobilise their potentials for sustainable and globally compettive economic growth. Finally, the issue of ensuring citizens and businesses relatively equal access to service provision across all parts of the national territory remains a cornerstone of territorial cohesion policy and should continue to be recognised as such. The territorial structure of the Nordic countries From a settlement point of view, the Nordic countries can roughly be subdivided into four geographical zones: First, there are five main metropolitan regions, around Oslo, Gothenburg, Copenhagen, Stockholm and Helsinki. These regions have become larger, as the spatial range of commuting has extended. Secondly, Denmark and Scania in Sweden are characterised by a central European type of urbanisation, with a dense system of cities and towns, and a functionally integrated countryside. This area is increasingly developing into a single or a few inter-connected labour markets, with intense commuting between cities and sprawl. The Norwegian coast from Southern Trøndelag to Oslo and Lillehammer, Sweden south of Gävle and southern Finland belong to a third category, with a regular but looser system of 5
6 towns and cities that are more clearly separated in terms of labour market areas. The Northern Swedish and Finnish coasts belong to this category, and thereby highlight the increasingly challenging perspective of preserving a coherent territorial development model catering for the needs of the inland and the coastal areas in these areas. Beyond these zones, one indeed finds a specific north Nordic geographical context, facing geographic challenges in terms of sparsity, peripherality, long distances and cold climate unique in the European context. Except for border region issues, these factors all concern the vast majority of the north Nordic regions, especially if one considers that areas with harsh climatic conditions are assimilated to mountain areas. The north Nordic regions therefore must endure a combination of specific geographic impediments. It is not immediately obvious however which of these characteristics on there own should be considered as resilient obstacles to social and economic development. The only exception in this respect is sparsity, defined as a low number of persons within daily mobility distance. Sparsity leads to a series of challenges in terms of economic development and public and private service provision. Border regions may also be sparse because human resources in the neighbouring country are made unavailable. Sparsity therefore is a generic way of addressing the core challenge of the north Nordic regions. It should also be noted that sparsity, in combination with a number of social and economic trends such as an ageing population, rising energy costs and the growing pressure of globalisation are conspiring to position the north Nordic regions in a rather unique manner as seen from a broader European perspective. Long-term labour shortage demands productivity improvements Ageing and depopulation are major future challenges for the European Union. Seen from a European perspective studies at NUTS 2 level indicate that, in future, the Nordic countries will neither be better off nor worse than the rest of Europe. However a more detailed study of the Nordic countries at the municipal level indicates that considerable swathes of the Nordic countries will suffer from depopulation and ageing. The conclusion to be drawn from this more detailed study is that differences remain both between the Nordic countries - Denmark in particular appears to have few problems with ageing or with future demographic development - as well as within countries, where metropolitan areas and areas in proximity to larger cities appear to have fewer problems with ageing and future demographic development than do rural and peripheral regions. Internal differences are however particularly visible in Finland, Norway and Sweden. Ageing and potential depopulation mean that labour market adjustment will be needed. In addition, adjustments to the fact that service provision will be both public and private will also have to take place. Long-term labour shortage demands that labour should be replaced through structural changes which means technological, institutional and organisational change. For those regions that have succeeded in already undertaking such changes history shows that productivity rates have improved and that economic growth has increased. For those regions that do not currently have the capacity to undertake such changes the opposite situation will occur and the territorial cohesion will be challenged. The specific Nordic territorial structure can reinforce this picture where remote sparsely populated regions in particular will be vulnerable because of the lack of critical mass - or because they already risk falling below threshold population levels thus entering a self-reinforcing process leading to total depopulation - while the more urbanised areas in many cases will manage to undertake the necessary changes. Globalisation will further challenge the need for structural change An ongoing and significant challenge for the Nordic countries in the globalised economy remains their continuing attachment to high labour costs. Intra-Nordic regional differences 6
7 however remain small. Therefore despite lower labour productivity rates a strong economic incentive remains to move labour intensive production to other countries with lower average personnel costs. For the Nordic countries one conclusion here may be that the remaining pockets of industrial production have to be less labour intensive and instead based on knowledge. This may lead, in addition to other sorts of competitive pressure from outside, to the exhaustion of previously regionalised strongholds in specific sectors. These forces will impact on all Nordic regions in general but regions which remain dependent on often highly specialised but traditional industrial production will be more vulnerable than regions with a more diversified economic structure. The same could be said in respect of regions that are dependent on agriculture and forestry. This implies that the peripheral regions and even parts of those Nordic regions with a looser urban pattern outside the metropolitan and most densely populated regions will become increasingly vulnerable to the pressure of globalisation. A territorial cohesion policy should then enable these regions to overcome the pressure of globalisation so that the required technological, institutional and organisational changes can be undertaken. A territorially-oriented policy addressing this should then seek to involve a number of different sectors such as labour market policy, innovation policy, and education policy in addition to regional policy. The reduction of greenhouse gases will impact on regional development The Nordic countries have a higher demand for and greater consumption of energy per capita compared to the countries of southern Europe. Their dependence on fossil fuels i.e. oil, gas and coal, also remains rather high. However, in comparison with the EU15 the supply of renewable energy is higher. All Nordic countries are currently aiming for significant reductions in greenhouse gas emissions and ensuring a sustainable supply of energy. Despite the common goals, the means for replacing those energy sources causing CO2 emissions varies between the different Nordic countries due to variations in access to potential energy sources. The regional impacts of the reduction of greenhouse gases for the energy-intensive industries and production of goods dependent on heavy lift transport, as well for people living in sparsely populated areas, have yet to be thoroughly studied across the Nordic countries. Swedish studies do however indicate that the competitiveness of basic industries such as pulpand paper, the chemical industry, mining and steel may be negatively affected by rises in energy prices. This will have significant regional consequences since the energy-intensive basic industries are predominantly located in northern peripheral areas. Other studies show that people living in rural areas tend to be dependent on private cars in order to travel to work. A challenge here concerning transport in these sparsely populated areas then is that the supply of public transport remains limited. This indicates that these areas are rather vulnerable in respect of the impact of price rises in the use of private cars. In metropolitan and more densely urbanised areas strategies of regional enlargement (regionförstoring) provide a specific instance in which energy efficiency concerns may run contrary to other territorial cohesion objectives. It is frequently highlighted here that while regional enlargement helps improve the social and economic sustainability of local communities, it also leads to a higher degree of energy consumption. Regional enlargement, based on collective modes of transportation, is a possible way forward in this respect Seen from a policy point of view the making of future national and supranational energy and transport policy should then take into consideration the potential territorial impacts of new policies. The impact of climate change creates further uncertainties From a Nordic perspective the foreseen climate changes in the Northern Periphery will have great amplitude. Specific challenges thus remain for the Northern Peripheries in respect of mitigation, the reduction of CO 2 emissions and as regards broader adaptation to climate change issues. 7
8 In Northern Europe the potential consequences of climate change, including global warming, include a longer growth season and less demand for energy used for heating. Higher average temperatures may also entail greater problems with noxious insects and diseases for the forestry and agriculture sectors. In addition, more wind and rain is expected to cause floods and erosion (due for instance to higher river levels). Mitigation issues will demand increases in expenditure. As such, climate change will place new demands on efficient and proactive planning. Climate change thus presents both challenges and opportunities to the Nordic countries and particularly to their Northern areas. Climate change is linked to the socioeconomic development through its effect on natural resources and on the costs of adaptation. Adaptation will probably imply higher construction and maintenance costs for physical structures e.g. transport and energy supply infrastructures given the future forecast change towards more extreme weather patterns. Combined with higher energy prices and e.g. labour force shortages the regional impact of future climate change remains then rather uncertain. The specific potential of the Nordic urban systems As noted previously, the patterns of loose urbanisation in a sparsely populated regional context only concern the northern and eastern parts of Norden. Most of Denmark and the southernmost parts of Sweden are characterised by continental modes of dense urban networks, with intense inter-urban commuting and generalised urban sprawl. In addition, there are a restricted number of major metropolitan regions, around Gothenburg, Helsinki, Oslo and Stockholm, in which the secondary neighbouring cities are increasingly integrated. Most of the population resides in an interstitial type of region, with relatively loose networks of towns and cities. Some of these towns and cities are sufficiently close to each other to create a potential for mutual function integration (so-called regionförstoring ). This could compensate for the limited size of these towns and cities, but would also further amplify the contrast between the areas where inter-urban functional integration is possible, and those where it is not. The strategically important issues are then to what extent the Nordic areas manage to remain integrated in the relevant global networks and to develop strong positions within a selected range of sectors, which can maintain a sustainably high level of economic and social development. The degree to which European territorial and urban strategies will serve the interests of the Nordic countries depends on the extent to which they acknowledge that globalisation concerns all levels of the urban hierarchy, albeit in different ways. In terms of urban systems, the Nordic countries need, moreover, to emphasize the impact and potentials of endogenous dynamics at all levels of the urban hierarchy. Previous debates and analytical findings show that European approaches privilege macrostructures at the high end of the urban hierarchy, rather than considering towns and cities on the basis of their structuring potential on the territory. A future European territorial cohesion policy should therefore explicitly focus on the functional profiles of cities, and on the possibilities for developing proactive strategies for sustainable, endogenous growth at all levels of the urban hierachy. Towards a Nordic territorial cohesion policy What a Nordic take on territorial cohesion policy could look like is summarised in some bullet points below. The expression Territorial cohesion policies refers to the system of principles and objectives to be defined as constituting the umbrella policy concept Territorial cohesion. Different types of Nordic geographical zones and multiscalar analyses: Seen from a Nordic point of view it is very important to acknowledge that the Nordic territorial structure consists of different types of geographical zone with very different future development perspectives. These differences often disappear when pan European comparisons are made based on data at NUTS 2 level. The analyses undertaken thus far in the context of this paper tell us that, due in the main to a number of specific 8
9 structural handicaps, the northern Nordic zone will be significantly affected in the future by economic and social mega trends, often such that the territorial cohesion of the Nordic countries will be severely challenged. Moreover, even regions beyond this northern zone which remain dependent on specialised and relatively labour intensive industrial production will become increasingly vulnerable according these trends. Further multi-scalar analyses will result in a more nuanced picture both of the Nordic territory itself and of the future development challenges seen from a regional perspective. As such then territorial cohesion policy should be developed in a way that ensures that territorially differentiated approaches to policymaking below the NUTS 2 level are championed. Coordination and territorialisation of sectoral policies : The Nordic countries need to focus on an integrated development in order to use the capacity and reach growth. The underlying idea here is that the focus on territorial cohesion policies must be on fully exploiting local and regional territorial capital. Territorial cohesion policy thus needs coordination and territorialisation of sectoral policies. Here labour market policy, enterprise- and innovation policy, energy- and transport policy, rural development policy, urban development and planning together with the provision of public and private services are very important fields of policy which should be integrated into territorial development strategies. The involvement of regional and local actors in this territorialisation process is crucial. Individual policy instrument also need to be developed and elaborated in such a way that the territorial dimension implying regional differences is better taken into consideration. A good example here is that of European and national innovation policy where regional differences in the Nordic countries point to the fact that more differentiated regional innovation policies, including more sophisticated enabling instruments, are needed. The need for a thorough territorialisation of various sectoral policies is also obvious as is the coordination of the national-level implementation of EU-programmes. Here the crucial point is that this territorialisation process and coordinated implementation have to take place in such a way that the specific Nordic geographies are more fully taken into account. Territorial implications of globalisation: From a Nordic perspective, there is a need to challenge the idea that globalising trends require European territorial cohesion policies to address the balance between peripheral regions and a European core area. Instead, territorial cohesion policies need to focus on the potentials for local communities and regions to continue to develop globally competitive activities. This may involve some reconsideration of strategic connectivity issues, but not necessarily in relation to the European core. The focus rather needs to be on strengthening local and regional territorial capital and the capability to compete in global markets. Measures to facilitate the development of knowledge-intensive activities in all types of European territories play a key role in this respect. Accessibility: Accessibility measures used in European territorial policy documents do not reflect the challenges faced by the Nordic regions in an appropriate manner, particularly insofar as positive developments such as European economic and social convergence and the development of trans-european networks will reduce the relative accessibility of Norden. Instead, a focus on the concrete transport infrastructure needs of Nordic regions is needed. Polycentricity: The traditional perspective on European polycentricity, developing counterweights to the Pentagon must be rejected. Instead, the Nordic countries need to focus on the capacity of their own towns and cities to build more efficient regional 9
10 alliances for integrated development and growth. A relational understanding of polycentricity is needed. The crucial challenge here is to optimise each city s functional profile based on its position in transnational, national and regional urban systems. The focus on territorial cohesion policies must be on fully exploiting local and regional territorial capital. This implies that trade-offs may be needed between regions in terms of labour force and infrastructure. The principles of such a trade-off must presuppose an ideological stance on the redistribution of growth and a long term perspective privileging environmentally and socially robust development models. This implies that the definition of Territorial Cohesion needs to make reference to European territorial values, as was the case in the ESDP. Sparsely Populated areas: Sparsely populated areas require particular attention. The core challenge they face is the difficulty of reaching a sufficient number of people within daily commuting range to run public and private services cost-efficiently and to establish a well-functioning labour market. Current depopulation trends in sparsely populated areas implies the risk of falling below threshold population levels below which local communities enter a self-reinforcing process. A concern implies the need to incorporate social, environmental, cultural and resource-related issues into debates over territorial cohesion. This does not imply that preserving local communities is a necessary purpose of territorial cohesion, but rather that the consequences of depopulation need to be taken into account in these different respects. A territorial cohesion policy must provide a set of tools to counter the structural causes of depopulation in situations where its consequences are deemed inacceptable. Energy and transport efficiency: A territorial cohesion policy needs to consider two main energy-related issues. Firstly, a concern to promote renewable energy resources implies that one has to focus on the relative positions of energy production and energy consumption areas. Secondly, the desire to reduce overall energy consumption implies that one needs to organise the exploitation of resources in a more cost-efficient and sustainable manner. Both of these issues entails the need to develop better mechanisms for making trade-offs between access to land-based resources (requiring dispersed settlements and activities) and a reduction in transport needs (requiring concentrated settlements and activities). Regional enlargement: Strategies of regional enlargement imply that energy efficiency may work contrary to other territorial cohesion objectives. It is frequently highlighted in this regard that while regional enlargement helps improve the social and economic sustainability of local communities it also generally leads to a higher degree of energy consumption. Regional enlargement based on collective modes of transportation is one possible way., but presupposes settlement patterns which enables collective modes of transportation. Territorial Cohesion therefore needs to address the different degrees of sustainability associated with each type of settlement pattern. This implies incorporating transportation efficiency, the spatial organisation of urban services and the structuring effects of the existing infrastructure and encouraging a balanced assessment of these different parameters. Climate change adaptation: Territorial development patterns can contribute to mitigation by facilitating collective modes of transportation and reductions in fossil-fuel consumption. Adaptation to climate change is difficult to incorporate in territorial cohesion policies, insofar as the impacts of climate change remain essentially unknown. This should encourage the development of precautious territorial strategies and planning, with particular attention paid to areas exposed to risks of flooding and 10
11 those with fragile ecosystems. A European approach to territorial cohesion should then incorporate a reference to robustness in view of possible climate changes. Based on these analytical outputs, some basic principles on how to defend the long-term interests of Nordic regions in European debates over Territorial Cohesion emerge: - Core-periphery contrasts in terms of accessibility are not a Territorial Cohesion issue. While Nordic regions are far away from the largest European markets, this does not determine their potential for economic development. Territorial Cohesion implies all regions have a coherent transport system, and have the connections to European and global markets required for their economic development. They must be clearly differentiated from the reduction coreperiphery. - Territorial Cohesion must incorporate polycentricity, defined as a strategy to optimise each city s functional profile based on its position in transnational, national and regional urban systems and to ensure the full exploitation of local and regional territorial capitals. European polycentricity defined as the pursuit of balance and the development of counterweights to the Pentagon should be rejected, as this definition de facto disqualifies Nordic regions from a polycentric development agenda. - Pursuing Territorial Cohesion implies facing up to the contradictions between social, economic and environmental sustainability. These contradictions are particularly obvious in the Nordic sparsely populated, mountainous and insular regions. Promoting Territorial Cohesion as a principle for making trade-offs between these different forms of sustainability is a way of highlighting its inter-sectoral nature. Territorial cohesion in this respect is an umbrella concept that may become more operational and concrete than the abstract reference to sustainability. - Territorial Cohesion is also about incorporating permanent territorial specificities in regional and sectoral policies. Nordic regions comprise extensive sparsely populated, mountainous and insular regions. These regions can make significant and substantial contributions to European growth, but in some respects need adapted policies. A Territorial Cohesion policy needs to systematise the thinking around these geographically specific areas, and specify why their challenges are different from those of regions in need of structural reform. A significant first step may be to replace the term permanent geographic handicaps with permanent geographic specificities, so as to highlight that these are areas of opportunities if the policy context is appropriate. 11
12 Introduction Nordic input to the Commission s Green Paper on Territorial Cohesion The new Lisbon Treaty, when ratified by the EU Member States, will institutionalise the concept of territorial cohesion alongside social and economic cohesion, making it one of the core objectives of the European Union. This institutionalisation implies that the Union has to define it more clearly and coherently than has been the case previously. Indeed, until now, territorial cohesion has been used as a necessary objective for the Union, while lacking political legitimacy and clearly defined instruments to achieve it. EU regional policy naturally plays a central role here, and Commissioner Hübner has long sought to tie together the agendas of both regional and cohesion policy. It is clear however that cohesion policy should not be reduced to regional policy, as its challenges have deeper repercussions which traditional regional policy instruments, such as the Structural Funds, cannot deal with on their own. Consequently, there are two main questions that should be posed in respect of territorial cohesion: - What does territorial cohesion mean? The challenge for the European Commission, and the central objective of the green paper, is to provide a clear and common understanding of the concept of Territorial Cohesion. A recent speech of Commissioner Hübner, made on the occasion of the Informal Ministerial Meeting on Territorial Cohesion and Regional Policy in Portugal, provides some initial scope for reflection. - What policy instruments should be used to achieve territorial cohesion? In what follows we seek to develop these two questions with a particular emphasis on the Nordic perspective. What does territorial cohesion mean? One of the core objectives of the Commission s green paper on territorial cohesion is to come up with a clear and common understanding of the concept. In order to do so, the Commission is consulting with the Member States and other stakeholders in order to build a broad basis for the concept. In a recent speech, on regional policy Commissioner Hübner revealed some of the preliminary results of the questionnaire. 1 In general, she points to a clear shift in the perceptions of the concept held by the Member States themselves: From the traditional understanding of territorial cohesion (usually in terms of balanced development and the reduction of territorial disparities) towards a concept which underlies the importance of the sustainable use of territorial resources to increase competitiveness and reduce disparities (a so called "mixed approach"). 2 In that sense, it seems that the perception of territorial cohesion has changed at the same time as the instruments for regional policy have been renewed, from a redistributive policy to a territory-based, proactive approach. It also appears that awareness regarding the impact of territorial specificities on regional development potential is rather low for the Member States. Commissioner Hübner states that territorial specificities (natural handicaps but also marginalised areas) are also present but less frequently mentioned in the replies as important elements of territorial cohesion. These specificities are however high on the European territorial agenda, as they occupy a prominent place in the EU 1 Only 17 out of 27 countries had answered at the time of the speech. The final responses include 26 out of the 27 EU countries, plus Norway. 2 Hübner, D. (2007). 12
13 Commission Fourth Cohesion Report, in the Territorial Agenda and in the Guellec 3 and Kallenbach 4 reports to the EU Parliament. The Nordic countries answers to the above-mentioned questionnaire indicate that there is not a common understanding of what territorial cohesion means. These different understandings are quite naturally rooted in the individual national policy-making contexts and territorial structures. They should be seen as complementary, rather than contradictory. Finland Regional solidarity Enhanced regional co-operation Sweden Use of territorial capital for good development conditions for companies Good living conditions for people emphasising territorial diversity Denmark Avoid territorial imbalances Improve territorial integration and cooperation Norway Give people the choice to settle where they want Fair distribution of growth across the country between cities and rural areas Meet the challenges of the most vulnerable regions Territorial challenges solved by common efforts The Nordic countries share the perspective that Territorial Cohesion should deal with managing the high degree of diversity European in European territories and developing some form of balance in their development. Moreover, there is a clear emphasis on the multiscalar dimension of territorial cohesion. Territorial diversity needs to be managed and promoted n a balanced way not only necessary between regions, but also within regions (e.g. in terms of settlement structure and urban-rural relationships). What policy instruments should be used to achieve territorial cohesion? Notwithstanding these different understandings of territorial cohesion, based on the specific territorial structures of each country, Nordic countries share a value-basis in terms of welfare state and perspectives on public regulation of social life that inspires their approach of Territorial Cohesion and of the political means to be developed to achieve it. From the Commission s point of view, cohesion policy does not represent a new policy field for the Community, but rather an umbrella policy concept that influences the manner in which other policies are elaborated and implemented. Indeed, if regional policy (structural funds) is often seen as the core policy for achieving territorial cohesion, the coordination and territorialisation of sectoral policies is now also playing a significant role in the process. We need a new policy platform that would encompass at the same time specific geographic characteristics (islands, peripheral areas, sparsely populated areas) and socio-economic dynamics (rural depopulation, urban deprivation) affecting EU territories at different levels ranging from the transnational to the infra-regional and local. 5 Another dimension emphasised by Commissioner Hübner is the need for greater coordination between national and Community initiatives encompassing the role of the NSRFs and Operational Programmes in achieving territorial cohesion. The intertwining of the 3 Report on the fourth report on economic and social cohesion (2007/2148(INI)). 4 Report on the Follow-up of the Territorial Agenda and the Leipzig Charter: Towards a European Action Programme for Spatial Development and Territorial Cohesion (2007/2190(INI)). 5 Hübner, D. (2007). 13
14 European and national agendas is also implicitly linked to the need to reduce disparities between regions at Community level and within Member States. 6 In this light, the answers provided by the Nordic countries to the Commission s questionnaire provide a better understanding of the policy mechanisms that ought to be considered as part of territorial cohesion policy. First of all, it seems clear that there is a need to conceive a territorially differentiated approaches to policymaking. This comes from acknowledgement of the fact that different types of regions need different types of policy support and thus the financial instruments of regional policy and other sectoral policies should be further territorialized. This means that regional development strategies should increasingly take into account pre-existing economic and labour-market conditions in order to develop more adapted and achievable goals. But, most importantly, the territorially differentiated effects of specific sectoral measures need to be assessed and taken better into account in the policy design. Second, it is necessary to consider how improved Territorial Cohesion may require an enhanced role of regional and local actors in the conception and elaboration of regional development strategies. These actors have a prime understanding of the local and regional challenges faced and their support should be used by the European and national levels to elaborate further a territorial cohesion policy (Vertical coordination). The fundamental importance of designing and implementing strategies at the appropriate functional scale, on the on hand, and of improving relevant actors sense of strategy ownership, on the other, is amply recognised both in evaluation reports and in the academic literature. The debate on Territorial Cohesion therefore needs to relate to the national situations with regards to local and regional institutional reform. Third, better coordination of policy initiatives in different sectors and at different levels should be sought. The integration of spatial planning instruments can be achieved on two main levels. On the one hand, the coordination of sectoral policy initiatives (health care, transport, energy, education etc.) taken at different territorial authorities (European, national, regional and local) ought to avoid counter-productive measures taken on different levels, and thus provide for the more efficient use of public investments. This is referred to as vertical coordination. On the other hand, the coordination of sectoral policies between them emphasises the role of cohesion policy as the crossroads of regional policy and other sectoral policies (Horizontal coordination). The Nordic countries would need to take a more explicit stance on the kind of horizontal and vertical policy coordination that is deemed desirable. Finally, the issue of service provision to both citizens and businesses in all parts of the national territory is one of the cornerstones of territorial cohesion policy. In the most peripheral and rural areas of the Nordic countries, where long distances and the lack of a critical mass are seen as a structural obstacles, this then demands the fuller involvement of the public authorities in securing access to these services and in the creation of incentives for private companies to invest in these areas. It is likely that Service of general economic interest (SGEI) will be particularly high on the political agenda during the upcoming French presidency. It is therefore of particular importance to clarify the Nordic positions on this matter. The aim of this discussion paper This discussion paper provides a first attempt to introduce the Nordic countries to the upcoming Commission-led discussions on the future of EU territorial cohesion policy. The aim is to describe the territorial challenges of the Nordic countries, to explain how the Nordic countries understand the challenges of territorial cohesion and what instruments ought to be put in place to achieve this objective. The division of the report into four main chapters reflects different perspectives on the issue. 6 Hübner, D. (2007). 14
15 First, the report highlights how the territorial structure of the Nordic countries is framing the Nordic understanding of European territorial cohesion. Special attention here is given to the northern areas of Finland, Norway and Sweden. These territories are faced with a series of permanent and structural characteristics which affect their potential for development. Second, the report describes the demographic trends of the Nordic countries, with a focus on the core issues of ageing and migration. The objective is to draw up a more nuanced picture of the opportunities and challenges these trends may lead to, and to highlight the territorial differentiation of the situations encountered. The report then identifies three overarching and emergent challenges, energy supply and demand, climate change and globalisation in Chapter 3. These challenges are among those identified in the Territorial Agenda of the European Union and even though they will have repercussions across Europe as a whole they will have specific implications for the Nordic countries. Furthermore, energy supply and demand, climate change and globalisation are nonetheless seen as factors of enhanced uncertainty, increasing dependency and vulnerability for northern Norden. Finally, the report indicates in Chapter 4 the potential for a number of proactive strategies for regional development which could be taken into considerations in the Nordic countries, as part of what can be labelled in the European context as instruments or approaches towards territorial cohesion. 15
16 1 Geographic structures in the Nordic countries This section provides a series of maps illustrating the specific geographic structures of the Nordic countries. In addition, a brief analysis of their social and economic implications is also included. From a settlement point of view, the Nordic countries can be subdivided into roughly four geographic zones (figure 1.1): First, there are five main metropolitan regions, around Oslo, Gothenburg, Copenhagen, Stockholm and Helsinki. These regions have become larger, as the spatial range of commuting has extended, and are often now formalised through wide-ranging cooperation bodies and or agreements. Secondly, Denmark and Scania in Sweden are characterised by a central European mode of urbanisation, with a dense system of cities and towns, and a functionally integrated countryside. This area is increasingly developing into a single labour market, with intense commuting between cities and sprawl. The Norwegian coast from Southern Trøndelag to Oslo and Lillehammer, Sweden south of Gävle and southern Finland belong to a third category, with a regular but looser system of towns and cities that are more clearly separated in terms of labour market areas. The Northern Swedish and Finnish coasts belong to this category, and thereby highlight the increasingly challenging perspective of preserving a coherent territorial development model catering for the needs of the inland and the coastal areas in these areas. Beyond these zones, one finds a specific north Nordic geographic context, facing geographic challenges in terms of sparsity, peripherality, long distances and cold climate that are unique in the European context. This specificity should not however lead us to underestimate the local differences in settlement patterns and development potentials characterising this part of Norden. This section will focus more specifically on the latter two types of area through the compilation of a series of maps illustrating their specific geographical structures. Some initial ideas on the potential social and economic implications of these specificities are also introduced, as a background to the further analyses of situations and trends encountered in these same areas in the ensuing chapter. The aspects covered correspond to those encountered in debates and policies concerning the north Nordic regions. These include long distances to main markets, extensive mountain areas, insular and coastal regions, isolated border regions, arctic and sub-arctic climate and demographic sparsity. The urban networks can additionally be considered as a Nordic specificity, insofar as they are resilient structures of which the geographic patterns and hierarchies constrain the options for territorial policy making. Finally, demographic trends provide some idea of the impact of these specificities on the overall development of the Nordic regions over the last decade. 16

17 Figure 1.1 Schematic typology of Nordic spaces 17
18 Long distances Industries in the northern areas of the Nordic countries face long distances in reaching their main markets. This is sometimes referred to as a major competitive disadvantage, obliviously of the competition exerted by far Eastern industries on the European market in spite of considerably longer distances. In the European Economic Area, one must presume that industries located in the periphery of the north Nordic area however remain there because this location is deemed economically advantageous. While the importance of transport subsidies is undeniable from the point of view of individual companies, and in preserving existing jobs, the overall impact on regional economic performance remains difficult to quantify. Therefore, in spite of recurrent requests from both the national and the regional authorities, the quantification of the relative disadvantages faced by northern Nordic industries as compared to similar activities in other parts of Europe have not been produced. Such a task is indeed difficult, especially as the industries that do develop in these areas are naturally ones that are less sensitive to distance to markets. Attempts to assess the impact of distance on the geography of international trade however conclude that there is little evidence to support the additional cost assumption 7. The 2004 Cap Gemini evaluation of the transport aid system in Sweden 8, which is supposed to compensate for long distances, concludes that it does not stimulate economic conversion to new or service-oriented sectors of activity, that it does not lead to the creation of new companies and is not perceived as compensating for the deficiencies of the infrastructure of for the lack of competition in the transport sector. At the European level, accessibity maps have frequently been used as an illustration of core-periphery patterns in Europe. There is a long tradition for these representations, going back to the Keeble reports in the 1980s. From a Nordic point of view, such maps confirm the unique position of north Nordic Regions. It is tempting to conclude from this that they constitute a factual underpinning for demands to improve core-periphery infrastructure, so as to reduce the extent of core periphery patterns. The paradox is however those radial connections would increase the relative contrasts between core and periphery, rather than reducing them. While Trans-European Networks, conceived as transnational links connecting all European regions in a predominantly radial pattern are part of the European integration agenda, they do not necessarily constitute an appropriate answer to north-nordic challenges in terms of accessibility. The relative absence of transnational TEN in north-nordic regions does not need to be problem, insofar as the primary accessibility challenges are found within region and between neighbouring regions. Industries in North Nordic regions indeed experience problems of network congestion (bottlenecks), low reliability (due to the climate, and to the lack of alternatives when a problem occurs) and unsatisfactory handling and distribution services (high costs, no possibility of next day delivery). These industrial needs must be identified carefully, rather than advocating transnational links that may have more effect on the visual cohesion of European TEN maps than on the territorial cohesion of the concerned region. 7 Chisholm, MDI. (1995). 8 Cap Gemini (2004). 18
 and Figure 1.2 (left): Potential road accessibility to Gross Regional Product (by 2.5x2.")
19 Figure 1.1 (right): Potential road accessibility to population (by 2.5x2.5 km grid cells) and Figure 1.2 (left): Potential road accessibility to Gross Regional Product (by 2.5x2.5 km grid cells) Extensive mountainous areas The Nordregio report on Mountain areas in the Europe 9 demonstrated that significant proportions of the north Nordic regions are mountainous, especially if one assimilates Swedish and Finnish regions with harsher climate than the most exposed peaks of continental Europe to mountain areas. Using these criteria, Norway has 92% mountainous areas, while the corresponding figure is 19% in Finland has 51% in Sweden. The proportion of population living in these mountain areas is 63,4% in Norway, 12% in Finland and 6.9% in Sweden. Mountainous topography creates specific challenges, particularly in terms of accessibility and ecological vulnerability. There are also a number of opportunities, for example in terms of tourism, life quality and access to hydro-electric energy. The main feature of European mountain regions is however their great diversity, and the existence of strong local contrasts between neighbouring areas. From a European point of view, the challenge is to use statistical evidence that reflects these local gradients rather than NUTS3 or NUTS2 data that evens them out. In terms of ecosystems and agricultural production, mountain areas are a particularly fragile type of environment, where human intervention is often needed to preserve landscapes and natural equilibriums. A sustainable development of the forestry industry, especially in the context of increasing demand for biomass and bio fuels, is a particularly important issue in the Nordic countries. In this respect, it is important to note that depopulating trends and abandoned infrastructures (railways) make a range of remote or mountainous forest resources 9 Nordregio (2004). 19

20 unavailable. These trends are guided by current economic profitability patterns, but may make it more difficult to adapt to a changing energy situation in the future. An assessment of potential resource needs in a long term perspective may guide policies in mountainous areas and in areas assimilated to mountains. Figure 1.3: Mountain areas and areas assimilated to mountain areas according to climatic criteria 20

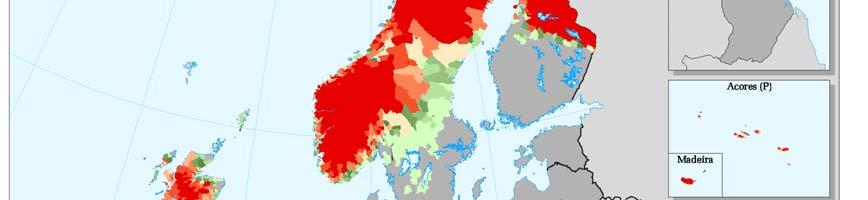
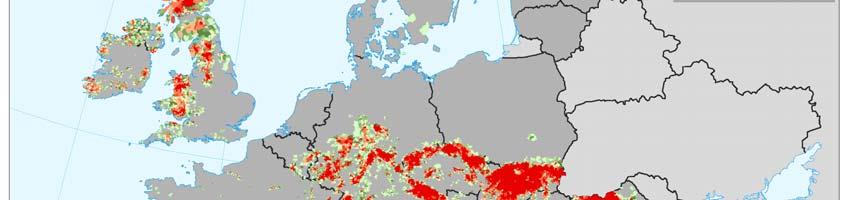
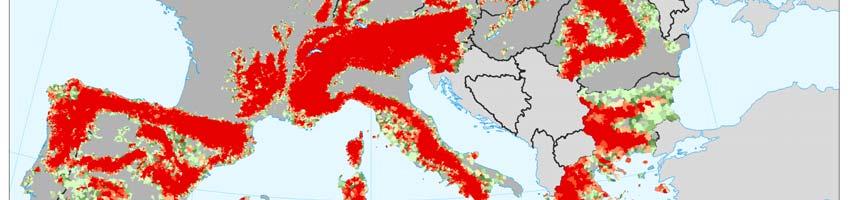
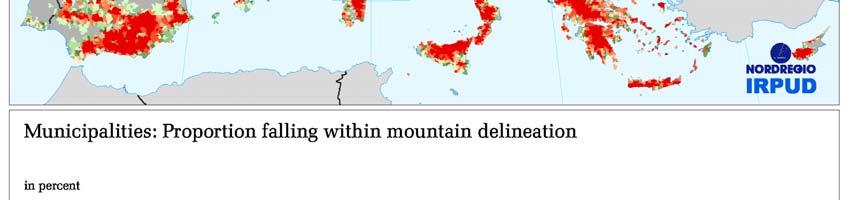
21 Figure 1.4: Proportion of mountain areas and areas assimilated to mountain areas per municipality 21
. In the north Nordic context, insularity is mainly a Norwegian concern.")
22 Insular and coastal regions Insularity is a particularly difficult topic to analyse systematically in Europe, as defining and delimiting islands is much more complicated than for mountain areas (see Report on Insular and Ultra-peripheral regions of the European Union, Planistat Europe, 2003). In the north Nordic context, insularity is mainly a Norwegian concern. Most regions of north Norden are however coastal, and many are members of the Conference of Peripheral Maritime Peripheries (CPMR see figure 1.5) Figure 1.5: Member regions of the Conference of Peripheral Maritime Regions Interestingly, the term insular is increasingly being used in a metaphorical sense. Insular labour markets for example do not correspond to labour markets on islands, but to those functioning in relative isolation. This suggests that economic and social characteristics similar to those of islands may also be found in for example sparsely populated areas. This however does not imply that insular and coastal regions do not have unique specificities. The European Union maritime policy has been formulated in a European Commission communication 10 published in October Among the strategic issues identified in this Blue Book, one finds the formulation of a Roadmap for maritime spatial planning by the Member States, the promotion of Integrated Coastal Zone Management (ICZM) and the need to mitigate the effects of Climate Change on coastal region. The Green Book on Territorial Cohesion must therefore be coordinated with the conclusions of the Blue Book on Maritime policies. This also suggests that, while the use of insular in the metaphorical sense makes perfect sense from an economic and social development point of view, it also important to deal with islands as such, and the specific maritime issues relating to their development

23 Isolated border regions The predominant territorial context, both in terms of economic exchanges and urban systems, remains the nation. Border regions are generally characterised by their relative peripherality in relation to these system, which they may compensate for by developing interface functions. Location between national systems with different wage levels, taxation principles and welfare systems may have territorially and socially disruptive effects in some cases. Along the outer borders of the European Economic Areas (EEA), relative isolation from the respective national system is reinforced by customs barriers. Border regions throughout Norden are characterised by cross-border commuting and trade. The Russian border is however specific because of the differences in wealth that are very high even in a global perspective. This discontinuity creates tensions that do not necessarily have dramatic immediate effects but which nevertheless must be borne in mind when taking a long term territorial development perspective. The focus on territorial cohesion and on the necessary cross-border cooperation between local and regional actors is an efficient way of creating stable relations with a country whose democratic traditions are still weak. A border barrier entails both a short term obstacle to development and a long term potential for economic prosperity. A situation of relative isolation along a closed border may develop into a strategic position for cross-border trade. The uncertainty around how and when this change may occur creates a challenge for regional development policies, as these two types of situations require quite different types of measures. There are obvious parallels with the coastal areas here as a maritime context may both be a factor of isolation and help develop a region s role as an interface for trade and communication. In this respect, climate change making it possible to open new maritime freight connections in the Arctic may change the geographic situation of the regions of Northern Norway in particular. Figure 1.6: Discontinuities along borders in Europe and in the world, illustrating the relative importance of contrasts along the Russian Nordic border 23

 but also some opportunities (winter tourism, car testing, cold climate technology, lower frequency of pests in")


24 Arctic- and sub-arctic climate The effects of climate on economic activity are real, but difficult to quantify. Cold climates create a number of additional costs (e.g. heating, snow removal, and the need for special equipment, specific standards for roads and other infrastructure etc.,) but also some opportunities (winter tourism, car testing, cold climate technology, lower frequency of pests in agriculture and forestry). The main economic costs derive from the frequency of extreme weather conditions (causing destruction and reducing the reliability of e.g. transport) and potentially from the larger amplitude of climate change. The map of temperature contrast index (figure 1.7) reflects the total accumulation of heat through the growing season and the contrast between summer and winter temperatures, and varies from -1 in areas where temperatures never exceed 0 C, to +1 in areas where the average minimum never falls below 0 C. In Europe it varies from to The unique characteristics of the north Nordic Regions in this respect are clearly illustrated by the figure below. The impact of this situation on economic activity is however difficult to assess, except, possibly, in relation to relatively higher energy consumption for heating costs and public costs for infrastructure and snow removal. The main concern is climate change, which is expected to have more dramatic consequence in Arctic and Sub-Arctic areas than elsewhere. This may create some opportunities (e.g. for fisheries and fish-farming, agriculture and tourism) but will also lead to substantial challenges of adaptation, not least for the part of the Sami population living off reindeer herding. Figure 1.7: Temperature contrast index for Europe 24

25 Sparsely populated regions Population density has been actively used as a criterion for structural fund support and as a justification for special arrangements with regards to competition rules. The justification for this special treatment of sparsely populated areas has however been weak. This has led the European Commission to challenge this special treatment in the preparatory discussions over the structural funds period, especially in view of the relatively satisfactory economic performances of the concerned regions. The objective here then is to formulate the concrete economic and social challenges deriving from Sparsity. Sparsity is generally expressed as an average population density. The dissatisfaction with the geographies resulting from the application of NUTS3 population density thresholds has however in some cases resulted in complex swapping systems, whereby individual municipalities can be excluded or included from the initial intervention of the regulation area. Figure 1.8: Average population densities in Europe This is not just a problem of delimitation. Population densities are essentially an abstract notion which fails to express the reasons for which sparse areas require specific attention. The issue in sparse areas is not that there are few persons per land unit, but that the absolute number of persons that can be reached within a commuting area or daily mobility range is low. This is reflected in a map of population potential, where one considers how many people one can find around each point within a generally accepted commuting distance. In the figure below, this distance has been approximated to 50 km air distance, but one should ideally consider a travel time (e.g. 45 minutes). This low number of people within daily mobility range has multiple effects. First, the size of the labour market will be limited. This implies that it will be forced to specialise in order to be competitive, which in turn leads to a higher degree of vulnerability to economic cycles and fluctuations. In other words, sparse areas may be prosperous for long periods of time, but economic downturns will be more brutal than other places. 25


 vary considerably depending on the scale. NUTS 3 average population densities fail to reflect a number of situations that may be perceived locally as sparse.")
26 Secondly, sparsity implies that it will be more difficult to make economies of scale in public and private service provision. This implies that some services will be absent or will depend on state subsidies to exist. From a purely economic point of view, these subsidies can be weighed against the value created by the economies of the concerned sparse areas. Other factors, such as long term sustainability, access to natural resources, landscape preservation and the concern for rural cultural heritage may also be taken into account. It is however important to bear in mind that those large agglomerations generally rely on state support for their infrastructure investments. The patterns of sparsity (blue areas) vary considerably depending on the scale. NUTS 3 average population densities fail to reflect a number of situations that may be perceived locally as sparse. On the other hand, a number of municipalities with a low population density may be sufficiently close to a significant town or city not to experience any problems related to sparsity. Figure 1.9: Population potential within a 50 km radius Urban pattern Urban and rural are the two main categories of European space applied in EU territorial policy documents (i.e. the ESDP, the Territorial Agenda and the Territorial State and Perspectives of the European Union). These categories are in many cases wrongly interpreted as equivalents of dense and sparse: the OECD definition of urban areas 11 is for example based on a population density above 150 inhabitants/km 2. The distinction between the urban/rural and dense/sparse dichotomies is particularly important in the Nordic countries, where one finds extremely sparsely populated areas which are nonetheless extensively urbanised, with most of the population concentrated in a series of isolated towns and cities. More generally, the issues facing sparsely populated areas need to be differentiated from those of European rural areas: 11 OECD (2005). 26
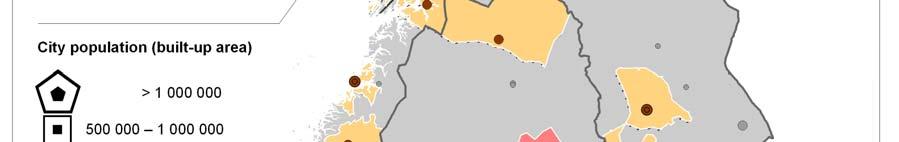
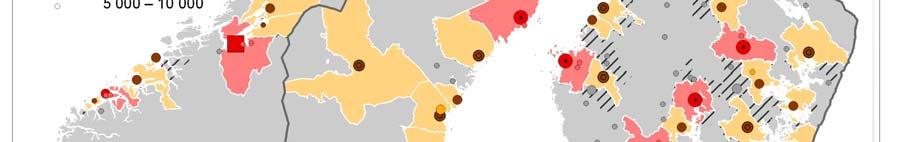
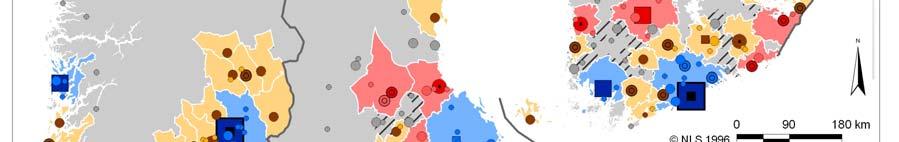
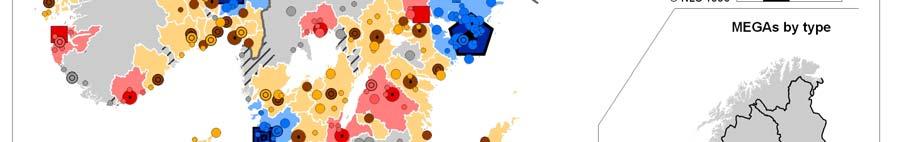
27 the challenges of developing isolated towns and cities and of managing the wide areas of wilderness separating them are not the same as those of preserving the interests of rural areas surrounded by dense urban networks. As we have already noted in the introduction, the patterns of loose urbanisation in a sparsely populated regional context only concern the northern and eastern parts of Norden. Most of Denmark and the southernmost parts of Sweden are characterised by continental modes of dense urban networks, with intense inter-urban commuting and generalised urban sprawl. In addition, a restricted number of major metropolitan regions exist, around Gothenburg, Helsinki, Oslo and Stockholm, in which the secondary neighbouring cities are increasingly integrated. Most of the population resides in an interstitial type of region, with relatively loose networks of towns and cities. Some of these towns and cities are sufficiently close to each other to create a potential for mutual function integration (so-called regionförstoring ). This could compensate for the limited size of these towns and cities, but would also further amplify the contrast between the areas where inter-urban functional integration is possible, and those where it is not. This aspect is further developed in Chapter 4. Nordic cities in European urban networks The European and global significance of Nordic urban nodes has been amply discussed, both in Nordic and European studies. It is important in this respect to differentiate between general global significance, sectoral significance and global integration. The general global significance of urban areas is based on the extent of core metropolitan function identified in the World city literature. Typically, advanced producer services, corporate command functions and the presence of major international political bodies characterise globally significant urban nodes. The number of such globally significant cities is very low, and only concerns the largest European urban agglomerations. The sectoral significance of metropolitan areas is related to the concentration of a specific type of activity, e.g. banking, international functions, or a specific type of research. Nordic cities have managed to assert their sectoral significance in a number of respects, e.g. marine trading and shipping (Oslo), Knowledge-intensive industries and finance (Stockholm), ICT research (Helsinki), Biotechnology and pharmaceuticals (Copenhagen / Øresund). The global integration of urban nodes is not necessarily related to the presence of any socalled global functions, but to the capacity of local actors to connect to the advanced producer services and global networks which may contribute to their economic and social development. A large number of Nordic cities and towns benefit from a high degree of global integration, not least peripheral towns specialising in industries based on primary resources or access to abundant energy. 27


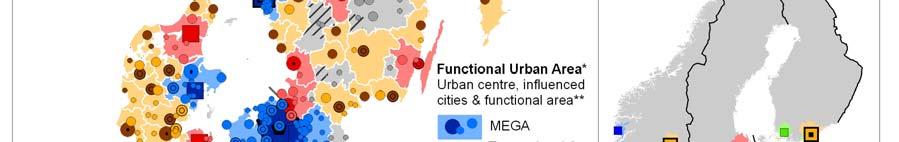
28 Figure 1.10: Intra-urban structure and polycentric integration potential of Nordic FUAs in ESPON terms 28
29 These three concepts global significance, sectoral significance and global integration can be used to critically approach the characterisation of Nordic cities made in European studies. These studies indeed often focus on mass and overall global significance, for which the Nordic areas have relatively low scores. The strategically important issues are however to what extent the Nordic areas manage to remain integrated in the relevant global networks and to develop strong positions within a selected range of sectors, which can ensure a maintained and sustainable high level of economic and social development. The degree to which European territorial and urban strategies serve the interests of the Nordic countries will depend on the extent to which they acknowledge that globalisation concerns all levels of the urban hierarchy, albeit in different ways. Typically, the ESPON 2006 programme implemented an understanding of globalisation focused on assessing the weight of large metropolitan areas in global system. Neubauer s (2007: 31) attempt to zoom-in the European results of ESPON project ( urban areas as nodes in polycentric development ) to the Nordic countries make their limitations even more obvious (Figure 1.10). Initially, ESPON considered commuter catchment areas that include at least inhabitants, and deisgnated these as Functional Urban Areas (FUAs). In total there are 1595 FUAs in the EU including Norway and Switzerland, of which 136 are located in the Nordic countries. In a second phase, the FUAs were characterised according to different functions and classified in different categories, viz. global (MEGA), transnational, national, regional and local FUAs 12. Strikingly, the cities characterised as global are the capital cities, Gothenburg and a few cities of major demographic weight (Bergen, Turku). The global sectoral significance of cities such as Stavanger (within oil and gas), or the global integration of primary producers such as Kiruna (mining), Årdal (aluminium), Tornio (stainless steel production) is ignored. Moreover, the wider regional integration around the Nordic capital cities, beyond the current area of predominant commuting to the city core, is not taken into account. As illustrated in the introduction (see Figure 1.1), the areas within which one should assess the European relevance of these cities extends considerably further out, and should for example include the Wider Oslofjord region around Oslo ( Østlandssamarbeider ), The Mälar and Uppsala regions around Stockholm and the entire Øresund region around Copenhagen. Such a focus on wider functional metropolitan regions is also a way of pinpointing the challenges of ongoing trends, e.g. extensive commuting costs, urban sprawl and increasing emissions of greenhouse gases and other pollutants. The preservation of the overall balance of the wider urban regions, in terms of living environments and economic development, requires urban evidence produced at the appropriate scale, that reflects the emergence of these polycentric metropolitan regions. The notion of polycentric integration area has thus far been applied mechanically in ESPON reports, based on the proximity between neighbouring Functional Urban Areas. The zones appearing in Figure 1.11 on the basis of these calculations, strikingly, do not include the Botniabanan area between Sundsvall and Umeå in Sweden, which is one of the most relevant areas for functional regional enlargement ( regionförstoring ) from a regional policy point of view. The Agderbyen area from Tvedestrand to Mandal on the southern Norwegian coast is also only partly identified, as it includes a number of towns that are too small to be considered relevant in a European analysis and is based on some infrastructural improvements along to the E18 highway yet to be finalised. Overall, polycentric integration in the Nordic countries requires pro-active public policies and clearly identified strategies to overcome challenging geographical preconditions (see Chapter 4 Proactive strategies). This specific perspective on polycentric integration is only partially reflected in European policy documents. 12 The FUA grouping was based on the number of inhabitants, competitiveness (GVA in manufacturing), the knowledge base (number of university students), accessibility (number of airport passengers and volume of freight at a port), access to decision making (number of headquarters of top 1500 European firms) and access to public administration (highest level of public administration located there). 29
30 The combined effect of this lack of understanding in respect of sectoral global significance and of the multiple possible types of polycentric inter-urban dynamics is revealed in the ESPON scenarios for 2030 (Figure 1.11). These scenarios are based on three types of hypotheses: the trend scenario is supposedly based on the extrapolation of current tendencies; the competitiveness scenario presupposes public policies actively seeking to maximise economic performance; the cohesion scenario presupposes public policies actively seeking to enhance territorially and socially balanced development. Analysing these maps from an urban pattern point of view, the lack of differenciation between these three scenarios is striking. Political options in favour of competitiveness or cohesion are not presupposed to having any effects on the urban structure of the Nordic countries. The only notable effect concerns the extension of the European core area, which in an hypothesis of active cohesion policies extends to Stockholm and Oslo, while it only reaches Copenhagen in the competitiveness scenario. The limited size of Nordic towns and cities in other words makes the urban dynamics of these countries totally invisible in a European perspective. Nordic regions are reduced to the rank of dependent peripheries, whose fate is determined by impulses from a presumed European core area. As such, the scenario maps perfectly illustrate a certain type of European thinking in terms of urban patterns and dynamics. In spite of a general discourse emphasising the diversity of European regions as a source of growth and development, it is difficult to overcome a approach whereby current territorial structures such as the Pentagon/periphery dichotomy are the main determinants of future development. Without denying the existence of major contrasts in current urban structures, both between Norden and the rest of Europe and within the Nordic countries, it must be a priority for Nordic countries to design analytical tools which recognise the structuring role of Nordic towns and cities in their respective regions, and focus on their endogenous capacity to develop sustainable growth. The objective is not to challenge current core-periphery contrasts in the urban patterns, but to create conditions in which the trends threatening the territorial balance of the Nordic countries and jeopoardizing the appropriate exploitation of territorial resources may be reversed. Niche -thinking is a fundamental part of these strategies; this needs to be incorporated much more fully into European urban strategies. The existence of a strong hierarchy between cities, with a corrresponding division of labour, with dynamics of increasing polarisation, functional differentiation and rehierachisation can be observe all over Europe. The increasing weight of Metropolitan regions in urban systems can be partly attributed to the spatial logic and territorial needs of the knowledge-based economy, e.g. in terms of human capital, infrastructures, milieus etc. The degree to which these needs in respect of increased concentration, as they are identified by the market, are necessary components of the knowledge economy, or contingent on a specific type of social dynamics and economic production cultures that may be reversed with appropriate policies, however remains to be determined. A political agenda for territorial cohesion therefore needs to critically challenge arguments based on the necessity of increased urban concentration, disentangling the underlying hypotheses of such affirmations. 30


31 Figure 1.11: ESPON Scenarios for Norden in 2030, based on trend extrapolation, public policies focusing on competitiveness or on cohesion 31
.")
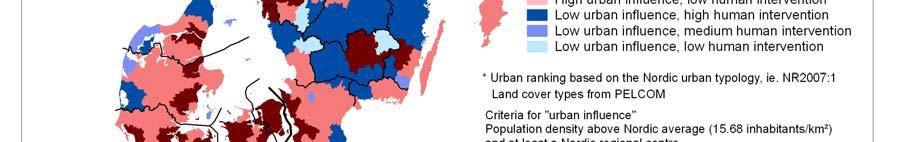
32 Typologies of urban and rural in Norden and Europe Various attempts have been made to produce regional typologies in Europe to illustrate what is urban and what is rural. The OECD has for example applied a typology that is based on population density (figure 1.12). This typology has been widely adopted as a basis for socioeconomic analysis and in the context of rural development policy. It is based on population density, both at the municipal and at the regional (NUTS 3) level. Municipalities or local communities are classified as rural or urban, according to their population density (< > 150 inhabitants/km 2 ). Regions are then classified according to the proportion of population living in rural or urban communities 13. The shortcomings of this classification in the Nordic context are obvious. The size of NUTS 3 regions and their low average population density leads to the misleading classification of most regions as predominantly rural. Only seven Nordic regions are classified as predominately urban (< 15% population in rural communities). A number of regional centres are overlooked because they belong to municipalities that are so large and sparsely populated that their average population density is considered rural 14 (figure 1.13). This is especially problematic in Sweden where municipalities are in general larger than in Finland and Norway. Consequently, cities like Uppsala ( inhabitants) and Örebro ( ) belong to regions considered 100% rural in the OECD typology. This leads to the creation of a rather misleading perspective on the development opportunities and challenges of these regions. Figure 1.12 (right): The OECD typology of Nordic NUTS3 regions Figure 1.13 (left): Population density in the Nordic Countries 13 Copus, A. (2007). p Copus, A. (2007). 32

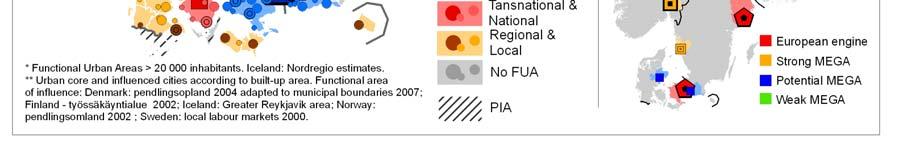
33 The ESPON study has applied a wider perspective. It s typology combines population density with the status of the leading town of the NUTS 3 area and the main land use types. On this basis, a classification into six types of rural-urban structure was established. The more function-oriented dimension was labelled as urban influence, the more structure-oriented dimension as human intervention. But even this more nuanced type of approach leads to a misleading representation of the Nordic countries as rural areas in all regions outside of the capitals insofar as it is based on European average values and NUTS 3 regions. Schmidt- Thomé & Vihinen (2006:44-45) have highlighted these limitations of the analysis. Neubauer (2007:32) has applied the ESPON urban-rural typology on the local level for the Nordic countries (figure 1:15). In this map the ESPON FUA typology has been replaced by the Nordic urban typology and Corine land cover has been replace by PELCOM. This map demonstrates that proper account of Nordic patterns of urbanisation requires analyses at the municipal scale, and the use of reference values adapted to the specific geographical context of Norden. The limited significance of population density has been exemplified by Gløersen et al. (2006). Considering three areas of the same size (i.e. a circle with a 50 km radius) and with the same population ( inhabitants) around Tromsø, Östersund and Mikkeli, one can observe very different settlement structures. In other words, population density is not necessarily an appropriate indicator to address specific challenges at the regional level, rather a closer inspection of specific settlement pattern is needed to fine-tune policies with, for instance, regard to a better provision of social services in the region concerned. Figure 1.14: Variations of local settlement structures around three Nordic cities (Source: Gløersen, E. et al. (2006) More generally, significant internal differences exist between settlement patterns in the Nordic countries. This is quite obvious when observing population figures by 1 1 km grid 33
34 cells. 82% of these cells contain no population in Norway (Svalbard excluded), while the equivalent figures are 72% in Sweden and 66% in Finland, and only 3% in Denmark. A cross-analysis of settlement patterns (share of population living in built-up areas) and population densities is therefore needed to allow for a more nuanced differentiation of development challenges across Nordic peripheral areas. Sparsely populated areas with concentrated settlement patterns face different types of challenges than those with dispersed settlement, as the perspectives for cost-efficient infrastructure development and public service provision vary correspondingly. The social and economic impact of sparsity needs to be approached in a more nuanced manner then in large parts of northernmost Norway and Sweden. Eastern Finland on the other hand experiences an extremely dispersed settlement pattern, combined with relatively low overall population density figures. This differentiation of Nordic peripheral areas justifies the formulation of tailor-made solutions for each type of territory. 34


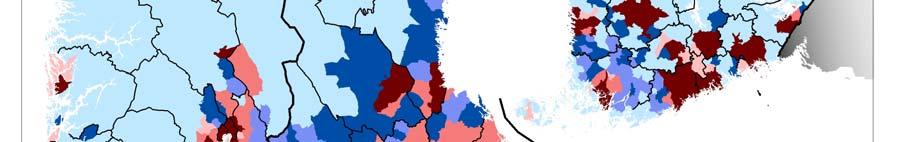
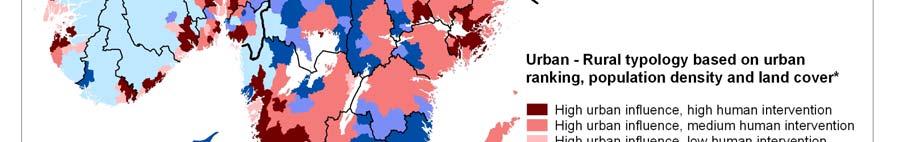
35 Figure 1.15: The urban and rural Norden by ESPON measures 35


36 Figure 1.16: Cross analysis of settlement patterns and population densities 36
 (fig. 1.17) demonstrate that the main regional challenge is not the concentration of population to the main metropolitan areas, but the reorganisation of population within each region.")
37 Demographic trends Demographic trends over the last 15 years (January 1993 January 2008) (fig. 1.17) demonstrate that the main regional challenge is not the concentration of population to the main metropolitan areas, but the reorganisation of population within each region. With few exceptions generally linked to the development of tourism and leisure, population is concentrating in a selection of towns and cities. These areas of demographic growth are generally well-spread across each country. The main exceptions are the inland parts of northern Finland, eastern Finland and northern Sweden, where extensive areas of population decline can be found. The large size of municipalities in Sweden may however partly explain the absence of localised spots of demographic growth in the maps. Considering the shorter time span of the last 5 years (January 2003 January 2008), one observes a generally improving situation, with a larger number of demographic growth spots emerging, especially in Sweden and Finland. The population decline of inland northern Finland, eastern Finland and northern Sweden however seems to be constant and steady. Figure 1.17: Population change in Nordic municipalities (left) and (right). The Nordic countries therefore face a demographic reorganisation at a geographic scale level which is generally not considered relevant in European studies and analyses. It is essential then to integrate this level of analysis to be able to argue in favour of the need for adapted policies at the European level. The specific challenges of Nordic inland areas facing constant and alarming population decline also need to be highlighted. The availability of the specific resources of these regions, especially in terms of forestry, will be reduced if ongoing demographic trends are allowed to continue. 37
38 Concluding remarks To summarise, we have reviewed a series of specific geographic characteristics of the Nordic countries and especially the Northern areas of Finland, Norway and Sweden: - long distance to main markets, - extensive mountain areas, - insular and coastal regions, - isolated border regions, - arctic and sub-arctic climate, - demographic sparsity. - an extremely diffused urban system with sharp differences regarding settlement structures, functional profiles and centralities Except possibly the border region issues, these factors all concern the vast majority of the north Nordic regions, particularly if one considers that areas with harsh climatic conditions are assimilated to mountain areas. The north Nordic regions therefore face a combination of specific geographic characteristics. It is however generally not undisputed that these characteristics should be considered to constitute resilient obstacles to social and economic development. The only exception in this respect is sparsity, defined as a low number of persons within daily mobility distance. Sparsity leads to a series of challenges in terms of economic development and public and private service provision. More generally, sparsely populated areas need to actively promote the specific advantages they have to offer, against a generally promoted standard urban and suburban lifestyle. A specific and concrete challenge in the context of a knowledge economy is the absence of specialised higher education facilities in sparsely populated regions. This entails that sparsely populated regions need to find ways of actively attracting youth segments that have finished their studies, in order to survive. It is important to note that, in this understanding, sparsity includes insular and mountainous areas. From a social and economic point of view, it is not relevant whether the obstacle to reaching a sufficient number of people is the sea, the topography or long distance. Border regions may also be sparse because human resources in the neighbouring country are made unavailable. Sparsity therefore is a generic way of addressing the core challenge of the north Nordic regions. The following chapter therefore mainly address the social and economic implications of sparsity. In terms of urban systems, the Nordic countries need to emphasize the impact and potentials of endogenous dynamics at all levels of the urban hierarchy. Previous debates and analytical findings show that European approaches privilege macrostructures at the high end of the urban hierarchy, rather than considering towns and cities on the basis of their structuring potential on the territory. A more explicit focus on the functional profiles of cities, and on the potential to develop pro-active strategies for sustainable, endogenous growth at all levels of the urban hierachy, is still needed. In this respect, a significant discrepancy can be observed between the overall European territorial discourse, focusing on regional diversity as a source of prosperity and development, and the concrete analytical perspectives and policy options that are proposed. The promotion of more balanced views of urban dynamics in the Nordic countries can therefore be based on the currently prevailing discourse on territorial development. Nordic demographic trends therefore offer a convincing demonstration that individual capacities, and comparative competitive advantages can lead to overall development in a wide range of towns and cities. Overcoming the structural challenges in areas falling below the threshold levels of local demographic and economic mass however seems very difficult. The issue is then to manage the ongoing local reorganisation of regions, encouraging development projects wherever they appear possible and managing the decline in all other parts, so as to minimize its social consequences. 38
39 A rationale based on current economic cost-benefit calculations however does not offer a sufficient basis for territorial strategies. National and European regional policies also need to preserve a long-term perspective, especially in terms of access to resources. A changing context in terms of climate, access to energy and overall mobility may significantly change the livelihood conditions of local development projects, e.g. based on bio-energy or mineral resources. A short-term perspective on profitability may, moreover, reduce the availability of the very resource endowments which may come to be seen as essential assets in the medium to long term. 39
40 2 Social and economic characteristics of the Nordic Countries This section will focus on the social and economic characteristics of the Nordic Countries at the local and regional levels, demonstrating that the Nordic countries economic, social and demographic patterns are rather divergent. From a Nordic perspective it is important to stress that significant territorial differences exist at both the inter-regional and the intra-regional scale. Consequently, scale matters when the social and economics characteristics of the Nordic regions are presented. Ageing Ageing has more dramatic consequences in depopulating local communities, where it can be a major challenge to the maintenance of basic public service provision. Depopulation In the context of European spatial planning, the notion of depopulation describes an actual or foreseen great diminution of population numbers, determined by structural causes such as an enduring pattern of out-migration, of gender imbalance and/or of insufficient fertility. Depopulation generally carries ominous signs of social and economic decline. It should be differentiated from population decline, which is reduction of population of smaller amplitude and of a less enduring nature. These two types of areas need to be differentiated in terms of territorial strategies. Within depopulating areas, different options can furthermore be envisaged, from pro-active policies countering the structural causes of depopulation to the managed disappearance of local communities. Negative population trends can have socio-economic implications related to distortions in the age-pyramid. Particularly far-reaching consequences are observed when a demographical thinning-out process affects already sparsely populated (and often remotely located) areas, when the population falls figures fall below critical threshold levels for cost-efficient private and public service provision. From the 1960s onwards, some peripheral parts of the Nordic area have even experienced complete depopulation in the sense that entire local communities are emptied of population and literally die out. In one or more of these senses, throughout the previous century, then the notion of depopulation has been discussed in national and European terms as well as with reference to sub-national uneven territorial development. A European study 15 has been undertaken at NUTS 2 level combining 7 indirect/structural indicators which may potentially lead to depopulation. This analysis covered the European Union, plus the candidate countries, Norway and Switzerland 16. The results (figure 2.1) show that challenging demographic situations are encountered in large parts of the Nordic countries, as well as the rest of Europe. The results do not however indicate whether the Nordic countries will be either better or worse off than the other studied countries. 15 ESPON 1.1.4, 16 The share of children 0-14 years in 2000, the share of persons 65+ years in 1995, the post-active dependency ratio in 2000, the number of persons over 65 years divided by the number of persons aged 15-24, the share of population aged divided by the share of population aged 20-64, the natural growth potential 2000 and the labour force replacement ratio in
41 As the population will become increasingly older in certain areas the labour market will need to adjust. Even consumer needs and preferences will probably change in the wake of demographic transformation while certain areas will be relatively more influenced by the upper segment of the age-pyramid. Ageing will not however impact uniformly on regions. Given the diversity of the impact on regions, the necessity to adapt to their demographic circumstances will require different measures in different regions. This requires that statistical analysis and research be carried out at a more detailed territorial scale taking into account the fact that demographic trends constitute only one among a large and complex set of factors influencing socio-economic development. Nevertheless, while these broad demographic trends remain the most predictable factors here it should be acknowledged that they are traditionally seen as the outcome rather than the cause of socio-economic change. 17 g # Reykjavik Canarias Guadeloupe Réunion Martinique Oslo # Stockholm # Helsinki # Tallinn # Guyane Riga # Madeira Dublin # København # Vilnius # Minsk # Acores Amsterdam London # # Bruxelles/Brussel # Luxembourg # Paris # Berlin # Praha # Warszawa # Kyiv # This map does not necessarily reflect the opinion of the ESPON Monitoring Committee Bern # WienBratislava # # Budapest # Kishinev # Ljubljana # Zagreb # Beograd Bucuresti # # Lisboa # Madrid # Roma # Sarajevo # Sofiya # Skopje # Tirana # Ankara # Athinai # Nicosia # Valletta # Project 1.1.4, 2005 Average score on indirect depopulation indicators in 2000 very low relative depopulation low relative depopulation high relative depopulation very high relative depopulation 500 km EuroGeographics Association for the administrative boundaries Origin of data: EU 15 and CC's : Eurostat, Norway and Switzerland : National Statistical Offices. Figure 2.1 Average score on indirect depopulation indicators in Note that very low depopulation here is synonymous with no depopulation. The depiction of demographic trends at NUTS 2 level gives a very incomplete picture of the situations encountered in Nordic regions. The classification of age structures encountered at the municipal scale in the Nordic countries illustrates the wide diversity of situations encountered within each region (Figure 2.2). Families with children are typically over-represented in metropolitan areas, while the overrepresentation of younger people can be found in a wide range of regions. A majority of municipalities of the southern and western coast of South Norway, of Troms and Finnmark 17 ESPON (2005). 41
42 and of the North-Western coast of Finland for example belong to this category. Overall, the diversity of situations encountered within each region is quite striking. The municipal analysis also reveals some national specificities that were not visible at the NUTS 2 level (Figure 2.1). The highest degree of over-representation of older people is almost exclusively encountered in Finland and Sweden. This category includes some relatively centrally located rural municipalities in Finland, while it is generally found in more typically remote and sparse parts of Sweden. This extreme category is only to be found in a few isolated Norwegian and Danish municipalities. Local contrasts in age structures are therefore organised quite differently from country to country. From a territorial cohesion point of view, this reveals different types of modes of urban-rural interaction. Another even more synthetic approach is to cluster Nordic municipalities in two classes, based on key demographic indicators (figure 2.3). Put very simply, this method on the one hand identifies regions which directly or indirectly experience positive demographic development, and on the other, regions which experience demographic stagnation and decline. Consequently, the policies applied have to address these two major characteristics. A finer level of detail is however needed in order to reproduce a more complete picture of the influence of the different components. With such a limited number of clusters the major structures are identified. Characterizing the two clusters one may identify class 1 as a purely rural areas while class 2 are areas are identified as urban areas and urbanized areas with a marked urban influence. The rural areas are characterized by a very high dependency level, first of all in relation to the age group 65+. High death rates and low birth rates in combination with a dominant outmigration pattern leads to a negative growth rate. Moreover, the urban influence is very limited, as infrastructure gaps and physical distances only to a limited extent allow commuting to contribute to rural economies. Contrary to this, the urban and urbanized areas in the activity sphere of the urban centres have positive growth rates due to a combination of high birth rates and positive in-migration patterns. Even municipalities characteristic of a rural landscape are included in this group as they are close enough to larger and medium-sized urban centres to be influenced by the dynamic socio-economic conditions characterizing urban activities. Developments across the Nordic countries do however differ something which is clearly illustrated in figures 2.1 and 2.3. In figure 2.1 only Hedmark and Oppland in Norway experiences a situation with a high risk of depopulation, while the demographic indicators point in a more positive direction in the rest of Norway, as in Oslo/Akershus, Sørlandet and Nord-Norge. Denmark experiences a low risk of depopulation. In Finland the capital region (Uusimaa) and Pohjois-Suomi are not threatened by depopulation while the rest of Finland is exposed to a high risk of depopulation. In Sweden only Stockholm is in a relatively positive situation, while the rest of Sweden is either exposed to high or very high demographic risks. 42


43 Figure 2.2: Age structures in the Nordic countries. Families with children are typically overrepresented in metropolitan areas, while the over-representation of younger people can be found in a wide range of regions. The more sparsely populated municipalities of Sweden and Finland experience the highest over-representation over older people. 43


44 Figure 2.3: The Demographic Development in the Nordic Countries in two Clusters. Class 1 is identified by a high share of the age group 65+, high death rates and low birth rates in combination with a dominant outmigration pattern. Class 2 is identified as urban areas with positive growth rates due to a combination of high birth rates and positive in-migration patterns. 44
45 It undoubtedly however remains the case that the size of territorial units here matters. When looking at the Nordic regions on the NUTS2 level regional and local imbalances are more or less hidden behind the NUTS2 level average. The northern sparsely populated regions in particular are dominated by a leading city region. The regional breakdown on the municipal level can be seen here in figure 2.3. It is also important to bear in mind that the European map shows the situation as of 2000 while for the Nordic map the data relate to The cluster analysis illustrated in figure 2.3 confirms the picture for Denmark which has few demographic problems. The picture for Sweden is also, to a large extent, confirmed in relation to figure 2.1 where, outside the metropolitan areas, especially in Norra Mellansverige, Småland med öarna, Mellersta Norrland and Övre Norrland the demographic situation does not look so good. For Norway, the generally positive situation illustrated in figure 2.1 begins to look a bit more worrying in figure 2.3. The population centres around Oslo and Trondheim and those in Vestlandet and Sørlandet still appear to have few problems, but for the rest of Norway developments seem rather more uncertain. Also for Finland, figure 2.3 shows a picture which differs somewhat from that of figure 2.1 only the areas around Helsinki and Oulu experience few demographic problems, while the rest of Finland appears likely to experience problems to various degrees. The conclusion to be drawn from this discussion is that differences remain both between the Nordic countries - Denmark in particular appears to have few problems with ageing or with future demographic development - as well as within countries, where metropolitan areas and areas in proximity to larger cities appear to have fewer problems with ageing and future demographic development than do rural and peripheral regions. The differences within the countries are however particularly visible in Finland, Norway and Sweden. Maintenance of service production There is a regional relationship between demographic change, on the one hand, and public consumption and social transfers as well as the tax base, on the other. The tax base is directly linked to the size of the population in the working ages. If the tax base is too small to maintain a reasonable level of social services (consumption), tax transfers can be made from the state to the regions, or between regions, to compensate for an unfavourable age-structure. Social transfers at the national level, e.g. pensions, sickness insurance and unemployment insurance, are financed by individual contributions and national taxes, and are thus not so vulnerable to a region s age-structure. Welfare is not however produced in a homogenous manner in the Nordic countries. Healthcare, which is a public consumption good highly vulnerable to changes in the agestructure, is financed and produced at a national level in Norway. An unfavourable agestructure in some regions will be levelled out by favourable age-structures in other regions. In Sweden however, healthcare is financed and produced at the regional level. In this case, an unfavourable regional age-structure will have a negative impact on the production and financing of this public consumption good. Another example is e.g. provided by the fact that in Sweden elderly care and childcare are, predominantly, financed through local taxation and produced at a local level, which is not the case in all Nordic countries. Again, a negative agestructure will limit the ability of a particular region to maintain these locally or regionally financed social services. One possible scenario here is that municipalities with a favourable agestructure will enjoy a high level of provision in respect of social services while municipalities with an unfavourable age-structure will not. Such a development will not however promote a territorial cohesion. One may also hypothesise that extreme distortions in the age structures will lead to increases in tax revenue transfers between municipalities. 45
46 The problems of ageing, depopulation and welfare service provision are, to a large extent then, a matter of scale. They can easily be made invisible at a sufficiently wide scale of analysis (e.g. NUTS 2 or NUTS 3). The issues however remain at the local level: within municipalities, when the tax revenue becomes insufficient to finance public services and welfare systems. Within commuting areas, when the number of people within a reasonable daily mobility area becomes insufficient to offer public and private services in a cost-efficient manner and to have a functional labour market. Furthermore, most of the regions with the biggest problems in respect of ageing and depopulation are also those whose economies are most dependent on primary industries and associated industrial transformation activities. These activities have generally experienced intense growth over the last years, in a context of high international demand. They however also face recurrent phases of falling demand and economic crisis, which makes it all the more difficult to promote a sound and sustainable long-term demographic evolution. The main challenge is to support these areas when the economic context is unfavourable without creating a culture of dependence on state support. If policies to compensate for the unavoidable cyclical downturns are not maintained, it will not be possible to exploit these regions resources in an efficient way when the economic context is favourable. But it is also important to maintain constant efforts of economic restructuring and productivity gain in these demographically challenged regions. Labour shortage According to standard economic theory demand for labour depends on fluctuations in the short-term business cycle. The opportunity cost of replacing labour with capital, i.e. investing in new technology, will remain too high in a short-term perspective. The most common way of dealing with short-term labour shortages then is to pass on the extra costs to customers and taxpayers, or, if the potential for substitution between native and foreign labour is high, labour immigration. 18 If, however, the labour shortage continues, or even worsens over time (five years or more) the opportunity cost for not replacing labour with capital will become too high. Seen from a long-term perspective, labour shortage is not then simply about being short of labour but rather about lacking the capacity to adjust to ongoing structural changes in the economy. 19 The changes in the relative size of the labour force in the Nordic countries will continue to evolve over the next 20 years; the relative share of persons in working age will gradually become smaller. 20 This suggests that labour shortage will not be due to fluctuations in the short-term business cycles but rather to long-term structural causes. To solve this kind of longterm problem and adjustment to new structural conditions, in this case access to relatively less labour, is needed. According to the OECD a labour shortage occurs when the demand for labour exceeds labour supply at a specific wage level. The shortage is said to be relative if the imbalance can be fixed by a change in prices (wage or reservation wage). Otherwise the shortage is said to be absolute. 18 A high substitution potential between native and foreign labour means that the imported foreign labour can be put into production from day one without any extra costs being incurred by the employer. Jobs with a high substitution potential between native and foreign labour include e.g. construction workers, miners, and industrial workers. Lawyers and auditors have a low substitution potential as the legal frameworks are different. Professions such as e.g. medical doctors, nurses and teachers have a medium substitution potential with some language training and knowledge about e.g. how the medical system works, pharmaceuticals, and how the legal framework functions they may be interesting for employers if they are willing to invest in their presumptive employees. 19 Begg, D., Fischer, S. & Dornbusch, R. (1987).; Fallon, P. & Verry, D. (1988).; Wonnacott, P. & Wonnacott, R. (1986).; Schön, L. (1994).; Schön, L. (2000). 20 Rauhut, D., Rasmussen, R.O., Roto, J., Francke, P. & Östberg, S. (2008). 46
47 INFO BOX: Labour shortage and its implications One consequence of labour shortage is that the cost of labour will increase, which is illustrated in the figure below. When the quantity of labour, Q L, diminishes, and the quantity moves from Q 1 to Q 2, the price of labour, P L, will move from P 1 to P 2. As a result, a new equilibrium will be achieved. PL P2 P1 Q2 Q1 QL Figure: The Relation between the Quantity of Labour and the Price of Labour According to economic theory, it is possible to estimate the effects of changes in the relative prices of a factor commodity (as shown in the figure above), especially when it comes to the demand for that specific factor commodity and substitution effects. Given the assumption that an employer is profit-maximising, a shortage of a factor commodity will result in an increase in its price. As a consequence, this specific factor commodity will be replaced by another, cheaper, factor commodity. If it is labour that is in relative shortage, capital will be substituted for labour. Elliott states that the substitution effect distinguishes the firm s reaction to the change in the relative price of capital and labour, holding constant the scale of production (Elliott, Op. Cit., p. 236). Begg et al. state that the substitution effect leads the firm to produce a given output using a technique which economizes on the factor that has become relatively more expensive. Thus, a rise in the wage rate of labour leads to a substitution effect towards more capital-intensive production methods at each output (Begg et al., Op. Cit., p. 214). According to Wonnacott & Wonnacott (Op. Cit., p. 723): in a competitive, fully employed economy, the wage rate increases as productivity increases. This conveys a clear message to those producers who can no longer afford the higher wage. The message is: society can no longer afford to have its scarce labour employed in your activity. There are now too many other, more productive pursuits. This may seem harsh, but it is the sign of economic progress. An increase in wages is to be expected when labour is scarce, which leads to an increasing wage ratio in the production process. When the marginal cost of a continued increase in production is higher than the marginal cost of substituting capital for labour, institutional, organisational and technological changes will be required in order to replace the scarce and expensive factor commodity, namely, labour in production. Despite using less labour, production will be kept up due to increased productivity. This is so not only because firms are profit maximising, but also because they are cost minimising (Fallon & Verry, Op. Cit., also give an overview of the theoretical models for substituting labour for, primarily, capital.). 47
48 Absolute labour shortages thus reflect the inability to find, in the working age population, a worker with the adequate skills without transferring him/her from a similar post. 21 Thus far only long-term labour shortages have been discussed. A few words need however to be said in respect of short-term labour shortages. A labour shortage occurs when the overall number of new job openings exceeds the number of qualified new entrants in a national economy for a period of time. This does not however mean that there are not enough people on the labour market. In a market economy which the Nordic economies indeed are there is really no such thing as a true shortage. If you want more of something, you can pay more and have it. When employers say that there is a shortage of workers, what they really mean is they cannot get enough workers at the price they want to pay. Furthermore, matching problems on the labour market are usually labelled as labour shortage although matching problems have little, if anything, to do with being short of labour. Matching problems refer to problems on the labour market: 22 Geographic mobility is low and sometimes flows in the wrong direction. The insider-outsider dilemma is especially related to the phase of establishing oneself on the labour market. The best way to get a job is to have a job and if a person fails in this, their position in the social security system will be just as weak. Locking in processes to a certain profession or employer (or both!) leading to health problems, long-term sickness and early retirement. Exclusion from the labour market, which is something that those with an immigrant background experience together with labour over the age of 50, as do single mothers and young adults. A segmented labour market, with three segments, does not improve the matching process. The first segment is attractive, the second is attractive when needed, and the third is unattractive. Even if there is a shortage of labour, the labour in the third segment will not be asked for. In addition to the matching problem, labour supply is further limited due to the fact that people spend longer periods in education and enter the labour market for their first time later in their life-cycle. 23 Female Labour Force Participation The Nordic countries enjoy a higher female participation rate on the labour market as compared to the countries of Central- and Southern Europe. On many Nordic regional labour markets women constitute half or more of the active labour force. This implies that the Nordic countries cannot compensate for ageing by increasing female participation in the labour market in the way that many other European countries can. 21 OECD (2003). 22 Rauhut, D. et al., Op Cit. 23 Magnusson, L. (2006). 48
49 Denmark Finland Sweden Norway Economic activity rate for females in % EU27 average Figure 2.4: Economic activity rates for females in Denmark, Finland, Norway, Sweden and the EU in 2006, percentage. Source: Eurostat. A statistical analysis based on census data for 1970, 1980 and 1990, shows that the level of labour market segregation, by gender, is substantially higher in the Nordic countries than in other OECD countries. Finland, Norway and Sweden are highly similar regarding those occupations which are the most feminized and the largest employers of women, involving caring and household-related types of activities. These results illustrate how consistent the gender stereotyping in Nordic society is and the types of abilities and characteristics that are attributed to women. 24 The conclusion of this ILO-study is that even though the Nordic countries are in many ways model countries as far as gender equality policies and programmes are concerned, women have considerably lower status in Nordic labour markets as compared to men, and the sex segregation of occupation remains high. 25 Over the last decade there has not been any major change in developments in this respect. 26 Regional Enlargement One possible solution to the problem of labour shortage which would help mitigate the laboursupply bottlenecks in a particular labour market is to widen the commuting area, namely, to undertake a process of regional enlargement. The analysis produced by Neubauer et al (2007) shows that in Denmark almost every second employed person commutes to work across a municipal boundary whereas in Finland, Norway and Sweden it is around every third person. More commuting and commuting over longer distances results in the creation of larger local labour markets and regional enlargement. This phenomenon is clearly emergent in e.g. Sweden 27. In Norway the number of commuters is growing slowly. Seventy percent of the Icelandic population resides in commuting distance to Reykjavik city and it is also around the capital where the main commuter flows arise. Commuting is still dominated by men especially in Norway. In capital labour markets the shares are more balanced. In non-urban labour markets and in medium-sized towns men continue to dominate commuting flows. On the Copenhagen and Stockholm labour markets male commuting has declined slightly and the trend is that female commuters are increasing Melkas, H.. & Anker, R. (1998). p Ibid. p Norut NIBR Finnmark (2005). 27 ESPON (2005). 28 Neubauer, J. et al (2007). 49
50 Implications of Labour Shortage to the Nordic Countries What are the effects of labour shortage? Historically, situations of long-term labour shortage have led to labour being replaced through technological, institutional and organisational changes. This has meant that productivity improvements have resulted in increased growth. The creation of an economic surplus through economic growth is a condition of welfare. 29 If this prosperity can be spread over the Nordic countries, territorial cohesion can actually be improved by a labour shortage. The most peripheral regions with the lowest population density and the lowest capacity to adapt to structural change are those that actually have the most to gain by a labour shortage. A labour shortage could actually set off a process of structural change which could improve productivity and generate an economic surplus. Large metropolitan regions face this process of structural change continuously. Immigration patterns Nordic countries have experienced less immigration from the New Member States and from outside Europe than the Central and Southern European countries. This implies that the Nordic countries cannot compensate for the relative loss of labour caused by an ageing population through immigration to the same extent as countries in south and central Europe. Migration Flows to the Nordic Countries In the Nordic countries immigration cannot be view as a workable strategy for overcoming shortages of labour. The number of immigrants is small in some countries, for example in Iceland and Finland while the main destination country remains Sweden. The diversity of immigrants countries of origin can be explained not only by labour immigration but also by the fact that refugees have been received into the Nordic countries from across the globe. 30 Differences exist between migration flows to the Nordic countries and to the European Union as a whole: (1) the magnitude of the immigration, and (2) while countries like France, Portugal, the United Kingdom, the Netherlands, Germany, Belgium and Italy have global migration flows, migration flows to Denmark, Finland, Norway and Sweden are predominantly European or from the European neighbourhood. 31 The structural change experienced by the Nordic economies has altered the relative demand for immigrant labour in these countries, i.e. it has dropped, due to the shrinking of the industrial sector. Since production is standardised, the industrial sector can easily use immigrant labour to supplement native labour, something which service production aimed at individuals does not have the same potential to do. At the same time, the service sector has expanded significantly, especially in the urban and metropolitan regions. Nevertheless, immigrants tend to find it easier to obtain employment in the industrial sector and in the unqualified service sector, i.e. the 3D -jobs. 32 Labour immigrants from the new EU member countries constitute a minority of all labour immigrants in all Nordic countries; the majority of labour immigration to the Nordic countries comes from other Nordic countries, from old EU/EES countries and from outside the EU/EES. Table 2.1 shows the five major immigrant sender countries to the Nordic area. It is however worth noting that the major nationalities of all immigrants to the Nordic countries are Nordic nationals returning to their home country. Other Nordic countries are also common 29 Cameron, R. (1997)., Landes, D.S. (1998).; Rider, C. (1995). 30 Eðvarðsson, I.R., Heikkilä, E., Johansson, M., Johannesson, H., Rauhut, D., Schmidt, T.D. & Stambøl, L.S. (2007). 31 ESPON (2005). Op. Cit.; Rauhut, D. (2006).; Johansson, M. & Rauhut, D. (2006). 32 Rauhut, D., Heikkilä, E., Stambøl. L.S., Wilkman, S. & Johansson, M. (2007). See also Eðvarðsson, I-R. et al. (2007). Op. Cit. 50
51 countries of origin for immigrants to a Nordic country, except Iceland. 33 Furthermore, only a small part of the total immigration flow to the Nordic countries is related to labour immigration; e.g. 4.6 per cent in Denmark, 8.0 per cent in Sweden, and between 5 to 10 per cent in Finland. In comparison to most EU15-countries these figures are very low. Norway, on the contrary, has a relatively large share of labour immigrants almost 27 per cent of all immigrants to Norway are labour immigrants. 34 Table 2.1: Gross immigration by country of birth to the Nordic countries 2005 and the share of labour migrants. Source: Rauhut, D and Statistics Iceland Denmark Finland Iceland b Norway Sweden Country % Country % Country % Country % Country % 1 Europe non Germany 7,2 EU/EES 4,8 Poland 19,8 Poland 8,1 Poland 5,4 2 USA 6,9 Sweden 4,5 China 5,2 Sweden 6,7 Denmark 5,4 3 The U K 6,6 Russia 2,4 Germany 3,8 Germany 4,3 Iraq 4,7 4 Sweden 6,6 Estonia 2,4 Portugal 2,8 Denmark 3,8 Finland 4,3 5 Norway 5,7 Germany 1,1 Lithuania 2,6 Iraq 3,5 Norway 3,7 Returning natives b 42,8 n.a. n.a , , ,0 Share of labour immigrants a 4, n.a. 26,6 8,0 a. Nordic citizens are excluded since no work permit is required b. Data refers to country of citizenship Table 2.2: Immigration rules of the Nordic countries. Source: Rauhut, D. et al Country Denmark Finland Iceland Norway Sweden Official statistics (intended stay) 3 months 12 months 12 months 6 months 12 months Migration statistics in the Nordic countries are based on definitions of the civil registration system in each country. The basic condition for being classified as an immigrant in the Nordic countries is that the immigrant intends to live in the country for a specific time, which varies from country to country (See table 2.2). These differences in the definition of migration will result in relatively higher numbers of migrations in Denmark and Norway. The high share of labour immigrants to Norway can probably be explained by the length of intended stay in Norway before becoming registered as a labour immigrant. 35 Recent OECD studies show a very troublesome development in respect of the integration of immigrants into the labour markets of Sweden and Denmark. From a situation where the labour market outcomes of immigrants in the late eighties, at least with respect to employment rates, seemed relatively favourable, Sweden now finds itself with an immigrant workforce that is significantly under-represented among the ranks of the employed. The evidence concerning discrimination suggests that this is not an insignificant impediment to employment in Sweden. 36 What is especially striking in the Danish context is the fact that employment gaps relative to the native-born are across-the-board they are longstanding and they are found for 33 International crises can rapidly change the number of refugees which could alter the top five list of countries of origin. Table 2.1 only contains one explicit refugee sending country: Iraq. 34 Rauhut, D. (2007). 35 Rauhut, D., Rasmussen, R. O., Roto, J., Francke, P. & Östberg, S. (2008). 36 Lemaître, G. (2007). 51
52 both OECD and non-oecd immigrants and even for offspring of immigrants from both OECD and non-oecd countries, at all attainment levels. Even returns to Danish education are lower for children of immigrants than for children of non-immigrants. Outcomes seem to be improving recently, but the general backdrop remains. Testing results have shown that immigrants and their children were ignored in the recruitment process, even when they had similar characteristics as native Danes. 37 The situation in general regarding the integration of immigrants in Norway is similar to that of Denmark and Sweden 38 Such a poor reputation will, on the one hand, undoubtedly lead to a reduction in the supply of immigrants willing to migrate to the Nordic countries, while on the other a reduction in the supply of labour will help stimulate a structural change in the economy thus leading to productivity increases. This, in turn, will lead to an increasing prosperity and rising international competitiveness. 39 Rising international competitiveness is in line with the Lisbon Agenda goals. The wave of cheap immigration to Sweden in the 1960s actually delayed the structural transformation of the Swedish economy. As a result, when the economic crisis finally hit Sweden it was exacerbated by the continuing existence of its now obsolete economic structure. 40 The supply of cheap immigrant labour has also delayed e.g. the structural transformation of the Swiss agricultural sector. 41 Regional Distribution of Immigrants At the regional level, the capital areas and major cities have been the most attractive destinations for immigrants to the Nordic countries. The concentration of immigration to the same cities where the native population is moving in the internal migration process has thus accelerated the ongoing urbanisation process. Designated refugee-receiving municipalities have also often acted only as short-term living areas after which many refugees subsequently move to the main growth centres. In Sweden, 62% of all new immigrants entering the country settle down in the three metropolitan counties (Stockholm, Skåne and Västra Götaland). About 35% of all immigrants to Norway settle down in the Oslo area with 9% in Hordaland and 9% in Rogaland. Varsinais- Suomi and Pirkanmaa attract 8% each of all immigrants to Finland, while the Uusimaa region attracts 36%. In Denmark, the Copenhagen area attracted about 35% and the Aarhus area 13% of all immigrants to Denmark. The capital region on Iceland attracts 53% and East region 23% of all immigrants to Iceland. This indicates that the flow of immigrants does not favour the greying and peripheral regions. Looking at the immigrants (flow) is one way of analysing immigration. Another is to look at the number of foreign-born persons in a country (stock). By looking at the regional distribution of the total population and the regional distribution of the foreign-born population it is possible to see whether the foreign born population is statistically over- or underrepresented in a particular region. The foreign-born population in Sweden is statistically overrepresented in Stockholm, Skåne Västra Götaland and Västmanland, and in Norway they are statistically overrepresented in Akershus, Oslo and Buskerud. In Denmark the foreign-born population is statistically overrepresented in just the Copenhagen area, while the foreign born population in Finland is statistically overrepresented in Uusimaa, Varsinais-Suomi, Etelä Karjala, Pohjanmaa and Åland. In Iceland the foreign-born population is statistically overrepresented in East Region, which is mainly to do with the dam-building. 37 Liebig, T. (2007). 38 Djuvne, A.B. & Cavli, H.C. (2007). 39 See the section on labour shortage above and the section on globalisation in chapter Lundh, C. & Ohlsson, R. (1994). 41 Maillat, D. (1974). 52
53 Figure 2.5: The allocation of immigrants by region 53
54 The low productive and unqualified industrial jobs that labour immigrants traditionally pick up have disappeared due to the structural transformation of the Nordic economics over the last 30 years. Metropolitan areas and major cities, with an expanding service sector, have become even more important for economic growth. Parallel to this process, the potential to substitute native labour with foreign immigrant labour has declined. As a result both refugees and labour immigrants now head for the metropolitan areas and major cities in the Nordic countries refugees to get low productive and unqualified jobs in the lower segment of the service sector and labour immigrants to get the qualified jobs. 42 Notwithstanding the fact that the Nordic countries continue to fail in the integration process, the peripheral areas are again the biggest losers here. The conclusion then is that immigration is not a worthwhile short term strategy to overcome labour shortage. The economic development pattern The Northern peripheries are characterised by contrasting economic performance figures across regions. Some of these contrasts vary over time, as the sector in which an individual locality has specialised enters a phase of recession or prosperity. Overall, the Northern peripheries make a contribution to the national production of wealth, but remain, to some extent, subsidised economies. The economic structure in the Nordic regions differs from that of the EU27 average. Table 2.3 below shows than the public sector (l to q) in the Nordic regions employs a larger share of the labour force than in the EU27, a smaller share are employed in the primary and secondary sectors (a+b, c+d+e, f) in the Nordic regions than the EU27 average. All Swedish regions, except Småland med öarna, Norra Mellansverige and Övre Norrland have a larger share of persons employed in financial and business activities (j+k) than the EU27 average, as does Hovedstaden in Denmark, Oslo and Akershus in Norway and Etelä- Suomi in Finland. Etelä-Suomi and Åland in Finland and Oslo and Akershus, Sør-Østlandet, Hedmark and Oppland in Norway, Hovedstaden, Syddanmark and Nordjylland in Denmark have a larger share of employed in wholesale etc (g+h+i) than the EU27 average, while Sweden has a smaller share of employed in this sector as compared to the EU27 average. These results can be interpreted as an indication that many of the Nordic regions (and countries) have travelled further towards the structural transformation of the economy (a postindustrial service-based economic structure) than the average EU27 region. 42 Rauhut, D. (2007). 54
55 Table 2.3: Employment by economic sector at NUTS 2 level (2005). Regional share above EU27 average marked with grey colour. Source: Eurostat, Statistics Denmark. a+b in % c+d+e in % f in % g+h+i in % j+k in % l to q in % No response (1000s) Total (1000s) EU27 6,1 19,8 7,8 24, ,4 n.a ,4 Hovedstaden 0,6 9,4 5,5 25,9 20,8 37,4 0,35 914,7 Sjælland 3,9 13,6 8,4 23,2 10,7 39,7 0,39 339,7 Syddanmark 4,6 18,9 6,8 24,7 10,9 33,8 0,33 587,9 Midtjylland 4,2 17,1 7,3 23,2 11,1 35,6 0,34 624,4 Nordjylland 5,3 18,9 6,8 24,7 10,9 33,8 0,33 280,1 Itä-Suomi 9,7 17,1 6,6 19,7 9,59 37,2 0,15 268,9 Etelä-Suomi 2,5 17,8 6,4 25, ,8 0, ,1 Länsi-Suomi 6,2 23,8 6,6 20,6 10,9 31,6 0,24 586,8 Pohjois-Suomi 7,7 18,1 7,5 19,1 10,8 36,6 0,19 266,4 Åland 3,7 8,82 7,4 36,8 8,82 35,3 0 13,6 Stockholm 0,5 8,11 5,1 23,5 25,8 36,6 0,44 963,3 Östra Mellansverige 2,6 18,6 6,4 19,5 13,2 39,4 0,21 709,2 Småland med öarna 4,6 23,8 5,2 19,1 9,18 37,9 0,15 393,1 Sydsverige 2,6 16,1 6 22,8 14,3 38 0,25 609,3 Västsverige 2,3 18,5 6 22,5 14,3 36,1 0,26 877,8 Norra Mellansverige 2,9 19,6 6,7 19,8 10,4 40,4 0,24 376,2 Mellersta Norrland 3,2 13,7 6,6 21,8 12,2 42,4 0,17 172,4 Övre Norrland 2,7 14,8 6,6 19,7 10,9 45,1 0,17 235,2 Oslo & Akershus n.a. 7,9 5 27, ,5 n.a. 536,8 Hedmark & Oppland 7,8 12,2 9 24,9 7,78 38,4 n.a. 176,2 Sør-Østlandet 2,2 16,2 7,9 26,1 11,1 36,5 n.a. 433,3 Agder & Rogaland 3,1 20,8 7,5 22,8 10,8 35 n.a. 324,4 Vestlandet 4,2 17,7 7 23,9 9,77 37,4 n.a. 393,9 Trøndelag 5,2 13,4 7,7 22,3 10,3 41,1 n.a. 195,4 Nord-Norge 5 8,49 7,1 24,4 8,54 46,4 n.a. 222,6 a+b Agriculture, hunting, forestry and fishing c+d+e Total industry (excluding construction) f Construction g+h+i Wholesale and retail trade, repair of motor vehicles, motorcycles and personal and household goods; hotels and restaurants; transport, storage and communication j+k Financial intermediation; real estate, renting and business activities l to q Public administration and defence, compulsory social security; education; health and social work; other community, social and personal service activities; private households with employed persons; extra-territorial organizations and bodies In figure 2.6 the regional GDP per inhabitant in Euro (PPS 43) Norway 2004 is illustrated in indexed values (EU27=100) The wealthiest regions are Oslo, Akershus, Hordaland, Rogaland 43 Purchasing Power Standards (PPS) are a fictive currency unit that eliminates differences in purchasing power, i.e. different price levels, between countries. Thus, the same nominal aggregate in two countries with different price levels may result in different amounts of purchasing power. Figures expressed in Purchasing Power Standards are derived from figures expressed in national currency by using Purchasing Power Parities (PPP) as conversion factors. These parities are obtained as a weighted average of relative price ratios in respect to a homogeneous basket of goods and services, both comparable and representative for each country. They are fixed in a way that makes the average purchasing power of one Euro in the European Union equal to one PPS. The calculation of GDP in PPS is intended to allow the comparison of levels of economic activity of different sized economies irrespective of their price levels. It is less suited for comparisons over time. Eurostat compiles PPP and publishes them on this website 55
56 and Sør-Trøndelag, while the poorest are found in the north and in the peripheral areas in the south. In figures the regional GDP per inhabitant in 2005 for Denmark, Finland and Sweden are shown in Euros (PPS). In Denmark, only one region has a regional GDP per inhabitant in Euro (PPS) below the EU27 average for 2005; Sweden has none. 44 In Finland half of the regions have a regional GDP per inhabitant in Euro (PPS) above the EU27 average for ,0 Index EU27= ,0 150,0 100,0 50, EU27 0,0 Oslo Akershus Hedmark Oppland Østfold Buskerud Vestfold Telemark Aust-Agder Vest-Agder Rogaland Hordaland Sogn og Fjordane Møre og Romsdal Sør-Trøndelag Nord-Trøndelag Nordland Troms Finnmark Figure 2.6: Regional GDP per inhabitant in Euro (PPS) for Norway Index: EU27= Hov edstaden Sjælland Sy ddanmark Midtjy lland Nordjy lland 2005 EU27 Figure 2.7: Regional GDP per inhabitant in Euro (PPS) for Denmark Source: Eurostat. (Data / Economy and Finance / Prices). PPP and related economic indicators are constructed primarily for spatial comparison and not for comparison over time. Therefore any comparison of results of different years must be made keeping this in mind. In particular, GDP in PPS should not be used to derive growth rates. 44 Data is, however, missing for 2 Swedish regions. 56
57 Etelä-Savo Pohjois-Savo Pohjois-Karjala Kainuu Uusimaa Itä-Uusimaa Varsinais-Suomi Kanta-Häme Päijät-Häme Kymenlaakso Etelä-Karjala Satakunta Pirkanmaa Keski-Suomi Etelä-Pohjanmaa Pohjanmaa Keski-Pohjanmaa Pohjois-Pohjanmaa Lappi Åland 2005 EU27 Figure 2.8: Regional GDP per inhabitant in Euro (PPS) for Finland Source: Eurostat Stockholms län Uppsala län Södermanlands län Östergötlands län Örebro län Västmanlands län Jönköpings län Kronobergs län Kalmar län Gotlands län Blekinge län Skåne län Hallands län Västra Götalands län Värmlands län Dalarnas län Gävleborgs län Västernorrlands län Jämtlands län Västerbottens län Norrbottens län 2005 EU27 Figure 2.9: Regional GDP per inhabitant in Euro (PPS) for Sweden Source: Eurostat. In general, the Nordic regions are well off as regards the shift from traditional- to knowledgebased industries and services. A remarkable level of regional difference however remains particularly in respect of the most peripheral regions (the Northern zone, which retains a high share of employment in the primary and public sectors). These regions are highly vulnerable to fluctuations in world markets for primary produce. To conclude, the restructuring of the economy has already come a long way in the Nordic countries as compared to other EU member states. This is illustrated both by their declining employment levels in the primary and secondary sectors of the economy and by increases in the size of the service sector. It must however be stressed that the service sector is, to some extent, dependent on the manufacturing sector (see Chapter 3 and the section on Globalisation). 57
58 Conclusion The problems of ageing, depopulation and welfare service provision are, to a large extent then, a matter of scale. They can easily be made invisible at a sufficiently wide scale of analysis (e.g. NUTS 2 or NUTS 3). The issues however remain at the local level: within municipalities, when the tax revenue becomes insufficient to finance public services and welfare systems. Within commuting areas, when the number of people within a reasonable daily mobility area becomes insufficient to offer public and private services in a cost-efficient manner and to have a functional labour market. The most common way of dealing with short-term labour shortages is to charge customers and taxpayers for the extra costs or, if the substitution potential of foreign for native labour is high, labour immigration. Immigration is not however a realistic short-term strategy to overcome labour shortage, since the Nordic countries have already failed to properly integrate previous immigrants. Again the peripheral areas are the major losers here as compared to the metropolitan regions. The Nordic regions remain, in general, rather well off as regards the shift from a traditional industrial to a knowledge-based economy. Regional differences nevertheless remain. For instance, the most peripheral regions (the Northern zone) continue to boast a rather high share of their employement endowment in the primary and public sectors. These regions are then vulnerable to fluctuations in the world market for primary produce. Instead of promoting structural change these regions have often become dependent on the public sector for their survival, i.e. they benefit from an indirect subsidy by taxpayers in the south. 58
59 3 Emerging challenges This section will highlight a number of key emerging challenges focusing on how they could impact the Nordic countries and how they could affect the most Northerly parts of these countries in particular. Above all, the aim here is to reflect on the emergence of a Nordic perspective on some of the new challenges mentioned in section II of the document Territorial Agenda of the European Union. The challenges that will be addressed can be summarised under the headings, energy supply and demand, climate change and globalisation. Energy supply and demand The Territorial Agenda of the European Union states that Europe is now facing new territorial challenges related to energy supply and demand. More specifically it is stated that the challenges are: Rising energy prices, energy inefficiency and different territorial opportunities for new forms of energy supply One of the major challenges for the Nordic countries in this area relates to the fact that a higher demand for and greater consumption of energy per capita (see figure 3.1) exists as compared to the countries of southern Europe. This may be explained by the lower temperatures (see section on Arctic- and sub-arctic climate in chapter 1), higher income, energy intensive industries, low population density etc. Around 50 percent of the energy consumed in the Nordic countries is used for heating purposes. 45 Final energy consumption per capita 2004 Tonnes of oil equivalent per capita EU25 0 Luxembourg Finland Sweden Belgium Netherlands Austria Ireland Denmark Germany France U.K. Cyprus Czech R. Slovenia Italy Spain Estonia Portugal Slovakia Greece Hungary Latvia Poland Romania Lithuania Bulgaria Malta Iceland Norway Croatia Turkey Final energy consumption includes all energy delivered to the final consumer s door (in the industry, transport, household and other sectors) for all energy uses. It excludes deliveries for transformation and/or own use of the energy producing industries as well as network losses. Figure 3.1: Final energy consumption per capita. Source: Eurostat (2007). Energy supply by source varies significantly between the Nordic countries and also in comparison with the EU 15 as a whole (figure 3.2). Marked regional differences in respect of access to different kinds of energy supply sources (see figure 3.3) also exist. In respect of renewable energy for instance many hydropower stations have been constructed in the Northern Swedish hinterland and in the southern part of Norway. These areas are however 45 Bye, T. A. (2002). 59
60 rather sparsely populated. As such, significant investment resources are needed in order to transfer the energy to areas where people live and where the energy-intensive industries are located. The demand for energy thus has a strong regional dimension. Despite the fact that the energy is produced locally, the common Nordic energy market dictates that consumers can choose their energy suppliers. The territorial dimension and proximity to energy supply sources has thus become something of minor importance (even though the system remains highly dependent on its infrastructure, which demands a minimum size of market in order to be cost efficient). The development of energy supply sources is for instance dependent on the settlement structure. Here it is important to know whether it is heating or electricity that is to be transferred. Heating is much more difficult to transfer over greater distances due to the fact that heat is lost on its way. This implies, among other things, that district heating establishments are more cost effective to develop for more densely populated settlements. Energy supply by source 2005 in % Denmark Finland Iceland Norway Sweden EU -15 Renewable energy Nuclear energy Gas Oil Coal Renewable energy includes hydro-, geothermal-, and solar energy Source: Nordic statistical yearbook, International Energy Agency, IEA Figure 3.2: Energy supply by source. Source: Agerskov, U. (ed.) (2007). Fossil fuel dependency, on oil, gas and coal, remains high. In comparison with the EU 15 however the supply of renewable energy is higher. Here there is also a potential to develop this energy source in the Nordic countries (see section below). The dominance of coal, oil and gas as energy sources in combination with the high demand for energy can be seen in the comparison of the emission of greenhouse gases per person (figure 3.4). Here all Nordic countries (except Sweden) are above the EU-15 average. The reason why Sweden is below average may perhaps be explained by the fact that nuclear energy plays such an important role here. As such, Sweden s carbon-based emissions are considerably lower than those of Finland, Denmark or Norway. All Nordic countries are currently aiming to oversee reductions in greenhouse gas emission levels while ensuring the continued existence of a sustainable and secure supply of energy (figure 3.5). Denmark, Finland and Sweden have all agreed to the climate goals of the EU, which envisages that greenhouse gases will be reduced by 20 percent by 2020 as compared to 1990s levels. Norway will reduce the emission of greenhouse gases by 10 percent during the period and by a total of 30 percent by Despite the common goals, the means adopted to replace the energy sources causing CO 2 emissions vary between the different Nordic countries due to the differences in their energy sources; wind power is an option in Denmark, storage of CO 2 in Norway and bio energy and nuclear power in Sweden and Finland. 46 It is nevertheless evident that in order to be able to reduce CO 2 emissions, new energy supply sources must be developed. It is here that risks over significant conflicts or interest emerge. For instance, the fuller exploitation of water as a resource - may contradict environmental objectives. Indeed, in accordance with the Natural Resources Act Sweden has 46 See for instance Iglebaek, O. (2007). 60


61 already taken a decision not to further develop the hydro power option in its remaining pristine river environments. Figure 3.3: The electricity transmission grid in the Baltic Sea Region Bio-energy is often highlighted as an alternative renewable energy source which could be developed in the Nordic countries and especially in the Northern areas of these countries. Denmark has seen developments in respect of biogas connected to waste and also agricultural by-products such as manure. Technological and policy obstacles however remain. Existing EU agricultural policy currently precludes designated agricultural land being used for the 61
62 production of bio-energy. Land that has been in fallow for a certain period can however be recultivated with for instance salix which can be used in the production of wood chips. In connection with the production of bio-energy transport costs must also be taken into consideration since, for instance, the transport of wood chips demands a significant transport tonnage. This suggests then that this particular energy source may have a strong territorial dimension. Emissions of greenhouse gases per person in 1990 and2004 Tonnes CO equivalents per person Denmark Finland Iceland Norway Sweden EU -15 Source: UNFCCC, Nordic statistical yearbook EU-15 data from 2003 Figure 3.4: Emissions of greenhouse gases per person. Source: Agerskov, U. (ed.) (2007). The research and infrastructure for developing new energy supply sources is capital intensive. The development of renewable energy sources is thus closely connected to the technological development process. It is here that we have a connection to pro-active strategies, such as innovation policy, in order to encourage the technological development of renewable energy sources. Concerning research and development it is also important to bear in mind the developments that can be made on the demand side. The regional consequences of the reduction of greenhouse gases have not been considered to any great extent in the Nordic countries. A reduction in CO 2 emissions will, for instance, have consequences for the energy-intensive industries and for the transportation of goods as well as for people living in sparsely populated areas. As far back as the beginning of the 2000s in Sweden however concerns were raised over the competitiveness of basic industries such as pulp- and paper, energy-intensive concerns such as the chemical industry, as well as mining and steel and metal manufacturing which would all be negatively affected by a unilateral introduction of taxes on energy and/or CO 2 emissions. This may have regional consequences since these energy-intensive basic industries are located in sparsely populated counties (glesbygdslän), and mainly in the north. 47 Recent studies have also shown major regional differences in respect of CO 2 emissions in relation to value added at factor cost and use of energy (figure 3.6). This difference may be connected to the dominant sector and industries in the regions. The specific locational pattern of these energy-intensive industries undoubtedly suggests that vulnerability to increasing energy prices also varies significantly between regions. The effects of increased energy costs related to the value added at factor cost will, for instance, be higher in the counties of Gotland, Norrbotten and Västernorrland Regeringskansliet (2001). 48 ITPS (2008). p
63 Total greenhouse gas emissions, index 1990= Target EU25 EU15 Cyprus* Spain Portugal Malta* Ireland Greece Finland Austria Italy Denmark * No target under the Kyoto Protocol Belgium Netherlands France Slovenia Sweden Luxembourg U.K. Germany Czech R. Slovakia Hungary Poland Estonia Latvia Lithuania Figure 3.5: Total greenhouse emissions. Source: Eurostat (2007). US* Norway Japan Liechtenstein Croatia Iceland Romania Bulgaria Use of energy, CO 2 emissions and value added at factor cost per county 2004 Value added at factor cost Energy use CO 2 emissions SEK billion TWh kg Stockholms län Uppsala län Södermanlands län Östergötland län Jönköpings län Kronobergs län Kalmar län Gotlands län Blekinge län Skåne län Hallands län Västra Götalands län Värmlands län Örebro län Västmanlands län Dalarnas län Gävleborgs län Västernorrlands län Jämtlands län Västerbottens län Norrbottens län Sweden - total Source: Statistics Sweden, Nolby Ekostrategi Figure 3.6: Use of energy, CO 2 emissions and value added at factor cost per county Source: ITPS (2008). The discussion concerning energy supply and demand also relates to transport patterns and the consequences for accessibility which increased fossil fuel energy process may have for daily mobility levels in the sparsely populated areas of the Nordic countries. In the Nordic countries the number of passenger cars per 1000 inhabitants at the national level is below the EU 25 63
64 average (463), Denmark (354), Finland (448), Norway (429) and Sweden (456). Regional differences do however exist concerning the number of cars per 1000 inhabitants. In Sweden the number of cars per 1000 inhabitants tends to be higher in counties with a lower population density. 49 In Norway the highest figure can be found for the sparsely populated counties of Hedmark, Buskerud and Oppland, all quite close to the metropolitan region of Oslo (including Akershus). The pattern may be related to commuting (see section on regional enlargement in Chapter 4). A similar pattern can also be seen in Finland. Looking at the issue of car dependency to travel to work, the regional differences concerning driving distance per car and inhabitant do not vary to any higher extent in Sweden. 50 According to the Swedish national travel study however, people living in rural areas tend to be more dependent on a private car in order to travel to work 51. The use of a car versus public transportation for journeys to work varied greatly across regions. The use of public transportation for journeys to work was approximately ten times more common in large cities as compared to sparsely populated areas. For those who resided in rural areas, travelling to work by car was often the only alternative. Furthermore, the use of car for journeys to work was nearly twice as common in rural areas as compared to large cities. 52 A similar situation is also evident for Norway where it is stated that the sparsely populated countryside implies that less people are travelling at the same time. Due to the lack of demand for public transport the private car may be the only alternative for most journeys. 53 The regional effects, particularly in respect of accessibility and transport quality in rural areas a new means of control for fuel (for instance financial through the introduction of a tax or fee) for reducing CO 2 emissions may have, are also stressed in a response from the Swedish Institute for Transport and Communications Analysis (SIKA) to the governmental report På väg mot ett oljefritt Sverige 54. In the Norwegian answer to the questionnaire what can be understood as territorial cohesion, it is recognised that people must have the freedom to settle where they choose. Previously the encouragement to settle the whole territory of a country had a defence-related dimension. Nowadays it is often claimed that this demand is connected to the fact that this contributes to the exploitation of resources, both concerning raw material exploitation and the preservation of nature-related endowment values, available in these areas. Increased transport costs in combination with the limited potential for public transport undoubtedly however add to the difficulties connected with settling in these sparsely populated areas. A further challenge concerning the transport issue in these sparsely populated areas is that the supply of public transport modes is limited. Access to rail traffic is for instance limited in the Northern areas of the Nordic countries (see Chapter 1). The significant distances to the main markets also imply that airports are crucial for companies hoping to act on the global market. 49 SIKA (2007b). 50 The Swedish Association of Local Authorities and Regions (SALAR) has commissioned the SCB to calculate the use of petrol and diesel fuel based on driving distances within every Swedish municipality according to the Körsträckedatabasen Bilregistret (number of cars per municipality) and SCBs Statistics (number of inhabitants per municipality). 51 The National Travel Survey, RES (SIKA 2007a), contains data on the everyday movements and longer journeys made by Swedish residents between the ages of 6 and 84. The survey also collected information about the individual and the household, as well as the means of communication that were significant to travel. In total, 27,000 interviews were conducted on SIKA s behalf, corresponding to a response frequency of 68 percent. The survey was conducted on a daily basis during a one-year period, beginning in the autumn of SIKA (2007a). p Opplysningsrådet for Veitrafikken AS, Fakta om veitransport, p Kommissionen mot oljeberoende (2006). 64
65 Figure 3.7: Number of cars per 1000 inhabitants 65
66 Territorial cohesion and energy supply and demand We can therefore conclude that a comparatively high level of demand for energy in the Nordic countries compared to other European countries remains. Sparsely populated areas face particular conditions and thus have special needs in respect of accessibility while the limited potential to develop public transport systems suggests that the private car dependency ratio will remain relatively high. The effects a substantial rise in energy prices linked to the depletion of fossil fuels may have on settlement patterns and regional economic development on a medium to long term remains entirely open. The more immediate energy-related concern for territorial cohesion policies relates to strategies of regional enlargement (regionförstoring). It is frequently highlighted that while these strategies improving the social and economic sustainability of local communities, particularly in the most sparsely populated parts, they also generally lead to a higher degree of energy consumption. Only regional enlargement strategies based on collective modes of transportation, such as for example in the case of the Bothnia railway project, may overcome this dilemma. The overall territorial challenge of adapting to a changing energy supply situation can however hardly be underestimated. Insofar as clean energy sources (e.g. hydro power) may reduce the use of polluting energy sources (e.g. coal driven power stations), the main issue is not the type of energy used but the total energy consumption. It is therefore of paramount importance in a European territorial development perspective to establish a clearer picture of the energy production potential of regions (including bio-energy), of the opportunities for energy transfers between regions, and of political or technical obstacles to energy transfers. The objective is to ensure that regional initiatives effectively contribute to reduce the overall European emissions, and that emerging territorial patterns are as a robust as possible facing an uncertain energy situation. Concentration of population and activities is an unsatisfactory general solution, insofar as it reduces the accessibility to land-bound resources (typically agricultural produce, forestry outputs, bio-energy, minerals, hydro power and wind power). The definition of territorial cohesion should therefore incorporate the reference to the need for a balance between geographic settlement and activity patterns which ensure access to land-bound resources, while minimizing the demand for energy. 66
67 Climate change The Territorial Agenda of the European Union states that the new territorial challenge posed by climate change includes: Regionally diverse impacts of climate change on the EU territory and its neighbours, particularly with regard to sustainable development. Significant uncertainties remain concerning the consequences of climate change. It is however recognised that climate change will have different direct and indirect consequences for different societies and populations, resource bases and living conditions 55. It is for instance estimated that climate change in the Northern Periphery may have a greater impact than in the rest of Europe. The northern areas of Norden thus face a number of specific challenges in respect of both mitigation, in terms of the reduction of CO 2 emissions (see section on energy supply and demand), and adaptation to climate change. In Northern Europe as a whole the potential consequences of climate change, including global warming, would be a longer growth season and less demand for energy used for heating. In addition, more wind and rain is expected to cause flooding and soil erosion (due to higher water volumes in the rivers). 56 Climate change thus offers both challenges and opportunities for the Nordic countries and particularly to those regions in the northernmost areas. Climate change is also linked to socio-economic development levels through its effect on natural resources, for instance forest growth and species (flora and fauna) composition. Rising mean temperatures are expected to impose new conditions on agricultural production and forestry in the northern areas of the Nordic countries. Another potential effect of climate change here is an increase in the size of designated wetlands which may hamper tree growth and damage the already existing forest stock. A higher mean temperature also implies greater problems with noxious insects and diseases as regards both the forestry and agriculture sectors. The saw mill industry may also be affected since the quality of the timber may decrease. 57 It is also pointed out in the Stern Review: The Economics of Climate Change that climate change will have economic consequences since adaptation must be made in respect of securing infrastructure and buildings against the extreme weather conditions forecast in connection with a changing climate. This also suggests that an amended view of risk management is needed in order to guarantee an adequate societal response to the consequences of extreme weather. Furthermore, mitigation work will entail increased expenditure on these matters. Consequently, climate change will place new demands on efficient and pro active planning. Climate change is also expected to have even greater consequences for environmental and societal development in the Arctic than at medium and low latitudes, since the Arctic s environmental and human systems are particularly sensitive to changes in their physical conditions. 58 In the Arctic rising temperatures resulting in melting ice may however result in better accessibility to gas and oil resources and in new transport passages being opened. This in turn may affect the settlement and social structure of the population and may actually pose a threat to the already existing population in the area, creating the need for either massive adaptation or the environmental refugees 59. Given these changing circumstances potential conflicts of interest have also arisen between those concerned with the extraction of raw 55 Hovelsrud, G. et al (2007). 56 Blakkisrud, H. (ed.) (2008). 57 Lundmark, L. et al (2006). 58 See for instance Balance, and Blakkisrud, H. (ed.) (2008). 59 See for instance Blakkisrud, H. (ed.) (2008). 67
68 material and energy, and those in other areas such as reindeer herding, fishing, seal hunting, tourism, natural and cultural heritage protection and shipping. 60 In respect of the opportunities afforded by climate change, forests in the northernmost areas of the Nordic countries could for instance contribute to carbon capture and storage. The option of focusing on carbon capture is also discussed in connection with the production of gas in Norway. 61 Concerning carbon capture this also connects to the development of renewable energy and the second generation of bio-fuel. If you use the trees for bio-fuel they can not be used for the storage of CO 2 at the same time. There is also a Nordic potential concerning a greater access to freshwater resources in Sweden and Norway (see figure 3.8) compared to other EU countries. In Norway climate change is also expected to positively influence access to fish which will lead to increased growth in this sector. Due however to the already high productivity levels experienced in this sector this development is not expected to lead to increased employment. 62 Freshwater resources per capita, 20 years average m per inhabitant (in 2005) 0 Latvia Finland Sweden Slovenia Estonia Slovakia Hungary Austria Lithuania Portugal Greece Netherlands Luxembourg France Italy U.K. Spain Germany Belgium Poland Cyprus Czech R. Malta Norway Iceland Turkey Bulgaria Romania Data not available from Denmark and Ireland Source: Eurostat Figure 3.8: Freshwater resources per capita long-term average. Source: Eurostat (2007). Climate change also relates to energy supply and demand. Climate change is recognized as having an effect on both the supply and demand sides of the energy equation. Envisaged supply side effects include increased precipitation, increased wind and increased bio-mass. The demand side may be influenced by higher temperatures and changing preferences. 63 Preferences may for instance be influenced by the climate debate, which could increase the pressure to develop alternative energy sources and renewable energy. 64 When we are talking about energy markets in general it is hard to grasp the overall impact of climate change on the energy markets. Different energy sources are used for different purposes; some energy sources have limited transportation possibilities or introduce capacity constraints in transport facilities. This regionalizes the energy markets. Since climate change may be different from region to region this introduces even more complex impacts from climate change to energy markets Hovelsrud, G. et al (2007). 61 Blakkisrud, H. (ed.) (2008). 62 Blakkisrud, H. (ed.) (2008). 63 Bye, T. A. (2002). 64 Blakkisrud, H. (ed.) (2008). 65 Bye, T. A. (2002). 68
69 Climate change and territorial cohesion The major challenge concerning the consequences of climate change relates to the uncertainties related to the phenomenon and this dimension must be taken into consideration when strategies for adaptation and mitigation are developed at various levels. Thus far however northern Norden has been impacted to a much greater extent than southern Norden. Deeper regional analyses of the consequences of climate change, in respect of both adaptation and mitigation, remain however to be written. Such analyses are however desperately needed since the climate policies currently under development at the global, EU, and national levels must attempt to take regional differences, regarding for instance business and settlement structure and local geographical conditions, more fully into consideration. Concerning the issue of environmental status it has recently also been stated that the risk remains that the singular focus on the environmental consequences of climate change in the Northern part of the Nordic countries may draw attention away from other environmental challenges there, for instance particularly in relation to the question of radioactive waste and persistent organic pollutants (POPs) 66. Globalisation The Territorial Agenda of the European Union states the following in relation to the new challenges facing the European territory: Accelerating integration of our regions, including cross-border areas, in global economic competition, and at the same time increasing dependencies of states and regions in the world Territorial effects of demographic change (especially ageing) as well as in and out migration and internal migration on labour markets, on the supply of public services of general interest as well as the housing market, the development of the settlement structure and how people live together in our cities and regions The dominant branch of employment varies across the Nordic regions (see figure 3.9). In many regions employment is still highly dependent on one or at most a few employers or all employers belonging to one sector. 67 The main export markets for the Nordic countries remain the other Nordic countries and the EU 15 (excluding Denmark, Finland and Sweden). Thus far globalisation has not however precipitated major changes in trade relations. The dominant export commodity varies across the Nordic countries while some of these commodities remain dependent on heavy transportation. In Denmark petroleum, medical and pharmaceutical products and manufactured articles constitute the greatest share. In Finland, the largest share consists of paper and paperboard plus telecommunication products. In Norway, petroleum and gas are the major export commodities. In Sweden, medical and pharmaceutical products and road vehicles provide the highest share of export commodities. In a recent report from Nutek it was stated that increasing prices for raw materials do not necessarily imply employment growth in that sector. In Sweden, is has already been stated that a rather contradictory development can be seen to be taking place in respect of the mineral extraction branch. This branch has enjoyed high growth levels in recent years, but a corresponding increase in employment levels across the sector is not discernable. This is due in the main to a high production efficiency rates. Instead, employment in general is increasing in sectors that display a lower efficiency rate, i.e. the construction and services sector (see figure 3.9). Rising raw materials prices may thus have an impact on the growth, but there is no direct impact on employment (a phenomenon sometimes referred to as jobless growth). 68 It must, 66 Blakkisrud, H. (ed.) (2008). 67 See e.g. ITPS (2008). 68 Nutek (2007). 69
70 however, be bourne in mind that large intra-regional differences exist if a scale below the NUTS3-level is used. 69 Figure 3.9: Dominant branch of employment in 2005 based on a Nordic average 69 In the case of Sweden, large differences exist in Norrland between the coastal areas and the inland areas. 70
71 Despite the fact that the employment rate within the service sector is above the European average in every Nordic region (see chapter 2), the employment structure of the Nordic Countries is highly sectorised (see figure 3.9). The dominant branch of employment refers to the branch that has the largest relative deviation from the total Nordic average employment structure, whereas the columns show the annual average change within the sector. In general the service sector is growing all over the Nordic Countries at the cost of other sectors. The increase experienced within the primary industries in Sweden is more or less a statistical anomaly produced by ongoing changes in Swedish agricultural policy and the CAP eligible areas. In a report from the OECD it is also stressed that regional economies in general in the OECD regions have moved from production toward knowledge-intensive non-production activities. This is confirmed by the declining number of jobs within the manufacturing sector and the emergence of service jobs as the basis of most regional economies. However, it is also stated that the manufacturing sector still retains a significant economic influence in many regions given its high productivity and wage levels as compared to other sectors. The manufacturing sector also has an indirect influence on regional economies. On average, 3-4 non-manufacturing jobs are estimated to be generated by 1 manufacturing job. 70 Average personnel costs by sector in 2005 Personnel costs per employee, in Mining & quarrying Manufactu ring Electricity, gas and water supply Constructi on Wholesale, retail trade and repair Transport, storage and Hotels and communic restaurants ation Real estate, renting & business activities eu27 EU (27 countries) Belgium Bulgaria Czech Republic : : : : : : : : Denmark Germany Estonia Ireland : Greece Spain France Italy Cyprus : Latvia Lithuania Luxembourg Hungary Malta : : : : : : : : Netherlands : Austria Poland Portugal Romania Slovenia Slovakia Finland Sweden United Kingdom Norway Figure 3.10: Average personnel costs. Source: Eurostat (2007). An ongoing challenge for the Nordic countries in the new globalised economy is their traditionally high labour costs. Here inter-nordic regional differences are small. In Denmark, 70 OECD (2007a). 71
72 Finland, Norway and Sweden the average personnel costs are much higher than those for instance in the new member states. In Denmark, Finland and Sweden the average personnel costs are more than 11 times higher than in Latvia, and for Norway labour costs are, compared to Latvia, 13 times higher (figure 3.10). Labour productivity per hour worked based on PPS (purchasing power standards) remain around the EU 15 average for Denmark, Finland and Sweden, however the difference between Latvia and Sweden here is far lower than the average personnel costs (34.2 compared to 102) (figure 3.11). Despite the lower level of labour productivity there is consequently still a strong economic incentive to move labour intensive production to other countries with lower average personnel costs. In respect of global conditions we can also only speculate about what the outcome of the calculation exercise would be if the Nordic figures were compared for instance with China or India. For the Nordic countries then one conclusion here may be that the remaining pockets of industrial production are likely to be less labour intensive and to be based on knowledge (see Chapter 4 on proactive strategies). 71 Labour productivity GDP in PPS per person employed relative to EU average Index EU25= eu27 EU (27 countries) Belgium Bulgaria Czech Republic Denmark Germany Estonia Ireland Greece Spain France : Italy Cyprus Latvia Lithuania Luxembourg Hungary Malta Netherlands Austria Poland Portugal Romania : : Slovenia Slovakia Finland Sweden United Kingdom Turkey : : : : : Iceland Norway Switzerland United States : Canada : : Forecast - Canada and Turkey Estimation - Poland Working hour estimations from Belgium, Latvia, Luxembourg, Malta, Portugal, Slovakia, the United Kingdom, Iceland and Switzerland Figure 3.11: Labour productivity. Source: Eurostat (2007). GDP in PPS per hour worked Index EU15 = 100 Labour shortage and structural change The high labour costs experienced in the Nordic countries put significant pressure on labour productivity: unless high cost countries are highly productive, they will not be competitive and will thus price themselves out of the market. The projected level of population development in the Nordic countries will however increase labour costs even more. While the Nordic countries 71 Blakkisrud, H. (ed.) (2008). 72
73 will increase their populations in the coming 20 years, this population increase will take place in the urbanised and metropolitan regions; the peripheral and rural regions will however face a population decline. A declining population in working ages means that labour as a production factor will become more expensive. 72 During periods of structural transformation the demand for labour with certain competences and skills will exceed supply. Problems with mismatch and with the allocation of labour will also occur. A labour shortage occurs when the demand for labour exceeds labour supply at a specific wage level. The shortage is said to be relative if the imbalance can be fixed by a change in prices (wage or reservation wage). Otherwise the shortage is said to be absolute. Absolute labour shortages thus reflect the difficulty in finding a worker, in the working age population, with the skills required without transferring them from a similar post 73. High labour costs, in combination with a predicted future structural labour shortage, will trigger a structural change in the Nordic regions, a process which will in the long run increase their productivity and competitiveness in the global arena (see chapter 2). Structural change and regional attractiveness Each region undergoes structural transformation at the industrial level, which renders changes in the labour demand for given skills in the short and medium term. The competitive pressure from outside may originate from changes in policies or from cross-sector externalities such as a reduction in transport costs due to technological changes in the transportation sector. The pressure to attain structural change may also originate from regional trends towards the exhaustion of regional resources. The presence of bottlenecks in the labour market and the resulting potential increases in regional wages will influence individual firms location choice relative to regions with ample labour resources at their disposal. The extent to which such pressures in relation to a dearth of regional resources in respect of regional competitiveness will materialize depends on the labour market mechanisms available to individual regional labour markets which have, at a Nordic scale, previously been analyzed in a number of studies 74. The choices made by employers will through these mechanisms be interconnected with the mass of individual choices taking place in a region. Individual choices by the incumbent population will in the medium and long run change the natural labour supply. Migration to other regions will add to the problem of sufficient and qualitatively inappropriate labour. Demographic changes in the incumbent population of the region will change the natural labour supply through ageing and the amending of fertility rates. Demographic renewal from other regions is one solution through intra-national migration. A counter argument here would pertain to the in-migration and immigration of low-skilled labour that prevents the necessary regional structural changes needed to preserve international competitiveness from occurring. In-migration and immigration may therefore be seen as both the solution and the problem at the same time depending on the match of competences in the flow of migrants and immigrants relative to the needed regional processes of industrial renewal 75. Seen from a Nordic territorial context, globalization will force through a structural change in the economic structure through the increasing need for regional specialization to maintain regional competitiveness. In small and medium-sized peripheral regions this will potentially induce labour market disruptions, such as e.g. mismatch and labour shortage. This problem is legible on sub-labour markets and for key professions. Besides the guaranteeing of high salary levels a high regional attractiveness level will in future be one of the main ways of enticing qualified labour to the region. 72 Eðvarðsson, I-R. et al. (2007). 73 OECD (2003). 74 Stambøl, L.S. et al. (1997), (1999), Persson, L-O. (2001), (2004), Edvardsson, I-R et al. (2002). 75 Eðvarðsson, I-R et al. (2007). 73
74 In large and centrally located regions regional competitiveness is ensured through the existence of a diversified economic structure. In these regions structural change is a continuous process. The size and economic importance of these regions ensures a certain regional attractiveness per se. Globalisation and territorial cohesion The discussion undertaken in this chapter has shown that the structural change process and the competitiveness of the Nordic regions are influenced by several factors, e.g. high labour costs, labour shortage and globalisation. High labour costs and a limited supply of labour put significant pressure on productivity development; unless the Nordic countries are highly productive, they will price themselves out of the market. In relation to the economic challenges posed by globalisation now faced by Nordic regions the reality that even growth in some sectors, for instance mineral extraction and fishing, does not automatically entail rising employment in these sectors (jobless growth) poses significant a dilemma. High labour costs may also mandate that, in future, industrial activities will be dependent on knowledge-intensive production and a growth of jobs within the service sector in order to be competitive. Despite the high labour costs, a limited supply of labour in peripheral regions and ongoing international competition the Nordic countries are doing well as compared to other regions in the European Union when the GDP per capita in Euro at current market prices (PPS) is compared (see table 3.1). The coefficient of variance (c.v.) indicates that territorial differences in the GDP per capita in Euro at current market prices (PPS) are relatively small in the Nordic regions, approximately The coefficient of variation should be interpreted as meaning that territorial cohesion is high if the c.v. is low, and vice versa. However, it must be stressed that this is merely to provide a static picture since it displays the difference for one year only, consequently it does not show whether polarization has taken place in the last couple of years between metropolitan and more peripheral regions in the Nordic countries. 76 Table 3.1: Cohesion of GDP per capita in Euro at current market prices (PPS), 2005 North Central South East mean 24344, , , ,14 std 4363, , , ,083 c.v. 0, , , , North = Denmark, Finland, Sweden Central = Belgium, Germany, Austria, the Netherlands, France, Luxembourg, the United Kingdom, Ireland South = Cyprus, Spain, Greece, Italy, Malta, Portugal East = Estonia, Latvia, Lithuania, Poland, Czech Republic, Slovakia, Hungary, Slovenia, Romania, Bulgaria Source: Own estimations from Eurostat Although the Nordic countries have large peripheral areas, with a low population density, as well as high labour costs table 3.1 and figure 3.12 indicate that they remain highly competitive. If a country (or region) is competitive its population density is of less importance. One possible explanation for this can also be found in table 2.3 (chapter 2), where it is obvious that the Nordic countries have a significantly different employment structure by economic sector: in all Nordic regions the public service sector is larger than the average for 76 In probability theory and statistics, the coefficient of variation (C v ) is a normalised measure of dispersion of a probability distribution. It is defined as the ratio of the standard deviation σ to the mean μ: σ C V = (1) μ This is only defined for non-zero mean, and is most useful for variables that are always positive. 74
75 the regions in EU27. The presence of a large and relatively well-functioning public service sector in remote and peripheral areas will, of course, increase territorial cohesion in terms of GDP per capita. At the same time, the public sector will especially in the remote and peripheral regions be pressured by the need for efficiency. This efficiency pressure is caused by globalisation, by the composition of economic sectors and by a changing age structure in these regions. A final concluding remark here is that structural change, labour shortage, globalisation and the demand for a cost-efficient public sector will likely place peripheral regions under extraordinary pressure to perform in the future. GDP per capita in PPS - GDP per capita in Purchasing Power Standards (PPS), Index EU-25= EU Belgium Bulgaria Czech Republic Denmark Germany Estonia Ireland Greece Spain France Italy Cyprus Latvia Lithuania Luxembourg Hungary Malta Netherlands Austria Poland Portugal Romania Slovenia Slovakia Finland Sweden United Kingdom Turkey Iceland Norway Switzerland United States Japan Canada Figure 3.12: GDP per capita in PPS. Source: Eurostat (2007). 75
76 4 Proactive strategies for regional development in the Nordic countries The focus of this section is to provide an overview of some of the proactive strategies which could be used in order to promote sustainable growth across all regions of the Nordic countries. The approaches that will be addressed are innovation, regional enlargement and polycentricity. Innovation One of the most important means used to induce structural change and meet the need to compete on the global market over the last decade has been the attempt to encourage the development of new solutions and thinking stimulating both societal and technological innovation. In the current Structural Funds programme innovation is also given a high priority, which implies that it has been allocated an enhanced role in the EU regional policy field. The sparsely populated areas and the non metropolitan regions, including the northern areas of the Nordic countries, however face special challenges in respect of innovation. One important condition for regional innovation performance and potential is regional capacity. Regional capacity is influenced by regional conditions concerning i.e. higher educational institutions, dominant business sectors (such as traditional manufacturing industry, tourism), educational level of the inhabitants, mobilisation of networks, etc. One recent study has for instance come to the conclusion that more accessible areas present higher rates of innovation activity than their peripheral counterparts. However, this innovation gap is mainly explained by non-observable factors such as entrepreneurial culture. 77. The way innovation performance and potential is measured in the EU-context tends to focus on the technology way of defining innovation. Available regional data at the NUTS 2 level used for measuring innovation performance and potential in the EU context highlights regional differences within the Nordic countries (see figure 4.1). At present harmonised and comparable data is lacking for the NUTS 3 level mostly corresponding to the regional administrative level in the Nordic countries. If this were to be available regional differences would probably be magnified. Regional differences are highlighted when data for R&D expenditure and performing sector 2005 are displayed. In the EU, the Barcelona objective suggests that at least 3 percent of GDP should be spent on R&D. In this context the R&D intensity is rather high in the Nordic countries exceeding that of the USA and being in line with the Japanese situation. However, focusing on the regional administrative level (NUTS 3) marked differences in expenditure levels become evident (figure 4.2). The objective is only fulfilled by 14 out of 70 Nordic regions 78 including Iceland, the Faroes and Greenland. Except in the capital regions, high R&D expenditures were 79 made in major Nordic metropolises and some important regional centres. Norway and Oslo in particular, proves to be the exception 77 Copus, A. et al (forthcoming). 78 Denmark: 7 R&D regions. Here expenditures by administrative region are not available. Norway: Oslo and Akershus are taken as one region. 79 When comparing the volume of regional R&D expenditures (in Euro) across Norden one must bear in mind the different purchasing power for knowledge-intensive services between countries and also between regions. The major part of the expenditure finances labour costs, namely the wages of the researchers. Wage levels, however, clearly differ across Nordic borders. Consequently the same nominal amount of R&D expenditure may finance different volumes of R&D in different countries and regions in terms of worked hours. 76


77 here. However, roughly one third of the total Nordic R&D expenditure is distributed to the five Nordic capitals alone. Adding the large Swedish R&D hubs of Västra Götaland and Skåne to this group leaves somewhat more than half of the total Nordic expenditure to be distributed to all other regions. Despite this fact, the regions spending most intensively on R&D in relative terms are not the capitals but the regional centres hosting a major university such as Uppsala in Sweden. Private actors however undertake the major part of the Nordic R&D effort. The public sector stands for only slightly more than 30 percent of the expenditure outlay. Furthermore public R&D is mainly conducted at the universities. Norway does however have a comparably large public R&D sector. The overall Nordic financing mix of R&D is comparable to that of other leading industrialized nations such as the USA, Canada or Japan but more business-orientated than in the EU25 in general. Figure 4.1: Regional Innovation Performance Index 77

 shows that the metropolitan regions in the Nordic countries are strong in both science and high technology.")

78 Figure 4.2: R&D expenditure and performing sector 2005 Regional data displaying specialisation in high-tech manufacturing and/or research and experimental development in the natural sciences and engineering in Nordic labour markets (see figure 4.3) shows that the metropolitan regions in the Nordic countries are strong in both science and high technology. The further away one moves from these centres the less the focus is placed on high-tech manufacturing and/or research and experimental development in natural science and engineering. Labour markets with both a specialisation in production and research are characteristic of the capitals and other major metropolises. An average specialisation in production but strong R&D production or vice versa is characteristic of major metropolises. Specialisation in high-tech production but low R&D activity is found in regional centres close 78
79 to capitals or the major metropolises. In some Nordic countries there are also some examples of specialisation in R&D in some peripheral regional centres. These centres have a university of importance, i.e. Rovaniemi, Kupio and Tromsö. Labour markets with neither high employment in high-tech manufacturing or research and development in natural sciences are evident in regional centres, small and medium-sized cities and non-urban labour markets at a distance from major metropolises. These labour markets could be seen as peripheral. 80 Smaller and peripheral labour markets may however have local economies based on innovation processes. Innovation processes could thus be analysed in the light of local economic life. This perspective emphasises the fact that innovation is not only about high-tech, but it has also concerns the adaptation capacity of local industries to changing economic environments. Regional differences in the Nordic countries point to the need for a more highly differentiated regional innovation policy including more sophisticated enabling instruments. 81 The Structural Funds programme for has a strong emphasis and significant resource levels allocated to innovation measures; here different approaches are needed for advanced and less developed regions. Thus far the policy has been rather mainstreamed towards the development of high technology and research and development. A new approach may however be needed in order to reach other segments of the economy which could then develop other kinds of (societal) innovation, for instance in respect of organisational and process-based concerns as well as innovations within the public sector (not least seen in the light of the growing dependency rate and future labour shortage). In order to assess the potential to develop innovation policies aimed at different regional contexts in Norden, one also needs to change the way in which innovation is conceptualised and measured. Current approaches have a strong bias in favour of R&D environments in major cities. 82 In Figure 4.4, Nordic university towns/cities are displayed by their importance. The ranking is qualitative and based on the World University ranking of JTU (Institute of Higher Education Shanghai). Nordic universities of global or European importance are located to capitals or other major metropoles. There are, however, a number of university colleges currently not included in the index, where performance is at least of regional or national importance. Not surprisingly the share of the population aged over 25 with tertiary level education tends to be higher in regions with a university. Innovation system and cluster policies focusing on the interaction between leading research environments with local industries may thus not be applicable to sparsely populated regions which often lack higher education institutions. An alternative here is to encourage networking between local communities and more distant R&D environments, developing specialised centres of expertise in a wider number of towns. However a recent study of patent data suggests that innovation networks, despite improved ICT, are more likely to exist in densely populated areas with a diversified industry. The science-orientated industries tend to benefit more from being located close to universities. As such then the construction of these networks remains a real challenge. 83 Another option here is to focus on soft types of innovation (organisational and governance related). 80 Hedin, S. et al (2008). 81 Hedin, S. et al (2008). 82 Hedin, S. et al (2008). 83 Wilhelmsson, M. (2007). 79


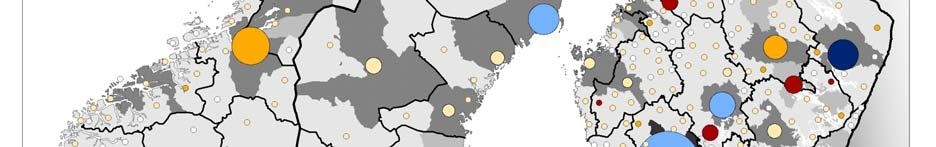

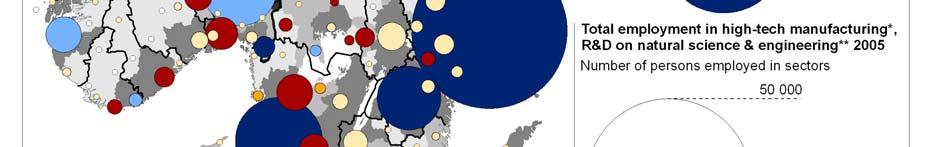

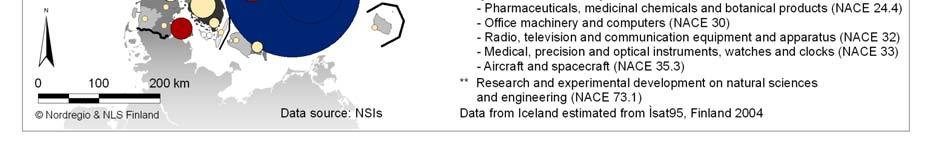
80 Figure 4.3: Specialisation in high-tech manufacturing and/or research and experimental development in natural science and engineering in Nordic labour markets


.")


81 Figure 4.4: Tertiary level education and educational attainment of the population A particular challenge in respect of innovation in the Nordic countries is the dominant nature of the public sector, especially in the Northern areas (see table 2.3). From an EU policy point of view, private actors are now expected to oversee ever more of the production of service and goods produced within the public sector. This however poses something of a problem in the sparsely populated areas in the Nordic countries where the potential for private actors to 81
REGIONAL POLICY SECTOR. Nordic Co-operation Programme for Regional Development and Planning
 REGIONAL POLICY SECTOR Nordic Co-operation Programme for Regional Development and Planning 2017 2020 Nordic Co-operation Programme for Regional Development and Planning 2017 2020 ISBN 978-92-893-4932-1
Regional Development in the Nordic Countries 2010
 Regional Development in the Nordic Countries 2010 Maria Lindqvist (editor) NORDREGIO REPORT 2010:2 Regional Development in the Nordic Countries 2010 Regional Development in the Nordic Countries 2010
HOW TO MEET DEMOGRAPHIC CHANGES. Appendix 2: A HANDBOOK FOR INSPIRATION AND ACTIONS IN NORDIC MUNICIPALITIES AND REGIONS 2012
 HOW TO MEET DEMOGRAPHIC CHANGES A HANDBOOK FOR INSPIRATION AND ACTIONS IN NORDIC MUNICIPALITIES AND REGIONS 2012 Appendix 2: TECHNICAL NOTES FOR MAPS AND DATA How to meet demographic changes A handbook
Cohesion and competitiveness of the Baltic Sea Region
 OFFICE OF THE COMMITTEE FOR EUROPEAN INTEGRATION Cohesion and competitiveness of the Baltic Sea Region Contribution from the Government of the Republic of Poland into works on the EU Strategy for the Baltic
EUROPAFORUM NORTHERN SWEDEN
 Territorial cohesion - the views of Europaforum Northern Sweden Europaforum Northern Sweden consists of a network of politicians at local, regional, national, and European level from the counties of Norrbotten,
IMPORTANCE OF COHESION POLICY FOR THE FUTURE OF THE EU
 (Version of 13 September 2016) IMPORTANCE OF COHESION POLICY FOR THE FUTURE OF THE EU AND THE CROSS-BORDER COOPERATION STATEMENT 13 SEPTEMBER 2016 - 2 - I. European cohesion policy Corner stone for a Community
Conference Resolution
 28/08/2018/ Conference Resolution Adopted by the 27 th Baltic Sea Parliamentary Conference (BSPC) The participants, elected representatives from the Baltic Sea Region States*, assembling in Mariehamn,
The Impact of Demographic Change in Nordic Regions
 Nordregio News Issue 3 June 2013 Nordic Population Ageing - Challenge and Opportunity? P H O TO : J O H A N N E S J A N S S O N / n o r d e n. o r g ISSN 2001-1725 Source: www.nordregio.se The Impact of
REGIONAL POLICY AND THE LISBON TREATY: IMPLICATIONS FOR EUROPEAN UNION-ASIA RELATIONSHIPS
 REGIONAL POLICY AND THE LISBON TREATY: IMPLICATIONS FOR EUROPEAN UNION-ASIA RELATIONSHIPS Professor Bruce Wilson European Union Centre at RMIT; PASCAL International Observatory INTRODUCTION The Lisbon
Europaforum Northern Sweden s views in the discussion on the future of the European Union
 10 November 2017 Swedish Government Swedish Riksdag European Commission European Parliament European Committee of the Regions Swedish Association of Local Authorities And Regions Europaforum Northern Sweden
Thematic Working Group 1: Targeting territorial specificities and needs in Rural Development Programmes
 Thematic Working Group 1: Targeting territorial specificities and needs in Rural Development Programmes Case Study on Rural Areas Eligible for Axis 3 Measures EN RD Contact Point 17 February 2011 17 February
State of the Nordic Region 2018
 2 0 / 0 4 / State of the Nordic Region 2018 State of the Nordic Region 2018 gives you a unique look behind the scenes of the world s most integrated region, comprised of Denmark, Finland, Iceland, Norway
Baltic Sea Region Strategy. A Critical Commentary
 Baltic Sea Region Strategy A Critical Commentary There is a great deal at stake on the successful implementation of the Baltic Sea Strategy. The outgoing Regional Commissioner, Danuta Hübner, stated
Nordic Statistics 2018
 Nordic Statistics 2018 Nordic Statistics 2018 Ed: Ulla Agerskov and Silva Mertsola, Nordic Council of Ministers ANP 2018:819 ISBN 978-92-893-5826-2 (PRINT) ISBN 978-92-893-5827-9 (PDF) ISBN 978-92-893-5828-6
Recent Migration Trends into the Nordic Region
 Recent Migration Trends into the Nordic Region Byplanmøde 2016 6-7 October 2016 Malmö, Sweden Timothy Heleniak Senior Research Fellow Nordregio timothy.heleniak@nordregio.se Outline About Nordregio From
AEBR ANNUAL CONFERENCE IN SZCZECIN, EUROREGION POMERANIA OCTOBER 7/8, 2004 F I N A L D E C L A R A T I O N
 AEBR ANNUAL CONFERENCE IN SZCZECIN, EUROREGION POMERANIA OCTOBER 7/8, 2004 F I N A L D E C L A R A T I O N NEW WAYS TOWARDS A NEW EUROPE - European community of values and a European constitution - A political
Strategy for regional development cooperation with Asia focusing on. Southeast Asia. September 2010 June 2015
 Strategy for regional development cooperation with Asia focusing on Southeast Asia September 2010 June 2015 2010-09-09 Annex to UF2010/33456/ASO Strategy for regional development cooperation with Asia
16827/14 YML/ik 1 DG C 1
 Council of the European Union Brussels, 16 December 2014 (OR. en) 16827/14 DEVGEN 277 ONU 161 ENV 988 RELEX 1057 ECOFIN 1192 NOTE From: General Secretariat of the Council To: Delegations No. prev. doc.:
Regional Policy and the Lisbon Treaty: implications for European Union-Asia Relationships
 Regional Policy and the Lisbon Treaty: implications for European Union-Asia Relationships Professor Bruce Wilson European Union Centre at RMIT; PASCAL International Observatory WORKING PAPER NUMBER 2 February
Diversity of Cultural Expressions
 Diversity of Cultural Expressions 2 CP Distribution: limited CE/09/2 CP/210/7 Paris, 30 March 2009 Original: French CONFERENCE OF PARTIES TO THE CONVENTION ON THE PROTECTION AND PROMOTION OF THE DIVERSITY
Summary. See OECD (2013). 6. See Statistics Sweden (2015). 7. See Swedish Migration Agency (2015).
. 6. See Statistics Sweden (2015). 7. See Swedish Migration Agency (2015).") Summary In 2015, more than 1.5 million people more than 16 per cent of Sweden s total population were born in another country. In addition, more than 700 000 people who were born in Sweden have at least
Summary In 2015, more than 1.5 million people more than 16 per cent of Sweden s total population were born in another country. In addition, more than 700 000 people who were born in Sweden have at least
Poverty profile and social protection strategy for the mountainous regions of Western Nepal
 October 2014 Karnali Employment Programme Technical Assistance Poverty profile and social protection strategy for the mountainous regions of Western Nepal Policy Note Introduction This policy note presents
Report from 25 Years of Barents Cooperation: Youth Perspective for the Future in Luleå, April 2018
 Memorandum 22 May 2018 Ministry for Foreign Affairs Report from 25 Years of Barents Cooperation: Youth Perspective for the Future in Luleå, 17 18 April 2018 The report is presented by the Swedish Chairmanship
TRENDS OF DEMOGRAPHIC DEVELOPMENT IN THE CONTEXT OF PLANNING REGIONS IN BULGARIA. Head Assist. Prof., PhD Nadezhda Veselinova
 TRENDS OF DEMOGRAPHIC DEVELOPMENT IN THE CONTEXT OF PLANNING REGIONS IN BULGARIA Head Assist. Prof., PhD Nadezhda Veselinova Department of strategic Planning, D.A.Tsenov Academy of Economics, Svishtov,
Partnership Annual Conference (PAC) Third Conference Oslo, Norway 12 December 2006
 Third Conference Oslo, Norway 12 December 2006") Partnership Annual Conference (PAC) Third Conference Oslo, Norway 12 December 2006 Reference PAC 3/4/Info 2 Title European Parliament resolution on A Baltic Sea Strategy for the Northern Dimension Submitted
Partnership Annual Conference (PAC) Third Conference Oslo, Norway 12 December 2006 Reference PAC 3/4/Info 2 Title European Parliament resolution on A Baltic Sea Strategy for the Northern Dimension Submitted
Index. per capita income level of 28 ratio of annual FDI inflow to national GDP 10
 Index accessibility and connectivity 17, 30 3 concept of 30 2 knowledge spillovers 31 railway networks 31 urban connectivity 32 administrative capacity 69 agglomeration 42, 51, 112 13, 116, 149 50, 152,
Proposals for the New Structural Funds Regulations for the period Position Paper -
 Réseau des Chambres de Commerce et d'industrie Insulaires de l'union Européenne Network of the Insular Chambers of Commerce and Industry of the European Union Proposals for the New Structural Funds Regulations
The Baltic Sea Strategy for Fair and Functional Labour Markets Trade Union Standpoints on the Baltic Sea Strategy
 24 November 2008 To the European Commission The Baltic Sea Strategy for Fair and Functional Labour Markets Trade Union Standpoints on the Baltic Sea Strategy 1 Summary of the Trade Union Standpoints The
Danish positions on key developments in the European Union
 DANISH INSTITUTE FOR INTERNATIONAL STUDIES STRANDGADE 56 1401 Copenhagen K +45 32 69 87 87 diis@diis.dk www.diis.dk DIIS Brief Danish positions on key developments in the European Union Summarised by Gry
Development Cooperation Instrument (DCI) Final compromise text reflecting the outcome of the trilogue on 2 December 2013
 Final compromise text reflecting the outcome of the trilogue on 2 December 2013") ANNEX to the letter Development Cooperation Instrument (DCI) Final compromise text reflecting the outcome of the trilogue on 2 December 2013 REGULATION (EU) /20.. OF THE EUROPEAN PARLIAMENT AND OF THE
ANNEX to the letter Development Cooperation Instrument (DCI) Final compromise text reflecting the outcome of the trilogue on 2 December 2013 REGULATION (EU) /20.. OF THE EUROPEAN PARLIAMENT AND OF THE
DEVELOPMENT AND COOPERATION ACROSS THE SOUTH EAST EUROPE AREA
 DEVELOPMENT AND COOPERATION ACROSS THE SOUTH EAST EUROPE AREA Jointly for our common future SOUTH EAST EUROPE Transnational Cooperation Programme INTRODUCTION 1 A transnational approach to cooperation
ESPON TANGO Territorial Approaches for New Governance
 The ESPON 2013 Programme ESPON TANGO Territorial Approaches for New Governance Applied Research 2013/1/21 Annex 1 Case Study 1: A Climate Change Adaptation Strategy for the Baltic Sea Region June 2013
BUILDING RESILIENT REGIONS FOR STRONGER ECONOMIES OECD
 o: o BUILDING RESILIENT REGIONS FOR STRONGER ECONOMIES OECD Table of Contents Acronyms and Abbreviations 11 List of TL2 Regions 13 Preface 16 Executive Summary 17 Parti Key Regional Trends and Policies
Kenya. Strategy for Sweden s development cooperation with MFA
 MINISTRY FOR FOREIGN AFFAIRS, SWEDEN UTRIKESDEPARTEMENTET Strategy for Sweden s development cooperation with Kenya 2016 2020 MFA 103 39 Stockholm Telephone: +46 8 405 10 00, Web site: www.ud.se Cover:
Mobility and regional labour markets:
 Mobility and regional labour markets: Lessons for employees and employers William Collier and Roger Vickerman Centre for European, Regional and Transport Economics The University of Kent at Canterbury
Northern Dimension Policy Framework Document
 Northern Dimension Policy Framework Document 1. Introduction 1. The Northern Dimension covers a broad geographic area from the European Arctic and Sub- Arctic areas to the southern shores of the Baltic
D2 - COLLECTION OF 28 COUNTRY PROFILES Analytical paper
 D2 - COLLECTION OF 28 COUNTRY PROFILES Analytical paper Introduction The European Institute for Gender Equality (EIGE) has commissioned the Fondazione Giacomo Brodolini (FGB) to carry out the study Collection
Ilze JUREVIČA Ministry of Environmental Protection and Regional Development Regional Policy Department
 Role of small and medium sized urban areas in territorial development: Latvian experience and plans for the upcoming Latvian presidency of the Council of the EU Ilze JUREVIČA Ministry of Environmental
The ESPON National Network and the role of the Contact Point (ECP) ESPON Information Session 7 November 2016, Malta. Role of ECPs
 ESPON Information Session 7 November 2016, Malta. Role of ECPs") The ESPON National Network and the role of the Contact Point (ECP) ESPON Information Session 7 November 2016, Malta Role of ECPs The ESPON Contact Points (ECPs) Network is a European wide network of national
The ESPON National Network and the role of the Contact Point (ECP) ESPON Information Session 7 November 2016, Malta Role of ECPs The ESPON Contact Points (ECPs) Network is a European wide network of national
COMMISSION OF THE EUROPEAN COMMUNITIES COMMUNICATION FROM THE COMMISSION TO THE COUNCIL AND THE EUROPEAN PARLIAMENT
 COMMISSION OF THE EUROPEAN COMMUNITIES Brussels, 19.6.2008 COM(2008) 391 final COMMUNICATION FROM THE COMMISSION TO THE COUNCIL AND THE EUROPEAN PARLIAMENT REPORT ON THE FIRST YEAR OF IMPLEMENTATION OF
Rights of the Child: the work of the European Union Agency for Fundamental Rights
 Rights of the Child: the work of the European Union Agency for Fundamental Rights Background The Agency for Fundamental Rights (FRA) is a body of the European Union established on 15 February 2007 with
European Platform against Poverty and Social Exclusion
 European Platform against Poverty and Social Exclusion Position paper of the European Network Against Racism in view of the European Commission exchange with key stakeholders October 2010 Contact: Sophie
>r ""~ L1i'B'E RALS and EUROPEAN LIBERALS ARE THE FIRST TO ADOPT ELECTION MANIFESTO
 .. "' >r ""~ L1i'B'E RALS and.-,,. DEMOCRATS for Europe PARTY EUROPEAN LIBERALS ARE THE FIRST TO ADOPT ELECTION MANIFESTO In 2014, we will have the opportunity to shape the future of Europe at a crucial
Ethiopia. Strategy for Sweden s development cooperation with MFA
 MINISTRY FOR FOREIGN AFFAIRS, SWEDEN UTRIKESDEPARTEMENTET Strategy for Sweden s development cooperation with Ethiopia 2016 2020 MFA 103 39 Stockholm Telephone: +46 8 405 10 00, Web site: www.ud.se Cover:
JOINT COMMUNIQUE Sixth Session of the Barents Euro Arctic Council Bodo, Norway 4 5 March 1999
 JOINT COMMUNIQUE Sixth Session of the Barents Euro Arctic Council Bodo, Norway 4 5 March 1999 Ministers and senior representatives from the Member States, Denmark, Finland, Iceland, Norway, the Russian
State of the Nordic Region 2018
 2 State of the Nordic Region 2018 Lunch seminar Julien Grunfelder, Head of GIS department April 23 rd 2018, Helsinki Outline Demography Labour Force Economy Regional Potential Index Introduction What is
Declaration. of the 18th CBSS Ministerial Session. Pionersky, the Kaliningrad Region of the Russian Federation. 6 June 2013
 Declaration of the 18th CBSS Ministerial Session Pionersky, the Kaliningrad Region of the Russian Federation 6 June 2013 The Council of the Baltic Sea States (CBSS), consisting of the Ministers of Foreign
EUROPEAN COMMISSION Employment, Social Affairs and Equal Opportunities DG ADVISORY COMMITTEE ON FREE MOVEMENT OF WORKERS
 EUROPEAN COMMISSION Employment, Social Affairs and Equal Opportunities DG Social Protection and Integration Coordination of Social Security Schemes, Free Movement of Workers ADVISORY COMMITTEE ON FREE
Forum Syd s Policy Platform
 Forum Syd s Policy Platform 2013-2022 Forum Syd s policy platform 2013-2022 Our vision is a just and sustainable world where all people have the power to effect change. When people use and develop democracy,
TIGER Territorial Impact of Globalization for Europe and its Regions
 TIGER Territorial Impact of Globalization for Europe and its Regions Final Report Applied Research 2013/1/1 Executive summary Version 29 June 2012 Table of contents Introduction... 1 1. The macro-regional
A POLICY FRAMEWORK FOR COASTAL AUSTRALIA
 A POLICY FRAMEWORK FOR COASTAL AUSTRALIA Author: Alan Stokes, Executive Director, National Sea Change Taskforce Introduction This proposed Coastal Policy Framework has been developed by the National Sea
EU-EGYPT PARTNERSHIP PRIORITIES
 EU-EGYPT PARTNERSHIP PRIORITIES 2017-2020 I. Introduction The general framework of the cooperation between the EU and Egypt is set by the Association Agreement which was signed in 2001 and entered into
The Lisbon Agenda and the External Action of the European Union
 Maria João Rodrigues 1 The Lisbon Agenda and the External Action of the European Union 1. Knowledge Societies in a Globalised World Key Issues for International Convergence 1.1 Knowledge Economies in the
Estonia. Source:
 ESTONIA * 1. DEVEOPMENT DISPARITIES AND ISSUES A stable macro-economic framework, rapid privatisation and other market economy reforms have led to a generally favourable economic environment in Estonia.
Combating Poverty and Social Exclusion in Rural areas
 Combating Poverty and Social Exclusion in Rural areas Budapest 11-12 Jun 2009 Paola Bertolini University of Modena and Reggio Emilia Fondazione Brodolini (FGB) 1 Main findings Invisibility of rural poverty
Action Plan on Cross Border Mobility in the Baltic Sea Region
 Action Plan 2013-11-1 1 / 7 Action Plan on Cross Border Mobility in the Baltic Sea Region PART I: BACKGROUND I. 1. PURPOSE OF THE ACTION PLAN The Baltic Sea Labour Forum (BSLF) was established in November
Gender, labour and a just transition towards environmentally sustainable economies and societies for all
 Response to the UNFCCC Secretariat call for submission on: Views on possible elements of the gender action plan to be developed under the Lima work programme on gender Gender, labour and a just transition
Preconditions for Social Entrepreneurship and Social Innovations in Rural Areas
 ISIRC 2018, Heidelberg, 3-5 September Bridging Social and Business Innovation Preconditions for Social Entrepreneurship and Social Innovations in Rural Areas PhD Yvonne von Friedrichs Professor of Business
OECD Rural Development Policy: Scotland. Betty-Ann Bryce Administrator OECD Regional and Rural Unit
 OECD Rural Development Policy: Scotland Betty-Ann Bryce Administrator OECD Regional and Rural Unit Roadmap 1. About OECD Rural Programme 2. New Rural Paradigm 3. Common threads in OECD Countries 4. Placing
HOUSING AND URBAN MATTERS: A CHANGING AGENDA IN THE EUROPEAN UNION?
 Plenary I - Housing issues in the EU: Do they Matter? HOUSING AND URBAN MATTERS: A CHANGING AGENDA IN THE EUROPEAN UNION? Iván Tosics tosics@mri.hu Paper presented at the ENHR conference "Housing in an
Europe a Strong Global Partner for Development
 Europe a Strong Global Partner for Development Taking stock of the joint 18-month development policy programme of the German, Portuguese and Slovenian European Union (EU) Council Presidencies (January
TOWARDS A EUROPEAN TERRITORIAL AGENDA POST 2020: WHAT SHOULD IT CONSIDER AND INCLUDE? CONCEPTUAL PROPOSALS AND IDEAS
 Territorial Thinkers Briefing November 2018:03 TOWARDS A EUROPEAN TERRITORIAL AGENDA POST 2020: WHAT SHOULD IT CONSIDER AND INCLUDE? CONCEPTUAL PROPOSALS AND IDEAS Derek Martin Peter Mehlbye Peter Schön
COMMISSION OF THE EUROPEAN COMMUNITIES COMMUNICATION FROM THE COMMISSION TO THE EUROPEAN COUNCIL A CITIZENS AGENDA
 COMMISSION OF THE EUROPEAN COMMUNITIES Brussels, 10.5.2006 COM(2006) 211 final COMMUNICATION FROM THE COMMISSION TO THE EUROPEAN COUNCIL A CITIZENS AGENDA DELIVERING RESULTS FOR EUROPE EN EN COMMUNICATION
1873 to 1914 saw the Currency Union of Denmark, Sweden and Norway. The common currency was the krona, crown, made up of 100 öre the Euro of its day!
 Jan-Erik Enestam Secretary General Nordic Council VIA NORDICA 2008: A common Nordic infra market A COMPETITIVE NORDIC AND EUROPEAN MARKET-POSSIBILITIES AND CHALLENGES Ladies and Gentlemen! Allow me to
1998 CBSS 7th Ministerial Session - Nyborg Communiqué
 1998 CBSS 7th Ministerial Session - Nyborg Communiqué Communiqué of the 7 th Ministerial Session of the CBSS, Nyborg, 22-23rd June 1998. 1. At the invitation of the Minister for Foreign Affairs of Denmark,
NATIONAL PRIORITIES OF REGIONAL DEVELOPMENT : Competitive regions and smooth everyday life
 NATIONAL PRIORITIES OF REGIONAL DEVELOPMENT 2016 2019: Competitive regions and smooth everyday life CONTENTS 1. The regional development decision purpose and basis... 2 2. Operating environment and outlook
The Danish Refugee Council s 2020 Strategy
 December 2016 The Danish Refugee Council s 2020 Strategy Introduction The world is currently facing historic refugee and migration challenges in relation to its 65 million refugees and more than 240 million
Children and Young People in the Nordic Region. a cross-sectoral strategy for the Nordic Council of Ministers
 Children and Young People in the Nordic Region a cross-sectoral strategy for the Nordic Council of Ministers 2016 2022 Children and Young People in the Nordic Region a cross-sectoral strategy for the Nordic
Ekspertmøte om helsepersonellkrisen, Soria Moria, 24 February 2005.
 Ekspertmøte om helsepersonellkrisen, Soria Moria, 24 February 2005. Mobilising for Action Political and strategic challenges Hilde F. Johnson, Minister of International Development, Norway Check against
Revue Française des Affaires Sociales. The Euro crisis - what can Social Europe learn from this?
 Revue Française des Affaires Sociales Call for multidisciplinary contributions on The Euro crisis - what can Social Europe learn from this? For issue no. 3-2015 This call for contributions is of interest
STRENGTHENING RURAL CANADA: Fewer & Older: Population and Demographic Crossroads in Rural Saskatchewan. An Executive Summary
 STRENGTHENING RURAL CANADA: Fewer & Older: Population and Demographic Crossroads in Rural Saskatchewan An Executive Summary This paper has been prepared for the Strengthening Rural Canada initiative by:
GCE. Edexcel GCE. Geography A (8214 / 9214) Summer Edexcel GCE. Mark Scheme (Results) Geography A (8214 / 9214)
 Summer Edexcel GCE. Mark Scheme (Results) Geography A (8214 / 9214)") GCE Edexcel GCE Geography A (8214 / 9214) 6462 Summer 2005 Mark Scheme (Results) Edexcel GCE Geography A (8214 / 9214) 6462 6462 Summer 2005 Mark Scheme SECTION A 1 Study Figure 1 which shows global variations
GCE Edexcel GCE Geography A (8214 / 9214) 6462 Summer 2005 Mark Scheme (Results) Edexcel GCE Geography A (8214 / 9214) 6462 6462 Summer 2005 Mark Scheme SECTION A 1 Study Figure 1 which shows global variations
The Overarching Post 2015 Agenda - Council conclusions. GE ERAL AFFAIRS Council meeting Luxembourg, 25 June 2013
 COU CIL OF THE EUROPEA U IO EN The Overarching Post 2015 Agenda - Council conclusions The Council adopted the following conclusions: GERAL AFFAIRS Council meeting Luxembourg, 25 June 2013 1. "The world
7 th Baltic Sea States Summit
 Prime Minister s Office 7 th Baltic Sea States Summit Riga, Latvia 4 June 2008 Chairman s Conclusions 1. At the invitation of the Prime Minister of Latvia, the Heads of Government and representatives of
MEMORANDUM OF UNDERSTANDING ON THE IMPLEMENTATION OF THE EEA FINANCIAL MECHANISM between ICELAND, THE PRINCIPALITY OF LIECHTENSTEIN,
 MEMORANDUM OF UNDERSTANDING ON THE IMPLEMENTATION OF THE EEA FINANCIAL MECHANISM 2014-2021 between ICELAND, THE PRINCIPALITY OF LIECHTENSTEIN, THE KINGDOM OF NORWAY, hereinafter referred to as the Donor
Speech before LIBE Committee
 SPEECH/10/235 Cecilia Malmström Member of the European Commission responsible for Home Affairs Speech before LIBE Committee The Committee on Civil liberties, Justice and Home Affairs (LIBE) of the European
Civil Society Reports: Countries under review at 2017 High Level Political Forum
 Civil Society Reports: Countries under review at 2017 High Level Political Forum Guiding Questions for a Template for CSO engagement for Voluntary National Review at the UN High-level Political Forum (HLPF)
UNHCR Europe NGO Consultation 2017 Regional Workshops Northern Europe. UNHCR Background Document
 UNHCR Europe NGO Consultation 2017 Regional Workshops Northern Europe UNHCR Background Document Strengthening Strategic UNHCR/NGO Cooperation to Facilitate Refugee Inclusion and Family Reunification in
Reproducing and reshaping ethnic residential segregation in Stockholm: the role of selective migration moves
 Reproducing and reshaping ethnic residential segregation in Stockholm: the role of selective migration moves Roger Andersson Institute for Housing & Urban Research, Uppsala university Paper accepted for
Exchange of Information in Cases of Trafficking in Human Beings
 Exchange of Information in Cases of Trafficking in Human Beings Good practices in the exchange of information between public authorities and the police in cases of trafficking in human beings Exchange
Meeting of the OECD Council at Ministerial Level
 Meeting of the OECD Council at Ministerial Level Paris, 6-7 May 2014 2014 OECD MINISTERIAL STATEMENT ON CLIMATE CHANGE 2014 OECD Ministerial Statement on Climate Change Climate change is a major urgent
Internal mobility in the EU and its impact on urban regions in sending and receiving countries. Executive Summary
 Internal mobility in the EU and its impact on urban regions in sending and receiving countries EUKN research paper to support the Lithuanian EU Presidency 2013 Executive Summary Discussion paper for the
THINK7 SUMMIT. The Think7 Quebec Declaration on Global Governance and the Challenges of Complexity and Inclusiveness
 THINK7 SUMMIT The Think7 Quebec Declaration on Global Governance and the Challenges of Complexity and Inclusiveness The Think7 Quebec Declaration on Global Governance and the Challenges of Complexity and
SOUTHERN AND EASTERN MEDITERRANEAN ETF OPERATIONS - CONTEXT AND ACTIVITIES
 SOUTHERN AND EASTERN MEDITERRANEAN ETF OPERATIONS - CONTEXT AND ACTIVITIES September 2012 CONTEXT The Southern and Eastern Mediterranean region is characterised by an extremely young population. Recent
STRENGTHENING RURAL CANADA: Fewer & Older: The Coming Demographic Crisis in Rural Ontario
 STRENGTHENING RURAL CANADA: Fewer & Older: The Coming Demographic Crisis in Rural Ontario An Executive Summary 1 This paper has been prepared for the Strengthening Rural Canada initiative by: Dr. Bakhtiar
Title: Barbados and Eastern Caribbean Crisis Poverty and Social Impact Analysis (PSIA)
") Title: Barbados and Eastern Caribbean Crisis Poverty and Social Impact Analysis (PSIA) Summary prepared by: The Inclusive Development Cluster, Poverty Group February 2010 This is a summary of the report
Title: Barbados and Eastern Caribbean Crisis Poverty and Social Impact Analysis (PSIA) Summary prepared by: The Inclusive Development Cluster, Poverty Group February 2010 This is a summary of the report
11559/13 YML/ik 1 DG C 1
 COUNCIL OF THE EUROPEAN UNION Brussels, 25 June 2013 11559/13 DEVGEN 168 ENV 639 ONU 68 RELEX 579 ECOFIN 639 NOTE From: To: Subject: General Secretariat of the Council Delegations The Overarching Post
The Way Forward: Pathways toward Transformative Change
 CHAPTER 8 We will need to see beyond disciplinary and policy silos to achieve the integrated 2030 Agenda. The Way Forward: Pathways toward Transformative Change The research in this report points to one
CONTRIBUTION TO THE GREEN PAPER ON TERRITORIAL COHESION
 1 (5) February 24, 2009 European Commission DG Regional Policy Green Paper on Territorial Cohesion REGIO-GreenPaper-Territorial@ec.europa.eu CONTRIBUTION TO THE GREEN PAPER ON TERRITORIAL COHESION Uusimaa
FCCC/PA/CMA/2018/3/Add.1
 ADVANCE VERSION United Nations Distr.: General 19 March 2019 Original: English Conference of the Parties serving as the meeting of the Parties to the Paris Agreement Contents Report of the Conference of
EU Communication: A renewed partnership with the countries of Africa, the Caribbean and the Pacific
 EU Communication: A renewed partnership with the countries of Africa, the Caribbean and the Pacific Preliminary Analysis Jean Bossuyt, Niels Keijzer, Geert Laporte and Marc de Tollenaere 1 1 The authors
Introduction to the Human Rights Strategy
 Introduction to the Human Rights Strategy Human rights apply to everyone, always and everywhere. They apply in Sweden and in other countries. This ought to be obvious, but we live in a time when the protection
Debate on the future of Home Affairs policies: An open and safe Europe what next?
 Debate on the future of Home Affairs policies: An open and safe Europe what next? Brussels, 21 January 2014 Ref: 2014/AD/P6601 Identification number EC register 4817795559-48 By e-mail to HOME-ANEWAGENDA@ec.europa.eu
The Baltic Sea region
 The Baltic Sea region * * * 22 June 2006 Hanseatic Parliament Copenhagen MEP Poul Nyrup Rasmussen President Party of European Socialists The Difference! * The ultimate global market economy. Comparative
COU CIL OF THE EUROPEA U IO. Brussels, 6 ovember 2008 (11.11) (OR. fr) 15251/08 MIGR 108 SOC 668
 (OR. fr) 15251/08 MIGR 108 SOC 668") COU CIL OF THE EUROPEA U IO Brussels, 6 ovember 2008 (11.11) (OR. fr) 15251/08 MIGR 108 SOC 668 "I/A" ITEM OTE from: Presidency to: Permanent Representatives Committee/Council and Representatives of the
COU CIL OF THE EUROPEA U IO Brussels, 6 ovember 2008 (11.11) (OR. fr) 15251/08 MIGR 108 SOC 668 "I/A" ITEM OTE from: Presidency to: Permanent Representatives Committee/Council and Representatives of the
COMMISSION OF THE EUROPEAN COMMUNITIES
 COMMISSION OF THE EUROPEAN COMMUNITIES Brussels, 1.9.2005 COM(2005) 389 final COMMUNICATION FROM THE COMMISSION TO THE COUNCIL, THE EUROPEAN PARLIAMENT, THE EUROPEAN ECONOMIC AND SOCIAL COMMITTEE AND THE
Growing stronger together.
 Growing stronger together. Five commitments for the next five years Manifesto of the Party of European Socialists for the June 2004 European Parliament elections Growing stronger together Five commitments
Civil Society Forum Belgrade Recommendations
 Civil Society Forum Belgrade Recommendations The Civil Society Forum Belgrade Forum was realised as a joint initiative of the European Fund for the Balkans (EFB) and ERSTE Foundation, supported by the
The evidence base of Health 2020
 Information document The evidence base of Health 2020 Regional Committee for Europe Sixty-second session Malta, 10 13 September 2012 Regional Committee for Europe Sixty-second session EUR/RC62/Inf.Doc./2
29/09/15 FOOTER HERE 1
 29/09/15 FOOTER HERE 1 FINLAND A CONTRIBUTOR AT INTERNATIONAL FORUMS Finland is a constructive, pragmatic and valued actor and contributor in international cooperation. 29/09/15 FOOTER HERE 2 AT INTERNATIONAL