An Equity Profile of. Pinellas County
|
|
|
- Darrell Cummings
- 5 years ago
- Views:
Transcription


1 An Equity Profile of Pinellas County
2 An Equity Profile of Pinellas County 2 Summary Mirroring national trends, Pinellas County is becoming a more diverse county. In the next few decades, the majority of the county s residents will be people of color from a rich variety of racial and ethnic backgrounds. However, a long history of racial discrimination and disinvestment in communities of color has created entrenched and persistent racial inequities in employment, income, wealth, education, health, justice, housing, and transportation. The success and prosperity of Pinellas County will rely on dismantling these unjust barriers and ensuring that everyone can participate in and enjoy the benefits of a thriving economy. It is estimated that without racial gaps in income, the economy in the region would have been $3.6 billion stronger in Existing community and policy efforts are beginning to adopt an equity-focused approach, providing meaningful opportunities for residents, government, and businesses to advance long-term sustainable change to shape a more inclusive economy for all.
3 An Equity Profile of Pinellas County 3 Indicators DEMOGRAPHICS Race, Ethnicity, and Nativity, 2016 Racial/Ethnic Composition, 1980 to 2050 Growth Rates of Major Groups by Race/Ethnicity and Nativity, 2010 to 2016 Black, Latinx, and Asian/Pacific Islander Populations by Ancestry, 2016 Percent People of Color by Census Tract, 2016 Percent People of Color by Age Group, 1980 to 2016 Median Age by Race/Ethnicity, 2016 Percent Linguistically Isolated Households by Census Tract, 2016 English-Speaking Ability Among Immigrants by Race/Ethnicity, 2010 and 2016 Unemployment Rate by Race/Ethnicity, 2016 Unemployment Rate, Not Seasonally Adjusted, December 2018 Unemployment Rate by Census Tract, 2016 Unemployment Rate by Educational Attainment and Race/Ethnicity, 2016 Median Hourly Wage by Educational Attainment and Race/Ethnicity, 2016 Poverty Rate by Race/Ethnicity, 2010 and 2016 Working-Poor Rate by Race/Ethnicity, 2010 and 2016 Child Poverty Rate by Race/Ethnicity, 2016 Percent Population Below the Poverty Level by Census Tract, 2016 Share and Count of Working-Age Population with an Associate s Degree or Higher by Race/Ethnicity, 2016, and Projected Share of Jobs that Require an Associate's Degree or Higher, 2020 ECONOMIC VITALITY Average Annual Growth in Jobs and GDP, 1990 to 2007 and 2009 to 2016 Growth in Jobs by Industry Wage Level, 2000 to 2016 Growth in Real Earnings by Industry Wage Level, 2000 to 2016 Income Inequality, 1989 to 2016 Real Earned Income Growth for Full-Time Wage and Salary Workers Ages 25-64, 1999 to 2016 Median Hourly Wage by Race/Ethnicity, 2000 and 2016 Households by Income Level, 1989 to 2016 YOUTH PREPAREDNESS Share of 16- to 24-Year-Olds Not Enrolled in School and Without a High School Diploma by Race/Ethnicity, 2000 to 2016 Share of 16- to 24-Year-Olds Not Enrolled in School and Without a High School Diploma by Race/Ethnicity and Gender, 2016 Disconnected Youth: 16- to 24-Year-Olds Not in School or Work by Race/Ethnicity, 1990 to 2016 Disconnected Youth: 16- to 24-Year-Olds Not in School or Work by Race/Ethnicity and Gender, 2000 to 2016 Composite Child Opportunity Index by Census Tract
4 An Equity Profile of Pinellas County 4 Indicators (continued) CONNECTEDNESS Percent Severely Rent-Burdened Households by Census Tract, 2016 Eviction Rates of Renter Homes, 2016 Owner-Occupied Households by Race/Ethnicity, 2016 Percent of Households Without a Vehicle by Census Tract, 2016 Means of Transportation to Work by Annual Earnings, 2016 Percent Using Public Transit by Annual Earnings and Race/Ethnicity, 2016 HEALTH OF RESIDENTS Health Insurance Coverage Rates by Race/Ethnicity and Age, 2016 Health Insurance Coverage Rates by Race/Ethnicity and Insurance Type, 2016 ECONOMIC BENEFITS OF EQUITY Actual GDP and Estimated GDP Without Racial Gaps in Income, 2016 Average Travel Time to Work in Minutes by Census Tract, 2016 Share of Adult (18 or Older) Population Registered to Vote in the 2016 General Election by Race/Ethnicity Voter Participation of Registered Voters for the 2016 and 2018 General Elections by Race/Ethnicity JUSTICE Percentage of Misdemeanor Referrals in which Resisting Arrest was the Only Charge by Race/Ethnicity, 2009 to 2013 Percentage of Nonviolent Felony Convictions Resulting in a Prison Sentence by Race/Ethnicity, 2012 to 2013 Percentage of Drug Possession Convictions Resulting in a Jail Sentence by Race/Ethnicity, 2012 to 2013
5 An Equity Profile of Pinellas County 5 Foreword The benefits of a more fair and just society are evident throughout the world. Equity full inclusion of all residents in the economic, social, and political life of Pinellas County, regardless of race/ethnicity, nativity, age, gender, neighborhood of residence, or other characteristics is more than just the right thing to do, it is essential for sustained prosperity. Reducing inequity correlates with more stable economies, more capacity to rebound from economic downturns, growth in overall academic performance, increased life expectancy, reduced infant mortality, and increased civic participation. Equity IS the superior economic and social model. Still, disparities based on race and ethnicity endure across a host of socioeconomic indicators in our county, indicating a persistence of racial barriers to opportunity. Typically, these barriers include discrimination as well as more subtle forms of exclusion that are embedded into institutions and systems. There is a disconnect between the brilliance and contributions of people of color in the United States and in Pinellas County and in the lived experience of many residents. With the production of this equity profile, UNITE Pinellas aims to make the data clear and indisputable knowing that the goal is to produce fairness and social justice where race would no longer be a factor in the assessment of merit, or in the distribution of opportunity. UNITE Pinellas is committed to increasing our community s capacity and will to achieve lasting economic and racial fairness. Specific and significant ways exist to reform systems that generated this unfairness: Dismantle public policies that create barriers to exclusion and develop policies that are more equitable. Eliminate institutional practices such as regulations and day-to-day decision-making in public and private institutions that generate biased outcomes. Change the narrative and modify the language, images, and cognitive cues that form the conventional understanding of poverty and race from one of blame to a deeper understanding of the systemic barriers in place that have created these inequities. By increasing the knowledge of the local dynamics and conditions and exposing the root causes that underlie the disparities, our community can develop the capacity to influence these three areas. It is important to acknowledge that the success in impacting systems relies on the wisdom and co-creation of people most impacted by the policies, practices, and blame narratives that perpetuate inequity. This goal will drive who participates in decision-making and how decisions are made. If there is a more just and equitable Pinellas County what difference will it make? Aside from the deep desire people hold for our world to be just and fair, there are concrete impacts that can be measured and seen. The research in this profile estimates that our local economy would be $3.6 billion larger if there were no income inequities. What happens if our community does not alter the systemic/structural causes of inequity? If the community is unable to generate lasting systemic impact, we will continue to deny the contributions that
6 An Equity Profile of Pinellas County 6 Foreword (continued) people at the margins are ready and able to make toward the well-being of the whole. The community s potential will be unrealized. Inequities will continue to cost everyone. This equity profile is an effort to increase awareness of how inequity is part of our reality in Pinellas County. This report, and future reports, will be enhanced as they include even deeper co-creation of solutions from residents who are context experts. Context expertise is a core value of UNITE Pinellas and it will generate a superior solution. This report defines and launches an agenda for Pinellas County focused on an inclusive economy and justice that materially impacts the measures of equity. The next steps will include an ongoing effort to elevate the awareness of the realities of the current systems, advancing the institutional commitments to internal change, and exploring areas that are ripe for movement around policy and practice. UNITE Pinellas Members AARP Florida Allegany Franciscan Ministries Central Florida Behavioral Health Network Community Foundation of Tampa Bay Forward Pinellas Foundation for a Healthy St. Petersburg Juvenile Welfare Board One Community Plan and 2020 Plan Pinellas County Community Foundation Pinellas County Government Pinellas County Health Department Pinellas County Schools Pinellas County Urban League Pinellas Education Foundation St. Petersburg Chamber of Commerce St. Petersburg College Tampa Bay Health Collaborative United Way Suncoast
7 An Equity Profile of Pinellas County 7 Acknowledgments PolicyLink and the Program for Environmental and Regional Equity (PERE) at the University of Southern California are grateful to UNITE Pinellas for their partnership and support for this effort. We thank the members of our advisory committee: Dr. Ulyee Choe, Florida Department of Health; Ruth Power, Central Florida Behavioral Health Network; Whit Blanton, Forward Pinellas; Justin Johnson, Grow Smarter; Jaclyn Boland, Hispanic Outreach Center; Judith Warren and Dr. Marcie Biddleman, Juvenile Welfare Board; Duggan Cooley, Pinellas Community Foundation; Lourdes Benedict, Pinellas County Government; Lori Matway, Pinellas County Schools; Dr. Misty Kemp, St. Petersburg College; Carrie Hepburn, Tampa Bay Healthcare Collaborative; Sean Kennedy, The Greenhouse and Grow Smarter; and Tim Dutton of UNITE Pinellas for their insightful guidance and feedback. The profile was written by Michelle Huang at PolicyLink; the data, charts, and maps were prepared by Justin Scoggins at PERE, Michelle Huang at PolicyLink, and Sabrina Kim at PERE; and Sarah Treuhaft at PolicyLink assisted with editing while Rosamaria Carrillo at PolicyLink helped with formatting and design. The summary was written by James Crowder Jr. at PolicyLink. In addition to the data analysis contained in the profile, the summary report draws upon insights that were shared during interviews conducted with local community leaders and residents. Their comments helped shape the policy recommendations included in the summary. We would like to give a special thanks to the following individuals and organizations who participated in interviews: Allison Pinto, PhD, Lake Maggiore Shores Initiative Brother John Muhammad and residents with The New Deal for St. Pete Carl Lavender, Pinellas Technical College Carrie Hepburn, Tampa Bay Healthcare Collaborative Gypsy Gallardo, 2020 Plan Jaclyn Boland and residents with Hispanic Outreach Center Kenneth Welch, Board of County Commissioners Nikki Gaskin-Capehart, City of St. Petersburg Randall Russell, Foundation for a Healthy St. Petersburg Rev. Watson L. Haynes, Pinellas County Urban League Samantha Richardson, The Gathering of Women Sean Kennedy, The Greenhouse Veatrice Farrell, Deuces Live
8 An Equity Profile of Pinellas County 8 Introduction Overview Across the country, residents and community organizations, local governments, business leaders, funders, and policymakers are striving to put plans, policies, and programs in place aimed at healthier, more equitable communities that foster inclusive growth. These efforts recognize that equity just and fair inclusion into a society in which all can participate, prosper, and reach their full potential is fundamental to a brighter future. UNITE Pinellas was formed out of a need to examine and combat systemic inequities in Pinellas County that have diminished economic and social success for residents with low incomes and especially for people of color. Knowing how a community stands in terms of equity is a critical first step in planning for equitable growth. To assist with that process, PolicyLink and the Program for Environmental and Regional Equity (PERE) developed an equity indicators framework that communities can use to understand and track the state of equity and equitable growth locally. This document presents an equity analysis of Pinellas County, Florida. The data in this profile are drawn from a regional equity database that includes data for the largest 100 cities and 150 regions in the United States, as well as all 50 states. This database incorporates hundreds of data points from public and private data sources including the U.S. Census Bureau, the U.S. Bureau of Labor Statistics, the Behavioral Risk Factor Surveillance System, and Woods and Poole Economics. See the "Data and methods" section of this profile for a detailed list of data sources. This profile also uses a range of data sources to describe the state of equity in Pinellas County as comprehensively as possible, but there are limitations. Not all data collected by public and private sources is disaggregated by race/ethnicity and other demographic characteristics. And in some cases, even when disaggregated data is available, the sample size for a given population is too small to report with confidence. Local data sources and the lived experiences of a diversity of residents should supplement the data provided in this profile to more fully represent the state of equity in Pinellas County.
9 An Equity Profile of Pinellas County 9 Introduction What is an equitable county? Counties are equitable when all residents regardless of their race/ethnicity, nativity, gender, income, neighborhood of residence, or other characteristics are fully able to participate in the county s economic vitality, contribute to the region s readiness for the future, and connect to the region s assets and resources. Strong, equitable counties: Have economic vitality that supports residents to secure high-quality jobs and to produce new ideas, products, businesses, and economic activity so the well-being of the residents is sustainable. Are ready for the future, with a skilled, ready workforce and a healthy population. Are places of connection, where residents can access the essential ingredients to live healthy and productive lives in their neighborhoods, reach opportunities located throughout the region (and beyond) via transportation and technology, participate in civic processes, and productively engage with other diverse residents.
10 An Equity Profile of Pinellas County 10 Introduction Why equity matters now The face of America is changing. Our country s population is rapidly diversifying. Already, more than half of all babies born in the United States are people of color. By 2030, the majority of young workers will be people of color. And by 2044, the United States will be a majority people-ofcolor nation. Yet racial and income inequality is high and persistent. Over the past several decades, long-standing inequities in income, wealth, health, and opportunity have reached unprecedented levels. And while most have been affected by this growing inequality, communities of color have felt the greatest pains as the economy has shifted and stagnated. Racial, gender, and economic equity is necessary for the nation s economic growth and prosperity. Equity is an economic and health imperative as well as a moral one. Research shows that equity and diversity are win-win propositions for nations, regions, communities, and firms. For example: More equitable regions experience stronger, more sustained growth. 1 Regions with less segregation (by race and income) and lower income inequality have more upward mobility. 2 Researchers predict that health equity would lead to significant economic benefits from reductions in health-care spending and lost productivity. 3 Companies with a diverse workforce achieve a better bottom line. 4 A diverse population more easily connects to global markets. 5 Lower economic inequality results in better health outcomes for everyone. 6 The way forward is with an equity-driven growth model. A new economic model based on equity, fairness, and opportunity can secure America s health and prosperity. Policies and investments must support equitable economic growth strategies, opportunity-rich neighborhoods, and cradle-to-career educational pathways. Counties play a critical role in building this new growth model. Local communities are where strategies are being incubated that foster equitable growth: growing good jobs and new businesses while ensuring that all including low-income people and people of color can fully participate and prosper. 1 Manuel Pastor, Cohesion and Competitiveness: Business Leadership for Regional Growth and Social Equity, OECD Territorial Reviews, Competitive Cities in the Global Economy, Organisation For Economic Co-operation And Development (OECD), 2006; Manuel Pastor and Chris Benner, Been Down So Long: Weak-Market Cities and Regional Equity in Retooling for Growth: Building a 21 st Century Economy in America s Older Industrial Areas (New York: American Assembly and Columbia University, 2008); Randall Eberts, George Erickcek, and Jack Kleinhenz, Dashboard Indicators for the Northeast Ohio Economy: Prepared for the Fund for Our Economic Future (Federal Reserve Bank of Cleveland: April 2006), papers/working-papers-archives/2006-working-papers/wp dashboard-indicators-for-the-northeast-ohio-economy.aspx. 2 Raj Chetty, Nathaniel Hendren, Patrick Kline, and Emmanuel Saez, Where is the Land of Economic Opportunity? The Geography of Intergenerational Mobility in the U.S. Quarterly Journal of Economics, 129 (214): , 3 Darrell Gaskin, Thomas LaVeist, and Patrick Richard, The State of Urban Health: Eliminating Health Disparities to Save Lives and Cut Costs. National Urban League Policy Institute, Cedric Herring. Does Diversity Pay?: Race, Gender, and the Business Case for Diversity. American Sociological Review, 74, no. 2 (2009): ; Slater, Weigand and Zwirlein. The Business Case for Commitment to Diversity. Business Horizons 51 (2008): U.S. Census Bureau. Ownership Characteristics of Classifiable U.S. Exporting Firms: 2007, Survey of Business Owners Special Report, June 2012, 6 Kate Pickett and Richard Wilkinson, Income Inequality and Health: A Causal Review. Social Science & Medicine 128 (2015):

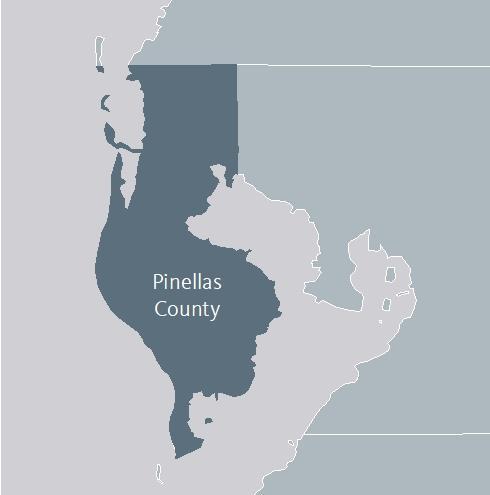
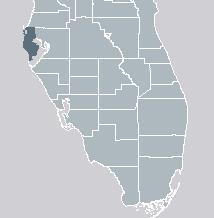
11 An Equity Profile of Pinellas County 11 Introduction Geography This profile describes demographic, economic, and health conditions in Pinellas County, Florida, portrayed in the map to the right. Pinellas County is part of the Tampa-St. Petersburg-Clearwater metropolitan statistical area, which also includes Hillsborough, Hernando, and Pasco counties. Unless otherwise noted, all data follow the Pinellas County geography. Some exceptions, due to lack of data availability, are noted beneath the relevant figures. Information on data sources and methodology can be found in the Data and methods section beginning on page 65.


12 An Equity Profile of Pinellas County 12 Demographics

13 An Equity Profile of Pinellas County 13 Demographics Who lives in the county? The majority of Pinellas County residents are White. Three-quarters of residents are White and one-quarter are Black, Latinx, Asian, or Mixed/other race. The county is much less diverse than the state of Florida, which is 56 percent White and 44 percent people of color. Race, Ethnicity, and Nativity, % Among communities of color in Pinellas, Blacks represent the largest group (10 percent) followed by Latinx (9 percent). The majority of the White, Black, and Latinx populations in Pinellas were born in the U.S., while the majority of the Asian or Pacific Islander population were not. 3% 6% 0.7% 9% 1% 2% 2% The diversity of residents contributes to the richness of Pinellas County. But often, people of color and immigrants face barriers that prevent them from participating fully in the economy. Having inclusive policies or infrastructure in place would benefit not only people of color, but also the county as a whole. 5% Source: Integrated Public Use Microdata Series. Note: Data represent a 2012 through 2016 average. 70%


14 An Equity Profile of Pinellas County 14 Demographics Who lives in the county and how is this changing? The county is experiencing a demographic shift. Demographic change has occurred more slowly in Pinellas County compared to the nation. However, the proportion of the population who are people of color and immigrants continues to steadily increase in the county. The increase in the Latinx population will continue to drive growth in the county. Between 2016 and 2050, the Latinx population is anticipated to increase from 9 percent to 22 percent, and the Asian or Pacific Islander population to increase from 3 percent to 8 percent of the total population. At this rate, the county will be majority people of color in As people of color continue to grow as a share of the workforce and population, their social and economic well-being will determine the county s future success and prosperity. Racial/Ethnic Composition, 1980 to % 2% 1% 2% 3% 3% 4% 5% 7% 8% 5% 3% 4% 5% 6% 8% 9% 9% 11% 14% 10% 18% 11% 22% 12% 90% 14% 89% 15% 83% 75% 72% 66% 58% 50% Projected Sources: U.S. Census Bureau; Woods & Poole Economics, Inc. Note: Data for 2016 represent a 2012 through 2016 average. Much of the increase in the Mixed/other population between 1990 and 2000 is due to a change in the survey question on race.
15 An Equity Profile of Pinellas County 15 Demographics Who lives in the county and how is this changing? The overall population in the county has seen a slight increase (2 percent) since The White population has declined slightly while people of color have driven all of the net population growth. People who identify as two or more races or Other are the fastest growing group, growing by 51 percent. The Latinx population added the most in terms of net change in population, increasing by over 15,000 residents between 2010 and 2016, with the U.S.-born population contributing to the vast majority of the growth. The population of immigrants who are people of color increased by 10 percent, by about 5,200 people. Immigration is an important driver of population growth nationwide, and in many communities, new immigrants are fueling neighborhood revitalization and business growth. Policies that increase access to education, services, and living-wage jobs for immigrants, and remove barriers to their full and equal participation, will help communities thrive. Growth Rates of Major Groups by Race/Ethnicity and Nativity, 2010 to 2016 All White, U.S.-born White, Immigrant Black, U.S.-born Black, Immigrant Latinx, U.S.-born Latinx, Immigrant Asian/Pacific Islander, U.S.-born Asian/Pacific Islander, Immigrant Native American and Alaska Native Mixed/other 2% (+21,210) -1% (-7,057) -2% (-1,269) 3% (+2,334) 3% (+853) 7% (+1,344) 15% (+1,241) Source: Integrated Public Use Microdata Series. Note: Data for 2010 represent a 2006 through 2010 average and data for 2016 represent a 2012 through 2016 average. 34% (+1,641) 34% (+14,432) 46% (+808) 51% (+6,883)
16 An Equity Profile of Pinellas County 16 Demographics Who lives in the county and what is their ancestry? The county's Black, Latinx, and Asian communities are diverse with respect to their ancestry. The Black population is predominantly African American, with most Black immigrants coming from the Caribbean or Sub-Saharan Africa. Within the Latinx community, the largest subgroups are Puerto Ricans and Mexicans. Among Asian or Pacific Islanders, the largest groups are Vietnamese, Indian, and Filipino. Black, Latinx, and Asian/Pacific Islander Populations by Ancestry, 2016 Black Population % Immigrant Latinx Population % Immigrant Caribbean/West Indian 5,302 65% Puerto Rican 17,125 0% Sub-Saharan African 2,751 43% Mexican 16,283 43% European 638 N/A Cuban 8,667 50% Latin American 238 N/A Colombian 3,695 62% North African/Southwest Asian 45 N/A All other Latinx 37,296 33% African American/Other Black 85,747 2% Total 83,066 31% Total 94,721 7% Asian or Pacific Islander Population % Immigrant Vietnamese 6,774 71% Indian 4,829 77% Filipino 4,642 75% Chinese 3,227 76% All other API 11,872 63% Total 31,344 70% Source: Integrated Public Use Microdata Series. Note: Data represent a 2012 through 2016 average. N/A indicates that data on the percent immigrant is not available.
17 An Equity Profile of Pinellas County 17 Demographics Where do people of color live in the county? Communities of color are spread throughout the county but are the most concentrated in urban centers. For example, the highest density neighborhoods of color are located in South St. Petersburg, Downtown Clearwater, and Highpoint. Percent People of Color by Census Tract, % to 15% 15% to 30% 30% to 50% 50% to 99% A long history of segregation and Jim Crow laws has shaped where people of color live, work, and socialize. Institutional practices such as redlining created low-resource neighborhoods with a high concentration of African American residents. For all residents to thrive in inclusive neighborhoods, the county and cities need to develop restorative policies and invest in communities of color. Source: U.S. Census Bureau. Note: Data represent a 2012 through 2016 average. Areas in white are missing data.
18 An Equity Profile of Pinellas County 18 Demographics How do the county s residents differ by age? Young people are leading the demographic shift in the county. Currently, about 41 percent of the youth (under age 18) in Pinellas County are people of color, compared with 11 percent of the county s seniors (65 and older) who are people of color. This 30-percentage point difference between the share of people of color among young and old can be measured as the racial generation gap. Since 1980, the racial generation gap has grown by 14 percentage points. Percent People of Color by Age Group, 1980 to % A recent Pew Research Center report shows wide and growing generational differences in views on racial discrimination and the importance of racism as the main explanation for why people who are Black cannot get ahead. 7 This influences the support for policy approaches to impact equity. Furthermore, the racial generation gap may negatively affect the region if the county does not invest in the educational systems and community infrastructure needed to support the youth population that is more racially diverse. 8 7 Pew Research Center. The Generation Gap in American Politics. March, Manuel Pastor, Justin Scoggins, and Sarah Treuhaft. Bridging the Racial Generation Gap is Key to America s Economic Future. PolicyLink and the USC Program for Environmental and Regional Equity (PERE), September p_%20final.pdf 19% 16 percentage point gap 3% 30 percentage point gap Source: U.S. Census Bureau. Note: Youth include persons under age 18 and seniors include those age 65 or older. Data for 2016 represent a 2012 through 2016 average. 11%
19 An Equity Profile of Pinellas County 19 Demographics Who will be driving growth in the future? The county is relatively older compared to Florida and to the nation. The average resident of Pinellas County is 47 years old, compared to the statewide median of 42 years and the nationwide median of 38 years. Many of the nation s residents move to the region for retirement. Median Age by Race/Ethnicity, 2016 All 47 The county s communities of color are more youthful than its White population. Latinx people, for example, have a median age of 32, while the median age of Whites is 52. White Black As younger populations grow increasingly diverse and the senior population remains largely White, bridging the gap between the two groups will be critical for the economy. Support from older residents for strong public schools for all children and workforce training is needed to prepare the emerging workforce for the jobs of tomorrow. Latinx Asian or Pacific Islander Native American and Alaska Native Mixed/other Source: Integrated Public Use Microdata Series. Note: Data represent a 2012 through 2016 median.
20 An Equity Profile of Pinellas County 20 Demographics Where are the linguistically isolated households? There are pockets of linguistic isolation in Clearwater, Highpoint, and the central region of Pinellas County. These are households in which no member age 14 or older speaks only English or speaks English at least very well. Percent Linguistically Isolated Households by Census Tract, % to 1% 1% to 5% 5 to 10% 10% to 17% Relative to the state and the country, residents in Pinellas County have high English proficiency with only 5 percent of people age five or older reporting speaking English less than very well ; in Florida and the nation, it is 12 percent and 9 percent, respectively. But, there are areas in the county where the proportion of households with low English proficiency is as high as 17 percent. Low English proficiency limits access to vital social services, health care, and neighborhood assets, which excludes linguistically isolated households from participating fully in the community and economy. Source: U.S. Census Bureau. Universe includes all households. Note: Data represent a 2012 through 2016 average. Areas in white are missing data.
21 An Equity Profile of Pinellas County 21 Demographics What is the English proficiency among immigrants? About one-third of all immigrants have limited English proficiency (LEP), defined as speaking English less than very well. The LEP share of the immigrant population has decreased slightly since Black immigrants have the highest levels of Englishspeaking ability with only 16 percent having LEP. Latinx immigrants have the lowest levels of English-speaking ability, followed by Asian/Pacific Islander immigrants. An inclusive county fosters a supportive environment for immigrants to thrive economically and socially. Investing in community resources and infrastructure that support immigrants with different linguistic backgrounds will help to integrate the county s new Americans and grow the economy for everyone. English-Speaking Ability Among Immigrants by Race/Ethnicity, 2010 and 2016 Percent speaking English 33% 32% 29% 34% 18% 17% 46% 43% 31% 34% 14% 15% 13% 11% 7% 6% 6% 6% 2% 2% 77% 64% 20% 14% 11% 5% 3% 5% 9% 11% 28% 20% 24% 19% 34% 22% 20% 14% 19% 18% All immigrants White immigrants Black immigrants Latinx immigrants Asian/Pacific Islander immigrants 30% 29% 19% 2% 39% 20% 17% 6% Source: Integrated Public Use Microdata Series. Universe includes all persons ages 5 or older. Note: Data for 2010 represent a 2006 through 2010 average and data for 2016 represent a 2012 through 2016 average.


22 An Equity Profile of Pinellas County 22 Economic vitality
23 An Equity Profile of Pinellas County 23 Economic vitality How is the economy doing after the Great Recession? The county is struggling to recover from the Great Recession. Before the recession that lasted from late 2007 to mid 2009, the county s economy performed about the same as the nation in job growth and better than the nation in GDP growth. Since 2009, Pinellas County has struggled to catch up to pre-recession level job and GDP growth, and has lagged the nation on both measures. However, it is important to note that nationwide jobs and the GDP have increased throughout 2017 and 2018, which is not reflected in this analysis. While GDP is often the measure of economic health and well-being, job recovery is also necessary for a prosperous economy. Stagnant job growth indicates that the benefits of an expanding economy are not reaching as many workers and their families as they could be. Average Annual Growth in Jobs and GDP, 1990 to 2007 and 2009 to 2016 Jobs GDP 3.2% 1.6% 1.6% 2.6% 2.6% 3.6% 1.2% 1.1% 2.6% 1.5% 2.1% 1.6% Pinellas County All U.S. Pinellas County All U.S % -0.3% 2.5% Southeast Florida All U.S. Southeast Florida All U.S. -0.3% Sources: U.S. Bureau of Economic Analysis; U.S. Bureau of Labor Statistics. Note: GDP growth rates are in real terms (i.e. adjusted for inflation).
24 An Equity Profile of Pinellas County 24 Economic vitality Is the county growing good jobs for everyone? While the country has seen growth across industries, this trend is not true in Pinellas County: jobs in low-wage industries have grown but jobs in middle- and high-wage industries have declined. The decline for middle-wage jobs was most severe at 15 percent. High-wage industries include sectors such as finance and insurance, information, and professional services; middlewage industries include sectors such as manufacturing, health care and social assistance, and construction; low-wage industries include sectors such as retail trade and accommodation and food services. Growth in Jobs by Industry Wage Level, 2000 to 2016 Low-wage Middle-wage High-wage 11% 13% 6% 11% The national trend over recent decades has been one of job polarization, with the largest growth in low- and high-wage industries. Job growth is critical for a region's economic vitality, but it is important to grow good jobs that pay familysupporting wages and offer opportunities for upward mobility. Middle-wage jobs have typically provided opportunities for workers without fouryear college degrees to be financially secure and enter the middle class. Jobs Jobs -3% Pinellas County United States -15% 27% 25% 15% Sources: U.S. Bureau of Labor Statistics; Woods & Poole Economics, Inc. Universe includes all jobs covered by the federal Unemployment Insurance (UI) program. 11% Note: Wage levels for industries are classified based on the industry s average annual wage in The wage level classification for each industry remains the same 10% across all years in order to track the trajectory of jobs and wages of low-, middle-, and high-wage industries. 36%
25 An Equity Profile of Pinellas County 25 Economic vitality Are earnings growing for all workers? Low-wage workers saw the lowest growth in earnings since While job growth for middle-wage industries was the lowest, real (inflation-adjusted) earnings growth was highest in these industries, growing by 13 percent. Average earnings increased by 10 percent for workers in high-wage industries, and by 4 percent for those in low-wage industries. The county did better than the nation overall on earnings growth in middlewage industries, but not as well in low-wage and high-wage industries. Growth in Real Earnings by Industry Wage Level, 2000 to 2016 Low-wage Middle-wage High-wage 13% 10% 17% Wages for workers in low-wage industries are lagging behind other industries. Stagnant wage growth limits the ability of residents and households from accumulating wealth and achieving economic mobility. When all job sectors can enjoy the benefits of a growing economy, workers of all racial and economic backgrounds can thrive. 4% Earnings per worker Pinellas County 25% 27% 6% 6% Earnings per worker United States 36% 15% Sources: U.S. Bureau of Labor Statistics; Woods & Poole Economics, Inc. Universe includes all jobs covered by the federal Unemployment Insurance (UI) program. 11% Note: Earnings growth rates are adjusted for inflation. Wage levels for industries are classified based on the industry s average annual wage in The wage level 10% classification for each industry remains the same across all years in order to track the trajectory of jobs and wages of low-, middle-, and high-wage industries.
26 Level of Inequality An Equity Profile of Pinellas County 26 Economic vitality Is inequality low and decreasing? Income inequality in Pinellas County has been increasing over the last few decades in a trend similar to the nation. Inequality here is measured by the Gini coefficient, which is the most commonly used measure of inequality. The Gini coefficient measures the extent to which the income distribution does not show perfect equality, when every household has the same income. The value of the Gini coefficient ranges from zero (perfect equality) to one (complete inequality where one household has all of the income). Income Inequality, 1989 to There is a growing consensus that inequality has a negative impact on growth. Recent research by prominent economists finds that inequality hinders economic growth, and that greater economic inclusion leads to more robust and sustained growth Gini coefficient measures income equality on a 0 to 1 scale. 0 (Perfectly equal) > 1 (Perfectly unequal) Source: Integrated Public Use Microdata Series. Note: Data for 1990 and 2000 are based on surveys in those years but reflect income from the year prior, while data for 2010 represent a 2006 through 2010 average and data for 2016 represent a 2012 through 2016 average.
27 An Equity Profile of Pinellas County 27 Economic vitality Are incomes increasing for all workers? Declining wages play an important role in the county s increasing inequality. One way to examine wage growth is by percentile of the wage distribution. This means that a worker at the 20 th percentile, for example, earns more than 20 percent of all workers and less than 80 percent of all workers. After adjusting for inflation, wages have declined the steepest for the bottom half of the county s workers. Since 1999, wages fell by 6 percent and 12 percent for workers at the 10 th and 20 th percentiles. Only workers near the top experienced wage growth, with wages increasing by 5 percent for workers at the 90 th percentile. If growth was inclusive, all workers would see rising wages with the largest gains among lower-wage workers. Nationwide, the trend has been the opposite: the wages of low- and middle-wage workers have stagnated or declined. Inequitable income growth contributes to rising inequality which acts as a drag on economic growth. Real Earned Income Growth for Full-Time Wage and Salary Workers Ages 25-64, 1999 to % -6% -12% -7% -3% -3% 2% 4% 5% 5% 10th Percentile 20th Percentile 50th Percentile 80th Percentile 90th Percentile Source: Integrated Public Use Microdata Series. Universe includes civilian non-institutional full-time wage and salary workers ages 25 through 64. Note: Data for 2016 represent a 2012 through 2016 average. Growth rates are adjusted for inflation.
28 An Equity Profile of Pinellas County 28 Economic vitality Is the median hourly wage increasing for all workers? Since 2000, the median hourly wage has declined for workers of color. The median hourly wage for Latinx workers went down $1.60, the largest decrease of all racial and ethnic groups. Wages were highest in 2016 for White workers ($20.20), well above the $15.20 per hour observed for all workers of color combined. No racial/ethnic group has a median wage high enough to be called a living wage for a family of one adult and two children in Pinellas County. According to the MIT Living Wage Calculator, the living wage for a family of three with one adult is just under $29/hour in Pinellas County. 9 The decline of the median hourly wages further puts financial burden on the residents of Pinellas County, especially on its people of color. Median Hourly Wage by Race/Ethnicity, 2000 and 2016 $19.90 $20.20 $19.40 $19.30 $16.60 $15.40 $15.00 $14.80 $17.70 $16.30 $18.50 $17.00 $16.50 $15.20 All (% of White (75%) Black (10%) Latinx (9%) Asian or Mixed/other population in Pacific (2%) 2016) Islander (3%) People of Color (25%) 9 Living Wage Calculator. Living Wage Calculation for Pinellas County, Florida. Amy K. Glasmeler and the Massachusetts Institute of Technology. Accessed March 26, Source: Integrated Public Use Microdata Series. Universe includes civilian non-institutional full-time wage and salary workers ages 25 through 64. Note: Data for 2016 represent a 2012 through 2016 average. Note: Values are in 2016 dollars.
29 An Equity Profile of Pinellas County 29 Economic vitality Is the middle class expanding? Middle-income households are on the decline while low-income households are on the rise. Since 1989, the share of households with middle incomes decreased from 41 to 36 percent while the share of households with lower incomes increased from 30 to 37 percent. The share of households with upper incomes declined during the 1990s but has slowly increased since. In this analysis, households with middle income are defined as having incomes in the middle 40 percent of household income distribution in In 1989, those household incomes ranged from $32,799 to $76,138. To assess change in the middle income and the other income ranges, we calculated what the income range would be today if incomes had increased at the same rate as average household income growth. Investments in community and economic resources for households with low incomes are also necessary for a healthy economy. When no residents are economically insecure, quality of life increases for the entire county. Households by Income Level, 1989 to 2016 $76,138 $32,799 29% Upper 27% 41% 30% Middle Lower 36% 37% $79,064 $34,060 Source: Integrated Public Use Microdata Series. Universe includes all households (no group quarters). Note: Data for 2010 represent a 2006 through 2010 average and data for 2016 represent a 2012 through 2016 average. Dollar values are in 2016 dollars.
30 An Equity Profile of Pinellas County 30 Economic vitality Can all residents reach employment? Unemployment rates were highest for Black workers and lowest for White workers in the county. Among Black adults ages 25 to 64 years, 10 percent were unemployed. Those identifying as Mixed or Other race had the second highest unemployment rate at over 8 percent. Unemployment Rate by Race/Ethnicity, 2016 All 7% In an equitable county, unemployment would be low and all workers would have similar success in finding work, regardless of race. Racial differences in employment result from differences in education, training, and experience as well as barriers to employment for workers of color, such as English language ability, immigration status, criminal records, lack of transportation access, and racial discrimination among employers and institutions. Policy and systems changes that remove these barriers will lead to greater labor force participation and a stronger economy. White Black Latinx Asian or Pacific Islander Mixed/other 6% 7% 7% 8% 10% Source: Integrated Public Use Microdata Series. Universe includes the civilian noninstitutionalized labor force ages 25 through 64. Note: Data represent a 2012 through 2016 average.
31 An Equity Profile of Pinellas County 31 Economic vitality How likely are residents to be unemployed compared to the region? In December 2018, Pinellas County s unemployment rate was 3.1 percent, lower than that of the state (3.3 percent) and the nation overall (3.7 percent). The county and the region are doing well compared to the state and the nation. However, this still means that over 15,000 people in Pinellas County are unemployed. Unemployment Rate, Not Seasonally Adjusted, December 2018 United States 3.7% Florida 3.3% Tampa-St. Petersburg- Clearwater, FL Metro Area 3.2% Pinellas County, FL 3.1% Source: U.S. Bureau of Labor Statistics. Universe includes the civilian noninstitutionalized labor force ages 16 and older. Note: U.S. Bureau of Labor Statistics does not have monthly unemployment data broken down by race and ethnicity, but provides the most recent data. Data for the Tampa-St. Petersburg-Clearwater metro area and Pinellas County is preliminary..
32 An Equity Profile of Pinellas County 32 Economic vitality Where is unemployment most prevalent? There are neighborhoods with high unemployment rates across the entire county. While unemployment tends to be more concentrated around the cities, suburban areas are not immune to economic recession. Many neighborhoods with high unemployment are located in Clearwater, St. Petersburg, Highpoint, and Tarpon Springs. Unemployment Rate by Census Tract, % to 5% 5% to 10% 10% to 15% 15% to 28% The unemployment rate captures only the workers who are not employed but still looking for jobs. This does not include those who are discouraged from the job search because of a negative economic climate or have given up. Having a large unemployed workforce as well as a discouraged worker population hamper the prosperity of the county. Investments and growing good jobs in every part of Pinellas County are necessary for a prosperous economy where all can participate fully. Source: U.S. Census Bureau. Universe includes the civilian noninstitutionalized labor force ages 16 and older. Note: Data represent a 2012 through 2016 average.
33 An Equity Profile of Pinellas County 33 Economic vitality Does education lead to employment for everyone? In general, unemployment decreases as educational attainment increases. Black workers face higher levels of unemployment than White workers at every level of education. Among college graduates, 6 percent of Black workers are unemployed compared with 4 percent of White workers. Racial disparities exist for African Americans at all education levels. Among those with less than a high school diploma, African Americans have a much higher likelihood to be unemployed than White and Latinx residents. While obtaining postsecondary training or credentials is often critical to accessing quality jobs, data are not available to track this at the county level. Access to educational opportunities provide a foundation for a strong and skilled work force. Equitable access to education is crucial for all residents to participate and contribute to a thriving economy. Unemployment Rate by Educational Attainment and Race/Ethnicity, % 26% 13% Less than a HS Diploma 8% 10% 9% 9% 4% HS Diploma, no College 6% More than HS Diploma but less than BA Degree 4% 6% 3% BA Degree or higher Source: Integrated Public Use Microdata Series. Universe includes the civilian non-institutional labor force ages 25 through 64. Note: Data represent a 2012 through 2016 average. Data for some racial/ethnic groups are excluded due to small sample size.

34 An Equity Profile of Pinellas County 34 Economic vitality Does higher education lead to better wages for everyone? Wages also tend to increase with higher educational attainment, but people of color have lower median hourly wages at nearly every education level compared with their White counterparts. White workers with only a high school diploma earn more than workers of color with some college or an associate s degree. Median Hourly Wages by Educational Attainment and Race/Ethnicity, 2016 The racial wage gap persists even at the highest education levels. The median wage of Black and Latinx workers with a bachelor s degree or higher is $21.30 and $22.80/hour, respectively, compared with $27.20/hour for their White peers. In an equitable county, wages would reflect differences in education, training, experience, and pay scales, but would not vary systematically by race. Racial gaps in wages between those with similar levels of education suggests discrimination among employers. Policy and systems changes that ensure equal pay for equal work and fair hiring will boost incomes, driving economic growth and job creation. $13.70 $10.60 Less than a HS Diploma $16.20 $12.80 $12.50 HS Diploma, no College $19.30 $15.30 $14.80 $13.90 More than HS Diploma but less than BA Degree $27.20 $21.30 $22.80 BA Degree or higher $30.30 Source: Integrated Public Use Microdata Series. Universe includes civilian noninstitutional full-time wage and salary workers ages 25 through 64. Note: Wages for some racial/ethnic groups are excluded due to small sample size. Data represent a 2012 through 2016 average. Values are in 2016 dollars. Data for some racial/ethnic groups are excluded due to small sample size.
35 An Equity Profile of Pinellas County 35 Economic vitality Is poverty low and decreasing? For most racial groups, the poverty rate has increased from 2010 to 2016, but people of color continue to be most impacted by economic insecurity. African Americans have the highest poverty rate at 29 percent. About two in nine Latinx people and Native Americans live below the federal poverty level compared with about one in nine Whites. Poverty Rate by Race/Ethnicity, 2010 and 2016 All % 14% High rates of poverty negatively impact everyone, costing the economy and weakening the middle class and civic engagement. The economic and social health of Pinellas County will thrive when all households are economically secure. White 9% 12% All 12.0% 14.4% Black White 9.3% 11.6% Latinx 18% Black Asian or Pacific Islander 12% 12% Latinx 17.8% 22% 27.5% 22.1% 28% 28.7% 29% Native American Asian or Pacific Islander 12.2% 12.5% 19% 22% Mixed/other Native American 18.9% 17% 22.1% 19% Mixed/Other 16.8% 19.0% Source: Integrated Public Use Microdata Series. Universe includes all persons not in group quarters. Note: Data for 2010 represent a 2006 through 2010 average and data for 2016 represent a 2012 through 2016 average.
36 An Equity Profile of Pinellas County 36 Economic vitality Is the share of workers who work full time and have income below poverty low and decreasing? While the proportion of workers of color who work full-time yet have income leaving them in poverty has either remained the same or declined since 2010, they are still more likely to be struggling economically than White workers. The working-poor rate defined as those working full-time with family income at or below 200 percent of poverty is highest among Latinx and Black workers at 19 percent. As the low-wage sector has grown, the share of adults who are working full-time jobs but still cannot make ends meet has increased, particularly among Latinx and Black workers. The failure of even full-time work to pay family-supporting wages limits the ability of workers to build wealth, provide for their families, and participate fully in the economy. Working-Poor Rate by Race/Ethnicity, 2010 and 2016 All White All White Black Black Latinx Latinx Asian or Pacific Islander Asian or Pacific Islander Native Mixed/other American 9.3% 7% 12.0% 12.2% 10% 7% 11.6% 14.4% 17.8% 12.5% 18.9% 10% 13% 13% 27.5% 22.1% 14% 13% 22.1% 19% 19% 28.7% 19% 22% Mixed/Other 16.8% 19.0% Source: Integrated Public Use Microdata Series. Universe includes the civilian noninstitutional population ages 25 through 64 not living in group quarters who worked at all during the year prior to the survey. Note: Data for 2010 represent a 2006 through 2010 average and data for 2016 represent a 2012 through 2016 average.
37 An Equity Profile of Pinellas County 37 Economic vitality Is child poverty low and decreasing? Black and Latinx children have the highest poverty rates. In 2016, the child poverty rate for Black children was 43 percent, nearly double the county average. By way of comparison, only about 15 percent of White children lived in poverty. The rate for all children of color combined was 32 percent. Child Poverty Rate by Race/Ethnicity, 2016 All 22% Family, school, and community environments are critical in children s healthy development. According to the Tampa Bay Times, children in the Tampa Bay Area who live in poverty have less access to educational opportunities and quality health care. 10 When families are economically secure, the future generation is set up for success. Black People of color Latinx Other Asian/Pacific Islander 18% 23% 27% 32% 43% White 15% 10 Caitlin Johnston. In Tampa Bay, this is what child poverty looks like. Tampa Bay Times. July 25, Source: Integrated Public Use Microdata Series. Universe includes the population under age 18 not in group quarters. Note: Data represent a 2012 through 2016 average.
38 An Equity Profile of Pinellas County 38 Economic vitality What neighborhoods have the highest poverty rates? Poverty rates are highest around the urban centers of the county. Neighborhoods with high levels of poverty are seen in cities such as St. Petersburg, Pinellas Park, Clearwater, and Tarpon Springs. Central regions of the county such as Highpoint also see a large share of their population in poverty. Percent Population Below the Poverty Level by Census Tract, % to 10% 10% to 20% 20% to 30% 30% to 52% People who live in high-poverty neighborhoods have less access to jobs, services, high-quality education, parks, safe streets, and other essential ingredients of economic and social success that are the backbone of strong economies. People of color particularly African Americans, Latinx people, and Native Americans are significantly more likely than their White counterparts to live in high-poverty neighborhoods, even if they themselves are not poor. Sources: U.S. Census Bureau; TomTom, ESRI, HERE, DeLorme, MaymyIndia, OpenStreetMap contributors, and the GIS user community. Universe includes all persons not in group quarters. Note: Data represent a 2012 through 2016 average.
39 An Equity Profile of Pinellas County 39 Economic vitality Do workers have the education and skills needed for the jobs of the future? According to the Georgetown Center on Education and the Workforce, in 2020, 41 percent of jobs in Florida will require an Associate s degree or higher. 11 While many of the region s workers currently have that level of education, there are large racial gaps in educational attainment. Only 32 percent of Latinx residents and 28 percent of African Americans have an associate s degree or higher. While obtaining postsecondary training or credentials is often critical to accessing quality jobs, data are not available to track this at the county level. America's future jobs will require ever-higher levels of skills and education, but our education and job training systems are not adequately preparing Latinx, African Americans, and other workers of color who are growing as a share of the workforce to succeed. Closing wide and persistent racial gaps in educational attainment will be key to building a strong workforce that is prepared for the jobs of the future. Share and Count of Working-Age Population with an Associate s Degree or Higher by Race/Ethnicity, 2016, and Projected Share of Jobs that Require an Associate s Degree or Higher, % (13,623) 32% (13,790) 34% (40,253) 41% (2,795) 44% (165,665) 50% (9,525) 41% 11 Anthony P. Carnevale, Nicole Smith, and Jeff Strohl. Recovery Job Growth and Education Requirements through 2020: State Report. Washington, DC: Georgetown University Source: Georgetown Center on Education and the Workforce; Integrated Public Use Microdata Series. Universe for education levels of workers includes all persons ages 25 through 64. Note: Data for 2016 by race/ethnicity represent a 2012 through 2016 average for Pinellas County; data on jobs in 2020 represent a state-level projection for Florida.


40 An Equity Profile of Pinellas County 40 Youth preparedness
41 An Equity Profile of Pinellas County 41 Youth preparedness Do all youth have a high school degree or are they pursuing one? The share of youth who do not have a high school education and are not pursuing one has declined since 2000 for all racial/ethnic groups. Despite the progress, Black and Latinx youth are still far less likely to finish high school than White youth; 12 percent of Black youth and 11 percent of Latinx youth lack a high school education and are not pursuing one whereas the rate for White youth is only 6 percent. Ensuring that youth are educated, healthy, and ready to thrive in the workforce is essential for economic prosperity. Not accessing education early in life can have long-lasting impacts including lower earnings, higher public expenditures, lower tax revenues, and lost human potential. Share of 16- to 24-Year-Olds Not Enrolled in School and Without a High School Diploma by Race/Ethnicity, 2000 to % 15% 16% 13% 12% 12% 11% 9% 7% 6% 5% 2% White Black Latinx Asian or Pacific Islander Source: Integrated Public Use Microdata Series. Universe includes 16 through 24 year olds. Note: Data for 2010 represent a 2006 through 2010 average and data for 2016 represent a 2012 through 2016 average.
42 An Equity Profile of Pinellas County 42 Youth preparedness Do all youth have a high school degree or are they pursuing one? Overall the share of youth who do not have a high school degree and are not pursuing one is about the same for female and male youth, but this does not hold across racial/ethnic groups. Black and Latinx young men are more likely than Black and Latinx young women to be lacking a high school diploma and not in pursuit of one. Share of 16- to 24-Year-Olds Not Enrolled in School and Without a High School Diploma by Race/Ethnicity and Gender, 2016 Male Female 13% 13% Support for youth of color, especially young men, in accessing educational opportunities will prepare the future generation to succeed in the workforce and grow a prosperous economy for all. 6% 6% 10% 10% 27% 25% 8% 7% 7% 7% 6% 4% White 2% 1% Black Latinx All White Black Latino, U.S.-born Latino, Immigrant 1% 2 Asian/Pa Island Source: Integrated Public Use Microdata Series. Universe includes 16 through 24 year olds. Note: Data for some racial/ethnic groups are excluded due to small sample size. Data represent a 2012 through 2016 average.
43 An Equity Profile of Pinellas County 43 Youth preparedness Who are the youth not working or in school? The number of disconnected youth who are neither in school nor working remains high. While the raw number of disconnected youth has increased for all racial/ethnic groups, youth of color are disproportionately impacted. Disconnected Youth: 16- to 24-Year-Olds Not in School or Work by Race/Ethnicity, 1990 to 2016 API, Native American or Mixed/other Latinx Black White The number of disconnected youth has increased since By 2016, more than 3,000 Black young people were not in school or working. The number of White, Latinx and all other disconnected youth has also increased since Youth of color are far more likely to be disconnected than White youth. In 2016, youth of color were 36 percent of all youth but were 46 percent of the county s disconnected youth. Too many youth particularly youth of color are disconnected from educational or employment opportunities and this limits their ability to succeed in the workforce later in life. 16,000 14,000 12,000 10,000 8,000 6,000 4,000 2, ,000 14, , ,550 10, ,488 1,488 1, ,493 1,493 8,000 3,287 1,947 1,947 2,550 3,287 1,878 1,878 2,550 6,000 4,000 2,000 6,293 5,944 6,268 6,779 6, ,944 6,268 6, Source: Integrated Public Use Microdata Series. Universe includes total population ages 16 to 24 (including group quarters). Note: Data for some racial/ethnic groups are excluded due to small sample size. Data for 2010 represent a 2006 through 2010 average and data for 2016 represent a 2012 through 2016 average.
44 An Equity Profile of Pinellas County 44 Youth preparedness Have youth been prepared to enter the workforce? The number of disconnected male youth has been growing faster than their female counterparts. The number of young men who are disconnected from school or work increased by 19 percent (about 1,100 people) from 2010 to 2016, with the number of disconnected young men of color increasing by 48 percent. The number of young women who are not in school or work only increased by 7 percent (about 350 people). Access to education and job training connects youth of color, especially young men of color, to good paying jobs that support their cost of living and sets the community up for success for the future. Disconnected Youth: 16- to 24-Year-Olds Not in School or Work by Race/Ethnicity and Gender, 2000 to ,000 7,000 6,000 1, ,000 1, ,069 1,305 4,000 1,355 2, ,203 1,151 1,195 3,000 2,000 1, ,854 3,447 3,475 3,090 2,821 3, Male Female Source: Integrated Public Use Microdata Series. Universe includes total population ages 16 to 24 (including group quarters). Note: Data for some racial/ethnic groups are excluded due to small sample size. Data for 2010 represent a 2006 through 2010 average and data for 2016 represent a 2012 through 2016 average.
45 An Equity Profile of Pinellas County 45 Youth preparedness Do all children have equitable access to opportunity-rich neighborhoods? Child opportunity is the highest in parts of the north county and waterfront regions compared to the cities. In areas that score low on the Child Opportunity Index, such as Tarpon Springs, South St. Pete, and Clearwater, children tend to have less access to educational, health, and social opportunities that are crucial for their wellbeing and success. These are the same parts of the county with a greater concentration of Black and Latinx households. Composite Child Opportunity Index by Census Tract Very high High Moderate Low Very low Living in a thriving community with access to quality educational and health resources leads to positive cognitive and physical development for children. However, when neighborhoods lack access to these opportunities, children and families suffer, especially people of color. Sources: The diversitydatakids.org Project and the Kirwan Institute for the Study of Race and Ethnicity; TomTom, ESRI, HERE, DeLorme, MaymyIndia, OpenStreetMap contributors, and the GIS user community. Note: The Child Opportunity Index is a composite of indicators across three domains: educational opportunity, health and environmental opportunity, and social and economic opportunity. The index is a relative measure of opportunity within the Tampa-St. Petersburg-Clearwater metropolitan area. The vintage of the underlying indicator data varies, ranging from years 2007 through The map was created by ranking the census tract level Overall Child Opportunity Index Score into quintiles for Pinellas County.


46 An Equity Profile of Pinellas County 46 Connectedness
47 An Equity Profile of Pinellas County 47 Connectedness Are residents paying too much for housing? High rent burden is a county-wide issue. In several communities a large share of renter households spend more than 50 percent of income on rent. With the rise in upscale development in the downtowns and waterfront areas, affordable housing will continue to be a barrier to equitable growth for all Pinellas residents. Percent Severely Rent-Burdened Households by Census Tract, % to 15% 15% to 20% 20% to 30% 30% to 40% 40% to 74% Quality, stable, and affordable housing is foundational for health and economic security. 12 However, housing is the single largest expense for most households. Rising costs and stagnant wages mean that many are paying too much for housing, particularly lowincome households and households of color. High housing costs squeeze household budgets, making it difficult to pay for even basic expenses, save for emergencies, or make long-term investments in their communities. 12 Foundation for a Healthy St. Petersburg. Home: A Pathway to Health Equity through Housing: An Assessment of the Connection between Housing and Health in Pinellas County, Florida. Foundation for a Healthy St. Petersburg and Collaborative Solutions Sources: U.S. Census Bureau; TomTom, ESRI, HERE, DeLorme, MaymyIndia, OpenStreetMap contributors, and the GIS user community. Universe includes all renter-occupied households with cash rent. Note: Data represent a 2012 through 2016 average.

48 An Equity Profile of Pinellas County 48 Connectedness Can all renters maintain stable housing? There are evictions in nearly every neighborhood in Pinellas County. In 2016, there were nearly 4,000 evictions in Pinellas County, an eviction rate of 2.5 percent. While the overall eviction rate in the county was lower than that of neighboring Hillsborough (3.3 percent) and Pasco counties (3.2 percent), some areas in Pinellas County had as many as 13 evictions for every 100 renter homes in a single year. Since 2010, the share of households that own their homes has declined by 6 percentage points. With more renter households, evictions will be an issue for more families and communities. Eviction Rates of Renter Homes, % to 1% 1% to 2.5% 2.5% to 5% 5% to 10% 10% to 13% Displacement from a stable home disconnects people from social, educational, and occupational resources. In addition to social and health detriments to the individual, evictions also disrupt the social fabric of a community. When households are able to remain in their homes, build social networks, and invest in their neighborhood, the community as a whole thrives. Sources: Eviction Lab, Princeton University, TomTom, ESRI, HERE, DeLorme, MaymyIndia, OpenStreetMap contributors, and the GIS user community. Universe includes all renter-occupied households. Note: The eviction rate is calculated as the number of homes receiving an eviction judgement ordering renters to leave divided by the total number of renter-occupied units in a given area.
49 An Equity Profile of Pinellas County 49 Connectedness Are residents able to own their homes? In Pinellas County, the majority of White and Asian or Pacific Islander households own their homes (69 percent and 68 percent, respectively). Homeownership rates for Black households (35 percent) and Latinx households (41 percent) are well below the county average (64 percent). Owner-Occupied Households by Race/Ethnicity, % 69% Homeownership remains one of the major ways to build wealth, especially across generations. However, discriminatory policies extending from redlining and Jim Crow laws have limited access to homeownership for people of color and stifled generational wealth that is still felt today. 35% 41% 47% Black Latinx Mixed/other Asian or Pacific Islander White Source: Integrated Public Use Microdata Series. Universe includes all households (excludes group quarters). Note: Data represent a 2012 through 2016 average.
50 An Equity Profile of Pinellas County 50 Connectedness Do all residents have access to a vehicle? In a county where the built environment requires people to rely heavily on driving, most households (91 percent) have at least one vehicle. But access to a vehicle remains a challenge for households across the entire county. Compared with 8 percent of White households, 17 percent of Black and 11 percent of Latinx households do not have a vehicle. Percent of Households Without a Vehicle by Census Tract, % to 5% 5% to 10% 10% to 15% 15% to 36% Coupled with a limited public transit system in the county, many people of color are excluded from employment opportunities in other parts of the county that may provide better wages. The lack of vehicle ownership also forces residents to walk or bike longer distances, often in the dark and along roadways built for speed and lacking safe accommodations. Sources: U.S. Census Bureau; TomTom, ESRI, HERE, DeLorme, MaymyIndia, OpenStreetMap contributors, and the GIS user community. Note: Universe includes all households (excludes group quarters). Note: Data represent a 2012 through 2016 average.

51 An Equity Profile of Pinellas County 51 Connectedness How do residents get to work? The vast majority of residents in Pinellas County drive alone to work. Single-driver commuting, however, fluctuates with income. Just under 70 percent of very low-income workers (earning under $10,000 per year) drive alone to work, compared to 81 percent of workers who make $75,000 or more a year. For households living in neighborhoods without robust transit systems, access to a car is critical, but people with lower incomes and people of color are more likely to be carless. Means of Transportation to Work by Annual Earnings, % 6% 4% 4% 5% 6% 7% 5% 4% 4% 4% 3% 3% 9% 8% 7% 5% 4% 9% 10% 12% 12% 4% Reliable and affordable transportation is critical for meeting daily needs and accessing educational and employment opportunities located throughout the county and beyond. But the high costs of owning a vehicle, as well as repairs and maintenance, can place a burden on households, especially for families with low incomes. Unexpected repairs can put a car out of commission or take a chunk out of savings, both of which would disrupt household finances for months or years. 69% Less than $10,000 75% 78% $10,000 to $14,999 $15,000 to $24,999 82% 84% 85% 85% $25,000 to $34,999 $35,000 to $49,999 $50,000 to $64,999 $65,000 to $74,999 81% $75,000 or more Source: Integrated Public Use Microdata Series. Universe includes workers ages 16 and older with earnings. Note: Data represent a 2012 through 2016 average. Dollar values are in 2016 dollars.

52 An Equity Profile of Pinellas County 52 Connectedness Who relies on public transit to get to work? Income and race both play a role in determining who uses the county s public transit system to get to work. Households of color are the most likely to be dependent on public transit. Among very low-income Black residents, 11 percent get to work using public transit, while 6 percent do among those earning $15,000-$35,000 per year. Percent Using Public Transit by Annual Earnings and Race/Ethnicity, 2016 A limited public transit network restricts lowincome residents from accessing social, educational, and job opportunities in other parts of the county. Many of the high-wage jobs in Pinellas are located in mid-county, St. Petersburg, and in north county, all areas that generally lack good transit service. With good paying jobs located throughout the county and region, investment in accessible public transit will be crucial for all residents to enjoy economic prosperity. 11% 10% 9% 6% 4% 3% 3% 1% 2% 1% 2% 1% 1% 0% 0% 0% 0% 0% 0% 0% Less than $15,000 $15,000-$34,999 $35,000-$64,999 $65,000 or more Source: Integrated Public Use Microdata Series. Universe includes workers ages 16 and older with earnings. Note: Data for 2016 represent a 2012 through 2016 average. Differences in bars with 0 percent are due to rounding values less than 0.5 percent to 0 percent.
53 An Equity Profile of Pinellas County 53 Connectedness How long do residents travel to get to work? Workers in Pinellas County have shorter commute times than those in neighboring counties, with an average commute of 24 minutes compared to 27 and 31 minutes in Hillsborough and Pasco counties. However, the population density is much higher in Pinellas County, which suggests that workers are able to commute to jobs closer to where they live. Average Travel Time to Work in Minutes by Census Tract, to 21 minutes 21 to 23 minutes 23 to 25 minutes 25 to 27 minutes 27 to 39 minutes Northern county and along the beaches are residential areas and tend to be further from jobs, which result in long commutes. Households in the parts of Clearwater and St. Petersburg with long commute times tend to have lower incomes and decreased access to vehicles, which means that many residents are commuting to work using public transit. When not all workers have reasonable commutes, households have to spend more on child care and have a lower quality of life. Employers also suffer from high turnover and employee dissatisfaction, and the public is affected by more carbon emissions and congestion. Sources: U.S. Census Bureau; TomTom, ESRI, HERE, DeLorme, MaymyIndia, OpenStreetMap contributors, and the GIS user community. Note: Universe includes all persons ages 16 or older who work outside of home. Data represent a 2012 through 2016 average.
54 An Equity Profile of Pinellas County 54 Connectedness Do all residents register to vote in elections? Voter registration for the 2016 general election was the highest among White residents. In Pinellas County, 51 percent of Latinx residents and 58 percent of Asian or Pacific Islander residents 18 years or older were registered to vote, compared with 85 percent of White residents. Participation in elections is necessary to ensure fair representation in local, state, and federal governments. But historically, people of color have lower voter registration rates due to structural barriers such as voter suppression, mass incarceration, difficult paths to citizenship, and lack of documentation that limits voting eligibility. Policies that enfranchise residents will help to create a more fair and democratic society. For example, the passing of Amendment 4 in 2018 restored the right to vote for Floridian residents with felony convictions who have completed the terms of their sentences. Share of Adult (18 or Older) Population Registered to Vote in the 2016 General Election by Race/Ethnicity 90% 85% 78% 80% 61% 61% 51% 58% White Black Latinx Asian or Pacific Islander Sources: Florida Division of Elections; Integrated Public Use Microdata Series. Note: Population data represent a 2012 through 2016 average. Universe includes people 18 years and older.
55 An Equity Profile of Pinellas County 55 Connectedness Do all residents participate in elections? Voter participation for both the 2016 and 2018 general elections was the highest among White voters. Among those registered to vote, 69 percent of Latinx residents and 70 percent of Black residents voted in the 2016 general election compared with 79 percent of White residents. Voter participation was higher across all racial and ethnic groups in 2016, which is to be expected given it was a presidential election. Participation in elections is necessary to ensure fair representation in local, state, and federal governments. But historically, people of color have lower voter registration rates due to structural barriers such as voter suppression, mass incarceration, difficult paths to citizenship, and lack of documentation that limits voting eligibility. Voter Participation of Registered Voters for the 2016 and 2018 General Elections by Race/Ethnicity % 68% 70% 69% 69% 61% 53% 55% White Black Latinx All other Total White Black Latinx All other Source: Pinellas County Supervisor of Elections,


56 An Equity Profile of Pinellas County 56 Justice
57 An Equity Profile of Pinellas County 57 Justice Are residents treated fairly by law enforcement? Black and Native American defendants in Pinellas County are more likely than Whites to be subject to misdemeanor referrals where the only charge is resisting arrest. Black defendants are more than twice as likely as White defendants to have resisting arrest as their only charge. This racial disparity is much larger in Pinellas County compared to the state. A resisting arrest charge can be broadly applied to situations where the law enforcement officer believes that the defendant is obstructing an arrest. However, racial differences may be due to systemic policing in communities of color or a police officer s implicit bias that leads to the perception of Black suspects as more resistant or aggressive than White suspects in the same situation. Unjust and unequal treatment continues to oppress communities of color and prevents Pinellas County from being an inclusive county for all. Percentage of Misdemeanor Referrals in which Resisting Arrest was the Only Charge by Race/Ethnicity, 2009 to % 4% 5% 9% 2% 4% White Black Asian or Pacific Islander 3% 6% Native American Source: Measures for Justice, Universe includes all misdemeanor referrals. Note: The defendant s race is often recorded based on an assessment made by the criminal justice officer who had initial contact with the defendant. Race and ethnicity categories mirror those used by the U.S. Census Bureau. Florida courts classify Hispanics/Latinx as White. Cases where there was an open warrant that resulted in a single charge of resisting arrest are included. Data reflect a 2009 through 2013 average.
58 An Equity Profile of Pinellas County 58 Justice Are all residents being treated fairly by the court of law? Of all nonviolent felony convictions involving a defendant with no violent convictions in Florida in the past three years, Black defendants are more likely than their White and Asian counterparts to be sentenced to prison. In Pinellas County, 24 percent of Black defendants who are convicted of a nonviolent felony (and have no violent conviction in Florida in the past three years) are given a prison sentence while only 17 percent of White defendants are. When people are treated unequally for similar crimes, it shows that the criminal justice system is inequitable. Black communities continue to be disrupted when Black residents are more likely to be imprisoned than Whites. Percentage of Nonviolent Felony Convictions Resulting in a Prison Sentence by Race/Ethnicity, 2012 to % 24% 21% 17% 15% 10% White Black Asian or Pacific Islander Source: Measures for Justice, Universe includes all nonviolent felony convictions involving a defendant with no violent convictions in Florida in the prior three years. Note: The defendant s race is often recorded based on an assessment made by the criminal justice officer who had initial contact with the defendant. Race and ethnicity categories mirror those used by the U.S. Census Bureau. Florida courts classify Hispanics/Latinx as White. Data reflect a 2012 through 2013 average.
59 An Equity Profile of Pinellas County 59 Justice Are all residents being treated fairly by the court of law? Of all drug possession convictions where the defendant has no violent convictions in Florida in the past three years, Black defendants are more likely to go to jail. In Pinellas County, the rate at which nonviolent Black defendants are sentenced to jail for drug possession is 34 percent compared with only 26 percent of White defendants. According to reports by the Sarasota Herald Tribune, Black defendants throughout Florida face harsher sentences than their White counterparts for the same charges. 13 Percentage of Drug Possession Convictions Resulting in a Jail Sentence by Race/Ethnicity, 2012 to % 34% Racial prejudice and discrimination are prevalent throughout the criminal justice system, leading to differential sentencing on the basis of race. While Whites are more likely to be placed in drug treatment programs in lieu of punishment, Black defendants are systemically given harsher punishments. Not only does an inequitable justice system create lasting damages in a person s personal life and job prospects, it also removes resources and community members from already marginalized communities. White Black 13 Josh Salman, Emily Le Coz, and Elizabeth Johnson. Florida s broken sentencing system: Designed for fairness, it fails to account for prejudice. Herald Tribune. Dec 13, Source: Measures for Justice, Universe includes all drug possession convictions involving a defendant with no violent convictions in Florida in the prior three years. Note: The defendant s race is often recorded based on an assessment made by the criminal justice officer who had initial contact with the defendant. Race and ethnicity categories mirror those used by the U.S. Census Bureau. Florida courts classify Hispanics/Latinx as White.


60 An Equity Profile of Pinellas County 60 Health of residents
61 An Equity Profile of Pinellas County 61 Health of residents Do residents have health insurance? People of color are less likely than Whites to have health insurance coverage as adults. In 2016, 71 percent of Latinx adults and 78 percent of adults of Mixed or Other race in the county had coverage compared with 88 percent of White adults. Black, Latinx, and Asian or Pacific Islander people under 26 years old were also less likely to have health insurance compared with their White counterparts. Without access to health insurance, many people go without medical treatment and preventative care that are crucial to physical and mental well-being. A healthy population is necessary for a thriving county. Health Insurance Coverage Rates by Race/Ethnicity and Age, % 88% 85% 81% 81% 82% 71% 89% 80% 78% White Black Latinx Asian or Pacific Islander Mixed/other Source: Integrated Public Use Microdata Series. Note: Data represent a 2012 through 2016 average.
62 An Equity Profile of Pinellas County 62 Health of residents What types of health insurance do residents have? For all racial/ethnic groups, most people who have health insurance are covered by private insurance. In Pinellas County, 38 percent of Black residents and 29 percent of Latinx residents have public insurance compared with only 23 percent of Whites and 17 percent of Asian or Pacific Islanders. Public insurance such as Medicare and Medicaid provide important health care coverage for residents who are older and have low income. Access to preventative care and quality medical services helps to ensure that everyone is able to live in a healthy community. Health Insurance Coverage Rates by Race/Ethnicity and Insurance Type, 2016 Private Public 88% 65% 83% 45% 38% 65% 75% 46% 45% 38% 81% 64% 46% 84% 55% 64% 55% 23% 23% 29% 29% 17% 29% 17% 29% White Black Latinx Asian or Mixed/other Pacific White Black Latinx Asian or Pacific Mixed/other Islander Islander Source: Integrated Public Use Microdata Series. Note: Data represent a 2012 through 2016 average. Private insurance includes health care coverage provided through employer, bought directly, or covered by TRICARE or another military health program. Public insurance includes health care coverage provided through Medicare, Medicaid or other government assistance, and VA health care.


63 An Equity Profile of Pinellas County 63 Economic benefits of equity
Equitable Growth Profile of the. Omaha-Council Bluffs Region 2018 updated analysis
 Equitable Growth Profile of the Omaha-Council Bluffs Region 2018 updated analysis 2 Summary The Omaha-Council Bluffs region continues to undergo a demographic transformation that has major implications
An Equity Profile of. Jackson
 An Equity Profile of Jackson An Equity Profile of Jackson PolicyLink and PERE 2 Acknowledgments PolicyLink and the Program for Environmental and Regional Equity (PERE) at the University of Southern California
An Equity Profile of. Grand Rapids. Supported by: Insert Map
 An Equity Profile of Grand Rapids Supported by: Insert Map An Equity Profile of Grand Rapids Table of contents PolicyLink and PERE 2 3 8 14 24 59 74 85 91 94 Summary Introduction Demographics Economic
An Equity Profile of. Albuquerque
 An Equity Profile of Albuquerque An Equity Profile of Albuquerque PolicyLink and PERE 2 Acknowledgments PolicyLink and the Program for Environmental and Regional Equity (PERE) at the University of Southern
Advancing Health Equity and Inclusive Growth in the. Sacramento Region
 Advancing Health Equity and Inclusive Growth in the Sacramento Region 2 Summary The four-county Sacramento metro is a growing and vibrant region. While the nation is projected to become majority people
An Equity Profile of. New Orleans. Supported by:
 An Equity Profile of New Orleans Supported by: An Equity Profile of New Orleans PolicyLink and PERE 2 Acknowledgments PolicyLink and the Program for Environmental and Regional Equity (PERE) at the University
An Equity Profile of the Southeast Florida Region. Summary. Foreword
 An Equity Profile of the Southeast Florida Region PolicyLink and PERE An Equity Profile of the Southeast Florida Region Summary Communities of color are driving Southeast Florida s population growth, and
Advancing Health Equity and Inclusive Growth in. Fresno County
 Advancing Health Equity and Inclusive Growth in Fresno County 2 Summary Fresno County is an agricultural powerhouse, yet it struggles with slow economic growth, high unemployment, and an economy dominated
An Equity Assessment of the. St. Louis Region
 An Equity Assessment of the A Snapshot of the Greater St. Louis 15 counties 2.8 million population 19th largest metropolitan region 1.1 million households 1.4 million workforce $132.07 billion economy
An Equity Profile of. Las Cruces
 An Equity Profile of Las Cruces An Equity Profile of Las Cruces PolicyLink and PERE 2 Acknowledgments PolicyLink and the Program for Environmental and Regional Equity (PERE) at the University of Southern
An Equity Profile of the. City of Detroit. Supported by:
 An Equity Profile of the City of Detroit Supported by: An Equity Profile of the City of Detroit PolicyLink and PERE 2 Acknowledgments PolicyLink and the Program for Environmental and Regional Equity (PERE)
An Equity Profile of the. Southeast Florida Region
 An Equity Profile of the Southeast Florida Region An Equity Profile of the Southeast Florida Region Table of contents PolicyLink and PERE 2 6 7 8 14 27 55 64 79 83 Foreword Summary Introduction Demographics
Omaha-Council Bluffs Region
 EMBARGOED UNITL DECEMBER 2, 2014 Equitable Growth Profile of the Omaha-Council Bluffs Region 2 Summary Communities of color are driving the Omaha-Council Bluffs region s population growth, and their ability
An Equity Profile of. Sunflower County
 An Equity Profile of Sunflower County An Equity Profile of Sunflower County PolicyLink and PERE 2 Acknowledgments PolicyLink and the Program for Environmental and Regional Equity (PERE) at the University
Advancing Health Equity and Inclusive Growth in. Cincinnati. Supported by:
 Advancing Health Equity and Inclusive Growth in Cincinnati Supported by: 2 Summary More than a third of Hamilton County residents live in the city of Cincinnati, which is home to more Fortune 500 companies
An Equity Profile of the. Detroit Region
 An Equity Profile of the Detroit Region An Equity Profile of the Detroit Region Table of contents PolicyLink and PERE 2 3 7 13 29 58 68 84 89 Summary Introduction Demographics Economic vitality Readiness
Equitable Growth Profile of the. Piedmont Triad Region
 Equitable Growth Profile of the Piedmont Triad Region 2 Summary Communities of color are driving the Piedmont Triad s population growth, and their ability to participate in the economy and thrive is central
Advancing Equity and Inclusive Growth in San Joaquin Valley: Data for an Equity Policy Agenda
 Advancing Equity and Inclusive Growth in San Joaquin Valley: Data for an Equity Policy Agenda Equity is the Superior Growth Model Image source: Flickr. Regional indicators database Coverage: 150 largest
An Equity Profile of the. Los Angeles Region
 An Equity Profile of the Los Angeles Region Table of contents PolicyLink and PERE 2 3 7 8 14 26 56 66 76 85 89 Summary Foreword Introduction Demographics Economic vitality Readiness Connectedness Neighborhoods
Part 1: Focus on Income. Inequality. EMBARGOED until 5/28/14. indicator definitions and Rankings
 Part 1: Focus on Income indicator definitions and Rankings Inequality STATE OF NEW YORK CITY S HOUSING & NEIGHBORHOODS IN 2013 7 Focus on Income Inequality New York City has seen rising levels of income
Racial Inequities in Montgomery County
 W A S H I N G T O N A R E A R E S E A R C H I N I T I A T I V E Racial Inequities in Montgomery County Leah Hendey and Lily Posey December 2017 Montgomery County, Maryland, faces a challenge in overcoming
Labor Force Characteristics by Race and Ethnicity, 2015
 Cornell University ILR School DigitalCommons@ILR Federal Publications Key Workplace Documents 9-2016 Labor Force Characteristics by Race and Ethnicity, 2015 Bureau of Labor Statistics Follow this and additional
Racial Inequities in Fairfax County
 W A S H I N G T O N A R E A R E S E A R C H I N I T I A T I V E Racial Inequities in Fairfax County Leah Hendey and Lily Posey December 2017 Fairfax County, Virginia, is an affluent jurisdiction, with
Racial Inequities in the Washington, DC, Region
 W A S H I N G T O N A R E A R E S E A R C H I N I T I A T V E Racial Inequities in the Washington, DC, Region 2011 15 Leah Hendey December 2017 The Washington, DC, region is increasingly diverse and prosperous,
Racial Disparities in the Direct Care Workforce: Spotlight on Hispanic/Latino Workers
 FEBRUARY 2018 RESEARCH BRIEF Racial Disparities in the Direct Care Workforce: Spotlight on Hispanic/Latino Workers BY STEPHEN CAMPBELL The second in a three-part series focusing on racial and ethnic disparities
Peruvians in the United States
 Peruvians in the United States 1980 2008 Center for Latin American, Caribbean & Latino Studies Graduate Center City University of New York 365 Fifth Avenue Room 5419 New York, New York 10016 212-817-8438
California s Congressional District 37 Demographic Sketch
 4.02.12 California s Congressional District 37 Demographic Sketch MANUEL PASTOR JUSTIN SCOGGINS JARED SANCHEZ Purpose Demographic Sketch Understand the Congressional District s population and its unique
The Latino Population of New York City, 2008
 The Latino Population of New York City, 2008 Center for Latin American, Caribbean & Latino Studies Graduate Center City University of New York 365 Fifth Avenue Room 5419 New York, New York 10016 Laird
Race, Ethnicity, and Economic Outcomes in New Mexico
 Race, Ethnicity, and Economic Outcomes in New Mexico Race, Ethnicity, and Economic Outcomes in New Mexico New Mexico Fiscal Policy Project A program of New Mexico Voices for Children May 2011 The New Mexico
Le Sueur County Demographic & Economic Profile Prepared on 7/12/2018
 Le Sueur County Demographic & Economic Profile Prepared on 7/12/2018 Prepared by: Mark Schultz Regional Labor Market Analyst Southeast and South Central Minnesota Minnesota Department of Employment and
DOING GOOD AND DOING WELL: WHY EQUITY MATTERS FOR SUSTAINING PROSPERITY IN A CHANGING AMERICA
 DOING GOOD AND DOING WELL: WHY EQUITY MATTERS FOR SUSTAINING PROSPERITY IN A CHANGING AMERICA 11/13 MANUEL PASTOR @Prof_MPastor 1 2 U.S. Change in Youth (
Socio-Economic Mobility Among Foreign-Born Latin American and Caribbean Nationalities in New York City,
 Socio-Economic Mobility Among Foreign-Born Latin American and Caribbean Nationalities in New York City, 2000-2006 Center for Latin American, Caribbean & Latino Studies Graduate Center City University of
CLACLS. A Profile of Latino Citizenship in the United States: Demographic, Educational and Economic Trends between 1990 and 2013
 CLACLS Center for Latin American, Caribbean & Latino Studies A Profile of Latino Citizenship in the United States: Demographic, Educational and Economic Trends between 1990 and 2013 Karen Okigbo Sociology
We know that the Latinx community still faces many challenges, in particular the unresolved immigration status of so many in our community.
 1 Ten years ago United Way issued a groundbreaking report on the state of the growing Latinx Community in Dane County. At that time Latinos were the fastest growing racial/ethnic group not only in Dane
Race and Economic Opportunity in the United States
 THE EQUALITY OF OPPORTUNITY PROJECT Race and Economic Opportunity in the United States Raj Chetty and Nathaniel Hendren Racial disparities in income and other outcomes are among the most visible and persistent
Patrick Adler and Chris Tilly Institute for Research on Labor and Employment, UCLA. Ben Zipperer University of Massachusetts, Amherst
 THE STATE OF THE UNIONS IN 2013 A PROFILE OF UNION MEMBERSHIP IN LOS ANGELES, CALIFORNIA AND THE NATION 1 Patrick Adler and Chris Tilly Institute for Research on Labor and Employment, UCLA Ben Zipperer
LOOKING FORWARD: DEMOGRAPHY, ECONOMY, & WORKFORCE FOR THE FUTURE
 LOOKING FORWARD: DEMOGRAPHY, ECONOMY, & WORKFORCE FOR THE FUTURE 05/20/2016 MANUEL PASTOR @Prof_MPastor U.S. Change in Youth (
2016 Appointed Boards and Commissions Diversity Survey Report
 2016 Appointed Boards and Commissions Diversity Survey Report November 28, 2016 Neighborhood and Community Relations Department 612-673-3737 www.minneapolismn.gov/ncr Table of Contents Introduction...
Why disaggregate data on U.S. children by immigrant status? Some lessons from the diversitydatakids.org project
 Why disaggregate data on U.S. children by immigrant status? Some lessons from the diversitydatakids.org project Dolores Acevedo-Garcia, PhD, MPA-URP Samuel F. and Rose B. Gingold Professor of Human Development
Demographic, Economic and Social Transformations in Bronx Community District 4: High Bridge, Concourse and Mount Eden,
 Center for Latin American, Caribbean & Latino Studies Graduate Center City University of New York 365 Fifth Avenue Room 5419 New York, New York 10016 Demographic, Economic and Social Transformations in
Demographic Data. Comprehensive Plan
 Comprehensive Plan 2010-2030 4 Demographic Data Population and demographics have changed over the past several decades in the City of Elwood. It is important to incorporate these shifts into the planning
Understanding Racial Inequity in Alachua County
 Understanding Racial Inequity in Alachua County (January, 2018) Hector H. Sandoval (BEBR) Department of Economics College of Liberal Arts and Sciences University of Florida Understanding Racial Inequity
CLACLS. Demographic, Economic, and Social Transformations in Bronx Community District 5:
 CLACLS Center for Latin American, Caribbean & Latino Stud- Demographic, Economic, and Social Transformations in Bronx Community District 5: Fordham, University Heights, Morris Heights and Mount Hope, 1990
SECTION 1. Demographic and Economic Profiles of California s Population
 SECTION 1 Demographic and Economic Profiles of s Population s population has special characteristics compared to the United States as a whole. Section 1 presents data on the size of the populations of
Extrapolated Versus Actual Rates of Violent Crime, California and the United States, from a 1992 Vantage Point
 Figure 2.1 Extrapolated Versus Actual Rates of Violent Crime, California and the United States, from a 1992 Vantage Point Incidence per 100,000 Population 1,800 1,600 1,400 1,200 1,000 800 600 400 200
The ten years since the start of the Great Recession have done little to address
 BUDGET & TAX CENTER December 2017 ENJOY READING THESE REPORTS? Please consider making a donation to support the Budget & tax Center at www.ncjustice.org MEDIA CONTACT: PATRICK McHUGH 919/856-2183 patrick.mchugh@ncjustice.org
STATE OF WORKING FLORIDA
 STATE OF WORKING FLORIDA 2017 The State of Working Florida 2017 analyzes the period from 2005 through 2016 and finds that while Florida s economic and employment levels have recovered from the Great Recession
This Could Be the Start of Something Big: Looking for the New America
 This Could Be the Start of Something Big: Looking for the New America Manuel Pastor January 2011 La Conyuntura vs. the Long-run We tend to think about short-term politics and economics... 1 La Conyuntura
LATINO DATA PROJECT. Astrid S. Rodríguez Ph.D. Candidate, Educational Psychology. Center for Latin American, Caribbean, and Latino Studies
 LATINO DATA PROJECT Demographic, Economic, and Social Transformations in the South Bronx: Changes in the NYC Community Districts Comprising Mott Haven, Port Morris, Melrose, Longwood, and Hunts Point,
LEFT BEHIND: WORKERS AND THEIR FAMILIES IN A CHANGING LOS ANGELES. Revised September 27, A Publication of the California Budget Project
 S P E C I A L R E P O R T LEFT BEHIND: WORKERS AND THEIR FAMILIES IN A CHANGING LOS ANGELES Revised September 27, 2006 A Publication of the Budget Project Acknowledgments Alissa Anderson Garcia prepared
Characteristics of People. The Latino population has more people under the age of 18 and fewer elderly people than the non-hispanic White population.
 The Population in the United States Population Characteristics March 1998 Issued December 1999 P20-525 Introduction This report describes the characteristics of people of or Latino origin in the United
Pulling Open the Sticky Door
 Pulling Open the Sticky Door Social Mobility among Latinos in Nebraska Lissette Aliaga-Linares Social Demographer Office of Latino/Latin American Studies (OLLAS) University of Nebraska at Omaha Overview
Understanding the Immigrant Experience Lessons and themes for economic opportunity. Owen J. Furuseth and Laura Simmons UNC Charlotte Urban Institute
 Understanding the Immigrant Experience Lessons and themes for economic opportunity Owen J. Furuseth and Laura Simmons UNC Charlotte Urban Institute Charlotte-Mecklenburg Opportunity Task Force March 10,
A Barometer of the Economic Recovery in Our State
 THE WELL-BEING OF NORTH CAROLINA S WORKERS IN 2012: A Barometer of the Economic Recovery in Our State By ALEXANDRA FORTER SIROTA Director, BUDGET & TAX CENTER. a project of the NORTH CAROLINA JUSTICE CENTER
Institute for Public Policy and Economic Analysis
 Institute for Public Policy and Economic Analysis The Institute for Public Policy and Economic Analysis at Eastern Washington University will convey university expertise and sponsor research in social,
RESEARCH BRIEF: The State of Black Workers before the Great Recession By Sylvia Allegretto and Steven Pitts 1
 July 23, 2010 Introduction RESEARCH BRIEF: The State of Black Workers before the Great Recession By Sylvia Allegretto and Steven Pitts 1 When first inaugurated, President Barack Obama worked to end the
The Dynamics of Low Wage Work in Metropolitan America. October 10, For Discussion only
 The Dynamics of Low Wage Work in Metropolitan America October 10, 2008 For Discussion only Joseph Pereira, CUNY Data Service Peter Frase, Center for Urban Research John Mollenkopf, Center for Urban Research
Latinos in Massachusetts Selected Areas: Framingham
 University of Massachusetts Boston ScholarWorks at UMass Boston Gastón Institute Publications Gastón Institute for Latino Community Development and Public Policy Publications 9-17-2010 Latinos in Massachusetts
Structural Change: Confronting Race and Class
 Structural Change: Confronting Race and Class THE KIRWAN INSTITUTE FOR THE STUDY OF RACE AND ETHNICITY & ISAIAH OHIO ORGANIZING COLLABORATIVE WEEKLONG TRAINING TOLEDO, OH JULY 19, 2010 Presentation Overview
Institute for Public Policy and Economic Analysis
 Institute for Public Policy and Economic Analysis The Institute for Public Policy and Economic Analysis at Eastern Washington University will convey university expertise and sponsor research in social,
Tracking Oregon s Progress. A Report of the
 Executive Summary Tracking Oregon s Progress A Report of the Tracking Oregon s Progress (TOP) Indicators Project Many hands helped with this report. We are indebted first of all to the advisory committee
BY Rakesh Kochhar FOR RELEASE MARCH 07, 2019 FOR MEDIA OR OTHER INQUIRIES:
 FOR RELEASE MARCH 07, 2019 BY Rakesh Kochhar FOR MEDIA OR OTHER INQUIRIES: Rakesh Kochhar, Senior Researcher Jessica Pumphrey, Communications Associate 202.419.4372 RECOMMENDED CITATION Pew Research Center,
Regional Data Snapshot
 Regional Data Snapshot Population, Economy & Education Features SET Civic Forum Glacial Lakes Region, South Dakota Table of Contents 01 Overview 03 Human Capital 02 Demography 04 Labor Force 01 overview
Dominicans in New York City
 Center for Latin American, Caribbean & Latino Studies Graduate Center City University of New York 365 Fifth Avenue Room 5419 New York, New York 10016 212-817-8438 clacls@gc.cuny.edu http://web.gc.cuny.edu/lastudies
FOR ACTION OUR COMMUNITIES. OUR PRIORITIES. OUR COUNTRY.
 FOR ACTION OUR COMMUNITIES. OUR PRIORITIES. OUR COUNTRY. Presented by the National Council of Asian Pacific Americans (NCAPA) The National Council of Asian Pacific Americans (NCAPA), founded in 1996, is
DATA PROFILES OF IMMIGRANTS IN THE DISTRICT OF COLUMBIA
 DATA PROFILES OF IMMIGRANTS IN THE DISTRICT OF COLUMBIA LATINO IMMIGRANTS Demographics Economic Opportunity Education Health Housing This is part of a data series on immigrants in the District of Columbia
EXECUTIVE SUMMARY. Race, Space and Youth Labor Market Opportunities in the Capital Region. November 2010
 November 2010 Race, Space and Youth Labor Market Opportunities in the Capital Region EXECUTIVE SUMMARY Chris Benner, Ph.D. Department of Human and Community Development Gideon Mazinga, Ph.D. Postdoctoral
Facts & Figures in this issue: income employment growth trends baby boomers millennials immigration
 Facts & Figures in this issue: income employment growth trends baby boomers millennials immigration 2017 Baby Boomers The term baby boomer refers to individuals born in the United States between 1946 and
Far From the Commonwealth: A Report on Low- Income Asian Americans in Massachusetts
 University of Massachusetts Boston ScholarWorks at UMass Boston Institute for Asian American Studies Publications Institute for Asian American Studies 1-1-2007 Far From the Commonwealth: A Report on Low-
EMBARGOED UNTIL THURSDAY 9/5 AT 12:01 AM
 EMBARGOED UNTIL THURSDAY 9/5 AT 12:01 AM Poverty matters No. 1 It s now 50/50: chicago region poverty growth is A suburban story Nationwide, the number of people in poverty in the suburbs has now surpassed
Seattle Public Schools Enrollment and Immigration. Natasha M. Rivers, PhD. Table of Contents
 Seattle Public Schools Enrollment and Immigration Natasha M. Rivers, PhD Table of Contents 1. Introduction: What s been happening with Enrollment in Seattle Public Schools? p.2-3 2. Public School Enrollment
Brockton and Abington
 s in Massachusetts Selected Areas Brockton and Abington by Phillip Granberry, PhD and Sarah Rustan September 17, 2010 INTRODUCTION This report provides a descriptive snapshot of selected economic, social,
THE COLOR OF ENTREPRENEURSHIP Why the Racial Gap among Firms Costs the U.S. Billions
 APRIL 2016 Why the Racial Gap among Firms Costs the U.S. Billions BY ALGERNON AUSTIN Businesses owned by people of color are playing an important part in restoring the health of the American economy after
Demographic, Economic, and Social Transformations in Brooklyn Community District 4: Bushwick,
 Demographic, Economic, and Social Transformations in Brooklyn Community District 4: Bushwick, 1990-2007 Astrid S. Rodríguez Ph.D. Candidate, Educational Psychology Center for Latin American, Caribbean
With the notable exception of the migration of Oklahomans to California during the Dust Bowl years in
 OKLAHOMA KIDS COUNT ISSUE BRIEF 2013 Voices for Oklahoma s Future. www.oica.org 3909 N. Classen Blvd., Suite 101 Oklahoma City, OK 73118 (405) 236-5437 [KIDS] info@oica.org Changing Demographics: A Catalyst
The foreign born are more geographically concentrated than the native population.
 The Foreign-Born Population in the United States Population Characteristics March 1999 Issued August 2000 P20-519 This report describes the foreign-born population in the United States in 1999. It provides
Poverty data should be a Louisiana wake-up call
 Poverty data should be a Louisiana wake-up call While the national economy continues to gain momentum, far too many families in Louisiana continue to be left behind. Data released this week by the U.S.
The State of. Working Wisconsin. Update September Center on Wisconsin Strategy
 The State of Working Wisconsin Update 2005 September 2005 Center on Wisconsin Strategy About COWS The Center on Wisconsin Strategy (COWS), based at the University of Wisconsin-Madison, is a research center
Race to Equity. A Project to Reduce Racial Disparities in Dane County
 Race to Equity A Project to Reduce Racial Disparities in Dane County Wisconsin Council on Children and Families Presenters Erica Nelson and Torry Winn Overview Who we are Goals and purpose of the Project
THE LITERACY PROFICIENCIES OF THE WORKING-AGE RESIDENTS OF PHILADELPHIA CITY
 THE LITERACY PROFICIENCIES OF THE WORKING-AGE RESIDENTS OF PHILADELPHIA CITY Prepared by: Paul E. Harrington Neeta P. Fogg Alison H. Dickson Center for Labor Market Studies Northeastern University Boston,
Heading in the Wrong Direction: Growing School Segregation on Long Island
 Heading in the Wrong Direction: Growing School Segregation on Long Island January 2015 Heading in the Wrong Direction: Growing School Segregation on Long Island MAIN FINDINGS Based on 2000 and 2010 Census
Unlocking Opportunities in the Poorest Communities: A Policy Brief
 Unlocking Opportunities in the Poorest Communities: A Policy Brief By: Dorian T. Warren, Chirag Mehta, Steve Savner Updated February 2016 UNLOCKING OPPORTUNITY IN THE POOREST COMMUNITIES Imagine a 21st-century
The Latino Population of the New York Metropolitan Area,
 The Latino Population of the New York Metropolitan Area, 2000 2008 Center for Latin American, Caribbean & Latino Studies Graduate Center City University of New York 365 Fifth Avenue Room 5419 New York,
BIG PICTURE: CHANGING POVERTY AND EMPLOYMENT OUTCOMES IN SEATTLE
 BIG PICTURE: CHANGING POVERTY AND EMPLOYMENT OUTCOMES IN SEATTLE January 218 Author: Bryce Jones Seattle Jobs Initiative TABLE OF CONTENTS Introduction 1 Executive Summary 2 Changes in Poverty and Deep
Demographic, Economic, and Social Transformations in Queens Community District 3: East Elmhurst, Jackson Heights, and North Corona,
 Demographic, Economic, and Social Transformations in Queens Community District 3: East Elmhurst, Jackson Heights, and North Corona, 1990-2006 Astrid S. Rodríguez Fellow, Center for Latin American, Caribbean
Nebraska s Foreign-Born and Hispanic/Latino Population
 January 2011 Nebraska s Foreign-Born and Hispanic/Latino Population Socio-Economic Trends, 2009 OLLAS Office of Latino/Latin American Studies (OLLAS) University of Nebraska - Omaha Off i c e o f La t i
THE MEASURE OF AMERICA
 THE MEASURE OF AMERICA American Human Development Report 2008 2009 xvii Executive Summary American history is in part a story of expanding opportunity to ever-greater numbers of citizens. Practical policies
Research Update: The Crisis of Black Male Joblessness in Milwaukee, 2006
 Research Update: The Crisis of Black Male Joblessness in Milwaukee, 2006 by: Marc V. Levine University of Wisconsin-Milwaukee Center for Economic Development Working Paper October 2007 I. Introduction
Ghana Lower-middle income Sub-Saharan Africa (developing only) Source: World Development Indicators (WDI) database.
 Source: World Development Indicators (WDI) database.") Knowledge for Development Ghana in Brief October 215 Poverty and Equity Global Practice Overview Poverty Reduction in Ghana Progress and Challenges A tale of success Ghana has posted a strong growth performance
Knowledge for Development Ghana in Brief October 215 Poverty and Equity Global Practice Overview Poverty Reduction in Ghana Progress and Challenges A tale of success Ghana has posted a strong growth performance
ECONOMY MICROCLIMATES IN THE PORTLAND-VANCOUVER REGIONAL ECONOMY
 MICROCLIMATES IN THE PORTLAND-VANCOUVER REGIONAL by Sheila Martin, Director of the Institute of Portland Metropolitan Studies, Portland State University 1 Introduction The Regional Labor Market Portland-Vancouver
Working women have won enormous progress in breaking through long-standing educational and
 THE CURRENT JOB OUTLOOK REGIONAL LABOR REVIEW, Fall 2008 The Gender Pay Gap in New York City and Long Island: 1986 2006 by Bhaswati Sengupta Working women have won enormous progress in breaking through
Chapter 1: The Demographics of McLennan County
 Chapter 1: The Demographics of McLennan County General Population Since 2000, the Texas population has grown by more than 2.7 million residents (approximately 15%), bringing the total population of the
KEY FINDINGS FROM THE 2016 EAST METRO PULSE SURVEY
 EAST METRO PULSE KEY FINDINGS FROM THE 2016 EAST METRO PULSE SURVEY ABOUT THE SAINT PAUL FOUNDATION The Saint Paul Foundation is a community foundation with more than 75 years of history in investing in
The Cost of Segregation
 M E T R O P O L I T A N H O U S I N G A N D C O M M U N I T I E S P O L I C Y C E N T E R R E S E A RCH REPORT The Cost of Segregation Population and Household Projections in the Chicago Commuting Zone
Immigrants are playing an increasingly
 Trends in the Low-Wage Immigrant Labor Force, 2000 2005 THE URBAN INSTITUTE March 2007 Randy Capps, Karina Fortuny The Urban Institute Immigrants are playing an increasingly important role in the U.S.
Regional Data Snapshot
 Regional Data Snapshot Population, Economy & Education Features SET Civic Forum East Central NM, New Mexico Table of Contents 01 Overview 03 Human Capital 02 Demography 04 Labor Force 01 overview East
Community Well-Being and the Great Recession
 Pathways Spring 2013 3 Community Well-Being and the Great Recession by Ann Owens and Robert J. Sampson The effects of the Great Recession on individuals and workers are well studied. Many reports document
Persistent Poverty on Indian Reservations: New Perspectives and Responses 1
 N I N T H D I S T R I C T Persistent Poverty on Indian Reservations: New Perspectives and Responses 1 Narayana Kocherlakota President Federal Reserve Bank of Minneapolis Editor s note: The following is
Executive summary. Part I. Major trends in wages
 Executive summary Part I. Major trends in wages Lowest wage growth globally in 2017 since 2008 Global wage growth in 2017 was not only lower than in 2016, but fell to its lowest growth rate since 2008,
FISCAL POLICY INSTITUTE
 FISCAL POLICY INSTITUTE Learning from the 90s How poor public choices contributed to income erosion in New York City, and what we can do to chart an effective course out of the current downturn Labor Day,