Experimental Evidence about Whether (and Why) Electoral Closeness Affects Turnout
|
|
|
- Annabel Curtis
- 5 years ago
- Views:
Transcription
1 Experimental Evidence about Whether (and Why) Electoral Closeness Affects Turnout Daniel R. Biggers University of California, Riverside, Assistant Professor Department of Political Science 900 University Avenue Riverside, CA David J. Hendry London School of Economics and Political Science, Assistant Professor Department of Methodology Columbia House Houghton Street London WC2A 2AE United Kingdom Alan S. Gerber Yale University, Professor Department of Political Science Institution for Social and Policy Studies 77 Prospect Street, PO Box New Haven, CT Gregory A. Huber Yale University, Professor Department of Political Science Institution for Social and Policy Studies 77 Prospect Street, PO Box New Haven, CT
2 Abstract Some canonical decision theoretic models predict that the closeness of an electoral contest should affect turnout rates, with a greater chance of being pivotal expected to increase a potential voter s propensity to vote. The majority of observational analyses conclude that closer elections are in fact associated with higher levels of participation, but these studies suffer from a number of potential problems in drawing a causal link between electoral competitiveness and the decision to turn out (e.g., their frequent reliance on an ex-post measure of closeness, usually the election results, as a means of proxying for ex-ante perceptions of closeness). Laboratory experiments yield results consistent with this expectation but raise concerns about external validity, especially given that field experimental work generally finds limited effects attributed to stressing the competitiveness of the contest. We seek to clarify this relationship through a series of experiments. Our first study is a survey experiment in which we independently randomize the closeness (polling margin) and expected turnout for a hypothetical race and find that closer elections are associated with greater interest in participating. Our second study is a large-scale, multistate field experiment conducted during the 2014 congressional primary elections. Using two phone scripts and four postcards that vary the reported closeness of primary contests in general (rather than the specific primary in question), we find that the telephone script describing the elections as more competitive has a statistically larger effect on turnout, which, in turn, is also distinct from a standard GOTV message. We find more mixed evidence for this relationship when messages stressing the closeness of the election are delivered via mail. Finally, our third study is a survey experiment that gives us leverage to isolate the mechanisms linking the closeness treatments to increased turnout. We test whether treatments emphasizing election closeness solely manipulate the perceived competitiveness of the election or also affect perceptions of other aspects of the election or candidates. The results provide causal evidence that citizens do respond to the closeness of electoral contests when deciding to vote but also show that the causal pathway linking these interventions to voting is likely not isolated to increased perceptions that one s vote is pivotal. 1
3 The basic Downsian decision-theoretic model of turnout predicts that individuals will vote when they perceive the expected instrumental benefits of doing so i.e., the stakes of the election derived from beliefs about the different outcomes depending on which candidate wins multiplied by the chances that one s vote is pivotal, are larger than the expected net costs of voting. The model thus implies that all else equal, individuals will be more likely to vote in a given election when they believe the probability that their vote can decide that election increases. In light of the exceedingly low probability that any one person s vote would decide most elections in modern democracies, combined with the fact that turnout has remained high in those elections, the pure Downsian model was subsequently extended by Riker and Ordeshook (1968) and others to allow for the net cost of voting to be decomposed into costs and noninstrumental positive returns to voting that were independent of election closeness. Most notably, these include perceptions of civic duty and beliefs about social norms that reward participation. Despite the centrality of the core linkage between electoral closeness and the likelihood of participating in the Riker-Ordeshook extended model, studies investigating the direct effect of variation in electoral closeness on participation have been limited, suffering from a number of important threats to credible causal inference. For example, some studies exploit variation in observed election closeness or survey assessments of perceived closeness to explain turnout (for citations see, e.g., Blais 2000; Enos and Fowler 2014), but in each case variation in context or individual perceptions are likely to be correlated with omitted factors that also affect the decision to vote. For example, turnout may be higher in closer elections because of greater campaign mobilization, and people who report on surveys that they believe an election is likely to be close may express that attitude to justify their expected participation. As such, it is unclear whether the model does a poor job of predicting behavior or rather if it has simply been tested in an imprecise way. Indeed, the general weakness of empirical tests of the model is such that supporters and critics of the theoretical approach alike remain unpersuaded by the existing evidence. This problem of inference was exacerbated by the near simultaneous development of game theoretic models in which individuals simultaneously decide whether to participate (e.g., Feddersen and Pesendorfer 1996, 1999; Palfrey and Rosenthal 1983, 1985). Moving outside of the decision-theoretic 2
4 context to one in which potential voters condition their own behavior on the expected behavior of others yielded many results suggesting it was difficult to (rationally) sustain high levels of turnout in any largescale electorate. While subsequent work has introduced new strategic accounts that can, in some circumstances, sustain positive turnout (e.g., Duffy and Tavits 2008), it is unclear how accurately those accounts reflect how voters think (i.e., whether they condition their expectations of pivotality on the equilibrium play of other citizens), a problem that is exacerbated because prior empirical work is not dispositive. This paper addresses this central shortcoming of previous empirical tests of the implications of the Downs-Riker-Ordeshook framework and its extensions. We present three novel experiments designed to test the effect of providing information about variation in expected election closeness on participation. The common thread across experiments is that we compare participation (or interest in participating) across variation in randomly manipulated expected closeness, therefore isolating whether (some) individuals are more likely to participate when the chances an election will be close increases. Importantly, all participants are exposed to a common framing of elections which varies only in expected closeness, whereas as we document below, prior field experimental work testing messages about election closeness has generally compared closeness messages to other types of messages (Bennion 2005; Dale and Strauss 2009; Enos and Fowler 2014; Gerber and Green 2000), which renders it difficult to ascertain whether it is the framing of the vote choice in terms of closeness or how close the election will be that might affect participation (we discuss at least one notable exception, Gerber et al. 2017, below). Our first study is a survey experiment embedded in a nationally representative sample of registered voters. In the study, we compare whether a respondent would be interested in voting in an election that was going to vary in both the total number of votes cast and the current polling margin separating the anticipated winner from the loser. We find that when respondents are told an election will likely be close (specifically that one candidate is leading by 1% or 5%) they are substantially more interested in voting than when they are told the election will not be close (specifically that one candidate is leading by 20% or 30%), even after fixing expected turnout (low, medium, or high, an independent 3
5 manipulation). To our knowledge, this is the first survey experimental work to directly estimate the effect of variation in expected electoral closeness on measured interest in voting after fixing expected aggregate electoral participation. Our second study is a field experiment conducted during the 2014 Congressional primaries in 7 states (Massachusetts, Michigan, Minnesota, Missouri, New Hampshire, Tennessee, and Wisconsin) in which registrants were contacted by telephone or sent a mailing that differed only in how close they describe past primary races as being. Importantly, these interventions depart from other field experiments on election closeness in that they do not communicate information about the specific race in question (e.g., whether one candidate is leading in the polls), but instead convey general information about the likelihood a race will be close given past races of that type. In this way, we isolate variation in expected closeness from all other information that might be conveyed by a polling margin. In the telephone experiment, more than 16,000 registrants were contacted and told one of two (accurate) messages: that 7% of contested primary elections were decided by either 350 votes or 2500 votes. Those in the 350 votes condition are 1.6 percentage points (6.5%) more likely to vote than in the 2500 votes condition, and this difference is statistically significant and robust across state, electoral context (whether the respondent lived in a competitive primary district), and past patterns of voter participation. Furthermore, the message describing elections as decided by 350 votes is more effective than a standard Get Out the Vote (GOTV) phone message. We do not find the same result, however, in the paired mail (postcard) experiment. In that experiment we cannot condition on making contact (that is, we have less assurances that the treatments were delivered) and there are four closeness treatments, which describe 7% of past primary elections as being decided by either 350, 650, 1000, or 2500 votes. This experiment yields non-monotonic estimated effects of past election closeness. Specifically, we estimate that the 350- and 650-vote treatments increased turnout by about.9 points compared to an uncontacted control group, while the 1000-vote treatment did so by.4 points, and the 2500-vote treatment by 2.2 points. None of these differences is statistically significant from one another. 4
6 Finally, our third study is a survey experiment conducted in 2015 and 2017 that replicates the treatments used in the field experiment but seeks to measure the different potential causal mechanisms underlying the effect on turnout of messages designed to induce beliefs about closer elections. In light of recent field experimental work showing that treatments emphasizing polling margins induced changes in beliefs about election closeness but did not increase turnout (Gerber et al. 2017; which is at odds with some of our own findings), we measured a variety of potential mechanisms identified in prior research by which more close elections could cause people to be more likely to vote. In this survey experimental context, we validate that the treatments induce an increase in beliefs that the election will be close and that a respondent s vote may prove pivotal, and find some evidence that the treatments increase selfassessed chances of voting. However, we also show that information about election closeness may additionally affect the intrinsic and extrinsic (socially-motivated) factors that may explain differences in turnout, showing that it is empirically very difficult to implement treatments that perturb only anticipated closeness without also potentially activating other causally relevant pathways. That is, increases in expected election closeness appear to simultaneously increase the instrumental and non-instrumental returns to voting, with the former effect arising due to increased expectations that one s vote could decide an election and the latter due to changes in beliefs about peer behavior (social norms) and increased intrinsic motivation (often called civic duty) to participate. There are several important implications of our findings. First, they provide direct evidence to support the Riker-Ordeshook model of participation. Some individuals are more likely to participate in an election when they are informed that their individual votes are more likely, as opposed to less likely, to be decisive. Thus, contrary to characterizations that the model is of limited value in understanding participation, we provide direct experimental evidence that this perspective helps explain variation in electoral participation. Second, our empirical approach showcases a field-experimental methodology for testing formal theoretic models. While calls for empirical testing of formal models are not new, we identify important 5
7 limitations of prior (observational and) field tests that limit their usefulness in assessing the veracity of the basic costs-of-voting model. Third, our research helps us to understand an important source of variation across elections and individuals in participation originating in perceptions that one s vote doesn t matter. While prior survey work has shown that many individuals believe whether they vote will not affect an election outcome, it remains an open question whether these views are malleable or simply correlated with other factors that also explain low rates of participation. Our work shows that such views can be manipulated and that in doing so more individuals can be brought to the polls, potentially highlighting a mechanism for further increasing political participation. Finally, our third study shows the importance of pairing survey data with an experimental manipulation to test assumptions about treatment mechanisms. We find that treatments designed to manipulate expected election closeness can increase turnout. However, we also show that the mechanism by which these treatments may operate is likely not confined to the effect of the treatments on changes in the belief one s vote decides an election. Instead, we show that the election closeness also alters the noninstrumental returns to voting. This means that in this specific context, even a (theoretically) targeted intervention violates the exclusion restriction assumption necessary for isolating the effect of perturbations in expected election closeness. More broadly, however, our study highlights the general importance of gathering data that are informative about the potential mechanism that underlies any treatment effects. This is particularly important in the experimental setting because scholars often have the opportunity to directly measure potential causal pathways, something that is often much harder in observational research. Rather than proceeding by assumption about how a treatment works, we show how the pairing of field and survey experimental studies allows for a deeper (and more accurate) understanding of the mechanism by which treatments operate. 6
8 Election Closeness and Participation The Riker-Ordeshook model of participation posits simply that individuals participate when P * B C > 0, where 0 <= P <= 1 is the probability one s vote decides an election, B >= 0 is the expected benefit to having one s preferred candidate defeat one s less preferred candidate, and C is the net cost of voting. As contemporary analysts have noted, C may be greater or less than 0, reflecting the fact that while there are certain minimal costs associated with voting (finding one s way to the polls, deciding for whom to vote, etc.), there are often offsetting benefits from participating that are independent of the election outcome (inter alia, fulfilling a sense of civic duty, gaining respect from one s peers, having the opportunity to express one s preference on an important topic, etc.). 1 We note that some scholars describe these noninstrumental positive returns to voting as D, in which case C + D may be greater than 0. For simplicity of presentation, we simply refer to the net cost of voting, C + D, as C. For individuals for whom C > 0, the crucial determinant of whether voting is worth the cost is how much one cares about the election outcome, B, and the likelihood that one s vote decides an election, P. One may care a great deal about an election outcome (i.e., one may have a large B), but if voting will have no effect on the outcome (P = 0), whether someone votes will be decided only by the sign of C. By contrast, as P gets large that is, as one believes her one vote may decide the election the stakes of the election (B) come into play. Fixing B > 0, for some individuals there may be a P <= 1 such that P * B > C, in which case voting is rational. 2 Despite the simplicity of this theoretical perspective, tests of the model remain elusive and limited in their credibility as causal evidence. There are four main approaches in this work. The first approach is to examine the aggregate relationship between observed election closeness and levels of turnout. In Blais s (2000) review of the literature, 27 of the 32 studies he identifies show election 1 Thus, while some individuals have criticized the model as predicting that no one will vote, this is true only if C is positive. More generally, as we discuss below, whether variation in P affects participation has not been fully tested, a salient concern given that there is substantial variation in individual perceptions of P and many individuals appear to overestimate the likelihood that their vote will prove decisive (Blais 2000). 2 This exposition fixes the individual s perception of P, but as game theoretic models show, individuals need to condition their beliefs about P on the behavior of others. How that conditioning takes place is an open question and a further justification for the experimental manipulation we introduce below. 7
9 closeness increases turnout, which leads him to conclude that there are strong reasons to believe that individuals are more likely to vote when the contest is close. A subsequent meta-analysis is more ambiguous in its conclusions. Examining 83 aggregate-level studies in both the U.S. and non-u.s. contexts, Geys (2006) determines that about 57% of the tests of this relationship, or 69% of the studies, appear to confirm the importance of closeness on turnout. However, as prior scholars have noted (e.g., Aldrich 1993; Cox and Munger 1989), the mechanism explaining this result is ambiguous because the increased campaign activity and media attention often assigned to close contests may influence participation aside from common perceptions of one s own pivotality (see also Matsusaka and Palda 1993). More generally, close elections may be close because many people vote or because of some other omitted factor that affects turnout. The second approach eschews aggregate election-level analysis in favor of individual-level data. One advantage of this approach is that it is possible to measure individual-level assessments of perceived election closeness along with other factors that might predict voting. While some studies find evidence that individuals who think elections will be closer are more likely to vote (e.g., Blais et al. 2000), Smets and van Ham (2013) report in a meta-analysis that the closeness hypothesis is supported only about 30% of the time. Nonetheless, many of the same threats to inference arise in this context because the sources of individual-level variation in perceived closeness may also affect other factors that increase turnout, or may reflect existing individual-level differences in the willingness to vote. In the absence of a full accounting of all (potential) factors that explain variation in participation (or correlated measurement error), the threat of omitted variable bias remains large. Scholars have turned to a third approach namely lab- or survey-experimental tests of the effects of variation in electoral closeness on participation to address these concerns about credible causal inference. Ansolabehere and Iyengar (1994), for example, find in a survey that manipulating the poll results embedded in a newscast (i.e., making the race more or less competitive) has no effect on intention to vote. By contrast, Kam and Utych (2011) find that races described as close spur cognitive engagement, 8
10 with subjects undertaking efforts (e.g., seeking out more information) consistent with the actions of someone more likely to participate. Work in the lab, in which the returns and costs to voting are experimentally manipulated, also provides some support for the effect of expected closeness on voting. Some of this work focuses on analyses in which pivotality is endogenous to others anticipated actions (i.e., as an equilibrium outcome of a game; see, e.g., Feddersen and Pesendorfer 1996, 1999; Palfrey and Rosenthal 1983, 1985). 3 Duffy and Tavits (2008) show that in a lab experiment where the costs and benefits of voting are fixed the elicited belief one is pivotal increases the propensity to vote, although the relationship is not as sharp as predicted by theory in light of the parameters manipulated in the game (see also Levine and Palfrey 2007). For both types of experiments, one important concern is external validity: Subjects participating in a survey or playing a game in a laboratory may behave differently than they would if exposed to similar stimuli outside of the laboratory. This may be either because the decision to vote (or express an intention to vote) is not an accurate reflection of real behavior, or because the way people decide in the lab setting is different from how they would behave outside of it. Additionally, in the case of prior survey experimental work, manipulations of closeness may generate variation not just in expectations about closeness, but also in beliefs about factors like aggregate turnout, which may affect beliefs about election importance and other relevant factors. Finally, a fourth approach involves field experiments that manipulate the salience of electoral closeness. These studies have the potential to address concerns about omitted variables bias and endogeneity, as well as the artificiality of the survey and lab setting. Those studies that explicitly test the closeness hypothesis find mixed evidence that stressing the competitiveness of the contest increases turnout, but almost all of these studies compare a closeness message either to no contact or an alternative outreach message. Thus, they do not estimate the effect of directly manipulating perceptions of election 3 Though see Feddersen and Pesendorfer (1996) for conditions under which turnout is not necessarily related to electoral closeness (i.e., the swing voter s curse ), as well as lab experiments that find a positive relationship between turnout and margin of victory as the number of informed voters increases (Battaglini et al. 2010). 9
11 closeness. We summarize this prior research in Table 1. Gerber and Green (2000), for example, included a closeness message among other treatments in their canvassing, phone, and mail field experiments, asserting that each year some elections are decided by only a handful of votes. This message had the largest estimated effect of any of the canvassing treatments, but it was not statistically distinguishable from the effects of the other messages. Similarly, Bennion (2005) finds no evidence that stressing in doorto-door canvassing that many elections in the state will be decided by only a handful of votes has a larger effect on turnout than a standard civic duty message, while Dale and Strauss (2009) determine that sending text messages that elections often come down to a few votes increases turnout in comparison to an uncontacted control group but has a slightly smaller effect (though not statistically distinguishable) from that of a civic duty message. 4 [Insert Table 1 about Here] Recent field tests by Enos and Fowler (2014) and Gerber et al. (2017) are the most promising with respect to uncovering causal mechanisms in the field setting. Enos and Fowler argue that the other studies in Table 1 were conducted in uncompetitive races, limiting the credibility of the treatments. Instead, following a State House special election in which the original contest ended in a tie between the two major party candidates, the authors conduct a field experiment before the follow-up election. Specifically, they tested whether raising awareness of the registrant s potential pivotality in light of the past tie increases participation. 5 They compared turnout among subjects randomly assigned to a simple election reminder to those assigned a message that also sought to increase the salience of the close 4 Two phone experiments by Nickerson use the word close or mention the number of votes that might decide the contest but do not explicitly test the closeness hypothesis. The script in Nickerson (2006), for example, includes (in a long message) the text, The Presidential election is close and there are two interesting initiatives on the ballot that young people might care about (see Sample Script in Appendix, p.289). Similarly, Nickerson (2007) includes the following in a mobilization message: It is expected that less than 500 votes may determine the outcome of this race (see Appendix C script, p.281). In both cases, however, the content related to election closeness is part of a larger message and there is no comparison across messages that convey different expected election closeness. Matland and Murray (2012) also mention election closeness in their mailers and canvassing outreach but do so as part of a longer message that also includes a civic duty appeal. 5 Prior to fielding their experiment, they conducted a survey and found that only 41% of registrants knew the prior election ended in a tie. 10
12 election. 6 They found that this message increased turnout by about 1.2 points among those contacted by phone (N=936) compared to the information script, but the difference was not statistically significant. 7 Like the other studies listed in Table 1, Enos and Fowler (2014) assume that discussing election closeness (apart from the expected closeness of any particular election) does not affect participation. With only a single closeness treatment, however, they cannot rule out this exclusion restriction violation (that is, they do not vary how close the election was described as being when discussing closeness). Furthermore, in emphasizing that a prior election involving the same candidates was close, they may also affect other beliefs about the specific followup contest (e.g., that it might be particularly important). Finally, the 1% incremental effect of the closeness message among those contacted (in addition to the effect of the reminder) is clinically but not statistically significant because their experiment is underpowered to distinguish it from sampling variability. In contrast, Gerber et al report results from a pair of studies explicitly designed to test the effects of manipulating perceived election closeness by providing polling margins. In a 2010 panel study with treatments delivered online, they find that providing subjects with a close poll (one in which the race is very close) increased perceptions measured in the same pre-election survey that the final race will be close relative to a less close poll. However, using the close-poll treatment as an instrument for perceived election closeness, they find no evidence that inducing differences in perceived closeness increased turnout as measured using administrative records among those who also completed a post-election survey in mid-november. A second experiment in Gerber et al. (2017) was a large scale (N=approximately 126,000) field experiment with treatments administered using mailed postcards. The treatments were manipulated along two dimensions: close versus not close polls and large versus small electorate. The outcome is turnout measured using state administrative records. The experiment yields a statistically insignificant.3 6 Specifically, the closeness message followed the information script and informed the subject of the reason for the special election (the last election ended in an exact tie), noted that one vote would have decided the contest, and emphasized the high likelihood of another close contest. 7 For one small subgroup (N=139), those who were unaware of the upcoming election and had voted in 2 recent elections, turnout was significantly higher (by 18.5 points) in the closeness group. 11
13 (SE=.25) point increase in turnout associated with the close polls treatment. One concern with this study is that the polling margin in a particular race may convey information not just about its expected closeness, but also about its candidates (i.e., the race may be close precisely because of something about the relative qualities of the incumbent and challenger). Thus, it is not clear that the treatment perturbs only expected election closeness. Overview of Studies In light of prior research, we conducted three novel experiments to investigate the effect of varying perceptions of electoral closeness on turnout. The first experiment is a between-subjects survey experiment in which we independently randomized the expected election closeness and the level of turnout in a hypothetical election and measured respondents perceived interest in participating. In contrast to past survey experimental research, this allows us to assess the effect of expected election closeness while holding constant beliefs about turnout levels. Thus, we can minimize concerns that describing an election as close also affects perceptions of the importance of the election as mediated through expectations about overall turnout rates. The second study is a field experiment in which we depart from most prior work by comparing turnout among individuals exposed to very similar messages discussing election closeness. These messages differ only in how close they describe elections similar to the one the participant is eligible to vote in as being. Thus, this experiment isolates the effect of variation in expected closeness within a design in which we hold constant the framing of the choice to vote as potentially being affected by a race s closeness. Notably, our treatment in this race conveys nothing about the closeness of the particular race in question, but instead about a class of elections like the one in question, reducing concerns that the treatment works by altering beliefs about the specific candidates in the race. Additionally, we compare turnout among those exposed to the closeness messages to those exposed to a standard non-partisan GOTV message. 12
14 Finally, the third study is a survey experiment in which we replicate the treatment language used in the field experiment to validate that the treatment altered expectations about election closeness. Furthermore, we measure multiple potential causal pathways through which perturbations in expected election closeness might affect respondent behavior. The factors that we consider, apart from expected election closeness, that might alter the decision to participate are beliefs about peer behavior (social norms), inferences about incumbent and challenger characteristics (the stakes of voting), and intrinsic motivations for participation (e.g., civic duty norms). Study #1: 2014 Survey Experiment Manipulating Election Closeness and Turnout Our first experiment was included on a longer unrelated survey that we designed and that was fielded by YouGov/Polimetrix from June 27 to July 3, We drew a nationally representative sample of registered voters who had voted in either the 2010 or 2012 general elections (as determined by matches to voter registration records). In addition, the sample was stratified to ensure that 25% of the invitees were individuals who voted in either (or both of) the 2010 and 2012 congressional primaries (all vote history information was appended to the data). Our sample thus consists of general election voters, some of whom also participate in House primary elections. The final dataset contains 2,000 completed surveys. 8 Before delivering the treatment, respondents were presented with a prompt that read: Below is a list of things one might learn about the upcoming congressional primary election. How would learning each thing affect your decision to vote? If you learned each thing. would it make you less likely or more likely to vote? One of the items in the list that followed was our experiment, which stated Turnout in the upcoming primary will be TURNOUT and pre-election polls show one candidate is currently leading by MARGIN%. TURNOUT could be low (15%), medium (30%), or high (50%) of registrants voting, while 8 According to YouGov, 6,058 individuals were invited to take the survey, 2,723 started it, and 2,334 completed it. The AAPOR response rate 1 is 38.5% and response rate 2 is 43.5% (American Association for Public Opinion Research 2011). Our analysis is robust to using weights provided by YouGov. 13
15 the candidate s current MARGIN could be 1, 5, 15, 20, or 25. Turnout and candidate margin were independently randomly assigned with equal probabilities for each turnout and margin level. The dependent variable was measured using a 5-point scale, with response options Much less likely to vote (scored -1), Less likely to vote (-.5), Neither more nor less likely to vote (0), More likely to vote (.5), and Much more likely to vote (1). Assignment is balanced by pre-treatment covariates, implying randomization was successful. We analyze data from this experiment using OLS regression predicting the outcome measure with indicators for each turnout level (excluded category is medium) and candidate margin (excluded category is 25%). Results appear in Table 2 for a variety of model specifications (column 1 without covariates, column 2 with demographic covariates, column 3 adding weights, and column 4 replacing the weights with state fixed effects). In general, results are largely similar across specifications and so we focus on the column (1) results. [Insert Table 2 about here.] Per these estimates, we find effects both of differences in expected turnout levels and candidate margins on interest in voting. Specifically, compared to an election in which one candidate is leading by 10 points (a predicted vote share of 55% versus 45% in a two-candidate race), respondents are on average.09 units and.13 units higher on the likelihood-of-voting scale when the leading candidate is winning by 5 or 1 points, respectively. These estimates are statistically indistinguishable from one another, but are statistically distinguishable (p<.05) from all other candidate margin levels. Substantively, the.13 effect associated with a 1% candidate margin corresponds to about 25% of the scale difference between moving between more likely and much more likely to vote (the outcome has a mean of.30 and a standard deviation of.46). Polling margins of 15% and 25% produce small but positive coefficient estimates that are indistinguishable from the baseline polling margin of 10%. Of some importance, we find similar effects for both 1% and 5% margins, implying that respondents are not responding to closer elections only in those (very close race) cases in which their votes are in fact likely to be pivotal, but instead appear to respond somewhat smoothly to decreases in 14
16 expected candidate margins. Additionally, 5% leads are still associated with increases in interest in voting compared to 10% leads, implying that treatments focusing on comparing smaller margins may be missing the range of candidate margins for which election closeness motivates turnout. Because the vignette also contains a direct manipulation of expected turnout, we believe the design also minimizes the possibility that individuals are making inferences about turnout levels on the basis of the candidate margin manipulation. At the same time, those manipulations are theoretically interesting. In particular, it appears that compared to an election in which turnout will be moderate, individuals are more motivated to vote in elections in which turnout will be low or high. Theoretically the former effect is consistent with the idea that in a smaller electorate one s vote is more likely to matter given a fixed candidate margin (in percentage terms), while the latter is not. However, prior work also shows that individuals are more motivated to participate in elections in which others vote, including for reasons of social norms (Doherty et al. 2017). 9 Overall, this survey experiment provides direct evidence that primary elections described as closer, holding constant expected turnout, garner greater interest in participation. However, as we note above, this result is in a survey context, so whether it has behavioral effects outside the survey setting is an open question. Additionally, because the treatment manipulates the polling margin in a particular race, we have not ruled out the possibility that respondents are making inferences about challenger and incumbent characteristics that also affect the extrinsic rewards to voting (the B term in the P * B part of the canonical turnout equation). Study #2: State Field Experiment with Messages Delivered by Phone and Mail Our field experiment was conducted during the 2014 primary elections in 7 states [Massachusetts (MA), Michigan (MI), Minnesota (MN), Missouri (MO), Tennessee (TN), New Hampshire (NH), and Wisconsin 9 In light of this result, we also examined whether the effect of the close margin treatment was affected by the expected turnout treatment. We did so by creating a dichotomous indicator for close election (margin 1% or 5%) and interacting it with the different turnout level indicators. If low turnout increased the effect of the close election treatment we would estimate a positive interaction on close margin by low turnout, but in fact all the interactions between close election and turnout levels are small in magnitude and far from statistically significant, implying the two treatments do not interact in that manner. 15
17 (WI)] in which all voters can vote in at least one party s primary election. 10 We first obtained a complete list of registered voters in each state. Prior to treatment assignment we excluded records likely to be invalid or persons who could not be contacted by phone or mail, accordingly. In households with multiple registrants, one registrant was selected at random for inclusion in the sample. From this pool, subjects were then randomly assigned to one of four treatments analyzed here and described in greater detail below. Treatment assignment was stratified by state, whether the registrant lived in a district with a competitive House race, and an individual s past record of voter participation. 11 For the phone experiment, each message was delivered by telephone in the four days leading up to each state s primary election by a professional survey vendor we hired for the experiment. All interventions began with the same question asking whether the subject was a resident of his or her state. 12 Subjects who were reached by telephone and answered in the affirmative are coded as contacted. We compare outcomes across treatments among subjects we successfully contacted by phone using this common (treatment-independent) definition of contact (subjects are coded as contacted if and only if they answer yes when asked if they were residents of their respective states). 13 In the mail experiment, 17,063 individuals were sent one of four closeness messages on half-sheet postcards that were delivered by mail and timed to arrive in the days leading up to the primary election in the intended recipient s state of residence. Unlike in the phone experiment, we cannot condition on respondents receiving the treatment (that is, actually being treated) because we have no direct measure of either receipt of the postcard or that a respondent actually read its contents. 10 In MA and NH, affiliated voters cannot vote in another party s primary, but unaffiliated voters can vote in any party s primary. In the other states all registrants can vote in any primary. 11 Treatment assignment rates differed slightly by state. In MI, MO, and TN, 40% of registrants were assigned to the Placebo message and the remaining three treatments were each assigned to 20% of registrants. In the other states, about 33% of registrants were assigned to the GOTV treatments and the remaining three messages were assigned at the same rate (about 22% each). Our subsequent analysis accounts for these different rates of assignment. 12 The script began with Hi. My name is [INTERVIEWER S FIRST NAME], and I'm conducting a university research survey of registered voters. You can help us a lot by answering just a few questions. The survey is voluntary and you don t have to answer questions you don t want to. I m not selling anything, and the entire questionnaire will take fewer than two minutes to complete. Are you currently a resident of [STATE]? 13 This question was asked prior to the portion of each script that branches into the assigned treatment group and therefore responses could not be affected by the subsequent treatment contact. 16
18 For both treatment modes, voting in the 2014 primary was measured using turnout as recorded in updated state voter files obtained from our vendor in spring Individuals are coded as having voted if they are listed as having done so in the official record and they are coded as not having voted if there is no record of voting or if they no longer appear in the voter file. Phone Treatments Our first two treatments were messages that emphasized the potential closeness of the election but that varied in the (accurate) information they conveyed about how close the election would be. Both messages began with an informational prompt and asked the respondent if he or she was aware of the upcoming primary. 14 Following this, both scripts included the following message, after which the call concluded: Because fewer people vote in most primary elections than in general elections, each vote matters more for deciding who wins. In fact, of the approximately 160 seriously contested primaries for the US House in 2012, more than 7% were decided by fewer than [# OF VOTES] votes. Think about how you will feel if you don't vote and it turns out the election was decided by only a few votes. In the Closeness 350 treatment, the number of votes was 350. In the Closeness 2500 treatment, the number of votes was Note that these two treatments do not mention anything about the particular primary contest in the respondent s district and hold constant all features apart from how close 7% of elections are. Because the treatment does not contain any information about the particular race in the respondent s district, we believe it makes it less likely that respondents are inferring features of their particular race from the variation in the closeness treatment (although they may infer something about the race in general from the fact that someone sent them a message, a reason we compare outcomes across messages). Additionally, the treatments emphasize that turnout is generally low in primary elections, which was designed to fix expectations about average turnout across treatments. Focusing on the theoretical question of interest, if perceptions of closeness increase turnout by increasing the expected 14 The script read, This [DAY OF WEEK] [STATE] will be holding primary elections to select which candidates will be on the ballot this November. Were you aware that [STATES] s primary elections will be held this [DAY OF WEEK]? 15 To arrive at this figure, we examined returns for the 2012 House primary elections. There were 162 races in which the winner had a margin of less than 25 percentage points. In those races, 12 (7.4%) were decided by 350 votes or fewer. Obviously those same races were also decided by 2500 votes or fewer. 17
19 returns to voting we would predict higher turnout in the Closeness 350 treatment than in the Closeness 2500 treatment. Our third treatment was a standard GOTV script. It was similar to the opening script for the Closeness messages, but also mentioned that turnout was expected to be high. 16 Finally, our fourth treatment was a Placebo message designed to identify a group who could be contacted by telephone, but which included no political contact. After confirming subjects were actually residents of their respective registration states, they were simply asked how often they went to the grocery store. 17 Mail Treatments Our four mail treatments paralleled the different closeness treatments delivered in the phone scripts but varied more widely in the vote thresholds communicated. Half-sheet postcards stating the number of votes that separated the candidates in the stated percentage of electoral contests were mailed to the address of each experimental subject. The four vote thresholds used were 350 votes, 650 votes, 1000 votes, and 2500 votes, with approximately 4,265 individuals assigned to each vote threshold. Results, Phone Experiment Our vendor contacted 8,453 registrants in the Closeness 350 condition, 8,402 in the Closeness 2500 condition, 11,591 in the GOTV condition, and 10,487 in the Placebo condition. Balance tests show that treatment groups did not vary to a material degree on available covariates (age, year of registration, gender, race/ethnicity, and the number of times having voted in previous general, primary, and special elections). We begin by focusing on our key theoretical test: whether turnout is higher among those in the Closeness 350 treatment than the Closeness 2500 treatment. This analysis appears in Table 3. [Insert Table 3 about Here] 16 The complete script read, This [DAY OF WEEK] [STATE] will be holding primary elections to select which candidates will be on the ballot this November. Many [STATE] citizens are expected to turnout for this [DAY OF WEEK] s election. Were you aware that [STATES] s primary elections will be held this [DAY OF WEEK]? The underlined portion is not included in the preamble to the Closeness treatments. 17 Specifically, we asked How many times in the last fourteen days have you been to the grocery store? 18
20 Specifically, we begin by showing results for the entire sample. As the first row of the table shows, 26.0% of respondents contacted for the Closeness 350 treatment voted, compared to 24.5% of those contacted for the Closeness 2500 treatment. This difference in proportion shown in column (3) is 1.6 points, which is statistically significant at the.01 level. The difference-of-proportions test does not accommodate weights or covariates, so in column (4) we present a regression estimate of the effect of the Closeness 350 treatment relative to the Closeness 2500 treatment with robust standard errors that controls for assignment strata (State x Vote History x District Competitiveness) and pre-treatment covariates x State (here state is interacted with all of the covariates for which we assess balance). These results are weighted to account for the different rates of assignment across strata. The regression estimate is 1.2 points (S.E.=.05, p<.05, two-tailed test), meaning that turnout is about 5% higher among those who receive the Closeness 350 message than the Closeness 2500 message. 18 As column (5) shows, this estimate is based on 16,855 completed calls. The remainder of the Table shows the robustness of this result for different states, electoral contexts, and past voter history. In each case, the regression estimates are indistinguishable from the 1.2 point estimate for the entire sample. (The estimates for the subsamples are also usually not individually statistically significant, reflecting the smaller samples.) Focusing on the regression estimates (which are less sensitive to any potential imbalance created by sampling variability), we estimate that the Closeness 350 message is more effective than the Closeness 2500 message in 6 of 7 states. Additionally, it appears equally effective in districts with (estimated effect of 1 percentage point) or without (estimated effect of 1.2 percentage points) a competitive House primary. Finally, the message appears effective for all partitions of past voter history. We estimate the largest effect among those who have never previously voted (3.3 points), but this is based on very small sample (N=581). These results show that otherwise identical messages that differ only in how close they describe a past similar election as being can increase turnout when those previous elections are closer. This is 18 In a model that excludes the covariates, the estimated coefficient is 1.1 points, p=
21 therefore direct evidence that an expectation that an election will be closer will bring more people to the polls. Additionally, the design of our experiment also allows us to assess the comparative effectiveness of the Closeness messages. For this analysis, we compare turnout in four conditions: Those who received each Closeness message, those who received the standard GOTV treatment, and those who received the Placebo message. Figure 1 displays the comparative effectiveness of each treatment in increasing participation relative to the placebo message (the 95% confidence interval for each estimate is indicated with the black capped lines). These estimates are derived from a regression model similar to that used in the Table 3 analysis. Compared to the placebo condition, those who received the Closeness 350 message are 3.0 points more likely to vote, which represents a proportional increase in turnout of 13% compared to the 22.7% turnout rate in the placebo condition. The Closeness 2500 and GOTV messages are both more effective than the Placebo message (by 1.8 and 2.0 points respectively), but neither is as effective as the Closeness 350 message. Thus, providing information that heightens perceptions that the election is close increases turnout compared to an otherwise identical message that makes the election seem less likely to be close, and the Closeness 350 message is more effective than a standard simple GOTV script. [Insert Figure 1 about here.] Results, Mail Experiment Paralleling our analysis from the phone experiment, Table 4 displays regression estimates of the effects of the different closeness treatments (350, 650, and 1000 votes) relative to the 2500-vote baseline for the mail experiment. These results differ from those found in the phone experiment. First, we find that none of the closeness treatments have statistically distinguishable effects from one another. Turnout in the 2500-vote treatment is 22.7%, 20.9% in the 1000-vote treatment, and 21.4% and 21.3%, respectively, in the 650- and 350-vote treatments. Additionally, the estimates are non-monotonic with changes in election closeness: The highest turnout is associated with the largest election margin (2500 votes), but the smallest turnout occurs in the 1000-vote-margin treatment. 20
22 [Insert Table 4 about here.] Second, the results of the closeness treatments are indistinguishable from the effects of a standard GOTV message. Compared to an uncontacted control group, the GOTV message increased turnout by.8 percentage points (p<.05). We cannot reject the null that the estimated effect of any of the closeness treatments is different from this estimate. (The average effect of being sent any closeness treatment is to increase turnout by 1.1 points compared to the control group, but this difference is indistinguishable from the GOTV effect and its magnitude is driven, in large part, by the 2500 vote condition.) Overall, these results contrast with those from Experiment 1 and the phone experiment, but it is unclear whether they reflect real differences in treatment effects or are instead driven by sampling variability and the difficulty of delivering treatments by mail. These results are null effects (comparing across closeness treatments) and non-monotonic, which can be interpreted as evidence undercutting the importance of differences in expected election closeness, the ineffectiveness of these treatments when delivered by mail (for example, people may not pay attention to or fully incorporate the historical margin given their views about expected closeness), the difficulty of ensuring treatment delivery (mail may not be delivered or may be ignored), or sampling variability. In this final respect, the fact that we can condition the analysis of experiment #1 on those who complete the survey and the phone experiment on comparisons among those we can contact by telephone (and with comparatively larger treatment cells) gives those experiments greater power vis-à-vis this one. At the same time, these are merely arguments and we cannot reject the possibility that the differences across experiments arise for other reasons like sample composition or accurate samplings from an underlying distribution of true treatment-effects distributions. Study #3: 2015 and 2017 Survey Experiment Assessing Potential Treatment Mechanisms The preceding experiments provide suggestive evidence that messages designed to increase the perceived closeness of an election can, in some cases, increase reported (experiment 1) and actual (experiment 2, phone) turnout. While these results are consistent with the interpretation that the treatment operates via 21
23 the perceived closeness mechanism, we have not provided evidence showing that the treatments actually do manipulate expected closeness (but see Gerber et al. 2017). Nor have we provided evidence ruling out the possibility that the treatments increased turnout through alternative causal pathways (that is, we have not validated the exclusion restriction). For this reason, our third experiment is a survey experiment that pairs treatments similar to those used in the field experiment with measures of potential mechanisms to explain the effectiveness of the close election message in increasing turnout. We recruited N=2,604 respondents to complete a survey hosted online by Qualtrics using samples provided by Survey Sampling International (N=1,747 in 2015) and Lucid (N=857 in 2017). To be eligible to participate, subjects had to provide informed consent, be 18 years of age or older, and provide their states of residence (necessary for customized treatment delivery, see below) 19. To be in the final analysis sample subjects had to complete the entire survey, including measures of covariates, and not have completed the survey too quickly or too slowly. 20 Subjects were assigned to one of two treatments, which differ only in how close they describe elections for the state legislature generally being. Specifically, the treatment text read: Think about the next election for the State [SEATNAME] in [YOURSTATE]. Prior to that election, you receive the following message from a non-partisan group encouraging participation: Because fewer people vote in State [SEATNAME] elections than in elections for Congress, each vote matters more for deciding who wins. In fact, of the seriously contested races for State [SEATNAME] seats in the last election, more than 10% were decided by fewer than [350 or 2500] votes. Think about how you will feel if you don t vote and it turns out the election was decided by only a few votes! The variables SEATNAME and YOURSTATE were populated based on subjects responses about their current residence. The election closeness manipulation, whether 10% of (seriously contested) 19 Additionally, for the SSI sample, unrelated content on the survey caused us to eliminate people who stated they were ineligible to register to vote or did not know if they were eligible to vote. We also eliminated all responses from individuals who appeared to have taken the survey multiple times. For reasons stemming from unrelated content on the Lucid survey, that sample was restricted to individuals who confirmed they were not using cell phones to take the survey and were partisans or leaned toward one of the two major parties (i.e., there are no pure independents). 20 We eliminated all subjects who took longer than 60 minutes because of concerns about time between treatment delivery and outcome measurement. We eliminated subjects who took less than 4 minutes to complete the SSI survey or 3 minutes to complete the Lucid survey because, given the length of each survey, this timing indicated to us low levels of attention. These restrictions removed 223 observations from the SSI sample (11%) and 159 from the Lucid sample (16%). Including subjects who were excluded in this way generally increases the p-values of treatment effects reported below. 22
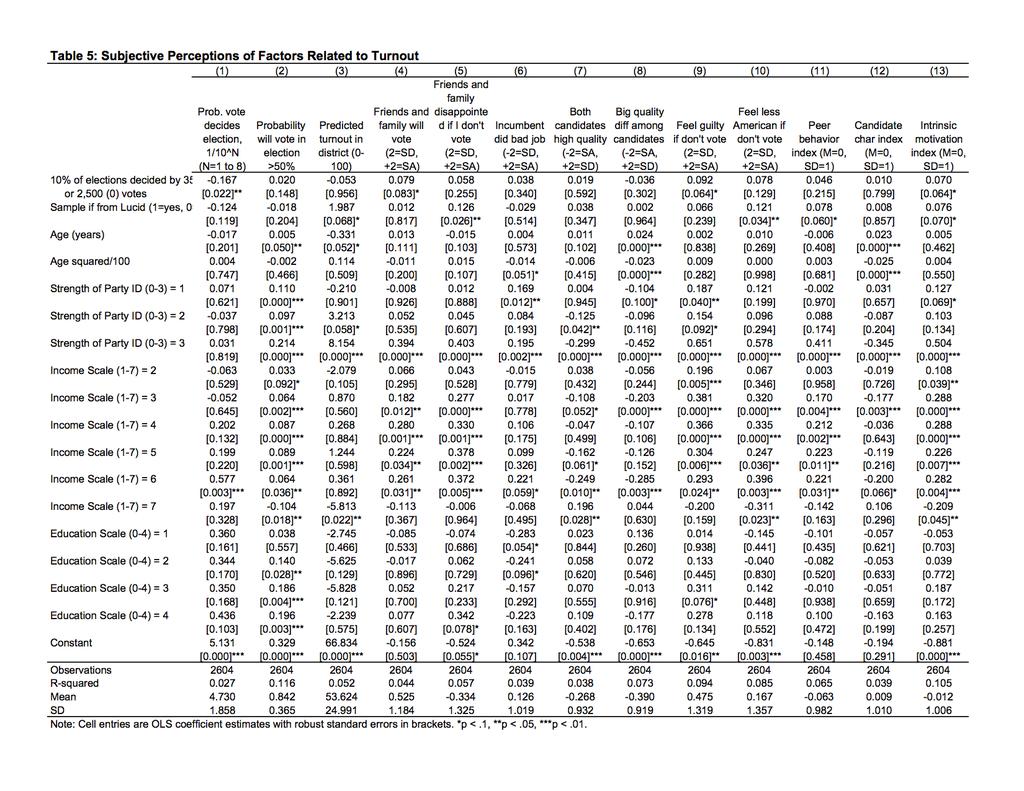
24 races were decided by 350 or 2500 votes, was randomly assigned with equal probability. Thus, the salient differences from the field experiment language are the focus on state legislative offices and the hypothetical nature of the treatment. After treatment was delivered, subjects completed a battery of items designed to measure different theoretical constructs. 21 As a proxy for the outcome in the field experiment, we measured interest in voting in the next state legislative election (coded 1 if the response on a scale from was above 50). To assess whether the treatment affected expectations about election closeness, we measured the expected probability the respondent s vote would decide the election (1/10^N, where N could vary from 1 to 8). Finally, to assess different causal mechanisms (other than just expected closeness) that could affect the motivation to vote, we measured beliefs about peer behavior (expected turnout in the district [0-100] and whether friends and family would vote [5-point scale, coded -2 to 2]), peer expectations (whether friends and family would be disappointed if subject didn t vote [5-point scale, coded -2 to 2]), perceptions of incumbent and challenger characteristics (whether incumbent did a bad job, incumbent and challenger were both of same quality, and the subject s perception of the big difference in candidate quality, all measured on 5 point scales coded -2 to 2), and intrinsic motivations to participate (feeling guilty for not voting and feeling less American for not voting, both measured on 5-point scales coded from -2 to 2). For ease of exposition, all of the measures apart from expected closeness are coded so that higher scores indicate improved motivations to vote (e.g., candidates of equal quality should depress the material returns to vote, so disagreeing both candidates are of the same quality is coded positively). Additionally, because several of the items measure the same theoretical construct, we created three scales that combine multiple items: a peer behavior index (a standardized index composed of the sum of the standardized scores on the district turnout, friends and family turnout, and friends and family disappointed if don t vote 21 The interest in voting outcome measure always appeared first, followed by the remaining items (in blocks) in randomized orders across and within blocks. 23
25 measures), a candidate characteristic index (a standardized index composed of the sum of the standardized scores for the three candidate/challenger characteristic items), and an intrinsic motivations index (a standardized index composed of the sum of the standardized scores for the guilt and less American items). We report analysis of this survey data in Table 5. Our analysis strategy for each outcome is the same. We predict the outcome using an OLS regression with robust standard errors where the independent variables are a treatment indicator for closer elections (10% of elections decided by 350 rather than 2,500 votes), the respondent being in the Lucid sample (rather than SSI), and various relevant covariates (strength of partisanship as indicators, income as indicators, with a separate indicator for refusal to provide, age in years and age squared [divided by 100], and education as indicators). 22 [Insert Table 5 about here.] Beginning in column (1), we see clear evidence that the treatment affected perceptions of expected election closeness. Those who we told 10% of elections were decided by 350 votes, rather than 2,500 votes, believed the chances their vote would decide the election were substantively higher (p=.01, one-sided p-values reported for effects with directional expectations). Because the measure is scaled as 1/10^N, it is somewhat difficult to interpret directly, and so it is useful also to examine the underlying distribution of responses. Those in the 350-votes condition were more likely to believe their vote would decide the race 1 time out of 10 (5% versus 4% in the 2500-votes condition), 1 time out of 100 or more frequently (13% versus 10%), and 1 time out of 1000 or more frequently (30% versus 24%). Next, in column (2), we show that the treatment modestly increased interest in voting. This measure is a binary variable, where 1 indicates the respondent has a greater than 50% predicted probability of voting in the next election of this type. Individuals in the 350 votes condition are 2 percentage points more likely to report interest in voting (p=.07, one-tailed). We then turn to consideration of factors other than expected election closeness that could explain this effect (and the results from experiments 1 and 2). In columns (3) and (4) we examine expectations 22 Note: Gender is omitted because we did not collect this covariate for the SSI sample. 24
26 about others turnout behavior, while in (5) we consider peer evaluations of a decision to abstain. The treatment does not appear to meaningfully alter expectations about overall district turnout (a coefficient estimate close to 0 and far from statistically significant), but it is associated with an increased belief that one s friends and family will vote (p=.04) and that those friends and family will view failing to vote negatively (p=.13). So, overall, there appears to be some evidence that the treatment induces different expectations about peer behavior, but not differences in expectations about voters on average. Combining these three items into a standardized index in column (11) yield a similar interpretation, again with borderline indications of statistical significance (p=.11, one-tailed). In columns (6) through (8) we examine whether the treatment affected beliefs about incumbent and challenger quality that would affect the likely instrumental returns to voting (i.e., the quality differences between the candidates). For all three dependent variables, the coefficient estimates are substantively small and statistically insignificant. Not surprisingly, therefore, in an analysis using an index composed of these three items (column 12), we also find null effects. It does not appear, therefore, that the closeness treatment affected expectations about the candidate-driven returns to voting (the B term in the canonical voting-decision model). Finally, in columns (9) and (10) we test whether the election closeness manipulation affected the intrinsic motivation to participate (i.e., feelings of civic duty). Per column (9), the treatment increased expected feelings of guilt if one did not vote (p=.03, one-tailed), while it had a more modest effect on feelings about being less American if one did not vote (p=.07, one-tailed). Combining these two items into an index, as in column (13), yields a statistically significant (p=.03, one-tailed) effect. Stepping back, this set of results provides new insights into the importance of expected election closeness in explaining turnout and the mechanism underlying this effect. Put most bluntly, we find largely positive evidence that expected election closeness increases turnout, but new evidence that even this treatment effect can originate through at least three different mechanisms for which we provide direct evidence: increased beliefs that one s vote decides an election (increased P in the canonical turnout equation), increased social returns to voting (a decrease in C, the cost of voting), and increased intrinsic 25
27 returns to voting (also a decrease in C, the cost of voting). From an empirical perspective, the turnout result is encouraging, but the mechanism result muddies its theoretical meaning: While election closeness does appear to affect the turnout calculus, we still cannot isolate the causal mechanism for this effect and, as such, it is premature to privilege any of these three mechanisms. Discussion and Conclusion Does variation in expected election closeness, a core factor in the canonical decision-theoretic turnout calculus, explain voting? We provide strongly suggestive experimental evidence, in both the survey and field-experimental contexts, that it does. In three of four tests (a survey experiment independently manipulating turnout and a polling margin, a field experiment manipulating the expected closeness of a class of elections when treatments are delivered by phone, but not mail, and a survey experiment replicating the field experimental intervention), we find that increasing expected election closeness increases reported or actual participation. Importantly, in our first experiment we fix expected turnout, and in our latter experiments we provide information about expected election closeness that is independent of the expected margin in a specific race. The latter treatments are particularly novel compared to prior work, because polling margins in a specific race can communicate information beyond expected closeness about other factors like turnout and incumbent and challenger characteristics. Does this show, therefore, that our treatments increase turnout by increasing the instrumental returns to voting via altering the chances that one s vote decides an election? Evidence that the election closeness treatments work in this way that is, evidence isolating the causal mechanism to changes in predicted chances that one s vote is pivotal but not to other factors that could also affect the decision to vote would be highly suggestive. However, our third experiment shows this conclusion is premature: Treatments that communicate information about the closeness of a class of elections do cause people to be more likely to vote or express interest in voting and do increase the expected chances one s vote decides an election. But they also appear to perturb other relevant and likely consequential causal pathways beliefs about civic duty (an intrinsic motivation to vote) and expectations about peer behavior and 26
28 evaluations (social norms), for example. They do not appear, however, to alter beliefs about incumbent and challenger characteristics. Where does this leave us? First, together, these results show that election closeness does appear to matter. All else equal, closer elections do drive greater participation. Second, the causal mechanism for this effect remains uncertain. As such, it is premature to either abandon or embrace the Riker-Ordeshook perspective or related decision-theoretic or game theoretic accounts on the basis of this evidence. This is because a treatment one might reasonably suppose alters only closeness also affects other relevant pathways. Third, there is room for continued research (and creativity) about the construction of instruments that can independently manipulate the different theoretical constructs that may explain turnout. Fourth, and perhaps most generally, while experimentation opens the possibility of targeted manipulations, it also requires that (responsible) researchers do more than simply assume they understand the mechanisms by which treatments affect outcomes. Thus, pairing survey and field experiments provides a promising way to understand the different theoretical constructs affected by a treatment intervention. In this regard, our design, in which we test that the treatment affects both the theoretical construct we designed it to alter and whether or not it affected arguably unrelated concepts is a design tool for other scholars to follow. Of course, no such measurement strategy can be exhaustive of all potential mechanisms, but where theory and past research provide clear guidance, scholars should undertake studies that test their assumptions about the ways in which treatments are interpreted by, and affect, those they target. 27
29 References Aldrich, John H Rational Choice and Turnout. American Journal of Political Science 37(1): Ansolabehere, Stephen and Shanto Iyengar Of Horseshoes and Horse Races: Experimental Studies of the Impact of Poll Results on Electoral Behavior. Political Communication 11(4): Battaglini, Marco, Rebecca B. Morton, and Thomas R Palfrey The Swing Voter s Curse in the Laboratory. Review of Economic Studies 77(1): Bennion, Elizabeth A Caught in the Ground Wars: Mobilizing Voters During a Competitive Congressional Campaign. Annuals of the American Academy of Political and Social Science 601: Blais, Andre To Vote or Not to Vote. Pittsburgh: University of Pittsburgh Press. Blais, Andre, Robert Young, and Miriam Lapp The Calculus of Voting: An Empirical Test. European Journal of Political Research 37(2): Cox, Gary W., and Michael C. Munger Closeness, Expenditures, and Turnout in the 1982 U.S. House Elections. American Political Science Review 83(1): Dale, Allison and Aaron Strauss Don t Forget to Vote: Text Message Reminders as a Mobilization Tool. American Journal of Political Science 53(4): Doherty, David, Conor M. Dowling, Alan S. Gerber, and Gregory A. Huber Are Voting Norms Conditional? How Electoral Context and Peer Behavior Shape the Social Returns to Voting. Journal of Politics 79(3): Duffy, John and Margit Tavits Beliefs and Voting Decisions: A Test of the Pivotal Voter Model. American Journal of Political Science 52(3): Enos, Ryan D., and Anthony Fowler Pivotality and Turnout: Evidence from a Field Experiment in the Aftermath of a Tied Election. Political Science Research and Methods 2(2):
30 Feddersen, Timothy J., and Wolfgang Pesendorfer The Swing Voter s Curse. American Economic Review 86(3): Feddersen, Timothy J., and Wolfgang Pesendorfer Abstention in Elections with Asymmetric Information and Diverse Preferences. American Political Science Review 93(2): Gerber, Alan, Mitchell Hoffman, John Morgan, and Collin Raymond One in a Million: Field Experiments on Perceived Closeness of the Election and Voter Turnout. NBER Working Paper Series # Gerber, Alan S., and Donald P. Green The Effects of Canvassing, Telephone Calls, and Direct Mail on Voter Turnout: A Field Experiment. American Political Science Review 94(3): Geys, Benny Explaining Voter Turnout: A Review of Aggregate-Level Research. Electoral Studies 25: Green, Donald P., and Ian Shapiro Pathologies of Rational Choice Theory. New Haven: Yale University Press. Kam, Cindy D., and Stephen M. Utych Close Elections and Cognitive Engagement. Journal of Politics 73(4): Levine, David and Thomas Palfrey The Paradox of Voter Participation? A Laboratory Study. American Political Science Review 101(1): Matland, Richard E., and Gregg R. Murray An Experimental Test of Mobilization Effects in a Latino Community. Political Research Quarterly 65(1): Matsusaka, John G., and Filip Palda The Downsian Voter Meets the Ecological Fallacy. Public Choice 77: Nickerson, David W Volunteer Phone Calls Can Increase Turnout: Evidence from Eight Field Experiments. American Politics Research 34(3): Nickerson, David W Quality is Job One: Professional and Volunteer Voter Mobilization Calls. American Journal of Political Science 51(2):
31 Palfrey, Thomas R., and Howard Rosenthal A Strategic Calculus of Voting. Public Choice 41: Palfrey, Thomas R., and Howard Rosenthal Voter Participation and Strategic Uncertainty. American Political Science Review 79(1): Riker, William, and Peter Ordeshook, A Theory of the Calculus of Voting. American Political Science Review 62(1): Smets, Kaat, and Carolien van Ham The Embarrassment of Riches? A Meta-Analysis of Individual-Level Research on Voter Turnout. Electoral Studies 32:

32 31
33 Table 1. Prior Field Experiments Examining the "Closeness" Hypothesis (A) (B) (C) (D) (E) (F) (G) Study Mode of Contact Closeness Language Compare to Other Treatment/ Control? Results Compare between "Closeness"? Sample Size Gerber and Green (2000) Gerber and Green (2000) Door-to-Door Each year some election is decided by only a handful of votes. Who serves in important national, state, and local offices depends on the outcome of the election, and your vote can make a difference on election day. Phone Not Reported Y Y Compared to Civic Duty Message (ATT):.030 Compared to No Contact (ATT):.121* Compared to No Contact (ATT; Treatments Pooled): N N Control = Closeness = 1928 Civic Duty = 1985 Control = Treatments = 6754 Gerber and Green (2000) Direct Mail "This year many elections will be decided by only a handful of votes--will yours be the deciding vote?" Y Compared to No Contact (Treatments Pooled):.002* N Control = Treatments = Bennion (2005) Door-to-Door "In an election, anything can happen. This year many Indiana elections will be decided by only a handful of votes--will yours be the deciding vote?" Y Compared to Civic Duty Message: Compared to No Contact (Treatments Pooled):.006 N Control = 1089 Closeness = 544 Civic Duty = 544 Dale and Strauss (2009) Text Messages Elections often come down to a few votes so please vote! Y Compared to Civic Duty Message: Compared to No Contact:.027* N Control = 4046 Closeness = 1974 Civic Duty = 2033 Enos and Fowler (2014) Phone The reason that there is a special election is that the last election ended in an exact tie. Had one more or one less person voted in the last election, your candidate would have won. The special election on Tuesday is likely to be close again, so there is a high chance that your vote could make a difference. Y Compared to Reminder Message:.006 N Closeness = 2995 Reminder = 2955 Note: Gerber and Green (2000) do not report turnout rates across treatments for mail and phone experiments, only that the effects are not statistically distinguishable from each other. Gerber and Green (2000) direct mail effect estimate derived from dividing treatment effect by number of mailings. *p<.05 32
34 Table 2: Effect of Election Closeness and Turnout on Stated Primary Participation Survey Vignette is: "Turnout in the upcoming primary will be [high/low] and pre-election polls show one candidate is currently leading by [1%/5%/15%/20%]." Effect of Message on Stated likelihood of voting in Primary (-1 Much less Likely to +1 Much more Likely) With Demographic Covariates With Demographic Covariates and weighted With Demographic Covariates and State Fixed Effects Treatment: Leading By 1% [0.032]*** [0.031]*** [0.035]*** [0.032]*** Treatment: Leading By 5% [0.032]*** [0.031]*** [0.034]** [0.032]*** Treatment: Leading By 15% [0.031] [0.031] [0.035] [0.031] Treatment: Leading By 20% [0.032] [0.031] [0.035] [0.032] Treatment: Turnout High (50%) [0.026]** [0.025]* [0.029] [0.025]* Treatment: Turnout Low (15%) [0.025]* [0.024]** [0.028]* [0.025]* Constant [0.027]*** [0.116] [0.140] [0.167] Observations R-squared Note: Cell entries are OLS coefficient estimates with robust standard errors in brackets. Source: Primary Participation Survey. Model includes demographic and political covariates. *p < 10%; **p < 5%; *** p < 1%. Excluded Treatment Categories: Turnout is 30%; Leading by 10%. Average scale response to this question is
35 Table 3: Turnout by Closeness Experimental Condition in Phone Field Experiment Proportion Voting, 350 Votes Treatment Proportion Voting, 2500 Votes Treatment Difference of Proportions (350 votes votes) [Standard Error] Regression Estimate of Difference (350 votes votes) [Standard Error] Number of Observations (350 votes, 2500 votes) Sample Entire Sample [0.007] [0.005] (8453,8402) State=Massachusetts [0.017] [0.014] (1335,1336) State=Michigan [0.019] [0.014] (1050,993) State=Minnesota [0.011] [0.010] (2295,2372) State=Missouri [0.028] [0.024] (585,568) State=New Hampshire [0.030] [0.024] (474,484) State=Tennessee [0.028] [0.022] (653,636) State=Wisconsin [0.014] [0.011] (2061,2013) No Competitive House Primary [0.008] [0.007] (5867,5881) Either House Primary Competitive [0.012] [0.010] (2586,2521) Ever Voters [0.007] [0.006] (8168,8106) Have Voted in Primary [0.013] [0.011] (3164,3034) Have Voted, but Never in Primary [0.006] [0.006] (5004,5072) No Prior History of Voting [0.018] [0.017] (285,296) 34
36 Table 4: Effect of Mail Treatment about Closeness on Turnout 35 (1) (2) (3) Treat=Closeness 1 (350 votes) [0.006]* [0.012] [0.013] Treat=Closeness 2 (650 votes) [0.006] [0.011] [0.013] Treat=Closeness 3 (1000 votes) MA-Total General Election Votes 0.01 [0.006] [0.011] [0.013] [0.009] MA-Total Primary Election Votes [0.019]*** MA-Total Special Election Votes [0.009]*** MI-Total General Election Votes [0.007]*** MI-Total Primary Election Votes [0.013]*** MI-Total Special Election Votes [0.012]*** MN-Total General Election Votes 0.02 [0.008]** MN-Total Primary Election Votes [0.043]*** MN-Total Special Election Votes [0.018] MO-Total General Election Votes [0.013]*** MO-Total Primary Election Votes [0.021]*** MO-Total Special Election Votes [0.018]*** NH-Total General Election Votes [0.014] NH-Total Primary Election Votes [0.029]*** NH-Total Special Election Votes [0.072]...
37 Table 4: Effect of Mail Treatment about Closeness on Turnout (Continued) TN-Total General Election Votes (1) (2) (3) [0.014]*** TN-Total Primary Election Votes [0.018]*** TN-Total Special Election Votes [0.026]*** WI-Total General Election Votes [0.006]*** WI-Total Primary Election Votes [0.017]*** WI-Total Special Election Votes [0.013]* Constant [0.026] [0.019]** [0.009]*** Includes strata (state, district type, voter history) Yes Yes No Includes demographic controls Yes No No Observations 17,063 17,063 17,063 R-squared Note: Cell entries are OLS regression coefficient estimates with robust standard errors in parentheses. Demographic controls are, for each state in the study, years since registration date, election day age, gender, and indicators for whether the participant is black, latino, or other. *p <.10, **p <.05, ***p<
38 37
Case Study: Get out the Vote
 Case Study: Get out the Vote Do Phone Calls to Encourage Voting Work? Why Randomize? This case study is based on Comparing Experimental and Matching Methods Using a Large-Scale Field Experiment on Voter
Supporting Information for Do Perceptions of Ballot Secrecy Influence Turnout? Results from a Field Experiment
 Supporting Information for Do Perceptions of Ballot Secrecy Influence Turnout? Results from a Field Experiment Alan S. Gerber Yale University Professor Department of Political Science Institution for Social
Article (Accepted version) (Refereed)
 (Refereed)") Alan S. Gerber, Gregory A. Huber, Daniel R. Biggers and David J. Hendry Self-interest, beliefs, and policy opinions: understanding how economic beliefs affect immigration policy preferences Article (Accepted
Alan S. Gerber, Gregory A. Huber, Daniel R. Biggers and David J. Hendry Self-interest, beliefs, and policy opinions: understanding how economic beliefs affect immigration policy preferences Article (Accepted
Can Raising the Stakes of Election Outcomes Increase Participation? Results from a Large-Scale Field Experiment in Local Elections
 Can Raising the Stakes of Election Outcomes Increase Participation? Results from a Large-Scale Field Experiment in Local Elections Gregory A. Huber Yale University, Professor Department of Political Science
14.11: Experiments in Political Science
 14.11: Experiments in Political Science Prof. Esther Duflo May 9, 2006 Voting is a paradoxical behavior: the chance of being the pivotal voter in an election is close to zero, and yet people do vote...
Online Appendix. Pivotality and Turnout: Evidence from a Field Experiment in the Aftermath of a Tied Election. Ryan D. Enos and Anthony Fowler
 Online Appendix Pivotality and Turnout: Evidence from a Field Experiment in the Aftermath of a Tied Election Ryan D. Enos and Anthony Fowler Note on the Inclusion of Articles in the Literature Review of
Experiments in Election Reform: Voter Perceptions of Campaigns Under Preferential and Plurality Voting
 Experiments in Election Reform: Voter Perceptions of Campaigns Under Preferential and Plurality Voting Caroline Tolbert, University of Iowa (caroline-tolbert@uiowa.edu) Collaborators: Todd Donovan, Western
Proposal for the 2016 ANES Time Series. Quantitative Predictions of State and National Election Outcomes
 Proposal for the 2016 ANES Time Series Quantitative Predictions of State and National Election Outcomes Keywords: Election predictions, motivated reasoning, natural experiments, citizen competence, measurement
A Dead Heat and the Electoral College
 A Dead Heat and the Electoral College Robert S. Erikson Department of Political Science Columbia University rse14@columbia.edu Karl Sigman Department of Industrial Engineering and Operations Research sigman@ieor.columbia.edu
A positive correlation between turnout and plurality does not refute the rational voter model
 Quality & Quantity 26: 85-93, 1992. 85 O 1992 Kluwer Academic Publishers. Printed in the Netherlands. Note A positive correlation between turnout and plurality does not refute the rational voter model
On the Causes and Consequences of Ballot Order Effects
 Polit Behav (2013) 35:175 197 DOI 10.1007/s11109-011-9189-2 ORIGINAL PAPER On the Causes and Consequences of Ballot Order Effects Marc Meredith Yuval Salant Published online: 6 January 2012 Ó Springer
Report on Citizen Opinions about Voting & Elections
 Center for Public Opinion Dr. Joshua J. Dyck and Dr. Francis Talty, Co-Directors http://www.uml.edu/polls Report on Citizen Opinions about Voting & Elections Results of 2 surveys Polls Conducted by YouGov
NBER WORKING PAPER SERIES PARTY AFFILIATION, PARTISANSHIP, AND POLITICAL BELIEFS: A FIELD EXPERIMENT
 NBER WORKING PAPER SERIES PARTY AFFILIATION, PARTISANSHIP, AND POLITICAL BELIEFS: A FIELD EXPERIMENT Alan S. Gerber Gregory A. Huber Ebonya Washington Working Paper 15365 http://www.nber.org/papers/w15365
POLL: CLINTON MAINTAINS BIG LEAD OVER TRUMP IN BAY STATE. As early voting nears, Democrat holds 32-point advantage in presidential race
 DATE: Oct. 6, FOR FURTHER INFORMATION, CONTACT: Brian Zelasko at 413-796-2261 (office) or 413 297-8237 (cell) David Stawasz at 413-796-2026 (office) or 413-214-8001 (cell) POLL: CLINTON MAINTAINS BIG LEAD
What is The Probability Your Vote will Make a Difference?
 Berkeley Law From the SelectedWorks of Aaron Edlin 2009 What is The Probability Your Vote will Make a Difference? Andrew Gelman, Columbia University Nate Silver Aaron S. Edlin, University of California,
The Partisan Effects of Voter Turnout
 The Partisan Effects of Voter Turnout Alexander Kendall March 29, 2004 1 The Problem According to the Washington Post, Republicans are urged to pray for poor weather on national election days, so that
Objectives and Context
 Encouraging Ballot Return via Text Message: Portland Community College Bond Election 2017 Prepared by Christopher B. Mann, Ph.D. with Alexis Cantor and Isabelle Fischer Executive Summary A series of text
Why People Vote: Estimating the Social Returns to Voting
 Why People Vote: Estimating the Social Returns to Voting Alan S. Gerber Yale University Professor Department of Political Science Institution for Social and Policy Studies 77 Prospect Street, PO Box 208209
Supplementary Materials A: Figures for All 7 Surveys Figure S1-A: Distribution of Predicted Probabilities of Voting in Primary Elections
 Supplementary Materials (Online), Supplementary Materials A: Figures for All 7 Surveys Figure S-A: Distribution of Predicted Probabilities of Voting in Primary Elections (continued on next page) UT Republican
Learning from Small Subsamples without Cherry Picking: The Case of Non-Citizen Registration and Voting
 Learning from Small Subsamples without Cherry Picking: The Case of Non-Citizen Registration and Voting Jesse Richman Old Dominion University jrichman@odu.edu David C. Earnest Old Dominion University, and
1. The Relationship Between Party Control, Latino CVAP and the Passage of Bills Benefitting Immigrants
 The Ideological and Electoral Determinants of Laws Targeting Undocumented Migrants in the U.S. States Online Appendix In this additional methodological appendix I present some alternative model specifications
The Case of the Disappearing Bias: A 2014 Update to the Gerrymandering or Geography Debate
 The Case of the Disappearing Bias: A 2014 Update to the Gerrymandering or Geography Debate Nicholas Goedert Lafayette College goedertn@lafayette.edu May, 2015 ABSTRACT: This note observes that the pro-republican
SIERRA LEONE 2012 ELECTIONS PROJECT PRE-ANALYSIS PLAN: INDIVIDUAL LEVEL INTERVENTIONS
 SIERRA LEONE 2012 ELECTIONS PROJECT PRE-ANALYSIS PLAN: INDIVIDUAL LEVEL INTERVENTIONS PIs: Kelly Bidwell (IPA), Katherine Casey (Stanford GSB) and Rachel Glennerster (JPAL MIT) THIS DRAFT: 15 August 2013
Door-to-door canvassing in the European elections: Evidence from a Swedish field experiment
 Door-to-door canvassing in the European elections: Evidence from a Swedish field experiment Pär Nyman Department of Government Uppsala University December 14, 2016 Abstract In this paper I report the results
The National Citizen Survey
 CITY OF SARASOTA, FLORIDA 2008 3005 30th Street 777 North Capitol Street NE, Suite 500 Boulder, CO 80301 Washington, DC 20002 ww.n-r-c.com 303-444-7863 www.icma.org 202-289-ICMA P U B L I C S A F E T Y
Iowa Voting Series, Paper 6: An Examination of Iowa Absentee Voting Since 2000
 Department of Political Science Publications 5-1-2014 Iowa Voting Series, Paper 6: An Examination of Iowa Absentee Voting Since 2000 Timothy M. Hagle University of Iowa 2014 Timothy M. Hagle Comments This
Following the Leader: The Impact of Presidential Campaign Visits on Legislative Support for the President's Policy Preferences
 University of Colorado, Boulder CU Scholar Undergraduate Honors Theses Honors Program Spring 2011 Following the Leader: The Impact of Presidential Campaign Visits on Legislative Support for the President's
One in a Million: A Field Experiment on Belief Formation and Pivotal Voting
 One in a Million: A Field Experiment on Belief Formation and Pivotal Voting Mitchell Hoffman and John Morgan University of California, Berkeley WORK IN PROGRESS April 30, 2012 Abstract In swing voter models,
Online Appendix for Redistricting and the Causal Impact of Race on Voter Turnout
 Online Appendix for Redistricting and the Causal Impact of Race on Voter Turnout Bernard L. Fraga Contents Appendix A Details of Estimation Strategy 1 A.1 Hypotheses.....................................
Supplementary Materials for Strategic Abstention in Proportional Representation Systems (Evidence from Multiple Countries)
") Supplementary Materials for Strategic Abstention in Proportional Representation Systems (Evidence from Multiple Countries) Guillem Riambau July 15, 2018 1 1 Construction of variables and descriptive statistics.
Supplementary Materials for Strategic Abstention in Proportional Representation Systems (Evidence from Multiple Countries) Guillem Riambau July 15, 2018 1 1 Construction of variables and descriptive statistics.
THE EFFECT OF EARLY VOTING AND THE LENGTH OF EARLY VOTING ON VOTER TURNOUT
 THE EFFECT OF EARLY VOTING AND THE LENGTH OF EARLY VOTING ON VOTER TURNOUT Simona Altshuler University of Florida Email: simonaalt@ufl.edu Advisor: Dr. Lawrence Kenny Abstract This paper explores the effects
Voting and Electoral Competition
 Voting and Electoral Competition Prof. Panu Poutvaara University of Munich and Ifo Institute On the organization of the course Lectures, exam at the end Articles to read. In more technical articles, it
Modeling Political Information Transmission as a Game of Telephone
 Modeling Political Information Transmission as a Game of Telephone Taylor N. Carlson tncarlson@ucsd.edu Department of Political Science University of California, San Diego 9500 Gilman Dr., La Jolla, CA
Ohio State University
 Fake News Did Have a Significant Impact on the Vote in the 2016 Election: Original Full-Length Version with Methodological Appendix By Richard Gunther, Paul A. Beck, and Erik C. Nisbet Ohio State University
Information and Identification: A Field Experiment on Virginia's Photo Identification Requirements. July 16, 2018
 1 Information and Identification: A Field Experiment on Virginia's Photo Identification Requirements July 16, 2018 Kyle Endres Kyle.endres@gmail.com Duke University Costas Panagopoulos c.panagopoulos@northeastern.edu
Wisconsin Economic Scorecard
 RESEARCH PAPER> May 2012 Wisconsin Economic Scorecard Analysis: Determinants of Individual Opinion about the State Economy Joseph Cera Researcher Survey Center Manager The Wisconsin Economic Scorecard
Methodology. 1 State benchmarks are from the American Community Survey Three Year averages
 The Choice is Yours Comparing Alternative Likely Voter Models within Probability and Non-Probability Samples By Robert Benford, Randall K Thomas, Jennifer Agiesta, Emily Swanson Likely voter models often
Can Politicians Police Themselves? Natural Experimental Evidence from Brazil s Audit Courts Supplementary Appendix
 Can Politicians Police Themselves? Natural Experimental Evidence from Brazil s Audit Courts Supplementary Appendix F. Daniel Hidalgo MIT Júlio Canello IESP Renato Lima-de-Oliveira MIT December 16, 215
The Cook Political Report / LSU Manship School Midterm Election Poll
 The Cook Political Report / LSU Manship School Midterm Election Poll The Cook Political Report-LSU Manship School poll, a national survey with an oversample of voters in the most competitive U.S. House
Online Appendix for. The Minimal Persuasive Effects of Campaign Contact in General Elections: Evidence from 49 Field Experiments
 Online Appendix for The Minimal Persuasive Effects of Campaign Contact in General Elections: Evidence from 49 Field Experiments Joshua L. Kalla & David E. Broockman A Supplementary Figures and Tables Figure
RBS SAMPLING FOR EFFICIENT AND ACCURATE TARGETING OF TRUE VOTERS
 Dish RBS SAMPLING FOR EFFICIENT AND ACCURATE TARGETING OF TRUE VOTERS Comcast Patrick Ruffini May 19, 2017 Netflix 1 HOW CAN WE USE VOTER FILES FOR ELECTION SURVEYS? Research Synthesis TRADITIONAL LIKELY
Compulsory versus Voluntary Voting Mechanisms: An Experimental Study
 Compulsory versus Voluntary Voting Mechanisms: An Experimental Study Sourav Bhattacharya John Duffy Sun-Tak Kim January 31, 2011 Abstract This paper uses laboratory experiments to study the impact of voting
NH Statewide Horserace Poll
 NH Statewide Horserace Poll NH Survey of Likely Voters October 26-28, 2016 N=408 Trump Leads Clinton in Final Stretch; New Hampshire U.S. Senate Race - Ayotte 49.1, Hassan 47 With just over a week to go
Author(s) Title Date Dataset(s) Abstract
 Title Date Dataset(s) Abstract") Author(s): Traugott, Michael Title: Memo to Pilot Study Committee: Understanding Campaign Effects on Candidate Recall and Recognition Date: February 22, 1990 Dataset(s): 1988 National Election Study, 1989
Author(s): Traugott, Michael Title: Memo to Pilot Study Committee: Understanding Campaign Effects on Candidate Recall and Recognition Date: February 22, 1990 Dataset(s): 1988 National Election Study, 1989
Elite Polarization and Mass Political Engagement: Information, Alienation, and Mobilization
 JOURNAL OF INTERNATIONAL AND AREA STUDIES Volume 20, Number 1, 2013, pp.89-109 89 Elite Polarization and Mass Political Engagement: Information, Alienation, and Mobilization Jae Mook Lee Using the cumulative
The calculus of get-out-the-vote in a high turnout setting. Paper prepared for the panel Relationships and Voter Turnout at the MPSA Conference,
 The calculus of get-out-the-vote in a high turnout setting Paper prepared for the panel 23-15 Relationships and Voter Turnout at the MPSA Conference, Chicago 3-6. April 2014. Yosef Bhatti**, Jens Olav
This report is formatted for double-sided printing.
 Public Opinion Survey on the November 9, 2009 By-elections FINAL REPORT Prepared for Elections Canada February 2010 Phoenix SPI is a Gold Seal Certified Corporate Member of the MRIA 1678 Bank Street, Suite
Knock Knock : Do personal and impersonal party campaigning activities increase voter turnout? Evidence from a UK-based partisan GOTV field experiment
 Knock Knock : Do personal and impersonal party campaigning activities increase voter turnout? Evidence from a UK-based partisan GOTV field experiment Joshua Townsley * Draft, August 2017. Keywords: Campaigns;
Full Title: Does Incarceration Reduce Voting? Evidence about the Political Consequences of Spending Time in Prison
 Full Title: Does Incarceration Reduce Voting? Evidence about the Political Consequences of Spending Time in Prison Short Title: Does Incarceration Reduce Voting? Alan S. Gerber Yale University, Professor
THE RATIONAL VOTER IN AN AGE OF RED AND BLUE STATES: THE EFFECT OF PERCEIVED CLOSENESS ON TURNOUT IN THE 2004 PRESIDENTIAL ELECTION
 THE RATIONAL VOTER IN AN AGE OF RED AND BLUE STATES: THE EFFECT OF PERCEIVED CLOSENESS ON TURNOUT IN THE 2004 PRESIDENTIAL ELECTION A Thesis submitted to the Graduate School of Arts and Sciences at Georgetown
This journal is published by the American Political Science Association. All rights reserved.
 Article: National Conditions, Strategic Politicians, and U.S. Congressional Elections: Using the Generic Vote to Forecast the 2006 House and Senate Elections Author: Alan I. Abramowitz Issue: October 2006
When Context Matters: Assessing Geographical Heterogeneity of Get-Out-The-Vote Treatment Effects Using a Population Based Field Experiment
 Polit Behav (2014) 36:77 97 DOI 10.1007/s11109-013-9226-4 ORIGINAL PAPER When Context Matters: Assessing Geographical Heterogeneity of Get-Out-The-Vote Treatment Effects Using a Population Based Field
Prof. Panu Poutvaara University of Munich and Ifo Institute for Economic Research
 Prof. Panu Poutvaara University of Munich and Ifo Institute for Economic Research Lectures, exam at the end Articles to read. In more technical articles, it suffices to read introduction and conclusion
Who influences the formation of political attitudes and decisions in young people? Evidence from the referendum on Scottish independence
 Who influences the formation of political attitudes and decisions in young people? Evidence from the referendum on Scottish independence 04.03.2014 d part - Think Tank for political participation Dr Jan
A Natural Experiment: Inadvertent Priming of Party Identification in a Split-Sample Survey
 Vol. 8, Issue 6, 2015 A Natural Experiment: Inadvertent Priming of Party Identification in a Split-Sample Survey Marc D. Weiner * * Institution: Rutgers, The State University of New Jersey Department:
Supporting Information Political Quid Pro Quo Agreements: An Experimental Study
 Supporting Information Political Quid Pro Quo Agreements: An Experimental Study Jens Großer Florida State University and IAS, Princeton Ernesto Reuben Columbia University and IZA Agnieszka Tymula New York
Report for the Associated Press: Illinois and Georgia Election Studies in November 2014
 Report for the Associated Press: Illinois and Georgia Election Studies in November 2014 Randall K. Thomas, Frances M. Barlas, Linda McPetrie, Annie Weber, Mansour Fahimi, & Robert Benford GfK Custom Research
Voter and non-voter survey report
 Voter and non-voter survey report Proposal prepared for: Colmar Brunton contact The Electoral Commission Ian Binnie Date: 27 February 2012 Level 1, 6-10 The Strand PO Box 33690 Takapuna 0740 Auckland.
1. A Republican edge in terms of self-described interest in the election. 2. Lower levels of self-described interest among younger and Latino
 2 Academics use political polling as a measure about the viability of survey research can it accurately predict the result of a national election? The answer continues to be yes. There is compelling evidence
This article appeared in a journal published by Elsevier. The attached copy is furnished to the author for internal non-commercial research and
 This article appeared in a journal published by Elsevier. The attached copy is furnished to the author for internal non-commercial research and education use, including for instruction at the authors institution
The Persuasive Effects of Direct Mail: A Regression Discontinuity Approach
 The Persuasive Effects of Direct Mail: A Regression Discontinuity Approach Alan Gerber, Daniel Kessler, and Marc Meredith* * Yale University and NBER; Graduate School of Business and Hoover Institution,
Job approval in North Carolina N=770 / +/-3.53%
 Elon University Poll of North Carolina residents April 5-9, 2013 Executive Summary and Demographic Crosstabs McCrory Obama Hagan Burr General Assembly Congress Job approval in North Carolina N=770 / +/-3.53%
Voter ID Pilot 2018 Public Opinion Survey Research. Prepared on behalf of: Bridget Williams, Alexandra Bogdan GfK Social and Strategic Research
 Voter ID Pilot 2018 Public Opinion Survey Research Prepared on behalf of: Prepared by: Issue: Bridget Williams, Alexandra Bogdan GfK Social and Strategic Research Final Date: 08 August 2018 Contents 1
ELITE AND MASS ATTITUDES ON HOW THE UK AND ITS PARTS ARE GOVERNED VOTING AT 16 WHAT NEXT? YEAR OLDS POLITICAL ATTITUDES AND CIVIC EDUCATION
 BRIEFING ELITE AND MASS ATTITUDES ON HOW THE UK AND ITS PARTS ARE GOVERNED VOTING AT 16 WHAT NEXT? 16-17 YEAR OLDS POLITICAL ATTITUDES AND CIVIC EDUCATION Jan Eichhorn, Daniel Kenealy, Richard Parry, Lindsay
Prepared by: Meghan Ogle, M.S.
 August 2016 BRIEFING REPORT Analysis of the Effect of First Time Secure Detention Stays due to Failure to Appear (FTA) in Florida Contact: Mark A. Greenwald, M.J.P.M. Office of Research & Data Integrity
Congruence in Political Parties
 Descriptive Representation of Women and Ideological Congruence in Political Parties Georgia Kernell Northwestern University gkernell@northwestern.edu June 15, 2011 Abstract This paper examines the relationship
THE FIELD POLL FOR ADVANCE PUBLICATION BY SUBSCRIBERS ONLY.
 THE FIELD POLL THE INDEPENDENT AND NON-PARTISAN SURVEY OF PUBLIC OPINION ESTABLISHED IN 1947 AS THE CALIFORNIA POLL BY MERVIN FIELD Field Research Corporation 601 California Street, Suite 900 San Francisco,
Rick Santorum has erased 7.91 point deficit to move into a statistical tie with Mitt Romney the night before voters go to the polls in Michigan.
 Rick Santorum has erased 7.91 point deficit to move into a statistical tie with Mitt Romney the night before voters go to the polls in Michigan. February 27, 2012 Contact: Eric Foster, Foster McCollum
Non-Voted Ballots and Discrimination in Florida
 Non-Voted Ballots and Discrimination in Florida John R. Lott, Jr. School of Law Yale University 127 Wall Street New Haven, CT 06511 (203) 432-2366 john.lott@yale.edu revised July 15, 2001 * This paper
Biases in Message Credibility and Voter Expectations EGAP Preregisration GATED until June 28, 2017 Summary.
 Biases in Message Credibility and Voter Expectations EGAP Preregisration GATED until June 28, 2017 Summary. Election polls in horserace coverage characterize a competitive information environment with
November 15-18, 2013 Open Government Survey
 November 15-18, 2013 Open Government Survey 1 Table of Contents EXECUTIVE SUMMARY... 3 TOPLINE... 6 DEMOGRAPHICS... 14 CROSS-TABULATIONS... 15 Trust: Federal Government... 15 Trust: State Government...
NBER WORKING PAPER SERIES THE PERSUASIVE EFFECTS OF DIRECT MAIL: A REGRESSION DISCONTINUITY APPROACH. Alan Gerber Daniel Kessler Marc Meredith
 NBER WORKING PAPER SERIES THE PERSUASIVE EFFECTS OF DIRECT MAIL: A REGRESSION DISCONTINUITY APPROACH Alan Gerber Daniel Kessler Marc Meredith Working Paper 14206 http://www.nber.org/papers/w14206 NATIONAL
Europeans support a proportional allocation of asylum seekers
 In the format provided by the authors and unedited. SUPPLEMENTARY INFORMATION VOLUME: 1 ARTICLE NUMBER: 0133 Europeans support a proportional allocation of asylum seekers Kirk Bansak, 1,2 Jens Hainmueller,
Chapter 6 Online Appendix. general these issues do not cause significant problems for our analysis in this chapter. One
 Chapter 6 Online Appendix Potential shortcomings of SF-ratio analysis Using SF-ratios to understand strategic behavior is not without potential problems, but in general these issues do not cause significant
Public Awareness and Attitudes about Redistricting Institutions
 Journal of Politics and Law; Vol. 6, No. 3; 2013 ISSN 1913-9047 E-ISSN 1913-9055 Published by Canadian Center of Science and Education Public Awareness and Attitudes about Redistricting Institutions Costas
Understanding Taiwan Independence and Its Policy Implications
 Understanding Taiwan Independence and Its Policy Implications January 30, 2004 Emerson M. S. Niou Department of Political Science Duke University niou@duke.edu 1. Introduction Ever since the establishment
Web Appendix for More a Molehill than a Mountain: The Effects of the Blanket Primary on Elected Officials Behavior in California
 Web Appendix for More a Molehill than a Mountain: The Effects of the Blanket Primary on Elected Officials Behavior in California Will Bullock Joshua D. Clinton December 15, 2010 Graduate Student, Princeton
The Case of the Disappearing Bias: A 2014 Update to the Gerrymandering or Geography Debate
 The Case of the Disappearing Bias: A 2014 Update to the Gerrymandering or Geography Debate Nicholas Goedert Lafayette College goedertn@lafayette.edu November, 2015 ABSTRACT: This note observes that the
Capturing the Effects of Public Opinion Polls on Voter Support in the NY 25th Congressional Election
 Rochester Institute of Technology RIT Scholar Works Theses Thesis/Dissertation Collections 12-23-2014 Capturing the Effects of Public Opinion Polls on Voter Support in the NY 25th Congressional Election
*The Political Economy of School Choice: Randomized School Admissions and Voter Participation
 Yale University Department of Economics Yale Working Papers on Economic Applications and Policy Yale University P.O. Box 208268 New Haven, CT 06520-8268 DISCUSSION PAPER NO. 11 *The Political Economy of
Political Economics II Spring Lectures 4-5 Part II Partisan Politics and Political Agency. Torsten Persson, IIES
 Lectures 4-5_190213.pdf Political Economics II Spring 2019 Lectures 4-5 Part II Partisan Politics and Political Agency Torsten Persson, IIES 1 Introduction: Partisan Politics Aims continue exploring policy
Elections Alberta Survey of Voters and Non-Voters
 Elections Alberta Survey of Voters and Non-Voters RESEARCH REPORT July 17, 2008 460, 10055 106 St, Edmonton, Alberta T5J 2Y2 Tel: 780.423.0708 Fax: 780.425.0400 www.legermarketing.com 1 SUMMARY AND CONCLUSIONS
Changes in Party Identification among U.S. Adult Catholics in CARA Polls, % 48% 39% 41% 38% 30% 37% 31%
 The Center for Applied Research in the Apostolate Georgetown University June 20, 2008 Election 08 Forecast: Democrats Have Edge among U.S. Catholics The Catholic electorate will include more than 47 million
A Cost Benefit Analysis of Voting
 MPRA Munich Personal RePEc Archive A Cost Benefit Analysis of Voting Richard Cebula and Richard McGrath and Chris Paul Jacksonville University, Armstrong Atlantic State University, Georgia Southern University
VoteCastr methodology
 VoteCastr methodology Introduction Going into Election Day, we will have a fairly good idea of which candidate would win each state if everyone voted. However, not everyone votes. The levels of enthusiasm
Electoral Studies 32 (2013) Contents lists available at SciVerse ScienceDirect. Electoral Studies
 Contents lists available at SciVerse ScienceDirect. Electoral Studies") Electoral Studies 32 (2013) 113 123 Contents lists available at SciVerse ScienceDirect Electoral Studies journal homepage: www.elsevier.com/locate/electstud Do impersonal mobilisation methods work? Evidence
Electoral Studies 32 (2013) 113 123 Contents lists available at SciVerse ScienceDirect Electoral Studies journal homepage: www.elsevier.com/locate/electstud Do impersonal mobilisation methods work? Evidence
ALABAMA: TURNOUT BIG QUESTION IN SENATE RACE
 Please attribute this information to: Monmouth University Poll West Long Branch, NJ 07764 www.monmouth.edu/polling Follow on Twitter: @MonmouthPoll Released: Monday, 11, Contact: PATRICK MURRAY 732-979-6769
THE PUBLIC AND THE CRITICAL ISSUES BEFORE CONGRESS IN THE SUMMER AND FALL OF 2017
 THE PUBLIC AND THE CRITICAL ISSUES BEFORE CONGRESS IN THE SUMMER AND FALL OF 2017 July 2017 1 INTRODUCTION At the time this poll s results are being released, the Congress is engaged in a number of debates
Previous research finds that House majority members and members in the president s party garner
 American Political Science Review Vol. 109, No. 1 February 2015 doi:10.1017/s000305541400063x c American Political Science Association 2015 Partisanship and the Allocation of Federal Spending: Do Same-Party
Colorado 2014: Comparisons of Predicted and Actual Turnout
 Colorado 2014: Comparisons of Predicted and Actual Turnout Date 2017-08-28 Project name Colorado 2014 Voter File Analysis Prepared for Washington Monthly and Project Partners Prepared by Pantheon Analytics
Information and Wasted Votes: A Study of U.S. Primary Elections
 Quarterly Journal of Political Science, 2015, 10: 433 459 Information and Wasted Votes: A Study of U.S. Primary Elections Andrew B. Hall 1 and James M. Snyder, Jr. 2 1 Department of Political Science,
PENNSYLVANIA: SMALL LEAD FOR SACCONE IN CD18
 Please attribute this information to: Monmouth University Poll West Long Branch, NJ 07764 www.monmouth.edu/polling Follow on Twitter: @MonmouthPoll Released: Thursday, 15, Contact: PATRICK MURRAY 732-979-6769
These are the findings from the latest statewide Field Poll completed among 1,003 registered voters in early January.
 THE FIELD POLL THE INDEPENDENT AND NON-PARTISAN SURVEY OF PUBLIC OPINION ESTABLISHED IN 1947 AS THE CALIFORNIA POLL BY MERVIN FIELD Field Research Corporation 601 California Street, Suite 210 San Francisco,
Release #2475 Release Date: Wednesday, July 2, 2014 WHILE CALIFORNIANS ARE DISSATISFIED
 THE FIELD POLL THE INDEPENDENT AND NON-PARTISAN SURVEY OF PUBLIC OPINION ESTABLISHED IN 1947 AS THE CALIFORNIA POLL BY MERVIN FIELD Field Research Corporation 601 California Street, Suite 210 San Francisco,
1 of 5 12/13/ :59 PM
 Make This My Home Page Search Advanced Search PRINT EDITION In This Issue Welcome MARK WATTS, Logout Subscriber Info Change Your Profile ---- Print Edition --- Features Inside Politics Home > Consultants'
Who says elections in Ghana are free and fair?
 Who says elections in Ghana are free and fair? By Sharon Parku Afrobarometer Policy Paper No. 15 November 2014 Introduction Since 2000, elections in Ghana have been lauded by observers both internally
Benefit levels and US immigrants welfare receipts
 1 Benefit levels and US immigrants welfare receipts 1970 1990 by Joakim Ruist Department of Economics University of Gothenburg Box 640 40530 Gothenburg, Sweden joakim.ruist@economics.gu.se telephone: +46
Telephone Survey. Contents *
 Telephone Survey Contents * Tables... 2 Figures... 2 Introduction... 4 Survey Questionnaire... 4 Sampling Methods... 5 Study Population... 5 Sample Size... 6 Survey Procedures... 6 Data Analysis Method...
Working Paper: The Effect of Electronic Voting Machines on Change in Support for Bush in the 2004 Florida Elections
 Working Paper: The Effect of Electronic Voting Machines on Change in Support for Bush in the 2004 Florida Elections Michael Hout, Laura Mangels, Jennifer Carlson, Rachel Best With the assistance of the
Text Messages as Mobilization Tools: The Conditional Effect of Habitual Voting and Election Salience
 Text Messages as Mobilization Tools: The Conditional Effect of Habitual Voting and Election Salience The Harvard community has made this article openly available. Please share how this access benefits