The Fiscal Costs of the U.S. Refugee Admissions Program at the Federal, State, and Local Levels, from
|
|
|
- Phillip McBride
- 5 years ago
- Views:
Transcription
1 The Fiscal Costs of the U.S. Refugee Admissions Program at the Federal, State, and Local Levels, from July 29,
2 Contents I. Introduction 4 II. Background 4 III. Approach 6 IV. Limitations 12 V. Program and Service Expenditures and Sources of Revenue 13 VI. Refugee Demographics 18 VII. Fiscal Impact of Refugees 24 VIII. Differences in Fiscal Impact by Years of U.S. Residency, Education, and Age 30 IV. Comparison to US Population 33 X. Comparability to Other Estimates 36 XI. Conclusion 37 Appendix A. Details and Methods for Expenditures and Revenue Items in this Report 39 Appendix B. Supplemental Tables 49 2
3 Tables and Figures Table 1. Top 10 Countries of Origin for Refugees, Asylees, and Cuban/Haitian Entrants 8 Table 2. Expenditure Items 14 Table 3. Revenue Items 18 Table 4. Countries of Origin for Refugees by Length of U.S. Residency and Size of Population, Table 5. Refugee Population Characteristics by Years of U.S. Residency, Table 6. Participation in Social Programs, Public Education and Refundable Tax Credits for Refugees and Persons in Refugee Families, Table 7. Expenditures for Refugees, Table 8. Expenditures for Refugees, by Program, Table 9. Revenues from Refugees, by Source, Table 9. Expenditures and Revenues for Refugees, and Refugees and Families, Table 10. Fiscal Expenditures and Revenues of Refugees, by Year 30 Figure 1. Annual Per Capita Net Fiscal Impact Amount by Number of Years Post Resettlement in the U.S., Figure 2. Total Net Fiscal Impact for Refugees by Age, Figure 5. Annual Per Capita Net Fiscal Impact Per Capita by Education Level, Table 11. Annual Per Capita Fiscal Impact for Refugees and General U.S. Population, by Years 34 Table 12. Annual Per Capita Expenditures and Revenues for Refugees and U.S. Population excluding cost and taxes for Social Security and Medicare, Table 13. Annual Per Capita Expenditures for Refugees and U.S. Population, by Program, 2005 to Table 15. Revenue to Expenditure Ratio for First Generation Immigrants and Refugees 36 3
4 I. Introduction President Trump issued a memorandum on March 6th to the Secretary of State, the Attorney General, and the Secretary of Homeland Security with the subject Implementing Immediate Heightened Screening and Vetting of Applications for Visas and Other Immigration Benefits, Ensuring Enforcement of All Laws for Entry into the United States, and Increasing Transparency among Departments and Agencies of the Federal Government and for the American People. Section 4(b) of the memorandum states: To further ensure transparency for the American people regarding the efficiency and effectiveness of our immigration programs in serving the national interest, the Secretary of State, in consultation with the Secretary of Health and Human Services, the Secretary of Homeland Security, and the Director of the Office of Management and Budget, shall, within 180 days of the date of this memorandum, submit to me a report detailing the estimated long term costs of the United States Refugee Admissions Program at the Federal, State, and local levels, along with recommendations about how to curtail those costs. In response to this request, the Office of the Assistant Secretary for Planning and Evaluation in the Department of Health and Human Services conducted an analysis of the fiscal impact of refugees to federal, state, and local governments. This report describes the study methods and results. It will be part of a larger report authored by the Department of State, and will go through Departmental clearance at the Departments of State, Health and Human Services, and Homeland Security, as well as the Office of Management and Budget. II. Background This report uses the term refugee to refer to all individuals who arrived in the United States with refugee status, all individuals who received asylum, Cuban/Haitian Entrants, Victims of 1 Trafficking and certain Special Immigrant Visa holders, regardless of subsequent adjustment to the status of lawful permanent resident or U.S. citizen. For the purposes of this report, all these types of entrants are referred to as refugees. In general the groups included are eligible for the same public benefits and programs. The data and methods used do not permit distinguishing between the groups with confidence. Though the fiscal cost of immigrants has been studied extensively by economists and most 2 recently by the National Academies of Science in 1997 and 2016, there is limited research on 1 Describe what SIV are. 2 National Research Council, The New Americans: Economic, Demographic, and Fiscal Effects of Immigration, (Washington, DC: The National Academies Press, 1997), and National Academies of 4
5 the economic impact or fiscal costs of refugees to the United States. To date, no study of the national fiscal impact of refugees has been undertaken. A recent brief examined refugees participation in social welfare programs using the Annual Survey of Refugees for relatively new arrivals from Middle Eastern countries. The analysis by the Center for Immigration Studies found that each refugee from the Middle East required $64,400 in combined in health, social 3 welfare and education spending over five years. However the input data focused on the costliest resettlement period and did not account for taxes paid nor or future earnings. Two recent studies explored the economic integration of refugees at the national level. Capps et al. issued a report from the Migration Policy Institute based on five years of pooled data from the American Community Survey (ACS), and explored English language proficiency, educational 4 attainment, income, employment, and public benefits receipt. They found that many refugees arrive with low education levels and English language proficiency but that refugee employment rates are generally on par with the U.S. born population and that income levels increase over time. Their analysis also found that although refugee participation in public benefit programs declines with time in the U.S., they remain slightly more dependent on public benefits than U.S. born individuals 20 years after resettlement. Using a similar approach to Capps et al, a National Bureau of Economic Research working paper by Evans and Fitzgerald identified economic and 5 social outcomes of refugees. They found that refugees entering the U.S. before age 14 graduated high school and entered college at the same rate as natives, while refugees entering as older teenagers had lower educational attainment than natives. Refugees entering as working age adults were found to initially have low levels of employment, high benefits usage, and low earnings. As refugees spent more time in the U.S. their outcomes improved, with higher employment rates than natives, but earnings did not reach the levels of natives. While these studies rely on nationally representative surveys, a known shortcoming of these surveys is that they generally undercount of public benefits receipt (Pascale et al., 2009; Klerman et al, 2005; Wheaton and Giannarelli, 2000). One study found that the Current Population Survey similar in design to the ACS used by the aforementioned studies underreported overall Medicaid recipiency by more than one third (Pascale et al, 2009). Relying on household surveys without adjusting the receipt of public benefits for underreporting inevitably underestimates the fiscal costs associated with refugees. Several studies have examined the economic impact and outcomes of refugees at the local level. A 2012 study examined the economic impact of refugees in the Cleveland area in Ohio, and found that the total economic impact was estimated to be $48 million and the creation of 650 Sciences, Engineering, and Medicine, The Economic and Fiscal Consequences of Immigration, (Washington, DC: The National Academies Press, 2016), 3 Steven A. Camarota and Karen Zeigler, The High Cost of Resettling Middle Eastern Refugees, (Washington, DC: Center for Immigration Studies, 2015), Cost Resettling Middle Eastern Refugees 4 Capps et al., The Integration Outcomes of U.S. Refugees: Successes and Challenges, (Washington, DC: The Migration Policy Institute, 2015), migrationpolicy.org/research/integration outcomes us refugees successes and challenges. 5 William N. Evans and Daniel Fitzgerald, The Economic and Social Outcomes of Refugees in the United States: Evidence from the ACS (NBER Working Paper No , National Bureau of Economic Research, Cambridge, MA, 2017), 5
6 jobs (Chimura, 2012). A similar analysis was conducted in the area around Columbus, Ohio, in 2015, which found that the 16,596 refugees in the area supported 21,273 jobs and contributed $1.6 billion to the local economy (Community Research Partners, 2015). Another study focused on refugee integration in Colorado over a five year period, and among other findings noted that employment rates among refugees rose from 17 percent in their first year, to 63.5 percent in their third year (Quality Evaluation Designs, 2016). III. Approach General Approach This study focuses on the fiscal costs of refugees to the federal, state, and local governments over the ten year period from 2005 to 2014, the most recent years for which data are available. Data limitations precluded analyses over a longer time period. This study includes all refugees arriving in the U.S. since 1980, regardless of their current immigration status. Individuals arriving before 1980 were not identifiable in available data. The data capture refugees at all ages and life stages childhood, young working age, middle aged and retirement years. This study follows an approach used by the National Academies of Science to analyze the fiscal impact of immigrants in a 2017 report, The Economic and Fiscal Consequences of Immigration (Chapters 7 9) with some modifications given the nature of the population under study. The National Academies of Science report points out two broad methodological approaches to assess the fiscal impact of refugees at the federal, state, and local levels using existing national level data. The first approach is dynamic and focuses on compounded costs for different age groups over multiple periods for the purpose of projecting future costs and benefits. The second approach is static and measures actual fiscal costs and impacts over a specified time frame, i.e. a particular ten year period. For the current study, data requirements and limitations necessitated the static approach. The current report broadly adheres to the methods outlined by the National Academies with respect to consideration of costs to government, including the full spectrum of national programs as well as other costs such as the costs of criminal justice and education. It also includes government revenues generated directly by refugees. The study followed the estimation methods used by the National Academies of Science study to the extent feasible. Specific methods differ from those used by the National Academies in several important ways. For the immigrant population, long term impacts are often examined and compared across generations. However, the static approach of the current study means assessing adults and minor children without capturing costs or contributions of adult offspring. The immigrant population is larger than the refugee population and much better represented in nationally representative surveys such that estimates for the former group are more precise. In addition, the research literature on the economic and fiscal effects of immigrants is more detailed than the research on refugees. In some cases, estimates for refugees were based on the research on other immigrant groups, but in other cases such assumptions were not well founded. As a result, some of the expenditures and revenues that could be estimated for immigrants could not be reliably estimated for refugees. 6
7 Important differences divide the population of foreign born with the smaller group of U.S. refugees. Refugees did not choose or plan to immigrate as much as flee harsh or dangerous conditions in their homelands. As a result, refugees may be more isolated in their assigned communities compared with immigrants who sought to join family members or to pursue economic opportunity in the United States. The refugee population is entitled to a range of social welfare benefits upon arrival, while new immigrants are not eligible for any benefit except emergency medical care prior to a five year waiting period required of new arrivals since the Welfare Reform Act of With respect to the costs of criminal justice, more than half of convictions among the foreign born are for visa or immigrant status violations ( Citation ). These offenses are not a risk for the refugees who adjudicate to long tern permanent residents or most often U.S. citizens. In defining fiscal impact, both the economic literature and subject matter experts consulted for the current study advised that capturing government outlays in the absence of related revenues would present an incomplete picture. This is specifically the case when measuring long term costs, which prompt consideration of returns on investment. To measure the actual fiscal costs of refugees over the long term, it is necessary to examine both government outlays paid on behalf of refugees and the fiscal contributions returned to government by the same population. Each individual in the country is the beneficiary of direct and indirect government outlays, such as expenditures for public schooling, national and local parks, and services for public safety and national security. Individuals are a fiscal burden if their contributions to government through taxes and fees do not offset these outlays. This analysis presents refugees direct fiscal costs to federal, state, and local governments and concludes with a presentation of direct costs compared with the tax payments generated by the refugee population. Economic factors particularly employment opportunities and the U.S. policy landscape have a strong influence on how quickly refugees establish themselves and attain self sufficiency. For example, refugees who arrived during the recession from 2008 to 2009 faced more challenging employment prospects than those arriving just a few years earlier. The macroeconomic and policy environment shifted dramatically over the study period, including a period of relative prosperity and economic recession, as well as different levels of government support for social programs. Gross domestic product averaged a 2.6 percent annual growth from 2005 through 2007, declined in 2008 and 2009 during the economic recession, and rose back up to 2 percent annual growth on average from 2010 through The unemployment rate was steady at about 5 to 6 percent until it increased to 8 percent early in 2009 and reached 10.0 percent by year s end. At the same time, federal outlays for benefits programs such as SNAP increased as a result of coordinated federal and state efforts to reach households eligible for nutrition assistance. The period selected for the current study is inclusive of diverse economic and policy environments and as such allows a more balanced and comprehensive perspective on the fiscal burden of refugees. The ten year study period also allows for a range of geopolitical events which determine refugees origin countries, which also has important consequences for the fiscal impact of refugees and their economic outcomes. Refugees from different countries are likely 7
8 systematically more or less employable due to prior educational attainment, quality of employment experience, English language proficiency, cultural norms, and other factors. Table 1 lists source countries for the largest number of refugees, asylees, and Cuban/Haitian entrants from 2006 through An X indicates the country was one of the ten largest sources of entrants for the given year. While some countries appear consistently, such as China, Iran, and Somalia, others are less consistent, reflecting shifting trends in entrants. For example, Colombia and Ethiopia were in the top ten for earlier years, but in later years do not appear. The Democratic Republic of Congo became prominent beginning in 2010 while Egypt was more prominent from 2012 to Table 1. Top 10 Countries of Origin for Refugees, Asylees, and Cuban/Haitian Entrants Country Bhutan X X X X X X X X Burma X X X X X X X X X Burundi X X China X X X X X X X X X X Colombia X X X Cuba X X X X X X X X X Dem. Rep. Congo X X X X X Egypt X X X El Salvador Salvador Eritrea X X X X X Ethiopia X X X X Guatemala Haiti X X Iran X X X X X X X X X X Iraq X X X X X X X X X Liberia X Russia X X Somalia X X X X X X X X X X Sudan Syria Ukraine Venezuela X Vietnam X X Source: Department of Homeland Security s 2015 Yearbook of Immigration Statistics, Table 17. X X X X X In addition to the calculation of costs for refugees alone, this report estimates costs for nuclear family members of refugees who are not refugees themselves. The nuclear family includes children under 18 born in the United States, and non refugee spouses. In an average year from , there were 2.9 million (mostly former) refugees in the U.S., while there were 4.5 million refugees and their family members. Most of the family members included in the analysis 8
9 are children born in the United States. Throughout this report, analyses that include non refugee spouses and children refer to this group as refugees and their families. This report does not consider second order economic effects as a result of refugees entrance into the labor market. The participation of refugees in the U.S. labor force may effect employment and wage levels among non refugee populations. Such an analysis would have implications for an accounting of the costs associated with the refugee population. However, due to limited data and extant research this type of analysis would require broad assumptions that may be unfounded. Given that refugees make up less than one percent of the total U.S. population, the probability is low that effects on non refugee earnings or other measurable fiscal consequences would be observed at the national level. There may be important costs in local areas where refugees make up a more substantial proportion of the population. Such an analysis is beyond the scope of this study. The study also does not consider the effect of refugee financial remittances to their home country. Data Data for the current study are primarily based on person and family observations from the 6 Current Population Survey s Annual Social and Economic Supplement (CPS ASEC). The survey is nationally representative of U.S. household residents and samples about 90,000 households each year. Because refugees made up less than 1 percent of the U.S. population in recent years, the number of sampled cases derived from the CPS ASEC was modest. As a result the level of detail that could be analyzed and presented for refugees was limited. The current study identified 3,029 cases of refugees who lived in the U.S. for 0 up to 4 years, 3,247 cases of refugees who lived in the U.S. for 5 to 9 years, and 12,040 cases of refugees who lived in the U.S. for 10 or more years. The current study relied on a total of 18,316 unweighted, person level observations collected from 2005 through 2014 representing 2,888,711 refugees over the period. As described previously, nationally representative surveys such as the CPS often undercount receipt of public benefits. To correct for this underreporting, this report uses the Transfer income Model, version 3 (TRIM3) to generate most cost estimates and taxes paid. TRIM3 is a microsimulation model that augments the CPS ASEC with tax data and administrative records. It is a comprehensive model that estimates program eligibility, program participation, and outlays for major human services, health, tax, and transfer programs. The model also produces national economic indicators such as labor force participation, marginal tax rates, earnings, and employment levels. TRIM3 enhances the accuracy of the survey data with a statistical match from IRS tax and income data and administrative records from government programs. In this way the model corrects for the undercount of participation in government programs typical of household surveys. The microsimulation model incorporates program regulations and tax rules for each state for the purpose of accurately modeling social program eligibility and levels of enrollment. 6 Data from the Current Population Survey s Annual Social and Economic Supplement file are published annually in the Current Population Reports P 20 and P 60 series. These reports are available from the Superintendent of Documents, U.S. Government Printing Office, Washington, DC They also are available on line at < html >. 9
10 To capture long term costs results were estimated separately by educational attainment, specific years ( , , ) and by years of U.S. residency (0 to 4 years, 5 to 10 years, more than 10 years). Results could not be estimated for other demographic characteristics, such as country of origin, nor for more narrowly defined years of U.S. residency, due to limitations in the sample size of the CPS. For example, the data includes 276 observations for persons from Nicaragua but only two of these were recent arrivals. That is, nearly all refugees from Nicaragua arrived in the U.S. in the 1990s or earlier. By not dividing the cases by country of origin, the two person observations representing from Nicaraguan origin can be combined with other new arrivals and contribute to the study. If all observations were broken out by country of origin, a number of cases would be thrown out and wasted, including all from Syria (n=28), Ghana (n=8) and Guatemala (n=7). Observations from these three countries are too few in number to yield an average estimate for their group and certainly too few to be broken out by level of education. Instead the current study retains observations from each country regardless of number and combines these cases with other by length of residency. Refugee status for the current study was not identified in the survey data but assigned based on respondents nativity, year of entry into the United States and country of origin. A method for identifying refugees was applied as described below but there are limitations to the approach. The current study uses cases that cannot individually be definitively identified as refugees; however, the researchers were confident that in the aggregate the sample was representative of the refugee population in the United States. The CPS ASEC does not ask directly about immigration, asylee, or refugee status. Refugee status was imputed for foreign born persons if their country of origin and year of entry into the United States taken together matched the time and place from which a majority of entrants were asylees or refugees. As such, the method used does not distinguish between asylum seekers and refugees. The observations resulting from this method were then compared to demographic estimates of the number of refugees and asylees residing in the United States. Data for 2013 and 2014 also took into consideration reported receipt of public benefits. Lastly, refugee status was assigned only for foreign born persons who entered the United States since Persons entering the U.S. prior to 1980 were not identifiable in the data. For expenditures not included in TRIM3, data were pulled from administrative records and budgetary documents for the relevant federal agencies. Assumptions were made about the proportion of program costs that can be attributed to refugees based on extant research on refugee participation in programs. Where research was not available on refugees specifically, research on the foreign born population in general were used, with some modifications deemed appropriate. Other data sources were considered for the study, including the American Community Survey (ACS) and the Annual Survey of Refugees. The ACS provides a larger sample, which would permit a more detailed look by demographic category, and other researchers have used the ACS to study the refugee population. The ACS does not cover the same number of years as the CPS, which would limit the time period under study. More importantly, the TRIM model has not been implemented with the ACS. The Annual Survey of Refugees, a survey administered by the HHS 10
11 Office of Refugee Resettlement, has been conducted annually for several decades. It focuses on refugees arriving in the most recent five fiscal years. That limitation would not permit understanding longer term costs of refugees. As part of preparing this analysis, both of these data sources were consulted to corroborate findings. More details on the data and methodological decisions specific to each expenditure and revenue source can be found in Appendix A. Methods This section provides an overview of the methods used in this report, and more details can be found in Appendix A. Total fiscal expenditures are reported to assess the overall fiscal impact of the refugee population. In addition, per capita expenditures, revenues, and net fiscal impacts are reported to permit appropriate comparisons across groups of refugees and with the general U.S. population. All estimates are reported in 2014 dollars using the Consumer Price Index for All Urban Consumers (CPI U). Intergovernmental transfers between federal, state, and local governments were excluded from the current analysis to avoid the double counting of outlays. Additionally, state or local public benefits programs unique to specific jurisdictions were not included, as data at the national level are not available for these programs. Estimating fiscal impacts at the federal, state, and local levels required the identification of each program and the proportion of its outlays attributed to each level of government. Many programs are solely paid for by a specific level of government; for example Social Security benefits are paid for exclusively by the federal government. Expenditures for TANF, Medicaid, Child Care Subsidies, the National School Lunch Program, K 12 public education, and the criminal justice system were a mix of federal, state, and local funding streams. Data were not sufficiently granular or explicit to allow the separation of state and local expenditures. The proportion of outlays from federal compared with state or local governments was more clearly defined and obtained from administrative records and budgetary documents. Expenditure data for programs particular to refugees and funded by the Office of Refugee Resettlement (ORR), the U.S. Department of State, or the U.S. Department of Homeland Security were collected from budgetary documents. For some expenditures such as costs related to the criminal justice system, data for refugee participation levels was not available. In the current analysis, costs were limited to courts and correctional institutions. To estimate the level of refugee involvement with the criminal justice system, refugee conviction rates were assumed to be comparable to those of the foreign born population, a conservative approach given that about one half of the refugees identified in current study were U.S. citizens and naturalized citizens have lower offending rates than the foreign born population overall. This approach was used to estimate the proportion of national criminal justice expenditures associated with refugees. Police protection, as noted above, was considered a public good and therefore excluded from the analysis. It is possible that the presence of refugees in a local community changes the degree of police enforcement, but no data are available on this, and given the size of the refugee population at the national level these costs are not likely substantial. 11
12 The largest costs estimated in the current study were related to health insurance. The survey data and TRIM3 provided estimates for Medicare and Medicaid enrollment. Enrollment in the CHIP program was understood to be unreliably reported in the Current Population Survey. For this reason the small number of CHIP cases identified in the survey and the costs associated with CHIP were combined with expenditures for Medicaid. Costs estimates for Medicare and Medicaid were derived from national estimates provided by the Centers for Medicaid and Medicare Services (CMS) based on age group. Disability status was not taken into account for these average national costs. For refugees who were uninsured, the current analysis estimated the size of the uninsured refugee population and the burden this population placed on hospitals and health centers. Refugees were assumed to be more like the foreign born than the US born, though due to higher eligibility and participation in Medicaid, refugee uninsured rates were calculated as the average of rates for the foreign born and naturalized citizens. Details on how these costs were estimated can be found in Appendix A. Education costs were introduced as the national average cost per public school pupil from kindergarten through high school. The average cost of a public education was applied to school age refugees as a component of refugee only estimates. To estimate costs, for refugees and their families, education expenditures were applied to school age refugees and all children of refugees from ages 5 through 17. IV. Limitations This study s approach has several important limitations, some of which have been mentioned previously. First, it does not account for the lifetime fiscal costs of refugees due to the limitations of cross sectional data. Fiscal costs and benefits change dramatically over the life course of an individual. Typically when individuals are of school age they are a greater cost to society, as they consume public schooling but do not contribute revenues through taxes. As working age adults, most individuals are a fiscal benefit, contributing more through taxes than they consume in program outlays. As individuals reach retirement age they are typically more costly, using programs such as Medicare and Social Security while contributing little through taxes as they are no longer working. To identify lifetime costs and benefits, one would need to track the same refugees over time or track a representative group of refugees reflecting the same arrival cohort. Longitudinal data on refugees of stretching over decades does not exist, and data for the current study are too sparse to permit the construction synthetic cohorts. An alternative approach would be to approximate a refugee s life course by grouping refugees by age and length of time in the United States. This is the approach taken by Capps et al (2015) and Evans and Fitzgerald (2017). The approach assumes that refugees differ only by length of time in the country, and that they do not differ substantially based on degree of human capital, ability to integrate into the U.S., or the macroeconomic and policy context encountered at the time of arrival. The current study does make these assumptions. 12
13 A second limitation is that this study focuses on a particular ten year period, which has its own unique demographic, economic, and geopolitical characteristics. The characteristics of the decade under study may not be comparable to previous or future decades. The conditions refugees face at arrival, that is, prevailing economic conditions and policy environments can change dramatically in a few years. New federal policy affects the flow of arriving refugees, but may not affect the existing stock of refugees. The generalizability of the results presented in the current report depends in part upon the relative size of a new flow of refugees compared with the existing stock of refugees. For example, 105,444 refugees and asylees were admitted in 2016, reflecting about 3.5 percent of the total stock of refugees and asylees in the country at the time. While these new arrivals may have different lifetime costs compared with those already in the country, the impact of new arrivals on the total cost of the refugee population over a ten year period is not likely to be substantial. An additional limitation is that this study focuses exclusively on refugees, and excludes the fiscal impact of refugee offspring in the U.S. While refugees can be identified with confidence in available data sources, we are unable to identify the adult offspring of refugees, impeding the ability to make a comprehensive empirical assessment of their long term fiscal costs and benefits. Research on U.S. immigrant populations identifies substantial economic gains from the first to the second generation (Citation). For example, the National Academies of Science (2017) found that for , on average first generation immigrants were a net cost to state and local governments ( $1,600 per first generation immigrant) while second and later generations were a net benefit ($1,700 per second generation immigrant). To the extent the adult offspring of refugees present a greater net benefit (or lower cost) than refugees themselves, the estimates presented in this report will overestimate the fiscal costs and underestimate the benefits of refugees. This study is unable to estimate the variance in the fiscal impact of refugees and how that impact differs by subgroups. The study reports total and per capita costs for refugees, and select subgroups as outlined above (years of residency and educational attainment). The fiscal impact of a specific refugee is likely to differ by key demographic characteristics, such as country of origin, age at entry, pre resettlement experiences such as trauma and violence, employment and educational history in the home country, and English proficiency. A study of greater depth and precision could address differences of quality and employment readiness among refugees at the time of their arrival and how this affects fiscal costs and benefits. Finally, this study does not include all expenditures and revenue sources related to refugees. While the most impactful programs and revenues are included, some federal, state, and local expenditures and revenue sources were excluded. These are discussed in more detail in Section E. V. Program and Service Expenditures and Sources of Revenue 13
14 This section outlines the costs associated with the largest social programs in the U.S. and the cost of narrower programs and services targeted to refugees. The programs and services used in this report are listed below in Table 2. Details on the methods for estimating expenditures and revenues can be found in Appendix A. Expenditures Table 2 categorizes the expenditures analyzed in this study. 14
15 Table 2. Expenditure Items Cost Social insurance bene its Social Security Social Security Disability Insurance (SSDI) Medicare Mainstream bene its Child Care Subsidies Health Centers Health, assistance to hospitals for the uninsured Housing Assistance Low Income Energy Assistance (LIHEAP) Medicaid National School Lunch Program Supplemental Nutrition Assistance Program (SNAP, formerly food stamps) Supplemental Security Income (SSI) Temporary Assistance for Needy Families (TANF) Women, Infants and Children (WIC), Special Supplemental Nutrition Assistance Refugee speci ic bene its Transitional Assistance and Medical Services Refugee Preventive Health Services Refugee Social Services Refugee Targeted Assistance Education and Criminal Justice K 12 public education Public funding for higher education Court and legal Costs Corrections Refugee speci ic programs Department of State, Bureau of Population, Refugees, and Migration Department of Homeland Security, U.S. Citizenship and Immigration Services Department of Health and Human Services, Of ice of Refugee Resettlement Refundable Tax Credits Federal Child Care Tax Credit (CTC) Federal Earned Income Tax Credit (EITC) State Earned Income Tax Credits Social insurance benefits include programs from which people receive benefits based on their individual contributions. In this report the social insurance benefit programs are Social Security, Social Security Disability Insurance, and Medicare. 15
16 Federal means tested benefits include benefits programs available to the general U.S. population, such as Temporary Assistance for Needy Families (TANF), Medicaid, and the Supplemental Nutrition Assistance Program (SNAP, formerly Food Stamps). Refugees are generally eligible for these programs. Under existing federal statutes, unlike other immigrant groups, refugees can receive federal means tested benefit programs immediately upon arrival in the U.S. as long as they meet the eligibility criteria (often set at a state level). Regulations about the eligibility of immigrants and refugees for benefits was largely established under the Personal Responsibility and Work Opportunity Reconciliation Act, (PRWORA, PL ) and the Illegal Immigration 7 Reform and Immigrant Responsibility Act (IIRIRA, PL ). PRWORA established two categories of immigrants: nonqualified immigrants: this includes unauthorized immigrants, as well as some lawfully present immigrants such as students and tourists; and qualified immigrants: this includes lawful permanent residents (LPRs), refugees, and other protected immigration statuses. Qualified immigrants arriving after the enactment of PRWORA in 1996 are generally not eligible for TANF, Medicaid, or SNAP for five years; however, refugees are exempt from this restriction and remain eligible upon arrival. Refugees are subject to the same program requirements that apply to other program recipients, such as TANF time limits and SNAP work requirements, which vary among states. Under SSI, qualified immigrants arriving after enactment of PRWORA are generally not eligible until they obtain U.S citizenship, but refugees are eligible for their first 7 years in the country and may remain eligible for an additional year if they have a pending naturalization application. Similar to means tested benefits, refundable tax credits target lower income taxpayers and are available to all taxpayers. These include the federal and state Earned Income Tax Credits, as well as the federal child care tax credit. Education expenditures include kindergarten through 12 th grade public schools, which are available to all children regardless of immigration status. Criminal justice expenditures include judicial and legal functions (i.e. prosecution, courts and public defense) and corrections. Refugee specific expenditures include operational costs for programs and services from ORR, the U.S. Department of State, and the U.S. Citizenship and Immigration Service (USCIS). USCIS incurs costs for processing visa applications and performing security screenings and background checks for applicants. Expenditures from the Department of State pay for the costs of processing of applicants overseas, performing health screenings, and for reception and placement services, which provide a one time cash payment to each refugee to assist with expenses during the first few months after arrival in the United States. 7 Several other federal statutes subsequently modified federal benefit eligibility rules for noncitizens, including: the Balanced Budget Act of 1997 ( PL ), the Agricultural Research, Extension and Education Reform Act of 1998 ( PL ), the Noncitizen Benefit Clarification and Other Technical Amendments Act of 1998 ( PL ), the Trafficking Victims Protection Act of 2000 ( PL ), the Food Stamp Reauthorization Act of 2002 ( PL ), the SSI Extension for Elderly and Disabled Refugees Act ( PL ), and the Children s Health Insurance Program Reauthorization Act of 2009 ( PL ). 16
17 ORR s provides four kinds of services to refugees which operate through the federal and state governments. Transitional and Medical Services are grants to states to provide services to refugees, and states use one of three models to administer the services: refugee cash and medical assistance, the Wilson/Fish program, and the Matching Grant program. Most states use Transitional and Medical Services funding to administer refugee cash assistance (RCA) and refugee medical assistance (RMA). RCA and RMA assist refugees who are not eligible for the mainstream programs listed above. The medical and cash benefits are terminated after eight months based on Congressional appropriation levels. A number of states assist refugees through the Wilson/Fish program, administered by private non profit organizations that receive grants to provide resettlement assistance. The Matching Grant program is a third alternative, targeted at helping refugees become economically self sufficient within 120 to 180 days. Self sufficiency must be achieved without accessing public cash assistance, and enrollment is available to all ORR eligible populations deemed employable (e.g., non elderly or disabled, not already self sufficient, and not in another ORR funded program ), but enrollment must occur within 31 days of becoming eligible to ensure adequate services are provided and self sufficiency is achieved and maintained within the period of eligibility. ORR Social Services funding provides assistance finding employment and integrating into life in the U.S., including case management, English language instruction, and job training. ORR also administers social services programs beyond the first eight months after arrival, including micro enterprise development, case management, and job training. These services help refugees acquire the skills and certification they need to enter, navigate and succeed in the American workforce, navigate U.S. society, connect with their neighbors and contribute to their new community. These services are available to refugees for their first five years in the U.S. ORR provides preventive health grants to state and local health departments to support coordination and promotion of refugee health. This includes providing new arrivals with health care access and an orientation to the U.S. health system. ORR also supports domestic health assessments within 90 days of entry into the U.S. for the purpose of identifying conditions that threaten the public health or impede self sufficiency. At the local level, the Targeted Assistance Program funds employment training and other services for refugees in counties with large refugee populations. The program supplements other county level to help the local refugees obtain employment within one year of participation in the program. Expenditures Not Included Some expenditure and revenue items were not estimated due to data limitations and their exclusion may underestimate costs and benefits to a certain degree. However, the impact of such omissions is likely to be negligible relative to the margins of error for such estimates. 17
18 K 12 education expenditures are likely to be higher for many refugee children based on their English proficiency. Based on the Annual Survey of Refugees, nearly 86 percent of refugees arriving in 2015 reported speaking English Not Well or Not At All. Education costs are higher for students with limited English proficiency (LEP), due to additional services provided, such as English as a Second Language classes or bilingual classes. This report does not account for these additional costs, as no nationally representative estimates were available for the additional costs for LEP students. The National Academies of Science study used an estimate from research published in 1994 for Florida. However, services for LEP students vary widely across states, and have changed since the 1990s. As a result that estimate is not likely to accurately reflect the additional costs for refugee students. Some social insurance programs were not estimated, such as insurance trust revenues and expenditures, which include unemployment insurance and workers compensation. Reliable estimates were not available for the excluded programs. However, for the current study the directional effect of this lack of data is known. Based on the 2014 Annual Survey of State and 8 Local Government Finance, across all states, insurance trust revenue exceeded expenditures by over $381 billion. That is, unless refugees differ substantially from the general population in their usage of insurance trust programs such as workers compensation, excluding such costs and benefits are likely to overestimate costs and underestimate benefits of refugees. Several public benefits programs were not included. For example, insurance subsidies available to low income individuals under the Affordable Care Act of 2010 were not estimated and are excluded from this analysis. For marketplace insurance subsidies, only 2014 data was available. IRS funded programs to support low income taxpayers, such as Low Income Tax Clinics and tax relief programs such as fee waivers and installment agreements. Smaller programs such as the Department of Energy s Weatherization Assistance Program were also excluded. The study does not include benefits programs unique to specific states and local governments, such as temporary disability insurance programs, cash assistance programs outside of the federal Temporary Assistance for Needy Families (TANF), or nutritional assistance programs apart from SNAP, Special Supplemental Nutrition Assistance for Women, Infants and Children (WIC), and the National School Lunch Program. The study also excludes revenue sources such as business permits and licenses, and some social insurance programs as described in more detail below. Other expenditures excluded include public goods, which include goods and services for which individuals cannot effectively be excluded from use and where the use by one individual theoretically does not impact use by another. Public goods would include services related to public safety and national security. In practice many public goods are in fact congestible, meaning there is a realistic limit to the number of users at a time, such as public parks and transportation. In addition, interest payments for national, state or local debt were excluded. Estimating the per person costs for these items is challenging one could take the average or per capita cost, or the marginal cost. For many of these items, such as national security, the marginal additional cost is typically zero. However, it may also be the case that the marginal cost is much higher than the average cost, as would be the case when a new park must be constructed due to
19 congestion. As the National Academies of Science (1997) pointed out, since public goods such as national defense represent a large part of the federal budget, the choice of how to allocate these expenditures will have a large impact on fiscal estimates. The National Academies estimates alternative scenarios to provide a range of costs. For the case of refugees, while in specific communities the addition of refugees could have significant costs for these items, given that refugees make up such a small portion of the total U.S. population it is not likely that they add substantially to these costs at the national level. The one exception could be national security, if refugees require additional monitoring by domestic agencies such as the FBI. It was not possible to estimate these costs from available budgetary information. Revenues Table 3 lists the revenue items included in the analysis. Four types of taxes were included: payroll, income, excise, and sales. Excluded from the current study were business taxes and the fees associated with licenses or permits, such as driver s licenses, business licenses, and park permits. For business taxes and fees, data on refugee business ownership and business taxes paid are not available at the national level. One study in Cleveland found that in 2012, refugee owned businesses contributed $437,939 in tax revenue to local and state governments, representing 17 percent of refugees state and local tax revenue in Cleveland. Unfortunately, different tax rates by state and county and potentially different business ownership patterns caution against extrapolating from this estimate. Table 3. Revenue Items Federal FICA payroll taxes Income taxes Excise taxes State/Local Income tax Property tax Sales tax VI. Refugee Demographics On average from 2005 through 2014, 2.9 million individuals living in the U.S., 0.9 percent of the total population, were at some point refugees. Within the refugee population two thirds (68 percent) lived in the U.S. for ten years or more. About 16 percent of the refugee population resided in the country for 5 to 9 years. Sixteen percent were relatively new arrivals, having been in the U.S. fewer than five years. Among these new arrivals, nearly one quarter were children under age 18. When looking at refugees along with their non refugee family members, of the 1.3 million children who had a refugee parent, 83 percent were U.S. born citizens. With respect to 19
20 income, poverty, and public benefits, refugee families were similar in levels and use to individual refugees. Refugees who lived in the U.S. in any year from 2005 through 2014 arrived from roughly 100 different countries. Most U.S. refugees, about 80 percent, arrived from one of twenty countries. Table 4 ranks countries of origin by the number of entrants and by years of U.S. residency. Refugees with longest U.S. residency were more likely to come from Vietnam, Laos, Cambodia, Russia, the Ukraine and Cuba. In recent years, refugees were more likely to arrive from Cuba and Haiti as well as North Africa and the Middle East. 20
21 Table 4. Countries of Origin for Refugees by Length of U.S. Residency and Size of Population, Rank Country of origin Total 0 4 yrs 5 9 yrs 10+ yrs Total 18,315 3,029 3,247 12,040 1 Vietnam 3, ,112 2 Cuba 2, ,698 3 Laos 1, Russia Ukraine Somalia Iraq Cambodia Bosnia & Herzegovina Iran Haiti Myanmar (Burma) Ethiopia Thailand Africa, not speci ied Columbia Sudan Nicaragua USSR Liberia Nepal Armenia Indonesia Romania Yugoslavia Eritrea Afghanistan Poland Moldova Bhutan Croatia Belarus Cameroon Serbia Kenya Sri Lanka Uzbekistan North Africa Azerbaijan Venezuela Macedonia Congo Kosovo Georgia Sierra Leone Germany
22 47 Hungary Bulgaria Egypt Syria
23 A summary of refugees demographic characteristics including age, gender, education, and income levels are discussed below and presented in Table 5. Although the data are presented by the number of years in U.S. residence, the source data did not observe the same individuals over time and should be interpreted with caution. Since 1980 refugees to the U.S. have tended to come from particular places during specific periods and this confounding of origin country with years of U.S. residence means the two elements are not meaningfully separated in the data. While the data presented in Table 5 is accurate, it may also be specific to the experiences of the individuals surveyed. Refugees were more likely than persons in the total U.S. population to be younger adults of working age. Among individual refugees, 81 percent were ages 18 to 64 years compared with 63 percent for the total U.S. population. More than one half (54%) of persons admitted to the U.S. as refugees since 1980 became citizens of the United States. In general, after 10 years of residence those who entered the U.S. as refugees were similar to the U.S. population in terms of income and employment. Poverty levels were high among new arrivals. Official poverty was 36 percent, affecting more than one in three refugees in residence for fewer than five years. The rate was lower for refugees with more years in the U.S. from 36.0 percent for new arrivals to 15.0 percent for those with 10 years or more of U.S. residency, the same as the official U.S. poverty rate from 2010 to Consistent with this trend, median family income was higher among refugees who spent more time in the U.S., such that, refugees with 10 or more years of residency had approximately the same level of income as the total U.S. population at each quintile. For example, median income was $59,400 for refugees with ten or more years of residency and $59,600 among all persons in the U.S. The difference of $200 amounts to less than the margin of error for the estimates. Employment trends were similar. Only 43 percent of relatively new arrivals were employed full time at the time of the survey, but the rate of full time employment was comparable with the U.S. population overall for those in the U.S. at least 5 years (58 percent compared with 57 percent). Education is one area in which levels of attainment were dissimilar compared with adults in the U.S. population overall. Compared with the U.S. population, more refugees had less than a high school education (20.3 percent) and about the same or a higher proportion of adults with bachelor s degrees (31.8 percent). Compared with new arrivals, refugees with 10 years of residency were more likely to complete high school (70 percent and 81 percent, respectively) and more likely to attain a bachelor s degree (28.0 percent and 32.0 percent respectively). As is the case with employment, levels of educational attainment are approximately the same whether considering individual refugees or both refugees and their spouses. 23
24 Table 5. Refugee Population Characteristics by Years of U.S. Residency, Refugees All persons, United States Number (in 1000s) Percent of Total Years of U.S. Residency 10 or more Total (percent) Total 2, Male 1, Female 1, Age Age Age , Age Health Insurance Medicare Medicaid/CHIP State CHIP Household family 1 person people people 1, people Education (ages 25+) less than H.S H.S. graduate 1, BA degree Employ (ages 25 64) Employed FT 1, Employed PT Not working Family Income <=100% poverty % 250% pov % 400% pov % poverty top value quintile 1 1 $21,471 $14,163 $22,359 $24,470 $24,575 top value quintile 2 1 $40,783 $25,676 $38,283 $46,810 $46,465 median 1 $52,541 $32,539 $47,489 $59,433 $59,595 top value quintile 3 1 $66,479 $41,250 $58,965 $75,189 $75,094 top value quintile 4 1 $108,330 $69,195 $92,413 $121,332 $119,374 Note: 1 Values are in constant 2014 dollars based in the CPI U for all urban consumers. Source: Current Population Survey s Annual Social and Economic Supplement and microsimulation model TRIM3,
25 Public Benefit Receipt Refugees differed from the U.S. population with respect to their use of public benefits programs. Table 6 reports participation in the major public benefit programs for refugees, refugees and their non refugee family members, and the general U.S. population. Refugees were less likely to access Social Security, SSDI benefits, and Medicare benefits than the general U.S. population. Eight percent of refugees received Social Security or SSDI benefits, compared to 15 percent of the U.S. population. Twelve percent of refugees received Medicare benefits, compared to 15 percent of the U.S. population. Social Security and Medicare are social insurance programs requiring contributions from beneficiaries through payroll taxes, whereas other benefit programs target low income individuals and families. A number refugee retirees may not have accumulated sufficient time in the U.S. workforce to be eligible for these social insurance benefits. Table 6. Participation in Social Programs, Public Education and Refundable Tax Credits for Refugees and Persons in Refugee Families, Refugees Refugees and Families U.S. Population Number Percen Number Percen Number Percent t t Total population 2,888, ,500, , Social Security and SSDI 234, , , TANF 65, , , SNAP 615, , , SSI 218, , , Housing assistance 218, , , LIHEAP 144, , , National School Lunch 163, , , Program WIC 37, , , Medicare 357, , , Medicaid or State CHIP 1 661, ,196, , Education (primary and H.S.) 197, , , EITC (refundable tax credit) 542, , , State taxes (refundable credit) 127, , , Child Tax Credit (refundable) 377, , , The data source does not reliably distinguish between Medicaid and State CHIP. Source: HHS ASPE estimates of Current Population Surveys and microsimulation model TRIM3, 2006 to Among the largest assistance programs, refugees were more likely to use SNAP and SSI. Over the study period, 21 percent of refugees compared with 15 percent of all U.S. residents received SNAP benefits some time during the year. Refugees were more than twice as likely to participate in SSI with 7.6 percent of refugees participating some time during the year compared with 2.6 percent enrolled for all U.S. residents. In part, SSI is targeted to retirees 25
26 ineligible for Social Security or whose Social Security benefits are too low to purchase necessities. Such circumstances are more likely among refugees who enter the county at retirement age or toward the end of their working years. TANF cash assistance benefited refugees at roughly the same rate (2.3 percent) as all persons in the U.S. Among refugee families TANF participation was 2.9 percent on average. Even though individual refugees and families had approximately the same rates of poverty, particularly prior to 10 years of residency, the higher rate of TANF participation for nuclear families compared with individuals aligns with TANF s goal of assistance to families. Consistent with their younger average age and lower levels of income at arrival, refugees and their families were more likely to use Medicaid (23 percent and 26 percent, respectively) compared with rate of Medicaid participation in among all persons in the U.S. (16 percent). VII. Fiscal Impact of Refugees Total Expenditures Over 10 Years From 2005 through 2014, government expenditures on refugees were an estimated $206.1 billion over the 10 year period, with an annual per refugee cost of $7, As shown in Table 7, expenditures from the federal government represented 74 percent of the total, at $153.4 billion. State and local government expenditures were 26 percent of the total, at $52.6 billion in expenditures from state and local governments. Table 7. Expenditures for Refugees, Refugees and Refugees Families Total $206,071 $326,432 Federal $153,446 $197,310 State/Local $52,626 $129,122 Values in millions, expressed in 2014 dollars. For refugees and their non refugee family spouses and children, expenditures totaled $326.4 billion, with an annual per capita cost of 7, Sixty percent of these expenditures were paid by the federal government, totaling $197.3 billion, and the remaining 40 percent were paid by state and local governments, totaling $129.1 billion. Expenditures for refugees and their families were higher than for refugees alone. The higher percentage of expenditures paid by state and local governments for refugees and their families is in large part due to higher K 12 education expenditures for non refugee children. The inclusion of refugee family members increases the number of children in the analysis, and programs with the greatest increases in cost are those that target children. Including refugee family members K 12 education increases expenditures by 26
27 $74.4 billion, and Medicaid/CHIP expenditures by $17.8 billion. Expenditures for child care subsidies, WIC, and the National School Lunch Program were higher by 200 percent for refugees and their spouses and children than when including refugees alone. Table 8 reports the fiscal expenditures on refugees, broken out by specific program. The largest expenditures on refuges were for Medicaid and Medicare, at $47.5 and $39.3 billion respectively. Medicaid represented 23 percent and Medicare represented 19 percent of total expenditures. These costs were consistent with trends in medical expenses which tended to be the largest drivers of federal and state non defense expenditures. Other high costs include Social Security and SSDI benefits ($26.5 billion), K 12 education ($23.3 billion), SSI ($16.6 billion), and the EITC ($11.6 billion). Programs specifically targeted to refugees through the HHS Office of Refugee Resettlement, including Refugee Cash Assistance and Refugee Medical Assistance, total $5.4 billion. Table 8. Expenditures for Refugees, by Program, Refugees Refugees and Families Medicaid $47,553.6 $65,337.8 Medicare $39,251.5 $45,810.9 Social Security and SSDI $26,487.3 $30,192.2 K 12 Education $23,311.8 $97,697.5 SSI $16,609.3 $18,433.3 EITC 1 $11,581.8 $13,357.3 Housing assistance $8,039.1 $10,002.9 SNAP $7,975.9 $12,008.7 Criminal Justice $6,299.3 $6,299.3 Child Tax Credit 1 $4,733.4 $5,753.2 ORR Transitional Assistance and Medical Services $3,244.8 $3,244.8 Department of State PRM $2,934.4 $2,934.4 DSH payments $2,919.5 $5,347.7 ORR Social Services $1,608.6 $1,608.6 TANF $993.1 $2,044.7 National School Lunch Program $579.1 $1,900.7 ORR Targeted Assistance $508.1 $508.1 State refundable tax credits 1 $496.7 $552.8 LIHEAP $219.9 $298.7 DHS USCIS $209.4 $209.4 Health Centers $185.5 $289.3 WIC $164.3 $1,394.7 Child Care Subsidies $113.4 $1,153.6 ORR Preventive Health $51.6 $
28 Public Higher Education TBD TBD Total $206,071 $326,432 Values reported in millions, and expressed in 2014 dollars. 1 includes only the refundable portion of tax credits. The non refundable portion is deducted out of taxes paid as reported in Table 9. Expenditures targeting refugees exclusively, including those from HHS ORR, DHS, and the State Department, totaled $8.6 billion over the 10 year period, representing 4.1 percent of the total expenditures on refugees. Expenditures on mainstream public benefits programs were $164.9 billion, representing 80 percent of all expenditures on refugees. Expenditures for Largest Programs Medicaid/CHIP Over the ten year period, the Medicaid and CHIP programs accounted for $47.5 billion, or 23 percent of total expenditures on refugees. From the periods to , Medicaid/CHIP costs increased by 47 percent and participation increased by 7 percentage points among refugees and their families, from 21 percent to 28 percent, and 3 percentage points among the overall U.S. population (from 14 percent to 17 percent). The largest increases in Medicaid participation occurred from to ; from the recession years in through , participation has been relatively stable at 25 percent for refugees and 28 percent for refugee families, compared with 17 percent for U.S. population. When adding in non refugee family members, Medicaid and CHIP costs increase the most of any item except for K 12 education. Expenditures on Medicaid and CHIP rose by $17.8 billion, in large part due to the addition of non refugee children that were eligible for these programs. Medicare Over the 2005 to 2014 period, Medicare accounted for $39.3 billion, or 19 percent of total expenditures on refugees. From through participation in Medicare increased from 10 percent to 15 percent among refugees alone and from 8 percent to 10 percent among refugees and their family members. Among the U.S. population, enrollment increased from 14 percent to 16 percent from through For refugee families, the total cost of Medicare increased by 66 percent from $3.4 billion annually in to $5.6 billion annually from The increase in Medicare costs in part reflects the upward trend in participation rates Annual per capita Medicare costs for refugees and their family members increased marginally from roughly $800 in to $1,100 in Annual per capita U.S. costs were slightly higher for the total population, but increased by the same amount ($1,400 in to $1750 in ). Social Security/SSDI Over the 2005 to 2014 period, Social Security and SSDI benefits accounted for $26.5 billion, or 13 percent of total expenditures on refugees. Refugees who received Social Security or SSDI benefits increased by 5 percentage points from 6 percent in to 11 percent over the period Refugee participation increased at a faster rate than that of the general US population, which increased by 2 percentage points over the ten year period, peaking at 16 28
29 percent most recently in Per capita annual benefits for refugees rose during the recessionary period (2008 to 2011) from $600 to $900 and increased again to $1,200 during the period 2012 to2014. Benefits for refugees alone totaled $10.6 billion annually during 2008 to 2011, which increased to $11.2 billion annually in 2012 to Per capita annual benefits for the general U.S. population averaged $2,100 to $2,200 during the years 2008 through K 12 Public Education Over the ten year period of the study, K 12 education costs accounted for $23.3 billion, or about 11 percent of expenditures for the refugee population. Expenditures on public education for refugees accounted 0.4 percent of public K 12 spending overall. Eighty one percent of refugees were working age adults, while 6 percent to 8 percent were enrolled in primary or secondary school from 2005 to The total cost of primary and secondary education for refugees was fairly consistent from , totaling around $2.2 to $2.4 billion annually, or about $800 per capita. By comparison the rate of K 12 school enrollment for U.S. population overall was 16 percent to 17 percent. When adding in non refugee family members, K 12 education costs rose to $97.7 billion, an increase of $74.4 billion. Housing Assistance Over the ten year period of the study, housing assistance costs accounted for around $8 billion, or 4 percent of expenditures for the refugee population. These costs include programs funded by the Department of Housing and Urban Development, as well as programs funded by state and local governments. Housing is a critical benefit for newly arrived refugees but data were not sufficient to permit the estimation of housing assistance costs by number of years of U.S. residency. However, for refugee families the total annual cost of housing assistance increased from was $615 million in 2005 through 2007 to about $1.1 to $1.2 billion annually from 2008 through About 6 percent of refugees were enrolled in housing assistance in and 9 percent were enrolled by The annual per capita cost for refugees including their family members was $261 in 2012 through Supplemental Nutritional Assistance Program ( SNAP) Over the ten year study period, SNAP accounted for $7.9 billion, or nearly 4 percent of spending on refugees. The share of refugees receiving SNAP benefits increased from 14 percent in to 23 percent in and annual costs for refugees increased from $380 million to $900 million. Annual costs increased only modestly in the years 2012 through 2014 to $1 billion. Given the higher poverty rates among refugees, per capita annual costs were higher among refugees at $310 compared to non refugees at $200 for 2008 to In the 2012 to2014 period, per capita annual spending was $340 for refugees and $240 for the general U.S. population. Refugee benefits accounted for 1.4 percent to 1.5 percent of the cost of the SNAP benefits from 2008 to Supplemental Security Income (SSI) Benefits to refugees accounted for about 2.9 percent of SSI expenditure in Costs and enrollment levels for the SSI program remained fairly stable over the ten year period of study. Participation in the program ranged from 6 percent to 8 percent among refugees and their family members during at a total annual cost $1.7 billion, $600 annually per capita for 29
30 refugees and $430 for refugees and family members. Estimates were similar in recent years from 2012 to 2014 with SSI enrollment rates at 5 percent to 7 percent among refugees, spouses, and children. Costs during 2012 to 2014 totaled $1.7 billion, about $540 annually per capita for individual refugees and $375 per capita for refugees and family members. Revenues Over 10 Years From 2005 through 2014, refugees contributed an estimated $269.1 billion in revenue to all levels of government refugees. They contributed an estimated $194.4 billion to the federal government through payroll, income, and excise taxes, and $74.6 billion to state and local governments, through income, sales, and property taxes. Refugees paid $99.2 billion in federal FICA taxes, an amount greater than expenditures on refugees in Social Security and Medicare ($65.7 billion). Refugees contributed $87.1 billion in federal income taxes, and $24.5 billion in state income taxes. Property tax contributions to local governments were $32.5 billion. State and local sales taxes were estimated at $17.7 billion, and federal excise taxes at $8.1 billion. Table 9 reports the revenues from refugees over the ten year study period. Table 9. Revenues from Refugees, by Source, Refugees and Refugees Families Federal FICA tax $99,249 $125,376 Federal income tax* $87,077 $114,794 Property tax $32,482 $39,478 State income tax* $24,503 $32,308 State and local sales tax $17,678 $21,457 Federal excise tax $8,117 $9,926 Total $269,106 $343,339 Values reported in millions, and expressed in 2014 dollars. * Excludes refundable portions of tax credits. Refugees and their non refugee spouses and children contributed an estimated $343.3 billion in revenue to all levels of government, greater than the amount paid by refugees alone by $117.8 billion. The largest increases were in federal and state income taxes, which were 32 percent greater. They paid an estimated $250.1 billion to the federal government and $93.2 billion to state and local governments. Net Fiscal Impact 30
31 Overall, this report estimated that the net fiscal impact of refugees was positive over the ten year period, at $63.0 billion, meaning they contributed more in revenue than they cost in expenditures. As shown in Table 9, refugees net fiscal benefit to the federal government was estimated at $40.9 billion, and the net fiscal benefit to state and local governments was estimated at $22.0 billion. The federal government spent over three times as much as state and local governments on programs and services for refugees, and received over two and a half times as much revenue. Table 9. Expenditures and Revenues for Refugees, and Refugees and Families, Expenditures Revenue Net Refugees Total $206,071 Federal $153,446 $269,10 6 $194,44 2 $63,034 $40,996 State/Local $52,626 $74,663 $22,038 Refugees and Families Total $326,432 $343,33 9 $16,906 Federal $197,310 $250,09 6 $52,785 State/Local $129,122 $93,243 $35,87 9 Values reported in millions, and expressed in 2014 dollars. Source: HHS ASPE estimates of Current Population Surveys and microsimulation model TRIM3, 2005 to Refugees and their non refugee spouses and children were also a net fiscal benefit overall, estimated at $16.9 billion. While refugees and their families were a net benefit to the federal government, estimated at $52.8 billion, they were a net fiscal cost to state and local governments, with the cost estimated at $35.9 billion. As described above, this is in large part due to the larger number of children when adding in non refugee family members, which increases costs for K 12 education and Medicaid/CHIP. The increases in these two items totals $92.2 billion, which was more than the increase $74.2 billion increase in revenue obtained from adding in non refugee family members. Refugees had a smaller positive fiscal impact in the years surrounding the economic downturn (2008 through 2011) compared with pre and post recession years. As presented in Table 10, from 2005 to 2007, when the economy was relatively strong, refugees contributed $33.2 billion 31
32 more than they received in program outlays. After the economy entered into a recession in late 2007, net contributions declined to just under $16 billion, and then rose again as the economy recovered to $22.9 billion for the 2012 to 2014 period. 32
33 Table 10. Fiscal Expenditures and Revenues of Refugees, by Year Refugees Expenditures $45.9 $81.5 $70.0 $197.5 Revenues $79.1 $97.0 $93.0 $269.1 Net $33.2 $15.5 $22.9 $71.6 Refugees and Families Expenditures $74.8 $134.2 $108.9 $317.9 Revenues $96.8 $123.2 $123.4 $343.3 Net $22.0 $11.0 $14.4 $25.5 Values reported in billions, and expressed in 2014 dollars. Including the costs of refugees non refugee spouses and children reduces the net fiscal benefit to $23 billion for 2005 to 2007 and to $15.9 billion for 2012 to In contrast, a net fiscal cost of $9.4 billion is estimated for the period 2008 to VIII. Differences in Fiscal Impact by Years of U.S. Residency, Education, and Age This section explores how fiscal impact differs by three demographic characteristics of refugees: years of residency in the U.S., educational attainment, and age. Refugees incur the highest fiscal costs in the immediate years following arrival and resettlement. After living in the U.S. for five years, however, refugees pay more in taxes than they receive in government outlays. The initial resettlement period is when public benefit use is highest and individuals are less likely to be employed. Over time, employment and labor force participation levels rise and public benefit use declines; thus, refugees begin to contribute more to the U.S. government and cost less. After 10 years in the U.S., the average resettled individual paid $4,600 per year more in taxes than he or she received in program benefits. Of note, none of the analysis in this section include costs associated with the criminal justice system, Disproportionate Share Hospital (DSH) payments, and federally funded medical services for the uninsured at health centers. Identifying differences in these costs by these demographic groups would require too many assumptions not supported by any research. For example, one could reasonably estimate health coverage for all immigrants by time in the U.S., but unlike other immigrant groups, refugees are eligible for public health coverage immediately upon arrival. There is also a paucity of research on criminal justice involvement of comparable groups. These costs represent less than five percent of the total expenditures on refugees, and therefore are not likely to qualitative influence the results presented. 33


34 Figure 1. Annual Per Capita Net Fiscal Impact Amount by Number of Years Post Resettlement in the U.S., Values expressed in 2014 dollars. The fiscal impact differs based on refugees age, as is shown in Figure 2. Much like the general U.S. population, working age refugees (ages 25 64) provide a larger net fiscal benefit than other age groups, both overall and per capita. During the ten year period spanning 2005 to 2014, the tax contributions of 25 to 64 year old refugees exceeded their receipt of public benefits by $198.4 billion, or almost $9,200 per person. The net fiscal impact of refugee children under age 18 and individuals older than age 65 also reflect general population trends. These findings mirror those of the National Academies of Science (2017), which found that immigrants were a net fiscal cost until around the age of 25, at which point they became a net fiscal benefit until the mid 60s, when they tend to work less, pay less in taxes, and receive more social insurance or public benefits. 34

35 Figure 2. Total Net Fiscal Impact for Refugees by Age, Values expressed in 2014 dollars. The net fiscal impact of refugees is more positive with higher levels of education. This mirrors the trend of the overall U.S. population, although the impact is lower for refugees across all education levels. On average, individuals with at least a high school diploma pay more in taxes than they receive in benefits, though the amount varies widely by educational degree obtained. The net fiscal impact for the average refugee who graduated from college graduate is eight times higher than that of a refugee who graduated from high school but did not attend college. On average, individuals without a high school diploma represent a net fiscal cost; that is, they receive more in government outlays than they pay in taxes. These findings mirror those of the National Academies of Science (2017), which found that immigrants with higher education have a much more positive net fiscal impact than immigrants with lower education. 35


36 Figure 5. Annual Per Capita Net Fiscal Impact Per Capita by Education Level, Values expressed in 2014 dollars. IV. Comparison to US Population From 2005 through 2014, refugees on average had a net fiscal impact comparable to the general U.S. population, as can be seen in Table 11. The per capita annual net fiscal benefit was $2,205 for refugees and $1,848 for the general U.S. population, a difference not likely to be significant given margins of error and other limitations of this study. Expenditures for the general U.S. population were on average higher than expenditures for refugees, while revenues were more comparable. The size of the net fiscal benefit provided by refugees and the U.S. population was highest in the earliest time period ( ). The increase in expenditures from 2008 to 2011 likely reflects the governmental responses to the recession in that time period. 36
37 Table 11. Annual Per Capita Fiscal Impact for Refugees and General U.S. Population, by Years Refugees Expenditure s $5,724 $6,972 $7,640 $7,111 Revenues $9,863 $8,294 $10,141 $9,316 Net $4,139 $1,321 $2,501 $2,205 U.S. Population Expenditure s $6,995 $7,867 $8,077 $7,677 Revenues $9,920 $9,000 $9,832 $9,525 Net $2,925 $1,133 $1,755 $1,848 In dollars. Values expressed in 2014 dollars. The situation is different when Social Security and Medicare are excluded from the tabulation, shown in Table 12. When these benefits as well as the payroll tax revenue that pays for the benefits are removed from the analysis, the per capita fiscal impact of the U.S. population is about $1,600 higher than for refugees. Per capita revenues are greater and expenditures are smaller for the U.S. population when Social Security and Medicare are excluded. Table 12. Annual Per Capita Expenditures and Revenues for Refugees and U.S. Population excluding cost and taxes for Social Security and Medicare, Refugees Expenditures $4,081 $4,726 $4,773 $4,858 Revenues $6,076 $4,951 $6,894 $5,880 Net $1,996 $224 $2,121 $1,022 U.S Population Expenditures $3,694 $4,113 $4,094 $3,985 Revenues $6,701 $6,017 $6,862 $6,477 Net $3,006 $1,904 $2,769 $2,492 In dollars. Values expressed in 2014 dollars. Table 13 reports annual per capita expenditures for refugees and the general U.S. population, by program. Refugees differed in average yearly per capita expenditures for particular items (Table 10). Some differences are due to expenditures targeting refugees specifically those from the State Department, DHS, and ORR. Refugee specific expenditures reflect $267 more in annual per capita spending on refugees than the general U.S. population. Other differences in expenditures reflect the different age structures of the populations being compared. As described above, 16 percent of the U.S. population over was school age, compared to 7 percent 37
38 of refugees this explains why per capita costs for K 12 public education are $1,056 higher for the U.S. population than for refugees. Table 13. Annual Per Capita Expenditures for Refugees and U.S. Population, by Program, 2005 to 2014 Refugees U.S. Population Medicaid $1,646 $731 Medicare $1,359 $1,631 Social Security and SSDI $917 $2,062 K 12 Education $807 $1,863 SSI $575 $174 EITC * $401 $201 Housing assistance $278 $110 SNAP $276 $190 Criminal Justice $218 $435 Child Tax Credit* $164 $83 DSH payments $101 $73 TANF $34 $30 National School Lunch Program $20 $33 State taxes credits* $17 $7 LIHEAP $8 $8 WIC $6 $19 Health Centers $6 $4 Child Care Subsidies $4 $23 ORR Transitional Assistance and Medical Services $112 $0 Department of State PRM $102 $0 ORR Social Services $56 $0 ORR Targeted Assistance $18 $0 DHS USCIS $7 $0 ORR Preventive Health $2 $0 Total $7,134 $7,677 Note: Values in 2014 dollars. * includes only the refundable portion of tax credits. Some differences in expenditures are due to higher poverty rates faced by refugees on average. Over the ten year study period, nineteen percent of refugees lived below the poverty line, nearly 1 in 4, compared with 14 percent of the total U.S. population or about 1 in 7 persons. For this reason benefit programs targeting low income families, such as Medicaid/CHIP, SSI, and SNAP, expend more per capita among refugees than the U.S. population. SSI is somewhat different. The SSI program is likely higher for refugees due to their higher poverty rate, but also because many retired refugees may not have worked enough years to be eligible for Social Security retirement benefits, or because refugees had low benefit amounts, making them eligible for SSI. As noted above, Medicare and Social Security/SSDI costs are higher among the U.S. population than among refugees. This is due in part to the larger proportion of the U.S. population over age 38
39 65 and therefore eligible for benefits. For Social Security in particular, the cost difference is also a result of refugee s historically lower wages on average. Both wage levels and years worked in the U.S. determine the benefit amount a retiree receives from Social Security. X. Comparability to Other Estimates Results from this report are similar to other comparable analyses of refugees and immigrants. The National Academies of Science (NAS, 2017; Chapter 8) uses a ratio of revenues to expenditures (or receipts to outlays) to characterize the net fiscal impact of immigrants. A revenue to expenditure ratio of 1 indicates revenue neutral; a ratio below 1 indicates a net cost, and above 1 indicates a net benefit. In the baseline scenario, NAS found that first generation immigrants in 2013 had a net negative fiscal impact, with a revenue to expenditure ratio of across all levels of government. The ratio for the federal government was and for state and local governments was With different assumptions about how to estimate the costs of public goods, such as national security and interest on the debt, that ratio increases to in total, for the federal government, and for state and local governments (Scenario 5 in the NAS study). Table 15 shows these results in comparison to the revenue to expenditure ratio for the present study. The ratio is reported for the group including refugees and their non refugee spouse and children, as this is most comparable to the definitions used in the NAS study (which includes immigrants and their dependents). Table 15. Revenue to Expenditure Ratio for First Generation Immigrants and Refugees State/Loca Total Federal l NAS Scenario 1 a NAS Scenario 5 b Refugees and families c a Scenario 1 includes first generation immigrants and their dependents in 2013, and includes the average cost of public goods. b Scenario 5 includes first generation immigrants and their dependents in 2013, and includes the marginal cost of public goods. c Costs for public goods are not included. The results from the present study finds that refugees and their families from had a near neutral net fiscal impact, with a receipts to outlays ratio of in total. The federal ratio was positive at 1.268, while the state and local ratio showed a negative net impact of Had public goods been included in the present study s estimates, the ratios may look more similar to the NAS scenarios. As noted in other sections of this report, the NAS study had comparable findings with respect to the net fiscal impact of immigrants by age and education. NAS found that immigrants in prime working age (around 25 through 95) have a positive net fiscal impact, while school aged and elderly immigrants have a negative fiscal impact, and that immigrants with lower education were 39
40 a net burden while higher educated immigrants were a net benefit. The present study had qualitatively the same results for refugees. Evans and Fitzgerald (2017) examined the socio economic outcomes of refugees entering the U.S. at ages 18 45, tracking their outcomes over a 20 year period. By excluding non refugee children and spouses, their result would be comparable to the present studies refugee alone group, with further restrictions on the sample to exclude children under 18 and some elderly refugees. Evans and Fitzgerald found upon initial arrival, refugees had low employment and earnings and high benefits use. As refugees were in the U.S. longer, their employment outcomes and income increased, and their benefits usage decreased. When examining refugees by time in the U.S., the present study found essentially the same result. Evans and Fitzgerald also found that over their first 20 years in the U.S., refugees pay $21,000 more in taxes than they receive in benefits, which corroborates the present studies finding of a net fiscal benefit for refugees. Two additional studies looked at the socio economic outcomes of refugees during the period. A report by the New American Economy (2017) found that refugees that were in the U.S. for five years or less had median income of around $22,000, while refugees in the country for 25 years had median income of $67,000. A report by the Migration Policy Institute (Capps et al., 2015) similarly found increased income and educational attainment, and lower public benefits usage, for refugees in the country longer. While neither study explored fiscal impact, the findings of better economic outcomes for refugees in the country longer generally track those of the present study. XI. Conclusion This report studied the fiscal impact of refugees from 2005 through It found that total governmental expenditures on refugees were an estimated $206.1 billion over the 10 year period, with an annual per refugee cost of $7, Expenditures from the federal government represented 74 percent of the total, at $153.4 billion. State and local government expenditures were 26 percent of the total, at $52.6 billion in expenditures from state and local governments. For refugees and their non refugee family spouses and children, expenditures totaled $326.4 billion, with an annual per capita cost of 7, Sixty percent of these expenditures were paid by the federal government, totaling $197.3 billion, and the remaining 40 percent were paid by state and local governments, totaling $129.1 billion. Expenditures for refugees and their families were higher than for refugees alone. The higher percentage of expenditures paid by state and local governments for refugees and their families is in large part due to higher K 12 education expenditures for non refugee children. Refugees contributed an estimated $269.1 billion in revenue to all levels of government. They contributed an estimated $194.4 billion to the federal government through payroll, income, and excise taxes, and $74.6 billion to state and local governments, through income, sales, and property taxes. Refugees and their non refugee spouses and children contributed an estimated $343.3 billion in revenue to all levels of government. They paid an estimated $250.1 billion to the federal government and $93.2 billion to state and local governments. 40
41 Overall, this report estimated that the net fiscal impact of refugees was positive over the ten year period, at $63.0 billion. Refugees net fiscal benefit to the federal government was estimated at $40.9 billion, and the net fiscal benefit to state and local governments was estimated at $22.0 billion. Refugees and their non refugee spouses and children were also a net fiscal benefit overall, estimated at $16.9 billion. While refugees and their families were a net benefit to the federal government, estimated at $52.8 billion, they were a net fiscal cost to state and local governments, with the cost estimated at $35.9 billion. This study has several limitations. The study does not examine the lifetime fiscal impact of refugees. The study focuses on the ten year period from 2005 through 2014, and as such the results may not be generalizable to other time periods, nor may they accurately project fiscal impact in the future. The study does not examine the fiscal impact of refugee offspring. Other research has found that second generation immigrants have very different economic outcomes and fiscal effects than first generation immigrants, and such information on refugees may be important to consider. The study examined the total and per capita fiscal impact of refugees, and did explore differences by time in the U.S. and educational attainment, but was not able to estimate the impact of other subgroups, such as countries of origin or English proficiency. Finally, the study did not include all possible costs and benefits. These limitations are explained in greater detail in the body of the report. Results from this study are comparable to existing research on refugees and immigrants more broadly. While the results in this report are valuable for decision makers, there are multiple ways to examine fiscal and economic impact that were not explored in this report. Specifically, this report used a static approach to examine fiscal impact. A dynamic approach, where projected future fiscal impacts and lifetime impacts can be studied, would provide additional information. Additionally, this study did not explore the effects of refugees on the broader economy and labor market, which would have implications both on the fiscal impact as well as other important policy questions. 41
42 Appendix A. Details and Methods for Expenditures and Revenue Items in this Report Child Care Subsidies: The Federal government and States provide child care subsidies for low income working families, spending roughly $10 billion in fiscal year Roughly two thirds of child care subsidy funding comes from the Child Care and Development Fund (CCDF) while the remaining one third comes from other government funding streams related to Temporary Assistance for Needy Families (TANF) and the Social Services Block Grant. Families receive a voucher that may be used to access care by any provider that meets state requirements; alternatively, some families receive a contracted child care slot. The federal government establishes broad requirements, including an income eligibility threshold of 85 percent of state median income. States have a wide degree of discretion within federal parameters and set rules for income eligibility limits, work requirements, family co payments, subsidy rates, and other program rules. See this resource for detailed information on state rules: policies database book tables key cross state variati ons ccdf policies october Estimates of child care subsidy receipt and costs were simulated using TRIM3. The estimated subsidy amount received by each child was equal to each state s maximum reimbursement rate (maximum reimbursement rates may vary by provider type, child age, and other factors), which aligns with state practices. See online documentation for a detailed description of TRIM s Child Care module: Child care subsidies are paid for by a combination of federal and state dollars, based on Federal Medical Assistance Percentages (FMAP), calculated by HHS yearly. After subsidy totals were estimated from TRIM, annual FMAP rates were used to allocate expenditures to the federal government and state governments. FMAP rates differ for each state. To account for the differential allocation of refugees in the U.S., the total federal and state share of expenditures were based on a weighted national FMAP rate, where each state s weight was the estimated proportion of refugees in its total population. Because the Current Population Survey does not have sufficient sample size to estimate the refugee population in each state, the American Community Survey year file was used, applying the same refugee imputation methods used by TRIM. Child Tax Credit (refundable portion only): The Child Tax Credit (CTC) reduces the federal income tax liability of families with qualifying children. The amount of the credit is income based and may be as high as $1,000 per qualifying child under age 17. If the value of the CTC exceeds the amount of taxes owed, families may receive the balance as a refund. Estimates of receipt and value of the child tax credit were simulated using TRIM3. The reported cost only includes the refundable portion of the Child Tax Credit, the Federal Additional Child Tax Credit (ACTC). The entire value of the ACTC was assigned to the tax unit head. If married and filing jointly, the credit was equally distributed between the head and spouse. See the online 42
43 documentation for a detailed description of TRIM s Federal Income Tax module: Children s Health Insurance Program (CHIP ): Based on the average national expenditures per enrollee and the number of children in the refugee population who qualified for enrollment. The Current Population Survey data for CHIP enrollment is known to be unreliable as respondents are often unsure whether a child is covered by Medicaid or CHIP. For this reason, costs of participation were summed with Medicaid costs and program participation indicators were considered to be participation in either Medicaid or CHIP. For a detailed description of Medicaid and CHIP eligibility modeling, see the on line documentation, located at: Criminal Justice: To estimate the level of refugee involvement with the criminal justice system, refugee conviction rates were assumed to be comparable to those of the foreign born population, a conservative approach given that about one half of the refugees identified in current study were U.S. citizens and naturalized citizens have lower offending rates than the foreign born population overall. This approach was used to estimate the proportion of national criminal justice expenditures associated with refugees. Data on expenditures was calculated from microdata for federal, state, and local government costs from the Department of Justice, Expenditure and Employment Extracts Program (JEE). Data on the size of the prison population at the federal, state and local levels for 2012 to 2014 came from a report by the Bureau of Justice Statistics available at The size of the incarcerated population was also compared against data in the American Community Survey. Citizenship status for the incarcerated population was found in annual reports to Congress by the U.S. Sentencing Commission s. Sourcebook for Federal Sentencing Statistics available at < Disproportionate Share Hospital (DSH) Payments: Hospitals receive Disproportionate Share Hospital (DSH) payments from CMS to cover a portion of uncompensated care for the uninsured, underinsured, and for Medicaid and Medicare underpayments. CMS provides DSH payments to qualifying hospitals that serve a large number of Medicaid and uninsured individuals. To estimate DSH costs for refugees, the current analysis divided total annual DSH expenditures by the proportion of the Medicaid population made up of refugees (2.1 percent to 2.5 percent from ) and applied the annual value to refugees federal expenditures. With this method, refugees accounted for an outsized share of DSH expenditures, more than twice what would have been estimated using the proportion of the total population made up of refugees (0.9 percent). The data source was the Medicaid and CHIP Payment and Access Commission (MACPAC), a non partisan legislative branch agency providing data to Congress and HHS. Figures were checked against a 2016 report from CRS, Medicaid Disproportionate Hospital Care Payments. Earned Income Tax Credit (refundable portion only): The Earned Income Tax Credit (EITC) is a benefit for working people with low to moderate income. To qualify, one must meet earnings 43
44 9 and other basic requirements and file a tax return. The EITC reduces the amount of taxes owed. When the value of the credit exceeds the amount owed in taxes, individuals receive the balance as a refund. TRIM3 produced estimates of receipt and cost of the Earned Income Tax Credit (EITC). The reported cost includes the EITC used to reduce positive tax liability as well as the refundable portion of the credit. The entire credit was assigned to the tax unit head. If married and filing jointly, the credit was equally distributed between the head and spouse. See online documentation for a detailed description of TRIM s Federal Income Tax module: Education: All children in the United States have access to free public primary, middle, and secondary education. Education costs were calculated as per pupil national averages based on the number of children in the refugee population ages 6 through 17. The age span captures students expected to be enrolled in primary or secondary (high) school regardless of whether students were actually enrolled in public school. Per pupil expenditures by state and year were obtained from Common Core of Data s (CCD) state fiscal data ( ) and used to impute overall costs. The amounts reflect the local, state, and federal spending. Averages were calculated from the two school years 10 corresponding to the calendar year covered by the survey data. The per pupil expenditure was assigned to each person ages 6 to 17, regardless of school enrollment. Insert methods for higher education. Federal Individual Income Taxes: TRIM3 simulated the value of federal income taxes. This value reflects total Federal Income taxes, excluding the EITC and ACTC. The entire tax was assigned to the tax unit head. If married and filing jointly, the tax was equally distributed between the head and spouse. See online documentation for a detailed description of TRIM s Federal Income Tax module: Health Center Costs for the Uninsured: Uninsured refugees can receive health coverage at any provider, but the federal and state governments only finance coverage and services through select programs. Hospitals providing treatment for uninsured get partially reimbursed through Disproportionate Share Hospital (DSH) Payments, described in more detail above. The Health Resources and Services Administration (HRSA) funds health centers and uses part of that funding to offset costs of caring for the uninsured. Health center grants from HRSA include Migrant Health Centers, Community Health Centers, Health Care for the Homeless, and Public Housing Primary Care. Ryan White Part C HIV clinics provide primary health care and many of 9 For more information on EITC eligibility, see: deductions/individuals/earned income tax credit/do i qualify for earned income tax cre dit eitc 10 Data were not yet available for the 2014 to 2015 school year, and so the 2013 to 2014 school year amount was used for
45 the recipients of these grants are health centers. Health centers are safety net providers that primarily provide primary care services typically furnished in an outpatient clinic. Data on insurance coverage for refugees was not directly available in existing survey data and was estimated as noted above. To identify the proportion of all uninsured that are refugees, we used national estimates of the uninsured at time of survey from the Current Population Survey. Compared with the foreign born population overall, refugee[s] had greater eligibility and higher rates of participation in Medicaid. The proportion of refugees without health insurance was estimated as the average proportion who were uninsured between the foreign born population and the population of naturalized citizens, which was estimated to be 23.9 percent across the CPS for years 2005 to HRSA funding for health centers attributed to uninsured refugees was calculated based on the estimated proportion of the total US uninsured population who are refugees. To estimate the federal costs, we first identified the overall operating expenses paid for by HRSA grants to health centers, as other expenses such as capital outlays are fixed costs that would not change with additional refugee patients. Next, we identified the percentage of health center patients that were uninsured from administrative records. This averaged from 36 percent over We increased the uninsured percentage by 50 percent to account for the fact that uninsured patients likely pay lower fees than insured patients. That is, greater weight was given to uninsured patients in determining the amount of HRSA grant dollars devoted to their care. As a result, we estimated that 54 percent of all operating expenses were to pay for services to the uninsured. The estimated yearly operating expenses for the uninsured were then multiplied by the estimated percentage of the total uninsured population that were refugees. An important limitation to note is that this analysis assumes that uninsured refugees are equally likely to seek care at health centers as other uninsured individuals. However, it may be the case that uninsured refugees are either more or less likely to be located in areas where health centers operate. Data are not available to determine this. An additional limitation is that while health centers are a major federally supported program that benefits uninsured refugees, this population may receive federal support for health services either directly or indirectly from other smaller federal efforts. Housing assistance: The federal, state, and local governments all provide housing assistance programs for low income individuals and families. The Department of Housing and Urban Development (HUD) administers five core programs that subsidize rents for low income populations: the Public Housing program, the Section 8 Housing Choice Voucher program, the Section 8 Project Based Rental Assistance program, the Section 202 Supportive Housing for the Elderly program, and the Section 811 Supportive Housing for Persons with Disabilities program. In general, HUD bases program eligibility on family income, citizenship or immigration status, and, in some cases, other characteristics (e.g. age or disability status). HUD defines income limits, based on a percentage of local area median income. The income level at which a family qualifies for assistance varies by program. Estimates of public and subsidized housing enrollment and costs were produced using TRIM3 Costs reflect the TRIM3 "subsidy" calculated for the household. For this analysis, the value of the subsidy was distributed equally among all household members. See online documentation for 45
46 a detailed description of TRIM s Public and Subsidized Housing module: To determine the proportion of housing assistance costs attributable to the federal government relative to state and local governments, total federal expenditures on housing for fiscal year 2014 were drawn from a 2015 report from the Congressional Budget Office, Federal Housing Assistance for Low Income Households. Total federal expenditures were $45 billion. State and local expenditures were drawn from the Census of Government Finance, line item for housing and community development. For 2014, the total was $ billion. The federal and state/local share of total expenditures was then calculated based on the total expenditures of roughly $95 billion in fiscal year Low Income Energy Assistance (LIHEAP): The Low Income Home Energy Assistance Program (LIHEAP) assists low income households with their heating and cooling energy costs, bill payment assistance, energy crisis assistance, weatherization and energy related home repairs. LIHEAP is designed differently in every state and each grantee sets its own income limits. Federal statute requires that income eligibility criteria for LIHEAP be between 110 and 150 percent of the federal poverty level, except where 60 percent of state median income is higher. LIHEAP costs and enrollment were estimated using a combination of CPS data and the TRIM3 model. CPS data was used for 2005, 2006, 2011, 2013, and TRIM3 data was used for all other years. The cost of the benefit received was equally distributed among all household members. Medicaid/Children s Health Insurance Program (CHIP) : Medicaid is a joint federal and state program that provides free or low cost hospital and medical coverage for low income families and children, pregnant women, the elderly, people with disabilities, and in some states, other adults. The federal government provides a portion of the funding for Medicaid and sets program guidelines, but there is state flexibility in program design. Eligibility varies by state but is primarily dependent on household income, family size, disability, and other factors. Qualifying individuals must be U.S. citizens, U.S. nationals, or legal permanent residents. The Current Population Survey data for enrollment in Children s Health Insurance Program (CHIP) is known to be unreliable as respondents are often unsure whether a child is covered by Medicaid or CHIP. For this reason, costs of participation in CHIP were summed with Medicaid and estimates were considered to be participation in either Medicaid or CHIP. Cost estimates in this report are based on medical care, as the per person average national expenditure for the program, and the number of individuals in the refugee population who met eligibility requirements to enroll. For the years that TRIM3 simulated enrollment results were available (2006, 2008, 2010) Medicaid/CHIP coverage was obtained from TRIM3 and reflects TRIM3 s correction for underreporting of Medicaid and CHIP receipt. For all other years, Medicaid and CHIP coverage was taken from the CPS ASEC. Dollar values were assigned based 46
47 11 on age and year using per enrollee spending data from CMS. Note that the same dollar amount was applied regardless of whether coverage came through Medicaid or through CHIP. For a detailed description of Medicaid and CHIP eligibility modeling, see the online documentation, located at: Medicaid and CHIP are paid for by a combination of federal and state dollars, based on Federal Medical Assistance Percentages (FMAP), calculated by HHS yearly. After total expenditures were estimated from TRIM, annual FMAP rates were used to allocate expenditures to the federal government and state governments. FMAP rates differ for each state, and to account for the differential allocation of refugees in the U.S., the total federal and state share of expenditures were based on a weighted national FMAP rate, where each state s weight was the estimated proportion of refugees in its total population. The Current Population Survey does not have sufficient sample size to estimate the refugee population in each state, so the American Community Survey year file, following the same refugee imputation methods used by TRIM. Medicare: Medicare is a federal health insurance program for people age 65 or older or people under age 65 with certain disabilities or terminal illnesses. Individuals pay into Medicare through payroll taxes while working and receive benefits upon meeting age and eligibility requirements. To qualify, an individual must be entitled to receive Medicare based on their own earnings or those of a spouse, parent, or child. The worker must have worked and paid payroll taxes for a specified number of quarters. Cost estimates for this report are based on medical care, the national, per person average expenditure for care, and are not based on the cost of premiums, copays, or insurance. Whether or not a person was covered by Medicare was taken from the CPS. To avoid overestimating Medicare costs for children, people ages 18 and under with reported Medicare were reclassified 12 as receiving Medicaid, rather than Medicare. Dollar values were assigned based on age (19 44, 45 64, 65 84, and 85+) and year using per enrollee spending data from the Center for Medicare & Medicaid Services (CMS), Office of the Actuary (OACT). For a detailed description of Medicare modeling, see the online documentation, located at: CMS Disproportionate Share Hospital (DSH) payments partially offset the additional costs to hospitals for serving Medicare patients. Data for were sourced from from the CMS Healthcare Cost Report Information System from hospital form CMS As noted above, people ages 18 and under who reported Medicare were counted as covered by Medicaid rather than Medicare. The per person Medicaid amounts were assigned by year and age group (children, adults, aged). Higher costs for the disabled are not captured. The per enrollee Medicaid values were provided to us by ASPE. The values were obtained from a table labeled Table 6 Medical Assistance Payments Per Enrollee, by Enrollment Category, Net Services FMR on APS Data. The 2004 values were obtained from a table labeled Table 19 Past and Projected Medicaid Expenditures on Medical Assistance Payments Per Enrollee, by Enrollment Category, Fiscal Years (Data for Figure 6). 12 People tend to confuse Medicare and Medicaid and this may be more pronounced among recent immigrants with limited English. Medicare is rare among children (who are eligible to receive it if they have End Stage Renal Disease and a parent who receives or is eligible for Social Security Benefits). 47
48 National School Lunch Program: The National School Lunch Program provides free or low cost nutritionally balanced meals to children in public and non profit private schools and residential child care institutions. These programs operate. Children qualify to receive subsidized meals at school if their families' household incomes meet the income eligibility guidelines. Children from families with incomes at or below 130 percent of the poverty level are eligible for free meals. Those with incomes between 130 percent and 185 percent of the poverty level are eligible for reduced price meals. Children who participate in the Supplemental Nutrition Assistance Program (SNAP) or Temporary Assistance for Needy Families (TANF), and children who are migrant, runaway, or homeless are automatically eligible for free meals. Costs of and participation in the National School Lunch Program were estimated using data from the CPS. The total value of school lunches received by all students in the household was equally distributed among all children age 5 15, plus those children who were enrolled in school. If a household reporting school lunches has no children under this definition, all year olds were considered students regardless of their enrollment status. The National School Lunch Program is funded by both the federal government and state governments. The federal and state portions of expenditures were calculated based on state match rates provided by the Department of Agriculture. Payroll taxes paid : The TRIM3 model simulated estimated payroll taxes (OASDHI, CSRS) paid. The tax was calculated on an individual basis and reflects the individual's taxes. The estimate includes both the employee and employer portions of payroll taxes paid. See online documentation for a detailed description of TRIM s Payroll Tax module: Property taxes paid: Property taxes were assigned to all households that owned or rented their home, excluding households that reported living rent free or that reside in public or subsidized housing. The assumption is that a share of the renter s rent goes toward property taxes. The amount of the property tax was obtained from tabulations of the ACS Year data file, performed by ASPE and provided to the Urban Institute for use in this task. The ACS tabulations reflect averages among property owners. Values vary by State, poverty level (<100%, 100 <199%, %, and 400%+), and age group (18 64, 65+). The property tax amount was assigned to the household head. If the household head was married, the tax was split between the head and spouse. Sales and Excise Taxes Paid: A formula developed by experts at the Tax Policy Center was used to calculate Federal excise taxes. The same equation was used in the National Academies of Science (NAS) report Economic and Fiscal Consequences of Immigration and was shared by 13 Gretchen Donehower and Kim Rueben. TRIM3 provides the necessary information to estimate each unit s total federal excise taxes (federal tax unit s AGI, the number of dependents, and the age of the dependents). The tax was allocated to the head of the tax unit. For joint tax filers, the 13 economic and fiscal consequences of immigration 48
49 amount was divided evenly between the two spouses. The imputation produced totals exceeding total federal excise taxes according to the national income and product accounts (NIPA) produced by the Bureau of Economic Analysis (BEA) and were adjusted across the board so as to match the NIPA. State and local sales and excise taxes are calculated as percentage of income that varies by income range. Using TRIM3 information on a family s total cash income, the family s total state and local sales and excise taxes were imputed by multiplying family income by rates that varied by state and income level (but not by year). For these purposes, related subfamilies were considered part of the household s primary family. State and local sales and excise taxes were assigned to the head of the family (where family is defined as all related persons in the household). If married, the tax was split between the head and spouse. Rates vary by State and the following income levels: $0 $30,000, $30,001 $40,000, $40,001 $60,000, $60,001 $100,000, $100,001 $300,000, more than $300,000. The rates are based on IRS tables for sales tax deductions for years and are augmented for state excise taxes and capital purchases based on information from the Consumer Expenditure Survey on relevant purchases and Census of Governments data. The totals that result from this estimation are less than what is shown in the national income and product accounts (NIPA) produced by the Bureau of Economic Analysis (BEA). Totals were not adjusted to match NIPA, because some share of taxes is paid by businesses (and the analysis did not take the further step of modeling how that would be passed on to consumers). Social Security: Social Security is a social insurance program that provides cash benefits to support workers and their families in retirement, or when they experience income loss due to career ending disability or the death of a family worker. Workers pay Social Security taxes while they are employed and employers pay matching contributions. Eligible individuals must have worked and paid Social Security taxes for a specified time. Benefit levels are calculated based on prior earnings. There is no means or resource testing of Social Security benefits, although there are limitations on earned income in some situations. The three categories of Social Security benefits are: retirement, survivor, and disability. The Old Age and Survivors Insurance program provides monthly retirement and survivors benefits to qualified workers and their families. Workers must pay Social Security taxes for a total of 40 quarters, or 10 years, to be eligible for retirement benefits. Individuals qualify for full retirement benefits between the ages of 65 and 67, depending on the year of birth. Reduced benefits are payable at age 62. Social Security Disability Insurance (SSDI) provides monthly benefits to disabled individuals who cannot work due to a medical condition expected to last at least one year or result in death. Eligible individuals must meet the requirements for past work and Social Security taxes paid. In some cases, dependents of disabled individuals may also qualify for SSDI benefits. Social Security benefit costs reflect receipt of Social Security and amounts reported on the CPS (TRIM3 does not simulate Social Security benefits). The reported benefits include Social Security retirement benefits, SSDI (Social Security Disability), and benefits paid to widows, 49
50 survivors, and dependents of Social Security recipients. For this analysis, dollars are counted as received by the person reporting Social Security income in the CPS ASEC. State Individual Income Taxes : The TRIM3 model was used to estimate the value of individual state income taxes paid. This variable reflects state income taxes for tax units with positive state income tax liability. The entire tax was assigned to the tax unit head. If married and filing jointly, the tax was equally distributed between the head and spouse. See online documentation for a detailed description of TRIM s State Income Tax module: Supplemental Nutrition Assistance Program (SNAP, formerly Food Stamps): The Supplemental Nutrition Assistance Program (SNAP) provides monthly nutrition assistance benefits to eligible low income individuals and families. Monthly allotments are determined based on net income and household size. To be eligible for SNAP, most households must meet certain asset and income tests. Households with elderly or disabled members need only meet the net income limit. The gross and net monthly income eligibility thresholds are set at 130 and 100 percent of poverty, respectively. Net income refers to gross income minus the allowable deductions. Certain categories of non citizens, including refugees, are eligible to receive SNAP benefits. 14 TRIM3 was used to estimate SNAP participation and costs. The cost of SNAP benefits was equally distributed among all eligible members of the SNAP unit. See online documentation for a detailed description of TRIM s SNAP module: Supplemental Security Income (SSI): S upplemental Security Income (SSI) is a federally funded program administered by the Social Security Administration (SSA) that provides monthly payments to individuals, including children, who are aged (age 65 or older), blind, or disabled and have limited income and assets. SSI is available to U.S. nationals, citizens, and 15 qualified aliens. TRIM3 was used to estimate SSI enrollment and costs. If both members of a married couple were eligible for SSI, the benefit was distributed equally between them. In all other cases (including disabled children) the entire benefit was assigned to the eligible person. See online documentation for a detailed description of TRIM s SSI module: Temporary Assistance for Needy Families (TANF): The Temporary Assistance for Needy Families (TANF) program provides cash benefits and services to low income families with children to help them achieve self sufficiency. States and territories receive federal funds to 14 For more information on SNAP eligibility, see: 15 Understanding Supplement Security Income SSI Eligibility Requirements. U.S. Social Security Administration. eligibility U.S.si.htm 50
51 16 design and operate the programs and each state and territory has broad discretion in eligibility criteria and the benefits it provides. In general, to qualify for TANF, an individual must have income below the poverty or deep poverty line, be pregnant or responsible for a child dependent, and be a U.S. national, citizen, or qualified legal alien or permanent resident. TRIM3 was used to estimate TANF enrollment and costs. The cost of TANF benefits were equally distributed among all eligible members of the TANF unit. See online documentation for a detailed description of TRIM s TANF module: TANF is paid for by a combination of federal and state dollars, based on Maintenance of Effort (MOE) rates. After total expenditures were estimated from TRIM, annual MOE rates were used to allocate expenditures to the federal government and state governments. MOE rates differ for each state, and to account for the differential allocation of refugees in the U.S., the total federal and state share of expenditures were based on a weighted national MOE rate, where each state s weight was the estimated proportion of refugees in its total population. The Current Population Survey does not have sufficient sample size to estimate the refugee population in each state, so the American Community Survey year file, following the same refugee imputation methods used by TRIM. Women, Infants and Children Special Supplemental Nutrition Assistance (WIC): WIC provides supplemental foods, nutrition education, referrals, and access to health and social services, at no cost to low income pregnant, breastfeeding, postpartum women, and to infants and children up to age five who have a medically determined nutritional risk. Income must be at or below the level or standard set by the state agency, which is required to be between 100 and 185 percent of the federal poverty guidelines. Individual who do not meet the income requirements may still be eligible through receipt of SNAP, Medicaid, or TANF benefits. The 17 WIC program does not restrict eligibility based on immigration status. TRIM3 was used to estimate WIC enrollment and costs. The TRIM3 model assigns benefit values to each member of the WIC unit based on that person's characteristics: woman, infant, young child). See the online documentation for a detailed description of TRIM s WIC module: 16 The four purposes of the TANF program are to: 1)Provide assistance to needy families so that children can be cared for in their own home; 2)Reduce the dependency of needy parents by promoting job preparation, work and marriage; 3)Prevent and reduce the incidence of out of wedlock pregnancies; and 4)Encourage the formation and maintenance of two parent families 17 For more information on WIC eligibility, see: eligibility requirements 51
52 Appendix B. Supplemental Tables Table B1. Costs for Refugee Population by Program, Proportion of Total Cost and Proportional Cost of Refugees by Program for 2005 to 2014 Proportion of Total Refugee Cost Refugee Proportion of Total US Cost Refugees US Population Medicaid/CHIP $47, % $2,229, % Medicare $39, % $4,975, % Social Security and SSDI $26, % $6,290, % K 12 Education $23, % $5,685, % SSI $16, % $530, % EITC* $11, % $614, % Housing assistance $8, % $335, % SNAP $7, % $580, % Criminal Justice $6, % $1,327, % Child Tax Credit* $4, % $254, % ORR Transitional Assistance and Medical Services $3, % Department of State PRM $2, % DSH Allotments $2, % $222, % ORR Social Services $1, % TANF $ % $90, % National School Lunch Program $ % $100, % ORR Targeted Assistance $ % State refundable tax credits* $ % $22, % LIHEAP $ % $24, % DHS USCIS $ % Health Centers $ % $12, % WIC $ % $58, % Child Care Subsidies $ % $69, % ORR Preventive Health $ % Public Higher Education Total $206, % $23,424, % Values in millions, expressed in 2014 dollars. Source: Current Population Survey Annual Social and Economic Supplement and microsimulation model TRIM3, and additional ASPE analysis of administrative and budgetary data. 52
53 Table B2. Expenditures and Revenues by Program for Refugees, Number of refugees Participatin g (average year) Percen t of total 10 Year Cost, Refugees Only Number in refugee families Participating (average year) Percen t of total 10 Year Cost, Refugees and Families Total 2,888, $74,582 4,500, $25,200 1 Social Security 234, $26, , $30,192 TANF 65, $ , $2,045 SNAP 615, $7, , $12,009 SSI 218, $16, , $18,433 Child Care Subsidies 5, $113 34, $1,154 Housing assistance 218, $8, , $10,003 LIHEAP 144, $ , $299 National School Lunch Program 163, $ , $1,901 WIC 37, $ , $1,395 Medicare 357, $39, , $49,318 Medicaid 661, $47,498 1,196, $65,091 Health Centers 482, $5, , $8,940 Education (primary, H.S.) 197, $23, , $97,698 EITC (refundable credit) 542, $11, , $13,357 State taxes (refund credits) 127, $ , $553 Child Tax Credit (refund) 377, $4, , $5,753 Federal taxes paid 1,391,18 9 State taxes paid 1,101,80 7 Federal Excise Taxes paid 2,105,66 0 Payroll taxes Paid 1,772,71 3 Property Taxes Paid 1,798,30 2 State & Local Sales Tax Paid 2,045,88 8 Values in millions, expressed in 2014 dollars $87,077 1,721, $114, $24,503 1,371, $32, $8,117 2,565, $9, $99,249 2,146, $125, $32,482 2,240, $39, $17,678 2,503, $21,457 53
54 Source: Current Population Survey Annual Social and Economic Supplement and microsimulation model TRIM3, and additional ASPE analysis of administrative and budgetary data. 54
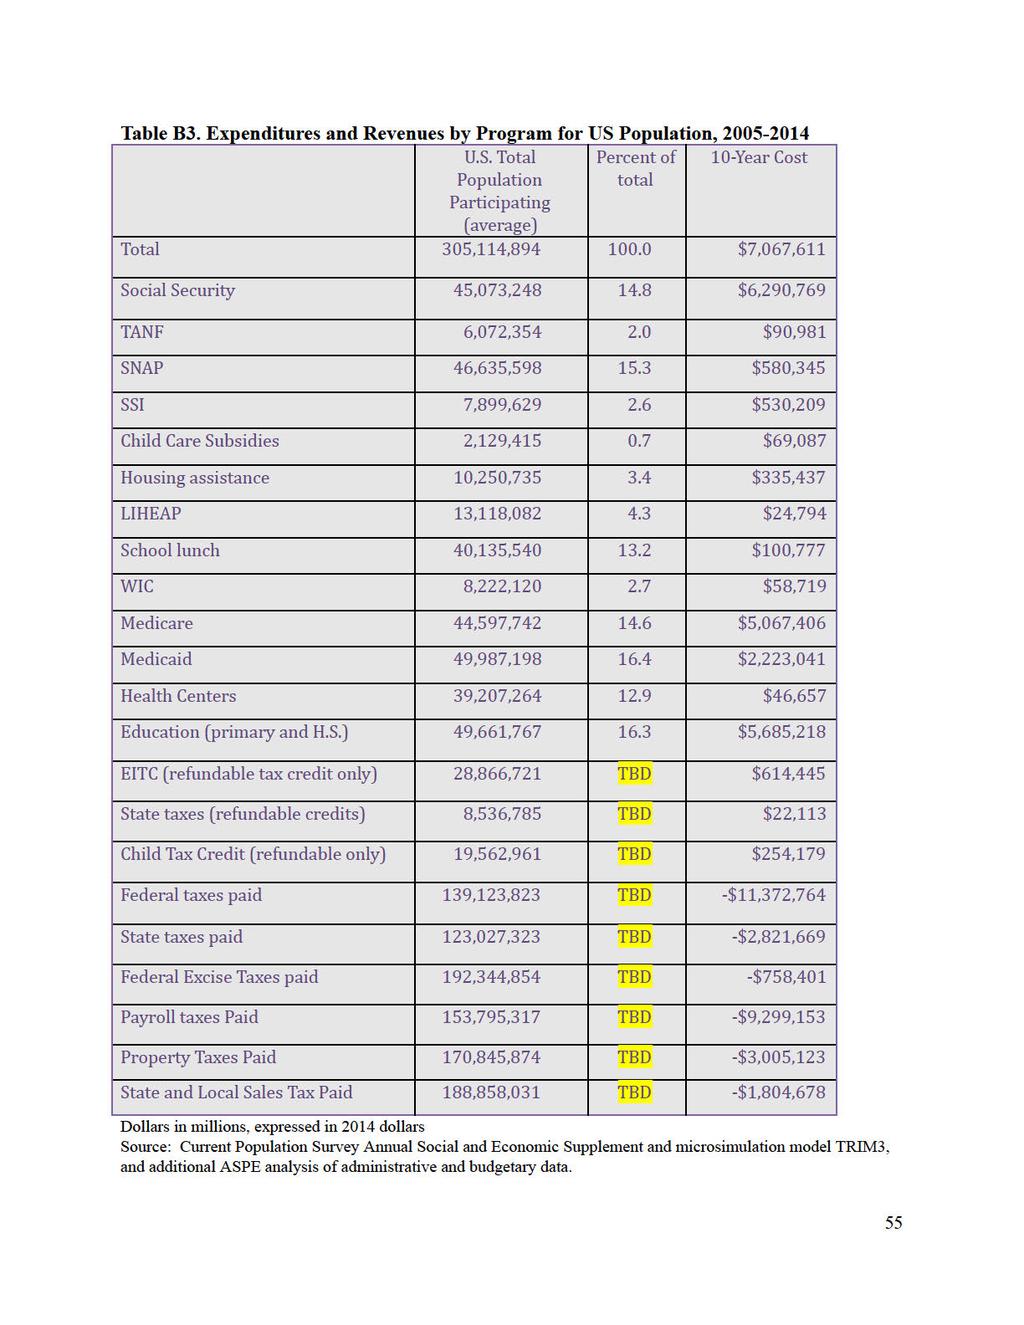
55
Immigration. Immigration and the Welfare State. Immigrant and Native Use Rates and Benefit Levels for Means-Tested Welfare and Entitlement Programs
 Immigration RESEARCH AND POLICY BRIEF May 10, 2018 Number 6 Immigration and the Welfare State Immigrant and Native Use Rates and Benefit Levels for Means-Tested Welfare and Entitlement Programs By Alex
New public charge rules issued by the Trump administration expand the list of programs that are considered
 CENTER FOR IMMIGRATION STUDIES December 2018 63% of Access Welfare Programs Compared to 35% of native households By Steven A. Camarota and Karen Zeigler New public charge rules issued by the Trump administration
John Hellerstedt, MD Commissioner Department of State Health Services. April 21, 2016
 Presentation to the Senate Committee on Health and Human Services: Overview of the Texas Health and Human Services System s Involvement in Refugee Services Judge John Specia Commissioner Department of
Immigrants Access. Who Remains Eligible for What? JILL D. MOORE
 Immigrants Access Since enactment of the Welfare Reform Act of 1996 and related legislation, human services workers and immigrants have often been confused about the Who Remains Eligible for What? JILL
The Fiscal Cost of Low-Skill Immigrants to State and Local Taxpayers
 214 Massachusetts Ave. N.E Washington D.C. 20002 (202) 546-4400 www.heritage.org CONGRESSIONAL TESTIMONY The Fiscal Cost of Low-Skill Immigrants to State and Local Taxpayers Testimony before The Subcommittee
This analysis confirms other recent research showing a dramatic increase in the education level of newly
 CENTER FOR IMMIGRATION STUDIES April 2018 Better Educated, but Not Better Off A look at the education level and socioeconomic success of recent immigrants, to By Steven A. Camarota and Karen Zeigler This
PROPOSED CHANGES TO PUBLIC CHARGE: QUICK ANALYSIS and FREQUENTLY ASKED QUESTIONS QUICK ANALYSIS
 PROPOSED CHANGES TO PUBLIC CHARGE: QUICK ANALYSIS and FREQUENTLY ASKED QUESTIONS QUICK ANALYSIS ** See Page 6 for Answers to Frequently Asked Questions ** How the public charge policy is applied today
Gauging the Impact of DHS Proposed Public-Charge Rule on U.S. Immigration
 Policy Brief Gauging the Impact of DHS Proposed Public-Charge Rule on U.S. Immigration By Randy Capps, Mark Greenberg, Michael Fix, and Jie Zong November 2018 Executive Summary On October 10, 2018, the
ARE IMMIGRANTS ELIGIBLE FOR PUBLICLY FUNDED BENEFITS AND SERVICES?
 No. 110 May 2007 David M. Lawrence, Editor ARE IMMIGRANTS ELIGIBLE FOR PUBLICLY FUNDED BENEFITS AND SERVICES? Jill Moore Local government agencies in North Carolina provide a wide variety of benefits and
Based on our analysis of Census Bureau data, we estimate that there are 6.6 million uninsured illegal
 Memorandum Center for Immigration Studies September 2009 Illegal Immigrants and HR 3200 Estimate of Potential Costs to Taxpayers By Steven A. Camarota Based on our analysis of Census Bureau data, we estimate
New Findings on the Fiscal Impact of Immigration in the United States
 New Findings on the Fiscal Impact of Immigration in the United States Pia Orrenius Federal Reserve Bank of Dallas Research Department Working Paper 1704 New Findings on the Fiscal Impact of Immigration
Migration Information Source - Spotlight on Refugees and Asylees in the United Sta...
 Pagina 1 di 8 Spotlight on Refugees and Asylees in the United States By Jeanne Batalova Migration Policy Institute July 13, 2009 For many people seeking protection, a neighboring country is often the first
Older Immigrants in the United States By Aaron Terrazas Migration Policy Institute
 Older Immigrants in the United States By Aaron Terrazas Migration Policy Institute May 2009 After declining steadily between 1960 and 1990, the number of older immigrants (those age 65 and over) in the
Case 1:17-cv DKW-KSC Document Filed 06/30/17 Page 1 of 10 PageID #: 5608 IN THE UNITED STATES DISTRICT COURT FOR THE DISTICT OF HAWAI I
 Case 1:17-cv-00050-DKW-KSC Document 297-3 Filed 06/30/17 Page 1 of 10 PageID #: 5608 IN THE UNITED STATES DISTRICT COURT FOR THE DISTICT OF HAWAI I STATE OF HAWAI I, Plaintiff, v. DONALD TRUMP, et al.,
Immigrants and Public Benefits in Texas
 1 Immigrants and Public Benefits in Texas Immigration and Border Security Hearing House Committee on State Affairs House Committee on Border and International Affairs. Presented March 28, 2007, rev. 10/24/07
Refugee Admissions and Resettlement Policy
 Andorra Bruno Specialist in Immigration Policy November 30, 2016 Congressional Research Service 7-5700 www.crs.gov RL31269 Summary A refugee is a person fleeing his or her country because of persecution
Counting for Dollars: The Role of the Decennial Census in the Geographic Distribution of Federal Funds
 THE GEORGE WASHINGTON INSTITUTE OF PUBLIC POLICY Counting for Dollars: The Role of the Decennial Census in the Geographic Distribution of Federal Funds Initial Analysis: 16 Largest Census-guided Programs
Office of Refugee Resettlement ORR 101
 Office of Refugee Resettlement ORR 101 Ken Tota, Deputy Director Office of Refugee Resettlement March 6, 2014 How Is This Talk Relevant to You? Community Services Programs: planning overall strategies
Population Estimates
 Population Estimates AUGUST 200 Estimates of the Unauthorized Immigrant Population Residing in the United States: January MICHAEL HOEFER, NANCY RYTINA, AND CHRISTOPHER CAMPBELL Estimating the size of the
Robert Haveman For Poverty 101 June, 2018 Research Training Policy Practice
 Causes of Poverty Robert Haveman For Poverty 101 June, 2018 Research Training Policy Practice A Difficult Topic No comprehensive evidence enabling assignment of responsibility to various causes. Lots of
C urrent federal benefits eligibility for immigrants is largely shaped by the 1996
 Immigrants Eligibility for Federal Benefits C urrent federal benefits eligibility for immigrants is largely shaped by the 1996 welfare reform law, the Personal Responsibility and Work Opportunity Reconciliation
An asylee is legally defined as a person who flees his or her country
 Asylee Eligibility for Resettlement The National Asylee Information & Referral Line Asylee Eligibility for Resettlement A joint project of Catholic Legal Immigration Network, Inc. and Catholic Charities,
Questions & May Answers
 Press Office U.S. Department of Homeland Security Questions & May 25, 1999 Answers PUBLIC CHARGE General Q1: Why are the Department of Justice (DOJ) and the Immigration and Naturalization Service (INS)
Proposed Public Charge Regulation Summary
 Proposed Public Charge Regulation Summary Introduction The Department of Homeland Security has issued proposed regulations that would redefine the meaning of the legal term public charge to reject immigrants
Housing and Serving Undocumented People
 Helly Lee Senior Policy Analyst hlee@clasp.org Housing and Serving Undocumented People National Conference on Ending Homelessness July 16, 2015 www.clasp.org More than 41.3 million immigrants in the U.S.
Migrants Fiscal Impact Model: 2008 Update
 11 April 2008 Migrants Fiscal Impact Model: 2008 Update Report by Access Economics Pty Limited for Department of Immigration and Citizenship TABLE OF CONTENTS EXECUTIVE SUMMARY... i 1. Introduction...
Major Benefit Programs Available to Immigrants in California
 NATIONAL IMMIGRATION LAW CENTER Major Benefit Programs Available to Immigrants in California November 2014 1 Supplemental Security Income & State Supplemental Payment (SSI/SSP) Receiving SSI (or application
DEPARTMENT PHILOSOPHY
 BEM 630 1 of 12 REFUGEE ASSISTANCE PROGRAM DEPARTMENT PHILOSOPHY DEPARTMENT POLICY / ELIGIBILITY PERIOD PROGRAM ADMINISTRATION MDHHS Local Office MDHHS Central Office The refugee assistance programs are
Refugee Admissions and Resettlement Policy
 Andorra Bruno Specialist in Immigration Policy March 7, 2012 CRS Report for Congress Prepared for Members and Committees of Congress Congressional Research Service 7-5700 www.crs.gov RL31269 Summary A
Immigrants are playing an increasingly
 Trends in the Low-Wage Immigrant Labor Force, 2000 2005 THE URBAN INSTITUTE March 2007 Randy Capps, Karina Fortuny The Urban Institute Immigrants are playing an increasingly important role in the U.S.
Immigration in Utah: Background and Trends
 Immigration in Utah: Background and Trends August 28, 2008 Immigration in Utah, as well as in the United States, has always been an issue that has evoked intense emotion and debate. Recent increases in
CRS Report for Congress
 CRS Report for Congress Received through the CRS Web Order Code RS2916 Updated May 2, 23 Immigration and Naturalization Fundamentals Summary Ruth Ellen Wasem Specialist in Social Legislation Domestic Social
SAFETY-NET INCOME & FOOD BENEFITS FOR IMMIGRANT- HEADED HOUSEHOLDS. Basic Benefits Training, March 2017 Patricia Baker, Mass Law Reform Institute
 SAFETY-NET INCOME & FOOD BENEFITS FOR IMMIGRANT- HEADED HOUSEHOLDS Basic Benefits Training, March 2017 Patricia Baker, Mass Law Reform Institute 1 KEY NUTRITION BENEFITS Supplemental Nutrition Assistance
May 1, First Street NE, Suite 510 Washington, DC Tel: Fax:
 820 First Street NE, Suite 510 Washington, DC 20002 Tel: 202-408-1080 Fax: 202-408-1056 center@cbpp.org www.cbpp.org May 1, 2018 Trump Rule Would Threaten Low-Wage Legal Immigrants in the U.S. If Their
Unauthorized Immigration: Is it really a fiscal burden for. California?
 Unauthorized Immigration: Is it really a fiscal burden for California? Bryan Cortes Economics 464: Applied Senior Project California Polytechnic State University San Luis Obispo, California Advisor: Stephen
PROPOSED CHANGES TO FEDERAL PUBLIC CHARGE IMMIGRATION REGULATIONS
 PROPOSED CHANGES TO FEDERAL PUBLIC CHARGE IMMIGRATION REGULATIONS What we know and what we can do October 2018 Table of Contents 1. What is going on?... 1 2. What is public charge?... 2 3. What are the
5 year bar unless pregnant or child<21. pregnant or child<21. pregnant or child< 21
 Health Coverage Crosswalk: Eligibility by Immigration Status Copyright March 2013 Benefit Related Immigration Classifications Lawfully Present5 Qualified Aliens Immigration Status Lawful Permanent Resident
The Challenges of Serving Undocumented and Immigrant Families
 The Challenges of Serving Undocumented and Immigrant Families A Guide for Case Managers at the Siemer Institute for Family Stability Wednesday April 22, 2015 2:00pm 3:30pm EST Presented by: Siemer Institute
Major Benefit Programs Available to Immigrants in California
 NATIONAL IMMIGRATION LAW CENTER Major Benefit Programs Available to Immigrants in California May 2017 1 Supplemental Security Income & State Supplemental Payment (SSI/SSP) Receiving SSI (or application
Illinois: State-by-State Immigration Trends Introduction Foreign-Born Population Educational Attainment
 Illinois: State-by-State Immigration Trends Courtesy of the Humphrey School of Public Affairs at the University of Minnesota Prepared in 2012 for the Task Force on US Economic Competitiveness at Risk:
This advisory seeks to provide practitioners with current information about the status of public charge.
 Fact Sheet August 2018 NON-LPR AN OVERVIEW CANCELLATION OF PUBLIC OF CHARGE REMOVAL An By Em Overview Puhl, Erin of Quinn Eligibility and Sally for Kinoshita Immigration Practitioners I. Introduction Since
PROPOSED CHANGES TO PUBLIC CHARGE: QUICK ANALYSIS
 PROPOSED CHANGES TO PUBLIC CHARGE: QUICK ANALYSIS Last updated: 9/23/2018 How the public charge rule is applied today Under the current policy, the only benefi ts considered in determining who is likely
Overview of Public Benefits Programs in New Mexico
 Overview of Public Benefits Programs in New Mexico Craig Acorn, Senior Attorney - New Mexico Center on Law and Poverty craig@nmpovertylaw.org, 505-255-2840 1 Overview of Public Benefits Programs in New
Deferred Action for Childhood Arrivals (DACA) 4. Not eligible. 16
 4. Not eligible. 16") TANF VAWA Self- Petitioner d Refugee, Asylee, T Visa 1 Access to State-Funded a Public Benefits in New Mexico for Survivors, Based on Immigration Status b By: Daniel Enos and Leslye E. Orloff c February
TANF VAWA Self- Petitioner d Refugee, Asylee, T Visa 1 Access to State-Funded a Public Benefits in New Mexico for Survivors, Based on Immigration Status b By: Daniel Enos and Leslye E. Orloff c February
Expected Changes to the Public Charge Test. September 13, 2018
 Expected Changes to the Public Charge Test September 13, 2018 Goals of the Presentation o Gain understanding of: o Historical/current public charge analysis o Expected changes to public charge test o Federal
Access to State-Funded a Public Benefits in Georgia for Survivors, Based on Immigration Status b By: Daniel Enos and Leslye E. Orloff c Feb.
 TANF VAWA Self- Petitioner d Refugee, Asylee, T Visa 1 Access to State-Funded a Public Benefits in Georgia for Survivors, Based on Immigration Status b By: Daniel Enos and Leslye E. Orloff c Feb. 14, 2019
Refugee Admissions and Resettlement Policy
 Updated December 18, 2018 Congressional Research Service https://crsreports.congress.gov RL31269 SUMMARY A refugee is a person fleeing his or her country because of persecution or a well-founded fear of
Refugee Admissions and Resettlement Policy
 Andorra Bruno Specialist in Immigration Policy August 8, 2013 CRS Report for Congress Prepared for Members and Committees of Congress Congressional Research Service 7-5700 www.crs.gov RL31269 Summary A
CRS Report for Congress
 Order Code RL31269 CRS Report for Congress Received through the CRS Web Refugee Admissions and Resettlement Policy Updated January 25, 2006 Andorra Bruno Specialist in Social Legislation Domestic Social
Economic Research Institute of Erie Black School of Business
 Economic Research Institute of Erie Black School of Business Dr. Kenneth Louie Director, ERIE 13 th ERIE Conference July 27, 2016 www.eriedata.org Thank you to our Sponsors! Gold Sponsors Silver Sponsors
Chapter 5: Verification of Immigration Status SAVE and FOIA
 Chapter 5: Verification of Immigration Status SAVE and FOIA This chapter explains the Refugee Services Program s policy on verifying immigration status, and offers guidance on how to get more information
Social Security Administration (SSA): Budget Issues
: Budget Issues") Social Security Administration (SSA): Budget Issues Scott Szymendera Analyst in Disability Policy January 25, 2013 CRS Report for Congress Prepared for Members and Committees of Congress Congressional
Social Security Administration (SSA): Budget Issues Scott Szymendera Analyst in Disability Policy January 25, 2013 CRS Report for Congress Prepared for Members and Committees of Congress Congressional
Immigrants Access. Who Remains Eligible for What? JILL D. MOORE
 Immigrants Access Since enactment of the Welfare Reform Act of 1996 and related legislation, human services workers and immigrants have often been confused about the Who Remains Eligible for What? JILL
Department of Legislative Services
 Department of Legislative Services Maryland General Assembly 2008 Session SB 84 FISCAL AND POLICY NOTE Senate Bill 84 (Senator Pipkin) Education, Health, and Environmental Affairs State Government - Public
Examining the Congressional Budget Office Cost Estimate of the Senate Immigration Bill By Sharon Parrott and Chad Stone
 820 First Street NE, Suite 510 Washington, DC 20002 Tel: 202-408-1080 Fax: 202-408-1056 center@cbpp.org www.cbpp.org Revised July 15, 2013 Examining the Congressional Budget Office Cost Estimate of the
340:60-1-1, 340:60-1-2, and 340: are revised to amend language to reflect current usage and clarify existing rules.
 POLICY TRANSMITTAL NO. 06-06 DATE: MAY 30, 2006 FAMILY SUPPORT SERVICES DEPARTMENT OF HUMAN SERVICES DIVISION OFFICE OF PLANNING, POLICY & RESEARCH TO: SUBJECT: ALL OFFICES MANUAL MATERIAL OAC 340:60-1,
Refugee Admissions and Resettlement Policy
 Order Code RL31269 Refugee Admissions and Resettlement Policy Updated January 25, 2007 Andorra Bruno Specialist in Social Legislation Domestic Social Policy Division Refugee Admissions and Resettlement
FREQUENTLY ASKED QUESTIONS Proposed Changes to the Public Charge Rule
 FREQUENTLY ASKED QUESTIONS Proposed Changes to the Public Charge Rule NOVEMBER 2018 ON OCTOBER 10, 2018, the Trump administration published a proposed new rule that would change how immigration officials
Noncitizen Eligibility for Federal Public Assistance: Policy Overview
 Noncitizen Eligibility for Federal Public Assistance: Policy Overview Alison Siskin Specialist in Immigration Policy December 12, 2016 Congressional Research Service 7-5700 www.crs.gov RL33809 Summary
State Restrictions on Public Benefits An Analysis of Mississippi s SB 2231 (2012)
") State Restrictions on Public Benefits An Analysis of Mississippi s SB 2231 (2012) Many states are considering bills that restrict access to public benefits based on the ability to document citizenship
State Restrictions on Public Benefits An Analysis of Mississippi s SB 2231 (2012) Many states are considering bills that restrict access to public benefits based on the ability to document citizenship
State Estimates of the Low-income Uninsured Not Eligible for the ACA Medicaid Expansion
 March 2013 State Estimates of the Low-income Uninsured Not Eligible for the ACA Medicaid Expansion Introduction The Patient Protection and Affordable Care Act (ACA) will expand access to affordable health
THE DECLINE IN WELFARE RECEIPT IN NEW YORK CITY: PUSH VS. PULL
 THE DECLINE IN WELFARE RECEIPT IN NEW YORK CITY: PUSH VS. PULL Howard Chernick Hunter College and The Graduate Center, City University of New York and Cordelia Reimers Hunter College and The Graduate Center,
BACKGROUNDER. National Academy of Sciences Report Indicates Amnesty for Unlawful Immigrants Would Cost Trillions of Dollars
 BACKGROUNDER No. 3175 National Academy of Sciences Report Indicates Amnesty for Unlawful Immigrants Would Cost Trillions of Dollars Robert Rector and Jamie Bryan Hall Abstract An analysis of a recent study
The National Partnership for New Americans: Principles of Immigrant Integration
 The National Partnership for New Americans: Principles of Immigrant Integration 02/15/13 Immigrant Integration Policy Goals The National Partnership for New Americans (NPNA) views immigrants as crucial
Proposed Refugee Admissions for Fiscal Year 2017: Report to the Congress. Summary prepared by the Refugee Health Technical Assistance Center
 Proposed Refugee Admissions for Fiscal Year 2017: Report to the Congress Summary prepared by the Refugee Health Technical Assistance Center The Proposed Refugee Admissions for Fiscal Year 2017: Report
Fiscal Impacts of the Foreign-Born Population
 William A. Kandel Analyst in Immigration Policy October 19, 2011 CRS Report for Congress Prepared for Members and Committees of Congress Congressional Research Service 7-5700 www.crs.gov R42053 Summary
Noncitizen Eligibility for Federal Public Assistance: Policy Overview and Trends
 Cornell University ILR School DigitalCommons@ILR Federal Publications Key Workplace Documents 9-24-2014 Noncitizen Eligibility for Federal Public Assistance: Policy Overview and Trends Ruth Ellen Wasem
The Applicability of Public Charge Rules to Legal Immigrants Who Are Eligible for Public Benefits 1
 820 First Street NE, Suite 510 Washington, DC 20002 Tel: 202-408-1080 Fax: 202-408-1056 center@cbpp.org www.cbpp.org April 14, 2004 The Applicability of Public Charge Rules to Legal Immigrants Who Are
CRS Report for Congress
 Order Code RL31114 CRS Report for Congress Received through the CRS Web Noncitizen Eligibility for Major Federal Public Assistance Programs: Policies and Legislation Updated March 17, 2004 Ruth Ellen Wasem
Health Care Reform Immigrant Eligibility
 Health Care Reform Immigrant Eligibility Amilcar Velasquez & Julia Rudakov Medi-Cal Eligibility Workers You do not have to be a US Citizen to be eligible for Health Care Insurance through the Marketplace
Treatment of Noncitizens in H.R. 3200
 Alison Siskin Specialist in Immigration Policy Erika K. Lunder Legislative Attorney August 26, 2009 Congressional Research Service CRS Report for Congress Prepared for Members and Committees of Congress
A Note on International Migrants Savings and Incomes
 September 24, 2014 A Note on International Migrants Savings and Incomes Supriyo De, Dilip Ratha, and Seyed Reza Yousefi 1 Annual savings of international migrants from developing countries are estimated
Department of Homeland Security
 Department of Homeland Security Under Secretary Management Chief Financial Officer Under Secretary Science and Technology Under Secretary National Protection & Programs Policy Assistant Secretary General
Low-Income Immigrant Families Access to SNAP and TANF
 C E N T E R O N L A B O R, H U M A N S E R V I C E S, A N D P O P U L A T I O N B R I E F Low-Income Immigrant Families Access to SNAP and TANF Devlin Hanson, Heather Koball, and Karina Fortuny with Ajay
Public Charge 101 October 17, 2018
 Public Charge 101 October 17, 2018 Presented by: Madison Hardee & Sonya Schwartz 1 The Protecting Immigrant Families Advancing Our Future Campaign Created in 2017 and Co-Chaired by: Purpose: Unite to protect
Key Nutrition Benefits
 Cash and Food Benefits for Immigrant-Headed Households Basic Benefits Training, March 2018 Patricia Baker, Mass. Law Reform Institute Naomi Meyer, Greater Boston Legal Services Key Nutrition Benefits Has
SOCIAL SECURITY ADMINISTRATION
 SOCIAL SECURITY ADMINISTRATION General and special funds: Federal Funds PAYMENTS TO SOCIAL SECURITY TRUST FUNDS For payment to the Federal Old-Age and Survivors Insurance and the Federal Disability Insurance
Immigration 101 The Advocates for Human Rights 2008
 Immigration 101 The Advocates for Human Rights is pleased to involve your class or community group in a day to learn about immigration to the United States. The Advocates for Human Rights 2008 Overview
Arizona s Response to the World Refugee Crisis. The Arizona Refugee Resettlement Program
 Refugee 101 Arizona s Response to the World Refugee Crisis The Arizona Refugee Resettlement Program What does it mean to be a refugee? What would you do right now if bombs were falling around you? What
Department of Health and Human Services Centers for Medicare and Medicaid Services Questions and Answers on the Five-Year Bar,
 Department of Health and Human Services Centers for Medicare and Medicaid Services Questions and Answers on the Five-Year Bar, Q3. What is the statutory authority for the five-year bar, which prohibits
THE CONSORTIUM stimulating self-sufficiency & stability scholarship
 THE CONSORTIUM stimulating self-sufficiency & stability scholarship July 2017 By Colleen Heflin and Yumiko Aratani Changing Demography of Social Safety Net Programs The demographic characteristics of America
PUBLIC CHARGE: HOW A NEW POLICY COULD AFFECT POVERTY IN NEW YORK CITY
 PUBLIC CHARGE: HOW A NEW POLICY COULD AFFECT POVERTY IN NEW YORK CITY The federal government has proposed changing a rule that determines if someone can get a green card. GREEN CARD? The proposed rule
US Undocumented Population Drops Below 11 Million in 2014, with Continued Declines in the Mexican Undocumented Population
 Drops Below 11 Million in 2014, with Continued Declines in the Mexican Undocumented Population Robert Warren Center for Migration Studies Executive Summary Undocumented immigration has been a significant
Public Charge Rules Would Be Dramatically Changed. May 1, 2018
 820 First Street NE, Suite 510 Washington, DC 20002 Tel: 202-408-1080 Fax: 202-408-1056 center@cbpp.org www.cbpp.org May 1, 2018 Trump Public Charge Rule Would Prove Particularly Harsh for Pregnant Women
REPORT OF THE COUNCIL ON MEDICAL SERVICE. Financial Impact of Immigration on the American Health System (Resolution 235, A-06)
") REPORT OF THE COUNCIL ON MEDICAL SERVICE CMS Report - A-0 Subject: Presented by: Referred to: Financial Impact of Immigration on the American Health System (Resolution, A-0) William A. Dolan, MD, Chair
REPORT OF THE COUNCIL ON MEDICAL SERVICE CMS Report - A-0 Subject: Presented by: Referred to: Financial Impact of Immigration on the American Health System (Resolution, A-0) William A. Dolan, MD, Chair
Welcoming the Stranger into our Communities: Refugee 101
 Welcoming the Stranger into our Communities: Refugee 101 Who Is a Refugee? Someone who has fled their country and cannot return because of persecution due to: Race Religion Nationality Political opinion
Immigrant Eligibility for Public Health Insurance in NYS Empire Justice Center
 Immigrant Eligibility for Public Health Insurance in NYS 2018 Empire Justice Center What will we cover? Definitions and Concepts Citizenship and immigration statuses Benefits-related immigration classifications
Center for Immigration Studies
 Center for Immigration Studies Immigrants in the United States A Profile of America s Foreign-Born Population By Steven A. Camarota i About the Center The Center for Immigration Studies, founded in 1985,
ADVOCATES FORUM TANF CHILD-ONLY POLICY: IMPROVING ACCESS AND ENROLLMENT IN ILLINOIS
 ADVOCATES FORUM TANF CHILD-ONLY POLICY: IMPROVING ACCESS AND ENROLLMENT IN ILLINOIS Valerie Taing, A.M. 13 Abstract This paper offers social work practitioners an intersectional analysis of social welfare
Access to Health Coverage for Immigrants Living with HIV Quick Reference Guide
 Access to Health Coverage for Immigrants Living with HIV Quick Reference Guide Are you working with immigrants living with HIV who need health coverage? Use this quick reference guide to learn about these
GAO IRAQ. Iraqi Refugees and Special Immigrant Visa Holders Face Challenges Resettling in the United States and Obtaining U.S. Government Employment
 GAO United States Government Accountability Office Report to Congressional Committees March 2010 IRAQ Iraqi Refugees and Special Immigrant Visa Holders Face Challenges Resettling in the United States and
IMMIGRANT YOUTH AND MIXED IMMIGRATION STATUS:
 IMMIGRANT YOUTH AND MIXED IMMIGRATION STATUS: Implications and Access to Higher Education in Ohio Luis Fernando Macías Doctoral Candidate Multicultural and Equity Studies in Education L.A.S.E.R In Residence
F EDERAL G U I D A N C E O N PUBLIC CHARGE When Is it Safe to Use Public Benefits?
 F EDERAL G U I D A N C E O N PUBLIC CHARGE When Is it Safe to Use Public Benefits? MAY 2009 The U.S. government has published guidance on the public charge rules when receiving public benefits may affect
Every year, about one million new legal immigrants, or lawful permanent residents, are admitted to the
 CENTER FOR IMMIGRATION STUDIES September 2017 Immigration Multipliers Trends in Chain Migration By Jessica Vaughan Every year, about one million new legal immigrants, or lawful permanent residents, are
Refugee Resettlement in Virginia: A Spotlight on Resources and Services in Virginia
 Darden College of Education, Old Dominion University Norfolk, VA 23529 Telephone: 757-683-3284 VECPC@odu.edu https://www.odu.edu/education/research/vecpc Refugee Resettlement in Virginia: A Spotlight on
New data from the Census Bureau show that the nation s immigrant population (legal and illegal), also
, also") Backgrounder Center for Immigration Studies October 2011 A Record-Setting Decade of Immigration: 2000 to 2010 By Steven A. Camarota New data from the Census Bureau show that the nation s immigrant population
Backgrounder Center for Immigration Studies October 2011 A Record-Setting Decade of Immigration: 2000 to 2010 By Steven A. Camarota New data from the Census Bureau show that the nation s immigrant population
A Demographic Profile of Mexican Immigrants in the United States
 A Demographic Profile of Mexican Immigrants in the United States Ariel G Ruiz Soto Associate Policy Analyst, U.S. Programs Migration Policy Institute Mexico Institute, Wilson Center November 5, 2018 Number
IMMIGRATION AND PUBLIC BENEFIT ELIGIBILITY: AN OVERVIEW
 IMMIGRATION AND PUBLIC BENEFIT ELIGIBILITY: AN OVERVIEW (UPDATED JULY 2016) ALLEGHENY COUNTY DEPARTMENT OF HUMAN SERVICES ONE SMITHFIELD STREET PITTSBURGH, PA 15222 Phone: 412.350.5701 Fax: 412.350.4004
Rural Welfare Reform. Lessons Learned. Leslie A.Whitener, Robert Gibbs, Lorin Kusmin,
 VOLUME 1 ISSUE 3 38 Rural Welfare Reform Lessons Learned Leslie A.Whitener, whitener@ers.usda.gov Robert Gibbs, rgibbs@ers.usda.gov Lorin Kusmin, lkusmin@ers.usda.gov JUNE 2003 39 EyeWire Welfare reform
Illegal Immigration: How Should We Deal With It?
 Illegal Immigration: How Should We Deal With It? Polling Question 1: Providing routine healthcare services to illegal Immigrants 1. Is a moral/ethical responsibility 2. Legitimizes illegal behavior 3.