STOCKHOLM. Yearbook: Summary Results 232
|
|
|
- Dorcas Rose
- 5 years ago
- Views:
Transcription
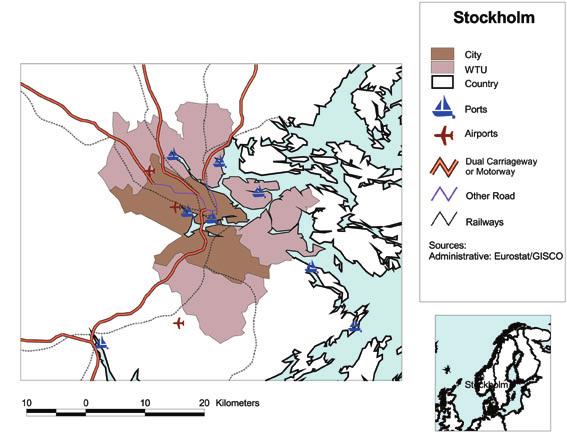
1 STOCKHOLM Stockholm is the capital city of Sweden, located on 15 islands where Lake Mälaren enters the Baltic Sea. Stockholm is the centre of an urban region with a population of approximately 1,760,000, one-fifth of the total population in Sweden. The region also provides one-fifth of total employment and almost a quarter of the gross national product. The region consists of 25 municipalities with common interests in the fields of employment, housing, leisure activities and transport. The 'Wider Territorial Unit' for the Urban Audit was defined as 11 municipalities within the region. The economy of Stockholm is growing faster than that of the rest of Sweden. Service production outweighs manufacturing, the latter accounting for approximately 10% of total employment. One characteristic feature is the high knowledge content in the production sector. Electronics industries play an essential role, the telecommunication company Ericsson being the best-known example. Most of the capacity for higher education and research in the region is located in the centre and north of Stockholm. Most fields of research are represented at different universities and institutes. The transport system, including the underground, commuter trains and the road network, are radial, with Stockholm's central business district constituting the hub. During peak hours, approximately 200,000 trips end in Stockholm, where the public transportation share is the highest in Sweden, over 40%. During the last decade, access to other parts of the region has improved, due to the creation of high-speed rail connections. Stockholm's population has increased due to immigration. The last five years have resulted in a population increase of 8,000 people every year. Problems characteristic of many large cities also exist in Stockholm. Housing segregation has increased and there are high levels of unemployment among specific social groups. Stockholm is home to many cultural institutions including the Royal Opera, the Stockholm Philharmonic Orchestra, the Royal Dramatic Theatre, more than 60 museums and 70 halls for performances and musical events. A New Modern Art Museum was recently built on the island of Skeppsholmen. In 1998, Stockholm was the European Capital of Culture, hosting more than 1,000 cultural events. Swedish municipalities enjoy extensive local governance responsibilities. Within the framework of the Local Government Act, the Stockholm city council is responsible for schools, childcare, social services, city planning, local infrastructure (streets, parks, lighting), building permits, health and environment protection. There are a total of 101 elected members on the City Council. The city is divided into districts. Each district is run by the District Council responsible for different municipal tasks. The District Councils are allocated resources from the City Council. Yearbook: Summary Results 232
2
3 Individual City Audit Summary Stockholm CITY LEVEL Comparison with UA cities 4 WTU 1 SUB-CITY 2 DATA QUALITY/ COMPARABILITY INDICATORS Score cases 5 SCORE Divergence from City level 6 Area 1 Area 2 Range/ Ratio 7 DQ 8 CNC 9 Total resident population (1996) !! Population change ( ) (%) Proportion of population less than 16 years old and above retirement age (%) (1996) " pp!! Proportion of non-nationals (%) (1996) Proportion of non-eu nationals (%) (1996) Average size of households (1990) Female activity rate (%) (1996) "! # Proportion of population of working age in N.Av1 employment (%) (1996)!! Unemployment rate (%) (1996) " pp! # Proportion of unemployed who are less than years old (%) (1996) " pp! # Median weekly household income (1996) N.Av :2.41 ra # $ (euro, 1998 prices) Proportion of households receiving less than half of the national average household income (%) N.Av1 21 N.Av3 N.Av1 N.Av1 N.Av1 pp! # Proportion of households owning or buying their own dwellings (%) (1990) Ratio of average house prices to average 6.96:1 18 N.Av1 annual household income # Life expectancy at birth (years) (1996) N.Av3 N.Av3 N.Av3 N.Av3 ra!! Total recorded crimes per 1,000 population per year (1996) " N.Av5 N.Av5 N.Av5 ra # # Proportion of employment in manufacturing N.Av (%) (1996)!! Proportion of employment in services (%) (1996) Employment change ( ) (%) "! # GDP per capita (1995) (euro, 1998 prices) " # # (1996) Proportion of registered electorate voting in N.Ap last municipal election (%) (1994)! # Proportion of elected city representatives N.Ap who are women (%) (1994)!! N.Ap! # Annual expenditure by municipality per capita (1995) (euro, 1998 prices) 1 WTU: Wider Territorial Unit 2 Scores are provided for two contrasting areas within the city. 3 Categories of Not Available: N.Ap: Not applicable; N.Av1: Not available; N.Av2: No approval to publish; N.Av3: Available but the data has not been processed/purchased for the Urban Audit; N.Av4: Has not been provided in time to be included; N.Av5: Missing for another reason. 4 1,2,3,4,5, reflects the fifth position of the city s relative to the other cities for which information is available (where 29 or more s are available). 1 is the highest and 5 the lowest. 5 Number of cities for which indicator s are available. 6 Yearbook: Summary Results for Each City
4 Individual City Audit Summary Stockholm CITY LEVEL Comparison with UA cities 4 WTU 1 SUB-CITY 2 DATA QUALITY/ COMPARABILITY INDICATORS Proportion of students completing compulsory education with minimum qualifications (%) (1996) Total places in crèches (per 1,000 population) (1996) Places in further education and university establishments (number per 1000 population) (1996) Proportion of male residents qualified at upper secondary education (%) (1996) Proportion of female residents qualified at upper secondary education (%) (1996) Score cases 5 SCORE Divergence from City level 6 Area 1 Area 2 Range/ Ratio 7 DQ 8 CNC " # " # $ N.Av1 26 N.Av " # # " # # Yearbook: Summary Results for Each City
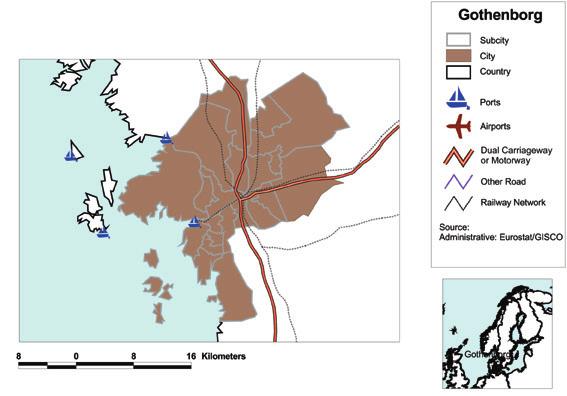
5 GOTHENBURG Gothenburg is the second largest city in Sweden and acts as an important gateway to the west. The municipality covers an area of 714 sq. km including the sea area, which takes up 36% of the total area within the city boundary. The population of the city is around 460,000 and increasing (one of the few cities in Sweden where this is the case). Gothenburg is the centre of the new super county that was founded in 1998, consisting of 49 municipalities and 1.5 million people (17% of Sweden's population). Production related to commerce, transport and communication accounts for 23% of total employment, followed by financial activity, primarily banking insurance and investment sectors (15%) and manufacturing (almost 20%). The city experienced a decline in job opportunities during the 1990s, a trend which has recently been reversed. The Gross Regional Product (GRP) per capita is above the national average. Most of the capacity for higher education and research is today located at two universities: Chalmers University of Technology and the Gothenburg University. Volvo is the best-known example of a successful company located in Gothenburg. The transport system in Gothenburg consists mainly of tram and road networks. Traffic has increased steadily during the last 20 years. This trend is largely due to increased commuting into the city, but is also due to the under-utilisation of public transport - journeys by public transport make up less than 17% of total journeys. In cooperation with the Swedish state, the municipalities of Greater Gothenburg have agreed on common regional investments in the transport and environmental sectors. The population of the city is expected to continue to grow, above the national average but at a lower pace than in Stockholm. Many residents have an immigrant background and almost one-fifth of the population was born outside Sweden. In 1997, over 10% of the labour force was unemployed. However, rates of unemployment have fallen during the last few years due to a greater demand for labour and investment in training. Gothenburg is a leading city for leisure events. Ullevi is Scandinavia's largest outdoor arena for sport and other events, with a capacity of 43,000 seats. Scandinavium is an indoor arena with 12,000 seats hosting events ranging from ice hockey to congresses. Gothenburg is home to several museums, including the Rösska Museum, Sweden's only design, arts and crafts museum, the Art Museum with fine collections of Nordic art, and the Maritime Museum with its Aquarium. The city also holds the Gothenburg Symphony Orchestra, the Gothenburg Opera and several theatres. Swedish municipalities enjoy extensive local governance responsibilities. Within the framework of the Local Government Act, the Gothenburg City Council is responsible for schools, childcare, social services, city planning, local infrastructure (streets, parks, lighting), building permits, health and environment protection. The City Council has a total of 81 elected members. Yearbook: Summary Results 236
6
7 Individual City Audit Summary Gothenburg CITY LEVEL SUB-CITY 1 DATA QUALITY/ Comparison with UA cities 3 COMPARABILITY INDICATORS Score cases 4 Area 1 Area 2 Range/ Ratio 5 DQ6 CNC 7 Total resident population (1996) Population change ( ) (%) Proportion of population less than 16 years old and pp above retirement age (%) (1996) Proportion of non-nationals (%) (1996) Proportion of non-eu nationals (%) (1996) Average size of households (1990) Female activity rate (%) (1996) Proportion of population of working age in employment (%) (1996) Unemployment rate (%) (1996) pp Proportion of unemployed who are less than 25 years N.Av pp old (%) Median weekly household income (1996) (euro, N.Av1 N.Av1 N.Av1 ra prices) Proportion of households receiving less than half of the national average household income (%) N.Av1 21 Proportion of households owning or buying their own dwellings (%) (1990) pp Ratio of average house prices to average annual household income (1996) 5.3:1 18 Life expectancy at birth (years) (1996) N.Av1 N.Av1 N.Av1 ra Total recorded crimes per 1,000 population per year N.Av1 N.Av1 N.Av1 ra (1996) Proportion of employment in manufacturing (%) N.Av1 46 Proportion of employment in services (%) (1996) Employment change (%) ( ) GDP per capita (1996) (euro, 1998 prices) Proportion of registered electorate voting in last municipal election (%) (1994) Proportion of elected city representatives who are women (%) (1994) Annual expenditure by municipality per capita (1995) (euro, 1998 prices) Proportion of students completing compulsory education with minimum qualifications (%) (1996) Scores are provided for two contrasting areas within the city 2 Categories of Not Available: N.Ap: Not applicable; N.Av1: Not available; N.Av2: No approval to publish; N.Av3: Available but the data has not been processed/ purchased for the Urban Audit; N.Av4: Has not been provided in time to be included; N.Av5: Missing for another reason. 3 1,2,3,4,5, reflects the fifth position of the city s relative to the other cities for which information is available (where 29 or more s are available). 1 is the highest and 5 the lowest. 4 Number of cities for which indicator s are available. 5 Results are expressed as percentage point differences (pp) or ratio (ra) of lower to higher s for the two selected sub-areas 6 DQ : Quality of Data : good : adequate 7 CNC : Cross-National Comparability of Data : good :adequate : poor Yearbook: Summary Results for Each City
8 Individual City Audit Summary Gothenburg CITY LEVEL SUB-CITY 1 DATA QUALITY/ Comparison with UA cities 3 COMPARABILITY INDICATORS Score cases 4 Area 1 Area 2 Range/ Ratio 5 DQ6 CNC 7 Total places in crèches (per 1,000 population) (1996) Places in further education and university N.Av1 26 establishments (number per 1000 population) Proportion of male residents qualified at upper secondary education (%) (1996) Proportion of female residents qualified at upper secondary education (%) (1996) Days per year that NO2 concentrations reach 200mg/m³ (1h averaging time) (1996) 1 Proportion of population exposed to outdoor noise N.Av3 12 level above 65 db (24 hr averaging time) (%) Consumption of water (m³ per annum per inhabitant) (1995) 1.27 Total solid waste collected (kg per capita per year) (1996) Proportion of solid waste incinerated and/or recycled (%) (1996) Population density (pop. per km²) (1996) : 1.3 ra Green space to which public has access (sq m per N.Av3 35 N.Av1 N.Av1 N.Av1 ra person) 8 Proportion of journeys to work by public transport (rail/metro/bus/tram) (%) (1996) Total electricity use per person (toe) N.Av1 19 Cinema attendances per resident per year (1996) 3.64 Theatre attendances per resident per year (1996) 1.07 Visitors to museums per resident per year (1996) For city level indicator is in square meters; for sub-city, it is the proportion of area in green space. Yearbook: Summary Results for Each City
Eurostat Yearbook 2006/07 A goldmine of statistical information
 25/2007-20 February 2007 Eurostat Yearbook 2006/07 A goldmine of statistical information What percentage of the population is overweight or obese? How many foreign languages are learnt by pupils in the
NOI ITALIA. 100 STATISTICS TO UNDERSTAND THE COUNTRY WE LIVE IN
 03 May 2012 Data publication office tel. +39 06 4673.3105 Press office tel. +39 06 4673.2243-44 ufficiostampa@istat.it 2012 Edition NOI ITALIA. 100 STATISTICS TO UNDERSTAND THE COUNTRY WE LIVE IN Noi Italia.
Setting up in Denmark
 Setting up in Denmark 1. Denmark and the Danes Denmark is an attractive northern European country that offers many advantages to foreign investors. It is one of the 25 member states of the European Union
ARAGON IN SPAIN AND THE EU.
 166 167 Population; Labour market. Population Total population as of January 1st* Persons 2016 1,318,738 46,445,828 510,284,430 Population density Inhab/Km2 2016 27.6 91.8 114.6 Annual population change
How s Life in Sweden?
 How s Life in Sweden? November 2017 On average, Sweden performs very well across the different well-being dimensions relative to other OECD countries. In 2016, the employment rate was one of the highest
2016 Census Bulletin: Education and Labour
 2016 Census Bulletin: Education and Labour Kingston, Ontario Census Metropolitan Area (CMA) The 2016 Census Day was May 10, 2016. In the fall of 2017, Statistics Canada released various data sets from
Labour Force Structure. Employment. Unemployment. Outside Labour Force Population and Economic Dependency Ratio
 210 Statistical Yearbook of Abu Dhabi 2016 Labour Force. 5 Labour Force Structure Employment Unemployment Outside Labour Force Population and Economic Dependency Ratio Statistical Yearbook of Abu Dhabi
SUMMARY. Migration. Integration in the labour market
 SUMMARY The purpose of this report is to compare the integration of immigrants in Norway with immigrants in the other Scandinavian countries and in Europe. The most important question was therefore: How
Ilze JUREVIČA Ministry of Environmental Protection and Regional Development Regional Policy Department
 Role of small and medium sized urban areas in territorial development: Latvian experience and plans for the upcoming Latvian presidency of the Council of the EU Ilze JUREVIČA Ministry of Environmental
Empirical evidence from the Urban Audit (draft)
") EUROPEAN COMMISSION EUROSTAT Directorate E: Agriculture, fisheries, Structural Funds and environment statistics Unit E-4: Regional accounts Working Party on Regional and Urban Statistics Meeting of 17-19
EUROPEAN COMMISSION EUROSTAT Directorate E: Agriculture, fisheries, Structural Funds and environment statistics Unit E-4: Regional accounts Working Party on Regional and Urban Statistics Meeting of 17-19
Nordic Statistics 2018
 Nordic Statistics 2018 Nordic Statistics 2018 Ed: Ulla Agerskov and Silva Mertsola, Nordic Council of Ministers ANP 2018:819 ISBN 978-92-893-5826-2 (PRINT) ISBN 978-92-893-5827-9 (PDF) ISBN 978-92-893-5828-6
How s Life in Belgium?
 How s Life in Belgium? November 2017 Relative to other countries, Belgium performs above or close to the OECD average across the different wellbeing dimensions. Household net adjusted disposable income
Trends in Labour Supply
 Trends in Labour Supply Ellis Connolly, Kathryn Davis and Gareth Spence* The labour force has grown strongly since the mid s due to both a rising participation rate and faster population growth. The increase
How s Life in the Netherlands?
 How s Life in the Netherlands? November 2017 In general, the Netherlands performs well across the OECD s headline well-being indicators relative to the other OECD countries. Household net wealth was about
Mapping migrants: Australians wide-ranging experiences of immigration
 No. 13 December 2018 Mapping migrants: Australians wide-ranging experiences of immigration Charles Jacobs Mapping migrants: Australians wide-ranging experiences of immigration Charles Jacobs POLICY Paper
A COMPARISON OF ARIZONA TO NATIONS OF COMPARABLE SIZE
 A COMPARISON OF ARIZONA TO NATIONS OF COMPARABLE SIZE A Report from the Office of the University Economist July 2009 Dennis Hoffman, Ph.D. Professor of Economics, University Economist, and Director, L.
Labour market outlook, spring 2018 Summary
 Labour market outlook, spring 2018 Summary Outlook for the labour market 2017 2019 Text Annelie Almérus Håkan Gustavsson Torbjörn Israelsson Andreas Mångs Petra Nyberg Cut-off date for calculations and
QUALITY OF LIFE IN TALLINN AND IN THE CAPITALS OF OTHER EUROPEAN UNION MEMBER STATES
 QUALITY OF LIFE IN TALLINN AND IN THE CAPITALS OF OTHER EUROPEAN UNION MEMBER STATES Marika Kivilaid, Mihkel Servinski Statistics Estonia The article gives an overview of the results of the perception
Measuring Social Inclusion
 Measuring Social Inclusion Measuring Social Inclusion Social inclusion is a complex and multidimensional concept that cannot be measured directly. To represent the state of social inclusion in European
Convergence: a narrative for Europe. 12 June 2018
 Convergence: a narrative for Europe 12 June 218 1.Our economies 2 Luxembourg Ireland Denmark Sweden Netherlands Austria Finland Germany Belgium United Kingdom France Italy Spain Malta Cyprus Slovenia Portugal
How s Life in Germany?
 How s Life in Germany? November 2017 Relative to other OECD countries, Germany performs well across most well-being dimensions. Household net adjusted disposable income is above the OECD average, but household
Goal 11: Make cities and human settlements inclusive, safe, resilient and sustainable
 Target 11.1 By 2030, ensure access for all to adequate, safe and affordable housing and basic services and upgrade slums UDHR, art. 25: (1) Everyone has the right to a standard of living adequate for the
How s Life in Austria?
 How s Life in Austria? November 2017 Austria performs close to the OECD average in many well-being dimensions, and exceeds it in several cases. For example, in 2015, household net adjusted disposable income
Statistics Update For County Cavan
 Social Inclusion Unit November 2013 Key Figures for Cavan Population 73,183 Population change 14.3% Statistics Update For County Cavan Census 2011 Shows How Cavan is Changing Population living in 70% rural
Item No Halifax Regional Council July 19, 2016
 P.O. Box 1749 Halifax, Nova Scotia B3J 3A5 Canada Item No. 14.4.1 Halifax Regional Council July 19, 2016 TO: SUBMITTED BY: Mayor Savage and Members of Halifax Regional Council Original Signed Councillor
Verdun borough HIGHLIGHTS. In 1996, the Verdun borough had a population of 59,714. LOCATION
 Socio-economic profile borough February 2002 HIGHLIGHTS In 1996, the borough had a population of 59,714. LOCATION Between 1991 and 1996, the population of the borough declined by 2.6%. One-person households
Corporate. Report COUNCIL DATE: April 28, 2008 NO: R071 REGULAR COUNCIL. TO: Mayor & Council DATE: April 28, 2008
 Corporate NO: R071 Report COUNCIL DATE: April 28, 2008 REGULAR COUNCIL TO: Mayor & Council DATE: April 28, 2008 FROM: General Manager, Planning and Development FILE: 6600-01 SUBJECT: 2006 Census Information
How s Life in Estonia?
 How s Life in Estonia? November 2017 Relative to other OECD countries, Estonia s average performance across the different well-being dimensions is mixed. While it falls in the bottom tier of OECD countries
Social Conditions in Sweden
 Conditions in Sweden Villa Vigoni Conference on Reporting in Europe Measuring and Monitoring Progress in European Societies Is Life Still Getting Better? March 9-11, 2010 Danuta Biterman The National Board
Country Reports Nordic Region. A brief overview about the Nordic countries on population, the proportion of foreign-born and asylum seekers
 Country Reports Nordic Region A brief overview about the Nordic countries on population, the proportion of foreign-born and asylum seekers Nordic collaboration for integration of refugees and migrants
How s Life in France?
 How s Life in France? November 2017 Relative to other OECD countries, France s average performance across the different well-being dimensions is mixed. While household net adjusted disposable income stands
1. Economy. Economic Aggregates. Foreign Trade. Prices. Financial Statistics. Government Finance. Wages and Compensation. Foreign Investment
 1. Economy Economic Aggregates Foreign Trade Prices Financial Statistics Government Finance Wages and Compensation Foreign Investment GDP at Current Prices, Abu Dhabi Emirate, 2014* Non-oil GDP 952,676
Income. If the 24 southwest border counties were a 51 st state, how would they compare to the other 50 states? Population
 Executive Summary At the Cross Roads: US / Mexico Border Counties in Transition If the 24 southwest border counties were a 51 st state, how would they compare to the other 50 states? In 1998, former Texas
How s Life in Australia?
 How s Life in Australia? November 2017 In general, Australia performs well across the different well-being dimensions relative to other OECD countries. Air quality is among the best in the OECD, and average
How s Life in Portugal?
 How s Life in Portugal? November 2017 Relative to other OECD countries, Portugal has a mixed performance across the different well-being dimensions. For example, it is in the bottom third of the OECD in
How s Life in Ireland?
 How s Life in Ireland? November 2017 Relative to other OECD countries, Ireland s performance across the different well-being dimensions is mixed. While Ireland s average household net adjusted disposable
City of Greater Dandenong Our People
 City of Greater Dandenong Our People 2 City of Greater Dandenong Our People Contents Greater Dandenong people 4 Greater Dandenong people statistics 11 and analysis Population 11 Age 12 Unemployment Rate
HIGHLIGHTS. There is a clear trend in the OECD area towards. which is reflected in the economic and innovative performance of certain OECD countries.
 HIGHLIGHTS The ability to create, distribute and exploit knowledge is increasingly central to competitive advantage, wealth creation and better standards of living. The STI Scoreboard 2001 presents the
RIS 3 Sicily SICILY IN PILLS
 RIS 3 Sicily 2014-2020 SICILY IN PILLS FARO, Portugal, July 4th 2013 Sicily is the largest Italian region, with a surface of 8,5% of the whole national territory. It is the fourth most populated region
POPULATION # JÖNKÖPING COUNTY
 Share POPULATION # Population change 28-217 Population by age 217 3 32 3 347 34 342 34 337 33 332 33 28 21 212 214 21 1 2 3 4 7 8 9 1+ Age Population december 217 Population change after 28 Age shares
CANARY ISLANDS HEADLINE ECONOMIC INDICATORS
 29/07/2014 CANARY ISLANDS HEADLINE ECONOMIC INDICATORS 6 6 May 2016 Viceconsejería de Economía y Asuntos Económicos con la UE Department for Economy and European Economic Affairs CANARY ISLANDS HEADLINE
How s Life in Hungary?
 How s Life in Hungary? November 2017 Relative to other OECD countries, Hungary has a mixed performance across the different well-being dimensions. It has one of the lowest levels of household net adjusted
London Measured. A summary of key London socio-economic statistics. City Intelligence. September 2018
 A summary of key socio-economic statistics September 2018 People 1. Population 1.1 Population Growth 1.2 Migration Flow 2. Diversity 2.1 Foreign-born ers 3. Social Issues 3.1 Poverty & Inequality 3.2 Life
How s Life in Poland?
 How s Life in Poland? November 2017 Relative to other OECD countries, Poland s average performance across the different well-being dimensions is mixed. Material conditions are an area of comparative weakness:
2. Challenges and Opportunities for Sheffield to 2034
 2. T he future presents many opportunities for Sheffield, yet there are also a number of challenges our city is facing. Sheffield is widely connected to the rest of the country and the world and, therefore,
11. Demographic Transition in Rural China:
 11. Demographic Transition in Rural China: A field survey of five provinces Funing Zhong and Jing Xiang Introduction Rural urban migration and labour mobility are major drivers of China s recent economic
Fiscal Impacts of Immigration in 2013
 www.berl.co.nz Authors: Dr Ganesh Nana and Hugh Dixon All work is done, and services rendered at the request of, and for the purposes of the client only. Neither BERL nor any of its employees accepts any
Spain s average level of current well-being: Comparative strengths and weaknesses
 How s Life in Spain? November 2017 Relative to other OECD countries, Spain s average performance across the different well-being dimensions is mixed. Despite a comparatively low average household net adjusted
2018 BAVARIA S ECONOMY FACTS AND FIGURES
 Bavarian Ministry of Economic Affairs, Energy and Technology 2018 BAVARIA S ECONOMY FACTS AND FIGURES wwwstmwibayernde As of August 2018 Area Population (3006) 1) females males age 0-14 (3112) 15-64 65+
How s Life in Turkey?
 How s Life in Turkey? November 2017 Relative to other OECD countries, Turkey has a mixed performance across the different well-being dimensions. At 51% in 2016, the employment rate in Turkey is the lowest
Dufferin Grove: Neighbourhood Profile
 I. Population and Age Population 21 Neighbourhood Population: 12693 12% of Catchment Area Population: Change in population growth (1996-21): # 145 % 1% same as pop change in the catchment area Population
Spain PROMISE (GA693221)
") Spain Population 46.443.959 Population aged 15-29 years old 14,7% Population aged 65 years old and above 19,2% Birth Rate 9,0 International migrant stock as a percentage of the 12,7% total population PROMISE
Spain Population 46.443.959 Population aged 15-29 years old 14,7% Population aged 65 years old and above 19,2% Birth Rate 9,0 International migrant stock as a percentage of the 12,7% total population PROMISE
Social Inequalities in Finland. Harri Melin Department of Social Research University of Tampere
 Social Inequalities in Finland Harri Melin Department of Social Research University of Tampere The case of Finland 5,3 milj. inhabitants Homogenous population: 2,5% immigrants, roma people 8 000, Same
Population and Dwelling Counts
 Release 1 Population and Dwelling Counts Population Counts Quick Facts In 2016, Conception Bay South had a population of 26,199, representing a percentage change of 5.4% from 2011. This compares to the
LANDMARKS ON THE EVOLUTION OF E-COMMERCE IN THE EUROPEAN UNION
 Studies and Scientific Researches. Economics Edition, No 21, 215 http://sceco.ub.ro LANDMARKS ON THE EVOLUTION OF E-COMMERCE IN THE EUROPEAN UNION Laura Cătălina Ţimiraş Vasile Alecsandri University of
Italy s average level of current well-being: Comparative strengths and weaknesses
 How s Life in Italy? November 2017 Relative to other OECD countries, Italy s average performance across the different well-being dimensions is mixed. The employment rate, about 57% in 2016, was among the
QUALITY OF LIFE HEALTH
 QUALITY OF LIFE HEALTH QUALITY Health OF LIFE EXPECTANCY Life expectancy at birth remains one of the most frequently quoted indicators of health status. Gains in life expectancy in OECD countries in recent
Chapter 18: Development and Globalization Section 1
 Chapter 18: Development and Globalization Section 1 Objectives 1. Understand what is meant by developed nations and less developed countries. 2. Identify the tools used to measure levels of development.
How s Life in Iceland?
 How s Life in Iceland? November 2017 In general, Iceland performs well across the different well-being dimensions relative to other OECD countries. 86% of the Icelandic population aged 15-64 was in employment
How s Life in New Zealand?
 How s Life in New Zealand? November 2017 On average, New Zealand performs well across the different well-being indicators and dimensions relative to other OECD countries. It has higher employment and lower
Creative Age Management Strategies for SMEs in the Baltic Sea Region. Annex 1: Country Studies ESTONIA. Carola Newiger-Bogumil
 Creative Age Management Strategies for SMEs in the Baltic Sea Region Annex 1: Country Studies ESTONIA Carola Newiger-Bogumil Creative Age Management Strategies for SMEs in the Baltic Sea Region Annex
How s Life in the United Kingdom?
 How s Life in the United Kingdom? November 2017 On average, the United Kingdom performs well across a number of well-being indicators relative to other OECD countries. At 74% in 2016, the employment rate
Poverty Profile. Executive Summary. Kingdom of Thailand
 Poverty Profile Executive Summary Kingdom of Thailand February 2001 Japan Bank for International Cooperation Chapter 1 Poverty in Thailand 1-1 Poverty Line The definition of poverty and methods for calculating
Korea s average level of current well-being: Comparative strengths and weaknesses
 How s Life in Korea? November 2017 Relative to other OECD countries, Korea s average performance across the different well-being dimensions is mixed. Although income and wealth stand below the OECD average,
THE INDICATORS FOR SUSTAINABLE DEVELOPMENT:
 JULY 6, 2018 THE INDICATORS FOR SUSTAINABLE DEVELOPMENT: GENERAL FRAMEWORK 1.1 The Sustainable Development Goals (SDGs) On 25 September 2015, the UN-Assembly General adopted the 2030 Agenda for sustainable
How s Life in Finland?
 How s Life in Finland? November 2017 In general, Finland performs well across the different well-being dimensions relative to other OECD countries. Despite levels of household net adjusted disposable income
People. Population size and growth. Components of population change
 The social report monitors outcomes for the New Zealand population. This section contains background information on the size and characteristics of the population to provide a context for the indicators
PREVENTION OF GROWING SOCIO-CULTURAL DISPARITIES IN THREE DIFFERENT REGIONS OF LITHUANIA
 PREVENTION OF GROWING SOCIO-CULTURAL DISPARITIES IN THREE DIFFERENT REGIONS OF LITHUANIA Liudas MAZYLIS 1, Regina JASIULEVICIENE 2, Ilona SVIRSKAITE 3, Rytis BULOTA 4, Nerijus PREKEVICIUS 5, Ingrida UNIKAITE
Community Social Profile Cambridge and North Dumfries
 Community Trends for 2013 in Cambridge, North Dumfries, Wellesley, Wilmot and Woolwich Community Social Profile - Cambridge and North Dumfries Published December 2014 Community Social Profile Cambridge
EUROBAROMETER 72 PUBLIC OPINION IN THE EUROPEAN UNION
 Standard Eurobarometer European Commission EUROBAROMETER 72 PUBLIC OPINION IN THE EUROPEAN UNION AUTUMN 2009 Standard Eurobarometer 72 / Autumn 2009 TNS Opinion & Social NATIONAL REPORT EXECUTIVE SUMMARY
How s Life in Norway?
 How s Life in Norway? November 2017 Relative to other OECD countries, Norway performs very well across the OECD s different well-being indicators and dimensions. Job strain and long-term unemployment are
Queensland s Labour Market Progress: A 2006 Census of Population and Housing Profile
 Queensland s Labour Market Progress: A 2006 Census of Population and Housing Profile Issue No. 9 People in Queensland Labour Market Research Unit August 2008 Key Points Queensland s Labour Market Progress:
Global Employment Trends for Women
 December 12 Global Employment Trends for Women Executive summary International Labour Organization Geneva Global Employment Trends for Women 2012 Executive summary 1 Executive summary An analysis of five
How s Life in Greece?
 How s Life in Greece? November 2017 Relative to other OECD countries, Greece has a mixed performance across the different well-being dimensions. Material conditions in Greece are generally below the OECD
UNITED NATIONS POPULATION FUND CARIBBEAN SUB-REGION
 UNITED NATIONS POPULATION FUND CARIBBEAN SUB-REGION COUNTRY PROFILE: TRINIDAD AND TOBAGO OVERVIEW The twin island Republic of Trinidad and Tobago is located in the Southern Caribbean, just off the cost
How s Life in Canada?
 How s Life in Canada? November 2017 Canada typically performs above the OECD average level across most of the different well-indicators shown below. It falls within the top tier of OECD countries on household
THE IMPACT OF IMMIGRATION ON ENGLAND S HOUSING
 Briefing Paper 7.2 www.migrationwatchuk.org THE IMPACT OF IMMIGRATION ON ENGLAND S HOUSING Summary 1. Every few years the Government produces projections of the number of households in England which help
How s Life in the Slovak Republic?
 How s Life in the Slovak Republic? November 2017 Relative to other OECD countries, the average performance of the Slovak Republic across the different well-being dimensions is very mixed. Material conditions,
Republic of Estonia. Action Plan for Growth and Jobs for the implementation of the Lisbon Strategy
 Republic of Estonia Action Plan for Growth and Jobs 2008 2011 for the implementation of the Lisbon Strategy Tallinn October 2008 CONTENTS CONTENTS...2 INTRODUCTION...3 1. BRIEF ANALYSIS OF THE COMPONENTS
Dobwalls and Trewidland Neighbourhood Development Plan: section 3. Evidence Base document - fourth draft September 2018
 Dobwalls and Trewidland Neighbourhood Development Plan: section 3 Economy and Jobs Evidence Base document - fourth draft September 2018 Contents Introduction Purpose of this Evidence Base report Themes
2018 Greater Vancouver Economic Scorecard. Dr. Daniel F. Muzyka Immediate Past President and Chief Executive Officer The Conference Board of Canada
 2018 Greater Vancouver Economic Scorecard Dr. Daniel F. Muzyka Immediate Past President and Chief Executive Officer The Conference Board of Canada Agenda Regional scorecard purpose Scorecard results Greater
Socio-Economic Profile
 LOCAL HEALTH AREA 7 - Socio-Economic Profile Powell River Comox Cumberland Denman Island Hornby Island Qualicum CENSUS POPULATION LAND AREA POPULATION DENSITY Number % of Region Sq. Km. % of Region Persons
Norwegian Ministries. Immigration and Integration Report for Norway
 Norwegian Ministries Immigration and Integration 2016 2017 Report for Norway 2 Prepared by Espen Thorud Member of the OECD Expert Group on Migration for Norway With substantial contributions from and in
COUNTRY REPORT. by Andrei V. Sonin 1 st Secretary, Ministry of Foreign Affairs
 Regional Workshop on Capacity-Building in Governance and Public Administration for Sustainable Development Thessaloniki, 29-31 July 2002 Ladies and Gentlemen, Dear colleagues, COUNTRY REPORT B E L A R
Vulnerability Assessment Framework
 Vulnerability Assessment Framework JORDAN RESPONSE PLAN Key findings June 2015 Developed under an interagency steering committee, including 5 NGOs, 5 UN agencies, BPRM and ECHO Refugees Outside of Camps
How s Life in the Czech Republic?
 How s Life in the Czech Republic? November 2017 Relative to other OECD countries, the Czech Republic has mixed outcomes across the different well-being dimensions. Average earnings are in the bottom tier
IT S YOUR AREA. what s important? TALYBOLION AREA. WELL-BEING ASSESSMENT GWYNEDD AND MÔN Gwynedd and Môn Public Services Board
 IT S YOUR AREA. what s important? TALYBOLION AREA WELL-BEING ASSESSMENT GWYNEDD AND MÔN Gwynedd and Môn Public Services Board 2016 well-being assessment Gwynedd WANT to HAVE YOUR SAY? and Môn The new act
EUROBAROMETER 71 PUBLIC OPINION IN THE EUROPEAN UNION SPRING
 Standard Eurobarometer European Commission EUROBAROMETER 71 PUBLIC OPINION IN THE EUROPEAN UNION SPRING 2009 Standard Eurobarometer 71 / SPRING 2009 TNS Opinion & Social Standard Eurobarometer NATIONAL
IMPLICATIONS OF THE EUROPEAN UNION ENLARGEMENT: THE QUESTION OF MINIMUM LEVEL OF SERVICES OF GENERAL INTEREST
 APEBH Conference 2014, Hamilton, New Zealand, February 13-15, 2014 IMPLICATIONS OF THE EUROPEAN UNION ENLARGEMENT: THE QUESTION OF MINIMUM LEVEL OF SERVICES OF GENERAL INTEREST Prof.Dr. Daniela-Luminita
Challenges for Europe
 Challenges for Europe This page intentionally left blank Challenges for Europe Edited by Hugh Stephenson Centre for Economic Performance London School of Economics and Political Science Editorial matter
How s Life in Switzerland?
 How s Life in Switzerland? November 2017 On average, Switzerland performs well across the OECD s headline well-being indicators relative to other OECD countries. Average household net adjusted disposable
IT S YOUR AREA. what s important? lligwy and twrcelyn AREA. WELL-BEING ASSESSMENT GWYNEDD AND MÔN Gwynedd and Môn Public Services Board
 IT S YOUR AREA. what s important? lligwy and twrcelyn AREA WELL-BEING ASSESSMENT GWYNEDD AND MÔN Gwynedd and Môn Public Services Board 2016 well-being assessment Gwynedd WANT to HAVE YOUR SAY? and Môn
Increasing Labour Supply through Economic Migration Statements and Comments
 Increasing Labour Supply through Economic Migration Statements and Comments Donald Storrie Centre of European Labour Market Studies (CELMS) Part 1: A brief assessment of the policy context, economic circumstances
Hessisches Statistisches Landesamt. Hesse in figures
 Hessisches Statistisches Landesamt Hesse in figures Edition 2013 Population and Area Population (31.12.) 2011 2012 TOTAL 5 993 771 6 016 481 100 Male 2 928 449 2 943 855 48.9 Female 3 065 322 3 072 626
Statistics on offences and coercive methods
 Justice 2016 Statistics on and coercive methods Offences known to the authorities 2015 Drunken driving caused by narcotic substances increased by 19.7 per cent According to Statistics Finland's data, a
Estonia. Source:
 ESTONIA * 1. DEVEOPMENT DISPARITIES AND ISSUES A stable macro-economic framework, rapid privatisation and other market economy reforms have led to a generally favourable economic environment in Estonia.
European Parliament Eurobarometer (EB79.5) ONE YEAR TO GO UNTIL THE 2014 EUROPEAN ELECTIONS Institutional Part ANALYTICAL OVERVIEW
 ONE YEAR TO GO UNTIL THE 2014 EUROPEAN ELECTIONS Institutional Part ANALYTICAL OVERVIEW") Directorate-General for Communication Public Opinion Monitoring Unit Brussels, 21 August 2013. European Parliament Eurobarometer (EB79.5) ONE YEAR TO GO UNTIL THE 2014 EUROPEAN ELECTIONS Institutional
Directorate-General for Communication Public Opinion Monitoring Unit Brussels, 21 August 2013. European Parliament Eurobarometer (EB79.5) ONE YEAR TO GO UNTIL THE 2014 EUROPEAN ELECTIONS Institutional
Chile s average level of current well-being: Comparative strengths and weaknesses
 How s Life in Chile? November 2017 Relative to other OECD countries, Chile has a mixed performance across the different well-being dimensions. Although performing well in terms of housing affordability
2 Finnish society and religion basic facts
 2 Finnish society and religion basic facts 23 The position and significance of religious communities in society depend on many historic, societal and legal factors. This chapter gives the background for
Population 1 January 1999 Harju county Persons Share of total *EU15:1997
 ESTONIA HARJU COUNTY Population density Land use Harju EU15* Number of weekly flights (11/1999) to (persons/km ) 124 1999 (%) county Nordic countries 103 Farm lands 28 44 Transition countries 40 Wooded