CHAPTER-V INTERNAL MIGRATION IN INDIA: A DISTRICT LEVEL ANALYSIS
|
|
|
- Frederica Wilkinson
- 5 years ago
- Views:
Transcription
1 CHAPTER-V INTERNAL MIGRATION IN INDIA: A DISTRICT LEVEL ANALYSIS 76
2 Chapter 5 Internal Migration in India: A District Level Analysis 5.1. Introduction: In the preceding chapter a detailed account of the nature and level of internal migration in India, both at the aggregate and at state level, has already been presented. The discussion was based on Census as well as NSSO data. As already discussed, barely 17 percent of the male population in India is classified as migrants as per 2001 census. The NSSO data revealed even a lower mobility among male in the year In other words, more than eight-tenth of male population in the country is still immobile. The underlying reasons for such a low rate of mobility in the country have already been examined in the chapter. Population mobility in the country is marked with significant variation across states. It may be recalled that lifetime migrants constitute a sizeable proportion in the high income states, which include Maharashtra, Gujarat and Punjab etc. The low income states, on the other hand, have been characteristically out-migrating states. This is manifest in net- migration at state level. In continuation, therefore, the present chapter endeavours to present an account of spatial patterns in the nature and rate of mobility in India based on district level data. As already known, internal migration includes movements both within states and between states. While the former refers to intra-state category, the latter pertains to inter-state migration. While analyzing the spatial patterns in the rate of mobility intra-state migration is further classified into intra-district and inter-district categories. The discussion begins with an account of lifetime migrants as percentage to total population. This is followed by description of the share of inter-censal migrants (i.e. those who have moved after census taking in 1991) in total lifetime migrants at district level. Thereafter, patterns in various streams and distance categories of migration at district level have been examined. Census of India 2001 now enables us to work out net migration at district level for the period between 1991 and Taking advantage of this, the chapter also provides an account of intercensal net migration at district level. 127
3 5.2. Spatial Patterns in Mobility: Life Time Migrants: Table 5.1 presents the distribution of districts in various categories on the basis of percentage share of internal lifetime male migrants as per 2001 census. Separate figures are given for all the states taken into account. It may be noted that, as many as 283 districts that accounts for nearly six-tenths of the total, report less than 16 percent of its population as lifetime migrants. Table: 5.1 Distribution of Districts by proportion of Lifetime Male Migrants, 2001 Lifetime Male Migrants as percentage to Male Population States and below and Total above Himachal Pradesh 0(0) 5(41.67) 3(25) 4(33.33) 0(0) 12 Punjab 0(0) 6(35.29) 7(41.18) 3(17.65) 1(5.88) 17 Uttaranchal 0(0) 5(38.46) 5(38.46) 1(7.69) 2(15.39) 13 Haryana 1(5.26) 6(31.58) 10(52.64) 1(5.26) 1(5.26) 19 Rajasthan 12(37.50) 17(53.13) 2(6.25) 1(3.12) 0(0) 32 Uttar Pradesh 51(72.86) 15(21.43) 2(2.85) 2(2.86) 0(0) 70 Bihar 36(97.30) 1(2.70) 0(0) 0(0) 0(0) 37 West Bengal 2(11.11) 9(50.00) 6(33.33) 1(5.56) 0(0) 18 Jharkhand 12(66.67) 2(11.11) 4(22.22) 0(0) 0(0) 18 Orissa 7(23.33) 14(46.67) 8(26.67) 1(3.33) 0(0) 30 Chhattisgarh 0(0) 11(68.75) 3(18.75) 2(12.50) 0(0) 16 Madhya Pradesh 8(17.78) 30(66.67) 5(11.11) 2(4.44) 0(0) 45 Gujarat 1(4.00) 4(16.00) 12(48.00) 4(16.00) 04(16.00) 25 Maharashtra 0(0) 2(5.71) 10(28.57) 13(37.15) 10(28.57) 35 Andhra Pradesh 0(0) 8(34.78) 11(47.82) 2(8.70) 2(8.70) 23 Karnataka 0(0) 10(37.04) 10(37.04) 5(18.52) 2(7.40) 27 Kerala 0(0) 2(14.29) 6(42.86) 4(28.57) 2(14.28) 14 Tamil Nadu 1(3.33) 5(16.67) 18(60.00) 4(13.33) 2(6.67) 30 Total Districts Note: Figures in parentheses are percentage share of districts under different categories to the total in respective states. Source: Based on Census of India (2001), Migration Table (D-01 and D-02). 128
4 It is only in 76 districts that report mobility rate among male population that is more than 24 percent. The distribution of districts across states by levels of mobility clearly reveals a positive association between rate of mobility and levels of development. In case of low income states, districts are concentrated at the lower end of the class while the converse is true for high income states. In Bihar, for instance, none of the districts reports a mobility rate of 16 percent and more. Jharkhand, Chhattisgarh, Uttar Pradesh and Rajasthan are only marginally better than Bihar. On the other extreme, high income states like Gujarat, Maharashtra, Punjab etc. report a significant number of districts in higher category on the basis of rate of mobility. Remarkably, as many as 35 out of 76 districts with mobility rate above 24 percent come from these three states. It is also important to note that among the southern states also a sizeable number of districts can be seen on higher side of mobility rate. The spatial patterns in mobility among male population as per 2001 census have been shown in Fig.5.1. In general, in the southern peninsula mobility rate is higher than that in the north. In the north, however, patches of relatively higher mobility rate can be seen over parts of Punjab, Haryana, Himachal Pradesh, Uttaranchal and around the national capital territory of Delhi. The northern part of Rajasthan particularly along the IndiraGandhiCanal also shows somewhat higher rate of mobility. Barring these pockets in the north, rest of Rajasthan, much of Madhya Pradesh, Uttar Pradesh, whole of Bihar and a greater part of Jharkhand report low to very low mobility of population. As is obvious, this belt of low mobility is spread over the entire west to east breadth of the country. It, however, does not mean that low mobility rate is not encountered in southern peninsula. There are pockets of low mobility in southern states also but their spatial extent is much limited. As contrary to low mobility in the north, the southern states report a higher mobility. Districts lying along the western coast in Maharashtra, Karnataka and Kerala report high to very high mobility in population. In fact this belt extends towards north up to the central parts of Gujarat. This belt of high to very high mobility in population coincides with the industrial belt running in north-south direction from Mumbai/ Thane to Surat/ Ahmedabad through Vadodra. In this region, the largest share of lifetime migrants is found in Thane district. Other prominent districts with very high mobility in this belt 129
5 are Surat, Mumbai Suburban, Pune, Mumbai, Gandhinagar, Valsad and Ahmedabad. In the north, Panchkula in Haryana, Nainital and Dehradun in Uttaranchal and Ludhiana in Punjab also report very high mobility as seen in a very large share of lifetime migrants. Along the eastern coast, scattered patches of high mobility can be seen in Tamil Nadu, Andhra Pradesh and Orissa. In the interior peninsula high to very high mobility rate can be seen in and around the centres of industrial activities or administrative headquarters for instance Banglore (now Bengaluru) in Karnataka, Hyderabad in Andhra Pradesh, Bhopal in Madhya Pradesh, Nashik, Sholapur, Amravati, Akola etc in Maharashtra etc. It is clear from the data that migrants are attracted towards industrially developed districts. In addition, they are also attracted to districts with large urban centres of administrative and commercial activities. Very low proportion of lifetime migrants is found in Sheohar, Madhepura, Sitamarhi, Vaishali and Gopalganj districts of Bihar, and Budaun district of Uttar Pradesh. Districts like Thane and Mumbai attract more migrants because of their potential in absorbing semi-skilled and unskilled migrants from other areas. It is important to note that most of these migrants are from the major sending states like, Uttar Pradesh and Bihar. The state of Uttar Pradesh accounts for the largest share among inter-state migrants in Maharashtra. Although, in part this is due to its rank in terms of its absolute size of population in the country, the fact that lack of enough employment opportunities pushes the unemployed chunk to migrate to greener areas. Migrants as well locals have setup their business activities which are instrumental in generating employment opportunities for number of migrants as well as to the non migrants (Singh, 2010: 206). Neighbouring states of Gujarat and Karnataka follow partly due to historical ties (Mukherji and Phadke, 2009: 128). Moreover, evidences also indicate that migrants have moved to Gujarat from Mumbai and Mumbai Suburbandistricts either for employment or for marriage purpose. In addition, many migrants might have moved to Gujarat due to the increasing pressure of antimigration movement started during eighties by regional political parties as well as better business environment created in the state (Singh, 2010: 203). 130
6 131
7 Inter-censal Migrants: A discussion on the share of inter-censal migrants in the lifetime migrants shed some valuable insight in the recent changes in spatial mobility of population in an area. Table 5.2 shows the distribution of districts on the basis of share of inter-censal migrants in the lifetime migrants as per 2001 census. As already discussed in the previous chapter, of total lifetime migrants in the country, more than one third moved only during the intervening period of 1991 and 2001 censuses. It has also been noted that the largest share of inter-censal migrants are recorded in Himachal Pradesh, Haryana, Rajasthan and Uttaranchal in that order. As Table 5.2 reveals, as many as 52 out of 99 districts with a share of more than 45 percent are from these four states alone. In terms of the picture at district level, it may be seen that the highest percentage of migrants is found in Kinnaur district of Himachal Pradesh. Himachal Pradesh has recently emerged as a fast growing economy. The state has benefited from programmes related with Hill Area Development. Agriculture and Horticulture in the state have witnessed significant progress during the recent past. The state has made significant achievements in the field of industrialization in the past few years. With the ushering in the liberalized economy and consequent delicensing and notification of special package of incentives for the State, the flow of investment has increased manifold resulting in the setting up of new industries in the state (Himachal Pradesh Development Report, 2011: 275). A very large share of inter-censal migrants in the state therefore can be attributed to forces unleashed in the wake of transformation of the spatial structure of economy. In the post green revolution era in Haryana, for intensive cultivation of crops, the farmers of the state largely depend on the migrant labours for various agricultural operations. Studies based on census data for various years show that Punjab and Haryana are the states where share of inter-state migrants has been significantly higher in the past (e.g. see Kshisagar, 1973; Datta, 1996 and 2001; Bhutani, 1995; Kaur, 2002 and Hassan, 2005). The spatial pattern in mobility among male migrants as per 2001 census have been shown in figure 5.2. The spatial pattern in case of inter-censal migrants is strikingly different from that of lifetime migrants as discussed already above. As could be seen in the map, along with the states of Himachal Pradesh, Uttaranchal and 132
8 Haryana in the north, the western and central parts of the country are marked with high to very high share of inter-censal migrants in the lifetime migrants. It covers all the districts of Himachal Pradesh, Haryana excepting its north-western parts (Fatehabad and Sirsa districts), Uttaranchal except Dehradun, Hardwar and Udham Singh Nagar districts, whole of Rajasthan barring some districts situated in its northern and eastern regions along with the coastal districts in Maharashtra and Karnataka. Table: 5.2 Distribution of Districts by Inter-censal Male Migrants in India, 2001 Inter Censal Male Migrants as percentage to Lifetime Male Migrants States and and below above Total Himachal Pradesh 0(0) 0(0) 0(0) 0(0) 12(100) 12 Punjab 9(52.94) 5(29.42) 2(11.76) 1(5.88) 0(0) 17 Uttaranchal 0(0) 3(23.08) 0(0) 2(15.38) 8(61.54) 13 Haryana 0(0) 0(0) 2(10.53) 3(15.79) 14(73.68) 19 Rajasthan 1(3.13) 2(6.25) 3(9.37) 8(25.00) 18(56.25) 32 Uttar Pradesh 53(75.71) 10(14.28) 3(4.29) 3(4.29) 1(1.43) 70 Bihar 18(48.65) 14(37.84) 2(5.41) 2(5.40) 1(2.70) 37 West Bengal 9(50.00) 6(33.33) 2(11.11) 1(5.56) 0(0) 18 Jharkhand 4(22.22) 3(16.67) 5(27.78) 4(22.22) 2(11.11) 18 Orissa 5(16.67) 7(23.33) 9(30.00) 5(16.67) 4(13.33) 30 Chhattisgarh 0(0) 1(6.25) 4(25.00) 6(37.50) 5(31.25) 16 Madhya Pradesh 0(0) 1(2.22) 8(17.78) 19(42.22) 17(37.78) 45 Gujarat 3(12.00) 4(16.00) 6(24.00) 8(32.00) 4(16.00) 25 Maharashtra 0(0) 5(14.29) 5(14.29) 15(42.85) 10(28.57) 35 Andhra Pradesh 3(13.04) 7(30.43) 6(26.09) 7(30.44) 0(0) 23 Karnataka 2(7.41) 3(11.11) 12(44.44) 7(25.93) 3(11.11) 27 Kerala 2(14.29) 4(28.57) 4(28.57) 4(28.57) 0(0) 14 Tamil Nadu 30(100) 0(0) 0(0) 0(0) 0(0) 30 Total Districts Note: Figures in parentheses are percentage share of districts under different categories to the total in respective states. Source: Based on Census of India (2001), Migration Table (D-02). 133
9 134
10 Remarkably the incidence of greater inter-censal mobility is more conspicuous in the western parts as compared to its counterpart in the central region. In the latter, pockets of high to very high rate of inter-censal mobility is interrupted by the presence of districts with low to very low rates. By contrast, almost the whole of Ganga plains and Punjab in the north as well as whole of Tamil Nadu on the peninsula report low and very low rate of inter-censal mobility Net Migration: In any discussion on spatial mobility based on census data it is quite customary to examine net migration i.e. the balance between in-migration and out-migration at least at the state level for which data are readily available. A discussion on the same at state level has already been presented in the preceding chapter. The 2001 census enables us to examine net migration for the first time at district level also. But this is possible only for inter-censal migration only. The present section is devoted to this aspect. It is obvious that the nature and patterns in net migration in a region reflects the nexus between economic forces and spatial redistribution of population. As already seen in the previous chapter, on the basis of net migration during the decade , Maharashtra occupies the top position in the country with 1.5 million net migrants, followed by Gujarat (0.48 million) and Haryana (0.37 million) as per 2001 Census.Among the other gaining states Punjab, Karnataka and Himachal Pradesh occupy significant positions. On the other extreme, the states of Uttar Pradesh and Bihar occupy the first positions in terms of net loss to population through migration. The net loss through migration in the two states is of tune of 1.7 million and 1.3 million. The other backward states of Rajasthan, Madhya Pradesh, Chhattisgarh and Orissa etc. have experienced loss to their population through more of out-migration as compared to in-migration. Along with these, most of the southern states barring only Karnataka have also witnessed net loss during When analysed at district level, as many as 346 districts from the study area seem to have gained through inter-censal migration between 1991 and In other words a total of 135 districts have lost their population through excess of outmigration over in-migration during the inter-censal period (Table 5.3). It may be 135
11 noted here that district level estimate of net inter-censal migration has been obtained from a 593 by 593 (this number correspond to the total number of districts that existed at the time of 2001 census) matrix of in-migration and out-migration. From among the gaining districts, in 36 districts the gain is of the order of more than one lakh. This accounts for over one-tenth of the total male population in these districts at the time of 2001 census. Among the 481 districts spread over 18 major states, it is Thane in Maharashtra that occupies the first place in terms of the absolute size of gain (over 11 lakh) through inter-censal migration. In fact, Thane is fast emerging as attractive new focal point for in-migrants. The decadal rate of growth in population in Thane during is as high as percent, which is the fastest growth in population recorded by ay district among the major states. Population growth in Thane district cannot be seen in isolation rather it is linked to redistribution of population from the mega city of Mumbai. At the time of 2001 census the size of population in Thane was eight million plus, and much of the growth in population of Thane during was a result of Mumbai pushing people to Thane. In addition, many new prospective migrant chose Thane, and also other nearby places, instead of Mumbai city because the latter has become less attractive in terms of relatively fewer job opportunities coupled with high rental values, an overstretched infrastructure and a poor quality of life that is getting increasingly expensive. (Times of India: Bombay Times, Feb 27, 2002). According to Gupta and Yesudian (2006) large number of migrants living in Mumbai have moved to adjoining districts including Thane due to development of housing complexes as well as employment opportunities there (Quoted in Singh, 2010: 217). The other districts in Maharashtra which have recorded substantial gain through inter-censal migration are Pune, Mumbai Suburban and Nashik. All these are characterized by the presence of large urban agglomerations. Just as in the case of Thane, high rate of growth in population of Pune is not due to natural growth alone, but due to heavy in-migration of people in large numbers from both within the state as well as from outside the state. The Pune city has good job opportunities. The city has witnessed tremendous expansion of IT sector during the recent past. Several multinational companies have set up their offices in the city. Thus, Industrial growth in information technology and the coming of multinational companies has attracted 136
12 talent here which is one reason for the rapid growth in population. The largest size of migrants to Mumbai Suburban has come from the districts of Ratnagiri, Satara and Pune (within the state i.e. intra-state level) and from Jaunpur, Azamgarh, Basti, Siddartha Nagar, Allahabad and Varanasi districts located in the eastern parts of Uttar Pradesh (from across the state boundary i.e. inter-state level). It is observed that migrants who come to Mumbai are generally low skilled labourers who help in infrastructural development of city by providing cheap labour as well as generate work and employment for others in the social service sector including hotel and entertainment industry (Singh, 2010: 200). Similarly, Nashik district has also come up with good infrastructure during the recent past, and the district will need more industrial growth in future to boost its employment potential. Outside Maharashtra, next only to Thane and Mumbai Suburban, Surat in Gujarat has recorded the largest gain through inter-censal migration. The city of Surat is famous for powerloom sector along with various other activities like diamond cutting and jewellery making which attract manpower from far off areas. The textile processing units here depend almost entirely on migrant labourers. The fact is that the locals are not interested in working for the low wages that the power loom sector offers (Times of India: Surat, Aug 7, 2011). Among other districts recording gain Bangalore (now known as Bengaluru) from Karnataka, Rangareddy from Andhra Pradesh and Twenty Four Parganas from West Bengal occupy a prominent place. The districts headquarter with the same name and which serves as the state capital city as well has lately come up as an important IT city. The city thus requires highly qualified workforce. According to a study conducted by Centre for Policy Research, New Delhi, during the period Bangalore, at 47.7 percent, got the lion's share of "highly educated migrants" (graduates and post-graduates), followed by Chennai at 36.6 percent, Kolkata at 36.2 percent and Hyderabad at 29 percent (Times of India: Mumbai, Feb 5, 2013). In Rangareddy district (and also in Hyderabad which does not rank as high as Rangareddy in terms of absolute size of gain), rate of growth in population during the recent decades has been very high which can be attributed mainly to in-migration. However, almost the whole quantum of migration in these two 137
13 districts of Andhra Pradesh is from the state itself. Same is the case with North Twenty Four Parganas of West Bengal. Gaining/ Loosing Status Table: 5.3 District level Net Male Migrants in India, 2001 Range of gain/loss (0-9 years) Number of Districts Absolute size of Net gain/ loss Male Population, 2001 Source: Based on Census of India (2001), Migration Tables (D-01, D-02 and D-13). Share of gain/ loss in the population Gaining ,061, ,717, lakh and above ,157,650 79,860, to ,995,528 57,992, ,000 to 50, ,712,839 78,955, ,000 to 25, ,698,142 70,395, Less than 10, ,104 58, Loosing 135 2,953, ,285, Less than 5, ,131 25,830, ,000 to 10, ,732 28,574, ,000 to 15, ,236 12,957, More than 15, ,490,034 83,923, Total ,014, ,003,526 Referring back to Table 5.3, it can be seen that on the whole 135 districts that witnessed excess of out-migration over in-migration during 1991 and 2001 recorded a loss of nearly 2 percent population. Of the total net loss of population at district level, the districts of Mumbai and Kolkata alone contributed over 12 percent. In fact, these districts represent the two metropolitan cities. Of late evidences indicate a marked slowing down of migration to large cities. Same is the case with these two mega cities. The population totals of census 2001 clearly show that the overall rate of 138
14 139
15 growth in population of Mumbai (includes natural increase and net migration) for the decades and has remained constant at nearly 20 per cent, suggesting a slowdown in its migrant component. The rate of growth in the population of Mumbai, in fact, has been consistently falling since Between , the net migration component in the city's total increase in population was 39.5 per cent. This dropped to an all-time low of 20 percent in The overall decline in the growth rate of the city which stands frozen at 20 per cent is indicative of a slowdown. The reason for the decline is because Mumbai has lost its importance as a manufacturing centre. The city district of Mumbai fails to show a high proportion of in-migrants... Saturation is also responsible for such small proportion. This can be seen from the higher proportion of in migrants in Thane district (Mukherji and Phadke, 2009: 123). With regard to the slowing down of migration to large urban centres, it is often argued that during the last two decades there hasn't been much expansion of industries that could attract migrants. According to Ashish Bose, a member of National Commission on Urbanisation, it is the service sector that has taken the lead now. It has been observed that industries all over Mumbai are gradually closing down as a result of which jobs are fast disappearing. The suburbs, which once thrived on heavy engineering industries and chemical and petrochemical plants, have been experiencing de-industrialisation too. No new investments are forthcoming and new jobs and the old formal sector jobs are declining. It is, however, argued that the city continues to attract migrants on the strength of its informal sector which is absorbing a large chunk of the influx population (Times of India: Bombay Times, Feb 27, 2002).More or less the same is the story with all large cities including Kolkata in West Bengal. The district of Kolkata has recorded the second largest loss due to more of out-migration as compared to in-migration. People from this, districts have shown a tendency of migrating towards the nearby districts of Twenty Four Parganas and Hawra districts Migration by Distance: As already noted earlier, census data enables us to analyse migration under three broad distance categories viz. inter-state, inter-district and intra-district migrations. While discussing internal migration at district level it is 140
16 important to examine the share of above mentioned three distance categories to comprehend the regional dynamics and population redistribution in India. The forthcoming paragraphs are devoted to this dimension of internal migration. Inter-state Migrants:Inter-state migrants are those migrants, who migrate from one state to another state of India. As already noted these migrants constitute percent (i.e. a little more than one-fourth) of the total inter-censal male migrants in the country. This means that more than 70 percent of migrants who have moved between 1991 and 2001 have relocated themselves within the boundary of the respective state only. For economic reason males even moves to distant places. As already discussed on the basis of state level data, of the major 18 states Haryana has the largest proportion (60 percent) of inter-state male migrants in its inter-censal migrants. A significant difference between this and the corresponding proportion for life-time migrants in Haryana indicates that the state has emerged as a big attraction for migrants from across the state boundary during the 1990s. It could be recalled that Punjab (52.68 percent), Uttaranchal (44.21 percent) and Jharkhand (40.02 percent) followed Haryana in that order. On the basis of spatial patterns in the strength of interstate migration across states it has been argued that long distance migration is selective in nature and is induced by economic factors. It is because of this that the developed states report a generally larger share of inter-state migrants as compared to low and middle income states. It is in this context that a discussion based on district level data becomes more appropriate for a study of the regional dimension of population mobility in the country. The present section is devoted to this aspect only. Table 5.4 shows the distribution of districts on the basis of share of inter-state migrants in inter-censal migrants as per 2001 census. Table reveals that 35 districts out of 48 districts with mobility rate 40 percent and more belong to the above mentioned four states. The spatial patterns in inter-state mobility among male migrants for the 1990s have been shown in figure 5.4. In general, states in the northern parts of the country reveal a higher incidence of inter-state migration as compared to the southern peninsula. The eastern part of the uplands mainly over Chhotanagpur plateau spread over Jharkhand, Chhattisgarh and northern hilly districts 141
17 Table: 5.4 Distribution of Districts by Inter-State Male Migrants in India, 2001 Inter-State Male Migrants as percentage to Inter-censal Male Migrants States and and below Total above Himachal Pradesh 0(0) 1(8.33) 5(41.67) 2(16.67) 4(33.33) 12 Punjab 0(0) 0(0) 0(0) 7(41.18) 10(58.82) 17 Uttaranchal 0(0) 1(7.69) 6(46.15) 2(15.38) 4(30.78) 13 Haryana 0(0) 0(0) 1(5.26) 3(15.79) 15(78.95) 19 Rajasthan 4(12.50) 16(50.00) 9(28.12) 3(9.38) 0(0) 32 Uttar Pradesh 20(28.57) 33(47.14) 13(18.57) 3(4.29) 1(1.43) 70 Bihar 13(35.13) 17(45.95) 6(16.22) 0(0) 1(2.70) 37 West Bengal 4(22.22) 8(44.44) 3(16.67) 1(5.56) 2(11.11) 18 Jharkhand 0(0) 2(11.11) 7(38.89) 3(16.67) 6(33.33) 18 Orissa 18(60) 10(33.33) 2(6.67) 0(0) 0(0) 30 Chhattisgarh 2(12.50) 8(50.00) 5(31.25) 1(6.25) 0(0) 16 Madhya Pradesh 12(26.67) 21(46.66) 8(17.78) 4(8.89) 0(0) 45 Gujarat 13(52) 6(24) 4(16) 0(0) 2(8.00) 25 Maharashtra 17(48.57) 10(28.57) 4(11.43) 2(5.72) 2(5.71) 35 Andhra Pradesh 17(73.91) 5(21.74) 1(4.35) 0(0) 0(0) 23 Karnataka 13(48.15) 10(37.04) 3(11.11) 0(0) 1(3.70) 27 Kerala 6(42.86) 8(57.14) 0(0) 0(0) 0(0) 14 Tamil Nadu 24(80) 4(13.33) 2(6.67) 0(0) 0(0) 30 Total Districts Note: Figures in parentheses are percentage share of districts under different categories to the total in respective states. Source: Based on Census of India (2001), Migration Table (D-02). of Orissa are also marked with higher incidence of inter-state migration. In addition, the coastal Maharashtra and adjacent districts in South Gujarat too have relatively higher share of inter-state migrants. Over the peninsular India, isolated patches of relatively higher share of inter-state migration can be seen scattered in districts with state headquarters and important centres of industrial and commercial activities. As is apparent, very high incidence of inter-state mobility is found in the developed states which are situated in mainly north India. Much of Haryana (except Rohtak, Kaithal, Bhiwani and Jind districts), a greater part of Punjab, areas of Himachal Pradesh (over the districts of Solan, Una, Bilaspur, Sirmaur etc.) and parts 142
18 of Uttaranchal (including Hardwar, Udham Singh Nagar, Dehradun and Nainital districts) along with the industrially developed districts of Gujarat(e.g. Valsad and Surat) and Maharashtra (e.g. Mumbai and Mumbai Suburban), minerally rich areas in Jharkhand (e.g. Purbi Singhbhum, Bokaro, Dhanbad, Deoghar, Kodarma and Ranchi), the hilly district of West Bengal (i.e. Darjilling) and technology developed districts of Karnataka (i.e. Banglore) show much higher incidence of inter-state mobility as compared to the rest of the areas. In Haryana, the highest percentage of inter-state migrants is found in Faridabad. It may be noted that Faridabad city of late has emerged as a fast growing urban centre based on a variety of industrial and commercial activities. The city that has recorded a very rapid growth mainly through migration during the 1990s has become the only million plus city of Haryana at the time of 2001 census. Faridabad district is followed by Panchkula, Gurgaon, Panipat and Yamunanagar in terms of the share of inter-state migrants during the 1990s. These districts are industrially developed and provide good base for employment. So migrants are coming in these districts from other states also. Haryana is number one state in the country so far as production of passenger cars and two wheelers are concerned. Gurgaon and Faridabad are the major automobile centres in the State. The presence of established manufacturers Maruti Suzuki, Honda Motors, Hero Group, Yamaha Group and Escorts has contributed a lot to develop ancillary automotive components (Haryana Development Report, 2009: 84). Moreover the cities of Faridabad and Gurgaon located in close vicinity of Delhi have grown up in the form of major residentialindustrial towns. Migrants are mainly coming from Uttar Pradesh and Bihar states. Panipat district has oil refinery, fish market and textiles industries. Panipat in Haryana is a home of home furnishings. The export of handloom products from Panipat is the highest in the country. Panipat has the advantage of largest shoddy yarn manufacturing facility and it is a pioneer in producing low cost blankets in the country. The urban population in the district has the maximum percentage of workers employed in household industries (Haryana Development Report, 2009: 152). A concentration of industries (e.g. those related to plywood, sugar, etc) in and around Yamuna Nagar has attracted a large number of migrants from nearby states of Uttar- 143
19 144
20 Pradesh and Himachal Pradesh in search of employment. A sizeable number of migrants from Bihar can also be seen in the districts. So far as the coastal Maharashtra is concerned, a sizeable portion of inter-state migrants can be seen in Mumbai and Mumbai Suburban districts. It is observed that migrants who come to Mumbai are low skilled labourers who help in infrastructural development of city by providing cheap labour as well as generate work and employment for others in the social service sector including hotel and entertainment industry (Singh, 2010: 200). As the largest industrial town in Punjab, Ludhiana has developed rapidly during last several decades in small scale industries like textiles and apparels. Most of these non household manufacturing industry and construction, in particular, largely depend on migrant workers from outside the state. Uttar Pradesh and Bihar alone contribute over 41 percent of the inter-censal migrants in Ludhiana from across the state boundary. The share of Haryana, a neighbouring state, being only a little over 3per cent (Yoshifumi, 2012: 87). As revealed in Fig. 5.4, in the south central Maharashtra, almost whole of Andhra Pradesh, a greater part of Karnataka and Tamil Nadu along with southern Orissa and parts in central Madhya Pradesh report very low share of inter-state migrants. Very low share is also found over the parts of Uttar Pradesh, Bihar plains and central Gujarat including Saurashtra. So far as a low share of inter-state migrants in the southern states is concerned, Kaur (2002) in a study based on 1991 census data has talked about language as a barrier. Although her observation was with particular reference to rural to rural migration across states the fact that the barrier of language acts as deterrent for migration stream to urban areas also cannot be negated. Lowest percentage of inter-state male migrants is found in Kandhamal (Orissa) district followed by Virudhunagar (Tamilnadu), West Godavari and Prakasm districts (Andhra Pradesh). In these districts intra-state movement is more prominent. Kandhamal is an extremely backward district in Odisha and is dominated by Kondhs tribe. In terms of population per sq. km. Kandhamal is the least densely populated district in the state. Christian population are of substantially high proportion. The 145
21 district is one of the least urbanised. The district is basically an out-migrating district and therefore a low share of inter-state migrants is self explanatory. Intra-state Migrants:Intra-state migrants constitute percent of total internal migrants who have shifted from one place to another during the intervening period between 1991 and 2001 censuses. This means that less than 27 percent of the intercensal migrants have moved across state boundary. As already discussed in earlier chapter, highest percentage of intra-state migrants is recorded in Andhra Pradesh followed by Tamilnadu, Kerala and Orissa states. It may be recalled that the share of inter-state in these states is very low and the probable reasons underlying this has already been discussed. As Table 5.5 reveals, as many as 88 out of 257 districts with more than 85 percent of the inter-censal migrants who have moved within the state boundary, are from these states. In Punjab, Uttaranchal, Haryana and Jharkhand none of the districts reports a corresponding figure of 85 percent and more. Whole of Andhra Pradesh, Tamil Nadu, Kerala, Karnataka except Bellary, Bidar and Banglore districts, Orissa (except Jharsuguda district), Maharashtra (except Raigarh, Nagpur, Thane, Mumbai and Mumbai Suburban), Gujarat (except Navsari, Ahmadabad, Bharuch, Surat and Valsad district), Rajasthan (except Jhalawar, Kota, Jaipur, Dhaulpur and Alwar district), Uttar Pradesh (except Meerut, Faizabad, Sonbhadra, Kushinagar, Ghaziabad and Gautam Buddha Nagar district), Madhya Pradesh (except Tikamgarh, Chhatarpur, Indore, Neemuch, Gwalior, Sidhi and Bhopal district), Chhattisgarh(except Raigarh and Koriya district), Bihar(except Kishangan and Siwan), Jharkhand(except Chatra, Sahibganj, Paschimi and Purbi Singhbhum, Hazaribagh, Ranchi, Kodarma, Deoghar, Dhanbad and Bokaro), West Bengal (except Barddhaman, Haora, Darjiling and Kolkatta), Haryana (in Jind), Himachal Pradesh (in Lahul & Spiti, Mandi, Kullu and Shimla), Uttaranchal (in 146
22 Bageshwar, Rudarprayag, Pithoragarh, Uttarkashi and Chamoli) report very high to high share of intra-state migrants among the inter-censal migrants (Fig. 5.5). States Himachal Pradesh Table: 5.5 Distribution of Districts by Intra-state Male Migrants in India, 2001 Intra-state Male Migrants as percentage to Internal Male Migrants and below and above 3(25.00) 1(8.34) 4(33.33) 3(25.00) 1(8.33) 12 Punjab 8(47.06) 6(35.29) 3(17.65) 0(0) 0(0) 17 Uttaranchal 4(30.77) 1(7.69) 3(23.08) 5(38.46) 0(0) 13 Haryana 12(63.16) 4(21.05) 2(10.53) 1(5.26) 0(0) 19 Rajasthan 0(0) 0(0) 5(15.62) 13(40.63) 14(43.75) 32 Uttar Pradesh 1(1.43) 2(2.86) 3(4.29) 28(40.00) 36(51.42) 70 Bihar 0(0) 1(2.71) 1(2.70) 9(24.32) 26(70.27) 37 West Bengal 1(5.56) 1(5.56) 2(11.11) 5(27.77) 9(50.00) 18 Jharkhand 5(27.78) 1(5.56) 4(22.22) 8(44.44) 0(0) 18 Orissa 0(0) 0(0) 1(3.33) 2(6.67) 27(90.00) 30 Chhattisgarh 0(0) 1(6.25) 2(12.50) 9(56.25) 4(25.00) 16 Madhya Pradesh 0(0) 2(4.44) 5(11.11) 16(35.56) 22(48.89) 45 Gujarat 0(0) 2(8.00) 3(12.00) 3(12.00) 17(68.00) 25 Maharashtra 2(5.71) 2(5.72) 1(2.86) 7(20.00) 23(65.71) 35 Andhra Pradesh 0(0) 0(0) 0(0) 1(4.35) 22(95.65) 23 Karnataka 0(0) 1(3.70) 2(7.41) 7(25.93) 17(62.96) 27 Kerala 0(0) 0(0) 0(0) 3(21.43) 11(78.57) 14 Tamil Nadu 0(0) 0(0) 1(3.34) 1(3.33) 28(93.33) 30 Total Districts Total Note: Figures in parentheses are percentage share of districts under different categories to the total in respective states. Source: Based on Census of India (2001), Migration Table (D-02). 147
23 The highest percentage of intra-state male migrants is found in Kandhamal (Orissa) followed by Virudhunagar (Tamilnadu), West Godavari and Prakasm(Andhra Pradesh) and Thoothukudi (Tamil Nadu) districts. In these districts intra-state movement is more prominent. Kandhamal district is dominated by Kondhs tribe. In terms of population per sq. km. Kandhamal is the least densely populated district in the state. As already discussed, the district is one of the least urbanised in the state. Therefore, whatever mobility that occurs is in the form of short distance migration. This could be further seen in the dominance of intra-district stream in such areas more so in Andhra Pradesh.Inter-district male migration during the inter-censal period is conspicuous only in a few coastal districts of the state namely Krishna, Visakhapatnam and West Godavari. In addition, the districts of Rangareddy and Hyderabad also on the western side show a relatively higher share of inter-district migrants. These districts drew around half of all male migrants from other districts in the state.more than half of males from the high-volume migration districts of East Godavari, West Godavari, Krishna, Guntur, and Nellore move between rural areas (Verma et al., 2007: 4). Prakasam reports high intra-state migration of the 14% of adult men who had out-migrated for work, 95% had migrated to other districts in the state (Ganju et al., 2013: 342).Thoothukudi or Tuticorin is called as "Pearl city" because it is famous for pearl fishery. Thoothukudi district is in the south of Tamil Nadu and is one of the backward districts in terms of economic indicators, social progress and industrialization. It is also a notoriously dry district and agriculture is completely dependent on the monsoons. Livelihood options for the people here are quite limited and migration to urban areas in search of jobs is quite common (Asha Trust - Project Pearl, Thoothukudi District, Tamil Nadu). The locality comprising of workers from Tuticorin Thermal Power Station and Tuticorin Port Trust. 148
24 149
25 Intra-district Migrants: As already discussed in the earlier chapter at state level highest percentage of intra-district migrants is found in Kerala, Andhra Pradesh and Jharkhand states. Table 5.6 shows the distribution of districts on the basis of share of intra-district migrants in the total male migrants who have moved within the state boundaries as per 2001 census. As the table reveals, as many as 12 out of 36 districts with a share of more than 80 percent are from the above mentioned states. The spatial Table: 5.6 Distribution of Districts by Intra-District Male Migrants in India, 2001 Intra-District Male Migrants as percentage to Intra-State Male Migrants States and and below above Total Himachal Pradesh 0(0) 0(0) 6(50) 6(50) 0(0) 12 Punjab 0(0) 3(17.65) 9(52.94) 5(29.41) 0(0) 17 Uttaranchal 0(0) 2(15.38) 3(23.08) 8(61.54) 0(0) 13 Haryana 0(0) 3(15.79) 13(68.42) 3(15.79) 0(0) 19 Rajasthan 0(0) 2(6.25) 7(21.88) 19(59.37) 4(12.50) 32 Uttar Pradesh 3(4.29) 2(2.86) 27(38.57) 37(52.86) 1(1.42) 70 Bihar 0(0) 2(5.40) 8(21.62) 25(67.57) 2(5.41) 37 West Bengal 1(5.56) 0(0) 6(33.33) 6(33.33) 5(27.78) 18 Jharkhand 0(0) 0(0) 5(27.78) 8(44.44) 5(27.78) 18 Orissa 1(3.33) 2(6.67) 12(40.00) 14(46.67) 1(3.33) 30 Chhattisgarh 0(0) 0(0) 3(18.75) 12(75.00) 1(6.25) 16 Madhya Pradesh 1(2.22) 2(4.44) 16(35.56) 22(48.89) 4(8.89) 45 Gujarat 0(0) 2(8.00) 4(16.00) 17(68.00) 2(8.00) 25 Maharashtra 2(5.71) 1(2.86) 8(22.86) 23(65.71) 1(2.86) 35 Andhra Pradesh 1(4.35) 1(4.35) 1(4.35) 14(60.86) 6(26.09) 23 Karnataka 0(0) 1(3.70) 9(33.34) 16(59.26) 1(3.70) 27 Kerala 0(0) 0(0) 4(28.57) 9(64.29) 1(7.14) 14 Tamil Nadu 1(3.33) 1(3.33) 8(26.67) 18(60.00) 2(6.67) 30 Total Districts Note: Figures in parentheses are percentage share of districts under different categories to the total in respective states. Source: Based on Census of India (2001), Migration Table (D-02). 150
26 patterns in intra-district mobility among male migrants for the 1990s have been shown in Fig On an average, districts in the southern states reveal a higher incidence of short distance migration as compared to elsewhere in the country. Almost whole of Maharashtra except some districts in the coastal and the interior areas, Andhra Pradesh, Karnataka barring some patches in its central region, a greater part of Kerala, Tamil Nadu report very high to high share of short distance migration. The largest share of intra-district migrants are recorded in Godda district (Jharkhand) followed by Dhaulpur (Rajasthan), Kanniyakumari (Tamil Nadu), Maldah (West Bengal) and Srikakulam (Andhra Pradesh) district. Godda is a very backward district in Jharkhand whose economy is almost wholly dependent on coal-mines in Lalmatia. Known for its hills and forest cover, the district does not provide opportunity to migrants from other areas. The local people who fail to get sustenance seek employment outside the district.from Srikakulam a large number of workers leave their villages and spend a major part of the year elsewhere as migrant workers. Srikakulam may be a backward district but it contributes a lot towards nation building. Although the district has plenty of natural resources, illiteracy and overdependence on agriculture delayed its development, forcing people to migrate in search of work. The issue of labour migration has long vexed public representatives and government officials. Now, they have found a solution in the form of the Mahatma Gandhi National Rural Employment Guarantee Scheme (MGNREGS), which guarantees at least 100 days of wage employment to a rural household in a year. Srikakulam notched the first place in the State for successfully implementing the United Progressive Alliance (UPA) government s flagship programme. The scheme is designed to curb labour migration and help people find work in their vicinity. The district administration was able to provide employment to each adult worker belonging to more than three lakh households (Frontline, 2013). 151
27 152
28 This should be reflected in a decline in flight of people from the district to other areas in search of better job opportunities. One will have to wait for the release of migration data of 2011 census to verify this fact. Inter-district Migrants: On the whole, of the total intra-state migrants in the country more than 40 percent have moved from one district to another. The largest share of inter-district migrants is recorded in Uttar Pradesh followed by Haryana and Orissa. Table 5.7 shows the distribution of districts on the basis of share of inter-district migrants in intra-state migrants as per 2001 census. As table 5.7 reveals, as many as 19 out of 55 districts with a share of more than 55 percent are from these states. The spatial patterns in inter-district mobility among male migrants for the 1990s have been shown in figure 5.7. As is expected, the patterns are just opposite to that discussed above in the case of intra-district migration. In general, states in the northern parts of the country reveal a higher incidence of inter-district migration as compared to the southern peninsula. In terms of individual districts very high percentage of interdistrict migrants are found in developed district Kolkata in West Bengal, Mumbai Suburban, Mumbai, Thane and Pune in Maharashtra, Chennai, Thiruvallur in Tamil Nadu, Central Madhya Pradesh(Bhopal, Indore, Gwalior, Ujjain, Umaria and Jabalpur), over the parts of Uttar Pradesh(Gaziabad, Sonbhadra, Meerut, Aligarh and Mahoba), Hyderabad and Rangareddy in Andhra Pradesh, Northern part of Orissa(Khorda, Cuttack, Jagatsinghpur, Jharsuguda and Sambalpur), Central Karnataka(Banglore, Dharwad and Chikmagalor), Jaipur and Kota in Rajasthan, Gandhinagar, Surat, Ahmadabad in Gujarat, Patna and Lakhisarai in Bihar, Kapurthala and Faridkot in Punjab, Panipat, Kurukshetra, Karnal and Rohtak in Haryana, Dehradun and Nainital in Uttaranchal, Jaisalmer and Kota in Rajasthan, Korba in Chhattisgarh, Darjiling in West Bengal and Kullu in Himachal Pradesh. 153
29 Table: 5.7 Distribution of Districts by Inter-District Male Migrants in India, 2001 Inter-District Male Migrants as percentage to Intra-State Male Migrants States and and below above Total Himachal Pradesh 0(0) 4(33.33) 3(25.00) 4(33.34) 1(8.33) 12 Punjab 1(5.88) 2(11.76) 2(11.76) 9(52.94) 3(17.66) 17 Uttaranchal 1(7.69) 5(38.46) 4(30.77) 1(7.69) 2(15.39) 13 Haryana 0(0) 2(10.53) 4(21.05) 8(42.10) 5(26.32) 19 Rajasthan 9(28.11) 6(18.75) 11(34.38) 3(9.38) 3(9.38) 32 Uttar Pradesh 3(4.29) 23(32.86) 19(27.14) 16(22.86) 9(12.85) 70 Bihar 6(16.22) 17(45.95) 4(10.81) 7(18.92) 3(8.10) 37 West Bengal 6(33.33) 4(22.22) 5(27.78) 1(5.56) 2(11.11) 18 Jharkhand 7(38.89) 3(16.67) 5(27.78) 3(16.66) 0(0) 18 Orissa 2(6.67) 8(26.67) 10(33.33) 5(16.67) 5(16.67) 30 Chhattisgarh 2(12.50) 5(31.25) 8(50.00) 0(0) 1(6.25) 16 Madhya Pradesh 6(13.33) 13(28.89) 14(31.11) 6(13.34) 6(13.33) 45 Gujarat 5(20.00) 10(40.00) 7(28.00) 0(0) 3(12.00) 25 Maharashtra 1(2.86) 20(57.14) 6(17.14) 4(11.43) 4(11.43) 35 Andhra Pradesh 12(52.17) 6(26.09) 3(13.04) 0(0) 2(8.70) 23 Karnataka 4(14.81) 10(37.04) 4(14.82) 5(18.52) 4(14.81) 27 Kerala 3(21.43) 4(28.57) 5(35.71) 2(14.29) 0(0) 14 Tamil Nadu 5(16.67) 10(33.33) 7(23.33) 6(20.00) 2(6.67) 30 Total Districts Note: Figures in parentheses are percentage share of districts under different categories to the total in respective states. Source: Based on Census of India (2001), Migration Table (D-02). 154
30 155
31 Migration by Streams: Migration of people is also analysed in terms of different streams. In Indian context, generally four flows or streams of migration are identified. They are i.e. rural-rural, rural-urban, urban-rural, and urban-rural. A discussion based on the relative strength of these streams throw a useful insight into the socioeconomic determinants of spatial mobility of population in an area. The forthcoming section is devoted to a district level study of migration streams in India. Rural to rural: As discussed in the previous chapter rural to rural stream constituted over 36 percent of the total inter-censal male migrants in the country. At state level the highest proportion of migrants in this stream is recorded in Kerala followed by Chhattisgarh, Andhra Pradesh, Himachal Pradesh, Rajasthan and Orissa. Table 5.8 shows the distribution of districts on the basis of share of rural to rural migrants in total inter-censal migrants as per 2001 census.as the table reveals, of the total 70 districts with more than 60 percent inter-censal migrants in rural to rural stream, as many as 38 are from these six states. The spatial patterns in rural to rural mobility among male migrants for the 1990s have been shown in figure 5.8. The figure reveals that rural to rural migration is more prominent in the districts of southern India. In Kerala, rural tourism in conjunction with health tourism has emerged as a successful venture attracting people from around the world (Gautam, 2012: 9). This seems to have governed spatial redistribution of population at local level also. In addition, in Kerala plantation based economic activities also have generated push and pull forces that have resulted into redistribution of rural population. Commercial crops like tea, rubber, spices, and along with food crops such as rice form main export items in Kerala and fetch revenue. Activities related to plantation/ cultivation of these crops attracts migrants from the state as well as from other states. Thus, relatively high proportion of rural to rural male migration is attributed to Coffee and Tea plantation in Kerala (Kaur, 2002: 75). Relatively high proportion of rural to rural migrants can also be attributed activities relating to mining and quarrying and also multipurpose projects also induced rural in-migration, for instance, in Andhra Pradesh. This attracted persons from other parts of the region. Chhattisgarh is the natural home to most of the primitive tribes of India. The state has a higher concentration of Gond tribes. The indigenous tribe of Gond inhabits the hilly region 156
32 of Chhattisgarh. Most of the districts of Chhattisgarh depend on agriculture because of low level of industrialization. Comprising mostly of backward castes, the state has a huge population of Schedule Tribes who inhabit the rural areas of the districts and depend on traditional form of occupations to earn their living. Thus, a substantial portion of population mobility falls under the category of rural to rural stream. Table: 5.8 Distribution of Districts by Rural to Rural Male Migrants in India, 2001 Rural to Rural Male Migrants as percentage to Inter-censal Male Migrants States and and below above Total Himachal Pradesh 0(0) 2(16.67) 3(25.00) 5(41.67) 2(16.66) 12 Punjab 4(23.53) 6(35.29) 3(17.65) 3(17.65) 1(5.88) 17 Uttaranchal 2(15.38) 2(15.38) 5(38.48) 2(15.38) 2(15.38) 13 Haryana 4(21.05) 6(31.58) 5(26.32) 3(15.79) 1(5.26) 19 Rajasthan 5(15.62) 3(9.38) 12(37.50) 6(18.75) 6(18.75) 32 Uttar Pradesh 18(25.71) 15(21.43) 20(28.57) 13(18.57) 4(5.72) 70 Bihar 6(16.22) 14(37.84) 12(32.43) 4(10.81) 1(2.70) 37 West Bengal 3(16.67) 4(22.22) 0(0) 6(33.33) 5(27.78) 18 Jharkhand 6(33.33) 3(16.67) 1(5.56) 6(33.33) 2(11.11) 18 Orissa 2(6.67) 6(20.00) 6(20.00) 7(23.33) 9(30.00) 30 Chhattisgarh 0(0) 2(12.50) 3(18.75) 3(18.75) 8(50.00) 16 Madhya Pradesh 8(17.78) 9(20.00) 16(35.56) 10(22.22) 2(4.44) 45 Gujarat 6(24.00) 3(12.00) 7(28.00) 4(16.00) 5(20.00) 25 Maharashtra 4(11.43) 4(11.43) 6(17.14) 13(37.14) 8(22.86) 35 Andhra Pradesh 2(8.70) 2(8.70) 2(8.70) 12(52.17) 5(21.73) 23 Karnataka 1(3.70) 7(25.93) 9(33.33) 9(33.34) 1(3.70) 27 Kerala 0(0) 4(28.57) 1(7.14) 1(7.14) 8(57.15) 14 Tamil Nadu 16(53.33) 9(30.00) 3(10.00) 2(6.67) 0(0) 30 Total Districts Note: Figures in parentheses are percentage share of districts under different categories to the total in respective states. Source: Based on Census of India (2001), Migration Table (D-02) At district level, patches of very high share of rural to rural migrants can be seen almost evenly distributed over the Indian sub-continent (Fig. 5.8). Although a marked dominance of the stream exists over the interior of the Indian peninsula particularly in the adjoining areas of Chhattisgarh, Orissa and Andhra Pradesh. Beyond this region, the districts in Rajasthan along the international border and the 157
33 158
34 hilly districts of Himachal Pradesh also exhibit dominance of rural to rural stream of migration. Rural to urban: In a less developed economy migration from rural to urban areas inthe wake of strong push factors form a distinctive characteristic of population redistribution. This leads to a wide differential in the rate of growth in urban and rural areas in such economies. India is also not an exception to this phenomenon. Rural to urban migration thus forms a significant portion of net increase in urban population. Table: 5.9 Distribution of Districts by Rural to Urban Male Migrants in India, 2001 Rural to Urban Male Migrants as percentage to Internal Male Migrants States and and below above Total Himachal Pradesh 7(58.34) 3(25.00) 1(8.33) 1(8.33) 0(0) 12 Punjab 1(5.88) 7(41.18) 6(35.29) 2(11.76) 1(5.89) 17 Uttaranchal 2(15.38) 6(46.16) 4(30.77) 1(7.69) 0(0) 13 Haryana 1(5.26) 6(31.57) 5(26.32) 5(26.32) 2(10.53) 19 Rajasthan 12(37.50) 14(43.75) 4(12.50) 2(6.25) 0(0) 32 Uttar Pradesh 23(32.86) 21(3.00) 15(21.43) 10(14.28) 1(1.43) 70 Bihar 7(18.92) 16(43.24) 10(27.03) 3(8.11) 1(2.70) 37 West Bengal 10(55.56) 5(27.78) 2(11.10) 0(0) 1(5.56) 18 Jharkhand 7(38.89) 2(11.11) 4(22.22) 4(22.22) 1(5.56) 18 Orissa 13(43.33) 9(30.00) 5(16.67) 2(6.67) 1(3.33) 30 Chhattisgarh 9(56.25) 3(18.75) 3(18.75) 1(6.25) 0(0) 16 Madhya Pradesh 7(15.56) 19(42.22) 11(24.44) 7(15.56) 1(2.22) 45 Gujarat 6(24.00) 11(44.00) 4(16.00) 2(8.00) 2(8.00) 25 Maharashtra 17(48.57) 8(22.86) 8(22.86) 0(0) 2(5.71) 35 Andhra Pradesh 7(30.43) 12(52.17) 3(13.05) 1(4.35) 0(0) 23 Karnataka 7(25.93) 15(55.56) 4(14.81) 1(3.70) 0(0) 27 Kerala 10(71.43) 4(28.57) 0(0) 0(0) 0(0) 14 Tamil Nadu 10(33.33) 15(50.00) 3(10.00) 2(6.67) 0(0) 30 Total Districts Note: Figures in parentheses are percentage share of districts under different categories to the total in respective states. Source: Based on Census of India (2001), Migration Table (D-02). 159
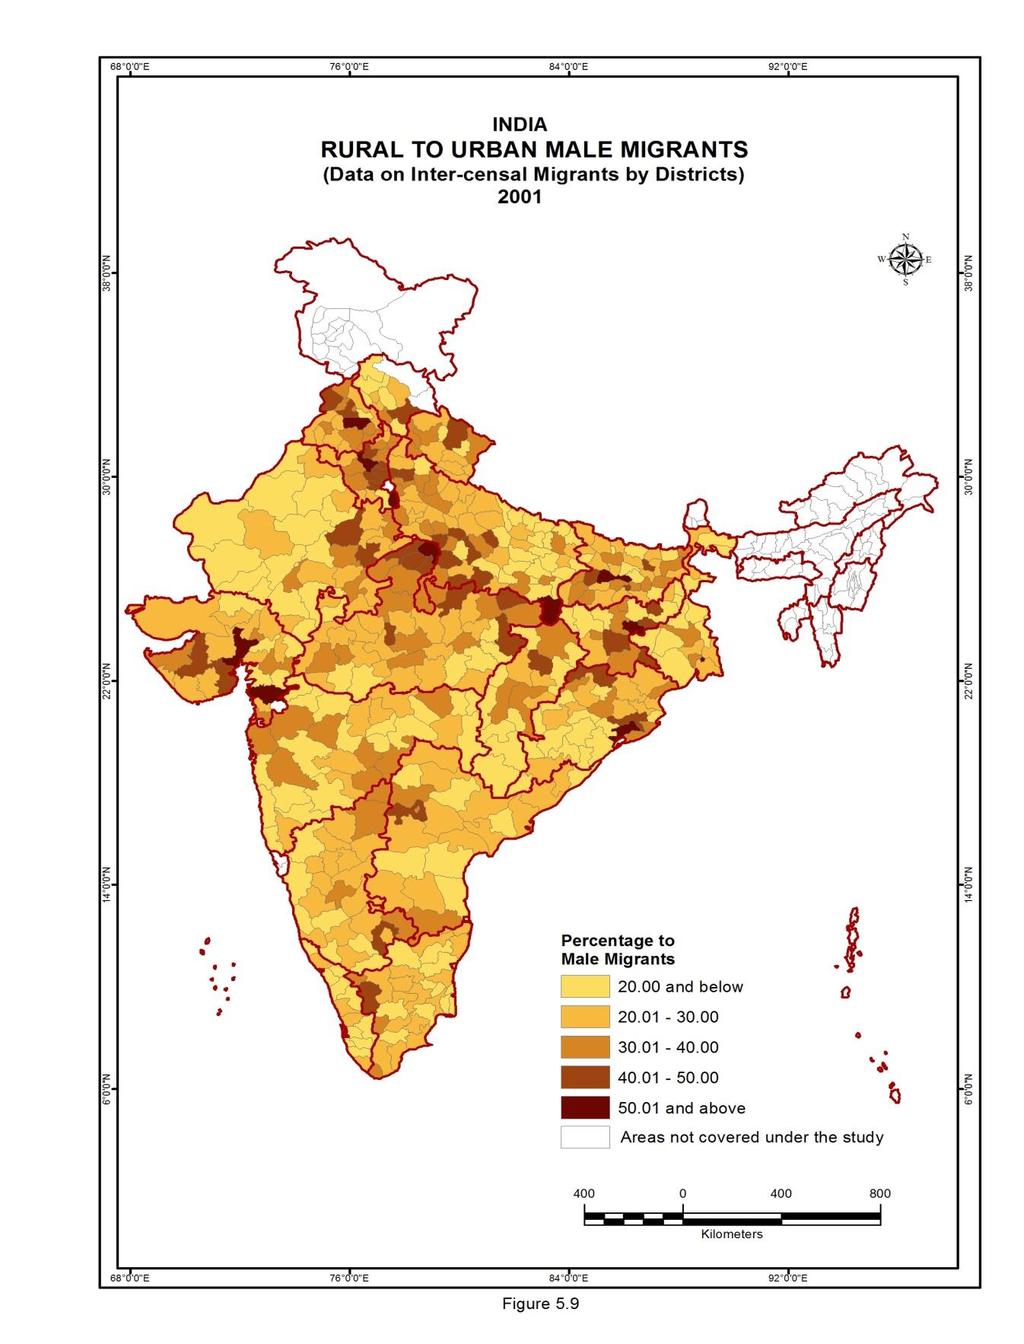
35 As much of this migration is induced by economic reasons, an evaluation of the relative share of this stream in the overall volume of migrationbecomes of utmost significance. In Indian context, rural to urban stream constitutes nearly one-third of the total male internal migration during the decade As already discussed in the previous chapter the highest percentage of rural to urban migrants is found in Gujarat (41.19 percent), Punjab (39.25 percent), Haryana (36.76 percent) and Jharkhand (36.57 percent).excepting the last one, all these states are highly urbanized and industrialized. As per the data of census in these states inter- state migration is more prominent. According to Kaur (1996), the regions with high inter-state rural-urban male migration experienced high rate of urbanization in recent decades. They included industrial-mining areas, Assam region, Punjab-Haryana tract and areas with considerable agricultural colonisation (Quoted in Mitra and Murayama, 2008:15). Maharashtra, Gujarat, Haryana, Punjab and Tamil Nadu, known for their robust and flourishing local economies and attract large number of workers (Khandelwal, 2011:202). States such as Uttar Pradesh, Uttaranchal, Bihar, Rajasthan, Orissa, West Bengal, Jharkhand, with laggard economies and a surplus of labour, are the primary suppliers of labour. The spatial patterns in rural to urban mobility based on district-level data among male migrants have been shown in Fig Very high percentage of rural to urban migrants are found in parts of Gujarat (Surat, Ahmadabad), Maharashtra (Mumbai Suburban and Mumbai), Faridabad in Haryana, Ludhiana in Punjab, Khordha in Orissa, Bhind in Madhya Pradesh, Bokaro in Jharkhand, Patna in Bihar, and Sonbhadra in Uttar Pradesh. 160
36 161
Important Notifications
 THE PAYMENT OF GRATUITY ACT, 1972 Important Notifications Brought into Force Notification S.O. 601 (E), dated New Delhi, the 16th September, 1972 1 In exercise of the powers conferred by sub-section (4)
HIV is widespread in Andhra Pradesh.
 TECHNICAL BRIEF FROM POPULATION COUNCIL INDIA NO. 1 MARCH 2007 Patterns of Male Migration in Andhra Pradesh and Implications for HIV Prevention Strategies: A Census Analysis Ravi K. Verma, Niranjan Saggurti,
RECENT CHANGING PATTERNS OF MIGRATION AND SPATIAL PATTERNS OF URBANIZATION IN WEST BENGAL: A DEMOGRAPHIC ANALYSIS
 46 RECENT CHANGING PATTERNS OF MIGRATION AND SPATIAL PATTERNS OF URBANIZATION IN WEST BENGAL: A DEMOGRAPHIC ANALYSIS Raju Sarkar, Research Scholar Population Research Centre, Institute for Social and Economic
Estimates of Workers Commuting from Rural to Urban and Urban to Rural India: A Note
 WP-2011-019 Estimates of Workers Commuting from Rural to Urban and Urban to Rural India: A Note S Chandrasekhar Indira Gandhi Institute of Development Research, Mumbai September 2011 http://www.igidr.ac.in/pdf/publication/wp-2011-019.pdf
TO BE NOTIFIED IN THE GAZETTE OF INDIA. Transfer Policy in EPFO for Commissioners Cadre INDEX
 TO BE NOTIFIED IN THE GAZETTE OF INDIA Transfer Policy in EPFO for Commissioners Cadre INDEX Sl. Chapter Subject No. 1. Chapter 1 Introduction 2. Chapter 2 Salient features of the policy 3. Chapter 3 The
INDIA ENTREPRENEURSHIP REPORT 2015
 INDIA ENTREPRENEURSHIP REPORT 2015 Fostering A New Wave Of Entrepreneurship Foreword Founded in 1959, Amway is today the world s largest Direct Selling FMCG Company in the world with operations in more
Perspective on Forced Migration in India: An Insight into Classed Vulnerability
 Perspective on in India: An Insight into Classed Vulnerability By Protap Mukherjee* and Lopamudra Ray Saraswati* *Ph.D. Scholars Population Studies Division Centre for the Study of Regional Development
Literacy in Million Cities
 Literacy in Million Cities This chapter explains the progress of urban literacy in India. It mainly focuses on the pattern and change of literacy rate between 2001 to 2011 censuses and gender disparity
Chapter 6. A Note on Migrant Workers in Punjab
 Chapter 6 A Note on Migrant Workers in Punjab Yoshifumi Usami Introduction An important aspect of Industry-Agriculture, or Urban-Rural Linkage, is that of through labor market. Unlike the backward and
Spatial Patterns of Migration in Himachal Pradesh,
 International Journal of Research in Social Sciences Vol. 8 Issue 2, February 2018, ISSN: 2249-2496 Impact Factor: 7.081 Journal Homepage: Double-Blind Peer Reviewed Refereed Open Access International
Regional Composition of Migrant and Non -Migrant Workers in Maharashtra, India
 International Journal of Interdisciplinary and Multidisciplinary Studies (IJIMS), 2017, Vol 4, No.2,152-156. 152 Available online at http://www.ijims.com ISSN - (Print): 2519 7908 ; ISSN - (Electronic):
not to be republished NCERT MIGRATION Types, Causes and Consequences Unit I Chapter 2
 Unit I Chapter 2 MIGRATION Types, Causes and Consequences Ram Babu, working as an engineer in Bhilai Steel Plant, Chhattisgarh, was born in a small village of district Bhojpur, Bihar. At an early age of
A lot of attention had been focussed in the past
 Chapter 7 CONCLUSION Regional economic disparities are a global phenomenon. These economic disparities among different regions or nations of the world have been an object of considerable concern to many,
On Adverse Sex Ratios in Some Indian States: A Note
 CENTRE FOR ECONOMIC REFORM AND TRANSFORMATION School of Management and Languages, Heriot-Watt University, Edinburgh, EH14 4AS Tel: 0131 451 4207 Fax: 0131 451 3498 email: ecocert@hw.ac.uk World-Wide Web:
Scheduled Tribe Out-Migration in West Bengal, India
 International Research Journal of Social Sciences E-ISSN 2319 3565 Inter-Regional Variation in Scheduled Tribe Out-Migration in West, India Abstract Manoj Debnath * and Sheuli Ray North Eastern Hill University,
DELHI PUBLIC SCHOOL, SURAT
 Series : DPS/ST/SS-SA-2/10-11 Code: 087 DELHI PUBLIC SCHOOL, SURAT SOCIAL SCIENCE (SAMPLE PAPER) SUMMATIVE ASSESSMENT Roll No : Marks : 80 Class : IX Time : 3 Hours Instructions : 1. The question paper
ABHINAV NATIONAL MONTHLY REFEREED JOURNAL OF REASEARCH IN COMMERCE & MANAGEMENT MGNREGA AND RURAL-URBAN MIGRATION IN INDIA
 MGNREGA AND RURAL-URBAN MIGRATION IN INDIA Pallav Das Lecturer in Economics, Patuck-Gala College of Commerce and Management, Mumbai, India Email: Pallav_das@yahoo.com ABSTRACT The MGNREGA is the flagship
International Institute for Population Sciences, Mumbai (INDIA)
") Kunal Keshri (kunalkeshri.lrd@gmail.com) (Senior Research Fellow, e-mail:) Dr. R. B. Bhagat (Professor & Head, Dept. of Migration and Urban Studies) International Institute for Population Sciences, Mumbai
Kunal Keshri (kunalkeshri.lrd@gmail.com) (Senior Research Fellow, e-mail:) Dr. R. B. Bhagat (Professor & Head, Dept. of Migration and Urban Studies) International Institute for Population Sciences, Mumbai
Regression Model Approach for Out-Migration on Demographic Aspects of Rural Areas of Pauri Garhwal
 175 Regression Model Approach for Out-Migration on Demographic Aspects of Rural Areas of Pauri Garhwal Pankaj Bahuguna, Research Scholar, Department of Statistics, H.N.B.G.U., Srinagar (Garhwal) Uttarakhand
Female Migration for Non-Marital Purposes: Understanding Social and Demographic Correlates of Barriers
 Female Migration for Non-Marital Purposes: Understanding Social and Demographic Correlates of Barriers Dr. Mala Mukherjee Assistant Professor Indian Institute of Dalit Studies New Delhi India Introduction
URBANISATION AND ITS ISSUES
 Foundation Course Semester 4 254 URBANISATION AND ITS ISSUES Although the population of India is still predominantly rural, the progress of urbanisation in the last decade has been fairly rapid.population
Insolvency Professionals to act as Interim Resolution Professionals and Liquidators (Recommendation) (Second) Guidelines, 2018
 (Second) Guidelines, 2018") Insolvency Professionals to act as Interim Resolution Professionals and Liquidators (Recommendation) (Second) Guidelines, 2018 Provisions in the Insolvency and Bankruptcy Code, 2016 30 th November, 2018
Insolvency Professionals to act as Interim Resolution Professionals and Liquidators (Recommendation) (Second) Guidelines, 2018 Provisions in the Insolvency and Bankruptcy Code, 2016 30 th November, 2018
Urban Administration: Urbanization and Governance Framework
 Urban Administration: Urbanization and Governance Framework Dr. A. K. Singh Assistant Director Regional Centre For Urban & Environmental Studies, Lucknow Urbanisation India is the second largest urban
Land Conflicts in India
 Land Conflicts in India AN INTERIM ANALYSIS November 2016 Background Land and resource conflicts in India have deep implications for the wellbeing of the country s people, institutions, investments, and
EXTRACT THE STATES REORGANISATION ACT, 1956 (ACT NO.37 OF 1956) PART III ZONES AND ZONAL COUNCILS
 PART III ZONES AND ZONAL COUNCILS") EXTRACT THE STATES REORGANISATION ACT, 1956 (ACT NO.37 OF 1956) PART III ZONES AND ZONAL COUNCILS Establishment of Zonal Councils. 15. As from the appointed day, there shall be a Zonal Council for each
EXTRACT THE STATES REORGANISATION ACT, 1956 (ACT NO.37 OF 1956) PART III ZONES AND ZONAL COUNCILS Establishment of Zonal Councils. 15. As from the appointed day, there shall be a Zonal Council for each
FOREIGN DIRECT INVESTMENT AND REGIONAL DISPARITIES IN POST REFORM INDIA
 Man In India, 96 (4) : 1075-1082 Serials Publications FOREIGN DIRECT INVESTMENT AND REGIONAL DISPARITIES IN POST REFORM INDIA Ripudaman Singh The largest democracy, second largest population and third
II. MPI in India: A Case Study
 https://ophi.org.uk/multidimensional-poverty-index/ II. in India: A Case Study 271 MILLION FEWER POOR PEOPLE IN INDIA The scale of multidimensional poverty in India deserves a chapter on its own. India
Andhra Pradesh: Vision 2020
 OVERVIEW Andhra Pradesh: Vision 2020 Andhra Pradesh has set itself an ambitious vision. By 2020, the State will have achieved a level of development that will provide its people tremendous opportunities
REVIVAL OF SATELLITE AND RING CITIES
 REVIVAL OF SATELLITE AND RING CITIES Background The National Capital Territory of Delhi (NCTD) is a giant metropolis, which has witnessed phenomenal growth and challenges both in terms of population and
Urban Women Workers. A Preliminary Study. Kamla Nath
 Urban Women Workers A Preliminary Study Kamla Nath Women constitute nearly a third of the working force in India. In 1961, out of a total working force of 188.4 million, 59.4 million or 31 per cent were
Electoral Bond Scheme Sale of Electoral Bonds at Authorised Branches of State Bank of India (SBI)
") Ministry of Finance Electoral Bond Scheme 2018 Sale of Electoral Bonds at Authorised Branches of State Bank of India (SBI) Posted On: 27 OCT 2018 3:55PM by PIB Delhi Government of India has notified the
Ministry of Finance Electoral Bond Scheme 2018 Sale of Electoral Bonds at Authorised Branches of State Bank of India (SBI) Posted On: 27 OCT 2018 3:55PM by PIB Delhi Government of India has notified the
Dimensions of rural urban migration
 CHAPTER-6 Dimensions of rural urban migration In the preceding chapter, trends in various streams of migration have been discussed. This chapter examines the various socio-economic and demographic aspects
HUMAN RESOURCES MIGRATION FROM RURAL TO URBAN WORK SPHERES
 HUMAN RESOURCES MIGRATION FROM RURAL TO URBAN WORK SPHERES * Abstract 1. Human Migration is a universal phenomenon. 2. Migration is the movement of people from one locality to another and nowadays people
Slum population in India: Extent and policy response
 International Journal of Research in Business and Social Science IJRBS Vol.2 No.1, 2013 ISSN: 2147-4478 available online at www.ssbfnet.com Slum population in India: Extent and policy response Upinder
Indian Journal of Spatial Science
 Manoj Debnath 1 Sheuli Ray 2 PhD Research Scholar, Department of Geography, NEHU, Shillong PhD Research Scholar, Department of Geography, NEHU, Shillong 1 2 Indian Journal of Spatial Science EISSN: 2249-4316
Poverty alleviation programme in Maharashtra
 Poverty alleviation programme in Maharashtra 1. Mr. Dhiraj. R. Ovhal Asst. Prof. NSS College of Commerce & Eco. Tardeo. Mumbai 400034 2. Dr. Deepak. M. Salve The Bharat Education Society s Sant Gadge Maharaj
A Study of Migration of Workers in India
 SAMVAD: SIBM Pune Research Journal, Vol X, 59-66, December 2015 ISSN (Print) : 2249-1880 ISSN (Online) : 2348-5329 A Study of Migration of Workers in India Heena Upadhyaya * Faculty, Department of Business
Internal Migration Udaya S Mishra S Irudaya Rajan
 1 Internal Migration Udaya S Mishra S Irudaya Rajan Draft Thematic Paper 2 This is a draft thematic paper. It was prepared by Prof. Udaya S Mishra and S Irudaya Rajan from Centre for Development Studies.
Policy for Regional Development. V. J. Ravishankar Indian Institute of Public Administration 7 th December, 2006
 Policy for Regional Development V. J. Ravishankar Indian Institute of Public Administration 7 th December, 2006 Why is regional equity an issue? Large regional disparities represent serious threats as
Table 1: Financial statement of MGNREG scheme
 MGNREGA AND MINIMUM WAGE DEBATE - A fight for the right to get minimum wage The Government of India has introduced several social security schemes, but the Mahatma Gandhi National Rural Employment Guarantee
GUJARAT BECOMING NEW DESTINATION FOR INTER-STATE MIGRANTS
 Journal of Economic & Social Development, Vol. - XIII, No. 1, June 2017 GUJARAT BECOMING NEW DESTINATION FOR INTER-STATE MIGRANTS Anand S. Sugandhe* ISSN 0973-886X Interstate migration is the major phenomenon
Female Migration to Mega Cities of India
 Female Migration to Mega Cities of India ABSTRACT K. C. Das and Arunananda Murmu The present paper tries to understand the pattern and trend of female migration to six mega cities of India namely Mumbai,
DEMOGRAPHIC CHARACTERISTIC OF MUMBAI SUBURBAN DISTRICT
 CHAPTER 3 DEMOGRAPHIC CHARACTERISTIC OF MUMBAI SUBURBAN DISTRICT Introduction: Mumbai Suburban.District is the 31 st district formed in 1990 in the state of Maharashtra followed by the formation of other
Who Put the BJP in Power?
 Decoding the Government s Mandate Center for the Advanced Study of India, University of Pennsylvania August 7, 2014 Orienting Questions Introduction Orienting Questions BJP s Overall Performance BJP won
Urbanization Process and Recent Trends of Migration in India
 Urbanization Process and Recent Trends of Migration in India Ratnesh Shukla 1 & Kashif Imdad 2 Abstract Urbanization is a process of transformation from traditional rural economies to modern urban economies
Performance of Urban India during Globalization Period: An Economic Analysis
 CIRJE-F-543 Performance of Urban India during Globalization Period: An Economic Analysis Muttur Ranganathan Narayana CIRJE, University of Tokyo and Institute for Social and Economic Change January 2008;
Internal Migration for Education and Employment among Youth in India
 WP-2014-004 Internal Migration for Education and Employment among Youth in India S Chandrasekhar, Ajay Sharma Indira Gandhi Institute of Development Research, Mumbai January 2014 http://www.igidr.ac.in/pdf/publication/wp-2014-004.pdf
Human Development in State of New Andhra Pradesh- Emerging Issues and Policy Perspectives
 RESEARCH ARTCLE Human Development in State of New Andhra Pradesh- Emerging Issues and Policy Perspectives Dr. Guest faculty, Dept. of Economics,AcharyaNagarjuna University, Guntur ABSTRACT K. KISHORE BABU
Migrant Child Workers: Main Characteristics
 Chapter III Migrant Child Workers: Main Characteristics The chapter deals with the various socio, educational, locations, work related and other characteristics of the migrant child workers in order to
Rural-Urban Partnership For Inclusive Growth In India
 ISSN: 2278 0211 (Online) Rural-Urban Partnership For Inclusive Growth In India Amar Kumar Chaudhary Registrar, Ranchi University, Ranchi, India Abstract: It is rightly appropriate that the academicians,
FEMALE MIGRATION TO MEGA CITIES AND DEVELOPMENT IN INDIA Kailash C. Das and Arunananda Murmu
 FEMALE MIGRATION TO MEGA CITIES AND DEVELOPMENT IN INDIA Kailash C. Das and Arunananda Murmu Abstract Pattern and causes of female migration are changing in India. An increasing proportion of women are
PRESS RELEASE. NCAER releases its N-SIPI 2018, the NCAER-STATE INVESTMENT POTENTIAL INDEX
 For more information, please contact: Shilpi Tripathi at +91-11-23452605, stripathi@ncaer.org Sudesh Bala at +91-11-2345-2722, sbala@ncaer.org PRESS RELEASE NCAER releases its N-SIPI 2018, the NCAER-STATE
Association for Democratic Reforms
 Date: 9 th March, 2018 Press Release Analysis of NOTA Votes (2013-2017) Association for Democratic Reforms T-95, C.L. House, 2 nd Floor, Near Gulmohar Commercial Complex Gautam Nagar, New Delhi-110 049
Workforce Participation in Tribal Districts of Gujarat: Comparative Study of ST and Non ST
 Continuous issue-22 June July 2016 Workforce Participation in Tribal Districts of Gujarat: Comparative Study of ST and Non ST The constitution of India ensures that all citizens enjoy equal rights and
International Journal of Informative & Futuristic Research ISSN (Online):
:") Research Paper Volume 2 Issue 5 January 2015 International Journal of Informative & Futuristic Research ISSN (Online): 2347-1697 Regionalization Of Indian Politics: A Study In Paper ID IJIFR/ V2/ E5/ 007
Research Paper Volume 2 Issue 5 January 2015 International Journal of Informative & Futuristic Research ISSN (Online): 2347-1697 Regionalization Of Indian Politics: A Study In Paper ID IJIFR/ V2/ E5/ 007
Interstate Unskilled Migrants of Kerala, South India: The Push and Pull Factors of Long Distance Migration within a Country
 Interstate Unskilled Migrants of Kerala, South India: The Push and Pull Factors of Long Distance Migration within a Country N.Ajith Kumar 1 1.Introduction Kerala state had a long history of in migration
Annexure XI. Comments on the Feedback received during the Workshop on "the Study of Counter Magnet Areas to Delhi and NCR"
 Annexure XI s on the Feedback received during the Workshop on "the Study of Counter Magnet Areas to Delhi and NCR" I to 5 A Workshop on "Dissemination of CMA Study Findings and Interaction with Stakeholders"
Department of Statistics, St.Ann s College for women, Mehdipatnam, Hyderabad.
 ANNQUEST DECEMBER 2015 ISSN: 2321-3043 www.stannsannquest.com Causes and consequences of migration G Ramaa Deepthi, M Bhavana Abstract: Migration (human) is the movement of people from one place in the
[TO BE PUBLISHED IN THE GAZETTE OF INDIA, EXTRAORDINARY, PART II, SECTION 3, SUB-SECTION (i)]
![[TO BE PUBLISHED IN THE GAZETTE OF INDIA, EXTRAORDINARY, PART II, SECTION 3, SUB-SECTION (i)]](/thumbs/93/112545386.jpg "[TO BE PUBLISHED IN THE GAZETTE OF INDIA, EXTRAORDINARY, PART II, SECTION 3, SUB-SECTION (i)]") [TO BE PUBLISHED IN THE GAZETTE OF INDIA, EXTRAORDINARY, PART II, SECTION 3, SUB-SECTION (i)] Government of India Ministry of Finance (Department of Revenue) [Central Board of Indirect Taxes and Customs]
[TO BE PUBLISHED IN THE GAZETTE OF INDIA, EXTRAORDINARY, PART II, SECTION 3, SUB-SECTION (i)] Government of India Ministry of Finance (Department of Revenue) [Central Board of Indirect Taxes and Customs]
Socio-Economic Causes of Rural to Urban Migration in India
 138 ISSN 0975 5942 Vol.III(2), July-Dec 2011, pp.138-158 Visit: http://www.socialsciences-ejournal.org International Society for Asia-Pacific Studies (ISAPS), www.isapsindia.org Socio-Economic Causes of
STUDY OF SECTOR WISE GROWTH AND TRENDS IN EMPLOYMENT IN MAHARASHTRA By HeenaThakkar
 STUDY OF SECTOR WISE GROWTH AND TRENDS IN EMPLOYMENT IN MAHARASHTRA By HeenaThakkar Abstract: Maharashtra enjoys a historical reputation of being among progressive and well administered States in the country.maharashtra
Growth and Structure of Workforce in India: An Analysis of Census Data
 Article Growth and Structure of Workforce in India: An Analysis of Census Data Venkatanarayana Motkuri 1 Suresh V. Naik 2 The Indian Economic Journal 64(1 4) 57 74 2018 Indian Economic Association SAGE
DISPARITY IN HIGHER EDUCATION: THE CONTEXT OF SCHEDULED CASTES IN INDIAN SOCIETY
 IMPACT: International Journal of Research in Humanities, Arts and Literature (IMPACT: IJRHAL) ISSN(E): 2321-8878; ISSN(P): 2347-4564 Vol. 2, Issue 4, Apr 2014, 35-42 Impact Journals DISPARITY IN HIGHER
Citation IDE Discussion Paper. No
 TitleRural to Urban Migration: A Distric Author(s) Mitra, Arup; Murayama, Mayumi Citation IDE Discussion Paper. No. 137. 2008 Issue Date 2008-03 URL http://hdl.handle.net/2344/729 Rights < アジア経済研究所学術研究リポジトリ
Inequality in Housing and Basic Amenities in India
 MPRA Munich Personal RePEc Archive Inequality in Housing and Basic Amenities in India Rama Pal and Neil Aneja and Dhruv Nagpal Indian Institute of Technology Bobmay, Indian Institute of Technology Bobmay,
ELECTION NOTIFICATION
 National Neonatology Forum Office of Election Committee (NNF Election-2018) Child Central, 717/1, 16 th Main, 6 th B Cross, Koramangala, 3 rd Block, Bangalore-560034 Email-nnfelection@gmail.com, Contact-+917022283535
An Analysis of Impact of Gross Domestic Product on Literacy and Poverty of India during the Eleventh Plan
 IOSR Journal Of Humanities And Social Science (IOSR-JHSS) Volume 22, Issue 6, Ver. 6 (June. 2017) PP 41-45 e-issn: 2279-0837, p-issn: 2279-0845. www.iosrjournals.org An Analysis of Impact of Gross Domestic
Causes and Impact of Labour Migration: A Case Study of Punjab Agriculture
 Agricultural Economics Research Review Vol. 24 (Conference Number) 2011 pp 459-466 Causes and Impact of Labour Migration: A Case Study of Punjab Agriculture Baljinder Kaur *, J.M. Singh, B.R. Garg, Jasdev
URBANISATION IN INDIA: A DEMOGRAPHIC REAPPRAISAL. R. B. Bhagat Department of Geography Maharshi Dayanand University Rohtak , India
 Introduction: URBANISATION IN INDIA: A DEMOGRAPHIC REAPPRAISAL R. B. Bhagat Department of Geography Maharshi Dayanand University Rohtak-124001, India The United Nations estimates indicate that at mid 1990s,
Internal Migration in India Initiative
 Internal Migration in India Initiative Internal Migration in India Initiative What is the Internal Migration in India Initiative (IMII)? The Internal Migration in India Initiative (IMII) was jointly launched
INDIAN SCHOOL MUSCAT SENIOR SECTION DEPARTMENT OF SOCIAL SCIENCE CLASS: IX TOPIC/CHAPTER: 03-Poverty As A Challenge WORKSHEET No.
 INDIAN SCHOOL MUSCAT SENIOR SECTION DEPARTMENT OF SOCIAL SCIENCE CLASS: IX TOPIC/CHAPTER: 0-Poverty As A Challenge WORKSHEET No. : 4 (206-7) SUMMARY WRITE THESE QUESTIONS IN YOUR CLASS WORK NOTE BOOK 5,
India s economic liberalization program: An examination of its impact on the regional disparity problem
 India s economic liberalization program: An examination of its impact on the regional disparity problem JAISHANKAR RAMAN Introduction: For the past three decades, the buzz word in Economics has been Market
Social Science Class 9 th
 Social Science Class 9 th Poverty as a Challenge Social exclusion Vulnerability Poverty Line Poverty Estimates Vulnerable Groups Inter-State Disparities Global Poverty Scenario Causes of Poverty Anti-Poverty
Structure and Pattern of Urbanisation in Punjab: A Macro Level Analysis
 69 Singh & Singh: Urbanisation in Punjab Structure and Pattern of Urbanisation in Punjab: A Macro Level Analysis Paramjit Singh Panjab University, Chandigarh Balwinder Singh Punjabi University, Patiala
Determinants of Rural to Urban Migration in Large Agglomerations in India: An Empirical Analysis
 MPRA Munich Personal RePEc Archive Determinants of Rural to Urban Migration in Large Agglomerations in India: An Empirical Analysis Sabyasachi Tripathi and Hardeep Kaur Department of Economics, Lovely
ROLE OF PANCHAYATI RAJ ACT AND SSA IN THE DEVELOPMENT OF RURAL LIBRARIES IN MADHYA PRADESH
 ROLE OF PANCHAYATI RAJ ACT AND SSA IN THE DEVELOPMENT OF RURAL LIBRARIES IN MADHYA PRADESH Jayant, Jaswant Singh and Zia, Yasmeen Dept. of Library and Information Science SNGGPG(NUTAN) COLLEGE, BHOPAL
Rural Labour Migration in India: Magnitude and Characteristics
 I nte rnational J ournal of Applie d Rese arc h 2015; 1(2): 114-118 ISSN Print: 2394-7500 ISSN Online: 2394-5869 Impact Factor: 3.4 IJAR 2015; 1(2): 114-118 www.allresearchjournal.com Received: 15-12-2014
MIGRATION AND URBAN POVERTY IN INDIA
 1 Working Paper 414 MIGRATION AND URBAN POVERTY IN INDIA SOME PRELIMINARY OBSERVATIONS William Joe Priyajit Samaiyar U. S. Mishra September 2009 2 Working Papers can be downloaded from the Centre s website
DEMOGRAPHIC PROFILE OF TOURIST HOUSEHOLDS
 DEMOGRAPHIC PROFILE OF TOURIST HOUSEHOLDS It has been estimated that there were about 196 million households in India in the year 2002: 141 million (72 per cent) in rural and 55 million (28 per cent) in
Democracy in India: A Citizens' Perspective APPENDICES. Lokniti : Centre for the Study of Developing Societies (CSDS)
") Democracy in India: A Citizens' Perspective APPENDICES Appendix 1: The SDSA II (India component) covered states of India. All major states were included in the sample. The smaller states of North East
Democracy in India: A Citizens' Perspective APPENDICES Appendix 1: The SDSA II (India component) covered states of India. All major states were included in the sample. The smaller states of North East
Morphology of Urbanisation in India
 SPECIAL ARTICLES Morphology of Urbanisation in India Some Results from 1981 Census Rakesh Mohan Chandrashekhar Pant The Provisional Population Totals of the 1931 Census reveal a marked acceleration in
Narrative I Attitudes towards Community and Perceived Sense of Fraternity
 1 Narrative I Attitudes towards Community and Perceived Sense of Fraternity One of three themes covered by the Lok Survey Project is attitude towards community, fraternity and the nature of solidarity
ISSN: Int. J. Adv. Res. 4(11), RESEARCH ARTICLE...
, RESEARCH ARTICLE...") Journal Homepage: - www.journalijar.com Article DOI: 10.21474/IJAR01/2083 DOI URL: http://dx.doi.org/10.21474/ijar01/2083 RESEARCH ARTICLE IMPACT OF OUT-MIGRATION ON DEMOGRAPHICS: EVIDENCE FROM DARBHANGA
Journal Homepage: - www.journalijar.com Article DOI: 10.21474/IJAR01/2083 DOI URL: http://dx.doi.org/10.21474/ijar01/2083 RESEARCH ARTICLE IMPACT OF OUT-MIGRATION ON DEMOGRAPHICS: EVIDENCE FROM DARBHANGA
Research Innovator: International Multidisciplinary Peer-Reviewed Journal ISSN: Print: ISSN: Online:
 Basic Infrastructural Development and Improvement of Social-Economic Indicator in Madhya Pradesh Dr. Rajesh Prasad Tiwari Professor of Economics, Sharda P.G. College, Sarla Nagar, Maihar, Dist. Satna (M.P.)
MGNREGA: Making Way for Social Change in Women s: A Case Study of Musunuru Mandal in Andhra Pradesh
 Volume-4, Issue-6, December-2014, ISSN No.: 2250-0758 International Journal of Engineering and Management Research Available at: www.ijemr.net Page Number: 1-5 MGNREGA: Making Way for Social Change in
Changing Character of Rural Economy and Migrant Labour in Punjab
 57 Lakhwinder Singh et al: Migrant Labour Changing Character of Rural Economy and Migrant Labour in Punjab Lakhwinder Singh, Inderjeet Singh and Ranjit Singh Ghuman Punjabi University, Patiala Rural economy
Calculating Economic Freedom
 2 Calculating Economic Freedom Laveesh Bhandari 1 Background As discussed in the previous chapter, the term economic freedom can have many connotations and depending upon which one is used the measurement
Structural Dynamics of Various Causes of Migration in Jaipur
 Jayant Singh and Hansraj Yadav Department of Statistics, University of Rajasthan, Jaipur, India Rajesh Singh Department of Statistics, BHU, Varanasi (U.P.), India Florentin Smarandache Department of Mathematics,
CHAPTER - II DEMOGRAPHIC CHARACTERISTICS OF RURAL POPULATION
 CHAPTER - II DEMOGRAPHIC CHARACTERISTICS OF RURAL POPULATION The study of population characteristic is one of the most important topics in the geographical analysis of any region. The element of man has
CHANGING WORKFORCE OF MUMBAI: A CRITICAL ANALYSIS
 CHANGING WORKFORCE OF MUMBAI: A CRITICAL ANALYSIS P.Princy Yesudian Introduction Cities are regarded as engines of economic growth. A City serves as a catalyst for development within their respective wider
June Technical Report: India State Survey. India State Survey Research Program
 June 2016 Technical Report: India State Survey India State Survey Research Program TABLE OF CONTENTS Overview... 3 Sampling Methodology... 3 Target Population/Coverage... 3 Sampling Frame... 3 Stratification/Sample
Socio Economic and Regional Disparities: Some Implications for India
 Int. Journal of Management and Development Studies 5(4): 61-66 (2016) ISSN (Online): 2320-0685. ISSN (Print): 2321-1423 Impact Factor: 0.715 Socio Economic and Regional Disparities: Some Implications for
ECONOMIC CONDITIONS OF THE MIGRANT WORKERS IN KERALA: A STUDY IN THE TRIVANDRUM DISTRICT
 (ISSN: 2321-4155), 33-46 Economics ECONOMIC CONDITIONS OF THE MIGRANT WORKERS IN KERALA: A STUDY IN THE TRIVANDRUM DISTRICT Dilip Saikia* ABSTRACT In recent years, Kerala has been experiencing a large
The Socio-economic Status of Migrant Workers in Thiruvananthapuram District of Kerala, India. By Dilip SAIKIA a
 Journal of Economic and Social Thought www.kspjournals.org Volume 3 March 2016 Issue 1 The Socio-economic Status of Migrant Workers in Thiruvananthapuram District of Kerala, India By Dilip SAIKIA a Abstract.
Evaluation of Upliftment of Scheduled Tribes under MGNREGA
 IOSR Journal Of Humanities And Social Science (IOSR-JHSS) Volume 19, Issue 8, Ver. IV (Aug. 2014), PP 08-12 e-issn: 2279-0837, p-issn: 2279-0845. Evaluation of Upliftment of Scheduled Tribes under MGNREGA
Public Affairs Index (PAI)
") Public Affairs Index (PAI) A Closer look at Andhra Pradesh NOTE: All the data and rankings presented in PAI represent the united Andhra Pradesh (before the bifurcation) Contents of the Presentation About
Public Affairs Index (PAI) A Closer look at Andhra Pradesh NOTE: All the data and rankings presented in PAI represent the united Andhra Pradesh (before the bifurcation) Contents of the Presentation About
INDIA JHPIEGO, INDIA PATHFINDER INTERNATIONAL, INDIA POPULATION FOUNDATION OF INDIA
 INDIA JHPIEGO, INDIA PATHFINDER INTERNATIONAL, INDIA POPULATION FOUNDATION OF INDIA Expanding Advocacy Efforts Geographical expansion Partnership expansion Expanded to two states: Assam and Maharashtra
Women and Wage Discrimination in India: A Critical Analysis March
 International Journal of Humanities and Social Science Invention ISSN (Online): 2319 7722, ISSN (Print): 2319 7714 Volume 2 Issue 4 ǁ April. 2013ǁ PP.06-12 Women and Wage Discrimination in India: A Critical
Trans. Inst. Indian Geographers. Fig.2 : Consistency in the seats won by the BJP: (See page 66 for text)
") Trans. Inst. Indian Geographers Fig.2 : Consistency in the seats won by the BJP: 1989-2004 (See page 66 for text) Transactions Vol. 36, No. 1, 2014 61 Trans. Inst. Indian Geographers Fig.3 : Consistency
Trans. Inst. Indian Geographers Fig.2 : Consistency in the seats won by the BJP: 1989-2004 (See page 66 for text) Transactions Vol. 36, No. 1, 2014 61 Trans. Inst. Indian Geographers Fig.3 : Consistency
INTERNATIONAL JOURNAL OF BUSINESS, MANAGEMENT AND ALLIED SCIENCES (IJBMAS) A Peer Reviewed International Research Journal
 A Peer Reviewed International Research Journal") RESEARCH ARTICLE Vol.4.Issue.4.2017 Oct-Dec INTERNATIONAL JOURNAL OF BUSINESS, MANAGEMENT AND ALLIED SCIENCES (IJBMAS) A Peer Reviewed International Research Journal THREE TIER MECHANISM OF CONSUMER DISPUTES
RESEARCH ARTICLE Vol.4.Issue.4.2017 Oct-Dec INTERNATIONAL JOURNAL OF BUSINESS, MANAGEMENT AND ALLIED SCIENCES (IJBMAS) A Peer Reviewed International Research Journal THREE TIER MECHANISM OF CONSUMER DISPUTES