Food secure. Marginally Food Secure Moderately Insecure Severely Insecure
|
|
|
- Kathryn Parsons
- 5 years ago
- Views:
Transcription

.")


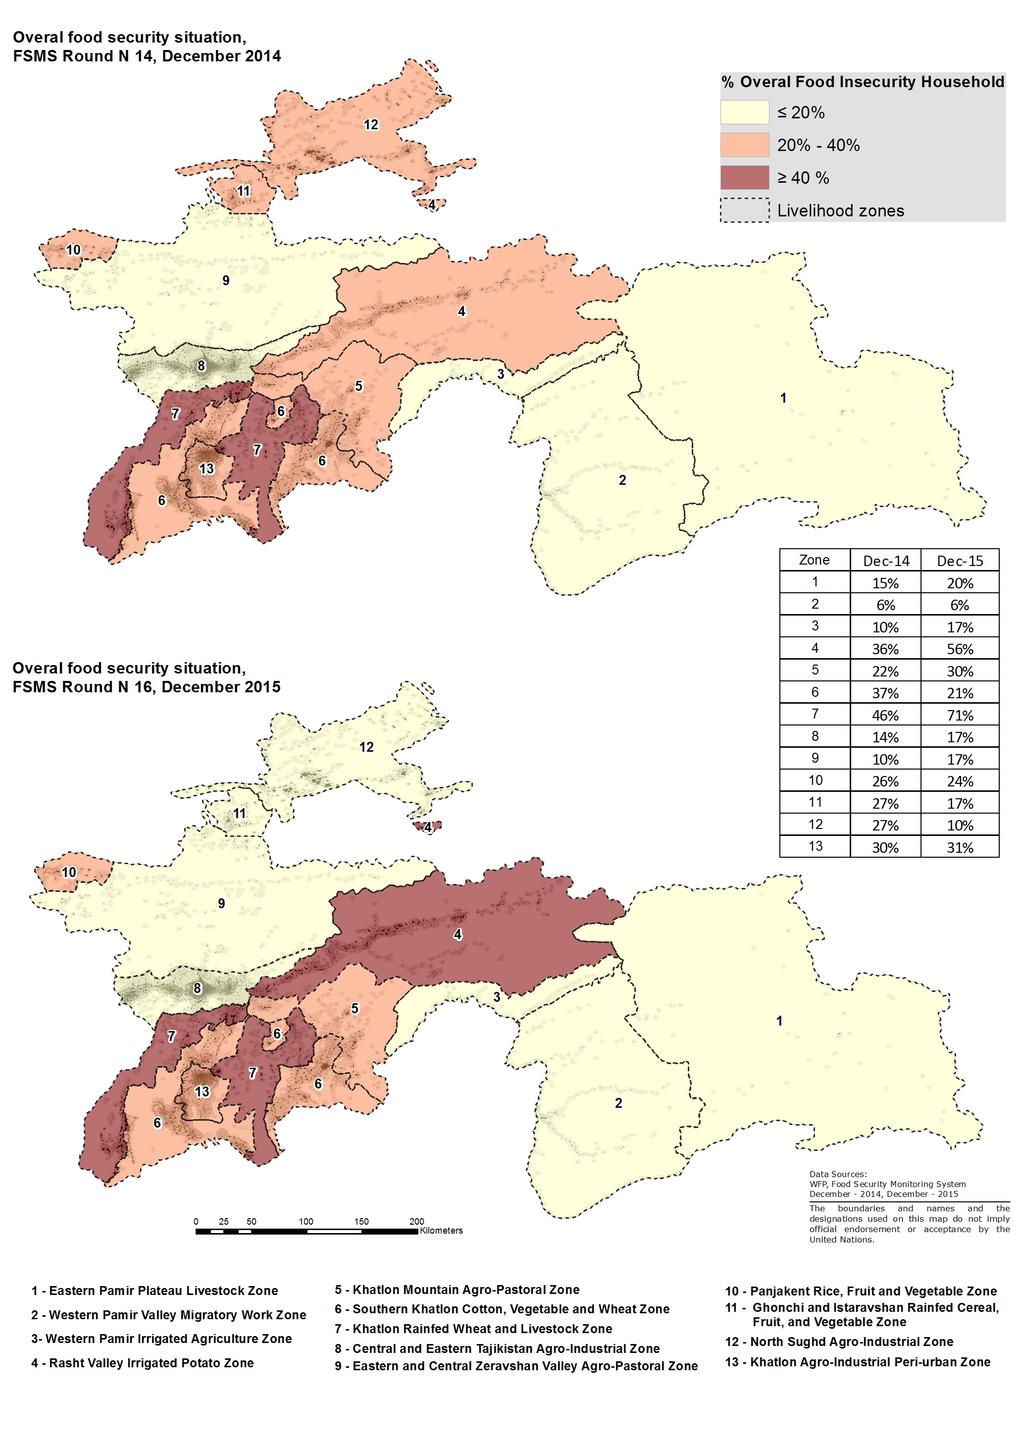
1 Highlights The Russian economic downturn continued in 2015 reducing employment opportunities for Tajik labour migrants in the Russian Federation. Being one of the remittance dependent countries combined with depreciation of the Russian ruble, the crisis increased the volume and frequency of reduction in remittances, 80 percent of which are reportedly used by Tajik households to purchase food. Most indicators of food security have remained relatively stable and some of them have deteriorated compared to the data from the same period in 2014 (Figure 1). Food Security analyses of key indicators (current food consumption status, percent of food expenditure and use of livelihood coping/asset depletion strategies) confirm that 5 percent of the total interviewed households are severely and 22 percent are moderately food insecure, compared to 4 and 23 respectively for same season in December % 23% 5 33% % 5 23% 5 33% 2 4% 4% 5% 5% Nov 2012 Apr 2014 Dec 2014 Apr 2015 Dec 2015 Food secure Marginally Food Secure Moderately Insecure Severely Insecure Tajikistan Food Security Monitoring System February 2016 NUMBER 16 and Rasht Valley zone have sharply deteriorated with the highest proportion of severely and moderately food insecure households. Meanwhile areas with relatively better indicators in previous surveys have deteriorated this time around, such as Eastern and Central Zeravshan, Western Pamir and Khatlon Mountain area. The Coping Strategy and Food consumption indicators show that households affected by a reduction of remittances coped worse than households whose income from remittances remained unaffected, in particular: 41 percent spent savings, 26 relied on less preferred or less expensive food, 39 percent of affected households purchased food on credit, 11 percent had poor and borderline food consumption score. According to the country s State Statistics Agency (SSA), the production of cereals in 2015 was equal to 1.39 million tons, up 5.7 percent against the previous year and more by 10.5 percent compared to the 5 year average ( ). The wheat flour price was higher by 7.8 percent in December 2015 compared to December 2014 even though the agriculture sector performed well and the wheat imports increased in comparison to the same period last year. The most important reason for households to take on new debts was to buy food, reported around 48 percent, which is higher in comparison to December 2014, when the proportion was 40 percent. Other 16 percent of the interviewed households accrued new debt to seek health care, which is 7 percent more than the same season of Severe weather conditions and natural shocks impacted households in the second half of the year 2015 (34 percent households reported severe weather conditions and 25 percent reported harvest failures ). High disruption of food stocks was also observed (64 percent of households reported possession of food stocks compared to 74 percent in Dec 2014). Figure 1: Overall Food Security Food insecurity still affects certain areas more than others: Southern Khatlon, North Sughd, Ghonchi and Istaravshan show improvements, Khatlon Rainfed zone The Food Security Monitoring System (FSMS) provides a seasonal trend of food insecurity in rural Tajikistan by analyzing data across 13 livelihood zones. The data for this bulletin was collected in December
2 Context and Recent Developments Fighting Hunger Worldwide Reliance on food imports and external market variations, vulnerability to natural disasters, limited arable land, and a landlocked geographic location still contribute in making Tajikistan one of the poorest countries in Central Asia. Tajikistan s GDP growth was 6 percent in 2015 according to official statistics, below growth figures of 2014 (6.7 percent) and 2013 (7.4 percent). Despite having reached lower-medium income status in 2015, Tajikistan still remains the only country in Central Asia that is categorized as facing serious food security issues according to the 2015 Global Hunger Index (GHI) report by the International Food Policy Research Institute (IFPRI). According to the country s State Statistics Agency, the production of cereals in 2015 was 1.39 million tons, 5.7 percent more compared to the previous year 1. The production of wheat itself increased in 2015, 838 thousand tons against thousand tons in 2014, which is almost 9 percent more compared to The import of the wheat increased as well by 11 percent in 2015, from 775 thousand in 2014 to 860 thousand in Despite of the relatively better availability of cereal products during this year (Figure 2), the retail prices for wheat flour were 7.2 percent higher 3 in the 4th quarter of 2015 compared to 4th quarter of 2014, the year with poorer availability of this main staple product observation. Due to inflation, prices food items has been raised by 4.13 percent, for non-food items by 7.8 percent. Prices for paid services went up by 2.3 percent 4. This presents an obstacle to food security for many households. During previous rounds of FSMS, many households were benefitting from remittances, which improved their food consumption and purchasing power. However income from remittances declined in the first half of 2015 against the same period in Working migrants decreased by more than 10 percent in the 4th quarter of Such dependency represents a higher risk for GDP growth, livelihoods and food security. A sudden economic or political downturn would result in a much sharper reduction in income with immediate and direct impact on households purchasing power. Rate of Tajik Somoni (TJS) depreciated against US Dollar by approximately 32 percent according to National Bank of Tajikistan since last year. It also caused the price of other main imported staple products in Tajikistan to increase. For instance, sugar price increased up to 14 percent, in comparison to December Real remittance income continued to fall in January This is partially seasonal, but the Ruble continued to decline in value, also driving down the value of earnings in Somoni terms. The average real value of remittances decreased from a high of about 1100 Somoni in November to about 775 Somoni in January TJS/Kg JAN FEB MAR APR MAY JUN JUL AUG SEP OCT NOV DEC *Five-year average * Figure 2: Wheat flour first grade price Despite good harvests of other products and quite stable prices of vegetables and meat products in 2015, prices for other main staple products (wheat flour, sugar, vegetable oil, milk products) remained higher than the previous year of 1 Socio-Economic Situation in Tajikistan 2015, , State Statistics Agency of the Republic of Tajikistan, p CUSTOMS SERVICE OF TAJIKISTAN 3 WFP market prices monitoring, VAM Country Report Portal: Malnutrition was and remains an issue in Tajikistan since the last countrywide Demographic and Health Survey (DHS) in Acute malnutrition (wasting) affects 10 percent of children under five, which also includes four percent that are severely wasted. Chronic malnutrition (stunting) has not changed significantly based on DHS 2012 figures against nationwide survey in 2005, with a prevalence of 26.0 percent measured in Anemia also presents a public health concern, with a prevalence of 24.2 percent among women of reproductive age and of 28.8 percent of children 6-59 months 8. 4 National Bank report: January-June_2015_en.pdf 5 Asian Development Bank, tajikistan/economy 6 World Bank survey Listening to Tajikistan : worldbank.org/en/country/tajikistan/brief/listening2tajikistan Tajikistan Demographic and Health Survey (DHS) 2
3 Focus on Remittances: Backround Remittances, mostly from migrants working in Russia, equal to approximately 43 percent of the Tajikistan s Gross Domestic Product (GDP) making Tajikistan one of most remittancedependent country in the world. Following the contraction of Russian GDP by 4.6 percent in the second quarter, a renewed downward trend registered in the second half of 2015 in the exchange rate of the Russian Ruble against the US dollar. This is having serious negative impacts on households relying on remittances from Russia for their livelihoods, with food security being a primary concern (for approximately 24 percent of rural households). Remittances from labour migrants have been one of the key contributors to Tajikistan s economic growth and poverty reduction. According to the National Bank remittances dropped by 32 percent in first 6 months of 2015 and poverty rate reached 36.1 percent in rural areas 9. 1 USD in Rouble USD in Rouble 1 USD in Tajik Somoni Figure 3: Depreciation of the Somoni and Rouble national average retail price of wheat flour has increased by 2.5 percent, price of sugar rose by 14 percent, and the price of rice and vegetable oil increased by 4 percent between December 2014 and December 2015.This further put economic pressure on low-income households which already spend a large proportion of their budget on food USD in Tajik Somoni Tajikistan is already feeling the Russian ruble collapse 10. The main indicator of the ruble crisis for Tajikistan is the return of labor migrants in large volumes and inability to send migrants to Russia compared to the December According to the Migration Service under the Ministry of Labour, Migration and Employment of Tajikistan, 523,500 labour migrants went to Russia from 01 January 2015 to 01 December 2015, which is on average 25 percent lower than As per data of the Federal Migration Service of the Russian Federation, the number of male Tajik nationals living in Russia reportedly decreased during the last year by 14.3 percent from 817,000 in January 2015 to 700,000 in January The number of female Tajik nationals living in Russia decreased over the reported period by 11.5 percent from 182,000 in January 2015 to 161,000 in January The economic slowdown in Russia had a major impact on Tajikistan s economy in 2015 through decreased US Dollar value of remittances and along with the strong depreciation of the Russian ruble and National Tajik Somoni 12 (Figure 3). This slowed the growth in services, lowered purchase power and domestic demand and put inflationary pressure on the price of the main staple products for Tajik households. The 9 World Bank s Economic Update No.2 (p.1, p.5) Asia plus Based on exchange rates of National Bank of Tajikistan (from 1st Jan 2015 to 1st Jan 2016) Despite the Rouble crises in Russia, flow of remittances in the rural area for this round was slightly higher compared to December The main reason for the higher remittances is attributed to all the savings sent by migrants before their return back, the share of which (returning migrants) decreased at the end of As shown in Figure 4, the share of households receiving remittances, which experienced a reduction in volume and frequency of remittances, increased in December 2015 compared to December 2014 confirming a downward trend of remittances volume in the first paragraph. It is important to note that, 64 percent of the households indicated that their % 1 Receiving Remittances Figure 4: Remittances impact 13 World Bank, Listening to Tajikistan pdf 54% 6 64% Less Frequent Reduced Volume Wellbeing Affected by Change Dec-14 Apr-15 Dec-15 3
4 subjective wellbeing around December 2015 was negatively affected by change in the amount of remittances, more than 14 percent compared to April 2015 and more than 2 times against December The indicator of the wellbeing might be deteriorating as a result of decrease in expenditure on food and healthcare in order to pay for other basic needs 14. Figure 4 does not include households which did not receive remittances at all, over the past three months, which may slightly increase the percentage of overall affected households having migrants. Current FSMS results show that 86 percent of the remittances received are used by households to purchase food, which is more than 8 percent compared to same season of 2014, indicating that remittances are essential for the food security of families receiving them. Meanwhile household use of remittances for construction has decreased forming a continuous trend around 5 percent during last 3 rounds into 2 percent respectively in December Therefore, reduced frequency and amount of remittances have a direct negative impact on household food security. Focus on Remittances: Impact on Household Food Security In terms of Food Consumption Score (FCS), a small difference was observed between the wellbeing of affected households through reduction in remittances and non-affected households with a percentage of households that had an acceptable FCS without resorting to coping strategies (Figure 5). % of Housholds % % 4.5% Not Affected Affected No Remittances Acceptable without consumption coping Acceptable with consumption coping Borderline Poor Figure 5: Food Consumption Score World Bank report Listening to Tajikistan en/country/tajikistan/brief/listening2tajikistan Households affected by a reduction of remittances had better FCS than the ones of the households that received no remittances at all, although with a slight difference in the shares of the households with a borderline and poor FCS 15. This round of FSMS is reporting that more households (14.3 percent) receiving reduced remittances had to resort to coping strategies to maintain an acceptable FCS compared to households not affected by reduced remittances (11.2 percent). The coping strategy most typical of the affected group was to resort to spend savings (41 percent in December against 21 percent in April), though purchasing food on credit remained the most frequent coping strategy for all groups (Figure 6). Spend savings Purchase food on credit Rely on help from others Income Diversification Increase labour migration 5% 23% 33% 4 26% 3 16% 25% Figure 6: Households Applying Livelihood coping Strategies On the other hand, the decline in remittances does not seem to have had a significant impact on households assets yet. An observation with serious consequences, however, is that the affected group has now joined the nonremittances group in decreasing expenditures as their main coping strategy (Figure 7). Decrease expenditures for 1 health care Figure 7: Households Asset Depletion Strategies 15 Households with poor or borderline food consumption patterns have limited access to protein sources, fruits, and vegetables, which jeopardizes the nutrition status of affected households. 6% Not Affected Affected No Remittances Decrease Agricultural Expenditures Sell more animals than usual Sell productive assets Sell domestic assets 6% 14% 1 5% 15% 25% Not Affected Affected No Remittances 4
5 The group affected by a decline in remittances has also clearly joined the non-remittances receiver group. By resorting much more frequently to negative food consumption patterns (Figure 8), the gap has widened between the betteroff remittances receivers. The most frequently used strategy by households was relying on less preferred food and less expensive food. This is not different from other households but the difference between households affected by a drop in remittances (26 percent) and unaffected households (21 percent) indicates that the poorer food consumption pattern among the affected households is likely due to a reduced or unpredictable income from remittances. Rely on less preferred and less expensive food Limit portion size at meals Consume seed stocks held for the next season Reduce number of meals eaten in a day Restrict cons. by adults in order for children to eat Restrict consumption by women Skip entire days without eating 5% 13% 5% Figure 8: Households Applying Food Consumption Strategies 26% 33% Not Affected Affected No Remittances As described above, using remittances for the construction of houses became less common during the surveyed period. Similarly, fewer households took out new loans for construction and for purchasing agricultural inputs. Twelve percent of households affected by a reduction in remittances accrued new debt in the three months prior to December 2015, against only 8 percent of the households not affected. In many cases (40 percent of the affected households), new debt was accrued to purchase food on credit: while 39 percent of all borrowing by households with reduced remittances was from shop owners, and only 12 percent of the unaffected households accrued new debts from shops during that period. Panjakent, Ghonchi and Istaravshan, Darvoz and Kurgan Tyube, (between 20 and 30 percent). These remittance-dependent areas are likely to suffer more severe consequences than the Rasht Valley and the Eastern Pamir Plateau. 26% 24% % 24% 25% % 15% 1 13% 5% 3% Average Nov 12 to Apr 15 Dec-15 Figure 9: Households dependency on remittances Focus on Remittances: Outlook for the next six months Although being still very important, remittances and migration will continue decreasing and will contribute less and less to household incomes. Migrants will return slowly, however in some regions migration will not be reduced at all, but on the contrary, it will increase as a coping strategy. The continued recession in Russia will negatively affect the amount of remittances being sent by labour migrants working in Russia. In the current context of slowed economic growth in Russia and weak currency, the coming seasonal increase in remittances will not be expected for all households. Food prices will be expected to go up slightly during the coming months because of a tendency for a seasonal increase, depreciation of the national currency and forecasted high inflation in These factors will continue to put economic pressure on low income groups which spend a large portion of their budget on food, especially those with migrants who are unable to return to their jobs abroad. It is important to note that the impact of the drop of remittances on food security outcomes will vary per region (Figure 9), depending on the importance of remittances as income source in that region. For instance, while in the Khatlon Mountains, Rasht and Eastern Pamir only 1 to 15 percent of households depend primarily on remittances, this proportion is much higher in the Central and Eastern Zeravshan valley, 5
6 Exposure to Economic and Natural Shocks 16 High food prices remain the main economic shock for households in all zones. Majority of the respondents reported high food prices as one of the three main shocks in the past three months before the survey (Figure 10). However, high food prices were mentioned as an economic shock only by 79 percent of the households, which is slightly lower compared to April This indicates good harvest season and higher volume of imported cereal products % 84% 76% % 3 24% 26% 16% % 15% Apr 2014 Dec 2014 Apr 2015 Dec 2015 Figure 10: Households Reporting Economic Shocks High fuel prices were reported as a shock within three months before the survey by 62 percent of the households. In April 2015, only 43 percent of respondents considered high fuel prices as a shock affecting the household food security. The reason could be the increased demand for fuel in the harvest season due to expansion of agricultural work in the fields. Loss of employment or reduced salary of the breadwinners affected 26 percent of households, which is much higher than the same season of December 2014, when 24 percent reported facing this difficulty. Natural disasters such as flooding and landslides impacted more households in the second half than the first half of 2015 (Figure 11). The high percentage of households reported severe weather conditions (34 percent) caused by severe mudflows and earthquake in GBAO and Rasht. Harvest failures (25 percent) can be attributed to heavy snowfall and frost wave at spring time (2015) in the Northern Sughd and Panjakent, where majority of households were impacted by harvest failures due to bad weather conditions. According to the Committee of Emergency Situation, the estimated damage from natural disasters reached 326 million TJS, which is almost 8 times more than Shocks are defined by an event that has a negative impact on food security and nutrition. Shocks can be natural or caused by human action 45% 35% 25% 15% 5% % 33% Figure 11: Households Reporting Natural Shocks Some shocks were repeatedly reported over the past year and identified as chronic issues that need to be addressed at any time of the year such as access to drinking water and agricultural water. Reduced agriculture and drinking water was reported by nearly 33 percent of the respondents. The scarcity of irrigation water still remains among the top concerns for households in rural areas, particularly those residing in zones with agricultural production as a main livelihood. The main reason for that still remains slow rehabilitation of irrigation infrastructure, rundown of pumping system and land degradation. The areas where the most households reported to have been affected by reduced agricultural water were Panjakent (61 percent), and Khatlon Rainfed area (60 percent). Crop pests and diseases increased from 28 percent in December 2014 to 30 percent in December 2015 and 10 percentage points more than in April This is likely to have been caused by relatively warmer temperatures. Food Stocks 34% % 4% 26% 25% 1 16% Apr 2014 Dec 2014 Apr 2015 Dec 2015 High disruption was observed in food stocks (Figure 12) compared to December Only limited rural households stored surplus food, especially wheat flour and potatoes, in anticipation for the winter months when food availability and access is low. During this round of the survey, 64 percent of households reported that they currently possessed food stocks, which is less (for all products) by 10 percent than in December 2014 (74 percent). Food stocks for main staple products has been depleted significantly. Wheat flour and potato stocks in households decreased to 53 percent, which is 35 percent less compared to December Households reported sharply reduced stocks of oil, fruit and vegetable, only 25 percent 6
7 possessed fruit/vegetable stocks and 38 percent of respondents had oil stocked. 60 percent of households indicated that the main source for food stocks was a local market, 30 percent of the stocked food came from their own crop and garden production, 6 percent from borrowing or debts, and the remaining 4 percent from relatives aid and bartering. Livestock possessed by households also decreased to 72 percent in 2015 against 79 percent in % 86% 76% % 66% % Figure 12: Food stocks % Apr 2014 Dec 2014 Apr 2015 Dec 2015 The food stocks prepared by households in December 2015 were expected to last for 6.8 weeks on average, similar to the response in December 2014 (6 weeks), but this varies depending on livelihood zones. In the Khatlon livelihood zone (excluding the mountainous area) household stocks reportedly lasted for only 3 weeks, the lowest average in the country. Food Consumption and Dietary Diversity 74% 63% 64% % During the surveyed season the average Food Consumption Score did not show substantial change from previous FSMS results (Figure 13) % % 6 16% 13% 1 5% 4% 6% 6% 5% Nov 2012 Apr 2014 Dec 2014 Apr 2015 Dec 2015 The combined percentage of poor and borderline households stayed within the narrow band width of 12 and 19 percent which was observed in the last three years. Though, it was only two percent lower in December 2015 than during the same period last year, possibly because of better harvest and increased importing of main staple foods in However, 15 percent of the households have poor or borderline food consumption patterns. Households with poor or borderline food consumption patterns have limited access to protein sources, fruits, and vegetables. In addition, 16 percent of households with acceptable consumption are at risk because they rely on consumption-based coping strategies. In the event of constricted resources, they will reduce consumption of better quality foods, thus pushing them into the borderline category. rfsd The FCS of female headed households improved from 8 percent, having a poor FCS in December 2014, to 6 percent in December In the same period, the indicator for male headed households did insignificantly change by only half percent (from 4.5 to 5 percent). dfs FCS for December 2015 divided per livelihood zone indicates differences between areas (Figure 14). Rasht scored worse than almost 56 percent of the interviewed households with either a borderline or poor FCS, which is increased from 31 percent score recorded in December 2014, but shows improvement in comparison with April 2015 (from 71 to 56). As explained in the special focus section, remittances are usually much less of an income source for households in the Rasht valley, than in other livelihood zones like Darvoz/Vanj (one of the most remittances dependent zones), which moved from group of zones with best food consumption into group of zones with medium indicator (from 0 to 14 percent) in December 2015 in comparison with the same period in Therefore, it is likely that a decline in % 16% 2 16% 2 16% 1 26% 1 13% 6% % 6% 3% 3% 3% 3% 4% 3% 5% Poor Borderline Acceptable with coping Acceptable without coping Figure 13: Food Consumption Score Trends Poor Borderline Acceptable with consumption coping Figure 14: Food Consumption Score Classifications per Region (December 2015) 7
8 remittances was the one the main causes of this rapid deterioration in the households with labour migrants in the above mentioned livelihood zone. The densely populated Khatlon Rain Fed area also comprised a large percentage of households with a poor and borderline FCS: 28 percent, 7 percent more than in April The best FCS was observed in the Western Pamir Valley (97 percent acceptable without coping strategies), and in North Sughd and Khatlon Mountains (87 and 86 percent). Southern Khatlon, Kurgan Tyube and Panjakent sorted again as chronically stressed zones, similar to the last 10 rounds of food monitoring surveys that show almost the same indicators with periodic improvements and deteriorating trends. Meanwhile, in 2015 FCS worsened in Panjakent up to 16 percent ( poor and borderline ) in December 2015 compared to December Households classified as borderline did slightly better than poor but still consumed dairy and meat products only once a week and vegetables only twice a week. (Figure 15) It is worthy to note that despite the availability of fruits and vegetables in local markets and relatively stable prices of meat, on average borderline households only consumed dairy and meat products once a week and households with a poor FCS did not consume dairy and meat products at all (16 percent of the responded households) Poor Borderline Acceptable Cereals Pulses Vegetables Fruits Meat Dairy Sugar Oil Figure 15: Food Groups Consumed per Week, per FCS Classification Households in the acceptable food group category ate more vegetables and fruits and food rich of proteins, including meat for 5 days in the week preceding the survey. Nonetheless, a low dietary diversity remained a key problem for families of poor and borderline category. The diet of the households with poor and borderline dietary diversity was exclusively based on staples and oils (consumed 4-5 days a week) with some 6 6 sugar (4-5 days a week). An average household with a poor FCS consumed cereal products every day of the week, but consumption of dairy, meat and vegetable proteins were essentially absent. This entails serious risk of protein malnutrition, iron deficiencies and diseases especially for young children, pregnant and lactating women, and the elderly The Dietary Diversity Score (DDS), which indicates how many out of the seven food groups and have been consumed in the last seven days prior to the interview, deteriorated in December 2015 compared to preceding FSMS round in the same period (Figure 16). The percentage of households with an inadequate diet has steadily increased since November In December 2015, 18 percent of the households had consumed 4 or less food groups in the last seven days, which is considered an inadequate diet, up from 12 percent in November This trend was confirmed by the FGDs in 2015, where it was identified that people purchased, for example, less meat in order to sustain similar levels of cereal and potato consumption. Two outliers performing much worse than the average were the Eastern Pamir Plateau (67 percent) and the Rasht valley (60 percent) in the 0-4 category % 34% % Nov 2012 Apr 2014 Dec Figure 16: Dietary Diversity Score Apr Dec 2015 It is worthy to mention that although the number of families with poor and borderline food consumption are relatively the same since November Households which have acceptable food consumption had increased slightly, but they are still at risk, because they rely on consumption-based coping strategies. In the event of an economic/natural shock or constriction of resources, they will reduce consumption of better quality foods, thus falling into the borderline category of food consumption patterns and less varied diet. 8
. 11.3 9.6 6.")
9 Infant and young child feeding practices Fighting Hunger Worldwide During this round of FSMS, a total number of 894 children under 5 years of age were surveyed to assess infant and young child feeding practices. Age distribution of the surveyed children is provided below (Figure 17) Figure 17: Children distribution by age Breastfeeding: While 6 of the children under 6 months received breast milk on the day before the survey, only 34 % were exclusively breastfed as recommended. The remaining 35 % received plain water (40 %) or sugary water (), tea (36%), animal milk (6 %), bread (20 %) or potatoes (20 %) in addition to breastmilk. Overall, about 1 of the children under 6 months received infant formula. The children who did not receive either breast milk or infant formula on the day before the survey (about 3) received different solid and semi-solid food items, mainly from Food Group 1 (bread and potatoes), tea/plain water, and other vegetables). Complementary feeding: While it is recommended to start complementary feeding months 6-8 months 9-11 months months months Breastfeeding yesterday Solid, Semi-solid Food yesterday 35% 76% 0-5 months 6-8 months 9-11 months months months Figure 18: Breastfeeding and indroduction of comlementary foods 53% % at the age of 6 months, only 35% of the surveyed children 6-8 months of age received solid or semisolid foods (Figure 18). Only 16 % of breastfed children and 46% of non-breastfed children aged 6-23 months received foods from 4 or more food groups (minimum dietary diversity). The survey results also indicate that only 2 of children aged 6-23 months were fed iron-rich food or iron-fortified food. In general, the diet of children under 5 years leans toward grains, roots and tubers. Eggs, flesh foods (meat, fish, poultry and liver organ meats), legumes and nuts are the least commonly fed foods (Figure 19) as only about one third of children months received eggs, meat, chicken, fish and legumes % % 43% Figure 19: Percentage of consumers of different food groups This percentage goes further down among children 6-23 months of age. Though, high intake of sugary water or fruit juices was noted. Moreover, only 17 % of non-breastfed children aged 6-23 months and 37 % of breastfed children aged 9-23 months were fed the minimum number of times recommended per day 17 (minimum meal frequency). Overall, only 24 % of children 6-23 months of age received a minimum acceptable diet in terms of dietary diversity and meal frequency In conclusion, infant and young child feeding practices observed in the survey are suboptimal, characterized by low rate of exclusive breastfeeding among children under 6 months; late or too early initiation of complementary feeding; low dietary diversity; and inadequate meal frequency. 17 Minimum is defined as: 3 times for breastfed children 9-23 months; 4 times for non-breastfed children 6-23 months 66% 3 53% 23% 43% % 16% 3 13% 3 1 5% 4% 6% 9
10 Coping Strategies Most common consumption-based strategies applied are the reliance on less preferred and lower quality food types, limiting portions of meal, followed by reducing number of meals consumed in a day. The widely applied food consumption strategy in December 2015 was the reliance on less expensive food (Figure 20), applied by 31 percent of households, slightly down from 37 in April 2015 and 38 percent in December 2014 respectively. The more extreme strategies were applied less often in December 2015 compared to December The consumption of seed stocks for next planting season decreased by 4 percent, the reduction of the number of meals per day by 6 percent, restriction of adults consumption by 4 percent and restriction of consumption by women by 3 percent. Rely on less preferred and less expensive food Limit portion size at meals Consume seed stocks held for the next season Reduce number of meals eaten in a day Restrict cons. by adults in order for children to eat Restrict consumption by women Skip entire days without eating 1 13% 1 14% 14% 15% 6% 25% 1 23% Figure 20: Households Food Consumption Strategies More than third of interviewed households continued to apply asset depletion strategies such as reducing expenditure on health care, and decreasing investments in agriculture, including expenditures for fertilizer, pesticide and veterinary care (Figure 21). Although the proportion of households using these strategies increased compared to the April 2015, it still remained high and increased risks for the health care and nutritional status of the most vulnerable groups. Households in Eastern and Western Pamir, and Western Panjakent and Eastern and Central Zeravshan valley Zones have used these strategies more frequently. Differences between livelihood zones, however, remain substantial with 22, 23 and 20 percent of the households in Panjakent, Rasht and Khatlon Mountains respectively (between 1 and 13 percent only in the other areas), decreased Apr 2014 Dec 2014 Apr 2015 Dec 2015 their agricultural expenditures to meet food requirements. Decrease expenditures for health care Decrease Agricultural Expenditures Sell more animals than usual Sell productive assets Sell domestic assets 14% 13% 1 6% 3% 26% 5% 15% 25% Apr 2014 Dec 2014 Apr 2015 Dec 2015 Figure 21: Households Asset Depletion Strategies In terms of livelihood diversification strategies (Figure 19), a downward trend was also observed, which could be explained by the reduced opportunities to diversify livelihoods due to the economic slowdown, rather than by the absence of a need for alternative means of subsistence. The use of labour migration is down by 4 percent compared to the last year, which is undoubtedly due to the reduced gains/ opportunities of migration. A slight decrease in purchasing food on credit and relying on the help of others was also observed. Purchase food on credit Rely on help from others Income Diversification Increase labour migration 23% 23% 13% 25% 26% 3 44% Apr 2014 Dec 2014 Apr 2015 Dec 2015 Figure 22: Households Livelihood Diversification Strategies More transitory shocks include economic shocks induced by the economic crisis; loss of savings were reported 1 less than in December 2014 and bankruptcy of small businesses increased up to 15 percent (more than the same period of 2014). Although these shocks were less frequently reported than April 2015, it shows that some households were still being affected by 10
11 the crisis. Facing these challenges, households try to cope as best they can without further losing any productive assets, as they did before. Households have managed to temporarily reduce the number, frequency and intensity of coping strategies they normally deploy. The Coping Strategy Index (Figure 23) for the past three months has increased in some livelihood zones showing that households used as many coping strategies to manage their food intake as they did in December However in some other Livelihood zones, for example in Sughd and in Central Khatlon, coping strategy showed improvements, in general very few households skipped meals for an entire day, reduce children s consumption or took children out of school. Important to note is that spending savings increased which may explain inability to properly prepare for the winter season due to low storage of food stocks in the households interviewed Dec-14 Dec-15 Figure 23: Households coping Strategy Index 18 deterioration was observed in the food security of households dependant on the sale and production of field crops, from 25 percent food insecure to 29 percent food insecure % Figure 24: Food Insecurity per Primary Income Source The same food security situation was observed for the group whose primary source of income is remittances. As discussed in the special section on remittances, income from this source has been significantly reduced. Households whose main source of income is no longer remittances as a result of the crisis are not included in this group. This seems to indicate clearly an erosion of the traditional advantage of the remittance group against other income groups. While the secondary effects of the crisis were impacting the most vulnerable groups first (daily wage labourers, smallholder farmers), there are signs that the crises will also impact the more protected groups, should the current trend persist % AprDecAprDecAprDecAprDecAprDecAprDecAprDecAprDecAprDecAprDec '14 '14 '15 '15 '14 '14 '15 '15 '14 '14 '15 '15 '14 '14 '15 '15 '14 '14 '15 '15 Daily Wage Labour Government Salary Pensions/Gov. Benefits Prod. & Sale of Field Crops Remittances Income and Food Insecurity Figure 24 shows that between April 2014 and April 2015, the food security situation deteriorated differently among households with different primary income. Food insecurity among households dependent on daily wage labour increased by 7 percent in comparison to the same period of This is likely explained by the decrease in the availability of casual labour in rural areas following the drop in remittances. Rates of food insecurity among households relying on government salaries, pensions and government benefits has remained more or less stable as these income sources are less impacted by the economic trends. A 18 The reduced coping strategy index is based on the most common set of coping behaviours across countries, such as reduced number of meals, limit portion size, and reflects the stress level of the household (the higher the score, the higher the stress level). 11
12 Household Debt Fighting Hunger Worldwide Around 19 percent of households interviewed, accrued new debts in the past three months (Figure 25). The most important reason for taking out new debts was to buy food, approximately 48 percent of the households reported. The second most reported cause of taking out new debts was to cover health expenses reported by 16 percent of interviewed households. 8.3% % % 0.4% % Figure 25: The main reason for recently accrued debt To buy food To cover health expenses To buy animal feed To buy agricultural inputs To pay education costs To buy animals For migration To buy clothes, shoes To pay for ceremonies Pay for taxes and utilities To start a business Construction Others Most loans for food came from shopkeepers, 59 percent, which is 22 percent more than December Respondents accrued up to 22 percent debt for food from relatives, which is usually given without conditions, 4 percent more than Households using bank credits for feeding decreased from 30 percent in 2014 down to 12 percent in December The same outcome could be seen for other debts. People have been trying to avoid higher amounts of bank loans in favour of unconditional relatively small loans from friends, relatives and shopkeepers. A possible reason could be the high fluctuation of the currency exchange rate and high difference of interest rates between loans accrued in National currency and in USD. The average size of the debt among the interviewed households decreased from 4,200 TJS to 3,500 TJS between December 2014 and December 2015; however, this average remained the same in comparison to April The debt average of those households which borrowed primarily for health expenses increased from 2,200 TJS in December 2014 to 3,200 TJS in April Besides accruing more debt to buy food, the average debt decreased from 2500 TJS to 1200 TJS, relative to other reasons. Generally overall debts taken this round for smaller amounts equate to 48 percent which was 12 percent more than December 2014 where those who contracted debts borrowed less than TJS 1000 ($128). Consequently, households accruing higher debts decreased to 52 percent from 64 in December Overall, 48 percent of all households used the borrowed money to purchase food over the past three months (Figure 26), which is higher in comparison with December 2014, when the proportion was 40 percent. Other 16 percent of interviewed households accrued new debt for health care purposes, which is 7 percent more than the same season of Debts accrued for migration presumably to purchase a ticket, work authorization and other related expenses did not change: remained at 3 percent as of December % 16% 13% 1 6% 3% 4% 3% Figure 26: Trend of accruing Debts by households The unchanged figure can reflect a reduced attractiveness of migration followed by the impact of the crisis, and return of labor migrants compared to the December Only 6 percent of households reported construction as main reason for debt accrued, which shows 5 percent decrease in comparison to the same season of
13 Outlook (February July 2016) Fighting Hunger Worldwide The overall food security situation in most parts of the country is expected to stay stressed during the next six months. Until the end of the lean season, ongoing deterioration is likely to continue for households which have spent most of their savings and already depleted food stocks. Improvement might be seen in some livelihood zones due to the expected arrival of the early harvest in May 2016 coupled with relatively lower food prices in the local markets. A declining Tajik Somoni, however, could offset this improvement, if the prices for key staple commodities increases. Remittances continue to remain critical for households food security. Russian economic growth perspectives remain negative 19 and continuous recession in Russia is negatively affecting the volume of remittances sent by labour migrants working in Russia. Prolonged trend of depreciation of ruble and drop of consumer demand along with decline of real income will reduce job opportunities for Tajik labour migrants in However, the process of inflow and labor migration trends should be monitored closely due to possible changes in economic prospects of Russia. March-May 2016 appears to be adequate 20 for agricultural production (based on the average annual monthly precipitation), leading to good prospects for the agricultural crops, cereals, fruits and vegetables. However, the effect of high food prices and of the economic slowdown in Tajikistan could delay the availability of fresh food stocks. While a decreased amount of households with food stocks was observed in December The seasonal availability of pasture might lead to improvement in livestock productivity and value, better food consumption pattern for some households possessing livestock. During spring and summer seasons, many alternative sources of income will be available, which includes the resumption of seasonal agricultural labor opportunities, construction work, casual labor opportunities, particularly in Dushanbe and regional and district centers, migration, and etc. If the increase of civil servants wages and pensions promised by the Government materializes, this would have a mitigating effect on the food security of these two income groups. Food prices are expected to go up slightly during the coming months due to seasonal growth and depreciation of the national currency along with forecasted inflation in The high prices and reduction of stocks in the coming months might cause further deterioration of dietary diversity and related poor nutritional status of households (particularly chronic malnutrition). These factors will continue to put economic pressure on low income groups which spend a large portion of their budget on food, especially those with migrants who are unable to return to their jobs abroad. Households expenditures have already shown some changes mainly due to the economic crisis, through increased food and health care expenditures from the total nonfood expenditures. In the coming months, expenditures on food are expected to remain high, expenditures on heating are expected to increase due to the winter season and the share of expenditures for health care will increase as well. This combined increase in expenditures will affect the most vulnerable households. Food availability and access to food is expected to improve slightly after the lean season, which will end in May as spring rains in 19 World Bank, Balancing Economic Adjustment and Transformation 20 World Bank, Climate change knowledge portal worldbank.org/climateportal/index.cfm?page=country_historical_cli mate&thisregion=asia&thisccode=tjk 13
14 14


15 Fighting Hunger Worldwide Food Security Situation Overview The FSMS provides reliable data at the household level which is integrated into the Integrated Food Security Phase Classification (IPC) system along with data from other sources to make a composite analytical statement on the state of food security in the regions. The system covers 5 sentinel sites in each of the 13 livelihood zones. In total 1,300 households in 65 sites are interviewed. The information represents a trend and cannot be projected at population level. UNICEF in Tajikistan has provided financial contribution and technical assistance to the FSMS conducted by WFP in December Analysis on Infant and young child feeding practises of the publication is provided by UNICEF. For further information please contact Farkhod Sydullaev, UNICEF in Tajikistan fsaydullaev@unicef.org For further information and data on food security please contact Andrea BERARDO andrea.berardo@wfp.org or Erkin HUSEINOV erkin.huseinov@wfp.org, WFP Tajikistan. All rights reserved. Reproduction and dissemination of material in this information product for education or other non-commercial uses are authorized without any prior written permission from the copyright holders provided the source is fully acknowledged. Reproduction of material in this information product for resale or other commercial purposes is prohibited without written permission. Application for such permission should be addressed to WFP vaminfor@wfp.org. 15
Tajikistan. Food Security Monitoring System. Highlights. Fighting Hunger Worldwide. June 2014 Number 13
 June 2014 Number 13 Tajikistan Food Security Monitoring System The Food Security Monitoring System (FSMS) provides a seasonal trend of food insecurity in rural Tajikistan by analyzing data from 1,300 rural
FOOD SECURITY MONITORING, TAJIKISTAN
 Fighting Hunger Worldwide BULLETIN February 2017 ISSUE 18 Tajikistan Food Security Monitoring Highlights The food security situation presents expected seasonal variation better in December after the harvest,
Tajikistan. Fighting Hunger Worldwide. Highlights. Food Security Monitoring System. February 2015 NUMBER 14
 February 2015 NUMBER 14 Fighting Hunger Worldwide Tajikistan Food Security Monitoring System The Food Security Monitoring System (FSMS) provides a seasonal trend of food insecurity in rural Tajikistan
Acute Food Insecurity Situation Overview
 TAJIKISTAN Acute Food Insecurity Situation Overview Created on 31/05/2016 Aggregate Numbers Key Findings and Issues Overall, an estimated 12% of the population (about 715,000 people) in rural areas are
Main Findings. WFP Food Security Monitoring System (FSMS) West Darfur State. Round 10 (May 2011)
 West Darfur State. Round 10 (May 2011)") WFP Food Security Monitoring System (FSMS) Round 1 (May 11) West Darfur State Main Findings Data collection was carried out in May 11, which corresponds to the pre hunger season and all the sentinel sites
WFP Food Security Monitoring System (FSMS) Round 1 (May 11) West Darfur State Main Findings Data collection was carried out in May 11, which corresponds to the pre hunger season and all the sentinel sites
FOOD SECURITY AND OUTCOMES MONITORING REFUGEES OPERATION
 Highlights The yearly anthropometric survey in Kakuma was conducted in November with a Global Acute Malnutrition (GAM) rate of 11.4% among children less than 5 years of age. This is a deterioration compared
From January to March 2015, WFP assisted 896,791 Syrian refugees, 11,972 new arrivals and 21,801 Palestine refugees from Syria.
 Quarter 1, January-March 2015 Regional Emergency Operation 200433- Syria crisis Lebanon Monitoring and Evaluation report, January-March 2015 Monitoring brief WFP conducts a range of monitoring and evaluation
The World Food Programme (WFP) Jordan FOOD SECURITY OUTCOME MONITORING (FSOM) Quarter 4 (Q4) 2016: Summary Report
 Jordan FOOD SECURITY OUTCOME MONITORING (FSOM) Quarter 4 (Q4) 2016: Summary Report") The World Food Programme (WFP) Jordan FOOD SECURITY OUTCOME MONITORING (FSOM) Quarter 4 (Q4) 26: Summary Report Quarter 4 (Q4) 26: Summary Report KEY FINDINGS: The food security situation has overall worsened
The World Food Programme (WFP) Jordan FOOD SECURITY OUTCOME MONITORING (FSOM) Quarter 4 (Q4) 26: Summary Report Quarter 4 (Q4) 26: Summary Report KEY FINDINGS: The food security situation has overall worsened
NEPAL. mvam Food Security Monitoring Survey respondents interviewed. 6.2 members per household on average. 17% female headed households
 NEPAL mvam Bulletin #1: June 2017 mvam Food Security Monitoring Survey Mid-Western and Far-Western The eight districts of the mid and far-western mountains of are some of the most food insecure areas in
Under-five chronic malnutrition rate is critical (43%) and acute malnutrition rate is high (9%) with some areas above the critical thresholds.
 and acute malnutrition rate is high (9%) with some areas above the critical thresholds.") May 2014 Fighting Hunger Worldwide Democratic Republic of Congo: is economic recovery benefiting the vulnerable? Special Focus DRC DRC Economic growth has been moderately high in DRC over the last decade,
May 2014 Fighting Hunger Worldwide Democratic Republic of Congo: is economic recovery benefiting the vulnerable? Special Focus DRC DRC Economic growth has been moderately high in DRC over the last decade,
EASTERN SUDAN FOOD SECURITY MONITORING
 EASTERN SUDAN FOOD SECURITY MONITORING KASSALA STATE, ROUND 1 JULY 2010 Highlights Round 1 of the FSMS in was carried out at the peak of the lean season. The food security situation in the urban and rural
MONTHLY UPDATE ON FOOD SECURITY AND PRICES IN RURAL AND URBAN AREAS
 BULLETIN January 2015 ISSUE 30 Fighting Hunger Worldwide MONTHLY UPDATE ON FOOD SECURITY AND PRICES IN RURAL AND URBAN AREAS ISSUE #30, World Food Programme Monthly Update on Food Security and Prices is
Above-average use of food-related coping continued for households in Anbar (20%) and Ninewa (18%) and declined by 11 percent in Salah Al-Din.
 and Ninewa (18%) and declined by 11 percent in Salah Al-Din.") Fighting hunger worldwide Bulletin 11 October 2015 IRAQ October 2015: Food security indicators continue to be poor in Anbar and Ninewa governorates, and for IDPs Highlights Food consumption indicators
Fighting hunger worldwide Bulletin 11 October 2015 IRAQ October 2015: Food security indicators continue to be poor in Anbar and Ninewa governorates, and for IDPs Highlights Food consumption indicators
ARMENIA COMPREHENSIVE FOOD SECURITY, VULNERABILITY ANALYSIS (CFSVA) UPDATE 2017
 UPDATE 2017") ARMENIA COMPREHENSIVE FOOD SECURITY, VULNERABILITY ANALYSIS (CFSVA) UPDATE 2017 SOCIO-ECONOMIC TRENDS The Armenia Comprehensive Food Security, Vulnerability Analysis (CFSVA) Update presents the current
ARMENIA COMPREHENSIVE FOOD SECURITY, VULNERABILITY ANALYSIS (CFSVA) UPDATE 2017 SOCIO-ECONOMIC TRENDS The Armenia Comprehensive Food Security, Vulnerability Analysis (CFSVA) Update presents the current
Online Consultation for the Preparation of the Tajikistan Systematic Country Diagnostic. Dushanbe, Tajikistan March 2017
 Online Consultation for the Preparation of the Tajikistan Systematic Country Diagnostic Dushanbe, Tajikistan March 2017 The Systematic Country Diagnostic (SCD): Designed to be the main analytical input
Monitoring & Early Warning in Tajikistan
 Tajikistan Monitoring & Early Warning Report December 2012 Monitoring & Early Warning in Tajikistan MONTHLY REPORT DECEMBER 2012 1 Tajikistan Monitoring & Early Warning Report December 2012 2 Tajikistan
The Role of Migration and Income Diversification in Protecting Households from Food Insecurity in Southwest Ethiopia
 The Role of Migration and Income Diversification in Protecting Households from Food Insecurity in Southwest Ethiopia David P. Lindstrom Population Studies and Training Center, Brown University Craig Hadley
Remittances and the Macroeconomic Impact of the Global Economic Crisis in the Kyrgyz Republic and Tajikistan
 Public Disclosure Authorized Public Disclosure Authorized Public Disclosure Authorized Public Disclosure Authorized China and Eurasia Forum Quarterly, Volume 8, No. 4 (2010), pp. 3-9 Central Asia-Caucasus
BANQUE AFRICAINE DE DEVELOPPEMENT
 BANQUE AFRICAINE DE DEVELOPPEMENT Publication autorisée Publication autorisée KENYA: PROPOSAL FOR AN EMERGENCY HUMANITARIAN ASSISTANCE TO POPULATION AFFECTED BY DROUGHT AND FAMINE* LIST OF ACRONYMS AND
Poverty profile and social protection strategy for the mountainous regions of Western Nepal
 October 2014 Karnali Employment Programme Technical Assistance Poverty profile and social protection strategy for the mountainous regions of Western Nepal Policy Note Introduction This policy note presents
PROJECT INFORMATION DOCUMENT (PID) ADDITIONAL FINANCING Report No.: PIDA Project Name Parent Project Name. Region Country Sector(s) Theme(s)
 ADDITIONAL FINANCING Report No.: PIDA Project Name Parent Project Name. Region Country Sector(s) Theme(s)") Public Disclosure Authorized Public Disclosure Authorized Public Disclosure Authorized Public Disclosure Authorized Project Name Parent Project Name Region Country Sector(s) Theme(s) Lending Instrument
Public Disclosure Authorized Public Disclosure Authorized Public Disclosure Authorized Public Disclosure Authorized Project Name Parent Project Name Region Country Sector(s) Theme(s) Lending Instrument
Haiti Urban Food Security Assessment
 Haiti Urban Food Security Assessment PRELIMINARY FINDINGS Highlights In the urban areas assessed in June 2016, 30% of the households are food insecure with 2% severely food insecure. The level of food
Migration, Employment, and Food Security in Central Asia: the case of Uzbekistan
 Migration, Employment, and Food Security in Central Asia: the case of Uzbekistan Bakhrom Mirkasimov (Westminster International University in Tashkent) BACKGROUND: CENTRAL ASIA All four countries experienced
The World Food Programme (WFP) Jordan FOOD SECURITY OUTCOME MONITORING (FSOM) Quarter 3 (Q3) 2017: Summary Report
 Jordan FOOD SECURITY OUTCOME MONITORING (FSOM) Quarter 3 (Q3) 2017: Summary Report") The World Food Programme (WFP) Jordan FOOD SECURITY OUTCOME MONITORING (FSOM) KEY FINDINGS: Food consumption improved amongst Syrian refugee households in quarter 3 (Q3), for both WFP general food assistance
The World Food Programme (WFP) Jordan FOOD SECURITY OUTCOME MONITORING (FSOM) KEY FINDINGS: Food consumption improved amongst Syrian refugee households in quarter 3 (Q3), for both WFP general food assistance
BADAN PUSAT STATISTIK KEPALA BADAN PUSAT STATISTIK 1
 www.bps.go.id BADAN PUSAT STATISTIK KEPALA BADAN PUSAT STATISTIK 1 INDONESIA DURING THE GLOBAL ECONOMIC CRISIS: 2008 2009 HOW DEEP THE IMPACT? ISTANBUL, TURKEY MARCH 2010 BPS Statistics Indonesia 2 BPS
E Distribution: GENERAL PROJECTS FOR EXECUTIVE BOARD APPROVAL. Agenda item 9 DEVELOPMENT PROJECTS TAJIKISTAN For approval
 Executive Board Second Regular Session Rome, 8 11 November 2010 PROJECTS FOR EXECUTIVE BOARD APPROVAL Agenda item 9 DEVELOPMENT PROJECTS TAJIKISTAN 200173 For approval Support for Tuberculosis Patients
Table 1. Nepal: Monthly Data for Key Macroeconomic Indicators.
 Table 1. : Monthly Data for Key Macroeconomic Indicators. 1 1 Year-on-year change, in percent Oct Nov Dec FY to date Oct Nov Dec FY to date Oct Nov Dec FY to date ( months) ( months) ( months) Inflation
Impact of Remittances on Household Food Security: A Micro Perspective of Rural Tigray, Ethiopia
 Impact of Remittances on Household Food Security: A Micro Perspective of Rural Tigray, Ethiopia By Nigussie Abadi, Ataklti Techane and Girmay Tesfay Mekelle University, Mekelle, Ethiopia Paper Presentation
15+85A. Situation Overview: Western Bahr el Ghazal, South Sudan. Introduction. Population Movement and Displacement
 Situation Overview: Western Bahr el Ghazal, South Sudan January - March 2018 Introduction. Ongoing conflict in Western Bahr el Ghazal (WBeG) State resulted in a continued deterioration of food security
MALAWI mvam Bulletin #10: October 2016
 Food security improves for the first time in three months in response to humanitarian assistance Key points: Negative coping strategies decrease across the country on account of increased scale up of humanitarian
evsjv `k cwimsl vb ey iv BANGLADESH BUREAU OF STATISTICS Statistics Division, Ministry of Planning
 PRELIMINARY REPORT ON HOUSEHOLD INCOME & EXPENDITURE SURVEY-2010 June, 2011 evsjv `k cwimsl vb ey iv BANGLADESH BUREAU OF STATISTICS Statistics Division, Ministry of Planning Household Income and Expenditure
Syria Crisis Regional Response M&E Updates. April-June 2014
 Syria Crisis Regional Response M&E Updates April-June Monitoring results from WFP Regional Emergency Operation 200433 Food assistance to vulnerable Syrian populations in Jordan, Lebanon, Iraq, Turkey,
Figure 1. Nepal: Recent Fiscal Developments
 Figure 1. : Recent Fiscal Developments Strong revenue growth combined with subdued capital spending kept the budget in surplus the past years. Fiscal Performance Revenue Capital expenditure 1 Current expenditure
MOGADISHU. (July 2011 April 2012)
") MOGADISHU Food Security & Nutrition Situation Trends (July 2011 April 2012) TABLE OF CONTENTS Acknowledgement iv Introduction 1 Methodology 1 Background 2 Markets and Trade 2 Population Movement 2 Household-Level
MOGADISHU Food Security & Nutrition Situation Trends (July 2011 April 2012) TABLE OF CONTENTS Acknowledgement iv Introduction 1 Methodology 1 Background 2 Markets and Trade 2 Population Movement 2 Household-Level
Kenya Inter-agency Rapid Assessment Community Group Discussion
 Kenya Inter-agency Rapid Assessment Community Group Discussion General information G1. Take the GPS location G2. Name of the data collector G3. County G4. Sub-County G5. Ward G6. Location G7. Sub-location
Title: Rapid Assessment of the social and poverty impacts of the economic crisis in Romania
 Executive Summary Section 1 Bibliographical Information Title: Rapid Assessment of the social and poverty impacts of the economic crisis in Romania Authors: Stanculescu, M. (coord.); Marin, M. Date: 2011
LIBERIA. and Food. Security
 Nimba Refugee Assessment LIBERIA Ivorian Refugee Influx and Food Security March 2011 Data collected from 8 to 13 March 2011 This report was produced by: Sayba Y. Tamba, Food Security Analyst, MOA. sayb.tambyawa@gmail.com
WFP/Hussam Al-Saleh. Fact Sheet FEBRUARY Syria Crisis Response
 WFP/Hussam Al-Saleh Fact Sheet FEBRUARY 2015 Syria Crisis Response The Syrian Crisis Syria is embroiled in a violent civil war that has resulted in widespread destruction and devastation. The conflict
Executive summary. Strong records of economic growth in the Asia-Pacific region have benefited many workers.
 Executive summary Strong records of economic growth in the Asia-Pacific region have benefited many workers. In many ways, these are exciting times for Asia and the Pacific as a region. Dynamic growth and
Lebanon. Lebanon: the largest per capita recipient of refugees in the world
 October 2014 Fighting Hunger Worldwide Is the Syrian crisis jeopardizing the economy and food security in Lebanon? Special Focus Lebanon The crisis in Syria now already in its third year has had an immense
REACH Situation Overview: Intentions and Needs in Eastern Aleppo City, Syria
 REACH Situation Overview: Intentions and Needs in Eastern Aleppo City, Syria 18 August 2016 INTRODUCTION Since the closure of Castello road in early July and the ensuing intensification of conflict in
Inclusive growth and development founded on decent work for all
 Inclusive growth and development founded on decent work for all Statement by Mr Guy Ryder, Director-General International Labour Organization International Monetary and Financial Committee Washington D.C.,
A REBALANCING ACT IN EMERGING EUROPE AND CENTRAL ASIA. April 17, 2015 Spring Meetings
 A REBALANCING ACT IN EMERGING EUROPE AND CENTRAL ASIA April 17, 2015 Spring Meetings A Rebalancing Act in Emerging Europe and Central Asia ECA is expected to be the slowest growing region worldwide with
ECONOMIC ANALYSIS (SUMMARY) 1
 1") 1991 1992 1993 1994 1995 1996 1997 1998 1999 00 01 02 03 04 05 06 07 08 09 11 12 13 14 15 Country Partnership Strategy: Tajikistan, 16 A. Overview of Economic Performance ECONOMIC ANALYSIS (SUMMARY) 1
1991 1992 1993 1994 1995 1996 1997 1998 1999 00 01 02 03 04 05 06 07 08 09 11 12 13 14 15 Country Partnership Strategy: Tajikistan, 16 A. Overview of Economic Performance ECONOMIC ANALYSIS (SUMMARY) 1
Monitoring Country Progress in Pakistan
 Monitoring Country Progress in Pakistan Program Office OAPA & USAID/Pakistan U.S. Agency for International Development Pakistan Institute for Development Economics September, 21 st, 211 Economic Reforms
Pathways to graduation: is graduation from social safety net support possible and why? Evidence from sub-saharan Africa
 Pathways to graduation: is graduation from social safety net support possible and why? Evidence from sub-saharan Africa Silvio Daidone Food and Agriculture Organization Luca Pellerano Oxford Policy Management
EMERGENCY OPERATION ARMENIA
 EMERGENCY OPERATION ARMENIA 200558 Emergency food assistance to displaced population of Syrian Armenians Number of beneficiaries 5,000 Duration of project 1 July 2013 31 December 2013 (6 months) WFP food
Poverty and Shared Prosperity in Moldova: Progress and Prospects. June 16, 2016
 Poverty and Shared Prosperity in Moldova: Progress and Prospects June 16, 2016 Overview Moldova experienced rapid economic growth, accompanied by significant progress in poverty reduction and shared prosperity.
Migration and Development Brief
 Migration and Development Brief 9 Migration and Remittances Team Development Prospects Group, World Bank Revised Outlook for Remittance Flows 2009 2011: Remittances expected to fall by 5 to 8 percent in
Fighting Hunger Worldwide. WFP Response to the Syria Crisis. Funding Appeal to the Kingdom of Saudi Arabia
 Fighting Hunger Worldwide WFP Response to the Syria Crisis Funding Appeal to the Kingdom of Saudi Arabia Emergency Food Assistance to Vulnerable Syrian Populations inside Syria and the Neighbouring Countries
NCERT Class 9th Social Science Economics Chapter 3: Poverty as a Challenge
 NCERT Class 9th Social Science Economics Chapter 3: Poverty as a Challenge Question 1. Describe how poverty line is estimated in India. A common method used to measure poverty is based on income or consumption
Refugee influx Emergency Vulnerability Assessment (REVA) - Summary Report
 - Summary Report") World Food Programme Subtitle xxx Refugee influx Emergency Vulnerability Assessment (REVA) - Summary Report Cox s Bazar, Bangladesh, December 2017 Data collection supported by: Overall vulnerability to
World Food Programme Subtitle xxx Refugee influx Emergency Vulnerability Assessment (REVA) - Summary Report Cox s Bazar, Bangladesh, December 2017 Data collection supported by: Overall vulnerability to
Vulnerability Assessment Framework
 Vulnerability Assessment Framework JORDAN RESPONSE PLAN Key findings June 2015 Developed under an interagency steering committee, including 5 NGOs, 5 UN agencies, BPRM and ECHO Refugees Outside of Camps
FOOD ASSISTANCE TO. Refugees. Refugee Operations faces a significant funding shortfall
 OCTOBER 2016 FOOD ASSISTANCE TO Refugees Refugee Operations faces a significant funding shortfall World Food Programme NEWSLETTER WFP/Daniel Dyssel IN THIS ISSUE Refugee Operations faces a significant
Sri Lanka: a review and analysis of experience
 Nutrition surveillance programme in tsunami affected areas of Sri Lanka: a review and analysis of experience Dr. Renuka Jayatissa, Dr. Aberra Bekele Department of Nutrition, Medical Research Institute,
Horn of Africa Situation Report No. 19 January 2013 Djibouti, Ethiopia, Kenya, Somalia, South Sudan
 Horn of Africa Situation Report No. 19 January 2013 Djibouti, Ethiopia, Kenya, Somalia, South Sudan AT A GLANCE Conditions across the Horn of Africa have improved, however a crisis food security situation
Zimbabwe Complex Emergency
 BUREAU FOR DEMOCRACY, CONFLICT, AND HUMANITARIAN ASSISTANCE (DCHA) OFFICE OF U.S. FOREIGN DISASTER ASSISTANCE (OFDA) Zimbabwe Complex Emergency Situation Report #3, Fiscal Year (FY) 2009 February 13, 2009
Policy, Advocacy and Communication
 Policy, Advocacy and Communication situation Over the last decade, significant progress has been made in realising children s rights to health, education, social protection and gender equality in Cambodia.
INTEGRATED FOOD SECURITY PHASE CLASSIFICATION THE REPUBLIC OF SOUTH SUDAN
 INTEGRATED FOOD SECURITY PHASE CLASSIFICATION THE REPUBLIC OF SOUTH SUDAN KEY IPC FINDINGS : SEPTEMBER 2017 MARCH 2018 South Sudan entered the harvest season in September 2017 with 6 million people (56%
The Russian Economic Crisis and Falling Remittances in Central Asia
 Vol. 6 No. 28 ISSN 2233-9140 The Russian Economic Crisis and Falling Remittances in Central Asia YUN ChiHyun Researcher, Russia and Eurasia Team, Department of Europe, Americas and Eurasia (chyun@kiep.go.kr)
16% 9% 13% 13% " " Services Storage Meters
 1+16+9+13+13 Camp Profile - Ein Issa Ar-Raqqa governorate, Syria November 2017 Management agency: Raqqa Civil Council (RCC) Registration actor: RCC, UNHCR Summary This profile provides a multisectoral
Regional Economic Context and Economic Trends in Ukraine
 Regional Economic Context and Economic Trends in Ukraine Konstantine Kintsurashvili June 2017 ECONOMIC PROSPECTS: EBRD REGION 2 Growth in the EBRD region is to pick up in 2017 and 2018 In 2017-18, EBRD
BRIEF MIGRATION PROFILE REMITTANCES Tbilisi, Georgia
 2016 STATE COMMISSION ON MIGRATION ISSUES BRIEF MIGRATION PROFILE REMITTANCES Tbilisi, Georgia Acknowledgments The State Commission on Migration Issues extends its gratitude to the European Union (EU)
4. Main Results of the Survey. From the very beginning of transition period the poverty has a wide spread incidence in Armenia.
 4. Main Results of the Survey From the very beginning of transition period the poverty has a wide spread incidence in Armenia. It should be mentioned that enjoying spread incidence in transition countries,
Community and Household Surveillance in North Western Tanzania: Programme Outcome Monitoring in Nyarugusu Refugee Camp
 Community and Household Surveillance in North Western Tanzania: Programme Outcome Monitoring in Nyarugusu Refugee Camp Undertaken Jointly by WFP and UNHCR May 2010 1 Acknowledgment The survey is the result
Nutritional Status of Children during and post Global Economic Crisis in China *
 Biomed Environ Sci, 2011; 24(4): 321 328 321 Original Article Nutritional Status of Children during and post Global Economic Crisis in China * CHEN ChunMing #, HE Wu, WANG YuYing, DENG LiNa, and JIA FengMei
Quarterly Labour Market Report. February 2017
 Quarterly Labour Market Report February 2017 MB14052 Feb 2017 Ministry of Business, Innovation and Employment (MBIE) Hikina Whakatutuki - Lifting to make successful MBIE develops and delivers policy, services,
By Peter Quartey (PhD) Centre for Migration Studies & ISSER, University of Ghana
 Centre for Migration Studies & ISSER, University of Ghana") THE IMPACT OF THE FINANCIAL & ECONOMIC CRISIS ON REMITTANCES, RETURN MIGRATION AND DEVELOPMENT IN GHANA By Peter Quartey (PhD) Centre for Migration Studies & ISSER, University of Ghana OUTLINE 1. Introduction
THE IMPACT OF THE FINANCIAL & ECONOMIC CRISIS ON REMITTANCES, RETURN MIGRATION AND DEVELOPMENT IN GHANA By Peter Quartey (PhD) Centre for Migration Studies & ISSER, University of Ghana OUTLINE 1. Introduction
Migration, remittances and climate resilience in Tajikistan. Working paper. Part II
 Migration, remittances and climate resilience in Tajikistan Working paper Part II Migration, remittances and climate resilience in Tajikistan April 2018 Zhanna Babagaliyeva Abdulkhamid Kayumov Nurullo
66+34+A. Situation Overview: Unity State, South Sudan. Introduction. Population Movement and Displacement
 Situation Overview: Unity State, South Sudan July-August 2017 Introduction Displacement trends, population needs and humanitarian access have all been negatively affected by the insecurity resulting from
East Africa Hunger Crisis East Africa Hunger Crisis Emergency Response Emergency Response Mid-2017 Updated Appeal Mid-2017 Appeal
 ETHIOPIA SOUTH SUDAN East Africa Hunger Crisis East Africa Hunger Crisis Emergency Response Emergency Response Mid-2017 Updated Appeal Mid-2017 Appeal KEY MESSAGES Deteriorating security situation: All
Fighting Hunger Worldwide QUARTERLY REPORT. World Food Programme in Lesotho July - September 2013
 Fighting Hunger Worldwide 1 QUARTERLY REPORT World Food Programme in Lesotho July - September 2013 Vision Statement Led by the Government, and supported by partners, the population of Lesotho is well nourished,
Climate Change & Migration: Some Results and Policy Implications from MENA
 Climate Change & Migration: Some Results and Policy Implications from MENA Outline 1. An abridged history of climate induced migration 2. Investigating CIM in MENA 3. Some results and policy considerations
Since the Vietnam War ended in 1975, the
 Commentary After the War: 25 Years of Economic Development in Vietnam by Bui Tat Thang Since the Vietnam War ended in 1975, the Vietnamese economy has entered a period of peaceful development. The current
The Short- and Long-term Effects of Rainfall on Migration: A Case Study of Chitwan, Nepal Introduction Setting
 The Short- and Long-term Effects of Rainfall on Migration: A Case Study of Chitwan, Nepal Nathalie Williams and Clark Gray 18 October, 2012 Introduction In the past decade, both policymakers and academics
Shock and Poverty in Sub-Saharan Africa: The Case of Burkina Faso (Report on Pre-Research in 2006)
") Shock and Poverty in Sub-Saharan Africa: The Case of Burkina Faso (Report on Pre-Research in 2006) Takeshi Sakurai (Policy Research Institute) Introduction Risk is the major cause of poverty in Sub-Saharan
Shock and Poverty in Sub-Saharan Africa: The Case of Burkina Faso (Report on Pre-Research in 2006) Takeshi Sakurai (Policy Research Institute) Introduction Risk is the major cause of poverty in Sub-Saharan
ECONOMIC ANALYSIS (SUMMARY) 1
 1") Country Partnership Strategy: Kyrgyz Republic, 2013 2017 ECONOMIC ANALYSIS (SUMMARY) 1 1. The Kyrgyz Republic went through a difficult transition after the breakup of the former Soviet Union and independence
Country Partnership Strategy: Kyrgyz Republic, 2013 2017 ECONOMIC ANALYSIS (SUMMARY) 1 1. The Kyrgyz Republic went through a difficult transition after the breakup of the former Soviet Union and independence
Inflation in South Sudan
 Public Disclosure Authorized Public Disclosure Authorized Public Disclosure Authorized Public Disclosure Authorized Inflation in South Sudan 1. Background & Summary South Sudan s current macroeconomic
VULNERABILITY STUDY IN KAKUMA CAMP
 EXECUTIVE BRIEF VULNERABILITY STUDY IN KAKUMA CAMP In September 2015, the World Food Programme (WFP) and the United Nations High Commissioner for Refugees (UNHCR) commissioned Kimetrica to undertake an
Food Crisis in the Horn of Africa: CARE Emergency Fund Seeks $48 million
 More than 1,500 refugees at least 80 percent of them children are arriving at refugee camps in Kenya daily as a result of a widespread food crisis. Food Crisis in the Horn of Africa: CARE Emergency Fund
Focus on conflict-affected groups in Ninewa, Diyala, and Sulaymaniyah Locations. 37 average age of respondents households surveyed
 Focus on conflict-affected groups in Ninewa, Diyala, and Sulaymaniyah mvam : UPDATE #18 APRIL 2018 Key points: In April, the share of households with borderline food consumption increased in Ninewa and
Price Transmission on Wheat Flour Market in Georgia. Ia Katsia, Pati Mamardashvili
 Price Transmission on Wheat Flour Market in Georgia Ia Katsia, Pati Mamardashvili Outline: Introduction Georgian Wheat Market Data and Methodology The Main Findings Outlook 2 Introduction Georgia is a
Blockade and violence in Yemen pushing an additional 25,000 people into hunger daily
 English Français Español Choose country The power of people against poverty Blockade and violence in Yemen pushing an additional 25,000 people into hunger daily Published: 28 July 2015 Since the start
Support for Tuberculosis Patients and their Families Standard Project Report 2016
 Fighting Hunger Worldwide Project Number: 200173 Project Category: Development Project Project Approval Date: November 11, 2010 Start Date: January 01, 2011 Actual Start Date: January 01, 2011 Project
Republic of Tajikistan Country Economic Memorandum: Executive Summary
 Report No. 54677-TJ Republic of Tajikistan Country Economic Memorandum: Executive Summary Tajikistan s Quest for Growth: Stimulating Private Investment January 2011 Poverty Reduction and Economic Management
MALAWI TESTIMONIES. By getting this assistance, I was able to feed my family properly. Estor Elliott
 By getting this assistance, I was able to feed my family properly. Estor Elliott TESTIMONIES "It was fair to receive this additional support because SCT cash amounts are very small and meant for survival.
Policy Challenges for Armenia in the context of Recent Global and Regional Shocks
 Policy Challenges for Armenia in the context of Recent Global and Regional Shocks Teresa Daban Sanchez IMF Resident Representative to Armenia November, 215 Outline Global Environment Outlook of the CCA
APPENDIX A QUESTIONNAIRE FOR SURVEY
 APPENDIX A QUESTIONNAIRE FOR SURVEY 1. Is your family able to afford all three meals a day consisting of dal, rice and vegetables? 2. What portion of your family income is spent in buying food? (a) One
A Time of Plenty, A World of Need: The Rold of Food Aid in 2020
 International Food Policy Research Institute 2020 Brief 10, February 1995 A Time of Plenty, A World of Need: The Rold of Food Aid in 2020 by Patrick Webb Food aid is one of the constants of human experience.
SUMMARY ANALYSIS OF KEY INDICATORS
 SUMMARY ANALYSIS OF KEY INDICATORS from the FSM 2010 Census of Population and Housing DIVISION OF STATISTICS FSM Office of Statistics, Budget, Overseas Development Assistance and Compact Management (S.B.O.C)
REACH Situation Overview: Displacement and Needs in Eastern Aleppo City, Syria
 REACH Situation Overview: Displacement and Needs in Eastern Aleppo City, Syria 6 September 2016 INTRODUCTION As conflict in and around Aleppo city continues, an estimated 250,000-300,000 people remain
ASSESSING VULNERABILITIES AND RESPONSES TO ENVIRONMENTAL CHANGES IN CAMBODIA THE MIGRATION, ENVIRONMENT AND CLIMATE CHANGE NEXUS
 ASSESSING VULNERABILITIES AND RESPONSES TO ENVIRONMENTAL CHANGES IN CAMBODIA THE MIGRATION, ENVIRONMENT AND CLIMATE CHANGE NEXUS IOM OIM PROJECT INFORMATION Cambodia is being reshaped by increasingly complex
100% of individuals are registered as camp residents. 6% of households are headed by females. 38 years old: Average head of household age.
 Camp Profile - Roj Al-Hasakeh governorate, Syria November 2017 Management agency: Self management Registration actor: UNHCR Summary This profile provides a multisectoral needs overview and summarises the
The Province of Prince Edward Island Food Insecurity Poverty Reduction Action Plan Backgrounder
 The Province of Prince Edward Island Food Insecurity Poverty Reduction Action Plan Backgrounder 5/17/2018 www.princeedwardisland.ca/poverty-reduction Food Insecurity SUMMARY Access to sufficient quantities
The Trends of Income Inequality and Poverty and a Profile of
 http://www.info.tdri.or.th/library/quarterly/text/d90_3.htm Page 1 of 6 Published in TDRI Quarterly Review Vol. 5 No. 4 December 1990, pp. 14-19 Editor: Nancy Conklin The Trends of Income Inequality and
The North Wind Doth Blow: U.S. Recession Brings Turbulence to the Mexican Economy Presented to: Maquiladora Industry Outlook Conference May 16, 2008
 The North Wind Doth Blow: U.S. Recession Brings Turbulence to the Mexican Economy Presented to: Maquiladora Industry Outlook Conference May 16, 2008 Presented by: Rafael Amiel, Ph.D. Managing Director,
BUDGET REVISION NUMBER 2 TO SUDAN EMERGENCY OPERATION
 BUDGET REVISION NUMBER 2 TO SUDAN EMERGENCY OPERATION Sudan 200151 - Food Assistance to Vulnerable Populations Affected by Conflict and Natural Disasters Cost (United States dollars) Present budget Change
Thematic Area: Disaster Risk Reduction and Resilience
 Thematic Area: Disaster Risk Reduction and Resilience Strengthening disaster risk modelling, assessment, mapping, monitoring and multi-hazard early warning systems. Integrating disaster risk reduction
Rapid Household Economy Analysis, Bidibidi Refugee Settlement, Yumbe District, Uganda
 Rapid Household Economy Analysis, Bidibidi Refugee Settlement, Yumbe District, Uganda Household Economy Analysis (HEA) Assessment conducted by DanChurchAid-DCA and Save the Children, February 2017 Report
PAKISTAN - COMPLEX EMERGENCY
 PAKISTAN - COMPLEX EMERGENCY FACT SHEET #3, FISCAL YEAR (FY) 2017 SEPTEMBER 30, 2017 NUMBERS AT A GLANCE 42,225 Displaced Households in FATA OCHA September 2017 262,623 Households Voluntarily Returned