Multi-Agency Flood Impact Assessment Koshi River Flood Nepal. Preliminary Results
|
|
|
- Douglas McDonald
- 5 years ago
- Views:
Transcription

1 Multi-Agency Flood Impact Assessment Koshi River Flood Nepal IASC Emergency Preparedness and Response Cluster System September 2008 Preliminary Results Photo: Krishna Khanal, WFP Disclaimer: This is a preliminary report prepared by the Food Security Monitoring and Analysis Unit of WFP Nepal. Many sections of the report are not part of WFP s area of expertise and should therefore be treated as an initial attempt to summarize the assessment findings. The full report will be prepared by IASC cluster system.
2 Preliminary Results of the Multi-Agency Koshi River Flood Impact Assessment IASC Emergency Preparedness and Response Cluster System September 2008 HIGHLIGHTS An estimated 66,500 people have been displaced in Sunsari and Saptari due to flood. Approximately 42 percent are of Indian origin. About one third of the affected population is Muslim. Eighteen percent are Dalit. Only 35 percent have so far received a government identity card. Improvements in the shelter situation are of utmost importance. Camps are overcrowded, poorly maintained and more than half of the displaced people report that their current shelter provides insufficient protection against the weather. There is an urgent need for firewood or cooking fuel to enable households to cook. Displaced people place a large burden on the hosting families/communities. Only about 15 percent currently receive humanitarian assistance. The impact on housing, livelihoods, animals and assets was significant with most households reporting complete or partial losses. The most severe coping strategies are practised by households staying in spontaneous camps or with host families. Significantly, these also demonstrate the worst patterns of consumption. Humanitarian aid, however, is currently focused mostly on people residing in established camps. The acute malnutrition rate among displaced children under the age of 5 was found to be 13 percent. Furthermore, one-third of the children are at risk of becoming malnourished. The flood has caused a significant increase in commodity prices which were already at very high levels. This price rise will further compromise people s access to food. 1. BACKGROUND AND OBJECTIVES On 18 August the monsoon swollen Koshi river (the largest river in Nepal) burst its banks and effectively changed its course. The river now flows through the broken embankment cutting through several VDCs in Sunsari district of Nepal before entering into the state of Bihar in India, where it has flooded up to 1,000 villages and affected more than one million people. In Nepal the river completely inundated 2 VDCs, Haripur and Sripurjabdi, and partially flooded the western part of Laukahi VDC and about four wards of Paschhim Kusaha (wards 3,4, 8 and 9) in Sunsari district. Other VDCs (Bhokraha, Madhuwan, Narsigha, Bashntapur and Dhuskighat) experienced limited flooding and/or are hosting displaced people. Saptari district which borders the Koshi river on the west was not flooded but has seen an influx of flood displaced people, in particular to Bhardaha and Hanumannagar VDCs. The East-West Highway connecting the main commercial city of Biratnagar in the east with the rest of the country was severely damaged and remains impassable. The Nepal Ministry of Home Affairs estimates that at least 70,000 people are affected by the flooding in the area. Estimates on the number of displaced people differ depending on the source. According to OCHA some 45,000 people are in need of shelter and humanitarian assistance. Estimates of the number of Indian nationals from Supaul district in Bihar, India, seeking refuge in Nepal vary considerably and range between 3,000-5,000 according to the Ministry of Home Affairs and 10,000 or more according to other sources. Flood displaced people have found shelter in 28 government established camps in Sunsari, in numerous spontaneous camps along roads and embankments and with host families. According to OCHA, at the end of August there were approximately 21,300 people living in established shelters in Sunsari and Saptari. Map 1 in Annex 1 provides an overview of the affected areas and the locations of camps for displaced people. This assessment aims to assess and quantify the extent of damage and displacement caused by the flood and the initial impact it has had on household food security, nutrition and livelihoods. It also identifies key protection, health, water and sanitation issues. Based on the outcomes of the assessment, the flash appeal document and the sectoral response plans will be revised and updated to ensure an evidence-based effective and coordinated response. In addition, the assessment will form the basis for further defining and planning a strategy for early recovery, livelihood support and disaster risk reduction. The assessment builds on previous assessments undertaken and uses an adapted version of the inter-agency initial rapid assessment tool that was developed during 2008 by the IASC cluster process. 2
3 2. METHODOLOGY Information presented within this preliminary report is based upon field data collected during the period 13 to 17 September A one day training session for the field assessment teams was provided by WFP simultaneously in Sunsari and Saptari on 12 September. This involved field-testing of the survey tools in an affected community and temporary shelter camp. The existing Initial Response Assessment (IRA) tool which had been developed during the course of 2008 by the IASC cluster system was used as a basis to develop situation specific survey instruments. In doing so, a community and household questionnaire was developed with input from all cluster agencies. The questionnaires were designed to allow for comparison of the situation before and after the flood to assess the impact on livelihoods, household food security, nutrition and the market situation and to identify the key protection, health, water and sanitation issues. Four different locations were assessed: 1. Established IDP camps 2. Spontaneous IDP camps 3. Flood affected communities 4. Host communities In each of these assessment locations a community focus group discussion was conducted with key informants, consisting of women, men, camp management, health workers, teachers, etc. Subsequently, household interviews were conducted with IDPs, affected households and households hosting IDPs, using the household questionnaire. In each affected community and in each selected camp (established and spontaneous) six households were randomly identified and interviewed. In each hosting community, three IDP households were identified and interviewed along with their hosting families. In total there were six assessment teams, three in Sunsari and three in Saptari. Each assessment team covered two to three VDCs and consisted of a minimum of three people. Data was collected by filling out the hardcopy household and community questionnaires which were subsequently inputted on the same day by the WFP assessor using a PDA and transmitted to Kathmandu. In total 67 community questionnaires were completed (42 in Sunsari and 25 in Saptari) and 303 household interviews took place (195 in Sunsari and 108 in Saptari). Details are provided in Table 1. The focus of the assessment was on affected communities, spontaneous camps and IDPs living with host families. Given the information already available on established camps only 10 and 7 were included in this assessment in Sunsari and Saptari respectively. communities Sunsari Saptari All households communities households communities households Established camp Spontaneous camp Affected community Host community All Table 1 Each team was provided with a detailed map of the VDC, indicating roads, rivers, settlements and known locations of established camps. As a first step in the sampling process, the assessment teams through discussions with key informants, e.g. VDC secretary etc. identified and mapped out the geographic locations of any spontaneous camps and the approximate size of these camps, communities with a concentration of IDPs in host-families as well as any communities in flood-affected areas which were once again accessible and to which people had started to return. These maps were subsequently used as the sampling frame from which communities were randomly sampled. The assessment is not intended to be representative for all locations assessed as the household sample is too small for this purpose. However, the household sample is large enough to allow for general conclusions for the total displaced population. The location assessment results are indicative only and may in fact vary considerably from location to location. 3. AN ESTIMATION OF THE NUMBER OF DISPLACED AND AFFECTED PEOPLE According to the projected census data for 2008, the population in the 4 most affected districts is as shown in Table 2. Population 2008 Estimated total Total population in affected area only Haripur 10,214 10,214 Laukahi 5,676 2,374 PaschimKasuha 12,242 7,379 Sripurjabdi 15,911 15,911 Total 44,043 35,878 Table 2 Results of the households sample survey of displaced people found that the majority were from the four most affected VDCs in Sunsari. However, a little more than an estimated 42 percent of households originally came from Bihar in India (see Figure 1) Main affected VDCs (Sripurjabdi, Haripur, PaschimKusuha, Laukahi) 54% Figure 1 Other VDCs in Sunsari 4% Bihar (India) 42% To estimate the total number of affected and displaced people, further analysis of the data is required. However based on the household survey results and assuming that most of the population in the affected area has been displaced - equaling 54 percent of the displaced population - a total estimate of the number of displaced people can be put at approximately 66,500 people, of which an estimated 27,900 people originate from India. 3
4 Most displaced people (70 percent) do not know or cannot say when they will be able to return home. Sixteen percent believe it will take more than six months and 8.4 percent hope to return between two and six months. A marginal number of displaced people (just over one percent) believe they will be able to return home within one month. It is reported that during the survey period people were still arriving as shown in Table 3. On the other hand people have also started to leave which indicates that there is still a lot of movement going on and that people move from one place to another for shelter and essential supplies. Percentage of assessment locations People still arriving People starting to leave Established camp Spontaneous camp 44 - Hosting community Affected community 20 - All 38 % 22 % Table 3 The main reasons why people are still arriving include they are no longer able to stay in previous IDP sites and staying with host families (50 percent); attraction of relief distribution (17.9 percent); and the flooding of more areas (17.9 percent). The main reasons why people are leaving include flood area having again become accessible (33 percent) and they are no longer able to stay at their current locations (27 percent). Of all displaced people only 34 percent so far have received a government identity card, while 44 percent report that they have received a beneficiary card for aid distribution. Table 4 shows the percentages by assessment location. It is evident that the registration of displaced people has been mostly concentrated in the established camps. Consequently most of the humanitarian relief has been directed to the established camps as will be discussed in Section 13. A little over 16 percent of Indian nationals have received a government identify card. Percentage of households who received Government identity card Beneficiary card for aid distribution Established camp Spontaneous camp 6 19 Hosting community Affected community All Table 4 4. A PROFILE OF THE AFFECTED AND DISPLACED Table 5 provides a selection of indicators regarding household demography and socio-economic status. As discussed, a substantial percentage of the affected and displaced population is from India. Most Nepali nationals originate from the four most-affected VDCs. A small percentage originates from elsewhere. Among the affected and displaced, a little over 10 percent of households are headed by females. Many households are Muslim (29.5 percent) and a substantial number are Dalit (17.5 percent). The average number of people sharing the same cooking pot is 7.4. Defecation in the open is commonly practiced by almost 62 percent of the displaced households. Most households rely on a tube well for their drinking water (91 percent) while 2.6 percent of the population get their drinking water from a river, stream or open well. The principal means of livelihood before the flood for almost 60 percent of the households was crop farming percent depended on casual wage labour as their primary source of income. Livestock farming and casual wage labour were the second primary means of livelihood for the displaced population. Remittances were not a key means of livelihood in the affected area. Selected indicators Place of origin: India Nepal (4 most affected VDCS) Nepal (elsewhere) Caste/ethnicity Brahmin / Chettri Janajati Dalit Muslim Other 42 % 54 % 4 % 11.6 % 10.9 % 17.5 % 29.5 % 30.5 % Percentage of female headed households 10.3 % Average household size Average number of children (6-18 yrs) Average number of children (<5 yrs) Average number of infants (<2 yrs) Use of sanitation facilities (before flood) Open defecation Water seal or pit latrine Use of primary water source (before flood) Tube well / hand pump Open water source % 33.3 % 90.8 % 2.6 % Primary means of livelihood (before flood): First Second Crop farming Livestock farming Casual wage labour Trade/business Remittances Other Table % 1.0 % 17.3 % 9.6 % 0.0 % 12.3 % 5. CONDITIONS IN TEMPORARY CAMPS 14.6 % 28.0 % 26.8 % 14.6 % 2.1 % 13.9 % 5.1 Shelter Improvements in the shelter situation are of utmost importance. Camps are generally crowded with on average three households sharing a particular type of shelter whether tent, class room or other type of public building. For the established camps, most people have taken shelter in a school or public facility. However, about 41 percent currently live in tents or under tarpaulins. For those in spontaneous camps, about 67 percent live in tents or under tarpaulins, while about 25 percent are now living in a school or public building. About six percent of households in spontaneous camps report having no shelter at all. For most households, the shelters in which they are now living do not provide adequate protection against the elements. For all assessment locations, almost 52 percent of the households report that they and their belongings get wet when it rains. For established camps, this percentage is 44 percent, while 62 percent of households in spontaneous camps report that they and their belongings get wet when it is raining. 5.2 Ability to prepare food It remains difficult for households within the camps to cook for themselves, particularly in spontaneous camps due to a lack of firewood, cooking stoves and utensils. Table 6 shows the percentage of displaced households who are experiencing a shortage in the availability of various items. An urgent problem needing to be addressed is the lack of 4
5 firewood or cooking fuel with almost all households complaining that there is not sufficient supply of either. Shortage in availability (% of households) Established camp Spontaneous camp Clean water 24 % 44 % Firewood or cooking 92 % 94 % fuel Cooking stove 75 % 86 % Cooking utensils 76 % 90 % Table Water and sanitation The average number of water and sanitation facilities per 100 people available in established and spontaneous camps is presented in Table 7. Water and sanitation facilities per 100 people Established camp Spontaneous camp Tube wells Latrines Bathing facilities Table 7 People in established camps have somewhat better access to water and sanitation facilities than those staying in spontaneous camps. However, on average more than 100 people need to share one latrine and tube well. For spontaneous camps this goes up to more than 300 people. The cleanliness of established camps is generally poor for a third of the camps. Cleanliness in two-thirds of the spontaneous camps visited was unacceptable. 5.4 Protection There are reports of gender-based violence and cases of sexual harassment. However, in general women did not feel comfortable sharing this information with the assessment teams. Referral systems for gender-based violence are nonexistent in the camps. More than 74 percent of households in established and spontaneous camps report that they feel generally safe. The percentages are a little lower for those households staying with host families and those residing in affected communities. The main threat is perceived as coming from criminal elements in the community and in the camps from other camp residents. People staying in host families sometimes perceive a threat from other family members. A small percentage (4.3 percent) feels threatened by the security forces. In affected communities, households feel the risk of renewed flooding as a major threat. 5.5 Health All families in established and spontaneous camps report having access to basic medical care. The main health concerns of people staying in camps are cough, fever, diarrhoea and high fever as shown in Figure 2. Other Trauma / injuries Snake bite Eye infection Vomiting Dehydration Skin disease High fever Diarrhoea Cough and fever Figure 2 Three main health concerns Population in camps In the 12 established camps assessed, HIV- and STIprevention services are mostly non-existent. Only in three out of these 12 camps, were condoms, testing and counseling services available. In none of the spontaneous camps were these services provided. Some kind of family planning service is available in nine out of the 12 established camps. In three camps oral contraceptive pills were available. Two of those also had injectable hormonal contraceptives and offered counseling services and one camp provided a choice of intra-uterine devices. 6. HOST FAMILIES SITUATION A significant share of people staying with host families originated from India (65 percent). Host families provide shelter to on average nine to 10 people. One third of host families reported that IDPs have started to leave. Most of them left for home or camps in India. Approximately onethird left the host family to seek shelter in an established camp. Based on observations of the assessment teams it is often the case that poor displaced people have sought refuge with other poor families, thereby causing considerable strain and further impoverishing the host family. This is confirmed by the data collected. Table 8 shows the percentage of host families who reported a significant negative change in their access to food, savings, animal fodder, cooking fuel and firewood to the extent that it caused problems for the host family. Percentage of host families who reported a significant decrease in their access to: Food 43.7 % Savings 36.8 % Animal fodder 21.8 % Cooking fuel 35.1 % Firewood 58.6 % Table 8 To date only limited or no assistance has been provided to displaced people staying with host families or to the host families themselves (see Section 13). 7. THE EXTENT OF DAMAGE The assessment teams could only visit those communities which were accessible. It can be safely assumed that the extent of damage in areas still submerged is of similar magnitude or worse. The brunt of the impact of the flood was on housing, agricultural production and infrastructure. According to the community survey in affected communities, 80 percent of houses were completely damaged and 10 percent were partially damaged. Rice production was heavily affected and farmers have incurred heavy losses. In the worst-affected areas, the crop has been completely lost. The average loss from all affected areas was 90 percent. A detailed crop assessment was undertaken by the Ministry of Agriculture who estimated the total loss at 16,800 Mt out of a total of 4,800 hectares of land affected. The East-West Highway remains impassable and it will take considerable time to repair. The flood has caused significant 5
6 damage to phone lines and installations. In India, the electrical transmission facilities were damaged, causing Nepal to introduce a load-shedding schedule of 16 hours per week. 8. IMPACT ON LIVELIHOODS AND ASSETS 89 percent of households have not yet been able to resume their primary means of livelihoods and 79 percent have not been able to resume their secondary means. Many are unable to return home, either because they are prevented by the cost of return (boat charges to Bihar are around IC 1,000) or because they cannot yet return due to ongoing flooding. Most households (87.5 percent) do not know or cannot say when they will be able to resume their primary or secondary means of livelihood again. Table 9 shows the extent to which household assets - jewelry, electric appliances, furniture, kitchen utensils, food stocks and official documents - were affected. Property was badly affected with 66 percent of houses completely destroyed and 27 percent partially damaged. The impact was also severe on other household assets such as furniture, utensils and food stocks as indicated in Table 9. Asset ownership Extent of loss (% of households) by households before the flood Fully Partially House Jewellery Electric appliances Furniture Kitchen utensils Food stocks Official Documents Table 9 Table 10 shows the average number of animals that households owned before and after the flood. The losses are extremely high. On average households lost 62 percent of their livestock in the flood affected areas. However, these figures are probably on the high side with the official record showing animal loss as a little over 14,000. Therefore, not all may have been lost; many families have brought part or all of their livestock from affected areas to the temporary camps. But, as fodder is in limited supply in the camps, many have been forced to sell their cattle in exchange for cash or food. Although the livestock prices were not covered in this assessment, the assessment teams reported sharp decreases in the price of cattle caused by people trying to sell off their domestic animals. Extent of loss Before Now % change Cow/Oxen/Buffalo % Goat/Sheep/Pig % Poultry % Table 10 Table 11 illustrates losses in productive assets, including agricultural tools, machinery, fishing gear, crops etc. Again, the extent of loss is substantial with often more than 80 percent of affected households reporting that productive assets were completely lost. Asset ownership Extent of loss (% of households) by households before the flood Fully Partially Agricultural tools Agricultural machinery Agricultural crops Crop seeds Trees / Ochard Fishing gear Fish pond Rickshaw/bicycle/van/motorbike Workshop (repairs, cottage industry etc.) Table 11 There has been a dramatic shift in the sources of income of affected households. Figure 3 compares the proportion of income from different sources before and after the flood in the affected population. As can be expected, sale of agricultural products has declined sharply as an income source, while income through relief/aid support has on average increased by up to 50 percent. 100% 90% 80% 70% 60% 50% 40% 30% 20% 10% 0% Figure 3 Changes in sources of income Before flood (%) Now (%) Relief aid Remittances Business/trade Wage income 9. IMPACT ON HOUSEHOLD FOOD SECURITY Sale of agricultural products incl. livestock Given the loss of people s homes, livelihoods and assets as well as consequent drain on host families, the food security situation at household level is of particular concern and requires continuous monitoring over coming months. As shown in Figure 4, affected households have switched their main source for food grains from own production and market purchase to emergency relief (49.5 percent) and social networks (30.2 percent). Fishing/hunting etc. Own production Purchase Social network Emergency relief Figure 4 Figure 5 presents a list of coping strategies used by the displaced households. It shows the percentage of 6
7 households that have practiced these strategies at least once a week. For more permanent damaging coping strategies such as the sale of land and assets, out-migration and selling of labour in advance it indicates whether this activity has occurred since the flood on 18 August. The lower concentration in the use of coping strategies in established camps is most likely due to relief efforts which until now have been mainly focused on the established camps. However, even for these households, the impact on livelihoods has been huge and increased efforts need to be made to restore people s livelihoods so as to prevent a possible deterioration in household food security in coming months. The relative low intensity of coping mechanisms in the affected communities cannot be readily explained. Further work by the assessment teams is required to clarify this. The high intensity of coping mechanisms apparent in those living in spontaneous camps and those who reside with host families would justify expanding the external support to these affected populations. This would secure the families food needs and prevent further deterioration in their livelihoods and well-being. 10. IMPACT ON FOOD CONSUMPTION, NUTRITON AND HEALTH STATUS Figure 5 Overall, 80 percent of households shifted their consumption to less preferred and less expensive food. More than 52 percent had to borrow money for consumption purposes and almost 46 percent had reduced the food intake of their children. A very worrying fact is that 17 percent of the population experienced at least one day a week without any meal at all. Seventeen percent of the households have sold labour in advance and between four to seven percent of households are selling agricultural or household assets. Out-migration of family members has been significant since 18 August. Twenty-five percent of households staying in established camps had at least one family member who migrated elsewhere. In spontaneous camps, hosting communities and affected communities these percentages were, 29, 29 and 9 percent, respectively. A significant higher-than-normal percentage of migrants were reported to be female (46 percent) and almost 49 percent of those migrated were below the age of 16. A coping strategy index has also been calculated. It combines the extent and frequency of the adopted coping strategy by different households. Coping strategies with more severe long-term consequences were assigned a higher weight in the calculation of the coping strategy index. Table 12 shows the result for each assessment location. The highest concentration in the use of coping strategies is found in spontaneous camps and among those living with host families. Coping strategy index Established camps 35 Spontaneous camps 41 Hosting community 45 Affected community 18 Table 12 Results for food consumption, as measured by dietary diversity over the past week, indicate that 76 percent of households consumed cereals on a daily basis. Fruits, meat, fish, eggs and milk and dairy products were not consumed by the majority of the affected population (84, 93, 91, 99 and 88 percent, respectively). There were substantial differences in the dietary diversity between the different assessment locations as shown in Table 13, which shows the food consumption score (FCS) for each location using standard agreed threshold values. Acceptable Borderline Poor Established camps Spontaneous camps Hosting community Affected community Table 13 Dietary diversity as measured by the FCS is worst in spontaneous camps and in host families. Most likely due to the delivery of food aid to established camps, the food consumption of displaced people in these locations is generally better. However, almost 26 percent of people in established camps fall in the borderline category with regard to food intake. Almost 40 percent of the interviewed households had a child under 5 years of age. The nutrition status of these children was screened by taking Mid-Upper-Arm-Circumference (MUAC) measurements. The average MUAC measurement for children 6-59 months was 13.4 cm. Table 14 shows the incidence of malnutrition according to globally used threshold values. Nutrition and Health status of children under 5 % Nutrition status: Severe acute malnutrition (MUAC < 11cm) 1.7 Moderate acute malnutrition (MUAC between cm and 12.5cm) At risk (MUAC between 12.5 and 13.5cm) 33.3 Global acute malnutrition rate 13.4 Health status: Fever 51.7 Cough or wheezing 56.1 Diarrhoea 34.2 Table 14 7
8 The nutrition screening using MUAC indicate wasting levels close to 14 percent and given high incidence of diarrhoea and respiratory infections among children 6-59 months, the situation may further deteriorate. Just under 2 percent were found to be severely malnourished and would require urgent treatment. The morbidity situation is worrying with more than 34 percent of children suffering from diarrhoea, 52 percent from fever and 56 percent from cough or wheezing (with no differences noted by child s sex). About 51 percent of children received medical care for their ailment (76 percent in established camps, 50 percent in spontaneous camps, 40 in host communities and 25 percent in affected communities). Access to complementary foods for infants was limited with 65.3 percent of households reported not having access to complementary foods. The situation is better in established camps where 62 percent reported to have access to complementary foods, however more than half of those reported that it was insufficient. 11. IMPACT ON EDUCATION The impact on education seems to be substantial with most school buildings either fully or partially damaged or used for providing shelter. Table 15 shows the percentage of assessment locations where the school is either not affected, affected and not in use or where the school building is currently used for providing shelter. Not affected and in use (%) Damaged and not in use (%) Used for providing temporary shelter (%) Established camps Spontaneous camps Hosting community Affected community Table 15 School and educational materials have mostly not been affected or only partially, however 56 percent of the community focus group discussions held in spontaneous camps revealed that school materials were mostly lost. 12. THE MARKET SITUATION Prices of selected commodities were collected and compared against their price levels before the flood as presented in Table 16. Price (Nrs) Commodity Before % increase Now flood Coarse rice (kg) Fine rice (kg) Wheat flour (kg) Mustard oil (Lt) Musuro (kg) Black gram (kg) Onion (kg) Potato (kg) Fire wood (bundle) Table 16 The flood has had a significant upward impact on commodity prices. The most dramatic price increase is in onion, potato and fire wood. In contrast, prices of perishable food items such as banana and vegetables have fallen sharply in Sunsari. The inability of transporters to cross the Koshi River due to severe damage to the East-West Highway is one key factor that has contributed to the increase in prices. With the sharp increases in basic essentials, access to food is likely to become increasingly difficult if no humanitarian assistance is provided. As access to the areas is difficult, the effect that local procurement of food aid may have on local prices will need to be carefully monitored. The joint market watch system of MoAC, WFP, FNCCI and the consumer protection forum is ideally placed to fulfil this essential monitoring requirement. 13. ASSISTANCE PROVIDED Table 17 shows the percentage of households who have received and those who currently receive humanitarian assistance. It becomes immediately evident that more households in the established camps have benefited and continue to benefit from humanitarian assistance than households in spontaneous camps or those living with host families or in affected communities. Humanitarian assistance (% of households) Received Currently receiving Established camps 48.9 % 61.6 % Spontaneous camps 9.9 % 11.3 % Hosting community 25.3 % 14.8 % Affected community 15.9 % 12.2 % Table 17 Table 18 shows the percentage of households who have received different types of humanitarian support. From the different assistance provided, ready to eat food and food aid were the most common. Supplementary food items for young children are provided to only one-third of the children. Only 10 percent of pregnant and nursing women receive supplementary food aid rations. At the time of the survey, general food rations were being received by almost 64 percent of affected households. Free medical care is now available to most households (71 percent). Only 4.4 percent of households have received cash and this has decreased to 1.6 percent at the time of the survey. Livelihood support programmes such as provision of agricultural inputs and tools have not yet started. Sector Relief item Humanitarian assistance (% of households) Received Currently receiving Ready to eat emergency food 73.7 % 22.8 % Cooked food 41.2 % 13.4 % Food aid 48.3 % 63.8 % Food aid for young children 29.4 % 31.5 % Food and nutrition Shelter Health Livelihoods & agriculture Table 18 Food aid for pregnant and 21.9 % 10.2 % lactating mothers Tarpaulin 44.7 % 7.9 % Stove & kitchen utensils 42.1 % 7.1 % Blanket/clothing 38.6 % 6.3 % Hygiene kit 39.9 % 11.0 % Health kit 15.4 % 6.3 % Free medical care 25.0 % 70.9 % Medical animal care 8.3 % 14.2 % Cash relief 4.4 % 1.6 % Construction material 5.3 % 3.9 % Agricultural tools/equipment 0.4 % 0.0 % Agricultural inputs 0.4 % 0.0 % Other 1.3 % 0.0 % 8
9 A little over 54 percent of all affected households report that they have no information about the available assistance. There is no significant difference between the different assessment locations. Almost 60 percent of all affected households claim that the assistance provided has not been distributed fairly. More households in spontaneous camps, hosting communities and affected communities make this claim than those in established camps. 14. VULNERABLE GROUPS AND IMMEDIATE NEEDS Community focus group discussions found that children, women, elderly and the ultra poor were most affected by the flood and in immediate need of assistance. The two most immediate needs indicated by the communities are presented in Figure 6. Don t know Other Sanitation facilities Drinking water Learning facilities Cash Clothing / blankets Medical / health support Food and other essential aid deliveries can prevent a further deterioration in household food, nutrition and health security. However, of immediate need is improvement in the shelter conditions and supply of cooking fuel or firewood. Furthermore, aid deliveries should immediately be extended to families living with host families and in spontaneous camps. These families demonstrate significant higher use of damaging coping strategies and have a much lower average consumption intake. With the expected deterioration in the nutritional status of children over the coming months with one third of the children at risk of becoming malnourished, further food aid deliveries need to take into account the possibility of complementary feeding programmes directed at young children, pregnant women and nursing mothers. The aid deliveries should support broader livelihood recovery programmes and disaster risk reduction strategies which will need to be set-up. A follow-up assessment focusing on recovery needs is scheduled to take place at the beginning of November. Shelter Food Figure 6 The most urgent needs expressed by community members include food and shelter, followed by medical support and clothing/blankets. Other needs include firewood and kitchen utensils. Figure 7 looks at the most urgent recovery needs as indicated by community members. Housing, agricultural inputs and repair of the embankments were listed as the urgent recovery needs. Other Irrigation Health facilities Learning facilities Road infrastructure Schools Embankments Agricultural input Housing Figure CONCLUSION The flood had a severe impact on people s homes, livelihoods and assets. Most people do not yet know when they will be able to return home and resume their livelihoods. The prices of essential commodities have risen sharply from an already high level before the flood. It is expected that people will be needing shelter, food and other essential supplies for the foreseeable future until the embankments have been repaired, houses rebuild and a long-term solution found for improved disaster risk management. 9
10 The Koshi River Flood Impact Assessment was a multi-agency coordinated activity that was implemented through the IASC preparedness and response cluster system. The assessment was coordinated with assistance from the UNDAC team and technical leadership was provided by the World Food Programme. The initial rapid response assessment tool which had been developed during 2008 by the cluster system was used as the basis for developing the survey instruments. The following cluster agencies provided technical input into this process: UNDAC and OCHA (coordination) OHCHR, UNHCR and UNFPA (protection) UNICEF (WASH, child protection, education and nutrition) NRCS and IFRC (shelter) IOM (camp coordination) WFP (food) FAO (livelihoods / agriculture) WHO (health) Field work was undertaken by 26 staff from 10 different organizations including the Government of Nepal as follows: WFP UNICEF UNHCR WHO IOM Save the Children CARE ISDR RSDC Government of Nepal The WFP Nepal Food Security Monitoring and Analysis System was made available to rapidly input, screen, organize, analyze and present the data. 10

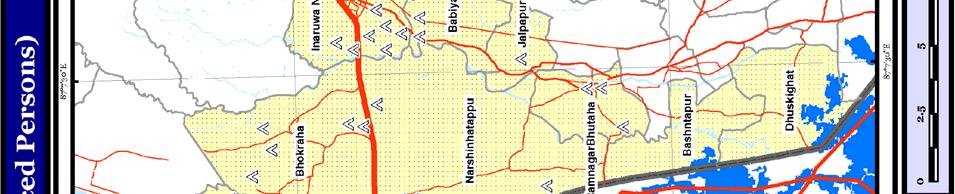
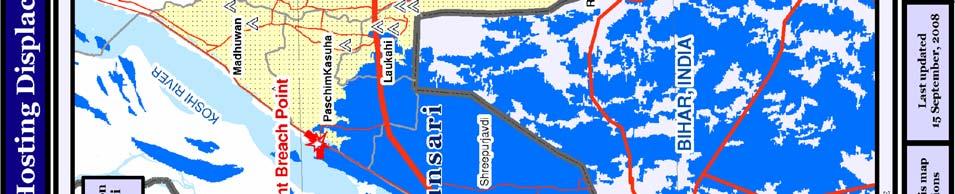
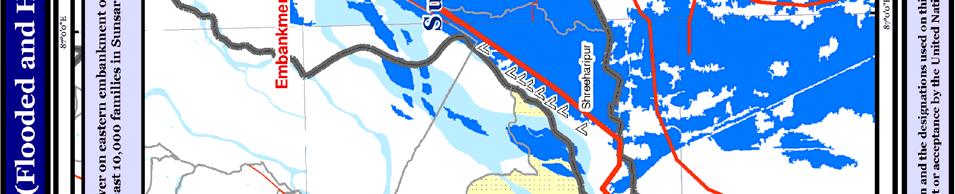
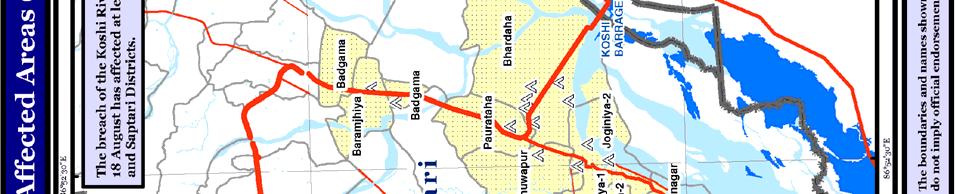
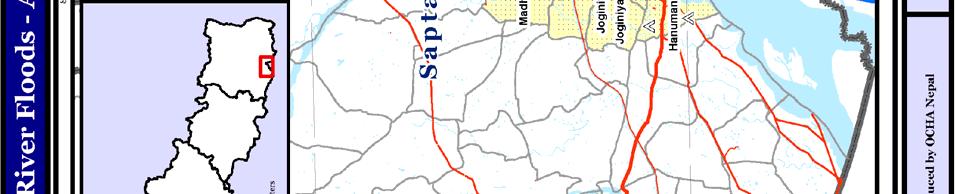
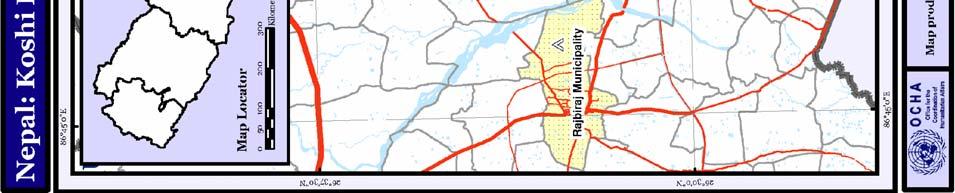
11 Annex 1 Map 1 11
Kenya Inter-agency Rapid Assessment Community Group Discussion
 Kenya Inter-agency Rapid Assessment Community Group Discussion General information G1. Take the GPS location G2. Name of the data collector G3. County G4. Sub-County G5. Ward G6. Location G7. Sub-location
Kenya Initial Rapid Assessment Community Group Discussion
 Kenya Initial Rapid Assessment Community Group Discussion GENERAL INFORMATION G1. Take the GPS location G3. County G10. Type of crisis G.11 Type of site / settlement G2. Name of the data collector G4.
JOINT RAPID ASSESSMENT IN GAJIRAM TOWN, NGANZAI LGA, BORNO STATE. BY Action Against Hunger AND NRC. DATE : 3rd JANUARY 2018
 JOINT RAPID ASSESSMENT IN GAJIRAM TOWN, NGANZAI LGA, BORNO STATE BY Action Against Hunger AND NRC DATE : 3rd JANUARY 2018 EXECUTIVE SUMMARY This report present the findings of the joint rapid needs assessment
Nepal: Oxfam EFSVL response to the Nepal Mid and Far West Floods and Landslides, Oxfam Canada s Intervention CHAF September 01, 2014
 Canadian Humanitarian Assistance Fund (CHAF) Disaster Response Strategy Nepal: Oxfam EFSVL response to the Nepal Mid and Far West Floods and Landslides, 2014 Oxfam Canada s Intervention CHAF September
Main Findings. WFP Food Security Monitoring System (FSMS) West Darfur State. Round 10 (May 2011)
 West Darfur State. Round 10 (May 2011)") WFP Food Security Monitoring System (FSMS) Round 1 (May 11) West Darfur State Main Findings Data collection was carried out in May 11, which corresponds to the pre hunger season and all the sentinel sites
WFP Food Security Monitoring System (FSMS) Round 1 (May 11) West Darfur State Main Findings Data collection was carried out in May 11, which corresponds to the pre hunger season and all the sentinel sites
South Sudan - Jonglei State
 April 06 SUDAN Overview Conflict in Jonglei State first broke out in late December 0, only days after fighting began in Juba. Since then, the state has been one of the worst affected by the conflict, and
REACH Situation Overview: Intentions and Needs in Eastern Aleppo City, Syria
 REACH Situation Overview: Intentions and Needs in Eastern Aleppo City, Syria 18 August 2016 INTRODUCTION Since the closure of Castello road in early July and the ensuing intensification of conflict in
EASTERN SUDAN FOOD SECURITY MONITORING
 EASTERN SUDAN FOOD SECURITY MONITORING KASSALA STATE, ROUND 1 JULY 2010 Highlights Round 1 of the FSMS in was carried out at the peak of the lean season. The food security situation in the urban and rural
Nepal: Floods. DREF operation n MDRNP002do GLIDE n FL NPL 28 August 2008
 Nepal: Floods DREF operation n MDRNP002do GLIDE n FL-2008-000104-NPL 28 August 2008 The International Federation s Disaster Relief Emergency Fund (DREF) is a source of un-earmarked money created by the
Rapid Multi Sectoral Needs Assessment in Kukawa, Cross Kauwa and Doro Baga
 Rapid Multi Sectoral Needs Assessment in Kukawa, Cross Kauwa and Doro Baga November 2017 List of Contents Introduction and Methodology... 2 Main findings... 2 Kukawa... 2 Cross Kauwa... 4 Doro Baga...
18,320 Families temporarily displaced *As per NRCS. 123 Dead *as per MoHA
 Nepal: Flood 2017 Office of the Resident Coordinator Situation Report No. 2 (as of 16 August 2017) This report is produced by Office of the Resident Coordinator Nepal in collaboration with humanitarian
TO: Laurent Bukera, Chief, OMXP DATE: 4 September 2009 FROM: Annalisa Conte, Country Director, Burkina Faso
 TO: Laurent Bukera, Chief, OMXP DATE: 4 September 2009 FROM: Annalisa Conte, Country Director, Burkina Faso PAGE 1 OF 5 (Information note 3 pages, EMOP budget 2 pages) CC: Thomas Yanga, Regional Director,
Sri Lanka: a review and analysis of experience
 Nutrition surveillance programme in tsunami affected areas of Sri Lanka: a review and analysis of experience Dr. Renuka Jayatissa, Dr. Aberra Bekele Department of Nutrition, Medical Research Institute,
PAKISTAN - COMPLEX EMERGENCY
 PAKISTAN - COMPLEX EMERGENCY FACT SHEET #3, FISCAL YEAR (FY) 2017 SEPTEMBER 30, 2017 NUMBERS AT A GLANCE 42,225 Displaced Households in FATA OCHA September 2017 262,623 Households Voluntarily Returned
East Africa Hunger Crisis East Africa Hunger Crisis Emergency Response Emergency Response Mid-2017 Updated Appeal Mid-2017 Appeal
 ETHIOPIA SOUTH SUDAN East Africa Hunger Crisis East Africa Hunger Crisis Emergency Response Emergency Response Mid-2017 Updated Appeal Mid-2017 Appeal KEY MESSAGES Deteriorating security situation: All
Food Crisis in the Horn of Africa: CARE Emergency Fund Seeks $48 million
 More than 1,500 refugees at least 80 percent of them children are arriving at refugee camps in Kenya daily as a result of a widespread food crisis. Food Crisis in the Horn of Africa: CARE Emergency Fund
KEY FINDINGS. Assessment Report Gorkha 18 June 2015
 Assessment Report Gorkha 18 June 2015 KEY FINDINGS A joint assessment was conducted in 7 northern hard-to-reach VDCs of Gorkha district between 1 June and 8 June. Focus group discussions were held with
Highlights. Situation Overview. 340,000 Affected people. 237,000 Internally displaced. 4,296 Houses damaged. 84 People dead
 Sri Lanka: Floods and landslides Situation Report No. 1 (as of 22 May 2016) This report is produced by OCHA Regional Office for Asia and the Pacific, in collaboration with humanitarian partners. It covers
UNICEF HUMANITARIAN ACTION AFGHANISTAN IN 2008
 For every child Health, Education, Equality, Protection ADVANCE HUMANITY UNICEF HUMANITARIAN ACTION AFGHANISTAN IN 2008 CORE COUNTRY DATA Population under 18 Population under 5 (thousands) 13982 5972 U5
Site Assessment: Round 8
 IOM BANGLADESH Needs and Population Monitoring (NPM) Site Assessment: Round 8 Following an outbreak of violence on 25 August 2017 in Rakhine State, Myanmar, a new massive influx of Rohingya NPM refugees
FOOD SECURITY AND OUTCOMES MONITORING REFUGEES OPERATION
 Highlights The yearly anthropometric survey in Kakuma was conducted in November with a Global Acute Malnutrition (GAM) rate of 11.4% among children less than 5 years of age. This is a deterioration compared
ETHIOPIA HUMANITARIAN FUND (EHF) SECOND ROUND STANDARD ALLOCATION- JULY 2017
 SECOND ROUND STANDARD ALLOCATION- JULY 2017") ETHIOPIA HUMANITARIAN FUND (EHF) SECOND ROUND STANDARD ALLOCATION- JULY 2017 I. OVERVIEW 1. This document outlines the strategic objectives of the EHF Second Standard Allocation for 2017. The document
ETHIOPIA HUMANITARIAN FUND (EHF) SECOND ROUND STANDARD ALLOCATION- JULY 2017 I. OVERVIEW 1. This document outlines the strategic objectives of the EHF Second Standard Allocation for 2017. The document
JOINT INITIAL ASSESSMENT GALGALA DISPLACED PEOPLE IN BARI AND SANAAG REGIONS.
 JOINT INITIAL ASSESSMENT GALGALA DISPLACED PEOPLE IN BARI AND SANAAG REGIONS. Date: 08 March 2015 Some of the new displaced people living outs tricks of Buraan village 1 P a g e General context In August,
FOOD SECURITY MONITORING, TAJIKISTAN
 Fighting Hunger Worldwide BULLETIN February 2017 ISSUE 18 Tajikistan Food Security Monitoring Highlights The food security situation presents expected seasonal variation better in December after the harvest,
16% 9% 13% 13% " " Services Storage Meters
 1+16+9+13+13 Camp Profile - Ein Issa Ar-Raqqa governorate, Syria November 2017 Management agency: Raqqa Civil Council (RCC) Registration actor: RCC, UNHCR Summary This profile provides a multisectoral
Province 7. India. 100 km. 143 Dead *as per MoHA. 461,000 People temporarily displaced * as per IRA
 Nepal: Flood 2017 Office of the Resident Coordinator Situation Report No. 4 (as of 21 August 2017) This report is produced by Office of the Resident Coordinator Nepal in collaboration with humanitarian
Persons of concern Total 83,480 53,410
 UNHCR worked with the Government of Zambia to help 9,700 Congolese refugees repatriate to the Democratic Republic of the Congo (DRC), mainly to Katanga Province. From January to March 2008 UNHCR conducted
Hunger and displacement: Views and solutions from the field. Lake Chad Basin
 Guy Calaf for Action Against Hunger Nigeria Hunger and displacement: Views and solutions from the field Lake Chad Basin OVERVIEW HUMANITARIAN CONTEXT Conflict Hunger The conflict between security forces
HIGHLIGHTS DJIBOUTI INTER-AGENCY UPDATE FOR THE RESPONSE TO THE YEMEN SITUATION #38 7,002. 2,945 Registered females.
 DJIBOUTI INTER-AGENCY UPDATE FOR THE RESPONSE TO THE YEMEN SITUATION #38 31 March 2016 HIGHLIGHTS KEY FIGURES 7,002 According to the latest available statistics from IOM and the Djibouti government, 33,340
From January to March 2015, WFP assisted 896,791 Syrian refugees, 11,972 new arrivals and 21,801 Palestine refugees from Syria.
 Quarter 1, January-March 2015 Regional Emergency Operation 200433- Syria crisis Lebanon Monitoring and Evaluation report, January-March 2015 Monitoring brief WFP conducts a range of monitoring and evaluation
MULTI SECTOR INITIAL RAPID NEEDS ASSESSMENT TO DIKWA TOWN
 MULTI SECTOR INITIAL RAPID NEEDS ASSESSMENT TO DIKWA TOWN Author: Filip Lozinski Date of report: 21 st April 2017 Assessment Team: Mustapha Mohammed Grema, Lare Maina, Danladi Bitrus Mamza Basic details
1.1 million displaced people are currently in need of ongoing humanitarian assistance in KP and FATA.
 Pakistan: FATA Displacements Situation Report No. 1 (as of 21 May 2013) This report is produced by OCHA Pakistan in collaboration with humanitarian partners. It was issued by OCHA Pakistan. It covers the
RAPID NEED ASSESSMENT REPORT
 RAPID NEED ASSESSMENT REPORT Syrian Refugees Marj el Khokh Informal Camp Marjeyoun District, South Lebanon 3 rd of April 2013 AVSI Foundation EMERGENCY TEAM Jounieh Ghadir, Rue st. Fawka (Lebanon) Telefax:
Myanmar Displacement in Kachin State
 Myanmar Displacement in Kachin State 28 December 2011 This report is compiled by UN-OCHA with the Humanitarian Country Team partners contribution. It covers the period from 25 October 2011 to 28 December
011% 65+ years 0% 666% 0-2 years 6%
 +58A 42% +42A 58% Multi-Sector Needs Assessment - July 2018 Background and Methodology An estimated 723,000 Rohingya refugees have fled violence in Myanmar s Rakhine state since August 25, 2017 1. Most
Myanmar. Operational highlights. Working environment. Achievements and impact. Persons of concern. Main objectives and targets
 Operational highlights UNHCR strengthened protection in northern Rakhine State (NRS) by improving monitoring s and intervening with the authorities where needed. It also increased support for persons with
444% 0-2 years 4% Multi-Sector Needs Assessment - July W Demographics. Camp 23 / Shamlapur, Teknaf, Cox s Bazar, Bangladesh
 +53A 47% +43A 57% Multi-Sector Needs Assessment - July 2018 Background and Methodology An estimated 723,000 Rohingya refugees have fled violence in Myanmar s Rakhine state since August 25, 2017 1. Most
122% 65+ years 1% 544% 0-2 years 5%
 +51A 49% +49A 51% Multi-Sector Needs Assessment - July 2018 Background and Methodology An estimated 723,000 Rohingya refugees have fled violence in Myanmar s Rakhine state since August 25, 2017 1. Most
133% 65+ years 1% % years 14% 544% 0-2 years 5%
 +59A 41% +50A 50% Multi-Sector Needs Assessment - July 2018 Background and Methodology An estimated 723,000 Rohingya refugees have fled violence in Myanmar s Rakhine state since August 25, 2017 1. Most
Coordination of Afghan Relief (CoAR) Needs Assessment for Water, Sanitation and Hygiene of Pakistan Refugees and IDPs - Afghanistan
 Needs Assessment for Water, Sanitation and Hygiene of Pakistan Refugees and IDPs - Afghanistan") Coordination of Afghan Relief (CoAR) Needs Assessment for Water, Sanitation and Hygiene of Pakistan Refugees and IDPs - Afghanistan Submitted to: UNHCR Date: Contents 1. Introduction 1.1 Background 1.2
Coordination of Afghan Relief (CoAR) Needs Assessment for Water, Sanitation and Hygiene of Pakistan Refugees and IDPs - Afghanistan Submitted to: UNHCR Date: Contents 1. Introduction 1.1 Background 1.2
16% 8% 11% 16% " " " " " " " " "
 1+16+8+11+16 Camp Profile - Mabruka Al-Hasakeh governorate, Syria November 2017 Management agency: UNCHR, Self administration Registration actor: UNHCR Summary This profile provides a multisectoral needs
011% 65+ years 0% % years 14% 744% 0-2 years 7%
 +53A 47% +47A 53% Multi-Sector Needs Assessment - July 2018 Background and Methodology An estimated 723,000 Rohingya refugees have fled violence in Myanmar s Rakhine state since August 25, 2017 1. Most
Nepal. Persons of concern
 2009 was a key year in terms of resolving one of Asia s most protracted refugee situations. Just one year after the start of large-scale resettlement for refugees from Bhutan, more than 25,500 refugees
BANQUE AFRICAINE DE DEVELOPPEMENT
 BANQUE AFRICAINE DE DEVELOPPEMENT Publication autorisée Publication autorisée KENYA: PROPOSAL FOR AN EMERGENCY HUMANITARIAN ASSISTANCE TO POPULATION AFFECTED BY DROUGHT AND FAMINE* LIST OF ACRONYMS AND
PAKISTAN - COMPLEX EMERGENCY
 PAKISTAN - COMPLEX EMERGENCY FACT SHEET #3, FISCAL YEAR (FY) 2018 JULY 6, 2018 NUMBERS AT A GLANCE 29,442 Displaced Households Due to Conflict in KPk OCHA May 2018 USAID/OFDA 1 FUNDING BY SECTOR IN FY
PAKISTAN - COMPLEX EMERGENCY
 PAKISTAN - COMPLEX EMERGENCY FACT SHEET #2, FISCAL YEAR (FY) 2016 MARCH 25, 2016 NUMBERS AT A GLANCE 178,474 Displaced Families in FATA and KPk OCHA February 2016 125,312 Families That Voluntarily Returned
Province 7. India. 100 km. 461,000 People temporarily displaced * as per IRA
 Nepal: Flood 2017 Office of the Resident Coordinator Situation Report No. 5 (as of 24 August 2017,) This report is produced by Office of the Resident Coordinator Nepal in collaboration with humanitarian
Joint Multi-Cluster Initial Rapid Needs Assessment in Bulagadud. Background
 Joint Multi-Cluster Initial Rapid Needs Assessment in Bulagadud Background On 11 January 2018, a joint mission including 3 UN agencies, 9 INGOs and 5 NNGOs led by the Office for the Coordination of Humanitarian
100% of individuals are registered as camp residents. 6% of households are headed by females. 38 years old: Average head of household age.
 Camp Profile - Roj Al-Hasakeh governorate, Syria November 2017 Management agency: Self management Registration actor: UNHCR Summary This profile provides a multisectoral needs overview and summarises the
% of IDP population living in camps that have been registered at the household level
 Key humanitarian indicators have been identified by global clusters and are available for use by country teams to create a composite and ongoing picture of the humanitarian situation. CCCM Indicators C1
International Organization for Migration AFGHANISTAN. Natural Disaster Affected and Displaced Families from 1 January to 30 June 2014
 International Organization for Migration International Organization for Migration AFGHANISTAN AFGHANISTAN Humanitarian Assistance Programme Cumulative Report May - June 2014 HIGHLIGHTS from May June 2014
August 19, 2013 (issue # 5) Humanitarian response to flooding in Sudan continues. Overview
 Humanitarian response to flooding in Sudan continues. Overview") August 19, 2013 (issue # 5) Humanitarian response to flooding in Sudan continues Overview Following the heavy rains that began in early August, the estimated number of floodaffected people across Sudan
August 19, 2013 (issue # 5) Humanitarian response to flooding in Sudan continues Overview Following the heavy rains that began in early August, the estimated number of floodaffected people across Sudan
MALAWI FLOOD RESPONSE Displacement Tracking Matrix Round III Report May 2015
 MALAWI FLOOD RESPONSE Displacement Tracking Matrix Round III Report May 2015 CONTACT Director of DoDMA: James Chiusiwa chiusiwaj@yahoo.com +265 (0) 999 937 952IOM DTM Project Officer: Brenda Chimenya bchimenya@iom.int
Philippines Humanitarian Situation Report
 Philippines Humanitarian Situation Report Reporting period: 10-13 November 2013 UNOCHA 2013/JAddawe SitRep Issued on 20 January 2013 Highlights The Bohol Earthquake Action Plan was launched on 23 October
Myanmar CO Humanitarian Situation Report 3
 /2015/Myo Thame Myanmar CO Humanitarian Situation Report 3 Issued on 12 August 2015 Highlights With the Government of Myanmar continuing to lead the response, UNICEF has already provided immediate relief
BUDGET INCREASE TO EMERGENCY OPERATION PAKISTAN (BUDGET REVISION NUMBER 6)
") BUDGET INCREASE TO EMERGENCY OPERATION PAKISTAN 108280 (BUDGET REVISION NUMBER 6) Food Assistance to Internally Displaced and Conflict Affected Persons in Pakistan s NWFP and FATA Cost (United States dollars)
BUDGET INCREASE TO EMERGENCY OPERATION PAKISTAN 108280 (BUDGET REVISION NUMBER 6) Food Assistance to Internally Displaced and Conflict Affected Persons in Pakistan s NWFP and FATA Cost (United States dollars)
ERM Household Assessment Report AC28# assessments: 63 IDP HH assessment report in CCN district
 ERM Household Assessment Report AC28# assessments: 63 IDP HH assessment report in CCN district 1. General Information: Assessment Location: (Province/District/Village) Type of Crises: (Conflict/Natural
INDIA : ORISSA CYCLONE
 INDIA : ORISSA CYCLONE 6 December 1999 appeal no. 28/99 situation report no. 4 period covered: 17th - 26th November 1999 As the full impact of the super cyclone that devastated Orissa one month ago becomes
ROHINGYA REFUGEE CRISIS Camp Settlement and Protection Profiling Cox s Bazar, Bangladesh Round 3
 ROHINGYA REFUGEE CRISIS Camp Settlement and Protection Profiling Cox s Bazar, Bangladesh Round 3 April 2018 UNHCR/Roger Arnold 1 Overview Upazila: Ukhiya Union: Palong Khali Introduction This profile provides
EMERGENCY OPERATION ARMENIA
 EMERGENCY OPERATION ARMENIA 200558 Emergency food assistance to displaced population of Syrian Armenians Number of beneficiaries 5,000 Duration of project 1 July 2013 31 December 2013 (6 months) WFP food
Zimbabwe Complex Emergency
 BUREAU FOR DEMOCRACY, CONFLICT, AND HUMANITARIAN ASSISTANCE (DCHA) OFFICE OF U.S. FOREIGN DISASTER ASSISTANCE (OFDA) Zimbabwe Complex Emergency Situation Report #3, Fiscal Year (FY) 2009 February 13, 2009
NEPAL. mvam Food Security Monitoring Survey respondents interviewed. 6.2 members per household on average. 17% female headed households
 NEPAL mvam Bulletin #1: June 2017 mvam Food Security Monitoring Survey Mid-Western and Far-Western The eight districts of the mid and far-western mountains of are some of the most food insecure areas in
E Distribution: GENERAL WFP/EB.A/2001/4-C 17 April 2001 ORIGINAL: ENGLISH POLICY ISSUES. Agenda item 4
 Executive Board Annual Session Rome, 21-24 May 2001 POLICY ISSUES Agenda item 4 For information* WFP REACHING PEOPLE IN SITUATIONS OF DISPLACEMENT Framework for Action E Distribution: GENERAL WFP/EB.A/2001/4-C
Response to the Somali displacement crisis into Ethiopia, Djibouti and Kenya, 2011
 Response to the Somali displacement crisis into Ethiopia, Djibouti and Kenya, 2011 Donor Relations and Resource Mobilization Service July 2011 Ethiopia, recently arrived Somali refugees waiting to be registered
Solomon Islands. Flooding. Solomon Islands. Humanitarian Situation Report 3
 Solomon Islands Humanitarian Situation Report 3 UNICEF Child Protection Officer with children in evacuation centre on 8 April 2014 Salient Points Torrential rain and river overflow in the capital city
Disaster relief emergency fund (DREF) Myanmar: Magway Floods
 Myanmar: Magway Floods") Disaster relief emergency fund (DREF) Myanmar: Magway Floods DREF operation n MDRMM005 GLIDE n FL-2011-000167-MMR 3 November 2011 The International Federation of Red Cross and Red Crescent (IFRC) Disaster
Disaster relief emergency fund (DREF) Myanmar: Magway Floods DREF operation n MDRMM005 GLIDE n FL-2011-000167-MMR 3 November 2011 The International Federation of Red Cross and Red Crescent (IFRC) Disaster
Rapid Joint Needs Assessment Phase 01- INDIA [VILLAGE / HAMLET]
![Rapid Joint Needs Assessment Phase 01- INDIA [VILLAGE / HAMLET]](/thumbs/84/89566900.jpg "Rapid Joint Needs Assessment Phase 01- INDIA [VILLAGE / HAMLET]") INDIA RAPID Needs Assessment Format Phase 1 Initial Days (1-25 days in the immediate aftermath of a disaster) Village Level Assessment Format An India Humanitarian Collective Action To be Used by the Humanitarian
INDIA RAPID Needs Assessment Format Phase 1 Initial Days (1-25 days in the immediate aftermath of a disaster) Village Level Assessment Format An India Humanitarian Collective Action To be Used by the Humanitarian
Disaster relief emergency fund (DREF) Georgia: Flash Floods
 Georgia: Flash Floods") Disaster relief emergency fund (DREF) Georgia: Flash Floods DREF operation n MDRGE008 GLIDE n FF-2013-000097-GEO 22 August 2013 The International Federation of Red Cross and Red Crescent (IFRC) Disaster
Disaster relief emergency fund (DREF) Georgia: Flash Floods DREF operation n MDRGE008 GLIDE n FF-2013-000097-GEO 22 August 2013 The International Federation of Red Cross and Red Crescent (IFRC) Disaster
Nutritional survey Dadaab, North Eastern Province, Kenya August 2000
 Nutritional survey Dadaab, North Eastern Province, Kenya August 2000 Médecins Sans Frontières With the participation of UNHCR, WFP, CARE and MOH. Carine Daenens Joke Van Peteghem Gunter Boussery Summary
Niger: Population Movement
 Emergency Appeal Operations Update Niger: Population Movement Emergency appeal n MDRNE013 GLIDE n OT-2014-000126-NER Operations update n 6 Date of issue: 6 December 2016 Emergency Appeal operation start
DISPLACEMENT TRACKING MATRIX : NEPAL EARTHQUAKE 2015
 WHAT IS DTM? This Displacement Tracking Matrix (DTM) report is produced by the International Organization for Migration in its role as Camp Coordination and Camp Management (CCCM) Cluster Lead Agency.
Zambia. Persons of concern
 UNHCR assisted in the voluntary repatriation from Zambia of more than 19,200 refugees, including 17,000 Congolese and 2,200 Angolans. Some 625 refugees were submitted for resettlement and 137 departed
European Refugee Crisis Children on the Move
 European Refugee Crisis Children on the Move Questions & Answers Why are so many people on the move? What is the situation of refugees? There have never been so many displaced people in the world as there
RWANDA. Overview. Working environment
 RWANDA 2014-2015 GLOBAL APPEAL UNHCR s planned presence 2014 Number of offices 5 Total personnel 111 International staff 27 National staff 65 UN Volunteers 14 Others 5 Overview Working environment Rwanda
Democratic Republic of Congo: 2017 End of Year Report BURUNDI - REGIONAL RRP December 2017
 Democratic Republic of Congo: 2017 End of Year Report BURUNDI - REGIONAL RRP December 2017 44,675 US$37.7 M 4% 5 BURUNDIAN REFUGEES IN DRC (DEC 2017) SITUATION OVERVIEW REQUIRED IN DRC IN 2017 The political
UNITED NATIONS OFFICE FOR THE COORDINATION OF HUMANITARIAN AFFAIRS. Myanmar Cyclone Nargis OCHA Situation Report No.
 UNITED NATIONS OFFICE FOR THE COORDINATION OF HUMANITARIAN AFFAIRS Myanmar Cyclone Nargis OCHA Situation Report No. 41 21 July 2008 SITUATION OVERVIEW 1. The Post-Nargis Joint Assessment (PONJA) report
Emergency Plan of Action (EPoA) Chad: Population Movement
 Chad: Population Movement") Emergency Plan of Action (EPoA) Chad: Population Movement DREF Operation Operation n MDRTD012 Date of issue: 12 February 2014 Date of disaster: From January 2014 Operation manager (responsible for this
Emergency Plan of Action (EPoA) Chad: Population Movement DREF Operation Operation n MDRTD012 Date of issue: 12 February 2014 Date of disaster: From January 2014 Operation manager (responsible for this
Northern Afghanistan Humanitarian Regional Team Meeting. UNICEF Mazar-e-Sharif on 25 January Draft Minutes
 Northern Afghanistan Humanitarian Regional Team Meeting UNICEF Mazar-e-Sharif on 25 January 2016 Draft Minutes Participants: ACF, ACTED, ADEO, CARE Int., FAO, IOM, NRC, OCHA, PIN, SCI, UNHCR, UNICEF, UNOPS,
SYRIAN HOUSEHOLDS IN JORDAN,
 SYRIAN HOUSEHOLDS IN JORDAN, THE KURDISTAN REGION OF IRAQ AND WITHIN SYRIA Regional Multi-Sector Analysis of Primary Data August 2014 CONTENTS SUMMARY... 2 Abbreviations and Acronyms... 4 Geographical
Bangladesh. Persons of concern
 Living conditions for the 28,300 refugees from Myanmar residing in two camps in Cox s Bazar have improved as a result of constructive government policies, international support and UNHCR initiatives. There
VULNERABILITY STUDY IN KAKUMA CAMP
 EXECUTIVE BRIEF VULNERABILITY STUDY IN KAKUMA CAMP In September 2015, the World Food Programme (WFP) and the United Nations High Commissioner for Refugees (UNHCR) commissioned Kimetrica to undertake an
0% 18% 7% 11% 17% 93% Education % of children aged attending formal school
 0+18+7+11+17 Summary IDP Camp Profile - Al Hardania Management agency: IRD This profile provides an overview of conditions in Al Hardania camp. Primary data was collected through household surveys on 31/12/2017.
KISMAYO IDP SETTLEMENT ASSESSMENT SOMALIA
 KISMAYO IDP SETTLEMENT ASSESSMENT SOMALIA ASSESSMENT REPORT DECEMBER 2016 0 About REACH REACH is a joint initiative of two international non-governmental organizations - ACTED and IMPACT Initiatives -
Oxfam (GB) Guiding Principles for Response to Food Crises
 Guiding Principles for Response to Food Crises") Oxfam (GB) Guiding Principles for Response to Food Crises Introduction The overall goal of Oxfam s Guiding Principles for Response to Food Crises is to provide and promote effective humanitarian assistance
Oxfam (GB) Guiding Principles for Response to Food Crises Introduction The overall goal of Oxfam s Guiding Principles for Response to Food Crises is to provide and promote effective humanitarian assistance
Above-average use of food-related coping continued for households in Anbar (20%) and Ninewa (18%) and declined by 11 percent in Salah Al-Din.
 and Ninewa (18%) and declined by 11 percent in Salah Al-Din.") Fighting hunger worldwide Bulletin 11 October 2015 IRAQ October 2015: Food security indicators continue to be poor in Anbar and Ninewa governorates, and for IDPs Highlights Food consumption indicators
Fighting hunger worldwide Bulletin 11 October 2015 IRAQ October 2015: Food security indicators continue to be poor in Anbar and Ninewa governorates, and for IDPs Highlights Food consumption indicators
APPENDIX A QUESTIONNAIRE FOR SURVEY
 APPENDIX A QUESTIONNAIRE FOR SURVEY 1. Is your family able to afford all three meals a day consisting of dal, rice and vegetables? 2. What portion of your family income is spent in buying food? (a) One
Horn of Africa Situation Report No. 19 January 2013 Djibouti, Ethiopia, Kenya, Somalia, South Sudan
 Horn of Africa Situation Report No. 19 January 2013 Djibouti, Ethiopia, Kenya, Somalia, South Sudan AT A GLANCE Conditions across the Horn of Africa have improved, however a crisis food security situation
15+85A. Situation Overview: Western Bahr el Ghazal, South Sudan. Introduction. Population Movement and Displacement
 Situation Overview: Western Bahr el Ghazal, South Sudan January - March 2018 Introduction. Ongoing conflict in Western Bahr el Ghazal (WBeG) State resulted in a continued deterioration of food security
Kenya. tion violence of 2008, leave open the potential for internal tension and population displacement.
 EASTERN AND SOUTHERN AFRICA Kenya While 2010 has seen some improvement in the humanitarian situation in Kenya, progress has been tempered by the chronic vulnerabilities of emergency-affected populations.
ERM Household Assessment Report AC404: 126 IDP HH assessment report in Bamyan province
 ERM Household Assessment Report AC404: 126 IDP HH assessment report in Bamyan province 1. General Information: Assessment Location: (Province/District/Village) Type of Crises: (Conflict/Natural Disaster/Other)
RAPID ASSESSMENT Dikwa and Ngala Local Government Areas, Borno State FEBRUARY 2017
 Focus group discussion with displaced women in Sangaya Camp, Dikwa. Photo credit: Mercy Corps RAPID ASSESSMENT Dikwa and Ngala Local Government Areas, Borno State FEBRUARY 2017 The purpose of this rapid
Under-five chronic malnutrition rate is critical (43%) and acute malnutrition rate is high (9%) with some areas above the critical thresholds.
 and acute malnutrition rate is high (9%) with some areas above the critical thresholds.") May 2014 Fighting Hunger Worldwide Democratic Republic of Congo: is economic recovery benefiting the vulnerable? Special Focus DRC DRC Economic growth has been moderately high in DRC over the last decade,
May 2014 Fighting Hunger Worldwide Democratic Republic of Congo: is economic recovery benefiting the vulnerable? Special Focus DRC DRC Economic growth has been moderately high in DRC over the last decade,
Nepal: Floods. Emergency appeal n MDRNP002 GLIDE FL NPL Operations update n December 2008
 Nepal: Floods Emergency appeal n MDRNP002 GLIDE FL-2008-000104-NPL Operations update n 03 31 December 2008 Period covered by this Operations Update: 20 November to 20 December 2008 Appeal target (current):
Pakistan Floods, Earthquake, and Complex Emergency
 BUREAU FOR DEMOCRACY, CONFLICT, AND HUMANITARIAN ASSISTANCE (DCHA) OFFICE OF U.S. FOREIGN DISASTER ASSISTANCE (OFDA) Pakistan Floods, Earthquake, and Complex Emergency Fact Sheet #, Fiscal Year (FY) 2009
CERF LIFE-SAVING CRITERIA AND SECTORAL ACTIVITIES (Guidelines)
") I. Introduction: CERF LIFE-SAVING CRITERIA AND SECTORAL ACTIVITIES (Guidelines) The Central Emergency Response Fund (CERF) is a stand-by fund established by the United Nations to enable more timely and
I. Introduction: CERF LIFE-SAVING CRITERIA AND SECTORAL ACTIVITIES (Guidelines) The Central Emergency Response Fund (CERF) is a stand-by fund established by the United Nations to enable more timely and
SYRIAN REFUGEE RESPONSE: Vulnerability Assessment of Syrian Refugees in Lebanon LEBANON HIGHLIGHTS OF THE SURVEY. August 8, 2014
 SYRIAN REFUGEE RESPONSE: Vulnerability Assessment of Syrian Refugees in Lebanon August 8, 2014 #FutureOfSyria Agencies and the Government of Lebanon had been requesting US$1.89 billion in the interagency
LÓVUA SETTLEMENT. 13,606 Refugees in Lóvua. 49% Women. 57% Children <18 years old. 3,343 Households. 4,505 Refugees under education age
 FACTSHEET Angola / May 2018 LÓVUA SETTLEMENT 13,606 Refugees in Lóvua 21,705 Refugees receiving assistance in Lunda Norte 3,343 Households 50 Persons with disabilities 57% Children
SUDAN: INFLUX OF ERITREAN REFUGEES
 SUDAN: INFLUX OF ERITREAN REFUGEES 15 August 2000 appeal no. 12/2000 period covered: 8 June - 10 August 2000 The operation so far has been running smoothly as the majority of needs have been covered with
Fighting Hunger Worldwide. WFP Response to the Syria Crisis. Funding Appeal to the Kingdom of Saudi Arabia
 Fighting Hunger Worldwide WFP Response to the Syria Crisis Funding Appeal to the Kingdom of Saudi Arabia Emergency Food Assistance to Vulnerable Syrian Populations inside Syria and the Neighbouring Countries
Average HHs size: Life expectancy at birth(years): 69 Infant mortality rate(under 1): 39 Female headed households : 26%
: 69 Infant mortality rate(under 1): 39 Female headed households : 26%") Nepal 2008-2015 Population: Urban population: 26.5 Million 17% (residing in 58 municipalities) Source of drinking water: 48%(tap/piped),35% wells/hand pump Not having toilet: 38%(95% HHs in rural area
Nepal 2008-2015 Population: Urban population: 26.5 Million 17% (residing in 58 municipalities) Source of drinking water: 48%(tap/piped),35% wells/hand pump Not having toilet: 38%(95% HHs in rural area