Migration out of Central Java:
|
|
|
- Marcia Carroll
- 5 years ago
- Views:
Transcription

1 Migration out of Central Java: Hasnani Rangkuti Crawford School of Public Policy College of Asia and the Pacific Australian National University A thesis submitted for the degree of Doctor of Philosophy of the Australian National University February, 2016
2
3 Declaration This thesis is my own original work and contains no material that has been submitted for a degree at the Australian National University or any other university. It contains no copy or paraphrase of work published by another person, unless explicitly stated. This thesis used the Indonesian population censuses (1971, 1980, 1990, 2000 and 2010). The data were provided by the Badan Pusat Statistik (BPS-Statistics Indonesia). All errors in this thesis are my own responsibility. Hasnani Rangkuti Crawford School of Public Policy College of Asia and the Pacific Australian National University iii
4
5 Acknowledgements First and foremost, I would like to give my sincere thanks to my chair, Professor Peter McDonald, who offered me so much advice, patiently supervised me, always guided me in the right decision, and provided me with the opportunity to grow as a researcher. I appreciate all his contribution of time, ideas and funding to make my PhD experience more productive, stimulating and joyful. Without his ongoing support I would not have had the opportunity to present my papers at various conferences and to complete my PhD on time. It is not sufficient to express my gratitude with only these few words. I would like to express my special appreciation and thanks to my supervisor, Dr. Ariane Utomo. Her encouragement made me feel confident to work on my thesis, her joy and enthusiasm to undertake research was contagious and motivated me, in particular, during the hard times of my PhD journey. I thank Professor James Raymer wholeheartedly for his supervision and advice during the earlier stages of my thesis. I am very grateful for support from Ibu Iwu Dwisetyani Utomo, Bapak Terence Hull, Zhongwei Zhao and all colleagues and friends at the School of Demography and the Crawford School of Public Policy. I also wish to thank Anthony Reid and Ed Aspinal. My PhD journey has been an amazing experience because of your support. I also appreciate the advice from all colleagues and friends who attended my PhD presentations and provided their critical comments. That really helped me to notice the weaknesses of my dissertation, to shape my research questions and to enable me to see things from different perspectives. I would like to convey my heartfelt thanks to my home institution, BPS (Statistics Indonesia), for giving me the opportunity to pursue my education and providing me access to data resources for my PhD thesis. I am hugely appreciative of the support of the head of BPS Bapak Suryamin, Bapak Kecuk Suhariyanto, Bapak Akhmad Jaelani, and Bapak Wynandin Imawan, Bapak Moh. Arie Nugraha, Hadi Suryono, and all colleagues at the v
6 Directorate of Dissemination Statistics. I thank Pak Wendi Hartanto for inspiring me to go to the ANU to pursue PhD in the first place. I would also like to extend my gratitude to all of my friends and colleagues. To Mba Vida, Irene, Mba Fifi, friends at the Crawford School of Public Policy, seniors at the School of Demography, colleagues at the Pengajian Muslimah and Pengajian Keluarga, friends at the Graduate House and the University House, office mates, Rongfang, Helen Moles and all other colleagues. To the one and only rosy cheeks owner, I thank you. I thank Megan Poore who has helped me improve my writing skills. For me, Megan is not only a PhD advisor but also a good friend who has always been there to support me, in particular, during my darkest times. For all her efforts and generosity, I am deeply grateful. I thank Karin Hosking for providing assistance with copy editing of my thesis. I also thank the IT staff, the librarians, the administrators and all staff at the Crawford School of Public Policy with whom I intersect. I would like to sincerely thank each and every one of the Australian taxpayers as I am an Australian Awards Scholarship recipient. Without this scholarship, I would not be able to pursue my PhD in this beautiful, clear-blue-sky country named Australia. Finally, but by no means least, thanks go to my mother, my late father, my sisters, my brother, my nieces, my nephews and all my relatives. I am very grateful for my mum. Her understanding and love have encouraged me to work hard towards my PhD and to allow me to travel the world independently. My father was my number one fan and he inspired me to study abroad. He once said, Pergilah sekolah jauh, nanti Ayah datang pas wisuda. Even though, he physically never appeared at any graduation that I had, I believe his spirit has never abandoned me. Hasnani Rangkuti, Canberra, February 2016 vi
7 I dedicate this thesis to my family, for their constant support and unconditional love. I love you all dearly. vii
8
9 Abstract Migration within Indonesia has a long history, a history associated with the uneven distribution of population across the archipelago that has persisted over centuries. Throughout this history, out-migration has been associated with population policy and, in particular, with one province, Central Java. The main objective of the thesis is to investigate contemporary patterns of population movement within Indonesia and to situate Central Java in the overall migration pattern. Specifically the thesis examines patterns and changes in inter-provincial migration, calculates rates of primary, onward and return migration for Central Java, and investigates employment outcomes and marital assimilation of Central Java s migrants in selected destinations. Utilising the five censuses of Indonesia from 1971 to 2010, the thesis found that Central Java was the largest source of out-migration in all the censuses, and was strongly connected with movements into two provinces: Jakarta and Yogyakarta. I argue that the connectedness between Central Java and Jakarta is related to economic opportunities while similarity in culture and proximity are the key connectivities between Central Java and Yogyakarta. Over time, the proportion of primary and onward migration to Jakarta declined substantially. At the same time, the proportion moving to West Java increased significantly. A substantial proportion of Central Java primary migrants was also found in Kepulauan Riau. I argue that the decline in the proportion of primary and onward migration to Jakarta is due to the economic extension of Jakarta to its peripheral regions in West Java and Banten. Comparing three destinations, Central Java primary migrants are less likely, as opposed to non-migrants, to be employed in Semarang Metropolitan Region (SMR) and are more likely to be employed in Jakarta Metropolitan Region (JMR) and Batam-Bintan-Karimun (BBK). In JMR, Central Java primary female migrants are less likely to work in manufacturing relative to Central Java primary male migrants. In contrast, in BBK, Central Java primary female migrants are more likely to work in manufacturing relative to Central Java primary male migrants. The nature of the manufacturing industry in the destination influences the ix
10 gender of the migrants. I also find that private-assisted labour movement acts as a gateway for migrants to seek better opportunities in distant places. From a social perspective, patterns of marital assimilation of Central Javanese husbands and wives are higher when measured by ethno-migration status that is, province of birth than they are by ethnicity. I argue that ethnicity is a better variable for measuring patterns of inter-marriage than ethno-migration status. When they do inter-marry, Central Javanese migrants favour marriage with local people compared with marrying people from other groups. Exogamous marriage is lower in JMR than it is in BBK when measured by either ethno-migration status or ethnicity. While education homogamy is the norm in all ethnic pairing type marriages, I found that hyper-gamy is more likely to be found in exogamous marriages than in endogamous marriages. As the levels of educational differences between husband and wife increases the likelihood of inter-marrying increases. As opposed to Javanese intra-marriages, Javanese husbands and wives who are in inter-marriages are more likely to marry down than to marry equally on education in both BBK and JMR. This means that status exchange on education applies among Central Javanese who intermarried local people in BBK and JMR. By examining patterns and outcomes of migration out of Central Java, my thesis contributes to the literature in understanding contemporary patterns of inter-provincial migration, and employment and marital assimilation of migrants who originate from the same place of origin but who migrate to different places of destination. Key words: internal migration, origin-destination-specific, conditional probability of migration, employment, inter-marriage, status exchange on education, migrants, Central Java, Indonesia. x
11 Table of Contents Declaration... iii Acknowledgements... v Abstract... ix Table of Contents... xi List of Tables... xv List of Figures... xix List of Appendices... xxi Chapter 1 Introduction Rationale of the thesis Background Setting of the study Migration and population resettlement policy Population resettlement policy during the Soekarno administration ( ) Population resettlement policy during the Soeharto administration ( ) Population resettlement policy during the Reform era ( to date) Summary Organisation of the thesis Chapter 2 Theoretical review Concept of migration Macro and micro theory in the migration literature Macro theory in the migration literature Micro theory in the migration literature Adaptation of migrants at the place of destination Employment outcomes of migrants Concept of assimilation Marital assimilation Conclusion xi
12 Chapter 3 Indonesia s inter-provincial migration between 1971 and 2010: Flows, spatial concentrations and structural patterns across provinces Introduction Background Data Patterns of inter-provincial migration flows Investigating spatial concentration of inter-provincial migration flows A Coefficient of Variation (CV) measure of spatial concentration CV values for in- and out-migration rates Provinces as redistributors of population Sex concentrations of inter-provincial migration flows Structural patterns of inter-provincial migration flows Summary and conclusion Chapter 4 Characterisation of Central Java s primary, onward and return migrants: Patterns and rates of conditional probabilities of migration by age and sex Introduction Positioning Central Java in the context of Indonesia Literature review Conceptual framework Method and data used Findings The number of Central Javanese migrants and migrations Conditional probabilities of migration for Central Java s primary, onward and return migrants The patterns and rates of conditional probabilities of migration by age and sex for Central Java s primary, onward and return migrants Discussion and conclusion Chapter 5 Employment outcomes of Central Java s primary migrants in different economic zones Introduction Literature review SMR, JMR and BBK zones Variables, method and data used in the study Definition of variables used xii
13 5.4.2 Method and data used Findings Descriptive analysis Odds of being in work Sectoral analysis Discussion and conclusion Chapter 6 Marital assimilation amongst Central Javanese people in two destinations: Investigating patterns of exogamous marriage and status exchange Introduction Theoretical review and hypotheses Background to the study Data and methods used in the study Findings Descriptive analysis of marital assimilation of Central Javanese people in BBK and JMR based on ethno-migration status and ethnicity Based on ethno-migration status Based on ethnicity Inferential analysis of the marital assimilation of Central Java married couples based on ethno-migration status and ethnicity in BBK and JMR Based on ethno-migration status Based on ethnicity Testing status exchange on education among Central Javanese inter-marriage couples by ethno-migration status and ethnicity Descriptive analysis of educational matching by ethno-migration status and ethnicity Inferential analysis Discussion and conclusion Chapter 7 Conclusions Introduction Summary of the thesis findings Indonesia s inter-provincial migration between 1971 and 2010: Flows, spatial concentrations and structural patterns across provinces xiii
14 7.2.2 Characterisation of Central Java s primary, onward and return migrants: Patterns and rates of conditional probabilities of migration by age and sex Employment outcomes of Central Java s primary migrants in different economic zones Marital assimilation amongst Central Javanese people in two destinations: Investigating patterns of exogamous marriage and status exchange Theoretical implications Implications for policy debates Suggestions for future research References Appendix xiv
15 List of Tables Table 1.1 Number of transmigrants and their provinces of origin, Table 1.2 Objective of transmigration in each development plan... 9 Table 2.1 The stages of assimilation (Gordon, 1964, p. 71) Table 3.1 Area, population and population density by islands in Indonesia, Table 3.2 List of new provinces and date of splitting, up until Table 3.3 Five-year inter-provincial migration rates of Indonesia, (per 1,000 persons) Table 3.4 ACV field indices of inter-provincial migration Table 3.5 CV field indices for out- and in-migration flows for provinces of Indonesia, Table 3.6 CV field indices for out- and in-migration flows, Indonesia, 2000 and 2010, 33 provinces Table 3.7 ACV field indices of inter-provincial migration Table 3.8 Classification of provinces that were redistributors of population, Table 3.9 ACV values for male and female inter-provincial migration flows, Table 3.10 ACV values for male and female inter-provincial migration flows, Table 3.11 Origin-destination-interaction components of inter-provincial migration flows, Table 4.1 Number of migrants, Java Island and Central Java Province, 1971 to Table 4.2 Definitions of Central Java s primary, onward and return migrants Table 4.3 Central Java s primary, onward and return migrants, 1971 to Table 4.4 Table 4.5 Table 5.1 Table 5.2 Provincial distribution Central Java s primary, onward and return migrants, 1971 to 2010 (per cent) Conditional probabilities of migration for Central Java s primary, onward and return migrants, (per 1000) Main activity of population aged years in SMR, JMR, and BBK (per cent) Economic sector of employed individuals aged years in SMR, JMR and BBK (per cent) xv
16 Table 5.3 Table 5.4 Table 5.5 Work status of individuals aged years in SMR, JMR and BBK (per cent) Economic sectors of individuals who were currently working in the SMR, JMR and BBK (per cent) Economic sectors of Central Java s primary migrant workers aged years in SMR, JMR and BBK (per cent) Table 5.6 Odds of being in work in SMR, JMR and BBK Table 5.7 Odds of being in work in the manufacturing, trade and service sectors Table 5.8 Odds of being in work in a particular sector by sexes in SMR Table 5.9 Odds of being in work in a particular sector by sexes in JMR Table 5.10 Odds of being in work in a particular sector by sexes in BBK Table 6.1 Table 6.2 Inter-marriages of local-born husbands and wives by their spouse s ethnomigration status in BBK and JMR, Percentage distributions of marriages by ethno-migration status of husbands and wives in BBK and JMR, Table 6.3 Exogamy rate of co-resident married couples in BBK and JMR, Table 6.4 Malay husbands and wives by their spouse s ethnicity in BBK, Table 6.5 Table 6.6 Sundanese, Betawi and Bantenese husbands and wives by their spouse s ethnicity in JMR, Percentage distributions of marriages by ethnicity of husbands and wives in BBK and JMR, Table 6.7 Exogamy rate of co-resident married couples in BBK and JMR, Table 6.8 Table 6.9 Likelihood of being in exogamous marriages of co-resident married couples based on ethno-migration status in BBK and JMR, Likelihood of being in exogamous marriages of co-resident married couples based on ethnicity in BBK and JMR, Table 6.10 Likelihood of being in exogamous marriages of co-resident married couples based on ethnicity in JMR, Table 6.11 Educational matching by inter-marriage among Central Java-born and localborn husbands and wives in BBK and JMR, Table 6.12 Educational matching by inter-marriage among Javanese and local-ethnic husbands and wives in BBK and JMR, Table 6.13 Multinomial logistic regression models of Central Java-born inter-marriages, with Central Java-born intra-marriages as the reference, BBK and JMR xvi
17 Table 6.14 Multinomial logistic regression models of Javanese inter-marriages, with Javanese intra-marriages as the reference, BBK and JMR xvii
18
19 List of Figures Figure 1.1 Map Showing Indonesian Provinces... 5 Figure 1.2 Target and realisation of transmigration in Indonesia (No. of families) Figure 1.3 Percentage of persons transmigrated by island of destinations Figure 3.1 In-migration (vertical) and out-migration (horizontal) rates for provinces of Indonesia, (per 1,000 persons) Figure 3.2 The provincials CV values for in- and out-migration, 1971 and Figure 3.3 The origin component of inter-provincial migrations, Figure 3.4 The destination component of inter-provincial migrations, Figure 3.5 The destination component of inter-provincial migrations, Figure 3.6 The sex component of inter-provincial migrations, Figure 3.7 Sex ratios of out-migrants by province, Figure 3.8 Sex ratios of in-migrants by province, Figure 3.9 Central Java-destination-interaction of inter-provincial migrations, Figure 3.10 Central Java-destination-interaction of inter-provincial migrations, (Jakarta and West Java are combined) Figure 3.11 Origin-Central Java-interaction of inter-provincial migrations, Figure 3.12 Origin-Jakarta-interaction of inter-provincial migrations, Figure 3.13 Jakarta-destination-interaction of inter-provincial migrations, Figure 4.1 Figure 4.2 Figure 4.3 Figure 4.4 Distribution of age groups (%) and conditional probabilities of migration by age groups for Central Java s primary, onward and return migrants (per 1000), Changes in distribution of age groups (%) and conditional probabilities of migration by age groups for Central Java s primary, onward and return migrants (per 1000), Changes in the sex ratio (males per 100 females) and conditional probabilities of migration by sex for Central Java s primary, onward and return migrants (per 1000), Distribution of age groups and sex (%) and conditional probabilities of migration by age groups and sex for Central Java s primary, onward and return migrants (per 1000), xix
20 Figure 4.5 Figure 4.6 Figure 4.7 Figure 5.1 Changes in the distribution of age groups (%) and conditional probabilities of migration by age groups and sex for Central Java s primary, onward and return migrants (per 1000), Changes in the sex ratio by destination provinces/provinces five years before the census for Central Java s primary, onward and return migrants, Changes in the sex ratios of conditional probabilities of migration by destination provinces/provinces five years before the census for Central Java s primary, onward and return migrants, Age group distribution of population aged five years and above by migration status in SMR, JMR and BBK, 2010 (per cent) xx
21 List of Appendices Appendix 1 Figures of provincial CV values for out-migration, Appendix 2 Figures of provincial CV values for in-migration, Appendix 3 Maps of Jakarta Metropolitan Region (JMR), Semarang Metropolitan Region (SMR) and Batam Bintan Karimun (BBK) Appendix 4 Questionnaires of the 1971 Population census Appendix 5 Questionnaires of the 1980 Population census Appendix 6 Questionnaires of the 1990 Population census Appendix 7 Questionnaires of the 2000 Population census Appendix 8 Questionnaires of the 2010 Population census xxi
22
23 Chapter 1 Introduction 1.1 Rationale of the thesis Migration within Indonesia has a long history, a history associated with the uneven distribution of population across the archipelago that has persisted over centuries. Throughout this history, out-migration has been associated with population policy and, in particular, with one province, Central Java. The first resettlement of population was conducted in 1901 by the Dutch colonial government, relocating 155 families from Kedu, a residency in Central Java, to Gedong Tataan, south of Wai Sekampung, a region in Lampung (McNicoll, 1968; Tirtosudarmo, 2009). Since then, population resettlement policy has continued to be implemented to the present day and Central Java has been the province that sends the greatest number of migrants. The latest population census recorded that, in 2010, the number of Central Java-born who lived outside the province reached 6.8 million whilst the number of those people who five years earlier had lived in Central Java was one million (BPS, 2013). Central Java predominates among provinces of origin of lifetime and recent migrants. It is important to investigate migration out of Central Java for four fundamental reasons. Firstly, migration out of Central Java is at the hub of historical population policy. The Central Javanese people have been part of population resettlement policy since the 1800s when one hundred Javanese workers along with the headmen who originated from Semarang, now the capital city of Central Java, disembarked in Suriname, a country located on the north-eastern coast of South America (Hoefte, 1998, p. 47). In the context of Central Javanese out-migration within Indonesia, it was noted from the 1930 Census that 92 per cent of migrants were Java-born and most of these were from Central Java (McNicoll, 1968). The Dutch relocated a great number of Central Javanese to Sumatra with the majority of them working as coolies (McNicoll, 1968). Among the Central Javanese, the Dutch recruited people who were unemployed, uneducated, poor and submissive. Culturally speaking, as opposed to higher ranked Central Javanese and people from other provinces in Java, the Central Javanese working class people have a natural culture of being 1
24 Chapter 1 less aggressive, quiet and accepting things peacefully 1. The characteristics and nature of this group are quite often taken for granted by third parties (Spaan, 1994). This explains how migration out of Central Java has occurred and has been triggered mostly by government policies. Secondly, it is important to investigate migration out of Central Java because Central Java consistently sends the greatest number of migrants across the nation. It was noted in 1971 that there were 1.7 million Central Javanese life time migrants, that is, people who were born in Central Java but lived outside the province. This figure accounted for 24 per cent of all out-migrants in 1971 (Hugo, 2001, p. 57). The sustained dominance of Central Java as the major origin of inter-provincial migrants continues over time. The latest population census reported that, in 2010, one quarter of the people who lived outside their province of birth originated from Central Java (BPS, 2013). Thirdly, the flow of people out of Central Java is investigated because people who left were amenable to migration due to macro-economic conditions that were not attractive to the majority of its residents. This can be seen by a comparison of the three largest provinces in Java. In 2010, the contribution of West Java to the total population of Indonesia was 18 per cent, while the equivalent figures were 16 per cent and 14 per cent for East Java and Central Java, respectively. In terms of macro-economic indicators, however, Central Java is far behind. For instance, the share of West Java s and East Java s Gross Domestic Regional Bruto (GDRB) to the national economy was 15 per cent each in 2013 whilst the share of Central Java s GDRB was only 8 per cent (BPS, 2014). At the same time, the share of Jakarta s GDRB, the nation s capital, was 17 per cent (BPS, 2014). Thus, as opposed to Central Java, the economic performances of West Java, East Java and Jakarta are much better leading to many more jobs being created in those three provinces. Thus, the persistent outflow of migrants from Central Java can be explained by persistent inequality in economic opportunities between Central Java and other provinces. 1 In his book The History of Java, Raffles (1988, p.248) categorised Javanese society into the privileged classes and the mass of the people. He states, Those who are in the peasant class are remarkable for their unsuspecting and almost infantine credulity whilst the other group are mostly involved in violence and deceit. 2
25 Introduction Fourthly, it is important to understand migration out of Central Java because it has contemporary political relevance, in particular, in terms of ethnicity, power and dispersion. Central Java is the heartland of Javanese ethnicity; 98 per cent of Central Java s population are Javanese (Ananta et al., 2014). The Javanese also constitute the largest ethnicity in Indonesia and account for 40 per cent of the national population (Ananta et al., 2014). Continuous outflows of Central Javanese people generate a great dispersion of the Javanese ethnic group across other provinces. At the place of destination, Central Java s migrants often participate in local government. For instance, it is common to find that a province that is located outside Java Island has a Javanese governor. The participation of Javanese migrants in local government can be considered to be a form of migration assimilation at the place of destination. Another form of migration assimilation is inter-marriage between Central Java s migrants and local people at the place of destination. Inter-marriage is considered to be one source of ethnic diversity and in a multi-ethnic nation such as Indonesia, a study on assimilation of migrants is crucial (King & Skeldon, 2010). The thesis explores a series of topics in the migration literature. The main objective of the thesis is to investigate contemporary patterns and outcomes of migration out of Central Java as regards the overall picture of contemporary patterns of population movement within Indonesia based on five decennial Indonesian population censuses (1971, 1980, 1990, 2000 and 2010 censuses). Specifically, the thesis examines inter-provincial migration patterns over 40 years of analysis and investigates out-migration patterns from Central Java; calculates the rates of conditional probability of migration of Central Java s primary, onward and return migrants; investigates employment outcomes of Central Java s primary migrants in different destinations; and examines patterns of exogamous marriage and status exchange in relation to education among Central Javanese people based on their ethnomigration status and ethnicity in selected destinations. In using Indonesia as a case study and further using Central Java as the core of analysis, this thesis adds to the cross-disciplinary literature through a macro-examination of the directions of in- and out-migration flows over roughly a 40-year time period. Following this macro analysis, the thesis takes a micro approach by investigating the employment outcomes and marital assimilation of Central Javanese people in selected destinations. Specifically, as a theoretical contribution to the literature, the thesis underlines the 3
26 Chapter 1 importance of origin-destination-specific migration in studying internal migration. The thesis enriches the migration literature by applying rates of conditional probabilities of migration in investigating the propensity to migrate amongst Central Java s primary, onward and return migrants. There has been extensive research on the employment outcomes of migrants in specific destinations. To enrich the literature, the thesis contributes insights on the employment outcomes of migrants who share the same origin but who migrate to different destinations. In the context of Indonesia, very little is known about the inter-marriages of migrants, although migration has been part of Indonesia s history. The thesis contributes to the literature by examining exogamous married couples in different places of destination. Further, the study enriches the literature by investigating status exchange on education among inter-married couples. The current chapter begins by outlining the rationale, the objectives and the contribution of the thesis. The chapter then moves on to the background of the study which discusses the setting of the study and related population resettlement policy. The analysis of population resettlement policy relates to the period from Indonesian independence to the present time. The focus in this discussion is not merely on migration out of Central Java; rather it focuses on the overall origin and destination of transmigrants and how Central Java sends the largest number of transmigrants. The chapter concludes with the structure of the thesis which outlines the objectives, data used and research questions addressed in each analytical chapter. 1.2 Background Setting of the study Indonesia is the largest archipelago in the world with an estimated area of 1.9 million square kilometres and is located between the Asian and Australian continents. Indonesia constitutes 17,504 islands (BPS, 2013, p. 9) and is the fourth most populous country in the world. The geographical layout of Indonesia is shown in Figure 1.1 below. By 2010, there were 33 provinces located on all islands in Indonesia. The latest population census reported that nearly 60 per cent of the total population inhabited Java Island, while the other 40 per cent of the population was scattered over the rest of the islands (BPS, 2013). 4

27 Introduction Figure 1.1 Map Showing Indonesian Provinces DIC : Aceh JB : West Java KT : East Kalimantan SMU : North Sumatera JTE : Central Java SLU : North Sulawesi SMB : West Sumatera DIJ : DI Yogyakarta SLTE : Central Sulawesi R : Riau JT : East Java SLS : South Sulawesi J : Jambi BT : Banten SLTG : Southeast Sulawesi SMS : South Sumatera B : Bali G : Gorontalo BE : Bengkulu NTB : West Nusa Tenggara SLB : West Sulawesi L : Lampung NTT : East Nusa Tenggara M : Maluku KBB : Bangka Belitung Island KB : West Kalimantan MU : North Maluku KR : Riau Island KTE : Central Kalimantan P : Papua DKI : DKI Jakarta KS : South Kalimantan PB : West Papua Source: Australian National University. CAP CartoGIS. Unevenness in the population distribution within provinces in Indonesia is often related to unevenness in the distribution of development across provinces. There are two macroeconomic indicators that can be used to indicate development imbalances across provinces, namely the GDRB and the proportion of people who are living below the poverty line. The GDRBs of provinces in Java are higher than for provinces in the outer islands. Among 33 provinces, DKI Jakarta, West Java and East Java (all on Java Island) contribute significantly to the national Gross Domestic Product (GDP). The share of each province was 15 to 17 per cent in In total, provinces in Java contributed 58 per cent to the national economy in The other 42 per cent came from the rest of the provinces. In the eastern part of Indonesia, East Kalimantan contributed six per cent to the national GDP, while the share of other provinces was less than two per cent. Out of ten provinces found in the western part of Indonesia, only North Sumatra and Riau contributed substantially to the national GDP, with five per cent and six per cent, respectively. It can be said that economic inequality exists between provinces on Java and provinces in the outer islands. As opposed to provinces in the outer islands, however, economic inequality among 5
28 Chapter 1 provinces within Java Island is relatively greater. For instance, Central Java, a province with a population size similar to West Java and East Java, contributes only eight per cent to the national economy. Another macro-economic indicator that can be used to demonstrate development imbalances across provinces is the percentage of people who are living under the poverty line. Statistics show that provinces in eastern Indonesia, such as Papua, Gorontalo and East Nusa Tenggara, are among those provinces with the highest percentage of poor people. For instance, 23 per cent of the population in East Nusa Tenggara Province were categorised as poor in Among provinces on Java Island, the percentage of poor people found in Central Java was high, reaching 17 per cent in 2010, four per cent higher than the national average of 13 per cent. Based on the two indicators above, it can be said that economic inequality exists across provinces and this inequality may contribute to out-migration. Central Java becomes the centre of analysis because, relative to other provinces that also have low GDRB and high poverty rates, Central Java is one of the largest provinces in the country. Demographically speaking, the effect of Central Java s out-migration on its population size and in particular on population at the places of destination would be much greater than the effect of migration from other provinces with a smaller population size Migration and population resettlement policy It is important to understand past migration trajectories and the population policy that contributed to the migration history of Indonesia because these can tell us how previous migration influences patterns of current migration in Indonesia and, in particular, migration out of Central Java. To this end, I briefly discuss migration and related population resettlement policy in Indonesia in this sub-section. The timeframe of the analysis is limited to the era after Indonesian independence until now, although resettlement policy had been implemented in the Dutch era. I outline how population policy for each period of administration was produced and conducted along with the number of people being resettled. There are three periods of administration, namely, the Soekarno administration, the Soeharto administration, and the reform era, which is after the Soeharto administration. 6
29 Introduction The major sources of citations are the works of Hugo, Sjamsu, Hardjono, Oey and Lipscombe Population resettlement policy during the Soekarno administration ( ) Soekarno was certain that population resettlement policy (known as transmigration) could overcome population imbalances and he planned the policy immediately after independence (Sjamsu, 1960 p. 78). Population resettlement was prioritised throughout the Soekarno administration. In the process, however, the implementation of the policy was marked by frequent changes of the institution that was responsible for the program and of the objective of the population resettlement policy. The objective of the transmigration program fluctuated between the purely demographic outcome of gathering and resettling people from a crowded Java to Sumatra while providing those people with shelter and daily support until they themselves were capable of providing for their daily needs (Sjamsu, 1960 p. 5) and the need for national security in order to achieve a prosperous socialist Indonesian state (Oey & Astika, 1978 p. 27). In most cases, however, the number of transmigrants successfully relocated was far below the target. The number of transmigrants relocated and their provinces of origin are shown in Table 1.1 below. The number of transmigrants is a total of general transmigrants and family transmigrants. General transmigrants refers to those who received full support from the government, while family transmigrants refers to those to whom the government only provided transportation, land and agricultural tools and who did not receive a house and rations loan because they came by the invitation of their relatives. In December 1950, the first batch of transmigrants, which involved 77 persons (23 families), were relocated to Lampung. Little is known about the origin of the transmigrants. The first batch was part of family transmigration because the 23 families were the kin of the former colonists during the Dutch era of the Lampung resettlement area. Learning from the first batch of transmigrants, which was considered quite successful, the Soekarno administration became overly ambitious and planned to relocate ten thousand families out of Java in However, due to budget constraints, the government was only capable of transmigrating 2,951 persons, where more than half of the transmigrants 7
30 Chapter 1 originated from Purbalingga, Banyumas and Purworejo, three regions in Central Java. Another 30 per cent of transmigrants originated from Yogyakarta and East Java. In contrast, only two per cent of transmigrants came from West Java. In 1952, the Soekarno administration planned an ambitious long-term transmigration program, called the 15-year transmigration plan. The plan aimed to relocate 48,675,000 people over a thirty five year period from 1953 to The plan was unachievable. For instance, the program target for 1965 was 50,000 families but only a quarter of the expected number of families was able to be relocated, accounting for 13,249 families or equal to 53,225 transmigrants. Table 1.1 Number of transmigrants and their provinces of origin, Year No. of Province of origin of transmigrants transmigrants Central West Yogya East Family Persons Others Total Java Java karta Java n.a. n.a. n.a. n.a. n.a. n.a , ,855 17, ,240 40, ,409 29, ,500 21, ,091 24, ,421 23, ,799 26, ,439 46, ,625 22, ,064 19, ,075 22, ,327 32, ,425 15, ,249 53, ,148 4, Source: Hardjono (1977); Oey & Astika (1982, p ). Apart from the fact that most of the targets and objectives of the transmigration program were not achieved, there was a consistent flow of transmigrants out of Central Java. From 1951 until 1966, Central Java remained the main source of transmigrants for both families and general transmigrants. The only major exception in 1963 related to the resettlement of a large number of people from Bali who had been displaced by the eruption of Gunung Agung. In total, around 156,000 transmigrants left Central Java during the Soekarno era. This figure represents 37 per cent of the total transmigrants relocated. In comparison, there were about 106,000 transmigrants who originated from East Java and 47,000 transmigrants 8
31 Introduction from West Java. In 1951, 1952, 1964 and 1965 the percentage of transmigrants from Central Java was half of the total number transmigrants relocated in that particular year. This shows that Central Java was the main source of migrants over these years Population resettlement policy during the Soeharto administration ( ) During the Soeharto era, the objective of population resettlement was embedded into national development (Hugo et al., 1987, p. 289). The specific objectives of the transmigration program were included in the Five-Year Development Plan (Rencana Pembangunan Lima Tahun REPELITA) as shown in Table 1.2 below. Soeharto underlined the need for family planning to control the population size of Java while at the same time continuing the policy of population resettlement. Table 1.2 Objective of transmigration in each development plan Plan Time span Objective of transmigration REPELITA I to utilise empty lands and to establish basic infrastructure in regions outside Java REPELITA II to support employment of transmigrants and to financially contribute to their daily lives REPELITA III to provide compensation for the indigenous people, to establish cooperatives, and to vigorously promote family planning REPELITA IV to attract more spontaneous migrants REPELITA V to promote development of settlement regions through improvement of the standard of living of transmigrants and local people and to re-organise the rights of land use and to reduce environment degradation and land misuse REPELITA VI to promote sustainable land use and natural resources and to develop agro-business, agro-industry and other programs Source: Hugo et al., (1987). It is quite difficult to gather complete statistics relating to the number of transmigrants over the REPELITAs due to poor data documentation. Information on the number of transmigrants for REPELITA I to IV is gathered from the work of Hugo et al. (1987) and for REPELITA V and VI from the Board of National Development Planning (BAPPENAS) and is shown in Figure 1.2 below. Information for REPELITA V only covered 1989/ /1993, while for REPELITA VI only 1993/ /1998 were covered. It is seen that over all of the REPELITAs, the government had set up overly 9
32 Chapter 1 ambitious and unachievable targets. In some years, the number of families transmigrated was greater than the target but this was due to the presence of spontaneous transmigrants that is, those who migrated with little or no help from government. According to Hardjono (1986), out of 535,474 families who transmigrated over the REPELITA III period, 32 per cent were spontaneous transmigrants, translating into 169,497 families who relocated themselves with no or limited government assistance. The other 365,955 families were part of the fully supported government transmigration. Within the general transmigrant category during REPELITA III, 22,284 families consisted of of local settlers and 42,414 families were transferred between receiving areas. Based on the impressive outcomes of REPELITA III, the government set another ambitious target for REPELITA IV. The program was expected to relocate 750,000 families outside Java, translating into around 3.6 million people. In reality, only one third of the targeted families actually transmigrated. Figure 1.2 Target and realisation of transmigration in Indonesia (No. of families) 800, , , , , , , ,000 0 Target Realization Source: Compilation from several sources. During REPELITA I ( ), the largest proportion of transmigrants (32 per cent) originated from Central Java. It was recorded that 32 per cent of transmigrants relocated during the period came from Central Java. In second position was East Java, contributing 29 per cent of the total transmigrants (Hardjono, 1977). Over the REPELITAs, Central Java remained the main source of transmigrants. In the last period of the Soeharto administration, one out of four transmigrants was of Central Java origin. 10
33 Introduction In relation to the destination of transmigrants, there were substantial changes in the receiving islands of transmigrants as shown in Figure 1.3 below. It can be seen that Sumatra consistently absorbed the largest proportion of transmigrants but its percentage decreased over time. Lampung in the southern part of Sumatra, which had been the main focus of transmigration from the Dutch period onwards, became no longer was the main transmigration site. This can be explained by a shortage of land suitable for the transmigration program and it was expected that Lampung would be closed to transmigrants (Hugo et al., 1987). As an alternative, the receiving areas were shifted to provinces in eastern Indonesia. Kalimantan was home for 14 per cent of transmigrants during REPELITA I, accounting for 29,013 settlers relocating to the island. By the end of REPELITA VI, of the total transmigrants resettled, 28 per cent relocated to Kalimantan. The level of transmigration to Sulawesi, however, decreased over time. At the same time, other islands located in the eastern part of the archipelago, such as Maluku and Papua, experienced a substantial increase in the number of transmigrants. Figure Percentage of persons transmigrated by island of destinations Sumatra Kalimantan Sulawesi Other Source: Compilation from several sources Population resettlement policy during the Reform era (1998 to date) There is a dearth of up-to-date and complete published information on transmigration from the department responsible; however, I managed to get some data. These data indicate that the program achievement was low through to From an article written by Adhiati and Bobsien (2001), it was recorded that to November 1999, the government set 11
34 Chapter 1 targets to resettle 16,235 families. The actual number resettled was 4,409 families, equal to 22,000 people. Out of the 4,409 families resettled, nearly half were spontaneous transmigrants (2,129 families). In the year 2000, there were only 2,265 families resettled, of which 1,260 were local transmigrants who moved within the resettlement areas. Information from the department responsible stated that there were 14,000 and 12,000 families who transmigrated in 2004 and 2005, respectively. During 2005 to 2009, 82,000 families were targeted to resettle; however, the target was not achieved. In 2010, the number of families who transmigrated was 8,875 but this fell to 7,274 families in 2011 and then slightly increased to 7,546 families in Under the Jokowi administration, the transmigration program has been revived with more or less similar objectives to the previous administration. The transmigration program is seen as an alternative way to distribute levels of development evenly across provinces and to boost the domestic economy through the fishery and farm economic sectors. Under the Jokowi administration, the transmigration program aims to relocate four million transmigrants annually during the period 2015 to To support the plan, the government has allocated Rp. 1.4 trillion from the national budget to support land clearing costs, settlement, infrastructure and lump-sum (monthly income received by transmigrants). The amount of lump-sum is Rp. 3.5 million per head of household for a period of 18 months. The government also allocates 0.25 ha. free for all heads of household and another three ha. of plantation land that transmigrants should pay for in instalments (Aditiasari, 2015). During a national transmigration meeting held at the end of 2014, the vice president stated that the transmigration program is still relevant to reduce population pressure in the inner islands, to promote equal economic development across islands and to maintain national sovereignty (Purnomo, 2014). He added that the current government has learnt from past experience that relocating the whole village (Bedol desa) does not make sense and is no longer possible. He urged the department responsible for the program to first establish economic activities in the transmigration sites. The ensuing employment opportunities then would attract migrants to voluntarily migrate to the site. 12
35 Introduction The current Minister of Villages, Development of Isolated Regions and Transmigration said that the transmigration program will promote a new concept of population resettlement. The Minister said that the concept of migration is not only to relocate people but also to widen employment opportunities for skilled workers. He added that the transmigration program will adopt a new concept of development, called an agro-district, in which transmigration sites are being converted to elite regions. The agro-district concept is based on a modern agriculture layout through establishing organic types of agriculture in each district. Through the channel of transmigration, the Minister argued, the Jokowi agenda on national food security for the nation can be achieved (Aditiasari, 2015). The master plan for the 2015 transmigration program has been set up and is ready to implement. In an initial stage, 48 transmigration sites with potential for agriculture, fishery and plantation development would be established immediately after the approval of the budget. Potential transmigrants would be assessed on the basis of their skills in agriculture, fishery and plantation. At the same time, the program would also establish a housing complex for six thousand families of the armed forces in East Kalimantan and West Kalimantan. Kalimantan has been selected for political reasons, to protect national boundaries. The sites will be equipped with public infrastructure such as schools, public health centres, places of worship, and industrial zones if possible. Sulawesi is also being prepared as a transmigration site. Transmigrants will be relocated to regions in Sumatra, Sulawesi and Kalimantan. For Kalimantan in particular, the transmigration sites are border regions with Malaysia. Transmigration candidates can participate in the program by applying online through official transmigration websites. There is a list of requirements that should be possessed by the potential transmigrants. They should be: 1. An Indonesian citizen 2. Married, approved by official marriage paper 3. Possess current population registration card (KTP) 4. Aged between 18 and 50 years old 5. Never participated in a previous transmigrant program 6. Healthy 7. Possess specific skills that can be used to develop natural resources in the sites 13
36 Chapter 1 8. Agree to obey all rules and procedures 9. Pass the selection process Apart from the above requirements, there are three exceptions for persons who want to take part in the program. Firstly, it is allowed for an unmarried person to take part if he or she possesses specific expertise (teachers, paramedics and clergy). Secondly, it is allowed for a widow who is accompanied by her adult son and, thirdly, it covers those who are victims of natural disasters or social unrest. The Minister of Villages, Development of Isolated Regions and Transmigration said that the transmigration program has improved the employment outcomes and welfare of 2.2 million families, the equivalent of 8.8 million transmigrants (Batubara, 2015). He added that the program has successfully established 1,168 villages, 385 districts and 104 regions/municipalities. An illustration of the success of the transmigration program was the designation of Mamuju, a former transmigration destination, as the capital city of West Sulawesi Summary The population imbalance between provinces in Java Island and provinces in the outer islands has been the main driver for implementing the population resettlement policy. There are several main points that can be concluded from the literature review on migration and the population resettlement policy in each period of administration. Firstly, past experiences have shown that the major failures of the policy were related to the selection of the sites and recruitment of transmigrants. In terms of the selection of the sites, it is important to prepare sites before settlers arrive. Site preparation covers roads, bridges, irrigation, clinics, sport centres, markets and other facilities which are not seen to be exclusive for certain locations. Sites should not be located far from where local people live. Further, it is also important to be certain about the legal rights of the land use in order to halt any potential conflicts in relation to land acquisition. One breakthrough made by the Jokowi administration has been to facilitate land legalisation rights for transmigrants. In relation to the selection of transmigrants, it is important to have a reliable institution for the recruitment of transmigrants. Potential transmigrants need to meet several criteria. Past and current governments have overlooked one crucial factor in recruiting transmigrants 14
37 Introduction that is, their marital status. Only those who are married are eligible to apply as transmigrants. Under the Jokowi administration, an unmarried individual is allowed to join the program if he or she possesses specific expertise (teachers, paramedics and clergy). Apart from those occupations, there is no place for the unmarried. Unmarried people are considered as people with a high risk of creating conflicts or social unrest, in particular with local people at the place of destination, even though there is no statistical evidence to support this claim. However, it is actually the young who have the greatest likelihood to migrate and to assimilate with the locals. One proxy of migration acculturation in receiving areas is in the form of inter-marriage between migrants and local people. Inter-marriage brings positive outcomes for both parties (Gordon, 1964; Kalmijn, 1998). It can reduce potential conflict between settlers and indigenous people and strengthen kinship and relationships. It also helps settlers to adapt and adjust easily to local culture, diet, attitudes and behaviours. Further, inter-marriage brings strong inter-region connectivity, creates a new form of culture, eliminates group boundaries and in the long run increases spontaneous migration. Secondly, the objective of the program which is aimed at reducing population pressure on the inner islands needs to be reconsidered. Past experience has shown that this objective is unattainable. The only option for migration out of Java is to establish new economic geographies outside Java. The decentralisation system has provided avenues for this approach. Successful economic regions such as those in Batam Islands and Kalimantan have shown this to be the case. It can be said that new economic geography is a by-product of the decentralisation system. Employment possibilities offered by new economic sites automatically attract people either through the channel of government or spontaneously. This is good for the development of the region and its fringe areas, to attract more people to migrate out of Java and also as an alternative to migration to Jakarta, which has been the main destination for migrants. Thirdly, the review of history indicates that there is little evidence that the transmigration program has been successfully implemented. The number of transmigrants relocated through the program has almost always been far below the target proposed. There is mixed evidence as to whether or not transmigrants are better off once they have relocated. 15
38 Chapter 1 Furthermore, in many instances transmigrants have had conflicts with local people. The main driver of conflict is the unwillingness of both transmigrants and local people to assimilate with each other. Different treatment received by both transmigrants and local people in terms of government assistance, access to local infrastructure and earnings are factors that fuel these conflicts. Also, there has been little effort made by the government or the ministry in charge to monitor and evaluate the program over time. To sum up, it can be said that migration within Indonesia has a strong association with population policy. The term transmigration was introduced by the Soekarno administration. To date, the term is still being used by the Jokowi administration. The aim of transmigration policy has changed quite frequently. In the early stages, the demographic factor the presence of population imbalances across provinces was the main driver of transmigration policy. In the later stages, the aim of the transmigration policy has been to include economic, cultural and sovereignty factors. There has been an improvement in the recruitment process for potential transmigrants. The current administration has outlined a clear list of requirements and training for candidates who want to transmigrate. Apart from the fact that the current government seems ready to implement the transmigration policy, little is known, in particular from the ministry in charge of the policy, as to how it will monitor and evaluate the program consistently over time. Evaluation and monitoring of such policy is important to measure the degree of success of the policy and also to give insights as to how to maintain the momentum so that the policy can run effectively for the next five years. While it is evident that the transmigration program has been a major pathway for Central Javanese people to leave the province, there is a considerable component of migration from Central Java which is not associated with transmigration, including migration to Jakarta, Yogyakarta, Batam and other destinations. Based on the 1971 Census, 41 per cent of Central Javanese recent migrants were found in Jakarta, and the percentage of females exceeded the percentage of males. Also in 1971, the percentage of Central Javanese migrants who were found in Riau was only one per cent but this had risen to five per cent in This translates to an increase of more than 45,000 Central Javanese migrants from the five years preceding 1971 to the five years preceding The percentage of recent Central Javanese migrants who were found in Jakarta decreased to 22 per cent in 2010, but 16
39 Introduction the percentage in West Java reached 35 per cent, increasing more than threefold from If Central Javanese migrants going to Jakarta and West Java are combined because most of those in West Java are in the Jakarta Metropolitan Region, the number of recent migrants in 2010 reached more than half a million. Migrants move from Central Java to Jakarta and Batam mainly to gain access to job opportunities. They move voluntarily or through the help of the third parties. The number of Central Javanese-born people who live outside the province is much higher than the number of Central Javanese recent migrants over the same period of time. Therefore, it can be said that while the transmigration program has been an instrument for people to migrate from Central Java, other forms of migration contribute significantly to migration out of Central Java. Building on that, it is important to underline here that this thesis does not investigate transmigrants from Central Java specifically nor does it evaluate the transmigration program. Rather this thesis has a broader focus on migration out of Central Java between 1971 and Organisation of the thesis The thesis explores a series of topics in migration studies in Indonesia and relies upon both macro and micro approaches from the migration literature. The first two analytical chapters address the numbers, directions, patterns and changes over time of migration in Indonesia. The results from these two chapters lead to the third and fourth analytical chapters of the thesis that focus on the employment outcomes and marital assimilation of Central Java s migrants in different places of destination using micro- approaches. The thesis is organised into seven chapters. In Chapter 1, I begin with an introduction that contains the importance and the objective of the thesis. I outline the setting of the study and briefly discuss population resettlement policy from Indonesian independence to date. I provide the thesis outline and detail on research questions for each analytical chapter. In Chapter 2, I provide a theoretical review of the thesis. The literature review encompasses the macro and micro approaches to migration in the context of internal migration and past studies in this field. Chapter 3 discusses overall patterns of inter-provincial migration in Indonesia over the 1971 to 2010 censuses. The key research questions addressed in this chapter are: 17
40 Chapter 1 1. What are the inter-provincial migration patterns over time? 2. How do the patterns of spatial concentration change across time? 3. What are the structural patterns across provinces? The aim of this chapter is to provide an overview of inter-provincial migration in Indonesia over the 40-year period. The chapter uses statistical approaches to measure population movements across time. The hypotheses in this chapter are that: 1. There has been no dramatic change in the patterns of internal migration in Indonesia over the 40 years of the analysis. 2. The direction of migration follows an economic pattern in which Jakarta remains the leading destination for migrants but other new geographies outside Java could attract substantial numbers of migrants. 3. Central Java contributes the main source of migrants for the nation. Chapter 4 focuses on migration out of Central Java. Specifically this chapter investigates the conditional probabilities of migration among Central Java s primary, onward and return migrants based on the 1971 to 2010 censuses. The chapter raises a series of research questions: 1. How many people have migrated from Central Java based on the 1971 to 2010 censuses? 2. Who are Central Java s primary, onward and return migrants? 3. What are the conditional probabilities of migration of Central Java s primary, onward and return migrants? 4. Are patterns of the conditional probabilities of migration different among Central Java s primary, onward and return migrants? 5. Are there differences in the conditional probabilities of migration for Central Java s primary, onward and return migrants according to their age and sex? This chapter uses descriptive analysis to answer the research questions. The study assumes that there are age, sex and destination differences in rates of conditional probabilities to migrate among Central Java s primary, onward and return migrants. Chapter 5 investigates the employment outcomes of Central Java s primary migrants in the Semarang Metropolitan Region (SMR), Jakarta Metropolitan Region (JMR) and Batam- Bintan-Karimun (BBK). This chapter searches for evidence of the likelihood of being in 18
41 Introduction work in a particular sector for migrants who share the same origin but who migrate to different places of destination. The key research questions of the chapter are: 1. Are Central Java s primary migrants more likely to find work than non-migrants? 2. Are employment outcomes different between Central Java s primary male and female migrants? 3. Are Central Java s primary migrants more likely to work in manufacturing, trade or service sectors than non-migrants? 4. Are Central Java s primary migrants in JMR more likely to work in manufacturing than migrants in other zones? 5. Are Central Java s primary female migrant workers to BBK more likely to work in manufacturing than in other zones? There is a series of hypotheses for this chapter: 1. Migration status influences the likelihood of being in work. 2. Central Java s primary migrants are more likely to work than non-migrants in the destination areas. 3. Migrants are more likely to work in either manufacturing or trade or service sectors 4. The likelihood of Central Java s primary migrants to be absorbed in the manufacturing sector is higher than it is for other types of migrants. 5. Sex difference contributes to the sectoral outcomes of migrants. This chapter utilises a binary logit regression model and a multinomial logit regression model to address the research questions. Chapter 6 explores exogamous marriages and status exchange on education of Central Javanese people based on two approaches: ethno-migration status and type of ethnicity. The key research questions of the chapter are: 1. To what extent are Central Javanese people in exogamous marriages? 2. If they marry out, with what groups are they most likely to inter-marry? 3. How do Central Javanese couples compare with other groups in their degree of exogamy? 4. Among Central Javanese husbands/wives, who marries out? 5. What are the relative education levels of the spouses among Central Javanese people who marry out? 19
42 Chapter 1 6. Is status exchange in relation to education evident among Central Javanese people who inter-marry with local people? For testing the exogamous marriages and status exchange on education, I assume that: 1. Central Javanese people are more likely to be in exogamous marriages than other migrants groups. 2. Central Javanese people are more likely to inter-marry with local people. 3. Educational homogamy dominates Central Javanese inter-marriage with local people, but it is likely that Central Javanese husbands and wives marry better-educated local people. A binary logit regression model and a multinomial logit regression model are used to answer the research questions in this chapter. Chapter 7 concludes the findings of each analytical chapter of the thesis. The conclusion recapitulates the major arguments and research issues raised in the thesis, pointing to implications for theory and policy and suggesting future research in the field of internal migration in Indonesia. 20
43 Chapter 2 Theoretical review The aim of the thesis is to investigate patterns of migration from Central Java in the context of migration within Indonesia and how Central Javanese migrants adapt economically and socially at the host place. In relation to the aim of the thesis, the current chapter reviews relevant literature on the macro theory of migration that discusses the flows and aggregate numbers of migrants and the micro theory of migration that deals with employment outcomes and patterns of inter-marriages among Central Javanese migrants. The chapter provides past studies that have been conducted in this field and shows how this thesis fills the gaps in the migration literature. The chapter begins by providing a general concept of migration. The following section discusses the macro and micro theories of migration. The third section outlines forms of migrants adaptation at the place of destination. The last section provides conclusions of the chapter. Based upon the literature reviewed, a thorough knowledge of the patterns of migration and adjustments made by migrants is believed to be crucial in gaining an overall understanding of the process of migration out of Central Java. 2.1 Concept of migration Migration involves both spatial and temporal dimensions. The spatial and temporal dimensions of migration distinguish migrants from movers (Brown & Bean, 2005). The standard definition of migration is a relatively permanent change in usual place of residence (Lee, 1966) and taking a certain period of time into account (Hugo, 2001). The interval may be definite, for instance, one year, five years, ten years, the inter-censal period, or it may be indefinite (UN, 1970). The change of usual place of residence identifies general geographic mobility. An individual must cross geographical boundaries to be considered a migrant. Provinces, regions or districts are widely used as migration-defining boundaries. The geographical structure of places is used to depict migration boundaries but often these boundaries need to be reclassified for a better understanding of the migration process (White & Lindstrom, 2005). Reclassification of territory involves the formation of a new place or splitting of one big area into two areas or an upgrading of rural areas to urban areas (UN, 2011). This can affect the measurement of migration because areas may be misclassified (continue being classified as rural although urbanisation has occurred) or 21
44 Chapter 2 where reclassification takes place, a person may be considered to have moved from one type of location to another even though they have not moved at all, sometimes referred to as pseudo/fake migrants 2 (Tan, 2008, p. 95). With regard to the scope of migration, currently there are many more people who migrate internally than internationally (King & Skeldon, 2010). There is at least one pronounced factor that leads to more people crossing boundaries within a nation than people who are crossing international boundaries, that is, the costs of migrating. Travel costs are directly proportional with distance and so crossing national boundaries generally is more expensive when compared with moving internally (UNDP, 2009). The process of applying for passports and visas adds an extra monetary burden for potential international migrants. Cross-national regulations created by the host country can be considered to be another cost of international migration (Tirtosudarmo, 2009). Some destination countries restrict the inflow of migrants by selecting those who are highly skilled or those who already have an offer of work or study, while these conditions do not exist for internal movement. Nonpecuniary costs of migration that is, the physical and psychological costs, contribute to the total cost of migration. Accessible distance and sharing the same language with the host destination increase the propensity for people to move internally (Muhidin, 2003). To sum up, the costs of migration, both monetary and non-pecuniary, contribute to the preferences of people who are moving either internally or internationally. According to King and Skeldon (2010), there are two avenues to distinguish between internal and international migration. Firstly, differences between internal and international migration can be seen from the volume of migration being measured. Relative to internal migration, it is easier to measure international migration. International migrants are a group of individuals who live in a nation different from their country of origin, while definitions of internal migration vary across countries. As a consequence, it is difficult to conduct cross-country comparisons of internal migration data. Secondly, internal migration differs from international migration in terms of the concept of distances and boundaries used in defining migration. It is likely that variations in sizes and shapes of regions affect migration rates across regions (Lee, 1957). Thus, squarish regions produce higher migrations both of 2 Pseudo/fake migrants are migrants who are categorised as migrants not due to their actual geographical movement, rather due to changes in classification of their place of residence. 22
45 Theoretical review internal and international migration. Regions with a squarish shape tend to provide a shorter distance between regions because they are physically close to each other and allow individuals to cross regional boundaries in a shorter time than they would in non-squarish regions. As a consequence, the number of migrations produced from these regions is higher than the number of migrations produced from regions with other shapes. In the Indonesian context, there is a huge disparity between provinces in terms of sizes and shapes with the size of provinces ranging from 664 square kilometres for Jakarta to 319,036 square kilometres for Papua (BPS, 2014). In terms of the shapes of provinces, there are provinces that consist of a group of small islands such as Maluku and Riau Islands and also provinces with squarish shapes such as provinces in Java. Thus, regardless of other factors, the number of inter-provincial migrants in Jakarta is not strictly comparable with the number in Papua because individuals moving to Papua must move much longer distances to be called migrants than those in Jakarta (UN, 1981). On the same note, if a group of countries forms a union such as Europe has, this reduces the number of national boundaries thus influencing the number of international migrants. Thirdly, there are differences in the factors influencing people to move internally or internationally. For example, King and Skeldon (2010) point out that there are differences in the economic factors that influence people to move either internally or internationally. In many cases, international migrants respond to the positive differences in the values of the origin and destination currencies while internal migrants respond to the economic disparities across regions without considering currency. The remainder of the chapter discusses theoretical and measurement aspects of internal migration. According to Etzo (2008), internal migration is often recognised as a fundamental mechanism through which the geographical redistribution of population changes over time and shapes the overall patterns of population as a whole. Internal migration research is a multidisciplinary study that mainly involves social sciences such as demography, geography, economics and sociology. In the study of internal migration, there are two essential questions to be examined: Who moves? and, What places grow? (White & Lindstrom, 2005). The former asks an individual or a household to answer it. This question calls for micro theory in the migration literature. The answer to the question, Who moves? is often associated with factors influencing migration decision making, such as the stages of the life 23
46 Chapter 2 cycle, economic and socio-cultural contexts and policy involved. The second question is related to macro theory because it relates to places rather than to people. The answer to this question is often related to macro-economic comparisons across regions and demographic dynamics that influence population composition or the number of potential migrants (White & Lindstrom, 2005). 2.2 Macro and micro theory in the migration literature Macro theory in the migration literature Mobility transition theory was first introduced by Zelinsky (1971). He proposed that there were five phases of mobility transition, namely, the pre-modern traditional society with limited residential migration; the early transition society with massive movements from the countryside to the cities; the late transitional society, where there was still major movement from the countryside to the cities; the advanced society with significant international migration; and a future super-advanced society with strong commuting patterns and more rigid procedures for internal and international migration. Zelinsky had made an effort to include modernization into the process, but that was not clearly specified (Skeldon, 1990). While considering Zelinsky s mobility transition theory to be excessively universal and unilinear, Skeldon (1990, 1992) proposed not to change it, but rather to propose some modifications to Zelinsky s hypothesis in order to fit the experience of developing countries that encountered modernization in their transitions. Skeldon (1992) modified Zelinsky s hypothesis by proposing that every region experiences different mobility transitions because they have different patterns of mobility, unless the regions were extremely homogenous in terms of settlement and social systems. In his more recent paper, Skeldon (2012) revisited mobility transition theory and proposed that patterns of mobility transition in the future will be associated with the unit being used to analyse the transition and its place in the global spatial system. Also, Skeldon (2012) argued that other variables should be taken into account such as agriculture, industry, and state structure as factors in the mobility transition. Macro theory in the migration literature relates to aggregate migration flows across regions. According to these theories, differences between different places act as macro factors to facilitate migration flows from one place to another (Hagen-Zanker, 2008). Some scholars 24
47 Theoretical review argue that the migration literature on this issue touches less on the theoretical aspects and more on the statistics on the volume of migration (Etzo, 2008; White & Lindstrom, 2005). The reported statistics often provide separate information about the number of lifetime and recent migrants and overlook the number of migrations undertaken by migrants. Lifetime migrants may have moved many times between their birth and their enumeration in the survey/census but only the one move is observed. For movers in the last five years (recent migrants), three places are measured, place of birth, place of residence and current location, so at least two moves are potentially observable. The dual-economic theory argues that differences between destinations can promote migration, and was introduced by Lewis (1954) and developed further by Ranis and Fei (1961). The theory argues that differences in the labour supply and wages in urban and rural sectors induce flows of workers from rural to urban areas. The process continues until there is no wage difference between urban and rural areas. In this regard, migration is seen as an equilibrating mechanism of development. The theory was then modified by Harris and Todaro (Harris & Todaro, 1970; Todaro, 1969) by adding the probability of finding a job in urban labour markets and the expected income of the migrants in the urban areas. The theory assumes that migration flows increase if the urban wage increases or the urban employment rate increases. The migration mechanism theory proposed by Ranis and Fei (1961) assumes that migration will disappear if wage equilibrium occurs between urban and rural areas. The argument proposed by Harris and Todaro (1970), which depicts migrants as having perfect knowledge and being economically rational individuals, is not always the case because some migrants move for non-economic reasons or they simply follow their relatives. Economic theory provides clear insights regarding how economic differences in different places promote migration flows, but tends to overlook the role of distance in migration flows. Distance has a strong influence on migration. The Gravity model proposed by Anderson (1979) assumes that migration flow has a strong direct association with the size of population at the place of origin and at the place of destination and is inversely proportional to distance. Distance is used as a connection between two places and is approached through travel costs, psychological costs and information about place of destination. The importance of a distance variable in the model, however, is questioned by 25
48 Chapter 2 Greenwood (1997). He argues that travel costs present the current costs of migrating while benefits of migration are gained in the future. Based on this logic, the costs of migration will not influence migration strongly but the psychological costs attached to migration and information decrease as distance increases. Therefore, distance is not a sophisticated tool to determine migration flows and to depict connection between two places. In the context of Indonesia, Lottum and Marks (2012) examined factors contributing to the process of inter-provincial migration in Indonesia based on 1930 to 2000 censuses by applying the Gravity model in their analysis. They chose Indonesia as a case study for three fundamental reasons. Firstly, Indonesia was the fourth most populous country and the largest archipelago in the world. The favourable geographic location and the range of ethnic groups have made Indonesia unique in its diversity. Secondly, population movement is not a new phenomenon for many Indonesians, since during the era of colonisation, people were relocated to meet the needs for labour in the plantation sectors in the outer islands, and for equal distribution of population. Thirdly, the intensity of population movement has been increasing since the 1970s. In addition, most qualitative studies have revealed that income differentials, the presence of a primate city and migration policy were among factors that determined inter-provincial migration. Lottum and Marks (2012) found that transmigration seemed to be insignificant between 1930 and 1980 but was statistically significant after that period, meaning that the premium income inputs influenced a great many people to move to transmigration areas. Jakarta, as the only primate city, had a strong influence in absorbing people to reside in all periods of time, while the income differential was found to be not significant in determining inter-provincial migration. According to Lottum and Marks (2012), there were at least two factors explaining these findings. Firstly, the labour market in Indonesia consisted of a dual labour market of formal and informal sectors, and seven out of ten migrants worked in the informal sector where wages were low. Secondly, the reason why income was insignificant their findings was that the measure of income used in their model, GDRB per capita, was an aggregate measure which did not necessarily reflect the incomes of workers, the expected income of migrants as Harris and Todaro proposed in their theory. However, due to the wide geographic spread of population across numerous islands, the Gravity model still has relevance in Indonesia. 26
49 Theoretical review A recent study was conducted by Vidyattama (2014) regarding the impact of internal migration on provincial growth in Indonesia during the 1975 to 2005 period. The study used the economic approach in its analysis by applying the growth model. The aim of the study was to investigate whether or not inter-provincial migration flows were capable of creating a just development across provinces. Ideally, the process of inter-provincial migration leads to convergence of economic growth across provinces. The overall findings showed that inter-provincial migration played no role in regional convergence during the period of analysis. Vidyattama (2014) further estimated the impact of inter-provincial migration on provincial economic growth by conducting sub-period analysis from census data. He found similar findings to the study carried out by Lottum and Marks (2012) which showed that, prior to the 1980s, migration impeded the process of convergence, however, after that period, migration was found to have significantly facilitated the convergence of economic growth across provinces. Vidyattama (2014) argued that differences in the policy implementation during a particular time period produced differences in the impact of interprovincial migration on provincial economic growth. Therefore, it can be said that Indonesia s inter-provincial migration flow is not purely influenced by wage differentials across provinces but is also due to government intervention on population movements and other related policies. Studies on aggregate national inter-provincial migration flows in Indonesia have been conducted by many scholars since the 1970s (Hamid, 1999; Hill, Resosudarmo, & Vidyattama, 2008; Hugo, 2001; Hugo et al., 1987; McNicoll, 1968; Muhidin, 2002; Rogers et al., 2004; Suharso et al., 1976; Tirtosudarmo, 2009; Titus, 1978) and also at provincial levels (Dwitjahyo, 2005; Firman, 1992; Romdiati & Noveria, 2006; Sudibia, 2011). The major finding of past studies was the dominance of Central Java as the major origin of inter-provincial migrants. Most previous scholars have based their studies on the uniregional migration approach that focused merely on the number of migrants who moved from a province and/or entered a particular province and have not considered, for instance, whether migrants who entered a particular region might originate from overseas. Also, earlier studies have not distinguished migrants based on migration experiences in their analysis. In fact, understanding the number of migrants who have undertaken a secondary move and migrants who have undertaken an initial move is important in order to 27
50 Chapter 2 get an idea of whether or not someone migrates as part of a corrective movement or a primary movement. A multi-regional perspective in migration patterns considers the system of origindestination-specific migration. In short, a multi-regional perspective observes flows of migration from and to provinces within a closed internal migration system. It is important to adopt the multi-regional approach in analysing migration flows across regions within a nation because this approach provides insights about regions that experience continuous flows of in- or out-migration relative to the rest of the regions and about how migrants originating from a particular province distribute themselves across the remaining provinces (Raymer, Bonaguidi, & Valentini, 2006). By doing so, a broader picture of the migration streams can be captured. In addition, further analysis of migration, such as migration patterns of people who share the same place of origin but who migrate to different places of destination can be investigated precisely under the system of origin-destination-specific migration. A multiplicative component model is a useful tool to measure connectedness between the place of origin and the place of destination with the absence of distance under the system of origin-destination-specific migration (Raymer et al., 2011; Raymer, Bonaguidi, & Valentini, 2006; Salzmann, Edmonston, & Raymer, 2010). According to this model, the volume of migrations between two places will be high if the two provinces are geographically close to each other. If the two places are sending and receiving a great number of migrants, it can thus be said that the two places are strongly connected. The level of connectedness between two provinces can be measured by the relative volume of in- and out-migrations between the two provinces. Thus, the multiplicative component model is useful in identifying the structures in the migration pattern (Raymer, Bonaguidi, & Valentini, 2006). Given the merits of the model in analysing flows of migration, this thesis will adopt this model in analysing inter-provincial migration flows in Indonesia and to assess the position of Central Java s out-migration within the context of internal migration in Indonesia. In doing so, the thesis is able to investigate the share of Central Java s out-migration to the national migration patterns, provinces with high concentrations of Central Java s migrants, 28
51 Theoretical review and connectedness between Central Java and the rest of the provinces. Findings from this investigation are provided in Chapter 3 of the thesis. Another imperative and powerful aspect in explaining Central Java s migration is the investigation of the sequences of migrations undertaken by Central Java s migrants. There is a variety of reasons why someone migrates in the first place. It can be personal intentions of expecting a greater amount of earnings, an effort to improve household incomes, job transfer, as part of family formation, or some combinations thereof. Once an individual has undertaken an initial move, it is likely that he or she will migrate again. Thus, the number of migrations undertaken by an individual depends on how often he or she repeats the movement. Investigation into inter-provincial migration also encompasses the patterns and changes in the rates and directions of migration based on the sequence of migrations. It is important to examine the rates and changes in the probability of undertaking primary, onward and return migration over time because this explains possible correlations between the migration process and factors that influence migration patterns in the short and long term and considers regional disparities (Newbold & Cicchino, 2007). The system of origindestination-specific migration is again adopted to address this issue. The findings of this study are discussed in Chapter Micro theory in the migration literature Chapter 5 and Chapter 6 of the thesis examine migration at the individual level, that is, the migrants themselves. Broadly speaking, an individual is categorised as a migrant because he or she has migrated. Thus, it is important to review the migration literature regarding the decision to migrate to have a better understanding of who migrants are and how they differ from non-migrants. The micro approach to migration discusses characteristics, tastes and values of an individual in considering migration. A fundamental theory of the micro approach to migration is the push and pull model of migration (Lee, 1966). The push and pull factor of migration explains migration in terms of individual responses toward the relative attractiveness of places. Lee (1966) proposes four main factors in the push and pull perspective of migration, namely factors associated with the place of origin, factors associated with the place of destination, intervening factors and personal factors. Both place of origin and place of destination are illustrated as having 29
52 Chapter 2 abundant factors that influence individuals decision making relating to migration. Those factors are split into three groups, namely positive factors that either withstand or pull individuals to migrate, negative factors which might push or prevent individuals to migrate, and zero factors that have neutral effect towards migration decision making by individuals. Lee (1966) expands the theory and states that there are intervening factors that lie between place of destination and place of origin. The intervening factors are described as barriers for potential individuals to migrate, for instance, distance and travel costs between the place of origin and the place of destination. The last group of factors influencing migration decision making is personal factors, that is, attributes and characteristics that affect individuals perceptions of the positive and negative factors associated with the place of origin and the place of destination, and existing obstacles. Lee (1966) introduces the concept of push and pull factors of migration by taking into account the aggregate features of the place of origin and the place of destination, linking these to the intervening factors that are located between the two places and attaching them to the personal factors of migration. Even though the theory merely constructs groups of factors that affect migration (Hagen-Zanker, 2008), the theory rigorously addresses how the migration takes place by introducing all possible factors that affect migration. The push and pull factors of migration rely on the work on the laws of migration introduced by Ravenstein (1885) who asserted that migrants move from places with lesser opportunities to places with greater opportunities. Ravenstein (1885) proposed that levels of economic development between places either facilitate or hinder migration. Thus, migration was seen to be an equilibrating mechanism. One century later, Zelinsky (1971) supported this argument and theorised that migration can be closely linked to the stages of modernisation and social change while personal factors are involved in the modernisation process. The macro approach to migration is employed in this approach. Hence, it could be said that individuals preferences and economic factors are the strong ingredients that either push or pull people from one place to another. It is likely that no matter who is in charge of migration decision making, the decision is affected by socio-economic conditions at home and at the destination. In addition to that, characteristics of potential migrants also play a crucial role. Hence, one could derive the 30
53 Theoretical review conclusion that a combination of the micro level of migration, namely individual/ households characteristics, coupled with the macro indicators embedded in each place, contribute to determine migration decision making. In other words, Lee (1966) has addressed the lack of connection between the micro and macro theories of migration by explicitly visualising the schema of the push and pull factors of migration. The push and pull theory of migration has been criticised for the way that Lee (1966) describes the role of personal factors in migration but does not clearly specify the links with the structural factors of migration (Morawska, 2001, 2003; Wolfel, 2005). Drawing on Giddens theory of structuration, Wolfel (2005) concludes that Lee s theory of migration combines the micro and macro components, but the theory does not satisfactorily take into account how personal factors interact with the social/economic structural factors. Morawska (2001) describes how structural factors that involve economic and political relations and cultural formations, coupled with the presence of networks, influence migration. Later she underlines how government regulations play a crucial role in migration (Morawska, 2003). Morawska (2001) argues that the linkage between migration and structural factors enables us to capture migration as a dynamic rather than as a static process. Criticisms aside, although it is true that structural factors play a crucial role in migration and the personal factors are the central point of migration, the overall idea on how these two dimensions affect migration is explained implicitly in Lee s work on the volume of migration. He states that the volume of migration varies with the degree of diversity of localities included in a particular territory, meaning that a variety of opportunities between localities stimulates migration but that migration is also affected by the diversity of people in terms of ethnic groups or levels of education or income or tradition, such that homogeneity yields a smaller number of migrants and variations in the economy. Potential migrants undoubtedly take consideration of these circumstances and respond directly to the positive and negative factors associated with the home and host areas. Regarding the migration schema proposed by Lee, the role of structural factors can be embedded as a push factor of migration that affects potential migrants (Portes, 2008). In any case, the prevailing theory of migration now considers migration to be attached to the individuals/households level and by contextual factors from home and host lands 31
54 Chapter 2 (Bilsborrow et al., 1987; Massey et al., 1993) which is positively accommodated by Lee s theory of migration. Thus, the push and pull perspective of migration theory remains the most powerful theory employed in migration studies (Sirkeci, 2007). In a broader conception, White and Lindstrom (2005) simplify the factors that influence migration decision making into three avenues. The first is the human capital theory of migration decision making. Adopted mostly from the work of Sjaastad (1962), migration is considered to be one form of human capital investment in which a rational individual maximises his or her expected return based on a migration utility function. Thus, the decision whether to migrate or not depends on the cost-benefit calculation of the expected discounted returns of migration over future time periods. Sjaastad (1962) argues that an individual decides to move if the present value of the lifetime benefits of migration are greater than the present value of the costs of moving. The expected benefits include the monetary return, that is, the discounted earnings between the place of origin and the place of destination, and the non-monetary returns such as preferences for the new location. The costs of moving cover the real costs of moving (travel costs), the psychological costs and the opportunity costs of not moving. Migration may also be viewed as part of a household survival strategy by migrating one member of the household or more over space and time in order to ensure the family s survival (Mincer, 1978; Stark & Bloom, 1985). Earlier studies propose that the whole family will migrate if the net gain of migration is positive. If only one member of the family has a chance to migrate, the family only migrates if, and only if, the benefits of one family member internalise the losses of other family members (Mincer, 1978). Later, Stark and Bloom (1985) went one step further and presented the new economic labour migration theory which considers migration is undertaken as a household strategy for maximising joint income, and status, and minimising the risks of migration. The theory argues that the decision to migrate is based on agreement of all household members and for the satisfaction of the household as a whole. Unlike the former, this theory suggests that households should send one member of household or more to migrate rather than migrate together. 32
55 Theoretical review The second approach of White and Lindstrom (2005) that can be used to explain factors that influence migration is the life cycle approach. They state that often an individual decides whether to migrate or not based on his or her current age. For instance, young individuals have the greatest probability of undertaking migration because, relative to the rest of the population, they have a longer time to spend in the labour market. As a consequence, the young can overcome the costs of migration and at the same time can gain more benefits from migration for the rest of their life time in the labour market than the remaining population. Other studies (Beshers & Nishiura, 1961; Christina, 2006; Greenwood, 1997) point out the relevance of migration to other, non-economic aspects of potential destinations. They argue that non-pecuniary factors of migration induce some people to migrate to economically unattractive areas. In other words, migration is ultimately conditional on conveniences such as language, climatologic, and topological amenities. The last approach that is proposed by White and Lindstrom (2005) in influencing an individual to migrate is the role of contextual factors. According to this approach, there are two contextual factors that can influence an individual in migration decision making. These are the interference of other family members and the community effect. The former suggests that the tendency of an individual to undertake migration is high if there is at least one member of the family that has migration experience. Meanwhile, the community affects an individual s migration decision making through the channel of social capital. The manifestation of community effect is the presence of migrant networks at the place of destination. Massey et al. (1993) define migrant networks as follows: Migrant networks are sets of interpersonal ties that connect migrants, former migrants, and non-migrants in origin and destination areas through ties of kinship, friendship, and shared community origin. They increase the likelihood of movement because they lower the costs and risks of movement and increase the expected net returns to migration and cause the probability of migration to rise, which causes additional movement, which further expands the networks, and so on. For first-time migrants, migration is considered a costly and risky act. Once the first-time migrants are settled, they set up migrant networks at the place of destination and persuade people to join them. The perpetuation of migration is often the result of a strong migrant 33
56 Chapter 2 network at the place of destination. This explains how chain migration works in connecting potential migrants with previous migrants. Past studies have shown that the role of the migrant networks, through the process of chain migration which is created by previous migrants at the place of destination, has functioned well in the migration process in Indonesia. Safitri and Wahyuni (2013) conducted a study on how migrants adapted and adjusted to the host environment and how the migrant network played a crucial role in the destination. The unit of analysis was a group of migrants who came from Lampung and who were found in Cikarang, West Java. The study revealed that migrants from Lampung had a solid migrant network in which, when migrants firstly arrived at Cikarang, they lived temporarily with previous migrants who were their next of kin or old neighbours. A strong network among migrants who originated from Lampung was started in the 1990s when industries were first established heavily in Cikarang. At that time, there was a huge demand for labour, and migrants from Lampung became the major source for the labour shortage. Safitri and Wahyuni (2013) argued that the migrant network was crucial for potential migrants in terms of their choice of destination, employment opportunities and psychological costs. The study found that migrants went to Cikarang because they had friends and/or acquaintances from Lampung who had permanent work in manufacturing and who persuaded them to migrate. This explains why the majority of migrants from Lampung work in the same manufacturing as the previous migrants. This also explains the role of chain migration in the context of Lampungnese migrants in Cikarang. For migrants, the migrant network was not only a place for sharing information about prospective jobs but also a venue for reducing homesickness. Migrants usually gathered together to share food and news from home. Safitri and Wahyuni (2013) added that most migrants had additional jobs so that they could save more money, with a consequence that they lost time to socialise with local people. Other studies of the role of migrant networks in the migration process were conducted by Purnomo (2004) and Khotijah (2008). Both scholars analysed migrants who came from the Wonogiri and Klaten, regions in Central Java and who migrated to Jakarta. Findings from Purnomo (2004) and Khotijah (2008) supported the above arguments that migrant networks provided a venue for migrants to connect with previous migrants and to assist them to adjust quickly at the place of destination. Purnomo (2004) argued that previous 34
57 Theoretical review migrants at the paguyuban (migrants community) assisted first arrival migrants with temporary accommodation and with employment at the same type of jobs as they had. More recent studies were conducted by McDonald et al. (2013) and Utomo et al. (2013) on migration and transition to adulthood in Greater Jakarta. Both studies revealed that the majority of migrants, both males and females, were part of chain migration following the patterns of previous migrants. They were mostly persuaded by their families, relatives or neighbours who had moved previously and now were settled at the place of destination. This indicated the presence of migrant networks at the place of destination. The study underlined the importance of migrant networks at the places of destination to secure temporary accommodation and employment in the city. Both studies found that it was common for migrants to stay with their siblings or relatives when they first arrived in Jakarta. In some cases, the siblings or relatives informed someone in the origin about the availability of jobs in their workplace. The studies also added that migrants first job was usually temporary and they tended to move across employment types until they earned stable incomes. To conclude, given the importance of economic factors in the migration process, structural factors, that is, migrant networks play an imperative role in affecting migration decision making and the choice of destination. A review of previous studies has shown how chain migration is applied in the migration process in Indonesia. Individuals decide to migrate to a specific place of destination because they have connections in that destination. The reviewed literature is utilised in this thesis in order to distinguish migrants from nonmigrants and explore how networks influence migrants in selecting destinations. 2.3 Adaptation of migrants at the place of destination Employment outcomes of migrants Theoretically speaking, when an individual arrives at a place of destination, the next steps he or she needs to take are how to adjust to the labour market at the place of destination and how to assimilate with the local people and their culture (King & Skeldon, 2010). In other words, there are two types of adjustment encountered by migrants at the host place, namely, social adjustment and economic adjustment (Frank, 2004). Economic adjustment is 35
58 Chapter 2 related to the goal of migration for the majority of migrants, that is, to be financially secure at the place of destination, while social adjustment is related to the migrants attitudes and openness towards local people and the local people s attitudes towards them. In terms of employment adjustment at the place of destination, recently arrived migrants in developing countries quite often work in the informal sector (Sibel & Gulay, 2011). The informal sector acts as a buffer for migrants because this sector does not require specific levels of education or skills for those who want to work in this sector. Also it is easy to enter and exit the informal sector. Types of employment that are available in the informal sector include small-family-run businesses, street vending, petty commerce, day labour, domestic service, etc. In many cases, the migrant follows the employment of previous migrants in his/her network. This indicates that a migrant network is well-functioning at the place of destination. Thus, it is likely that the type of employment of a migrant can be traced from their place of origin. This emphasises the existence of the segmented labour market due to the specialisation of a particular migrant s group (McKenzie, 2008; White & Lindstrom, 2005). In the context of Indonesia, studies regarding the employment outcomes of migrants at the place of destination have found, as expected, that the type of employment of migrants was indicative of their place of origin and or ethnicity. Priyanto (1991) conducted a study among migrant vendors in three traditional markets in Bogor, West Java. He categorised migrant vendors based on their ethnicity, namely, the Javanese, the Sundanese and the Minangkabau. The study found that there was variation in the types of goods being sold by the vendors that matched ethnicity. The Minangkabau traders sold clothes such as t-shirt, jeans and skirts, the Javanese migrants sold snacks such as meatballs, banana and cassava fries, and other types of street food, and the Sundanese migrants mostly sold fresh fruits and vegetables. Priyanto (1991) added that as opposed to other types of migrants, Minangkabau migrant vendors had more capital and received greater profits. Another study was conducted by Ammarell (2002) on how Bugis migrants adapted at their destination. The study found that Bugis migrants were known for their hard work in opening formerly unexploited economic niches by clearing new agricultural lands, developing fisheries, and establishing small businesses. As compared to local people, Bugis migrants gained more wealth and established strong relationships with local policy makers. 36
59 Theoretical review The existence of the segmented labour market among migrants was also found by other studies conducted by Safitri and Wahyuni (2013), Purnomo (2004), Firman (1999) and Lindquist (2002). Based on his work, Purnomo (2004) argued that there were at least three favourable jobs for migrants from Wonogiri, a region in Central Java, who migrated to Jakarta. Firstly, the biggest group of migrants worked as meatball sellers, groceries sellers, and herbal drink sellers. At the second position in the employment ladder was those who worked in the construction sector as carpenters or bricklayers. The last type of employment in which Wonogiri migrants were involved was domestic service. Purnomo (2004) added that there were also many migrants who were engaged as tailors, motorcycle drivers, and mechanics. Female migrants from Lampung who were found in Bekasi mostly worked in the manufacturing sector (Safitri & Wahyuni, 2013) and migrants to Jakarta from Central Java were also most likely to work in the manufacturing sector (Firman, 1999). Female migrants in Batam who come from Central Java are also more likely to work in the manufacturing sector (Lindquist, 2002). As urban employment becomes more diversified and as the education levels of the migrants increase, more migrants work in the growing formal sector. Migrants who move a long distance and work in the manufacturing sector are quite often assisted by an institutional network typically a labour agency at the place of origin of the migrant. The labour agency represents the manufacturing company in the host place and functions to recruit migrants to work in that manufacturing company. As a compensation for the willingness to work for the manufacturing company that is located far from the origins of the migrants, the manufacturing company facilitates travel costs and accommodation for migrants (Lindquist, 2002, 2009). In relation to employment opportunities and the choice of destination, migrants often decide to go to destinations where many modern economic activities are available. Employment diversity due to various economic activities in a particular region creates new opportunities for potential migrants to enter the region (Lee, 1966). Lee (1966) adds that the business cycle influences the choice of destination because during a period of economic expansion, many new industries begin to recruit labour from outside the region. Quite often, industries are not evenly distributed across destinations; rather they are spatially concentrated. The level of spatial concentration ranges from a group of small areas that produces a very specific product to a group of large areas that consists of a variety of 37
60 Chapter 2 industries that produce different products (Deichmann et al., 2008). Thus, each destination offers different types of employment and it is also likely that migrants are involved in different types of employment at the place of destination. Differences in types of employment of migrants can be explained by two aspects. Firstly, employment possibilities in destinations vary because different cities offer different types of jobs (McDonald et al., 2010). Today, economic structures of the places of destination are often dominated by modern economic sectors: the manufacturing, trade and service sectors. In some cities, migrants who cannot enter the manufacturing sector work in the informal service sector (McDonald et al., 2010) while, in other cities, migrants tend to work in casual employment or small enterprises (Manning & Pratomo, 2013). Secondly, types of employment of migrants are also differentiated by the sex of the migrants. Quite often, the manufacturing sector prefers females to males because females are considered to have capabilities to pay attention to detail (Firman, 1999; McDonald et al., 2013). Perhaps for the same reason, females are preferred in domestic service Concept of assimilation Park and Burgess (1921, p. 735) stated that: Assimilation is a process of inter-penetration and fusion in which persons or groups acquire the memories, sentiments, and attitudes of other persons or groups, and by sharing their experience and history, are incorporated with them in a common cultural life. In the process, assimilation occurs between migrant groups and native groups in a larger community, and is measured based on social, economic, and cultural aspects. Thus, in a situation where different groups live together, there is a likelihood that some individuals from a smaller group become assimilated (Newman, 1973, p. 25). Complete assimilation occurs when the cultural and social gaps between groups have disappeared. In short, as a society undergoes the assimilation process, group boundaries begin to decrease. General theories of assimilation were initially formulated in the context of the United States and international movement, and have been referred to variously as Angloconformity, melting pot, and cultural/multiculturalism (Gordon, 1964; Newman, 1973; Richard, 1992). Anglo-conformity requires a complete renunciation of the immigrant s cultural heritage in favour of the behaviour and values of the Anglo-Saxon core group 38
61 Theoretical review (Gordon, 1964). Park and Burgess (1921) suggest that assimilation entails the fusion of persons or groups where they acquire the attitudes of the host society, resulting in a common lifestyle for all. Park argues that inter-group relations go through a predictable set of phases that he calls a race relations cycle (Park & Burgess, 1921, p. 621). When groups first come into contact through migration and exploration, the form of relations is conflictual and competitive. Accommodation often takes place in an early stage, indicated by the actions of migrants to adjust to a new social situation. Park and Burgess (1921) considered accommodation as a tool to stabilise relationships between groups. The melting pot theory envisions that the culture of the various groups will mix and form a blended new culture, different from the cultures of any one of the groups separately (Gordon, 1964; Newman, 1973; Richard, 1992). The melting pot largely emerges over time through inter-marriage (Fitt-Ajewole, 2008). In the process, however, there is room for debate as to whether all groups will make an equally influential contribution, or whether there is to be a proportionately important influence upon the size, power and strategic location among groups (Gordon, 1964, p. 124). Gordon (1964) expressed concern that the melting pot concept envisaged that the culture of migrants was completely melted into the host culture and provided no cultural trace at all. Cultural pluralism is the most recent of the three general theories of assimilation as part of international interest in ethnic group persistence (Fitt-Ajewole, 2008). Cultural pluralism exists when groups maintain their individual identities (Newman, 1973) while at the same time taking on the behaviour and values of the host society (Richard, 1992). In the process, groups remain separate, and their cultural and social differences persist over time. While the three initial theories of assimilation have formed the ground of many assimilation studies, it is assumed that the assimilation of migrant groups involves major obstacles and takes a substantial period of time (Park & Burgess, 1921). Gordon (1964) formalised and enhanced the theory by providing details regarding the stages of the assimilation process and its time frame. He theorised that assimilation occurs through a series of stages, with integration being the crucial stage. In addition, he distinguishes clearly between the cultural and the structural components in his theory. Gordon (1964) proposes that assimilation runs a certain course in a certain order and is completed once migrant groups blend completely with local people. 39
62 Chapter 2 In his book entitled Assimilation in American Life (1964), Gordon (1964, p. 71), proposes a seven-stage model of assimilation as seen in Table 2.1 below. Table 2.1 The stages of assimilation (Gordon, 1964, p. 71) Stage of Assimilation Condition Special Term 1. Cultural assimilation Change of cultural patterns to those of the host (acculturation) society Acculturation 2. Structural assimilation Large-scale entrance into cliques, clubs, and institutions of host society, on primary group Integration level 3. Marital assimilation Large-scale inter-marriage Amalgamation 4. Identificational Development of sense of people-hood based assimilation on exclusively of host society None 5. Attitude receptional assimilation Absence of prejudice None 6. Behavioural receptional assimilation Absence of discrimination None 7. Civic assimilation Absence of value and power conflict None In the first stage of assimilation, Gordon (1964) argues that people will assimilate culturally to people in the host region in all aspects of life such as learning the host language, religious beliefs, changing diet, and the values individuals use to organise their lives and interpret their existence. He states that the completion of acculturation is crucial for people to move to the second stage of assimilation, that is, structural assimilation. However, he explains that there is no guarantee that individuals who have completed cultural assimilation will move to the second stage of assimilation, that is, integration. Structural assimilation or integration connects individuals to one another and to a larger society and consists of a secondary and a primary sector. The secondary sector consists of groups that are more public and task-oriented such as schools and factories whilst the primary sector involves inter-personal relationships such as friendships. Structural assimilation usually flows from the secondary level to the primary level, that is, before people start making friendships with members of other groups, they must become acquaintances. The initial contact between members of the groups occurs in public spheres such as schools or workplaces. Once people re-connect with each other in the public space, the assimilation process moves to the primary level more easily. Measures of integration into the primary sector include the extent to which people have acquaintances, close friends, or neighbours from other groups. 40
63 Theoretical review When members of different groups are comfortable in establishing friendships, the primary level of integration is settled. The next stage of assimilation is marital assimilation that occurs on the basis of a solid and a substantive relationship between members of the groups. Friendship is the basis for inter-marriage because it is most likely that people select their marriage partner from their inner circle. Gordon (1964, p. 81) states that structural assimilation leads to marital assimilation and therefore should be considered the keystone of the arch of assimilation. This is because structural assimilation inevitably produces acculturation, while acculturation does not necessarily lead to structural assimilation. When the stage of marital assimilation is completed, group boundaries are weakened and groups become indistinguishable from the host place which leads to an absence of prejudice and discrimination. The last stage of assimilation is reached when the assimilation process has been fully completed in all intrinsic and extrinsic cultural traits. To this end, it can be said that once structural assimilation has occurred, the rest of the assimilation process will fall into place Marital assimilation Marital assimilation is an important aspect of migration adaptation and acculturation at the place of destination (Gordon, 1964; Heckmann & Bosswick, 2005; Kalmijn, 1998; Kalmijn & Van-Tubergen, 2010; Newman, 1973; Qian & Lichter, 2007; Richard, 1992). Marriages between migrant groups and local people measure the degree of cultural and norm acceptance across ethnic group boundaries (Qian & Lichter, 2007). Gordon (1964) considers inter-marriage as the final stage of assimilation among ethnic or cultural groups. Inter-marriage is also regarded as one form of interaction between groups (Kalmijn, 1998). Inter-marriage may reduce ethnic identity and conflict in the long term because those who are in mixed marriages identify themselves as a single group (Kalmijn & Van-Tubergen, 2010). A marriage between migrants and local people can be used as an indicator of individuals private relations at the host place (Heckmann & Bosswick, 2005). A prominent sociologist, Kalmijn (1998), proposes that there are three main factors that determine marriage patterns: preferences of individuals for certain characteristics in f marriage partners, the role of third parties and the condition of the marriage market. 41
64 Chapter 2 Kalmijn (1998) adds that the three main factors are not independent, but are correlated with each other in influencing an individual in selecting his or her marriage partner. The first factor is an individual s point of view on marriage candidates that can be explained from two perspectives: socio-economic factors and cultural preference. Socio-economic factors are conceptualised as an economic resource for an individual, in which people maximise their income by searching for a spouse with a better socio-economic status. In terms of cultural preference, Kalmijn (1998) argues that similarity of values, opinions, worldviews and taste leads to mutual understanding and joint activities among individuals. The second factor is the role of third parties. Third parties influence the members of the group to be in an endogamous marriage so that they do not have to learn new cultural practices and customs in order to communicate with a new member of the family who comes from outside their own group (Carnegie, 2013). In a more rigid group, a sanction can be applied for a member of the group who decides to inter-marry. The sanction can be in the form of expelling inter-ethnic couples from their own groups (Seo, 2013). The sanction can also come from the state s law by stating that inter-faith marriage is illegitimate (Burdette, Haynes, & Ellison, 2012). The last factor is the local marriage market. In this aspect, there are three factors that need to be considered, namely, the size of the groups and the location and the composition of a marriage market. The size of a particular group is inversely proportionate to the likelihood of being in an exogamous marriage, provided that the process of marriage is random. A similar argument is drawn from the economics of marriage. Becker (1973), who introduces the economics of marriage, developed a model on how the marriage market generates couples that match on traits which are complements in the production of household goods. Becker (1973) conceptualised household goods to include factors such as companionship and healthy children. He also mentions that education, religion and race are complements in the production of household. For instance, religious practices in raising children can make household goods optimal. Since the commodities produced in a household are also consumed by the household, a marriage can be established between people with similar demands for the goods. In the model, Becker (1973) assumes that marriage occurs if, and only if, both of the husband and the wife are made better off, that is, increase their utility. Search costs and spatial location of marriage markets, however, mean that optimal matches do not always occur. This condition forces individuals to be 42
65 Theoretical review rational and select spouses they value most. Thus, from the economic point of view, the choice of marriage candidate lies in similarities of values, worldviews and benefits gained from marriage. On the preference of individuals towards marriage partners, Kalmijn (1998) states that it is likely that an individual marries someone from outside his or her own group whom he or she finds attractive. The concept of attractiveness often lies in the degree of socioeconomic status that can be measured by earnings and levels of education. The degree of socio-economic status creates layers across groups, in which some groups enjoy a higher status while others belong to a lower status. Individuals belonging to a higher status have more opportunities to select their marriage partner compared with people from the lower status (Fu, 2001). Status exchange theory facilitates the process, stating that members of the minority group exchange their high economic status to marry someone from the majority group (Levchenko & Solheim, 2013). The opposite of status exchange theory is status homogamy theory, which argues that people are more likely to marry someone who is similar to them in terms of socio-economic status (Hou & Myles, 2013). In a more specific context, migrants who are better-educated and risk takers are likely to exchange their high economic status by inter-marrying local spouses, in order to secure their position in the host place (Furtado & Theodoropoulos, 2011). In a multi-ethnic nation such as Indonesia, it is likely that an individual marries someone from outside his or her ethnic group. Inter-ethnic marriage is legal in Indonesia, but the same is not true for inter-faith marriage. Research on this issue, however, is relatively limited. The most current study on marriage pairing was conducted by Utomo and McDonald (2014) using the full dataset from the 2010 Indonesian population census. The study revealed that the vast majority of couples were in endogamous marriages, that is, they married someone from their own ethnic group. Utomo and McDonald (2014) added that the percentage of endogamous couples was lowest in Jakarta and highest in Central Java. This indicates that people who live in regions that consist of mixed ethnic groups have a greater tendency to meet and marry someone from a different background than those who live in regions with a uniform ethnicity. 43
66 Chapter 2 Past studies in the Indonesian context have shown that there is a series of rational reasons as to why an individual decides to inter-marry. A study conducted by Kurniawan (2012) investigated reasons for the occurrence of inter-ethnic marriage of Javanese-Chinese couples. The study was conducted through an in-depth interview amongst Javanese- Chinese married couples in Surakarta. The study found that an individual decided to cross his or her ethnic group in order to marry someone from outside his or her own group who was physically or economically attractive. A similar finding was provided by Seo (2013) on investigating characteristics of married couples and inter-faith conversion in the Javanese community. Seo (2013) found that the conversion of one partner depended on which partner had a stronger economic influence before the marriage took place. Seo (2013) argued that in many cases, the potential married couples could not afford to set up their own residence from the outset. Thus, the couples usually had to decide to live with or near the groom s or the bride s family. This decision led to which partner would convert at the time of marriage. Evidence of couples in inter-marriage relationships shows that their ethnic group boundaries are less rigid (Kalmijn, 1998). In daily practice, they embrace each other s ethnic traditions and routines through establishing joint activities and sharing common values of life (Febrianto & Hardi, 2011; Kurniawan, 2012; Manalu, 2012). For instance, Manalu (2012) states that to build strong ties among inter-ethnic married couples, the husbands and the wives have to actively participate in ethnic gatherings and festivals and religious activities of the other partner. In her study, she observed that non-batak wives of Batak husbands must have the capacity to speak Batak to help them to assimilate quickly to Batak culture and tradition. Febrianto & Hardi (2011) found that, for inter-married couples, the issue is not who dominates whom but how differences in ethnic origin are accepted and how similarities are developed such as through worshipping together. Accordingly, it can be said that though ethnicity represents an identity for Indonesians, religion is a stronger marker than ethnicity. This can be seen by marriage patterns among Batak ethnic groups in which Batak Mandailing people, a Muslim dominant ethnic group, are more likely to marry a Javanese or a Minangkabau person, two Muslim ethnic groups, whilst people of Christian Batak ethnic groups tend to marry people from other Batak or Manado ethnic groups (Utomo & McDonald, 2014). This explains why religion is a 44
67 Theoretical review stronger identity marker than ethnicity and a more rigid group boundary. Thus, the act of crossing religious boundaries, that is, being in an inter-faith marriage, is socially less acceptable (Carnegie, 2013; Connolly, 2009; Seo, 2013). At the state level, there is a clear and bold message from the Indonesian government under the Indonesian State s Marriage Law No 1/1974 that a marriage is valid if it is carried out according to the religion and beliefs of the bride and groom, which indirectly states that inter-faith couples can marry only if one partner converts to the other s religion (Connolly, 2009). At the community level, Connolly (2009) argues that inter-faith marriage can disrupt religious and familial obligations. Chapter 6 of the thesis investigates patterns of inter-marriage and status exchange on education among Central Javanese people based on the theory in the reviewed literature. Given the limited studies of inter-marriage among migrant populations in Indonesia, Chapter 6 of the thesis helps to fill the vacuum. 2.4 Conclusion Patterns of Central Java s out-migration and how Central Java s migrants adapt economically and socially at the places of destination are at the core of the thesis. The aim of this chapter has been to outline relevant theories in the migration literature regarding the aggregate flows and patterns of migrants and how migrants adjust economically and socially in destinations. Based on the review of literature, improved insights can be gathered into understanding the process of migration out of Central Java. The migration literature is very wide-ranging and can be discussed from different angles. In relation to the aim of the thesis, this chapter has consisted of three main sections. Firstly, the chapter introduced the overall concept of migration that underlined the importance of location and time in defining migration. This section led to narrowing the scope of the theoretical review of the thesis to the context of internal migration. Secondly, the chapter introduced two theories in the migration literature, namely the macro and micro theories of migration. The macro theory of migration focuses on the aggregate migration flows and differences across different places while the micro theory of migration deals with migrants in relation to the characteristics, tastes and values of individuals in migration decision making. Literature on migration decision making was reviewed in order to gather 45
68 Chapter 2 information on how migrants, the group of individuals who decide to move, are different from non-migrants. Thirdly, the chapter discussed how migrants adapted and adjusted economically and socially at the place of destination. This sub-section outlined the employment outcomes and marital assimilation of migrants. The human capital of the migrants and the support role of networks were likely to influence the type of employment of migrants. The process of marital assimilation is preceded by the completion of acculturation and the integration process of assimilation. The significance of the review of both macro and micro approaches to migration lies in the importance of individuals migration outcomes in the context of the system of origindestination-specific migration. Knowledge of the aggregates of inter-provincial migration allows us to capture consistent flows of migrants from a particular region and how they distribute themselves across different places of destination over time. A multi-regional approach to migration that considers the system of origin-destination-specific migration is applied in Chapters 3 and 4 of the thesis. Specifically, Chapter 3 will discuss inter-provincial migration in Indonesia and will situate Central Java s migration in the overall context of internal migration in Indonesia. Chapter 4 will investigate the conditional probability rates of Central Java s primary, onward and return migrants. Findings from the macro approach to migration lead to questions regarding how migrants who originate from a province that consistently sends many migrants over the decades, adjust economically and culturally at the places of destination. Subsequent inquiry mostly relates to the employment outcomes and the degree of assimilation of migrants at different places of destination; these are discussed in Chapters 5 and 6 of the thesis. The role of migrant networks needs to be taken into account in relation to the choice of destination and types of employment of migrants. The presence of migrant networks at the places of destination can be measured by living arrangements of migrants at the place of destination. This indicator is used as an approach whether or not migrants rely on their families, relatives or neighbours at the host place. Other factors that contribute to the employment outcomes of migrants such as levels of education, sex, age and location are also investigated in Chapter 5 of the study. 46
69 Theoretical review With regards to marital assimilation, the degree of persistence of group boundaries between migrant groups and other groups, in particular the group of local people, reflects the degree of final adjustment of migrants at the place of destination. Ethno-migration status (province of birth) and ethnicity (ancestral origin) of Central Javanese people will be used as group boundaries in Chapter 6. Status exchange on education amongst Central Javanese people who are in inter-marriages with local people will also be tested. In summary, the thesis explores a series of topics in the migration literature. This current chapter has reviewed relevant theories related to the different topics investigated in the thesis. The theoretical framework of the thesis rests on macro and micro theory of migration in the context of internal migration. A more thorough review regarding the migration literature related to a specific topic of the thesis is provided in each analytical chapter. From a broader perspective, one can argue that the conceptual framework should not restrict itself to macro or micro approaches to migration studies, but rather seek to link analysis of migratory processes to broader socio-demographic changes and through this to the analysis of societal change in general. 47
70
71 Chapter 3 Indonesia s inter-provincial migration between 1971 and 2010: Flows, spatial concentrations and structural patterns across provinces Introduction It is widely understood in the migration literature that internal migration is an important element in population redistribution. In the context of Indonesia, inequality of population distribution across provinces has been the cause and the effect of both voluntary migration and government-assisted migration. In an effort to capture population migration, most scholars rely on information gathered from the census. Apart from the shortcoming that the census is unable to capture short-term movements, the census instrument has been the main reliable source of inter-provincial migration data over the last few decades. The census provides retrospective information on place of residence, for example, the place where the respondent lived five years before the census was conducted. Past studies that used the census as a source of data have addressed the issue of inter-provincial migration patterns, in particular, the determinants of inter-provincial migration (Lottum & Marks, 2012), spatial patterns and urban populations (Firman, 1992), volumes and directions of inter-provincial migration (Hugo, 1980, 1997, 2001), age structures of inter-provincial migration (Rogers et al., 2007; Rogers et al., 2004) and inter-provincial migration and economic inequality (Hill, Resosudarmo, & Vidyattama, 2009). However, little is known about the regional concentration of provincial migration flows and their structural patterns over roughly the 40-year period between 1971 and There is an urgent need to conduct empirical analysis on inter-provincial migrations over the 40 years for three fundamental reasons. Firstly, an understanding of the structural patterns of inter-provincial migration flows is useful in analysing past migration trajectories and settlement patterns that have evolved over time (Rogers & Raymer, 1998). Secondly, information about inter-provincial migration is important for the basis of projecting future 3 This chapter was presented in the oral session during the 8 th International Conference on Population Geographies, 30 June to 3 July 2015, The University of Queensland, Brisbane, Australia, and in the poster session during the 2014 Population Association of America (PAA) Annual Meeting, 1 to 3 May 2014, Boston, US. 49
72 Chapter 3 patterns of inter-provincial migration (Raymer, Bonaguidi & Valentini, 2006). Thirdly, knowledge of provincial in- and out-migration flows through the origin-destination-specific migration patterns is crucial for understanding regional population changes (Fan, 2005; He & Pooler, 2002; Plane & Mulligan, 1997). This chapter adds to past studies on interprovincial migration patterns by investigating in- and out-migration flows, spatial migration concentrations and provincial connectedness utilising five Indonesian decennial population censuses. For many Indonesians, crossing provincial boundaries has been part of a building migration history. Official statistics report that in 1971 there were 5.8 million lifetime migrants, that is, people who lived in a province outside their province of birth, with the number reaching 28 million in 2010 (BPS, 2013). This figure was equal to 12 per cent of the total population in Meanwhile, the number of persons who lived in a province different from that in which they lived five years before was 3.7 million in This had increased to 5.39 million by This group of people is often called recent migrants. In both types of migrations, Central Java is the leading source of inter-provincial migrants. As a nation, Indonesia is diverse in terms of regional variations of inter-provincial migration flows. Interesting patterns of inter-provincial migration are indicated by the large numbers of inter-provincial migrants across the archipelago. Also interesting is how the sexes contribute to the overall migration patterns. The aim of this chapter is to answer the first research question of the thesis on the overall patterns of inter-provincial migration in Indonesia and how Central Java, as the main source of migrants, is situated in the overall picture. Specifically, the research questions of the chapter are: 1. What are the inter-provincial migration patterns over time? 2. How do the patterns of spatial concentration change across time? 3. What are the structural patterns across provinces? A full set of Indonesian population censuses is utilised in the study. The term recent migrant is used in this study to describe a person who lived in a province different from that in which he or she lived five years before each census. The unit of analysis excludes people aged below five years old and those who lived abroad. 50
73 Indonesia s inter-provincial migration The chapter is structured as follows. I begin by outlining the importance and the aim of the study. In section two, I describe the background of the study and past research that has been conducted in this field before describing the data sources in section three. I discuss the in- and out-migration rates in section four. In section five, I analyse the spatial concentration of inter-provincial migration flows, provinces as redistributors of population and gendered concentration in inter-provincial migration flows. I outline the structural patterns of inter-provincial migration flows in section six. The last section of the chapter provides concluding remarks of the analysis. 3.2 Background Interest in inter-provincial migration has been raised partly because of the considerable unevenness in population distribution across provinces in Indonesia. Statistics showing the unevenness in population distribution are exhibited in Table 3.1 below. The upper panel shows inequality across islands (A) while the bottom panel shows inequality of provinces inside Java (B). It can clearly be seen that the area of Java is the smallest compared to the rest of the islands in Indonesia but has the highest proportion of population. The population density of Java reached 1,000 persons per square kilometre in The population density of Java is nearly ten times higher than the national average. In comparison, Kalimantan constitutes nearly one third of the overall area of Indonesia but is inhabited by less than 6 per cent of the population. This leads to a population density of 25 persons per square kilometre. 51
74 Chapter 3 Table 3.1 Area, population and population density by islands in Indonesia, 2010 Proportion of area (%) Population (%) Population density (person per square km) A. By Island Java , Sumatra Kalimantan Sulawesi Other islands Indonesia as total B. By province in Java DKI Jakarta , West Java , Central Java DI Yogyakarta , East Java Banten , Source: BPS, various publications. Based on the 2010 population census, there are six provinces in Java Island, with the capital city of Indonesia, Jakarta, being one of the provinces. As expected for a major city, the land area of Jakarta is small but its population density is high at 14,469 people per square kilometre. In contrast, East Java, the province with the largest geographic area, has the lowest population density. The population density of Central Java, the province of interest to this thesis, is 987 people per square kilometre. The huge difference between Jakarta and other provinces within Java Island or provinces on other islands can be explained by two factors. Firstly, Jakarta has a long history as the centre for trade and government in Indonesia (Nitisastro, 1970; Pelzer, 1945; Raffles, 1988). Secondly, its role as the centre of national economic activities continuously attracts people to move to Jakarta (Firman, 1999; McDonald et al., 2013). As the capital city of the nation, Jakarta and its fringe areas were given privileges by the Indonesian government, in particular during the Soeharto era in terms of investment and budget allocation. This continued even after the system of administration changed to decentralisation in early The role of Jakarta and its surrounding regions as the centre of national economic activity and employment opportunities is very evident. Nearly 60 per cent of the total GDP of Indonesia is contributed by the six provinces in Java (mostly concentrated in Jakarta and its peripheral regions) while the other 40 per cent comes from the 27 provinces located outside Java (BPS, 2013). A great number of people, in particular 52
75 Indonesia s inter-provincial migration the young, migrate to Jakarta in search of employment and this reflects the disparity of employment opportunities between Jakarta and its periphery and the rest of Indonesia. Thus, it is obvious that inequality in employment opportunities is related to unevenness in population distribution across provinces in Indonesia. Unequal population distribution across provinces in Indonesia is partly the result of people leaving and entering provinces. Based on the 2010 population census, it can be noted that the main source of inter-provincial migrants is Central Java province; 7 million people who were born in Central Java lived outside the province while the figure was 900 thousand for recent migrants (BPS, 2013). In terms of the provinces that are the largest recipients of inmigrants, Jakarta and West Java are the most popular destinations for all migrants including Central Java s migrants. In total, these two provinces have attracted nine million lifetime migrants and two million recent migrants. Meanwhile in- and out-migrations for the rest of the provinces are relatively small. There have been numerous studies on the flows, spatial concentrations and structural patterns of inter-regional migration in developed nations (He & Pooler, 2002; Plane & Mulligan, 1997; Raymer et al., 2011; Rogers et al., 2004; Rogers & Sweeney, 1998; Salzmann, Edmonston & Raymer, 2010; Yu et al., 2011). Past studies have suggested that the unevenness of regional economies influences the rates of in- and out-migrations and regional concentration of migrants. They have shown how age and race play crucial roles in forming migrant-concentrated regions. They also show how connectedness between origin and destination can be traced from the migration patterns. This chapter extends past research in the developed nations by investigating flows, spatial concentration and structural patterns in the context of Indonesia. This chapter adds to the migration literature by showing patterns and changes of Indonesian inter-provincial migration over 40 years. Past studies have tended to overlook the importance of the sex of movers on the structural patterns of inter-provincial migration. This study enriches the literature by adding this variable into the analysis. More broadly speaking, it can be said that migration is related to people and place. Variation across places could contribute to different patterns of in- and out-migrations. Indonesia is no exception. Thus section 3.4 will discuss in detail the in- and out-migration 53
76 Chapter 3 patterns in Indonesia from 1971 until Beforehand, an overview of the data sources used in the analysis along with the scope and concepts used in this chapter, is discussed in section Data This chapter uses five consecutive Indonesian population censuses: the 1971, 1980, 1990, 2000 and 2010 censuses. For the first three censuses, the data enumeration was conducted by sample, that is, the three censuses are sample censuses. In 2000, the Indonesian population census enumerated the whole population for the first time. This procedure then continued for the 2010 census. With regards to the concept of migration used in this chapter, data on migration can be captured by looking at the difference between the place of residence five years before each census and the place of residence during the census. An individual is classified as a recent migrant if his or her place of residence five years prior to the census is different from his or her place of residence during the census. Later in this chapter, this group of persons is referred to solely as migrants. Another important factor that needs to be discussed is the changes in the provincial coverage and boundaries at successive censuses. Based on the 1971 census, Indonesia had 26 provinces. In the mid-1970s with the annexation of East Timor, the number of provinces increased to 27 but this was reversed in the 1990s when the independent country of Timor Leste (formerly East Timor) was established. When the economic crisis hit Indonesia at the end of the 1990s, the new order regime that ruled Indonesia for more than 30 years collapsed and was replaced by a new form of governance, namely the reform government. In this phase, the system of government changed from centralisation to decentralisation. The broad concept of decentralisation is to give local governments wider authority and responsibility to manage and utilise their own resources (see Bardhan & Mookherjee, 2006; Bird & Vaillancourt, 2008; Hadiz, 2004). This process induced several large provinces to split up into two provinces: the old province and a newly-named province. This meant that by 2010, seven new provinces had come into being, as shown in Table 3.2 below. 54
77 Indonesia s inter-provincial migration Table 3.2 List of new provinces and date of splitting, up until 2010 No. New province Capital city Old province Date Rank 1 North Maluku Ternate Maluku 4 October, Banten Serang West Java 17 October, Bangka Belitung Pangkal Pinang South Sumatra 4 December, Island 4 Gorontalo Gorontalo North Sulawesi 22 December, West Papua Manokwari Papua 21 November, Riau Islands Tanjung Riau 25 October, Pinang 7 West Sulawesi Mamuju South Sulawesi 5 October, As a consequence, the number of provinces found in the five censuses is not the same. In most of the analysis within this chapter, these seven new provinces are grouped into their old provinces. Moreover, since East Timor was under Indonesian sovereignty only for a part of the analysis period, it is excluded from the analysis. For particular sections in the current chapter, however, the seven new provinces are not grouped into their old provinces in order to observe patterns of migrations before and after the provinces split up. It is worthwhile to mention here that the coverage of migration considered in the analysis is all movements that occurred within the territory of Indonesia. Thereby, persons who lived overseas during the five years before the census or during the census are not included in the analysis. The chapter also excludes persons aged below five years old at each census. In addition, it is important to mention that for Irian Java (Papua) Province the 1971 census covers only urban areas. Migration data from the Indonesian censuses are only capable of capturing long term movements. Thus, information on non-permanent migration is missed. Also, migration data from the census are only available to the district (kabupaten/kota) level. Movement across villages or sub-districts within a district is not recorded. The above factors influence the coverage of migration data from the census. The 2010 Indonesian Census Post Enumeration Survey did not examine the accuracy of statement for the migration question, thus it is difficult to make definitive statements about how accurately respondents report migration history. 55
78 Chapter Patterns of inter-provincial migration flows To put migration into the context of Indonesia as a whole, this section provides information on Indonesian inter-provincial lifetime migration flows. Statistics show that during the period, the total number of inter-provincial migrants increased more than twofold from 2.1 million migrants at the 1971 Census to 5 million migrants in Every province has different levels of in- and out-migration. Most provinces in Java, along with several big provinces in Sumatra, experienced high volumes of inter-provincial migration. In 1971, Jakarta absorbed the most migrants across the country, accounting for 28 per cent. In the following census period, Jakarta remained the main destination for migrants. The proportion of migrants to Jakarta reduced slightly by 1990, when 900 thousand migrants were found in this province. The proportional decrease can be explained by the high cost of land in Jakarta, which induced movement of people who maintained their activities in Jakarta to West Java province on the outskirts of Jakarta. This conclusion is supported by the increase in the number of migrants to West Java. The number of migrants in West Java rose from 200 thousand in 1971 to almost half a million in As mentioned in the migration literature, regions with high in-migration tend to experience high out-migration. Jakarta and West Java are not exceptions. For instance, West Java was the source of a large number of migrants, translating into 20 per cent of Indonesia s outmigrants in The proportion of out-migrants from this province had increased to 26 per cent by Table 3.3 shows in- and out-migration rates, per thousand people, for all provinces in Indonesia from the 1971 until the 2010 census. Before turning to the analysis, it is worthwhile to mention here that the in- and out-migration rates are calculated by dividing the total number of in- and out-migrants for each province by the mid-year population of the province. Following Moultrie et al. (2013, p. 83), the population of the middle year is estimated by using a simple interpolation method. The national rate for inter-provincial migration was 19.6 per thousand people in 1971 and this consistently increased to 31.7 in 1990 but declined to 22.4 in It is observed from 56
79 Indonesia s inter-provincial migration Table 3.3 that in 1971, except for Jakarta, all provinces in Java experienced negative net migration rates, translating into more people leaving than entering the provinces. West Java and Central Java experienced the highest loss of population. Most of the out-migrants from these provinces actually migrated to Jakarta. For instance, 70 per cent of migrants found in Jakarta originated from West Java and the associated figure was 12 per cent for Central Java. A continuous flow of migrants entering Jakarta increased the level of population density of the province. In 1971, the population density was six thousand people per square kilometre. The figure had increased twofold by 2010, to around 14 thousand people per square kilometre. Other provinces with substantial in-migration included Riau, East Kalimantan and Central Kalimantan, all provinces where considerable economic investment in manufacturing (Batam, Riau), mining (East Kalimantan) and plantations (Central Kalimantan) led to expansion of employment opportunities. In the case of Riau, there were more than half a million migrants in the province in the year The overall inter-provincial migration flows decreased slightly between 2000 and 2010 from 5.08 million to 4.96 million, respectively. The substantial net in-migration to Jakarta observed for the earlier two censuses reversed from the 1990 census onwards with more people leaving Jakarta than entering. From the late 1980s onwards, reflecting land prices, new industry - particularly factories - and new housing was located increasingly outside the Jakarta boundary in the neighbouring districts. The number of migrants coming to the province fell to only 600 thousand at the 2000 Census and remained the same in Accordingly, West Java, the province bounding Jakarta, became the largest recipient of migrants across the country, accounting for 1.4 million in-migrants in the year While the rates of net migration in 2010 were highest in Riau, Central Kalimantan and East Kalimantan, West Java remained as the leading numerical recipient of migrants. 57
80 Chapter 3 Table 3.3 Five-year inter-provincial migration rates of Indonesia, (per 1,000 persons) 56 Year Province Abbrev In Out In Out In Out In Out In Out DI Aceh DIC North Sumatra SMU West Sumatra SMB Riau R Jambi J South Sumatra SMS Bengkulu BE Lampung L DKI Jakarta DKI West Java JB Central Java JTE DI Yogyakarta DIJ East Java JT Bali B West Nusa Tenggara NTB East Nusa Tenggara NTT West Kalimantan KB Central Kalimantan KTE South Kalimantan KS East Kalimantan KT North Sulawesi SLU Central Sulawesi SLTE South Sulawesi SLS Southeast Sulawesi SLTG Maluku M Papua P
81 Indonesia s inter-provincial migration It is important to underline here that the reduction in the number of migrants found in Jakarta does not mean that the attractiveness of Jakarta as the main destination for migrants has declined. Rather, it is due to the fact that many Jakarta residents shifted their housing to the districts surrounding Jakarta such as Bogor, Depok and Bekasi, districts under West Java administration, and Tangerang, previously a district of West Java but by 2010, part of the new province of Banten. This can be explained by the high cost of housing in Jakarta. Millions of people now carry out their daily activities in Jakarta and return to West Java on a daily basis. Because the border between Jakarta and their regions is not clearly evident, many of these people see themselves as Jakarta residents even though they are officially registered as West Java residents. In relation to the number of people who commute on a daily basis and their mode of transportation, a study conducted by the Ministry of Economic Affairs of Republic of Indonesia with the Japan International Cooperation Agency (JICA) reported that, in 2011, 3.7 million people commuted into Jakarta every day (JICA & RI, 2012). Along with its own population, the number of day time individuals in Jakarta was not less than 13 million people. The majority of commuters used motorcycles as their mode of transportation. The report also reveals a remarkable increase in the number of vehicles. By 2011, there were 13.3 million vehicles found in Jakarta Metropolitan Region (JMR), increasing from 11.4 million vehicles in Out of 13.3 million vehicles, 9.9 million were motorcycles. This finding is in line with Hugo s (2001) argument that an increase in the number of commuters leads to an increasing number of private transportation modes, such as motorcycles. With regards to Central Java migration patterns, it can be seen from Table 3.3 that, over the 40 years of analysis, Central Java s out-migration rates are larger than the other to large provinces in Java, West Java and East Java. Accordingly, Central Java sent the highest number of out-migrants in 2000 and 2010, accounting for 1.02 million and 980 thousand migrants, respectively. At the same time, much smaller numbers migrated to Central Java; 300 thousand and 200 thousand in-migrants in the same years, respectively. This pattern of high net out-migration has occurred over many decades in Central Java. From a push-pull perspective, this suggests that there are few factors that prevent Central Java people from leaving the province and, likewise, few factors that attract migrants from other provinces or 59
82 Chapter 3 potential returnees to enter Central Java. This underlines the importance of investigating patterns of places of destination, age and sex structures of Central Java s migrants, and their migration outcomes and acculturation processes in the provinces of destination. These questions are addressed in the following chapters of the thesis. The in- and out-migration rates of all provinces for the periods are compared in graphs as shown in Figure 3.1 below. The x-axis represents the out-migration rate and the y-axis the in-migration rate. The diagonal line denotes levels of in- and out-migration rates that are the same. In other words, provinces that fall under this line have negative net migration rates. In 1971, there were two provinces that had zero net migration rates, namely West Sumatra (SMB) and Bali (B). West Nusa Tenggara (NTB) also had a zero net migration rate in In 1980, however, none of the provinces fell precisely on the diagonal line. In all years, most provinces are grouped in the lower left part of each graph, indicating low levels of both in- and out-migration rates. Looking further into the first three graphs (1971, 1980 and 1990), it can be seen that each graph has a unique pattern that is different from the others. In 1971, only the transmigration province of Lampung (L) and Jakarta (DKI) deviated far from the diagonal, both displaying high net in-migration rates. Deviations from the diagonal were much more evident in 1980 mainly reflecting the extension during the 1970s of transmigration to provinces other than Lampung such as Jambi (J), Bengkulu (BE) and Central Sulawesi (SLTE), but also movement to the mining industry in East Kalimantan (KT). By 1990, Lampung was no longer a major destination and Jakarta had become a province with net out-migration. Also in 1990, the pattern of movement to economic development provinces such as Kalimantan Tengah (KTE), East Kalimantan (KT) and Riau (R) had emerged and this pattern continues to 2000 and Despite the fact that the 1971 and 1990 graphs show a clear pattern, most of the provinces in 1990 laid on the left bottom panel of the diagonal line, while the opposite is shown for In contrast, a quite dispersed pattern is found in 1980 and more provinces were found far from the diagonal line. Besides Jakarta (DKI), Lampung (L) and East Kalimantan (KTE), there were some other provinces that are located quite some distance from the diagonal line; among them were Bengkulu (BE) and Central Sulawesi (SLTE). 60
83 Indonesia s inter-provincial migration When the graphs of 2000 and 2010 are compared, it can be seen that, for 2010, the pattern is more concentrated than it is for In other words, the pattern of in- and outmigration rates of provinces in 2000 was more diverse and a lot more provinces deviated from the diagonal line. In 2000, there were several provinces that were located quite far from the diagonal line; among them were Jakarta (DKI), East Kalimantan (KT), Central Kalimantan (KTE) and Riau (R). A decade later, a lesser number of provinces deviated far from the line; among them were Riau (R) and Central Kalimantan (KTE). In both 2000 and 2010, Yogyakarta (DIJ) emerges as a notable province of in-migration. This presumably reflects the development of Yogyakarta as a major centre for tertiary education. When the coefficient of correlation between in- and out-migration rates in a given year is calculated, strong positive relationships are found in 1971, 1990 and 2010, with the coefficient being 0.66, 0.58 and 0.48 respectively. There was no significant relationship between the in- and out-migration rates in 1980 and Thus, the theory that in- and out-migration rates will be positively correlated is confirmed only for certain years. However, as the rates relate only to the five-year period preceding each census, not all years are covered and there may be lags involved. This relationship will be considered further in the next section. This finding is supported by earlier work by Mantra (1984) and Mantra and Sukamto (1984). Both these studies found that, in the 1971 census, the pattern of migration was dominated by the flow of people between Java and Sumatra islands. In the 1980 census, however, there was a substantial change in the pattern of inter-island migration because the percentage of people who were coming and or entering Java or Sumatra islands had decreased. At the same time, there had been a significant increase in the number of migrants found in Sulawesi. Going further into details, Mantra (1984) and Mantra and Sukamto (1984) found that, at the provincial levels, there were only two provinces that gained a substantial number of in-migrants in the 1971 and in the 1980 censuses: Jakarta and Lampung. Also, due to its closeness to Java, many voluntary migrants entered Lampung. Mantra (1984) and Mantra and Sukamto (1984) also noted that both in the 1971 and the 1980 censuses, Central Java had been the main source of migrants both transmigrants and voluntary migrants. 61
84 Chapter Figure 3.1 In-migration (vertical) and out-migration (horizontal) rates for provinces of Indonesia, (per 1,000 persons) DKI L J R BE SMB PKTE SLTG SLUKS KTSLTE DIJ SMS NTB NTTKB B DIC SLS SMU JTE JBM JT L KT SLTE BE J KTE R SMS SLTG M DIJ P KS SMB DICSLU KB JB B NTT NTBSMU JTSLS JTE DKI KTE SLTG DIJ JB SLTE P ML KSSMS SMB NTT NTB KB DICB JT SLU SLS SMU JTE BE R J KT DKI Inmig_1971 y Inmig_1980 y Inmig_1990 y R KTE SLTG KT BE J DIJ JB SLTE P B KS KB NTB SLU LSMS NTTSLS SMU JTE JT M DIC SMB DKI R KT KTE DIJ P J BJB DIC SLU SMS SLTE BESLTG KS SMB M NTB KB JT NTT LSLSSMU JTE DKI Inmig_2000 y Inmig_2010 y
85 Indonesia s inter-provincial migration To sum up, Figure 3.1 shows that patterns of in- and out-migration rates vary across time periods. Over decades, the position of Jakarta (DKI) has consistently shifted from the upper left to the bottom right of each graph, indicating a reduction in the number of inmigrants while at the same time an increasing number of out-migrants. As mentioned earlier, a reduction in the number of migrants coming to Jakarta does not mean that fewer people were attracted to the JMR. Rather, the number of people who work and study in JMR has increased consistently but many live in peripheral regions that are close to Jakarta and have lower land prices. Not all are commuters to Jakarta, however, as industry, particularly manufacturing industry, has developed outside the boundary of Jakarta. Those who are commuters can maintain their activities in Jakarta while returning to their homes outside Jakarta every evening. People commute using a variety of transportation modes as supported by the study of JICA & RI (2012) and by Hugo (2001). This explains why the day time population of Jakarta is far higher than the resident population of Jakarta. Variable rates of in-migration were observed for the provinces that were targets for transmigration as policy on transmigration destinations changed. A few provinces that experienced economic development had a consistently high in-migration rate: Riau (R), Central Kalimatan (KTE) and East Kalimantan (KT). For the two provinces in Kalimantan, employment increased as a result of investment in timber, palm oil plantations, coal mining and other minerals. Riau Province in this analysis is a combination of two 2010 provinces, Riau and Riau Islands. The latter, which is very close to Singapore, experienced economic gain from the formation of the economic zone between the province and its neighbouring countries. 3.5 Investigating spatial concentration of inter-provincial migration flows The previous section has shown that the volume of in- and out-migrations varied substantially across provinces during the time periods. It has also been demonstrated that some provinces experienced high in- and/or out-migration rates over time and have become the largest recipients of in-migrants and/or the main source of outmigrants across provinces. In short, it can be said that some provinces had high concentrations of in-migrants and some others had high concentrations of out-migrants. 63
86 Chapter A Coefficient of Variation (CV) measure of spatial concentration Plane and Mulligan (1997) proposed that a spatial concentration is defined as the inequality that exists in the relative volume of a set of origin-destination-specific migration flows which occurs due to differences in terms of population size, level of development and distance. A year later, Rogers and Sweeney (1998) stated that a concept of spatial concentration of inter-regional migration flows can provide a picture of geographical concentrations. Related to the current study, spatial concentration of inter-provincial migrations can be translated into how migrant populations originating from different provinces distribute themselves across destination provinces. In addition to this, spatial concentration can also be treated as a tool to investigate whether or not migrants came from more diverse origins and moved to more concentrated destinations, or the reverse. The fundamental issue relating to measuring the spatial concentration of inter-regional migration flows is that there is no widely accepted tool to measure the concentration (Rogers & Raymer, 1998; Rogers & Sweeney, 1998). Tools that had been used to measure spatial concentration in the empirical literature to characterise the spatial focus of geographical movements are not truly spatial (Yu et al., 2011). Previous studies have used many alternative tools to measure spatial concentration, ranging from very simple to more comprehensive techniques. Not long ago, Plane and Mulligan (1997) used the Gini Index to measure spatial concentration of US inter-state migration flows. They argued that the concentration is a reflection of inequality in population redistribution. Thus, measuring inequality in migration can be treated the same way as measuring inequality in income distributions, and the Gini Index is the most appropriate tool to measure inequality. A year later, Rogers and Sweeney (1998) also measured spatial concentration of US inter-state migration flows employing the Coefficient of Variation (CV) as the analysis tool. In their study, they compared the Gini Index and CV in measuring the spatial concentration of inter-regional migration flows and came to the conclusion that CV was better than Gini. They considered CV as a viable, simpler and more transparent alternative tool to measure spatial concentration. This finding is enhanced by the work of Rogers and Raymer (1998). In their study, they examined four alternative spatial concentration tools and applied all these tools to US inter-state migration flows. They also produced the same conclusion that CV was the most appropriate tool to measure spatial concentrations, especially in places that have primate provinces. 64
87 Indonesia s inter-provincial migration Based on the conclusions of Rogers and Sweeney (1998), the current study will use CV in its analysis. The CV measures the variability of a series of numbers independent of the unit of measurement used for these numbers. Statistically, CV is defined as the ratio of the standard deviation associated with each region s outflows (inflows) and the corresponding average flow value. It can be expressed in the following equation: where is the Coefficient of Variation index for province, is the number of migrants from province to province, is the mean of the total number of migrants from each province, and is the number of provinces involved in the calculation. The value of CV depends on the distribution of the data; the more homogenous the movement, the smaller the value of CV. With regards to the study, distribution of the data refers to the amount of in- and out-migration across provinces. If a particular province receives a huge number of in-migrants while the rest of the provinces only receive a moderate or even a small number of in-migrants, it is likely that the CV value of inmigration is quite high, because a greater proportion of in-migrants is concentrated in one province. The same story is also applicable for out-migration. In short, high values of CV, either for in- or out-migration, translate into a more regionally-concentrated distribution of migration flows. The opposite is true when the CV values of in- or out-migration are low. To put this into perspective, assume that a province has a lower CV value of in-migration than its CV value of out-migration. This means that the origins of its migrants are less concentrated than the destinations of its out-migrants. It can be said that migrants who enter the province come from a greater number of origins while migrants who left the province go to a lesser number of destinations. This also implies that the origins of its migrants are uniform across the provinces whilst the destinations of its migrants are converging. Whether or not the value of CV is high can only be determined by comparing the CV value of one province to the CV value for another province. There are no objective cut-off points for the CV value that can be used to interpret the level of spatial concentration. The average value of the CV can also be used as an indirect benchmark showing whether or not the CV value of a particular province is higher or lower than the average CV value. 65
88 Chapter 3 Despite the fact that CV depends highly on the distribution of the data, it is possible to estimate the interval value for CV. The interval values are related to the number of observations. For instance, there are 26 provinces observed in this study. Consider two extreme situations. If all provinces have the same numbers for in- or out-migration rates, the CV value would be zero, accounting for homogeneity of the data. On the other hand, if all in- or out-migration rates are pooled into one province, while the rest of the provinces have zero in- or out-migrations between each other, the value of CV will be five. Thus, it can be expected that the interval value of CV lies in between zero and five. Since it is possible to investigate the changes of in- and out-migration across time, the CV values for both in- and out-migrations could also demonstrate whether or not spatial concentrations of in- and out-migration are diverging or converging. An aggregate system-wide index (ACV) is calculated by taking into account a weighted summation of regional outflow CVs (or inflow CVs) in which the weights reflect the relative sizes of the total regional flows that are being summed (Rogers & Sweeney, 1998). Technically speaking, the weighted out-migration ACV and the weighted in-migration ACV are calculated separately for each census. The value of the system-wide ACV is a total of the weighted out-migration ACV and the weighted in-migration ACV CV values for in- and out-migration rates Table 3.4 exhibits the weighted CV field indices for both in- and out-migration over the five censuses. The change of the system-wide ACV from one year to another year is determined by the change of the out-migration ACV and in-migration ACV for the same years. As an illustration, from 1971 to 1980, the system-wide ACV experienced a very slight decrease as the net result of a decline in value for the out-migration ACV whilst the inmigration ACV increased in value. Thus, during that particular period of time, the decline of the value of system-wide ACV was influenced a little more by the value of the outmigration ACV. On this logic, it can be seen that the overall inter-provincial migration flows increased from 1980 to 2000, translating into a greater spatial concentration of migration flow. The increases in the system-wide ACVs were caused by increases in the out-migration CV field 66
89 Indonesia s inter-provincial migration indices, while the in-migration field indices fell by a smaller amount. Overall, this means that, across the years 1980 to 2000, migrants increasingly came from a larger number of origins. Provincial concentration of migration flows for the whole migration system decreased slightly in 2010 due mainly to the reduction in the out-migration ACV. The inmigration ACV, at the same time, experienced a moderate increase. This situation indicates that in-migrants were being drawn from a lesser number of origins while out-migrants had more diverse destination choices. Table 3.4 ACV field indices of inter-provincial migration Year Out-migration ACV In-migration ACV System-wide ACV The CV values of in- and out-migration for all provinces from 1971 to 2010 are set out in Table 3.5. In 1971, all provinces in Java (Jakarta, West Java, Central Java and DI Yogyakarta) had CV values for out-migration above the mean except for East Java (1.58). This means that these provinces had more concentrated destinations for their out-migrants. The highest CV value for out-migration is found in Central Kalimantan (3.47). In contrast, South Sulawesi has the lowest CV value for out-migration, indicating a diversity of destinations. Out of 26 provinces, there were 15 provinces that had CV values for outmigration below the mean point. In 1980, the pattern of CV values for out-migration was quite similar to 1971 except that the CV values for many provinces decreased. During this period, only eight provinces experienced an increase in the out-migration CV values, meaning that the destinations for each of these eight provinces became more concentrated. A different pattern was found in 1990 in which the CV values for out-migration for six provinces experienced an increase while the rest of the provinces experienced a decrease. DI Aceh and DKI Jakarta were the only two provinces that exhibited a persistent increase of the CV values for out-migration over 1971 to Thus, it can be said that over the 67
90 Chapter 3 periods of analysis to 1990, spatial concentration of destination choices made by outmigrants from these two provinces became more concentrated. In 2000, Jakarta experienced the highest CV value for out-migration, 3.75, probably reflecting a concentrated movement to West Java, while the other two provinces in Java also exhibited high CV values, namely West and Central Java (2.25 and 2.13 respectively). North Sumatra, a province in the northern part of Sumatra Island, also had a high CV value, In contrast, East Nusa Tenggara had the lowest CV value for out-migration. The CV value of East Nusa Tenggara was less than one, reflecting a diversity of destinations for out-migrants from this province. The wide variation between the highest and the lowest CV values for out-migration can be interpreted as indicating a high variation in the number of destinations. Among 26 provinces in the analysis, sixteen provinces had CV values below the average. Over the decade to 2010, the average CV values for out-migration were slightly reduced but the overall pattern of the CV values remained. In 2010, the CV value of South Sulawesi was constant at the level of 1.63, slightly lower than the average value. There are seven provinces that have a CV value for out-migration far above the average, namely DI Aceh (2.02), North Sumatra (2.65), Jakarta (3.55), West Java (2.05), Central Java (2.00), Central Kalimantan (2.63), and East Kalimantan (2.16). In terms of CV values for in-migration, there were three provinces in 1971 with CV values for in-migration that were much greater than the average, namely Bengkulu (3.37), Central Kalimantan (3.19) and Southeast Sulawesi (3.00). This means that the origins of in-migrants found in these provinces are concentrated. In other words, these three provinces draw migrants from a relatively smaller number of origins. Jakarta, West Java and DI Yogyakarta also had CV values greater than the mean point. In 1980, half of the total provinces had an increase in the CV values for in-migration, while the other half experienced a decrease in the CV values. Moving towards 1990, only six provinces experienced an increase in the CV values for in-migration. Among the six provinces, West Java, Bali and Maluku experienced a continuous increase in their CV values from
91 Indonesia s inter-provincial migration In 2000, Southeast Sulawesi, East Java and Bali stood out as the provinces with the three highest in-migration CV values, being 2.83, 2.69, and 2.62, respectively. In contrast, the lowest CV value for in-migration, denoting high diversity of origins, was for South Sulawesi with a value of value of less than one point. This may reflect return migration as South Sulawesi also had high diversity of destinations for out-migration. The Bugis people of South Sulawesi are well known for migration to provinces across Indonesia. An interesting finding was an increase in the overall average of the in-migration CV value during the period (from 1.83 to 1.86), while at the same time the standard deviation decreased. This finding is important because in the previous year, none of the average CVs experienced an increase. Based on this fact, it can be said that, overall, the CV value for in-migration is getting larger, translating into less diversity of origins of inmigrants. In 2010, there were 18 provinces that had an increase in their CV values for in-migration with Central Kalimantan having the highest increase. Meanwhile, the highest CV values for in-migration were found to be in Bali and DI Aceh, corresponding to 2.85 and These figures indicate that the origins of in-migrants for these two provinces are concentrated upon particular origins. In contrast, the CV value for in-migration of South Sumatra was 1.05, the lowest value across the provinces. This means the origins of in-migrants to South Sumatra are much more diverse than the rest of the provinces. 69
92 Chapter 3 68 Table 3.5 CV field indices for out- and in-migration flows for provinces of Indonesia, Province Abbrev Out In Out In Out In Out In Out In DI Aceh DIC North Sumatra SMU West Sumatra SMB Riau R Jambi J South Sumatra SMS Bengkulu BE Lampung L DKI Jakarta DKI West Java JB Central Java JTE DI Yogyakarta DIJ East Java JT Bali B West Nusa Tenggara NTB East Nusa Tenggara NTT West Kalimantan KB Central Kalimantan KTE South Kalimantan KS East Kalimantan KT North Sulawesi SLU Central Sulawesi SLTE South Sulawesi SLS Southeast Sulawesi SLTG Maluku M Papua P Mean Standard Deviation
93 Indonesia s inter-provincial migration I have also sorted the provincial CV values for in-migration and out-migration from the highest to the lowest and created a graphical layout of them as shown in Figure 3.2. By doing so, one can easily discern the provinces that consistently had high CV values in both 1971 and Figure 3.2 provides two graphs on provincial CV values for in- and outmigration for two periods, 1971 and 2010 (the provincial CV values for in- and outmigrations for the complete series of five censuses can be found in the appendix). It is observed that, between 1971 and 2010, the CV values for in-migration decreased, translating into more diversity of origins for in-migrants. Among all provinces, it is DI Aceh (DIC) that consistently had a high CV value for in-migration. Thus, it can be said that DI Aceh (DIC) consistently drew its in-migrants from a few selected origins. In broad terms, provinces tended to maintain similar rankings for the diversity of their in-migrants from 1971 to However, Bali (B) stands out as having undergone major change with a considerable diversity of the origins of its in-migrants in 1971, but, in 2010 the origins of the in-migrants had become highly concentrated. The mean of CV values for out-migration decreases between 1971 and 2010 but, in sharp contrast, Jakarta experienced a strong increase in the CV value for out-migration and stood out as the province with the highest CV value for out-migration in This reflects the movement of people to the districts surrounding Jakarta, here encapsulated as movement to one destination, West Java. When the CV values for out-migration are compared with the CV values for in-migration, it can be said that the two values decreased over time, but the decrease in the CV for out-migration was higher than the CV values for in-migration. Thus, the destinations for out-migrants became more concentrated than the origins of inmigrants. This implies that, between 1971 and 2010, potential migrants had fewer viable options in terms of possible destinations, perhaps because of the lack of engagement of the government in the movement of people in the five years prior to 2010 and also because of the concentration of in-migration upon a few rapidly developing provinces. Central Java, on the other hand, as Indonesia s main source of migrants, had a relatively high outmigration CV value in both 1971 and 2000, indicating that the choices of destination of migrants originating from Central Java were less diverse than for Indonesia as a whole. A possible hypothesis here is that migrants from Central Java were less well educated on average than migrants from other provinces, meaning that they had fewer choices. 71

94 Chapter 3 Figure 3.2 The provincials CV values for in- and out-migration, 1971 and 2010 CV values for in-migration, 1971 CV values for in-migration 2010 CV values for out-migration, 1971 CV values for out-migration 2010 One major challenge of measuring spatial concentrations in Indonesia after 2000 is the changes in geographical boundaries. A small change in the provincial boundaries can have a large impact on the CV values both for the province itself and also for the rest of the regions. Between 1990 and 2010, seven new provinces were created by splitting seven former provinces, four before the processing of the 2000 Census and three after. An interesting question arises as to how CV values for in- and out-migration change when the new provinces are included in the analysis. Table 3.6 exhibits the CV values for in- and out-migration in 2000 and 2010 when the new provinces are included in the analysis. Overall, the average CV value for out-migration (by including new provinces into the analysis) was higher in 2000 than it was when they were 72
95 Indonesia s inter-provincial migration combined into their origin provinces and its standard deviation was lower (check Table 3.5 as comparison). A decade later, these two figures declined. Table 3.6 CV field indices for out- and in-migration flows, Indonesia, 2000 and 2010, 33 provinces Province Abbrev Out In Out In DI Aceh DIC North Sumatra SMU West Sumatra SMB Riau R Jambi J South Sumatra SMS Bengkulu BE Lampung L Bangka Belitung Islands* KBB Riau Islands** KR DKI Jakarta DKI West Java JB Central Java JTE DI Yogyakarta DIJ East Java JT Banten* BT Bali B West Nusa Tenggara NTB East Nusa Tenggara NTT West Kalimantan KB Central Kalimantan KTE South Kalimantan KS East Kalimantan KT North Sulawesi SLU Central Sulawesi SLTE South Sulawesi SLS Southeast Sulawesi SLTG Gorontalo* G West Sulawesi** SLB Maluku M North Maluku* MU Papua P West Papua** PB Mean Standard Deviation Note: *=split before 2000 **=split after
96 Chapter 3 Bangka Belitung Islands, which used to be part of South Sumatra, had a CV value for outmigration of 1.99, higher than it was for South Sumatra (1.39) in 2000, reflecting the fact that the destination concentration of Bangka Belitung Islands was more concentrated than South Sumatra. The CV value for Bangka Belitung Islands was lower in The same is also true for South Sumatra. In terms of the CV values for in-migration, the Bangka Belitung Islands also had higher CV values than South Sumatra for both time periods, indicating a more concentrated set of origins of its migrants, probably because migrants to this economic zone are largely recruited by agents operating in a few provinces. Before splitting off, Banten was part of West Java. The CV value for out-migration of this province was much higher than it was for West Java (2.96 compared to 2.28) in With regards to the CV value for in-migration, Banten also had a higher value than for West Java (2.52 compared with 2.47). However, when Banten was pooled into West Java (check Table 3.5), West Java had a higher CV value for in-migration (2.55). The same story also applies for Gorontalo related to North Sulawesi. After splitting off from Maluku, the origins of in-migrants found in North Maluku were more concentrated in 2000 and were less concentrated in 2010 (2.30 and 1.55 respectively). In contrast, the CV value for out-migration of North Maluku was lower than Maluku in 2000, reflecting the situation where destination choice of out-migrants from Maluku was more concentrated than it was for North Maluku. Later, in 2010, there were three new provinces that had been officially formed in the previous decade, namely Riau Islands, West Sulawesi and West Papua. The CV values for in- and out-migration of Riau Islands were lower than they were for the origin province, while the opposite was the case for West Sulawesi. The situation of Riau Islands is exactly the opposite of West Sulawesi. Thus, it can be said that the origins and destinations of migrants who come to, and leave for, the Riau Islands are diverse while the origins and destinations of migrants of West Sulawesi are concentrated. West Papua had a lower CV value for out-migration but a higher CV value for in-migration, as compared with its origin province. 74
97 Indonesia s inter-provincial migration Table 3.7 shows the values of ACV for in- and out-migration for all provinces (new provinces are not grouped into their old provinces) for 2000 and It is observed that, across the decade, the system-wide ACV value increased from 4.28 to Such an increase is mostly contributed by an increase in the in-migration ACV value. Therefore, it can be said that in 2010, potential migrants may have had fewer choices in terms of possible destinations. A different picture is found if the results of Table 3.7 are compared to those (when new provinces are pooled with their old provinces) of Table 3.4. When the new provinces were grouped, the overall system-wide ACV decreased and this was due to a reduction of inmigration ACV values. However, the opposite is true when new provinces are segregated from old provinces. The overall system-wide ACV experienced an increase. Such an increase is solely contributed by the value of in-migration which increased from 2.17 to 2.32 during that period. Thus, based on these findings, one could say that separating new provinces from their origin provinces can change the overall patterns of the migration system. Based on the results of Table 3.7, however, it can be concluded that the origins of migrants are becoming more concentrated while the destinations of migrants are becoming less concentrated. Table 3.7 ACV field indices of inter-provincial migration Year Out-migration ACV In-migration ACV System-wide ACV Provinces as redistributors of population In the study of migration, provinces are seen to act as having low spatial focusing if the total number of people drawn to these provinces is the same as the total number of people leaving the places (Plane & Mulligan, 1997). Technically, provinces are defined as redistributors of population if they have CV values that lie above or below one standard deviation from the mean and are considered not to be normal (Rogers & Raymer, 1998). Provinces acting as redistributors of population can be classified into three groups: intensive, extensive and pure, whereby each classification could be distinguished as either 75
98 Chapter 3 outward or inward. A province is called an intensive redistributor of population if the province has relatively high in- and out-migration field values, while an extensive redistributor of population is the opposite. In addition, a province is called a pure outward redistributor if it receives in-migrants from relatively few provinces and sends its outmigrants to a relatively larger number of provinces. A province is then called a pure inward redistributor of population if its in-migrants come from a relatively larger number of provinces than its out-migrants. Table 3.8 exhibits provinces that were redistributors of population over the census years from 1971 to The table shows that from 1971 to 2010, the majority of provinces were normal and, hence, not redistributors of population. It is observed from Table 3.8 that in 2010 there were twelve provinces acting as redistributors of population, a slightly larger number of redistributor provinces as compared with Among all redistributor provinces in 1971, only half of them were still found in Out of these provinces, three provinces acted as intensive outward redistributors, namely DI Aceh (DIC), Southeast Sulawesi (SLTG) and West Java (JB). The first two provinces acted in the same way in 1971 but West Java (JB) was an intensive inward province in Central Kalimantan (KTE) was an intensive inward province in both 1971 and 2010 as was Jakarta (DKI). East Nusa Tenggara (NTT), West Nusa Tenggara (NTB) and East Java (JT) were extensive outward redistributors in Meanwhile Bali (B) and North Sumatra (SMU) were pure outward and inward redistributors, respectively. 76
99 Indonesia s inter-provincial migration Table 3.8 Classification of provinces that were redistributors of population, Year Classification Type Total Intensive Extensive Pure Intensive Extensive Pure Intensive Extensive Pure Intensive Extensive Pure Intensive Extensive Pure Outward Outward Outward Outward Outward Outward Outward Outward Outward Outward Outward Outward Outward Outward Outward DIC, BE, SLTE, SLTG Inward R, JB, KB, KTE SLS Inward NTT Inward DIC, JB, KTE, SLTG Inward DKI JT Inward SLU, SLS, IJ Inward NTT, KB DIC, JB, SLTG Inward DKI, KTE JT, NTT Inward SLU, SLS B Inward JB Inward DKI, KTE NTT, IJ Inward SLS DIC, JT, B, SLTG Inward SMU, KS, M DIC, JB, SLTG Inward DKI, KTE JT, NTB, NTT Inward SLU, SLS B Inward SMU It is worthwhile to mention here that during the forty years covered by the analysis, the classifications of redistributor provinces varied. In 1971, the redistributor provinces acted either as intensive outward or inward. In 1980, provinces that acted as intensive outward dominated the migration system, while in 1990 redistributor provinces were more likely to be intensive outward. An interesting feature found in 2000 was that many provinces acted as purely outward or inward redistributors of population. In 2010, however, the pattern was slightly changed. Many provinces acted either as intensive outward or extensive outward redistributors of population. 77
100 Chapter Sex concentrations of inter-provincial migration flows Interest in understanding how migration patterns are influenced by sex is chiefly derived from the fact that in developing countries, including Indonesia, women play a crucial role in migration patterns (Hugo, 2007). Factors such as culture and development could potentially hinder or motivate women to migrate. Culturally speaking, in many societies in Indonesia, women are associated with domestic activities and have responsibility for caring roles. In former times, migration patterns of women were related to family reunification. In those days, women were follower migrants. In that era, it was unlikely that women migrated alone (Hugo, 2001; McNicoll, 1968). In contemporary Indonesia, however, advancements in levels of development allow women to have wider opportunities in education and the labour force and this makes it possible for women to migrate on their own. Urban employers in manufacturing and the retail industry often prefer to hire women than men and this is also the case for domestic workers. As provinces have developed, the number of jobs in the non-agricultural labour market increased and many of these types of jobs are associated mainly with women (McDonald et al., 2010). Thus, the volume of women s migration to the more developed places increases. Another important reason for investigating migration by sex in Indonesia is related to the laws of migration proposed by Ravenstein (1885). One of the migration laws stated that there is a negative association between distance and the volume of women s migration. In other words, women tend to migrate a shorter distance than men. Table 3.9 ACV values for male and female inter-provincial migration flows, 2010 Sex Out-migration ACV In-migration ACV System-wide ACV Male Female Analysis of the concentration of inter-provincial migration flows by sex in this current chapter also employs the CV method. Table 3.9 shows the ACV values in 2010 for male and female inter-provincial migration flows. It is demonstrated that male inter-provincial migration flows show a slightly higher overall value than for females. This is due solely to the in-migration value which is somewhat higher for men than for women. In contrast, the weighted out-migration value for females was higher than it was for males. For female 78
101 Indonesia s inter-provincial migration migrants, the CV values for in- and out-migration did not differ much. These findings indicate that men came from a smaller number of origins than did women; however, the destination choices of men were greater than they were for women. The fact that destination choices for women are more selective than for men could be related to fact that women were more likely to move to a smaller number of developing provinces that offered employment opportunities for women. Next, the CV values for male and female in- and out-migration for 33 provinces in 2010 are presented in Table It is observed that there are eight provinces that have CV values for male out-migration that are equal or greater than two, and most of these provinces are located outside Java. In Java, it is only Jakarta and its neighbour Banten that have CV values for male out-migration that are greater than two, suggesting that these two provinces have a low concentration of destination choices for male out-migration compared to the other provinces in Java, probably reflecting a high level of movement across the provincial boundaries that lie within the Jakarta Metropolitan Region. On the other hand, the lowest CV value for male out-migration is also found in a province on Java Island, East Java (1.12). This indicates that destination choices of out-migrants from this province are diverse. The CVs for female inter-provincial out-migration show similar patterns to male outmigrations except for provinces within Java. Destination choices for female out-migration from West Java and Central Java are more concentrated than for males, suggesting that female migrants from these provinces have fewer choices of destination than do male migrants. In terms of in-migration flows, the patterns of female and male in-migration are the same, but on average, females in-migration flows are less diverse than the in-migration flows of males, translating into more uniform origins of female in-migration flows. To conclude, it is evident that there have been sex differentials in inter-provincial migration patterns in Indonesia. Destination choices of female migrants are smaller than those of male migrants reflecting the existence of sex preference for migrants in destinations. 79
102 Chapter 3 Table 3.10 ACV values for male and female inter-provincial migration flows, 2010 Province Abbrev. Males migration flow Females migration flow Out In Out In DI Aceh DIC North Sumatra SMU West Sumatra SMB Riau R Jambi J South Sumatra SMS Bengkulu BE Lampung L Bangka Belitung Islands KBB Riau Islands KR DKI Jakarta DKI West Java JB Central Java JTE DI Yogyakarta DIJ East Java JT Banten BT Bali B West Nusa Tenggara NTB East Nusa Tenggara NTT West Kalimantan KB Central Kalimantan KTE South Kalimantan KS East Kalimantan KT North Sulawesi SLU Central Sulawesi SLTE South Sulawesi SLS Southeast Sulawesi SLTG Gorontalo G West Sulawesi SLB Maluku M North Maluku MU Papua P West Papua PB Mean Standard Deviation Structural patterns of inter-provincial migration flows Previous studies have recognised that population movements between two specific places are influenced by distance. Ideally, the volume of migration between two places will be high if the two provinces are close to each other. If the two places are sending and receiving a 80
103 Indonesia s inter-provincial migration great number of migrants, it can be said that the two places are strongly connected. More broadly speaking, the structural pattern of migrations provides information on the connectedness across provinces with the absence of distance. The levels of connectedness between two provinces can be measured by the relative volume of in- and out-migration between the two provinces. The multiplicative components are useful in identifying the structures in the migration pattern (Raymer, Bonaguidi & Valentini, 2006). Adopted mostly from Raymer s work (Raymer et al., 2011; Raymer, Bonaguidi & Valentini, 2006; Salzmann, Edmonston & Raymer, 2010), the multiplicative component model for an origin-destination-specific table of migration flows is as follows: where is an observed flow of migration from region to. The above model consists of four components. is the total number of migrants and is noted as an overall component. There are two main effect components, namely the origin component and the destination component,, which represent the proportion of migrants from each origin and to each destination. These two main effects represent the push and pull factors from each region. The last component is a two-way interaction between a specific place of origin and place of destination, which represents the ratio of observed to expected migration. If the ratio is greater than one, there is a strong connectedness between two specific regions, and vice versa. The multiplicative component model for an origin-destination-specific table of migration flows is set out is Table To give an idea of the interpretation of the multiplicative component model, consider that there were 14,636 observed migrants coming from Aceh to North Sumatra. This number can be disaggregated into four multiplicative components: where the subscripts denote the province (1 = Aceh (DIC) and 2 = North Sumatra (SMU)). The interpretations of these components are as follows (Raymer, Bonaguidi & Valentini, 2006): The overall component was the level of the inter-provincial migration 81
104 Chapter 3 system at that time; there were 4.96 million inter-provincial migrants in Indonesia in The origin component represents the proportion of all persons in the system migrating from a particular province; 0.78 per cent of all migrants left from Aceh. The destination component represents the proportion of all persons migrating to a particular province; 2.44 per cent of all migrants went to North Sumatra. The interaction component represents the ratio of observed to expected flows; on average there were 15 observed migrants for each one expected migrant. This component reflects the connectedness between these two provinces. Since the ratio is much greater than one it can be said that Aceh and North Sumatra, two neighbouring provinces, were much more connected than would otherwise be expected. In addition, if the opposite flow of migrants is considered, it is seen that there are seven observed migrants for each one expected migrant from North Sumatra to Aceh as shown by the second calculation (North Sumatra to Aceh). Despite the fact that the ratio was greater than one, the figure was smaller compared to the ratio of Aceh to North Sumatra migration flows. Thus, it can be said that, overall, there is a strong connectedness between Aceh and North Sumatra. However, the connectedness is much stronger for Aceh than it is for North Sumatra (15.50 compared with 7.51). The interaction components between provinces in Indonesia in 2010 are set out in Table It can be observed that the greater is the distance between the two provinces, the lower is the connectedness between them. Thus, it is evident that distance plays a crucial role in inter-provincial migration patterns in Indonesia. 82
105 81 Indonesia s inter-provincial migration Table 3.11 Origin-destination-interaction components of inter-provincial migration flows, 2010 DIC SMU SMB R J SMS BE L DKI JB JTE DIJ JT B NTB NTT KB KTE KS KT SLU SLTE SLS SLTG M P DIC SMU SMB R J SMS BE L DKI JB JTE DIJ JT B NTB NTT KB KTE KS KT SLU SLTE SLS SLTG M P
106 Chapter 3 It is worthwhile to mention, however, there are other factors that influence connectedness across provinces. For instance, Riau (R) is a province neighbouring North Sumatra (SMU), West Sumatra (SMB) and Jambi (J). However, the level of connectedness between Riau with these provinces varies. Later, it can be observed that the level of connectedness between neighbouring provinces in Java is somewhat lower than the level of connectedness among neighbouring provinces in the outer islands. Central Java (JTE), for instance, the province sending the largest number of migrants to provinces in Java, has a high connectedness to those provinces in that the interaction factor is greater than one but it is low compared with some of the very high levels of connectedness between neighbouring provinces in the outer islands. Next, the component indicating the overall level of inter-provincial migration flows (T) experienced a dramatic increase from 1971 to 1990, more than twofold, from 2.1 million to 5.1 million during that period. The figure levelled off at 5.1 million in 2000 and then slightly reduced to nearly five million in The origin main effect components of inter-provincial migration over the five census years are set out in Figure 3.3. The patterns show how out-migration varied across provinces. The shares of out-migration are dominated by provinces located in Java including Jakarta (DKI), West Java (JB), Central Java (JTE) and East Java (JT). Central Java s share (JTE) increased from 19 per cent in 1971 to 26 per cent in 1980, the highest share of any province, and while its share slightly decreased over the next census years (23 per cent in 2000 and 20 per cent over in 2010), it maintained its position as the province providing the largest share of out-migrants. The patterns of Jakarta (DKI) s out-migration are mirrored by the patterns of West Java (JB) with out-migration from West Java being high in the first two census years and out-migration from Jakarta being high at the next three censuses. The graph for in-migration (Figure 3.4) shows the reverse pattern for these two provinces. The share of out-migration from East Java (JT) on the other hand was 10 per cent in 1971, reached 16 per cent in 1980 and then the figure gradually declined to 10 per cent in In contrast, the shares of out-migrations from most of the provinces in the eastern and western parts of Indonesia are below five per cent over all of the decades. Among provinces in the eastern part of Indonesia, it is only South Sulawesi (SLS) that has a 84

107 Indonesia s inter-provincial migration substantial share of out-migration. North Sumatra (SMU) has an out-migration slightly above five per cent. Of course, these shares partly reflect the population sizes of the various provinces. Figure 3.3 The origin component of inter-provincial migrations, The destination main effect component is exhibited in Figure 3.4. Unlike the origin component pattern that is dominated mostly by several provinces located in Java Island, the patterns of the destination main effect component have only two main players: Jakarta (DKI) and West Java (JB). In 1971, 28 per cent of all of Indonesia s in-migrants went to Jakarta (DKI). Subsequently the figure decreased, falling to only 13 per cent in A reverse pattern was evident for West Java by West Java (JB) for which the percentage of all migrants increased from 10 per cent in 1971 to 28 per cent in 2000 and then slightly reduced to 27 per cent in This is all due to the growth of the Jakarta Metropolitan Region with most of the early growth being in the Jakarta component and most of the growth from 1990 onwards being in the West Java component of JMR. JMR expanded its economic activities by establishing manufacturing in the peripheral regions while maintaining financial and banking sectors in its core (Firman, 1997). Later, Jakarta became quite costly to live in. Many of Jakarta s residents moved to the surrounding districts in West Java because of the high cost of land in the capital. The fringe areas administratively under West Java (JB) include Bogor, Bekasi and Depok, and Tangerang (in the new province of Banten but in West Java in this analysis). 85
108 Chapter 3 Because of transmigration policy, Lampung (L) had a high percentage of in-migrants in the first two census years but the percentage fell away at later censuses. Riau (R) Province experienced an increase in the number of in-migrants from 2000 due to the Riau Islands functioning as the new mecca for economic activities in Indonesia through strong economic collaborations with Singapore and Malaysia. Among provinces in the eastern part of Indonesia, East Kalimantan (KT) has had a substantial share of in-migration. The growth of the coal and mining industries and also palm oil plantations found in this province can explain why many migrants went to this province. Figure 3.4 The destination component of inter-provincial migrations, Unfortunately, the census question about the place of residence five years before the census for the censuses did not provide information at district levels. Such data only became available from the 2000 Census onwards. Data from the 2000 and 2010 Censuses support the above argument in which, of the total migrants who came to West Java, around two thirds of them were found in Bogor, Depok and Bekasi, areas all parts of the Jakarta Mega-Urban Region. Based on the 2010 Census, it was recorded that 85 per cent of migrants originating from Jakarta were living in these three regions. The other 15 per cent were scattered in the other 21 regions within West Java. The supremacy of the Jakarta Metropolitan Region as a region of in-migration is indicated in Figure 3.5 which recreates Figure 3.4 but combines Jakarta and West Java as a single destination. 86
 Sex differences It was noted earlier that sex differences in migration are evident in")
109 Indonesia s inter-provincial migration Figure 3.5 The destination component of inter-provincial migrations, (Jakarta and West Java are combined) Sex differences It was noted earlier that sex differences in migration are evident in Indonesia, in particular in terms of sex concentrations of inter-provincial migration flows. Inter-provincial migration flows of females are more concentrated than they are for males. Therefore, it is worthwhile to include a sex variable into the component equation. The main effect component of inter-provincial migration by sex over the forty years of analysis covered in this study is exhibited in Figure 3.6. There have always been more male migrants than female but the sex migration gap has been closing over the decades. Such a reduction in the sex gap of inter-provincial migration implies that women are becoming more independent and have wider access and opportunities to pursue education and employment in other places. In addition, previous studies have found that many employers in the development regions prefer to hire women over men in particular jobs. Also, there are some types of jobs that are normally only done by women, such as domestic helpers. 87

110 Chapter 3 Figure 3.6 The sex component of inter-provincial migrations, Migrant sex ratios by province Figure 3.7 shows the migrant sex ratios by province, that is, the ratio of the number of male out-migrants from a province to the number of female out-migrants. Male outmigrants predominate in provinces located in the outer islands. In contrast, there were more female out-migrants from provinces in Java, in particular from West Java (JB), Central Java (JTE), and DI Yogyakarta (DIJ) although the excess of women tended to fall across time. In the provinces of Sumatra, there was something of a reversal of the pattern with more male out-migrants in the earlier years but more females in the latter years. This latter trend is particularly evident for Lampung (L). 88
 where female in-migrants far exceeded male")
111 Figure 3.7 Sex ratios of out-migrants by province, Indonesia s inter-provincial migration The sex ratios of in-migrants by province are shown in Figure 3.8. There were more male in-migrants than female in-migrants for almost all provinces in all the census years with the striking exception of Jakarta (DKI) where female in-migrants far exceeded male inmigrants for all census years. In Jakarta, there has been a high demand for female workers in the modern shopping malls and as domestic workers. In relation to the development provinces, males predominated in the movement to East Kalimantan and Central Kalimantan (KT, KTE) probably reflecting the physical nature of the new jobs in these destinations but, for Riau (R), a small female excess is evident following the opening of the economic zone in Riau Islands. Thus, sex preferences in inter-provincial migration patterns can be explained by the nature of economic activities in the regions. 89
112 Chapter 3 Figure 3.8 Sex ratios of in-migrants by province, In summary, Central Java has always been the leading source of out-migrants while Jakarta and West Java (essentially, the Jakarta Metropolitan Region) are by far the leading provinces of in-migration. Males have predominated among migrants for Indonesia as a whole, and also for most provinces especially for in-migration. However, some recent shifts to female migration are evident especially among out-migrants from provinces in Sumatra. In relation to in-migration, men predominate in the development provinces in Kalimantan (KT and KTE) where the new jobs in forestry, mining and plantations require physical labour while women are considerably more prominent among migrants to Jakarta (DKI). Central Java interactions As out-migration from Central Java is the focus of this thesis, this section considers the interaction between Central Java as the origin province with all other provinces as destinations. The trends of Central Java-destination-interaction of inter-provincial migration flows at the five censuses are set out in Figure 3.9. As described above, ratios above one indicate connectedness between Central Java and another province in relation to migration from Central Java to that province. Central Java was clearly more strongly connected to the other provinces in Java than to provinces outside Java with a few exceptions such as Lampung (L) and North Sumatra (SMU) in the early years and Central Kalimantan (KTE) in Connectedness with Central Java was particularly strong for Jakarta (DKI) and for Yogyakarta (DIJ). 90

113 Indonesia s inter-provincial migration Figure 3.9 Central Java-destination-interaction of inter-provincial migrations, If Jakarta and West Java are taken as a single entity (as shown in Figure 3.5), of the total of Central Java s out-migrants in 2010, 563,143 (57%) were living in these two provinces. Of the total of Central Java s migrants found in West Java, 60 per cent lived in Bogor, Bekasi or Depok, districts that border Jakarta. The same procedure for producing Figure 3.5 was used for Figure 3.10 below to exhibit destination patterns of Central Java s migrants. The figure shows that over the decades the connectedness between Central Java and Jakarta and West Java (DKI+JB) and between Central Java and Yogyakarta (DIJ) are consistently well above one. It is speculated that a strong connectedness between Central Java and Jakarta and West Java rests upon the employment opportunities of those provinces whilst the connectedness between Central Java and Yogyakarta is the result of similarity in cultural background and short distance. Meanwhile the level of connectedness between Central Java and East Java (JT) has fluctuated. 91
 In order to gain a better understanding of the connectivity of Central Java with")
114 Chapter 3 Figure 3.10 Central Java-destination-interaction of inter-provincial migrations, (Jakarta and West Java are combined) In order to gain a better understanding of the connectivity of Central Java with the rest of the provinces, patterns of migration to Central Java are important to investigate. The origin province to Central Java interactions of at the five censuses are exhibited in Figure A consistent, very high level of connectivity is observed for migrants from DI Yogyakarta (DIJ), reflecting a strong connectedness between Central Java and DI Yogyakarta. In contrast, the connectivity between Central Java and West Java (JB) is not that strong, even though these two provinces are close to each other. The connectivity between Central Java and DI Yogyakarta (DIY) may be related to the return of students to Central Java who have completed their study in Yogyakarta or simply people moving a short distance over the very long border between the two provinces. There is also early connectedness with Lampung perhaps indicating return migration of persons who went to Lampung, as transmigrants. 92

115 Indonesia s inter-provincial migration Figure 3.11 Origin-Central Java-interaction of inter-provincial migrations, Jakarta interactions Jakarta has been a mecca for migrants from across the country. Thus, it is also interesting to investigate which provinces have strong connectedness with Jakarta. The patterns of interaction between origin provinces and the destination of Jakarta over are set out in Figure It is easily noticed that West Java (JB), the closest province to Jakarta, has strong connectedness with Jakarta, the value ranges from 2.0 to nearly 3.5. The strong connection between these two provinces, as explained before, is due to the spill over of Jakarta s economic activities to its surrounding regions. Following West Java, Central Java (JTE) also shows quite strong connectedness with Jakarta despite its greater distance from Jakarta. Perhaps, as mentioned earlier, the variety of jobs offered in Jakarta and also the presence of strong community networks facilitate migrants from Central Java to come to Jakarta. The only other province to have a relatively high degree of connectivity to Jakarta is West Kalimantan (KB), perhaps because both provinces have sizeable populations of Chinese origin. 93

116 Chapter 3 Figure 3.12 Origin-Jakarta-interaction of inter-provincial migrations, Unlike Central Java, which loses a great number of migrants and receives a very small number, Jakarta experiences large in- and out-flows of population. Therefore, to enrich the analysis, I have also examined patterns of out-migration from Jakarta. The connectedness between Jakarta as the origin with the rest of provinces acting as destinations is shown in Figure As expected, the counter flows of migrants from Jakarta are to West Java (JB) primarily but also to Central Java (JTE). The connectedness between Jakarta and West Java is very strong, the value lying between 2.0 to 4.5 during the period of analysis. Outmigrants from Jakarta to Central Java (JTE) are probably mainly return migrants, perhaps returning for family reasons or because they are unable to maintain employment in Jakarta. 94

117 Indonesia s inter-provincial migration Figure 3.13 Jakarta-destination-interaction of inter-provincial migrations, Summary and conclusion The aim of this chapter has been to gain a better understanding of the internal migration patterns of Indonesia by using data from five decennial censuses (1971, 1980, 1990, 2000 and 2010 censuses) and to situate the patterns of Central Java into the overall picture of Indonesian migration. Specifically, this chapter investigated the flows of inter-provincial migration, spatial concentrations and structural patterns across provinces. Migration was measured based on difference in the province of residence five years before the census and at the census. In-and out-migration rates are used to measure inter-provincial migration flows. For the province of Jakarta, rates of in- and out-migration were relatively high at all censuses but the balance shifted from net in-migration in the early years to net out-migration in the later years. However, net out-migration in the later years reflected movement to the districts surrounding Jakarta within the Jakarta Metropolitan Region. Government transmigration policy was also an important aspect of out-migration from the provinces of Java in the earlier years but this effect was minimal in the later years. In more recent years, development provinces outside of Java such as Riau and East Kalimantan have experienced high in-migration. These new economic geographies outside Java have promoted a new form of mobility based on private recruitment of workers from 95
118 Chapter 3 other provinces. With regards to the association between in- and out-migration rates, it is noticed that there were positive correlations between in- and out-migrations rates in 1971, 1990 and This result is supported by past literature that states that provinces with high in-migration rates tend also to have high out-migration rates (Lee, 1966; Tobler, 1995). CV was employed to investigate spatial concentrations of inter-provincial migration flows. The calculations were carried out using two groups of provinces. The first group is based on the 26 provinces in existence in 1971 in which new provinces are grouped into their origin provinces. The second group consists of all 33 provinces in existence at the 2010 Census. Interestingly, the findings change somewhat when different groups of provinces are used in the analysis, however, in general, weighted CV values for in-migration became higher across time meaning that the choices of destination for out-migrants became narrower. There have always been more male migrants than female migrants but the gap has become smaller in the later years. For the provinces of Java as migrant recipients, however, there is a strong female majority among the migrants. The overall findings suggest that provincial variation on CV indices reflects variations in the levels of regional development, cultural background and local policies. In addition, it is speculated that the types of employment available in each destination influence the patterns of inter-provincial migration by sex. The structural patterns of inter-provincial migrations flows have provided knowledge on the levels of connectedness between provinces. The multiplicative component model was used to measure the connectedness between a specific origin and destination by segregating the observed migrations into the overall level, main effect and two-way interaction effects. Among provinces in Sumatra Island, for example, the connectedness between Aceh and North Sumatra, two neighbouring provinces, is very high. The same is also true for neighbouring provinces in eastern Indonesia. It can be said that, as opposed to provinces in Java, the level of connectedness of provinces outside Java is influenced by distance and geographical shape. As for Aceh and North Sumatra, a higher connectivity from Aceh to North Sumatra than the connectivity from North Sumatra to Aceh is due to the geographical deadlock of Aceh that is located in the edge of Sumatra Island. Aceh has only one borderland neighbour, North Sumatra. The story differs for the provinces in Java, 96
119 Indonesia s inter-provincial migration where distance between provinces is not so far due the shape of Java Island. For instance, the interaction component between Central Java and Jakarta is 1.72, meaning that there are two observed migrants for each one expected migrant. Findings from the origin components confirmed the position of Central Java as the main donor of migrants and the dominant destination was Jakarta inclusive of its fringe districts. The high level of interaction between Central Java and Jakarta Metropolitan Region proved that there was a strong connection between these two regions. The next chapter will focus on the patterns and changes of out-migration from Central Java across the censuses. Specifically, the chapter will investigate the conditional probability of migration rates among Central Java s primary, onward and return migrations by destination, age and sex. 97
120
121 Chapter 4 Characterisation of Central Java s primary, onward and return migrants: Patterns and rates of conditional probabilities of migration by age and sex Introduction Migration is an event that involves not only social, economic and/or political factors but that also relies upon migration experiences held by individuals. Generally, individuals with migration experience are more prone to migrate than those who have never previously migrated (DaVanzo & Morrison, 1981; Rogers & Raymer, 2005). Persons who have migration experience and who undertake a subsequent move, known as secondary migrants, are categorised into onward migrants and return migrants. Onward migrants are migrants who move to another new destination while return migrants are those who move back to the place of origin. Meanwhile, individuals who undertake an initial move are called primary migrants. Past studies in developed nations have shown that the three types of migrants, that is primary, onward and return migrants, have differences in rates of migration (DaVanzo & Morrison, 1981; Nekby, 2006; Newbold, 1997a; Newbold & Bell, 2001; Rogers & Raymer, 2005), in sex and age patterns (Belanger & Rogers, 1992; Newbold, 1997b), in socio-economic characteristics (Aydemir & Robinson, 2008; Marinelli, 2013; Nekby, 2006) and in their places of birth (Belanger & Rogers, 1992). In the context of developing countries such as Indonesia, however, little is known about the patterns and rates of migration among primary, onward and return migrants and how age and sex patterns differ across types of migrants. Mobility transition theory suggests that there are systematic changes in the rates and directions of migration over time (Zelinsky, 1971). Differences between primary, onward and return migrants provide knowledge regarding the relationship between migration processes and social, economic, political and structural factors that influence patterns of movement in the short and long term. This knowledge can assist in understanding regional disparities and the motivations of people who undertake a subsequent move to a new destination or return to their place of origin, in particular returning to an economically 4 This chapter was presented in the poster session during the 8 th International Population Conference on Population Geographies, 30 June to 3 July 2015, The University of Queensland, Brisbane, Australia. 99
122 Chapter 4 unattractive region (Newbold & Cicchino, 2007). To this end, it is important to study how patterns of primary, onward and return migrants have changed over time, specifically for Central Java, the leading source of out-migrants within Indonesia. There is a general lack of census-based studies on internal migration in Indonesia that examine the number of migrations undertaken by migrants and the importance of the origin-destination specifics of migration. It is likely that persons who have migration experience may undertake another move to a different place of destination or return to the place of origin (DaVanzo & Morrison, 1981). In addition, the number of migrations undertaken by a migrant can be influenced by the life cycle (White & Lindstrom, 2005). Also, it is likely that the number of individuals migrating for the first time is the most common movement even though the barriers to migrate are likely to be the greatest (Newbold, 1997b). This chapter contributes to the gap in migration studies by investigating the rates, patterns and changes of migration among primary, onward and return migrants. Traditionally, the rate of migration has been calculated by taking the ratio between the number of migrants and the population at the middle year for a specific region. The produced rate, however, is not able to provide evidence on the underlying directional channels of migration flows (Belanger & Rogers, 1992). This chapter contributes to the migration literature by applying the rates of conditional probability of migration in investigating patterns of primary, onward and return migrants. The advantage of using this technique is that it considers the population at risk for each type of migrant group which helps us to provide a precise picture of the patterns and changes of migration processes. The aim of this chapter is to answer the second research question of the thesis regarding the patterns and changes of Central Java s primary, onward and return migrants based on five decennial population censuses (1971, 1980, 1990, 2000 and 2010 censuses). Specifically, this chapter asks: 1. How many of Central Java s migrants are found at each census from 1971 to 2010 and how many movements have they made? 2. Who are Central Java s primary, onward and return migrants? 3. What are the conditional probabilities of migration for Central Java s primary, onward and return migrants? 4. Are patterns of conditional probabilities of migration different among Central Java s primary, onward and return migrants? 100
123 Characterisation of Central Java s migrants 5. Are there differences in the conditional probabilities of migration of each type of Central Java s migrants by age and sex? The chapter is organised as follows. I start by positioning Central Java in the context of Indonesia, in terms of its geographical location and macro-economic indicators. I discuss literature, methodology and concepts used in this current chapter in section two. In the analytical section, I first investigate the patterns and changes of Central Java s primary, onward and return migrants. Then, I calculate the rates of conditional probabilities of migration over five censuses. In the last section of analysis, I investigate patterns and changes of the rates of conditional probabilities of migration by age and sex for each type of migrant. Discussion and conclusions are provided in the last section of the chapter. 4.2 Central Java in the context of Indonesia Referring to the map of Indonesia in Chapter 1, Central Java (33) is a province located in the centre of Java Island and has land borders with West Java (32), DI Yogyakarta (34) and East Java (35). Demographically, in 2010, Central Java was the third most populous province in Indonesia after West Java and East Java. The province contributed 14 per cent of the total population of Indonesia or 24 per cent of the total population of Java Island (BPS, 2013). Economically, however, Central Java is left far behind compared to the other two provinces. For instance, the share of Central Java s GDRB to the total national GDP in 2010 was eight per cent, while the associated figures for West Java and East Java were 15 per cent each in each case (BPS, 2012). In addition, around 16 per cent of national GDP related to the province of Jakarta (BPS, 2012). In terms of the percentage of the population living under the poverty line, statistics show that, in 2010, 17 per cent of Central Java s population was categorised as poor while the associated figures were lower for West Java and East Java (11 per cent and 15 per cent, respectively) (BPS, 2013). These two economic indicators can be used as initial indicators to explain why there is a large relative outflow of migration from Central Java. It is important to study migration out of Central Java because this province sends the most migrants and receives few migrants. As mentioned in Chapter 3, in 2010, a quarter of the total of Indonesia s life time migrants was contributed by Central Java, while the associated figure was 19 per cent for recent migrants. In contrast, the number of migrants who 101
124 Chapter 4 entered Central Java province was three and six per cent for life time migration and recent migration, respectively. The fact that the number of Central Java s out-migrants was far higher than the number of its in-migrants seems not to be in accordance with the argument that regions with high in-migration tend to experience high out-migration flows (Lee, 1966; Tobler, 1995). Thus, it is crucial to investigate the patterns of Central Java s out-migration. Statistics of in- and out-migration of Central Java province and Java Island as a comparison are represented in Table 4.1 below. Java Island is taken as a comparison because Central Java is located on the island so the contribution of Central Java migration to migration for the island as a whole is clearly evident. For recent migration, there were 1.2 million people who came to Java Island and 1.3 million people who left the island in Both figures increased in 2010, reaching 2.8 million and 3.3 million, respectively, with an excess of 435,324 out-migrants. For Central Java s recent migrants, the number of in-migrants is stagnant over the periods but its percentage of the total in-migrants of Java decreases. In 1971, 18 per cent of the total recent in-migrants to Java Island were found in Central Java. The percentage then reduced to ten per cent in In contrast, the number of Central Java s out-migrations experienced a huge increase between the 1971 and 1990 Censuses. In 1971, the number of Central Java s recent out-migrants was 390,668, increasing threefold in 2010 (979,860 out-migrants). This figure accounted for 30 per cent of the total recent outmigrants of Java Island. 102
125 Characterisation of Central Java s migrants Table 4.1 Number of migrants, Java Island and Central Java Province, 1971 to 2010 Type of migrant Year Java Island Net migration Central Java Province Inmigration Outmigration Inmigration Outmigration Net migration Lifetime ,789,570 4,139,984-1,350, ,477 1,798,001-1,544, ,470,507 6,967,892-2,497, ,408 3,227,892-2,891, ,866,303 10,303,814-3,437, ,658 4,521,141-4,012, ,410,301 13,067,192-2,656, ,311 5,345,265-4,639, ,383,446 17,645,162-3,261, ,356 6,822,778-5,925,422 Recent ,185,465 1,284,419-98, , , , ,714,601 2,402, , , , , ,009,688 3,408, , ,940 1,157, , ,823,311 3,058, , ,152 1,016, , ,848,681 3,284, , , , ,184 Source: Author s calculation. It can also be observed from Table 4.1 that Central Java s lifetime and recent outmigrations increased significantly over time. The rate of increase in lifetime and recent outmigration was higher than the rate of increase in Central Java s population. Over the last four decades the annual growth rate for lifetime out-migration was 3.42 per cent and 2.36 per cent for recent out-migration. Meanwhile the annual population growth rate was 1.00 per cent. Previous scholars have argued that migration is the main factor contributing to the massive population in Java Island (Tirtosudarmo, 2009; Titus, 1978). If this were the case, then the number of people who come to Java Island should be enormous. However, statistics do not support this viewpoint. The number of migrants to Java Island is tiny compared to the population of Java. Statistics indicate that in 2010 nearly 60 per cent of the total population of Indonesia lived on Java Island, equal to 137 million people. There were 2.8 million recent migrants who came to Java and 3.2 million out-migrants. Thus, in the five years preceding the 2010 Census and, indeed, in the five years preceding every census, there were more out-migrants than in-migrants to Java. Table 4.1 also shows that in-migration to Central Java was small compared with inmigration to Java as a whole. As shown in Chapter 3, people who migrated to Java Island 103
126 Chapter 4 were actually going to Jakarta and its surrounding regions (Bogor, Depok, Tangerang and Bekasi). This zone is known as Jabodetabek; the centre of national economic activities (Firman, 1999; Mohamad, 2014). It is known that people who migrated to Java Island usually have two purposes: either to seek better jobs or to pursue higher education in topranking universities (Hugo, 2001; Purnomo, 2004). It is also argued that better-educated people on other islands believe that they will not get jobs with high returns to their education if they remain at their place of origin whilst those in Java who are less-educated tend to leave the island (Hamid, 1999). The less-well-educated in Java migrate because they do not have sufficient skills to compete with others in the competitive labour markets on Java Island and because they are recruited to work in low-skilled jobs in the development provinces. This outflow continues the pattern of out-migration from Java of low-skilled people established through transmigration policy. It could also be argued that the consistent flows of people who migrate out of Central Java indicate that there are no substantial pull factors that stop people leaving the province or pull factors that attract migrants to come to Central Java. While the level of out-migration from Central Java fluctuates across time, the large-scale outflow can have impacts on the provincial destinations and on Central Java itself. For example, the age composition of Central Java could change substantially if the young population constantly migrated elsewhere. Central Java might experience economic degradation since it is losing young and productive people. In relation to the choice of destination, it is important to investigate provincial destinations among Central Java s migrants because the presence of migrants at the places of destination could also influence demographic and social factors in those places of destination. 4.3 Literature review Conceptual framework The analytical framework of this study is a combination of economic and sociological perspectives. Economically speaking, migration is considered as a part of human capital investment in which an individual will expect benefits in the long run due to his or her action in undertaking migration at present (Sjaastad, 1962). In this context, an individual migrates if the expected returns outweigh the costs. The costs of migration include direct 104
127 Characterisation of Central Java s migrants costs such as the cost of travel and indirect costs. Indirect costs include the psychological costs of living apart from loved ones, and the search costs involved in gaining information about the availability of jobs and knowledge of the places of destination. From a sociological perspective, the decision to migrate is not always rational as an individual may be following the path of siblings or other kin (Hendrix, 1975). The reason for this may be mainly due to information about employment opportunities and place of destination provided to them through family networks. Otherwise, information is not costless and is restricted. The flow of migration is then formed by a combination of networks of kinship, by people s conception of distance, and by their notions about various places of destination (Hasmath, 2011; Hendrix, 1975; Zelinsky, 1971). This process of chain migration underpins the sociological approach towards migration in which the bulk of people are heading to a single destination and ignoring other potential destinations. Thus, it is likely that information has the power to differentiate types of migrants according to the stage of migration acquired by migrants. Among the three types of migrants, that is primary, onward and return migrants, it is the first-time movers (primary migrants) who have little information about the availability of jobs and places of destination. Thus they have the hardest obstacles to overcome (Newbold, 1997b). The rationale behind this is related to the stages of a life cycle in which primary migrants predominantly are young persons and their reasons for migrating are to enter the labour market, to pursue higher education or to start a new family. Thus, they typically make only a small investment in themselves and have imperfect information about the availability of jobs at the places of destination. Meanwhile, return and onward migrants, also called secondary migrants, face less uncertainty than primary migrants because they have had prior learning experiences of migration and they will have acquired first-hand information about potential places of destination including return migration (DaVanzo & Morrison, 1981; Davis & Winters, 2001; Grant & Vanderkamp, 1986). As a consequence, they are more inclined to undertake a subsequent move. However, among secondary migrants, knowledge derived from prior migration experiences varies. Return migrants have different motives in mind when they decide to go back to their place of origin. Some return migrants might have had less successful experiences at the places of destination (disappointment) due to miscalculation about the places of 105
128 Chapter 4 destination, in particular in terms of income, that have caused them to return to their place of origin (DaVanzo & Morrison, 1981; Newbold, 2005). Apart from disappointment, there are other factors that influence people to return. For some, return migration is part of a pre-planned pattern, such as among students and intra-company transfers, while for others, the action may include factors of climate, kinship and friendship relations, public goods, and amenities (Beshers & Nishiura, 1961; Gmelch, 1980). The other type of secondary movement is onward migration. It is likely that potential onward migrants experienced positive outcomes from the initial move that emboldened them to undertake a subsequent move for greater success (DaVanzo & Morrison, 1981). Another explanation is that if the majority of potential onward migrants are coming from an economically depressed area, they are unlikely to return to the place of origin, but prefer to undertake a corrective move to another place of destination (Newbold, 1998). Differences between migrants who undertake the first move, those who undertake a subsequent move to another new place of destination or those who decide to return to the place of origin can be approached from their demographic characteristics. Since the decision to migrate is influenced by stages of the life cycle, it can be said that, as opposed to secondary migrants, primary migrants tend to be younger and less skilled (Détang Dessendre, Drapier, & Jayet, 2004). The fact that young people make up the largest proportion of migrants is also stated by Hugo et al. (1987); the most obvious observation for migration populations is that there is an excess of adolescents and young adult individuals among the population. Meanwhile, it is likely that onward migrants tend to be younger, more skilled and better informed about places of destination than return migrants (Marinelli, 2013). Previous research and theories have suggested that gender differences contribute to the likelihood of migrating and the choice of destination in developing countries. Overall, males are more migratory than females (Foulkes & Newbold, 2000; Hugo, 2000). An increase in the role of family ties in the form of being a carer for an elderly person, which is disproportionately conducted by daughters rather than sons, may be another factor that decreases the propensity of females to migrate (Rebhun & Goldstein, 2009). It is also known that gender affects the feasibility of migration. Males mostly migrate for economic purposes while females tend to participate in marriage migration (Alam & Barkat, 2011). In 106
129 Characterisation of Central Java s migrants terms of the choice of destination, however, the result is mixed; some scholars find that males are more likely to go to urban areas while females are more likely to move to a nearby place regardless of the types of job offered (Alam & Barkat, 2011). Other scholars, however, find that males are more likely to go to agricultural-based destinations while females are more likely to go to urban centres (Barbieri, Carr, & Bilsborrow, 2009). It is also stated that urban areas offer more jobs to female migrants than to male migrants (Firman, 2004). The body of literature on migration propensity in western societies has shown that there are differences in the probability of undertaking primary, onward and return migration. Lee (2008) conducted a study on the racial comparison of people who are undertaking primary and repeat migration in the US by using panel data from the National Longitudinal Survey of Youth. The unit of analysis was individuals who were between the ages of 14 and 21 years old by the end of 1998 and they were followed to He classified race types into Whites, Hispanics and Blacks. The study found that the proportion of people participating in primary migration decreased as age increased. The youngest age group (18 21 years old) had the highest percentage undertaking the first move, 7.5 per cent. Meanwhile the oldest age group (age 36 years old and above) had the lowest percentage, 3 per cent. Whites had the highest percentage of undertaking primary and onward migration while Blacks had the highest percentage of undertaking return migration, followed by Hispanics. In terms of sex, males outnumbered females in all types of migration. Lee (2008) argued that there was a lower likelihood of Blacks and Hispanics undertaking primary or onward migration as opposed to Whites, which indicated that these two groups were not pursuing opportunities in as many places as Whites. Rogers and Belanger (1990) examined the importance of place of birth on population redistribution in the United States by using census data from 1940 to The conditional probability of migration was used to measure the rates of each type of migrant. All states were classified into nine regions. The study found that over the period the probability of undertaking inter-regional migration increased more than twofold for the total population. But the out-migration probability did not double for any type of migrant, indicating that the population at risk of return and repeat migration increased faster than the population at 107
130 Chapter 4 risk of primary migration. The conditional probability of return in-migration was dramatically higher than that for primary or other repeat migration. Belanger and Rogers (1992) conducted a similar study by examining the spatial redistribution of the foreign-born population in the Unites States by using Public Use Micro Sample data 1965 to 1970 and 1975 to In this study, they extended their analysis by investigating the age patterns of the foreign-born population. The foreign-born population are grouped into eight nationalities. The study found that, as opposed to the US-born, the conditional probability of out-migration of the foreign-born was 12 per cent higher. Among foreign-born people, it is the Asians who have high out-migration probabilities being twice as large as those of the US-born and they are four times more likely to migrate to the Northeast, Midwest and South. The study also found that outmigration propensities for both foreign-born and US-born showed similar age patterns. The propensities to out-migrate decline during the school ages and increase dramatically during the ages of entry into the labour force. The propensities to out-migrate decline as age increases. However, it is likely that the propensity to out-migrate increases slightly at the age of retirement. In terms of destination propensities, the study found similar findings to their previous study (Rogers & Belanger, 1990). Newbold (2001) continued the work of Belanger and Rogers (1992) by using the 1990 U.S. Public Use Micro Sample (PUMS) to compare and contrast patterns of primary, onward and return migration for Blacks and Whites. The study found that, as opposed to Whites, Blacks have a lower propensity to undertake primary or onward migration and have a higher likelihood of participating in return migration. Spatially speaking, both Whites and Blacks are more likely to migrate out of the Northwest and Midwest and into the South and Southwest. In the same year, Newbold and Bell (2001) conducted a study to compare and contrast patterns of return and onward migrants in Canada and Australia at three points, 1986, 1990 and Their study found that the percentage of return migrants was 36 per cent and 26 per cent for Australia and Canada respectively. As opposed to other migrants, migrants who returned to their former place of residence tended to be older and had pre-planned their return in advance. 108
131 Characterisation of Central Java s migrants A more recent study on the propensity to migrate among each type of migrant was conducted by Newbold and Cicchino (2007) in Canada using a Public Use Micro-data File (PUMF) of the 1996 Canadian census. The inter-regional migrations are based on 40 identified regions, of which 24 were Census Metropolitan Areas (CMAs). The study revealed that repeat migration is mostly prevalent among young adults aged years old. The percentage of those who are undertaking onward migration is greater than those who are participating in return migration. The fact that there is a substantial proportion of young educated people who are part of return migration reflects a pre-planned migration. High mobility was also found among individuals aged 60 years and above. This can be explained by the tendency of some retirees to move back to their place of origin. It is also evident from the study that there were high rates of return migration across Canada. Past studies have shown the importance of examining different types of migration and how patterns of conditional probabilities of primary, onward and return migrants vary. However, most of the studies were conducted in developed countries and little is known about whether the same results would be found if the same study were applied in developing nations. It is also known that past studies in Indonesia have overlooked sex differences in migration patterns. They have not provided a comprehensive analysis of age structures and sex-differentiated patterns of migration for each type of migrant. This study contributes to the body of literature on migration by conducting an analysis on the patterns and changes of migration for each type of migrant based on their age and sex Method and data used Origin-destination-specific migration patterns can be distinguished using changing migration propensities from spatial population distribution (Raymer & Rogers, 2007). Migration propensities that measure the conditional probabilities of migration are an appropriate tool to measure the likelihood of migrating (Raymer & Rogers, 2007; Rogers, 1990). Unlike traditional migration rates which rely only on the number of migrants and the number of population in a specific place of destination, the rate of conditional probability of migration is derived by dividing the number of migrants by the population at risk of each type of migration (Newbold, 2001). For the out-migration flow, the conditional probability rate includes the ability of a region to retain its in-migrant population whilst for in-migration flow, the rate includes the ability to regain former out-migrants 109
132 Chapter 4 (Newbold & Cicchino, 2007). Later in this current chapter, the conditional probability of migration is used interchangeably with the propensity/probability to migrate. In this current chapter, Central Java s migration is classified into three groups, namely primary, return and onward migrants. The difference between these three groups is based on three points in time: province of birth, province of residence five years before the census and province during the census (Newbold, 2001). The aim of this study is to investigate migration from Central Java, so the province of birth is Central Java. Persons who migrated from Central Java may migrate again. Those who do will become onward migrants if they migrate to a province other than Central Java, while if they migrate to Central Java they are return migrants. Individuals who migrate out of Central Java for the first time five years before the census are called primary migrants. Some scholars propose that those who are classified as primary migrants are called natives while those who are undertaking onward and return migrants are called non-natives (Morrison & Davanzo, 1986; Newbold, 2001). This current chapter uses five sets of Indonesian census data (1971, 1980, 1990, 2000 and 2010 censuses). The general shortcoming of using the census as the source of data is that it fails to record many back and forward movements that take place. It is also unable to capture short movements, that is, migration across regions within a province or even across provincial boundaries, which is common in Indonesia especially for smaller geographic provinces such as Jakarta and Yogyakarta. Daily commuting across the boundary of the province of Jakarta is exceptionally common. Indeed, the number of daily commuters across the Jakarta boundary, at around four million, exceeds the number of in- or outmigrants to the island of Java over the five-year period preceding the census. Apart from these shortcomings, the census is a powerful tool to identify migration for whole populations over a period of time. Since the study uses five consecutive censuses, it is possible to investigate patterns and changes in populations across decades. The unit of analysis is restricted to those aged five years and over who were born in Central Java. In each census, Central Java-born who died after migration or had missing information about their places of residence are excluded from the analysis. This current study also excludes people whose place of residence five years before the census was 110
133 Characterisation of Central Java s migrants overseas. All migration occurs between provinces within the national boundary. It is important to note here that this study does not examine the migration history of Central Java-born people. Due to the nature of the data, the current study has some limitations, firstly, it is related to the concept of migration that is used in this current chapter which only captures permanent movements that occurred by crossing provincial boundaries. Those who migrated across regions within a province are not captured by this study. Secondly, those who reside next to provincial boundaries and who cross provincial boundaries on a daily basis are not included in the study. The conceptualisation of Central Java s primary, onward and return migrants used in the chapter is summarised in Table 4.2 below. Table 4.2 Definitions of Central Java s primary, onward and return migrants Type of migrant Place of birth Place of residence five Place of residence at the years before the census census Primary Central Java Central Java Other province Onward Central Java Other province Other province (different province from province of five years before census) Return Central Java Other province Central Java An individual is categorised as a Central Javanese onward migrant if he/she was born in Central Java and his/her place of residence of five years before the census was in another province, for instance, West Java, and his/her place of residence during the census was neither in Central Java nor in West Java (his or her province of residence five years before the census), but for instance, in Jakarta. A person is called a Central Javanese primary migrant if his/her place of birth and his/her place of residence five years before the census was in Central Java, and during the census he/she lived outside of Central Java. Meanwhile a Central Javanese return migrant is an individual who was born in Central Java, and five years before the census he/she lived in another province but during the census he/she resided in Central Java. The migration propensity for Central Java s primary, onward and return migrants is calculated by taking the ratio of the number of each type of migrant with its corresponding population at risk. By taking into account the population at risk for each type of migrant, it allows us to measure the conditional probability of undertaking each type of migration. The 111
134 Chapter 4 conditional probability of migration illuminates the observed structure of migration patterns (Rogers & Raymer, 2005). The populations at risk for each type of Central Java migrant are as follows: Population at risk for primary migrants: persons who were born in Central Java and who lived in Central Java five years before the census. Population at risk for onward migrants: persons who were born in Central Java and who lived outside Central Java five years before the census. Population at risk for return migrants: persons who were born in Central Java and who resided outside Central Java five years before the census. Mathematically, the conditional probability of migration for each type of migrant can be stated as follows: The interpretation of the rates of conditional probability of migration for each type of migrant is similar to that of traditional migration rates. What makes the former more useful than the latter is that conditional probability of migration measures the ability of Central Java to retain or regain its migrants. Also, conditional probability allows us to investigate some crucial questions such as whether or not the conditional probability of migration for primary migrants is lower than it is for onward or return migrants, whether or not the conditional probability of onward migrants is higher than it is for return migrants, whether or not age patterns for each type of migrant follow general migration schedules, whether or not there are sex differences in the conditional probability of migration among Central Java s primary, onward and return out-migrants, and whether or not there are differences in terms of places of destination among primary and onward migrants and places of destination from which migrants return. 112
135 Characterisation of Central Java s migrants In general, the overall conditional probabilities of migration for primary migrants are usually lower than those of return and onward migrants for two main reasons. Firstly, a lower propensity to migrate among primary migrants as opposed to onward migrants and return migrants is related to the base populations for primary migration probabilities, which are larger than those for return and onward migration probabilities (Rogers & Raymer, 2005). Secondly, it is known that the propensity of migrating among migrants who have experienced migration is higher than those who have not because they have gained experience from previous migration and are more confident in undertaking either onward or return migration (Newbold, 2001). It is expected that migration propensities of Central Java s primary, onward and return migrants will vary by age and sex. The conditional probabilities of migration among onward and return migrants are higher in older age groups because of the effect of earlier migration experiences. The propensity to undertake return migration among the adult population is predicted to be low due to the fact that Central Java has experienced consistent flows of out-migration. Past studies in developed nations have not investigated sex difference in the propensity of migrating and the choice of destination. This study, however, explores sex differences in conditional probabilities of migration and it is speculated that migration propensities and destination patterns differ between male and female migrants. 4.4 Findings The number of Central Javanese migrants and migrations Table 4.3 exhibits inter-provincial migration of people who were born in Central Java as shown by the 1971 to 2010 censuses. This table allows us to distinguish between the number of migrants, which refers to the number of individuals who have undertaken one migration or more and the number of migrations. Born in Central Java is used as the primary basis for defining the population under consideration. Migration is movement in the five-year period preceding each census. This table also provides details of the percentage of each type of migrant (primary, onward and return migrants) to the total migrants and to the total population of Central Java as a whole. 113
136 Chapter 4 Table 4.3 reveals that there were 510,477 migrants as at the 1971 Census. Central Java s primary migrants represented 69 per cent of the total flow. A substantial proportion of this group was found in Lampung, North Sumatra and South Sumatra provinces, reflecting the effect of transmigration policy at that time. A large proportion of primary migrants was also found in other provinces, in particular in Jakarta. At that time, primary migrants who moved a long distance were likely to be part of Indonesian government-assisted migration through the transmigration policy. Meanwhile primary migrants who moved to other provinces within Java Island were part of self-supported migration or voluntary migration. The table also shows that return migrants were a high proportion of all migrants in It is speculated that this is due the inability of migrants to adjust at their destinations (Newbold, 1997b). Earlier studies on transmigration policy argued that many transmigrants faced difficulties at the place of destination (Arndt, 1983; McNicoll, 1968). This would imply that there is a substantial proportion of return migrants from transmigration-specific destinations. Comparatively, the proportions of Central Java s primary migrants to the total migrants increased slightly between 1971 and 2010, but, in numerical terms, the increase was dramatic. Over the period, the number of primary migrants increased threefold, reflecting a substantial outflow of Central Java s young population, since primary migrants were likely to be young. At the same time, the share of return migrants to the overall migration went down, while the share of onward migrants significantly increased both numerically and proportionately. In 2010, onward migrants constituted 16 per cent of the total migrants, double the 1971 percentage. This finding suggests that the outcomes from the initial movement encouraged migrants to undertake a subsequent movement to another new destination. In addition, it is observed that the rate of growth of the number of migrants is higher than the rate of growth of Central Java s population. 114
137 Characterisation of Central Java s migrants Table 4.3 Central Java s primary, onward and return migrants, 1971 to 2010 Types of migrant Year Primary Number of Migrants 352, ,812 1,081, , ,943 % of All Migrants % of CJ Population Onward Number of Migrants 41,631 92, , , ,787 % of All Migrants % of CJ Population Return Number of Migrants 116,551 60, , , ,382 % of All Migrants % of CJ Population Total migration Number of Migrants 510,477 1,011,098 1,480,756 1,174,328 1,217,112 % of All Migrants % of CJ Population Central Java Population 21,877,136 25,372,889 28,520,643 31,228,940 32,382,657 It is evident from Table 4.3 that, at all censuses, primary migration was the dominant form. Previous studies argued that primary migrants were often associated with young people who migrated for education while onward migrants usually moved either looking for new jobs in other places or were job-transfer related. Therefore, it is likely that place of destination for primary and onward migrants is different. Also, those who decide to return to their place of origin usually come from regions with a high in-migration flow. This hypothesis raises interest in observing the place of current residence of Central Java s primary and onward migrants and the provinces from which the returnees come (Table 4.4). It can be seen that Central Java s primary and onward migrants were mostly concentrated in provinces within Java and this concentration increased over time as the number of transmigrants reduced. The percentage of primary migrants in other parts of Java increased from 66 per cent in 1971 to 73 per cent in The associated figures for onward migrants were very similar, being 65 per cent and 73 per cent, respectively. Comparatively, 30 per cent of primary migrants resided in provinces in Sumatra in Specifically, they were concentrated in Lampung, North Sumatra and South Sumatra Provinces. In 2010, 115
138 Chapter 4 only 12 per cent of Central Java s primary migrants were found in Sumatra, with the largest percentages being found in Riau and Riau Islands Provinces. This reflects the shift from transmigration in the early years to private recruitment to the development provinces in the later years. It is observed that patterns of provincial destination of Central Java s primary migrants in the outer island have shifted from provinces in Sumatra (except for Riau Province) to provinces in Kalimantan, in particular, Central Kalimantan and East Kalimantan Provinces. The presence of Central Java s primary migrants in Central Kalimantan and East Kalimantan was pronounced in The figure was six per cent and two per cent for Central Kalimantan and East Kalimantan, respectively. The Revitalization Forest Conversions Act (1999) in association with the Decentralization Act led to the development of plantations and mining in these two provinces (Sardjono & Inoue, 2007). As a consequence, large inflows of migrants entered these provinces, including Central Java s primary migrants. The provincial destinations of Central Java s onward migrants also show a similar pattern. Jakarta, West Java and Banten became the leading destinations for Central Java s onward migrants over the censuses. This is probably due primarily to people crossing provincial borders within the Jakarta Metropolitan Region. With regards to Central Java s return migration, it is obvious from Table 4.4 that Central Java returnees come from provinces in Java, in particular from Jakarta and West Java Provinces. In 2010, more than half of the Central Java migrants returned from these two provinces, with a further sizeable proportion returning from the three other provinces in Java. The figure had increased by ten per cent from
139 Characterisation of Central Java s migrants 115 Table 4.4 Provincial distribution Central Java s primary, onward and return migrants, 1971 to 2010 (per cent) Province of residence during Primary migrants Onward migrants Return migrants the census/five years before Abbrev. the census (for returnees) DI Aceh DIC North Sumatra SMU West Sumatra SMB Riau R Jambi J South Sumatra SMS Bengkulu BE Lampung L Bangka Belitung Islands* KBB Riau Islands** KR DKI Jakarta DKI West Java JB DI Jogyakarta DIJ East Java JT Banten* BT Bali B West Nusa Tenggara NTB East Nusa Tenggara NTT West Kalimantan KB Central Kalimantan KTE South Kalimantan KS East Kalimantan KT North Sulawesi SLU Central Sulawesi SLTE South Sulawesi SLS Southeast Sulawesi SLTG Gorontalo* G West Sulawesi** SLB Maluku M North Maluku* MU West Papua** PB Papua P Total *): data available since 2000 census, **) data available since 2010 census Source: Author s calculation.
140 Chapter 4 The findings have shown that provincial destinations of both Central Java s primary and onward migrants follow the locations of employment opportunities. Provinces in Java, specifically Jakarta and West Java, have been the centre of economic activities in Indonesia for more than 30 years. At the same time, a substantial proportion of Central Java s return migrants also come from Jakarta and West Java. The opening of new economic activities in some provinces in the outer islands has been important in diverting migrants away from the Jakarta Metropolitan Region. The study found that there were substantial proportions of Central Java s primary and onward migrants in Riau, Central Kalimantan and East Kalimantan Provinces. This is evidence that economic factors play a crucial role in determining provincial destinations of migrants. The current study has confirmed the strong attractiveness of Jakarta, Banten and West Java for Central Java s primary and onward migrants. Since the major reason for Indonesian migrants to move is economic (Hugo, 2001; McDonald et al., 2010), the findings from Table 4.4 indicate that economic opportunity is hugely concentrated in these provinces. This finding is supported by previous studies which argued that unbalanced regional development is the major driver of population movement in Indonesia (Titus, 1978; Lottum & Marks, 2012) Conditional probabilities of migration for Central Java s primary, onward and return migrants The conditional probabilities of migration for Central Java s migrants at the censuses from 1971 to 2010 are shown in Table 4.5, which refers only to those exposed to the risk of migrating who survived to the end of a five-year time interval for each census time. It is observed that the conditional probabilities of migration for Central Java s primary, onward and return migrants follow the same patterns. In 1971, the conditional probability of migration for primary migrants was 23, which means that there were 23 people out of every thousand people who were born in and living in Central Java five years before 1971 who migrated outside of Central Java. Meanwhile, the rates for return and onward migrants were 24 and nine per thousand people, respectively. This means that for every thousand Central Java-born people who lived outside the province in 1966, 24 people returned to the province while nine people had undertaken a subsequent move to another province. 118
141 Characterisation of Central Java s migrants The rates for primary, onward and return migration increased consistently and reached peak points in A dramatic increase is shown for onward migration such that the rate increases more than fivefold from 1971 to Meanwhile, the conditional probabilities of migration for primary and return migrants doubled over the same period. In 2000, all rates experienced a decrease and, in 2010, the conditional probabilities of migration for onward and return migrants decreased even further while that for primary migration increased a little. Table 4.5 also shows that in 1971, the conditional probability of undertaking return migration was higher than that of undertaking onward migration. Compared with the rate of primary migration, the propensity of undertaking return migration was 1.09 while the propensity of undertaking onward migration was Rates of return or onward migration relative to primary migration fluctuated across time. In 2010, it is observed that more migrants decided to move onward than to return to Central Java (1.09 compared to 0.60). Table 4.5 Conditional probabilities of migration for Central Java s primary, onward and return migrants, (per 1000) Year Primary Return Return/ Primary Onward Onward/ Primary The fall in the probability of migrating for Central Java s primary migrants at the 2000 Census may have been related to the Asian economic crisis that occurred at the end of the 1990s. However, it is surprising to find that the propensity to undertake return migration also experienced a decrease during the economic crisis. The fact that few returnees were found in Central Java after the crisis is in line with what Hugo s (2000) view that, during the crisis, many migrants did not return to their places of origin; instead they moved to regions where the effects of the economic crisis were more moderate. This is confirmed by the fact that the ratio of onward migration to primary migration was highest at the
142 Chapter 4 Census. In 2010, the overall economic situation was quite stable and the propensity of undertaking primary migration among Central Javanese people increased compared with The patterns and rates of conditional probabilities of migration by age and sex for Central Java s primary, onward and return migrants It is evident that Central Java s primary, onward and return migrants show similar destination patterns. The majority of primary and onward migrants is going to provinces on Java Island while at the same time a big proportion of Central Java returnees come from those provinces. The overall patterns also show that there is a shift in inter-provincial migration across islands. Historically speaking, Central Java s migrants migrated to provinces on Sumatra Island. Later, their destinations shifted to provinces on Kalimantan Island. The position of Jakarta and its adjacent provinces in attracting migrants is also part of the story. Patterns and temporal changes of Central Java s primary, onward and return migrants by age group and sex are discussed in this section. The conditional probabilities of migration by age and sex are investigated for each type of migrant. Also, patterns of provincial destination by each type of migrant are examined in the analysis. The age patterns of Central Java s primary, onward and return migrants for 2010 are set out in Figure 4.1. The left panel represents the age distribution of Central Java s migrants while the right panel represents the conditional probabilities of migration by age groups of Central Java s migrants. With regards to the patterns of age distribution among Central Java s migrants, it can be observed from Figure 4.1 that the shape for onward and return migrants is similar. The graph for primary migrants is skewed more to the younger ages. The highest percentage of primary migrants is found in the age group years old. One out of three Central Java primary migrants is aged For onward or return migrants, the most prominent age group is years with 21 per cent and 19 per cent for onward and return migrants, respectively. After reaching the highest point, the percentage of primary migrants falls sharply. In contrast, the percentage of individuals either undertaking onward or return migrations decreases at a slower pace. The graph on the right hand side of Figure 4.1 demonstrates the conditional probabilities of migration for Central Java s primary, onward and return migrants in It can be seen 120
143 Characterisation of Central Java s migrants that, out of every thousand people, the propensity of people to be primary migrants is high for the age group years old and reaches its highest point for the age group years. For every thousand population at risk in the age group, a very high 107 people were primary migrants. Migration propensities of people for primary migrants were the same for individuals aged years old and those aged years old. After the age of years old, the conditional probability of migration for primary migrants decreased sharply. Meanwhile, the conditional probability of undertaking onward and return migration was highest amongst those aged years old. At this particular age group, the propensity of individuals who were undertaking onward migration was 59 per 100 while the associated figure was 29 per 1000 for return migration. The propensity of participating in onward migration was higher than it was for participating in return migration over the course of the age distribution. It is also observed from Figure 4.1 that there was a slight hump in the propensity of participating in return migration at the older age group, years old, perhaps reflecting a return to Central Java upon retirement from work. Figure 4.1 Distribution of age groups (%) and conditional probabilities of migration by age groups for Central Java s primary, onward and return migrants (per 1000), 2010 The temporal changes in the distribution of age groups and the conditional probabilities of migration by age groups amongst Central Java s migrants for 2000 and 2010 are exhibited in Figure 4.2. The solid line represents data in 2010 while the dashed line represents data in Over a ten year period, there was little change in the age distribution and the 121
144 Chapter 4 conditional probabilities of migration by age groups amongst Central Java s primary migrants. The percentage of primary migrants aged years old was 29 per cent in 2010, slightly lower than the 32 per cent applying in But the propensity to migrate among individuals of this age group increased from 88 to 107 per 1000 from 2000 to It is observed from Figure 4.2 that the age distribution of Central Java s onward migrants also did not change much. There was a slight decrease in the percentage of onward migrants aged 20 years old and below and in the ages 60 years old and above. In contrast, the conditional probabilities of undertaking onward migration experienced a decrease for all age groups from 2000 to The largest decline in the conditional probability of undertaking onward migration was experienced by individuals aged years old (65 per 1000 in 2000 to 48 per 1000 in 2010). For Central Java s return migrants, it is seen that there was an increase in returnees among people in the age group years old, with the greatest increase being among people in the age group years old. In terms of the conditional probabilities of returning to Central Java, the graph shows that the probabilities of being a return migrant fell in all age groups. The largest falls are shown for those aged 15 years and under. For instance, 110 individuals out of every thousand people aged 5 9 years old returned to Central Java in The associated figure in 2010 was 32 per
145 Characterisation of Central Java s migrants Figure 4.2 Changes in distribution of age groups (%) and conditional probabilities of migration by age groups for Central Java s primary, onward and return migrants (per 1000), Primary Onward Return 123
146 Chapter 4 The temporal changes in the sex ratio of Central Java s primary, onward and return migrants and the conditional probability of migration by sex are set out in Figure 4.3 below. The bar with dots represents data in 2000, while the bar with lines represents data in In all cases except primary migrants in 2000, there were more male migrants than female migrants, and the deficit of males among primary migrants in 2000 was small. Between 2000 and 2010, the sex ratios rose for all three types of migrants. In 2010, for every 100 primary female migrants, there were 108 primary male migrants whilst the associated figure was 119 males per 100 females among the returnees. Figure 4.3 Changes in the sex ratio (males per 100 females) and conditional probabilities of migration by sex for Central Java s primary, onward and return migrants (per 1000), For all migration types and for both years, the conditional probabilities of migration were very similar for men and for women. For both sexes, however, the conditional probabilities for onward and return migration fell substantially between 2000 and 2010 while the probabilities for primary migrants rose slightly. Both onward and return migration may have been high in the five-year period preceding the 2000 Census because of the impacts on employment of the Asian financial crisis but it is interesting that similar falls were not evident for primary migrants. I have further calculated the percentage distribution by age group and sex and the conditional probabilities of migration by age group and sex for 2010, as shown in Figure 4.4. Overall, both the age distributions and the probabilities by age for men and 124
147 Characterisation of Central Java s migrants women were relatively similar. The graphs also show the much greater age concentration among primary movers than among onward and return migrants. In more detail, among Central Java s primary, onward and return migrants, a higher percentage of female migrants than male were found in the younger age groups. The percentage of females was seven per cent higher than it was for males among primary migrants in the age group years old. On the contrary, the percentage of males was substantially greater than females among the productive age groups (25 39 years old). For onward and return migrants, a higher percentage of females than males were found in age groups below 30 years old. In relation to the conditional probabilities of migration by age and sex, it is observed that propensity of undertaking an initial move was higher among females than it was for males in the age group years old. For the rest of the age groups, the male propensities were higher. For onward migration, likewise, the probabilities were higher at younger ages (15 24) than was the case for males and the reverse was true at higher ages. Among return migrants, females had higher probabilities at ages years old. 125
148 Chapter 4 Figure 4.4 Distribution of age groups and sex (%) and conditional probabilities of migration by age groups and sex for Central Java s primary, onward and return migrants (per 1000), 2010 Primary Onward Return Primary Onward Return Further analysis has been carried out by investigating changes in the age groups and sex distribution and conditional probabilities of migration for Central Java s primary, onward and return migrants as set out in Figure 4.5. It can be seen from the Figure 4.5 that among primary migrants, there was an increase in the percentage of males participating in primary migration among the age group years old. For instance, the proportion of male aged years old who were undertaking an initial move increased by two per cent during In contrast, the percentage of females in the same age group experienced a decrease. Among onward migrants, there was a big increase in the number of males who undertook an onward migration among the age groups years old and years old. Meanwhile, females aged years old experienced an increase in the number of onward migrations. For Central Java returnees, there was a substantial decrease among people aged 19 years old and under and an increase among people in the age group years old, for both sexes. Overall, one could say that differences in the patterns across types of migrants are rather influenced by age structures. There was no such substantial difference between males and females. 126
149 Characterisation of Central Java s migrants Figure 4.5 Changes in the distribution of age groups (%) and conditional probabilities of migration by age groups and sex for Central Java s primary, onward and return migrants (per 1000), Primary Onward Return Primary Onward Return With regards to changes in the conditional probabilities of migration by age groups and sex of Central Java s migrants, as shown in Figure 4.5, it is seen that there was an increase in the propensity of participating in a first move for the majority of age groups and for both sexes. Among onward migrants, there was a decrease in the conditional probabilities of migration across all age groups, for both males and females. The greatest decrease in the propensity of undertaking a subsequent move is found among people at the age group years old, with a decrease to 17 and 15 for every 1000 population at risk for males and females, respectively, during the 2000 and 2010 period. The same condition is applied for Central Java returnees. The propensity of undertaking return migration decreased consistently for all age groups and for both males and females. The greatest reduction in the conditional probability of undertaking return migration is experienced among people in young and old age groups, for males and females, respectively. The sex ratios (ratio of males to females) by province of residence during the census for primary and onward migrants or province of residence five years before the census for 127
150 Chapter 4 return migrants are set out in Figure 4.6. The sex ratio for primary migrants in most provinces on Java Island was less than one, except for East Java (JT), meaning more female than male primary migrants. However, in almost all other provinces, there were many more males than females among primary migrants. Between 2000 and 2010, the more prominent trend was for the sex ratios of primary migrants to increase, but there were several provinces where the reverse occurred. With regard to onward migrants, all destination provinces have sex ratios above one, reflecting a greater number of males than females. East Java (JT) stood out as a destination for male onward migrants in 2000 with 2.5 male migrants per female migrant. This ratio dropped sharply to 1.18 in The sex ratios were low in both years for onward migrants to other provinces in Java. The reason why there were a lot more male primary or onward migrants than female migrants found in East Java (JT) during the five years before the 2000 census was possibly related to the economic performance of East Java (JT) in The economic growth of this province was so promising, reaching 8.2 per cent in 1995, the highest growth since 1990 to now. The economic performance of East Java (JT) was mostly caused by substantial growth in male-oriented industries at that time. A few provinces on Sumatra Island experienced a slight decrease in the sex ratios, such as West Sumatra (SMB) and Lampung (L). Some provinces in eastern Indonesia also experienced a decrease in the sex ratios, such as Central Kalimantan (KTE) and Gorontalo (G). In terms of return migrants, the sex ratio was low among provinces on Java Island. 128
151 Characterisation of Central Java s migrants Figure 4.6 Changes in the sex ratio by destination provinces/provinces five years before the census for Central Java s primary, onward and return migrants, Primary Onward Return Patterns and changes in the sex ratios of conditional probabilities of migration by province of residence during the census/province five years before the census are shown in Figure 4.7. It is observed that the sex ratios of the conditional probabilities of migration were lower in some provinces inside of Java than in provinces outside of Java. The sex ratio of the conditional probability of migration for primary migrants was below one in Jakarta (DKI), West Java (JB) and Yogyakarta (DIJ), reflecting higher probabilities of migration for women in these provinces than men. Similar patterns are also shown for onward migrants. The sex ratio of the conditional probabilities of migration for return migrants show that there was an increase in the sex ratio for those undertaking return migration from most provinces in the outer islands. 129
152 Chapter 4 Figure 4.7 Changes in the sex ratios of conditional probabilities of migration by destination provinces/provinces five years before the census for Central Java s primary, onward and return migrants, Primary Onward Return To conclude, it can be said that there are no major differences in the choice of destination of Central Java s primary and onward migrants and the source provinces of return migrants. The Jakarta Metropolitan Region has remained the leading destination for Central Java s primary and onward migrants. Patterns of movement by sex are related to the destination. Migrants to the provinces of Java are more likely to be female while Central Java s migrants are more likely to be male in the outer islands. As the major form of migration is employment-related, the nature of employment offered at the places of destination contributes to sex segregation. It is known that Jakarta and its surrounding regions is characterised by secondary and tertiary economic activities such as manufacturing and services. In contrast, industrial growth in provinces in eastern Indonesia is mainly in primary industries. 130
153 Characterisation of Central Java s migrants 4.5 Discussion and conclusion The objective of this chapter has been to provide a better understanding on the patterns and changes of Central Java s primary, onward and return migrants by utilising five decennial Indonesian population censuses. Specifically, this chapter examined the number of Central Java s primary, onward and return migrants as evidenced by the 1971 to 2010 censuses, the percentage distributions by age and sex of Central Java s primary, onward and return migrants, and patterns and changes in the conditional probabilities of migration for Central Java s primary, onward, and return migrants by age, sex and destination/origin. Past studies have overlooked the importance of sequences of migration that are birthplacespecific in investigating migration patterns. Also, the formula conventionally used to calculate migration rates does not take into account types of migrant and the populations at risk for each type of migrant. This chapter contributes to the migration literature by investigating migration propensity for all types of migrant who were born in Central Java. This problem is overcome in this chapter through the use of the conditional probability of migration that is the rate that indicates the ability of a region to retain or to regain migrants. A total of 510,477 migrations were undertaken by Central Java-born people in the five years preceding the 1971 Census and this increased more than twofold at the 2010 Census, with 1,217,112 migrations. Primary migrants dominated migration patterns. The number of primary migrants increased threefold over the same period of time. In 2010, the percentage of primary migrants reached 75 per cent. There was steady increase in onward migrants; numerically it increased four times and, proportionately it increased two times. The trend for return migrants, however, was the opposite of onward migrants. The percentage of return migrants was 23 per cent in 1971 but reduced sharply to nine per cent in With regards to the age structures, it is observed that in 2010, the highest percentage of primary migrants was found among people in the age group years old. Meanwhile, the peak point for onward and return migrants occurred in the age group years old. The fact that the number of Central Java s primary and onward migrants consistently went up while the number of its return migrants gradually reduced needs explanation. The continuous increase in the number of primary migrants is likely related to the life cycle theory and the age of migration. Individuals undertake an initial move early in their life 131
154 Chapter 4 cycle in order to satisfy their need for educational, occupational and social integration (Détang-Dessendre, Goffette-Nagot, & Piguet, 2008). In general, the number of individuals participating in migration increases between the late teen ages and the early twenties, and then declines after peaking around age 30 (Jones, 1990). Educational and occupational opportunities rose substantially during this period and the population at the peak ages of migration also increased. Apart from the life cycle theory, the personal histories of migration undertaken by individuals also influence their move to a new place and as networks in the destination province increased, so did the number of moves (Détang- Dessendre et al., 2002). The consistent increase in the number of onward migrants reflects the widening of opportunities in new development provinces and the numerical growth of primary migrants (DaVanzo & Morrison, 1981). The fall in return migrants to Central Java is probably due to the relative decline in importance of transmigration which, particularly in the earlier years, was characterised by many failures in the destination provinces (Grant & Vanderkamp, 1986). The conditional probabilities of migration for Central Java s primary, onward and return migrants show quite similar patterns, in which the rates increased gradually during and then slightly reduced in For every thousand Central Java born migrants who resided in the province in 1966, 23 people undertook an initial move in the five years preceding the 1971 Census. The figure increased to 42 in 1990 and then declined slightly to 31 in For return and onward migrants in 2010, the figure was 18 and 34 per 1000, respectively. It is evident that over time, primary migrants were more likely to make a subsequent move to another destination than to return to Central Java. With regard to age, the highest probability of primary migration in 2010 was for year at 107 migrants per 1000 population, having increased from 89 per 1000 in For onward and return migrants, the propensity to migrate was highest among people aged years old. In 2010, the conditional probability of onward migration for people aged years old was 59 per 1000, having fallen slightly from 64 per 1000 in For return migrants, the probability was 29 per 1000 for people in the age group years old in 2010, reducing from 40 per 1000 in The study also showed that the conditional probabilities of migration did not differ much between males and females. When both age and sex were used simultaneously in calculating conditional probabilities of migration for 132
155 Characterisation of Central Java s migrants each type of migrant, the study revealed that rates were similar for males and females in most age groups. However, when the spatial factor was considered, the results showed that conditional probabilities of primary migration were higher for women than for men in the provinces of Java but the reverse was the case for provinces outside of Java. It is evident from this current chapter that onward and return migration rates peaked among individuals aged years old, which is in line with results from previous studies conducted in developed societies (Lee, 2008; Newbold, 2001; Newbold & Cicchino, 2007). There are at least two explanations to support this finding. First, a high proportion undertaking return migration among people in the age group years old may indicate that the migrant always intended to return or pre-planned migration (Grant & Vanderkamp, 1986). Besides being the age group after the peak of primary migration (20 24), this age group also coincides with life cycle events such as completing education, getting married, changing housing or job transfer. Alternatively, returning to the place of origin may indicate a feeling of disappointment or failure towards the outcomes from the initial movement. If the assumption is made that a subsequent move is a corrective movement, then onward migrants undertake a quick decision to move to another promising province (DaVanzo & Morrison, 1981). A corrective movement undertaken by onward migrants also implies unwillingness to return to the place of origin. The next chapter will discuss employment outcomes of Central Java s primary migrants in selected destinations. The aim of the next chapter is to compare and contrast Central Java s primary migrants who moved a relatively short distance with those who moved to other regions within Java Island and those who moved to regions outside of Java Island. In the analysis there will be three destinations, namely Semarang Metropolitan Region (SMR), Jakarta Metropolitan Region (JMR) and Batam-Bintan-Karimun (BBK) zones. The chapter will examine whether or not there are differences in the employment outcomes among Central Java s primary migrants who resided in these three different destinations. 133
156
157 Chapter 5 Employment outcomes of Central Java s primary migrants in different economic zones Introduction Many scholars have studied the impacts of migration on the lives of migrants at the place of destination. In particular, past research has examined the effect of migration on the education and labour market prospects of migrants (Alonso-Villar & Río, 2013; Chiswick & Miller, 2009; Manning & Pratomo, 2013; McDonald et al., 2010), health (Lu, 2010), environmental degradation (Barbieri & Carr, 2005), gender and transition to adulthood (Utomo et al., 2014; Utomo et al., 2013) and age structures (Fuguitt & Heaton, 1995). Less effort, however, has been devoted to studying the effect of migration on people who come from the same place of origin but who migrate to different destinations. In this chapter, firstly, I assess whether migrants from Central Java province have similar types of employment at three different destinations, namely the Semarang Metropolitan Region (SMR), the Jakarta Metropolitan Region (JMR) and the Batam-Bintan-Karimun (BBK) economic zones. Secondly, I investigate whether types of employment offered at the places of destination favour migrants of a particular sex. It is important to investigate the effect of migration on the employment outcomes of people who share the same place of origin but migrate to different destinations for two main reasons. Firstly, it is unlikely that all migrants who come from the same place of origin will go to the same place of destination. In fact, such migrants are more likely to go to different destinations since difference in the place of destination is strongly related to the intention to migrate (Nivalainen, 2003). Secondly, it is generally accepted that the ultimate motivation for many people to migrate to cities is for improved employment opportunities (Hugo, 2001). Employment possibilities in cities are varied because different cities offer different types of jobs (McDonald et al., 2010). On another note, economic activities in cities are often spatially concentrated. The level of spatial concentration ranges from a group of small areas that produce a very specific product to a group of large areas that comprises of a variety of industries that produce different products (Deichmann et al., 5 This chapter was presented in the poster session during the 3 rd Asian Population Association (APA) International Conference, 27 to 30 July 2015, Kuala Lumpur, Malaysia. 135
158 Chapter ). Since economic activities vary across economic zones, it is likely that migrants in each economic zone work in different types of employment. It has long been observed that migrants who make an initial move, known as primary migrants, are most likely to be young people, that is those in their late teens, twenties and early thirties (Lee, 1966; McKenzie, 2008; Raharto & Noveria, 2005; Ravenstein, 1885). Taking a demographic perspective on the transition to adulthood, young people are those who are at a crucial stage of life where many important decisions are taken such as those relating to looking for jobs, pursuing higher education, or getting married (Bailey, 1993; McDonald et al., 2013; Raharto & Noveria, 2005; Thissen et al., 2010). As opposed to the rest of the population, it is the young who have the weakest ties to their families or communities, so that their desire to make an initial move is the greatest (Beshers & Nishiura, 1961; De-Brauw & Giles, 2008; Hugo, 2001). In many cases the initial move made by the young is often made for economic reasons compared to other age groups in the population (McDonald et al., 2013; McKenzie, 2008). Yet, it is the young who face the greatest uncertainty and limited information and knowledge about possible destinations because they have never previously migrated (DaVanzo & Morrison, 1981). This chapter uses a complete set of 2010 Indonesian population census data of all individuals aged years found in the SMR, JMR and BBK zones. The objective of this study is to investigate the employment outcomes of Central Java s primary migrants in the SMR, JMR and BBK zones. Specifically, this chapter raises the questions: 1. Are Central Java s primary migrants more likely to find work than non-migrants? 2. Are employment outcomes different between Central Java s primary male and female migrants? 3. Are Central Java s primary migrants more likely to work in manufacturing, trades or services sectors than non-migrants? 4. Are Central Java s primary migrants in JMR more likely to work in manufacturing than migrants in other zones? 5. Are Central Java s primary female migrant workers to BBK more likely to work in manufacturing than in other zones? This chapter begins by outlining the rationale and objective of the study. Section two explores the literature on the employment outcomes of migrants and how type of 136
159 Employment outcomes of Central Java s primary migrants employment at the place of destination is in favour of a particular sex. Section three introduces three selected destinations of Central Java s primary migrants: SMR, JMR and BBK. Section four proposes the method of analysis and variables used in the study. Section five outlines the results of the study. The last section discusses the findings and concludes the study. 5.2 Literature review Migrants are often attracted to cities where a large number of economic activities is available. In cities, economic sectors are quite often spatially concentrated. The site of concentrated economic activities, which is usually called the economic zone, is often formed through cooperative agreements among the heads of regional governments. An economic zone is ready to operate right after the cooperation agreement is signed. Economic zones can also be created in other ways. For instance, a specific region that acts as the capital city of a nation quite often also acts as the centre of the national economy, and this is the case in Indonesia. As the centre of the national economy, the scale of economic activities in the region is massive, which causes a spill over effect to peripheral regions. This leads to the formation of an economic zone consisting of the core region and its fringe areas. The degree of the spatially concentrated economic activities can be traced by examining the number of migrants entering the zones. A high degree of industrial development in a particular zone absorbs more migrants, distributed over a larger set of urban areas, which consequently extends the economic zones (Firman, 2004). For Central Java s migrants, there are three economic concentration zones that attract migrants most. The first zone is the local economic specific zone, the Semarang Metropolitan Region (SMR), where Semarang, the capital city of Central Java, is located. The other two zones are the Jakarta Metropolitan Region (JMR) and the Batam-Bintan- Karimun (BBK) zones, both of which are located outside Central Java province. JMR is the centre of national economic activities and has been the leading destination for all migrants in Indonesia, including those from Central Java. Although the creation of BBK as a bounded economic zone is quite new compared to JMR, a great number of migrants have come to the region. The latest population census reports that Central Java migrants dominated migration flows into BBK. 137
160 Chapter 5 It is important to examine migration outcomes of Central Java s primary migrants in different economic zones because quite often the types of employment offered by each economic zone vary. In the developed setting, Farmer and Moon (2009) conducted a study on the differences between Mexican migrants who moved to metropolitan areas and those who moved to non-metropolitan areas in the United States. Using data from the Mexican Migration Project, they found that, compared to first time migrators to metropolitan areas, first time migrators to non-metropolitan areas are likely to work in unskilled manufacturing jobs. In the Indonesian setting, Manning and Pratomo (2013) studied the work status of migrants in four big cities in Indonesia, namely Tangerang (part of JMR), Medan (the largest city in Sumatra), Samarinda (a city in East Kalimantan) and Makassar (the largest city in Sulawesi). They classified the work status of migrants into four groups, namely small business, formal, formal casual and informal. Their study found that, relative to the other three cities, Samarinda attracts small business migrants. In contrast, the densely populated industrial city of Tangerang was more likely to attract people into casual employment in the formal sector. Individuals migrate for various reasons, and for many Indonesians, migration is considered as a coping mechanism to seek better jobs at the place of destination (Hugo, 2000; ILO, 2004). Migrants move elsewhere because there is no employment available for them at their place of origin. The only jobs available for them if they decide not to migrate are jobs in the traditional agricultural sector, which offers very low income. The young in particular are often reluctant to work in the traditional sector and prefer to migrate and look for their fortune in cities (Manning & Pratomo, 2013). An industrially concentrated zone, such as the Greater Jakarta zone, attracts a lot of young people who seek job opportunities (McDonald et al., 2013). Another study by Sanders and Brown (2012) measured the response of labour migrants to specific economic zones in the Philippines during by comparing average wages across regions. Their findings suggest that areas with a high concentration of foreign investment tend to offer higher wage rates compared to other places. As a consequence, places with highly paid jobs attract many migrants to come to the zones but the numbers coming surpass the number of formal jobs offered, leading to many migrants working in the informal sector. 138
161 Employment outcomes of Central Java s primary migrants Earlier studies have found that the likelihood of being employed is higher for migrants than for non-migrants because migrants tend to have a higher level of education than local people (Fraser & Uche, 2010; Sanders & Brown, 2012) as migrants to urban centres tend to be selective of the young educated population. A study in the western setting was conducted by Détang Dessendre, Drapier, and Jayet (2004) on young French male migrants based on French youth data. They proposed that it is the young and educated who are the most mobile and who have the highest likelihood of being employed in cities than other types of migrants. They also stated that the more educated the person is, he or she prefers to go to a destination that offers the greatest rate of return on his or her education. In short, as education increases, young people are no longer tied to their place of origin. The young consider that migration to an urban centre is a major human capital investment, while the condition at the place of origin reflects the push factor of migration. Détang Dessendre, Drapier, and Jayet (2004) argued that young migrants have a higher chance of being employed because they have a higher education level compared to nonmigrants. In addition, marital status of an individual also contributes to the likelihood of being employed. Married men are more likely to be employed and earn higher earnings due to their position as bread winner and married women are less likely to be employed. Despite the importance of educational attainment for getting jobs at the place of destination, there is no certainty that a highly educated migrant would be employed at the place of destination without the help of the previous migrants (Hasmath, 2011). Hasmath (2011) studied the labour market experiences of ethnic minorities in Beijing based on data from the 2000 Census and 36 interviews conducted with ethnic minority members and their employers from various enterprises of various sizes during 2006 to Findings from the qualitative research revealed that being a well-educated migrant is not a guarantee that one can get a job in cities unless there is somebody to inform and assist the migrant in finding a job. Hasmath (2011) underlined the importance of the social networks in particular as channels for word-of-mouth exchanges about job openings and for initial introductions to potential employers. From the employer s side, there is tendency that, all being equal, the employer prefers to hire those who have the same ethnic background because they not only need to work together but also to get along and be friends, which is more likely if they belong to the same background. Therefore, migrants with high 139
162 Chapter 5 educational attainment but with a limited social network would have less access to the job market and may experience a slower pace in their career paths. The role of networks in the migration process as a whole is well known in Indonesia. Quite often migrants who have settled economically at the place of destination persuade their families, relatives or even neighbours to follow and work with them (Safitri & Wahyuni, 2013). The former migrants offer temporary shelter and food and provide channels for employment opportunities. Purnomo (2004), who studied labour migration from Wonogiri regency to Jakarta, found that the migrant community in Jakarta plays a crucial role in assisting migrants in terms of accommodation and the search for jobs. His finding suggests that migrants who share the same origin are more likely to have the same type of employment. Haryono (2007) proposed three avenues for how networks fit into the migration process in Indonesia. Firstly, a network is often established based on kinship or sharing the same place of origin. This type of connection reduces the psychological costs of migration. Secondly, a network builds vertically to assist migrants with jobs availability. In this aspect, migrants have a connection with previous migrant workers about job possibilities in their workplace. Thirdly, a network is considered as an alternative to reduce daily expenses at the place of destination. Migrants often live together at the same house with previous migrants to reduce living expenses and to share job information between migrants. In this chapter, the role of networks is measured by a living arrangement variable. The destination choice made by migrants often relates to the types of employment that are possible for them. Despite a variety of jobs offered at the place of destination, it is likely that gender selectivity influences destination choices of migrants. Studies in developing countries show how gender plays a crucial role in destination choice and labour segregation. Barbieri and Carr (2005) studied gender-specific migration in the Northern Ecuadorian Amazon and found that destination choice is significantly different between men and women. Men were more likely to migrate to other rural areas whereas urban areas were more favourable to female migrants. Men went to rural areas because of the fact that males are more likely to work on farms so that they can open a new farm in other rural areas. At the same time, female out-migrants headed to urban areas because their presence in farm work is not significant. Another study was conducted by McKenzie (2008), who observed destination choices of young migrants in developed countries. His study found 140
163 Employment outcomes of Central Java s primary migrants that male migrants tend to work in physically demanding jobs such as construction and agricultural labour. On the other hand, female migrants are most likely to be domestic workers, cashiers, sales clerks, waitresses, and cooks. He argued, in addition, that the types of job available to young migrants are often low in status and offer limited career advancement. In the Indonesian setting, Firman (1999) studied the pattern of female migration to the Jakarta metropolitan city by observing the inter-provincial migration pattern using 1995 inter-censal survey data. His study found that more female migrants than male migrants are found in Jakarta, as documented in the previous chapter on Central Java migrants. He suspects that the reason for an increasing number of female migrants in Jakarta is related to the type of jobs offered, which favour women. This situation is a result of an increasing level of female education and the rising number of export-oriented businesses. The most recent findings on the employment outcomes of young migrants in Greater Jakarta are provided by McDonald et al. (2013). Using data from the 2010 Greater Jakarta Transition to Adulthood Survey, the study found that age at migration is crucial in determining migration outcomes. The overall findings suggest that migrants are more likely to be employed than non-migrants. Migrants were also more likely to be self-employed and to be working as domestic helpers in households and less likely to be working for a private company. They also found that male migrants often work as street sellers while female migrants are more likely to work as domestic helpers. Over time, only a few migrants had improved their employment; and many migrants do not to move to the formal sector due to their low level of education. Findings from Batam, Kepulauan Riau are provided by Lindquist (2002). The study found that compared to male migrants, more female migrants were engaged in the manufacturing and tourism sectors in Batam. A more recent study conducted by Pardede & Nasution (2013) also found that female migrants have a higher likelihood of working in the manufacturing industry in Batam. 5.3 SMR, JMR and BBK zones It is important to investigate Central Java s primary migrants in the SMR, JMR and BBK zones for several reasons. Firstly, with respect to distance, SMR is the closest destination for the migrants, followed by JMR which is located in the northern part of Java Island. BBK, however, is located in Sumatra very close to Singapore and quite far from Central 141
164 Chapter 5 Java. Secondly, on the aspect of adaptation to the places of destination, Central Java s primary migrants found in SMR may face less difficulty than those who are found in JMR and BBK since the nature of the local people of SMR is mostly homogeneous and they have cultural similarity to Central Java s primary migrants. Sharing the same language and ethnicity could reduce migration costs for migrants (Massey & España, 1987). On another note, the role of networks may increase when migrants move a long distance (Purnomo, 2004). Thus it is likely that migrants rely more on networks in JMR and BBK. Thirdly, while SMR is within Central Java province, it is included in this analysis so that those who move a long distance from the province of origin can be compared with those who make the main alternative choice, movement to the largest centre within the province. Finally, other zones or corridors such as the Surabaya corridor are not used in this study because, compared to the three zones that are part of the study, the numbers of migrants are small. The SMR zone with the local name Kedungsepur (stands for Kendal, Demak, Ungaran, Salatiga, Semarang and Purwadadi) is a specific zone formed by Central Java s government, aiming to boost the provincial and national economies by utilising regional cooperation among cities/regencies. The SMR zone consists of six regions: two cities (Semarang and Salatiga) and four regencies (Kendal, Demak, Semarang and Grobogan). At the end of 1998, six mayors/regents agreed and signed a cooperation agreement on the formation of the SMR zone. The agreement was to run for a five-year period. However, it did not run as planned because each region had different perspectives on how to utilise their own resources and failed to prioritise regional connectivity (Martono, 2008). In 2005, the proposal was renewed by bringing a more focused proposal on how to boost economic development under regional connectivity. There are some crucial aspects that were mentioned in the proposal, such as agreements on manufacturing, trade, transportation, tourism, education, culture, employment and so on (Martono, 2008). The SMR zone has several privileges, in particular in terms of geographical location. Firstly, the existence of Semarang, the capital city of Central Java, in the zone has been leading the regional economy in the province. Secondly, spatially speaking, this zone is located in the Northern part of Java Island with connecting lines between West Java and East Java 6. In addition, the zone has long been known for its tourism sector. 6 It hosts the main interprovincial roads between West Java and East Java. The roadway is called Pantura (Jalur Pantai Utara) 142
165 Employment outcomes of Central Java s primary migrants The JMR, also known as Jabodetabek, is a zone located in the northern part of West Java. The JMR consists of 13 administrative units (eleven cities and two regencies) and is combined from three different provinces, namely Jakarta, West Java and Banten. Despite the fact that the land size of JMR comprises only 0.33 per cent of the national land area, the zone contributes almost a quarter of Indonesia s GDP and absorbs 40 per cent of total foreign investment. The JMR zone is influenced by the role of Jakarta as the capital city of the nation. The most obvious feature of the massive development in Jakarta is the dramatic increase in the number of industries established by both government and private investors. At the same time, many expensive housing complexes, new golf courses, shopping centres and other extensive land conversion projects have shifted the function of the zone to its fringe regions (Cybriwsky & Ford, 2001). As a result of land restructuring, manufacturing shifted from the core of Jakarta to its peripheral regions. The effect of a spill over of Jakarta to its surrounding regions was studied by Firman (1997), who found that there was a significant difference in the proportion of investment found in Jakarta and in its peripheral regions. Firman (1997) argued that Jakarta has received a greater proportion of investment in the tertiary sector, while its peripheral regions mostly absorbed investment in the secondary sector. The BBK economic zone is a group of three big islands: Batam, Bintan and Karimun, located within Kepulauan Riau, a province on the border with Indonesia, Malaysia and Singapore. There were 1.7 million people in Kepulauan Riau in 2010 of which more than half lived in Batam. Among the three big islands, it is Batam that has the greatest proportion of land compared to the other two islands. For instance, with a size of 1,570 square kilometres, the land area of Batam is 715 square kilometres, equal to 46 per cent of the whole area. The formation of BBK as a specific economic enclave was in fact influenced by the rapid development of Batam Island. The development of Batam as an industrial zone dates back to a 1971 Indonesian presidential decree (Kam & Kee, 2009). The aim was to boost the Indonesian economy and to compete with Singapore s economy. At the end of the 1970s, a plan was designed to assign Batam as the centre of industrial, commercial, and tourism activities in Indonesia. By 1989, Batamindo Industrial Park was built on two thousand hectares of land and eight industrial estates were built in the area. In 1990, regional cooperation between Singapore, Johor Bahru in Malaysia and Kepulauan Riau in Indonesia was initiated. The purpose of the agreement was to promote investment 143
166 Chapter 5 and accelerate production in the region, and reduce interference of local government policies in economic activities (Peachey, 1998). The idea of international regional cooperation came from the Singapore government, who were concerned about rising labour costs in the country and persistent land scarcity for expanding manufacturing (Lyons & Ford, 2007). In 2006, the Indonesian government officially formed the BBK zone as one of the eight economic zones, in partnership with Singapore (Kam & Kee, 2009). Bintan and Karimun Islands are included in the zone as part of the economic enclave of Batam Island. The SMR, JMR and BBK have several things in common. Firstly, the provincial/national capital city is located in each zone. For instance, Tanjung Pinang, the capital city of Kepulauan Riau province is located in Bintan Island. Secondly, the three zones were formed to boost economic activities in the zones and their surrounding regions. Thirdly, the economic structure of the three zones is quite similar. Each of the economic zones relies on the manufacturing, trades and service sectors for its economic activities. 5.4 Variables, method and data used in the study Definition of variables used All individuals are classified as non-migrants, Central Java s primary migrants, other primary migrants, or other migrants. Non-migrants are considered to be the local people of SMR, JMR or BBK. Non-migrants are conceptualised as individuals who have had no migration experience in their entire life. For example, non-migrants of SMR are individuals who were born in SMR, who lived in SMR five years before the census and who resided in SMR during the census. The same concept is also applied for JMR and BBK. Central Java s primary migrants are defined as individuals who were born in one region in Central Java (outside SMR), who resided in the region five years before the census and who resided either in SMR, JMR or BBK zones during the census. For instance, Central Java primary s migrants in SMR are a group of individuals who were born in a region in Central Java (outside SMR), who remained in the region five years before the census and who lived in SMR during the census. A similar definition is applied for JMR and BBK that is, individuals who were born in a region in Central Java, who remained in that region five years before the census and who resided either in JMR or BBK at the time of the census. Other primary 144
167 Employment outcomes of Central Java s primary migrants migrants are individuals who come from other provinces outside the zones, with no other migration experience. As an illustration, other primary migrants to the BBK zone are individuals who were born outside Riau Islands province, who remained in the region five years before the census and lived in BBK during the census. The last category is other migrants which comprises all individuals who are not included in either one of the previous classifications. Thus, other migrants could be a group of return migrants, longer-term migrants or onward migrants. Return migrants are a group of individuals who were born in the zone, who lived outside the zone five years before the census and who had returned to the zone during the census. Longer-term migrants are a group of individuals who were born elsewhere, who resided in the zone five years before the census and during the census. The definition of onward migrants used in this chapter is the same as used in Chapter 4 that is, a group of individuals who were born in one region, who resided in another region five years before the census and who moved to another new region during the census. The reason for classifying all individuals into four groups is to reduce bias due to migration experiences that potentially can influence the employment outcomes of migrants. Individuals are categorised into four age groups: years old, years old, years old and years old. In the empirical analysis, people aged years are treated as the reference group. Sex is defined as males and females while marital status is grouped into unmarried and married/ever married. The census data recorded nine categories of educational attainment. In this current study, educational attainment is classified into four groups: completed primary school or lower, completed junior high school, completed senior high school, and completed university degree or tertiary diploma. The lowest level of educational attainment is used as the reference group. Living arrangements can be used as a proxy indicator to predict the presence of a noninstitutional network at the place of destination. In this study, the role of a network is indicated if an individual is living with his/her family or others at the place of destination. A living arrangement variable is categorised into three groups, namely living alone (acting as a sole householder), living with family (sharing the same house either with spouse, sons, parents, or with other next of kin) and living with others (sharing the same house with someone/group of people who have no blood relationship). 145
168 Chapter 5 The main activity of individuals in this study is categorised into three groups: working, not working, studying, and inactive. Inactive is defined as persons who neither go to school nor work/look for jobs. For those who were working at the time of the census, their economic sector is classified into manufacturing, trade, service and other sectors. In the 2010 population census, there were 19 economic sectors. I divided the 19 economic sectors available in the census data into four broad economic sector categories. The classification of the economic sectors in this current chapter is mostly based on the economic structures of SMR, JMR and BBK and also based on previous studies on employment outcomes of migrants that have been conducted in Indonesia. Out of 19 economic sectors, I grouped manufacturing sector (code 8), trade sector that consists of wholesale & retail (code 11) and hotel &restaurant (code 12), service sector that consists of educational services (code 16), health services (code 17) and public & personal services (code 18), and other sectors consisting of the remaining economic sectors that consists of rice & crops plantation (code 1), horticulture (code 2), plantation (code 3), fishery (code 4), livestock (code 5), forestry (code 6), mining & quarrying (code 7), electricity & gas (code 9), construction (code 10), transportation & storage (code 13), information & communication (code 14), financial & insurance (code 15) and others (code 19) Method and data used The main objective of this study is to examine the employment outcomes of Central Java s primary migrants across different economic zones. To gain a comprehensive knowledge on employment outcomes, two multivariate models are applied in this study. The first model examines the likelihood of being in work for individuals aged years by migration status and is controlled by age, sex, education, marital status, and living arrangements. There will be three models produced for each zone: males, females and pooled (that is, a group consisting of both males and females). The second model investigates the probability of being in work in a particular sector by migration status and is controlled by other explanatory variables. Zones are treated as a dummy variable and used as one of the control variables. For this model, the unit of analysis is all individuals aged years who were currently working. This model provides insight into the employment prospects of Central Java s primary migrants engaged in the manufacturing, trade and service sectors. This sectoral analysis model is run for the whole population and separately for each destination. For each zone, there will be three models provided: males, females and pooled. 146
169 Employment outcomes of Central Java s primary migrants A binary logistic regression is utilised for the first empirical model. Consider: where is an independent variable, and G is a function taking on values strictly between zero and one: 0 <G(z) < 1, for all real numbers z. The non-linear function of G is assumed to follow a logistic distribution: For model one, the value of a dependent variable is: The explanatory variables are migration status, age, sex, education level, marital status and living arrangements. The effect of migration status on the likelihood of being in work is investigated by controlling the effect of other explanatory variables. Model one is run separately for males, females and pooled in the SMR, JMR and BBK zones. In total there are nine models. There are two hypotheses for this model: 1. Migration status influences the likelihood of being in work. 2. Central Java s primary migrants are more likely to be in work than non-migrants. The second model examines whether or not migration status influences the propensity to work in the manufacturing, trade or service sectors. A logistic binary regression is adopted to examine the likelihood of being in work in manufacturing, trade, and service sectors. Thus, there are three values for dependent variables:
170 Chapter 5 The logistic binary regression model is run twice; for the total population and for each zone. The model for the total population uses zones as one of the controlled variables. The model for each zone runs separately for males, females and pooled. There are three hypotheses for this model: 1. Migrants are more likely to work either in the manufacturing, trade or service sectors than non-migrants. 2. The likelihood of Central Java s primary migrants to work in the manufacturing sector is higher than it is for other types of migrants. 3. Sex contributes to the sectoral outcomes of migrants. When using a dichotomous dependent variable, logistic and probit regressions have become standard methods of analysis. A logistic binary regression model is preferred in this chapter because of its simplicity in interpretation when compared with a probit regression model (Allison, 1999; Dey & Astin, 1993). To interrogate the research question relating to the likelihood of being in work in a particular sector, a check for robustness has been undertaken by using a multinomial logistic regression model. The model shows that the coefficients and the signs of each variable derived from a multinomial regression model are similar to binary logistic regression models. Since the interpretation of logistic binary regression models is easier to apply and interpret than a multinomial logistic regression model and the findings from both models are consistent with each other, a logistic binary regression is chosen in this study. A full count of the 2010 Indonesian Census data is utilised in this study with the population of all individuals aged years found in the SMR, JMR and BBK zones as the units of analysis. For the descriptive analysis, information on the migration status of individuals aged five years and above is provided. The reason for doing this is to gain perspectives on the age patterns and current activity of the overall population. For the empirical analysis, the unit of analysis is adjusted for the purpose of each model. 148
171 Employment outcomes of Central Java s primary migrants 5.5 Findings Descriptive analysis Figure 5.1 Age group distribution of population aged five years and above by migration status in SMR, JMR and BBK, 2010 (per cent) The descriptive analysis begins by plotting population aged five years and above found in SMR, JMR and BBK according to their migration status, as shown by Figure 5.1 above. It can be observed from Figure 5.1 that the age distribution of primary migrants peaks at the age group years. Compared to other primary migrants, the proportion of Central Java s primary migrants aged years was higher in all zones. For instance, 23 per cent of Central Java s primary migrants aged years were found in JMR while the associated figure was 17 per cent for other primary migrants. More of Central Java primary s migrants aged years are found in BBK than in the other zones. The percentages of individuals who undertake primary migration are low after the age group years old. It can be said that patterns of primary migration are mostly found at the young ages, when many important life decisions such as the decision to participate in the labour market take place. Therefore it is important to investigate the employment outcomes of the population in the age group years old based on their migration status. Next, Table 5.1 outlines the main activity of the population aged years by migration status in SMR, JMR, and BBK. Comparatively, Central Java s primary migrants in SMR had 149
172 Chapter 5 a lower percentage in work than those who were found in other zones. In SMR, 48 per cent of Central Java s primary migrants worked while another 38 per cent studied. As opposed to the other two zones, the percentage of Central Java s primary migrants who studied in SMR was higher. Meanwhile, it is shown that in JMR and BBK, eight out of ten of Central Java s primary migrants worked. Less than three per cent of this group studied in JMR. An even lower percentage was found in BBK. It is also interesting to find that compared to other primary migrants, Central Java s primary migrants had higher percentages working in all zones. Although this result needs further investigation, Table 5.1 provides some indirect clues on the motivation to migrate for Central Java s primary migrants. It seems that the intention of Central Java s primary migrants to SMR was either to seek work or to pursue higher education. Meanwhile, the ultimate aim of going to JMR or to BBK was for work purposes. Table 5.1 Main activity of population aged years in SMR, JMR, and BBK (per cent) Migration status Worked Not worked Studied Inactive SMR Non-migrants Central Java s primary migrants Other primary migrants Other migrants JMR Non-migrants Central Java s primary migrants Other primary migrants Other migrants BBK Non-migrants Central Java s primary migrants Other primary migrants Other migrants Among groups of migrants, the percentages of those who were inactive were high for nonmigrants and other migrants in all economic zones and the number of females was higher than the number of males. For instance, 33 per cent of female other migrants in SMR were inactive. A higher percentage was found in JMR and BBK. Meanwhile 34 per cent of female non-migrants in SMR were inactive. The associated figure was 48 per cent and 46 per cent for both JMR and BBK, respectively. In all zones, the percentages of other migrant groups who are inactive increase with age. For instance, nine per cent of other migrants aged years in SMR were inactive, while the associated figure for the older 150
173 Employment outcomes of Central Java s primary migrants age group was 20 per cent. On the contrary, similar patterns are not true for non-migrants. The age pattern of those who were inactive among non-migrants group follows an inverted U shape. In JMR for instance, 23 per cent of non-migrants in the age group years old were inactive. This percentage increased and reached 27 per cent for the age group years old and then gradually decreased. Although the age patterns are not exactly identical, it is still possible to say that both non-migrants and other migrants have similar patterns of activities. For those who were currently working, information on their economic sector by migration status is provided by Table 5.2. Overall, the manufacturing sector has been the most attractive sector for all migrants in all economic zones. For instance, one out of three of Central Java s primary migrants in JMR worked in the manufacturing sector, meanwhile a bigger percentage was found in BBK. It is interesting to note that the percentage of nonmigrants who worked in the manufacturing sector in BBK was much lower compared to the other two zones. Working in the services sector has been an alternative for Central Java s primary migrants in SMR and in JMR but not in BBK. About 32 per cent of Central Java s primary migrants worked in the service sector in SMR. The associated figure was 34 per cent for JMR. They mostly worked in the public and personal services sectors. The other economic sector that attracts Central Java s primary migrants in all zones is the trade sector. About 15 per cent of Central Java s primary migrants in BBK worked in the trade sector. On another note, it is observed that non-migrants are mostly involved in the traditional economic sector in SMR and in BBK. In SMR, nearly 19 per cent of nonmigrants worked in the rice and crop plantation sector, meanwhile 15 per cent of nonmigrants worked in the fishery sector in BBK. Most non-migrants in JMR did not work in the agriculture sector, but a substantial proportion of them were found in the transportation and storage sectors. 151
174 Chapter Table 5.2 Economic sector of employed individuals aged years in SMR, JMR and BBK (per cent) Economic sector SMR JMR BBK Total Total Total Manufacturing Trades Wholesale & retail Hotel & restaurant Services Education services Health services Public & personal services Others Rice & crops plantation Horticulture Plantation Fishery Livestock Forestry Mining& quarrying Electricity & gas Construction Transportation & storage Information & comm Financial& insurance Others Total Note: 1. Non-migrants; 2. Central Java s primary migrants; 3. Other primary migrants; 4. Other migrants.
175 Employment outcomes of Central Java s primary migrants Further analysis has been carried out by investigating the characteristics of individuals aged years based on their employment status in the SMR, JMR and BBK zones, which is shown in Table 5.3 below. Employment status is classified into two groups: worked and did not work during the census. It can be seen that Central Java s primary migrants were a higher percentage among those who were working than among those who were not working. The opposite is true for non-migrants. Among those who worked, higher percentages were found in the older age groups. On the contrary, among those who did not work, higher percentages were found in the younger age groups in all zones. For instance, about 46 per cent of those who did not work in SMR were found in the age group years old. The associated figure was 37 per cent and 29 per cent for JMR and BBK, respectively. Thus, it is speculated that the intention of people aged years to migrate to SMR was to pursue higher education. This fact is supported by the previous table (Table 5.1) where as many as 48 per cent of Central Java s primary migrants were studying in SMR. In addition, it is much less likely that school migration is part of the intention of Central Java s primary migrants in JMR and BBK. They come to JMR and BBK mainly for employment. There are differences in the work status of individuals aged when segregated by sex. Among those in work, a higher percentage were male than female across all economic zones. The greatest difference was found in JMR where the percentage of workers who were male was almost double that for females. Among those in work, the percentage increased as education level increased. Individuals who had completed senior high school represented the highest percentage of those who were working. Over 60 per cent of workers in BBK held senior high school certificates. It can also be observed that workers in SMR and JMR are more likely to be married than non-workers. In contrast, the opposite is true in BBK, where as much as 54 per cent of workers were unmarried. Also in BBK, the majority of workers were living alone (63 per cent). It should be noted that those who were living in shared accommodation like barracks were classified in the census as living alone. 153
176 Chapter Table 5.3 Work status of individuals aged years in SMR, JMR and BBK (per cent) Variable Not worked SMR JMR BBK Worked Total Not Not Worked Total worked worked Worked Migration status Non-migrants Central Java s primary migrants Other primary migrants Other migrants Age group Sex Male Female Highest education completed Primary school or lower Junior high school Senior high school University degree Marital status Unmarried Married Living arrangement Living alone Living with family Living with others Total % N 885,822 1,121,687 2,007,509 5,024,874 6,031,337 11,056, , , ,369
177 Employment outcomes of Central Java s primary migrants The descriptive analysis has been further continued by investigating the characteristics of individuals aged years who worked in the manufacturing, trade, service, and other sectors as shown in Table 5.4 below. The three economic sectors are chosen because they are the top three economic sectors for migrants employment as stated in Table 5.2. The rest of the economic sectors are grouped into the other sectors. In SMR, the manufacturing sector was dominated by non-migrants. Central Java s primary migrants contributed five per cent to the total percentage of those who worked in the manufacturing sector. On the contrary, the manufacturing sector in BBK was dominated by migrants whilst non-migrants only contributed less than five per cent from the total percentage of workers found in the manufacturing sector. Meanwhile the percentage of Central Java s primary migrants who worked in the manufacturing sector was six per cent. A quite different picture was found in JMR in which the manufacturing sector constituted both non-migrants and other migrants. In total, the two groups contributed more than 90 per cent. In interpreting these percentages for other migrants, it should be remembered that these can include migrants from Central Java who moved to JMR more than five years before the census. To be a primary migrant, the person had to move for the first time in the five years before the census. It is interesting to note that the percentage of Central Java s primary migrants working in manufacturing in JMR is double the percentage of primary migrants from other regions. Across all economic zones, the percentage aged in the manufacturing sector was lower than for other age groups and the concentration of manufacturing workers tended to be for those in their twenties. Also in manufacturing, males outnumbered females in both JMR and BBK. The majority of manufacturing workers had senior high school qualifications. The percentage of unmarried outnumbered married among workers in manufacturing in BBK. The opposite is true for SMR and BBK. The majority of manufacturing workers in SMR and JMR are living with their families. Those who are living alone are mostly found among workers in BBK. 155
178 Chapter Table 5.4 Economic sectors of individuals who were currently working in the SMR, JMR and BBK (per cent) Variable SMR JMR BBK Total Total Total Migration status Non-migrants Central Java s primary migrants Other primary migrants Other migrants Age group Sex Male Female Highest level of education Primary school or lower Junior high school Senior high school University degree Marital status Unmarried Married Living arrangement Living alone Living with family Living with others % N (thousand people) ,122 1,731 1,266 1,053 1,981 6, Note: 1: Manufacturing; 2. Trade; 3. Service; 4. Others.
179 Employment outcomes of Central Java s primary migrants It is worthwhile to examine whether or not the types of employment of migrants are identical across different destinations. Table 5.5 provides the percentages of Central Java s primary migrant workers in each economic sector in the SMR, JMR and BBK zones. The overall findings suggest that types of employment of Central Java s primary migrants found in SMR and JMR are similar, in that one third of the total migrants worked in the manufacturing sector and another one third worked in the service sector. On the contrary, a different picture is found in BBK. The majority of Central Java s primary migrants worked in the manufacturing sector (58 per cent) and only eight per cent of them engaged in the service sector. It is also observed that manufacturing workers in all economic zones were mostly people in the age group years old. Thus, it is likely that they had completed senior high school before working in the manufacturing sector. There was a substantial percentage of workers aged years who worked in the service sector in SMR and JMR. The manufacturing sector employed more female migrants than male migrants both in SMR and BBK. Meanwhile the service sector is dominated by female migrants in all zones. It is observed that those who worked in the manufacturing sector were senior high school graduates. In contrast, the educational qualifications of the majority of workers in the service sector were junior high school graduates or less. Based on their low educational background, it can be said that those who engaged in the service sector were mostly working in the informal sector such as working as street vendors and petty traders. The marital status of the majority of Central Java s primary migrant workers in most of the economic sectors is unmarried. This can be explained because this study focused on Central Java s primary migrants, a group of individuals who make an initial move, which is mostly dominated by young people. With regards to living arrangements, it can be seen that there are differences in the living arrangements between migrants in BBK and migrants in SMR and JMR. The majority of migrant workers in SMR and in JMR are living with their families. In contrast, migrant workers in BBK tend to live alone. Based on findings from the descriptive analysis, there are several interesting points that need to be highlighted. Firstly, choice of destination could be used as an indicator to predict the motivation to move among Central Java s primary migrants. Central Java s 157
180 Chapter 5 primary migrants in SMR were a combination of those studying and those working. In contrast, the large majority of Central Java s primary migrants found in JMR and in BBK were working. Secondly, the classification of migration status allows us to capture whether or not place of origin and migration experience contribute to employment outcomes and the likelihood of being absorbed into the manufacturing, trade or services sectors. Compared to other primary migrants, the percentage of Central Java s primary migrants who worked was higher in SMR and in JMR. It is speculated that a strong migration connection between Central Java s primary migrants and other types of Central Javanese migrants at the place of destination contributed to this process. Thirdly, the percentage of Central Java s primary migrants who worked in the manufacturing sector was high in all economic zones. This finding is supported by previous studies on the employment prospects of migrants in Indonesia. Past studies have found that working in the manufacturing sector is the ultimate expectation for most of the migrants (Firman, 1999; Manning & Pratomo, 2013; McDonald et al., 2013). Lastly, the differences in characteristics of Central Java s primary migrant workers in different economic zones suggest that destination choice contributes to these differences. For instance, among Central Java s primary migrants who worked in the manufacturing sector in SMR, more than 70 per cent of them were female. A similar pattern can also be found in BBK but with a smaller gap. In contrast, male migrants predominated among those who worked in the manufacturing sector in JMR. 158
181 Employment outcomes of Central Java s primary migrants 157 Table 5.5 Economic sectors of Central Java s primary migrant workers aged years in SMR, JMR and BBK (per cent) Age group Variable SMR JMR BBK Total Total Total Sex Male Female Highest level of education Primary school or lower Junior high school Senior high school University degree Marital status Unmarried Married Living arrangement Living alone Living with family Living with others % N 13,812 8,104 12,034 11,366 45,316 94,917 44,253 90,793 54, ,232 10,288 1,902 1,477 4,169 17,836 Note: 1. Manufacturing; 2. Trade; 3. Service; 4. Others
182 Chapter Odds of being in work Table 5.6 provides the odds ratio of being in work among individuals aged years in each economic zone. For each zone, I ran three models: males, females and pooled. After controlling for sex, age, education, marital status and living arrangements, the likelihood of being in work for Central Java s primary migrants varies across economic zones. In SMR, Central Java s primary migrants are less likely to work than non-migrants. However, the opposite is true for Central Java s primary migrants found in JMR and BBK zones. In JMR for instance, the likelihood of being in work for Central Java s primary migrants is 4.6 times higher than for non-migrants. The probability of being in work of Central Java s primary migrants is even much higher in BBK, seven times higher than for non-migrants. Other types of migrants are also more likely to be in work than non-migrants. When the models are run separately for males and females, it is evident that among Central Java s primary migrants in JMR and BBK, employment outcomes of both male and female migrants were higher than for non-migrants of the same sex. For instance, the propensity for Central Java s primary male migrants to be in work in JMR was ten times higher than it was for male non-migrants, while the propensity to be employed for Central Java s primary female migrants was three times higher than it was for female non-migrants. The likelihood of being in work increased with age. For instance, the likelihood of being in work in JMR is 4.9 times higher for individuals aged years than the reference age group aged years and eight times higher for those aged years. The results from the pooled models show that individuals who had completed senior high school were more likely to work than those with primary school education or lower in JMR and BBK but less likely to work in SMR. Individuals with university degrees had a higher probability of working than the reference category in all zones. When sex is taken into account, it is evident that the effect of higher education on the likelihood of being in work is significant for females but not for males. In JMR and BBK, females who had completed senior high school were much more likely to work than those with a primary school or less. However, males who had senior high school certificates were less likely to work in these two zones than the reference category. The effect of education on the likelihood of being in work was strong among females. Females with university degrees were two times more likely to be work in SMR, four times more likely to be work in JMR and six times more likely to be working in BBK than the reference category. 160
183 Employment outcomes of Central Java s primary migrants 159 Table 5.6 Odds of being in work in SMR, JMR and BBK Migration status Sex Age Variable SMR JMR BBK Male Female Pooled Male Female Pooled Male Female Pooled Non-migrants (Ref.) Central Java s primary migrants 0.695** 0.913** 0.893** ** 3.038** 4.619** 9.205** 5.641** 6.835** Other primary migrants 0.560** 0.351** 0.418** 2.361** 1.353** 1.702** 3.730** 3.737** 4.008** Other migrants 0.925** 0.799** 0.829** 1.843** 1.145** 1.315** 1.931** 1.726** 1.675** Male (Ref.) Female 0.308** 0.185** 0.140** (Ref.) ** 3.523** 4.504** 6.204** 3.376** 4.892** 7.237** 5.305** 7.874** ** 5.376** 8.207** ** 3.831** 7.719** ** 6.248** ** ** 6.182** 9.930** ** 3.663** 8.365** ** 6.542** ** Education Primary school or lower (Ref.) Junior high school 0.732** 0.885** 0.870** 0.763** 1.125** ** ** Senior high school 0.517** 0.914** 0.817** 0.760** 1.609** 1.305** 0.751** 1.969** 1.476** University degree 0.769** 1.965** 1.638** 0.846** 4.364** 2.766** ** 3.392** Marital status Unmarried (Ref.) Married 6.402** 0.951** 1.750** 2.912** 0.411** 0.959** 3.516** 0.112** 0.331** Living arrangement Living alone (Ref.) Living with family 1.181** 0.849** 0.893** 0.914** 0.406** 0.488** 0.803** 0.764** 0.778** Living with others 1.195** 2.441** 2.027** 3.790** 9.781** 8.721** 1.809** 3.706** 3.058** Constant 0.293** 0.313** 0.508** 0.247** 0.498** 0.819** 0.385** 0.232** 0.663** Number of observation 994,099 1,013,410 2,007,509 5,537,761 5,518,450 11,056, , , ,369 LR chi2 (12) 471, , , ,260, ,023, ,420, , , ,677.5 Prob.>chi Pseudo R **): Significant at 1% level; *) Significant at 5% level.
184 Chapter 5 With regard to marital status, married males are more likely to be working than unmarried males. Meanwhile married females are less likely to work than unmarried females. Both males and females who are living with others are more likely to work than males and females who are living alone Sectoral analysis Further analysis has been carried out by examining the likelihood of being in work in the manufacturing, trade and service sectors relative to all other sectors. The unit of analysis is individuals aged years who were currently working. Table 5.7 shows that after controlling for sex, age, education, marital status, living arrangements and zones, the likelihood of Central Java s primary migrants to work in the manufacturing sector was 2.3 times higher rather than to work in the remaining sectors as opposed to non-migrants. Central Java s primary migrants are also more likely to work in the trade and service sectors than their counterparts. Similar patterns are also observed for other types of migrants. Relative to males, the propensity of females to work in the manufacturing sector rather than the rest of the sectors is three times higher. Females are also more likely to work in the trade and service sectors. In terms of age, the likelihood of working in either manufacturing, trade or service sectors decreases with age. Meanwhile, those who had completed senior high school have the greatest probability of working in the manufacturing sector or in the trade sector as opposed to the reference group. University degree holders are less likely to work in the manufacturing sector or in the trade sector than they are to work in the remaining sectors relative to their counterparts, however, their propensity to work in the service sector is two times higher than their propensity to work in any of the remaining sectors. Among individuals who are currently working, married people are more likely to work in the service sector than any of the remaining sectors and they are less likely to work in the manufacturing or trade sectors, compared to unmarried people. With regards to living arrangements, individuals who are living with others are more likely to work in the trade or service sectors than the rest of the sectors, as opposed to people who are living alone. 162
185 Employment outcomes of Central Java s primary migrants It is also observed from Table 5.7 that individuals who resided in JMR and BBK were more likely to work in the manufacturing or trade sectors than any of the other sectors as compared to people who resided in SMR. Unlike people in JMR who are more likely to work in the service sector, individuals who resided in BBK are less likely to work in the service sector than to work in any of the other sectors, as opposed to individuals who resided in SMR. Results from Table 5.7 suggest that Central Java s primary migrants, like other types of migrants, are more likely to work in the manufacturing, trade and service sectors than the local people (non-migrants). The likelihood of working in these two sectors is higher in JMR than it is in other zones, suggesting accessibility to migrants of employment offered by the manufacturing sector and the trade sector in JMR. Among those who are working in the service sector, their likelihood of being in work increases with education. Thus, it can be said that the service sector offers jobs regardless of the levels of education of migrants. Those with university degrees could work in the education, health or the public services sector, while those who only completed junior high school might work in the personal services sector. Findings from Table 5.7 suggest that overall there are differences in the employment availability offered in each zone and the presence of sex segmentation. The analysis has been continued by running separate models for males, females and pooled for each zone. Table 5.8, 5.9 and 5.10 provide the likelihood of being in work in a particular sector in the SMR, JMR and BBK zones. 163
186 Chapter 5 Table 5.7 Odds of being in work in the manufacturing, trade and service sectors Variable Manufacturing vs. the rest of the sectors Trade vs. the rest of the sectors Service vs. the rest of the sectors Migration status Non-migrants (Ref.) Central Java s primary migrants 2.254** 1.849** 1.861** Other primary migrants 1.882** 1.659** 1.317** Other migrants 1.413** 1.573** 1.330** Sex Male (Ref.) Female 3.288** 2.431** 1.073** Age group (Ref.) ** 0.832** 0.663** ** 0.737** 0.646** ** 0.721** 0.658** Highest level of education Primary school or lower (Ref.) Junior high school 2.053** 1.532** 1.410** Senior high school 2.975** 1.998** 2.123** University degree 0.480** 0.513** 2.203** Marital status Unmarried (Ref.) Married 0.984** 0.958** 1.073** Living arrangement Living alone (Ref.) Living with family 0.719** 0.929** 0.423** Living with others 0.846** 1.060** 3.280** Zone SMR (Ref.) JMR 2.170** 2.133** 1.965** BBK 1.637** 1.089** 0.664** Constant 0.354** 0.340** 0.476** Number of observation LR chi2 (12) Prob.>chi Pseudo R **): Significant at 1% level; *) Significant at 5% level. SMR Table 5.8 exhibits the resulting odds ratio of being in work in a specific sector in SMR, separately for males, females and pooled. The overall picture suggests that, after controlling for age, education, marital status and living arrangements, as opposed to non-migrants, both Central Java s primary male and female migrants are more likely to work in the manufacturing sector than in the remaining sectors. The odds of Central Java s primary male migrants working in the trade sector rather than in any of the other sectors are three times higher than for non-migrants, while the associated figure is almost two times higher for Central Java s primary female migrants. In addition, the likelihood of both Central 164
187 Employment outcomes of Central Java s primary migrants Java s primary female migrants and male migrants working in the service sector is 2 to 3 times higher than for non-migrants. The pooled model shows that age positively influences the likelihood of being in work in the manufacturing sector. The effect of age on the propensity to work in the trade or service sectors is positively significant for the oldest age group (30 34 years old). When sex is considered, the effect of age on the likelihood of being in work in the manufacturing sector is positively significant for both males and females. The effect of age increases females odds of being in work in the trade sector, and to males odds of working in the services sector. The effect of educational attainment positively influences the likelihood of being in work in the manufacturing, trade, or service sectors, with the greatest effect on the likelihood of being in work being found among those who had completed senior high school. For instance, the odds of working in the manufacturing sector among people who had completed senior high school is nine times higher than the odds of working in the other sector as opposed to people with primary school or lower qualifications. Also, their likelihood of working in the trade and service sectors is six times higher, respectively, as opposed to the reference category. With regards to marital status, as opposed to unmarried, married people, irrespective of sex, are less likely to work either in the manufacturing, trades, or service sectors than to work in the remaining sectors. Meanwhile, individuals who are living with others are more likely to work in the manufacturing, trade, or service sectors than to work in the other sectors. 165
188 Chapter Table 5.8 Odds of being in work in a particular sector by sexes in SMR Migration status Variable Manufacturing vs. the rest of the sectors Trade vs. the rest of the sectors Service vs. the rest of the sectors Male Female Pooled Male Female Pooled Male Female Pooled Non-migrants (Ref.) Central Java s primary migrants 2.070** 2.821** 2.538** 3.045** 2.125** 2.559** 2.129** 3.164** 2.754** Other primary migrants 1.605** ** 3.203** 1.618** 2.751** 1.527** 1.535** 1.480** Other migrants 1.712** 1.791** 1.771** 2.490** 2.168** 2.345** 2.051** 2.640** 2.296** Sex Male (Ref.) Female 4.933** 3.051** 2.380** Age (Ref.) ** 1.266** 1.206** ** 0.944** 1.148** 0.691** 0.828** ** 1.332** 1.179** ** 1.028* 1.250** 0.806** 0.931** ** 1.262** 1.138** 1.083** 1.411** 1.193** 1.342** ** Education Primary school or lower (Ref.) Junior high school 2.289** 4.034** 3.133** 1.677** 2.541** 2.009** 1.932** 1.777** 1.794** Senior high school 6.934** ** 9.149** 4.212** 8.882** 5.698** 6.624** 5.295** 5.852** University degree 2.811** 1.330** 1.921** 3.193** 2.166** 2.697** ** ** ** Marital status Unmarried (Ref.) Married 0.910** 0.512** 0.759** 0.864** 0.578** 0.784** 0.847** 0.482** 0.700** Living arrangement Living alone (Ref.) Living with family 0.707** 0.679** 0.734** 0.841** 0.730** 0.828** 0.769** 0.278** 0.501** Living with others 1.364** 2.008** 1.543** 2.324** 1.893** 1.956** 2.466** 4.739** 4.015** Constant 0.134** 0.655** 0.113** 0.172** 0.580** 0.160** 0.103** 1.271** 0.224** Number of observation 652, ,309 1,121,687 LR chi2 (12) 119, , , Prob.>chi Pseudo R **): Significant at 1% level; *) Significant at 5% level.
189 Employment outcomes of Central Java s primary migrants JMR Table 5.9 shows the likelihood of being in work in the manufacturing, trade or service sectors as opposed to the other sectors in JMR. Similar to SMR, Central Java s primary migrants in JMR are also more likely to work in the manufacturing sector than the rest of the sectors, as opposed to non-migrants. The odds of working in the manufacturing sector for Central Java's primary male migrants are two times higher, with slightly higher odds for Central Java s primary female migrants. Both Central Java s primary male and female migrants are also more likely to work in the trade and service sectors than to work in any of the remaining sectors. The effect of age negatively influences the likelihood of being in work in the three sectors. Meanwhile, the impact of education on the propensity of being in work varies across sexes and sectors. Females with senior high school education are less likely to work in the manufacturing and services sectors than in other sectors. However, they are more likely to work in the trade sector than they are to work in the other sector as opposed to those with primary education or less. Males with the same levels of educational background, however, are more likely to work either in the manufacturing, trade or service sectors than to work in the other sector. Males with a university degree are two times more likely than those with primary education or less to work in the service sector than to work in the rest of the sectors. Females with a university degree, however, are less likely to work in the three sectors. Relative to the unmarried, married men are less likely to work in the trade and service sectors. Meanwhile, there is no difference between married and unmarried men as regards the likelihood of being in work in the manufacturing sector. In terms of living arrangements, those who are living with their family or living with others are more likely to work in the manufacturing sector or to work in the trade sector relative to those who are living alone. 167
190 Chapter Table 5.9 Odds of being in work in a particular sector by sexes in JMR Migration status Variable Manufacturing vs. the rest of the sectors Trade vs. the rest of the sectors Service vs. the rest of the sectors Male Female Pooled Male Female Pooled Male Female Pooled Non-migrants (Ref.) Central Java s primary migrants 2.059** 2.306** 2.061** 1.759** 1.650** 1.653** 1.146** 2.295** 1.670** Other primary migrants 1.324** 1.657** 1.483** 1.930** 1.189** 1.639** 1.164** 1.306** 1.312** Other migrants 1.407** 1.182** 1.382** 1.718** 1.109** 1.533** 1.232** 1.186** 1.290** Sex Male (Ref.) Female 3.112** 2.353** 3.091** Age (Ref.) ** 0.892** 0.783** 0.795** 0.858** 0.791** 0.817** 0.706** 0.629** ** 0.794** 0.610** 0.664** 0.821** 0.676** 0.757** 0.717** 0.603** ** 0.744** 0.517** 0.611** 0.912** 0.646** 0.745** 0.773** 0.613** Education Primary school or lower (Ref.) Junior high school 1.714** 2.661** 1.879** 1.339** 2.059** 1.425** 1.583** 1.404** 1.319** Senior high school 2.672** 0.878** 2.143** 1.415** 1.163** 1.542** 2.565** 0.563** 1.641** University degree 0.691** 0.077** 0.328** 0.515** 0.148** 0.362** 2.264** 0.615** 1.500** Marital status Unmarried (Ref.) Married 0.991* 1.169** 1.037** 0.909** 1.275** 0.991** 0.977** 1.398** 1.146** Living arrangement Living alone (Ref.) Living with family 1.092** 1.973** 1.365** 0.952** 1.412** 1.117** 0.659** 0.239** 0.387** Living with others 1.651** 1.326** 1.395** 1.196** 1.166** 1.132** 2.016** 3.980** 2.843** Constant 0.653** 2.087** 0.584** 0.942** 1.785** 0.788** 0.558** 8.570** 1.251** Number of observation 3,907,265 2,124,072 6,031,337 LR chi2 (12) 316, , ,116, Prob.>chi Pseudo R **): Significant at 1% level; *) Significant at 5% level.
191 Employment outcomes of Central Java s primary migrants BBK The odds of being in work in a particular sector in BBK are provided in Table The likelihood of Central Java s primary migrants being in work in the manufacturing sector in BBK is six times higher than being in work in the other sectors, as opposed to nonmigrants. The odds are even higher than those found in SMR or JMR. Across the sexes, the likelihood of Central Java s primary female migrants working in the manufacturing sector is ten times higher while the associated figure is five times higher for Central Java s primary male migrants. Other types of migrants are also more likely to work in the manufacturing sector than in the rest of the sectors as opposed to non-migrants, with the propensity to work among females being notably high. Clearly, female migrants in BBK are extremely likely to work in the manufacturing sector. There is no difference in the likelihood of being in work in the service sector between Central Java s primary male migrants and male nonmigrants. Meanwhile, Central Java s primary female migrants are 1.9 times more likely to work in the service sector than non-migrants. With the exception of year old males in manufacturing, the chance of being employed in manufacturing, trade or services relative to other sectors falls as age increases. With regard to educational attainment, Table 5.10 shows that individuals who had completed senior high school, irrespective of sex, had a much higher likelihood of working in manufacturing, compared with the remaining sectors, than people with any other educational qualification. Meanwhile the effect of a tertiary qualification is significant among those who work in the service sector. It can be seen that males with tertiary education are ten times more likely to work in the service sector than in any of the other sectors, as opposed to those with the lowest level of education. Married males or females are less likely to work in the manufacturing sector than in any of the other sectors as opposed to unmarried people. Meanwhile, both males and females who are living with others are more likely to work in the service sector than in the remaining sectors. For instance, females who are living with others are three times more likely to work in the service sector than in any of the other sectors, as opposed to females who are living alone. 169
192 Chapter Table 5.10 Odds of being in work in a particular sector by sexes in BBK Migration status Variable Manufacturing vs. the rest of the sectors Trade vs. the rest of the sectors Service vs. the rest of the sectors Male Female Pooled Male Female Pooled Male Female Pooled Non-migrants (Ref.) Central Java s primary migrants 4.943** ** 6.186** 1.664** 1.334** 1.443** ** 1.230** Other primary migrants 4.970** 8.315** 5.982** 1.570** 1.140** 1.339** ** 1.126** Other migrants 3.593** 5.060** 4.121** 1.742** 1.450** 1.628** 1.106** ** Sex Male (Ref.) Female 4.534** 3.893** 4.389** Age (Ref.) ** ** 0.800** 0.687** 0.769** ** 0.828** ** 0.904** 0.856** 0.677** 0.700** 0.698** ** 0.826** ** 0.721** 0.667** 0.633** 0.797** 0.679** 0.844** 0.799** 0.759** Education Primary school or lower (Ref.) Junior high school 2.037** 2.861** 2.231** 1.937** 2.133** 1.994** 1.922** 1.490** 1.649** Senior high school 5.063** ** 6.969** 2.365** 1.460** 2.059** 4.137** 1.072* 2.435** University degree 3.784** 1.451** 2.734** 1.507** 0.321** 0.929** ** 2.802** 6.879** Marital status Unmarried (Ref.) Married 0.816** 0.616** 0.721** 0.792** 1.152** 0.919** 0.964* 1.164** 1.068** Living arrangement Living alone (Ref.) Living with family 0.381** 0.431** 0.384** 0.783** 1.050* 0.847** 1.164** 1.047* 1.059** Living with others 0.814** ** ** 2.940** 1.973** Constant 0.157** 0.280** 0.117** 0.336** 1.632** 0.348** 0.111** 1.301** 0.169** Number of observation 256, , ,810 LR chi2 (12) 58, , , Prob.>chi Pseudo R **): Significant at 1% level; *) Significant at 5% level.
193 Employment outcomes of Central Java s primary migrants 5.6 Discussion and conclusion This chapter has investigated the employment outcomes of Central Java s primary migrants in the SMR, JMR and BBK zones. Specifically, the chapter examined whether or not there were differences between Central Java s primary migrants and non-migrants relating to the propensity to work, employment outcomes and economic sectors in which they worked. The chapter also examined whether or not there were differences in the employment outcomes of Central Java s primary migrants across the two sexes and the three zones. The units of analysis were individuals aged years found in the SMR, JMR and BBK zones classified according to their migration status: Central Java s primary migrants, other primary migrants, other migrants and non-migrants. Based on the findings, there are several conclusions that can be made. Firstly, it is evident that migrants places of destination can be used as a predictor of their reason for migrating. The study showed that Central Java s primary migrants who moved to SMR, a zone that is close to their place of origin, are likely to study or to work. The further away the zone is the higher the percentage of Central Java s primary migrants who work. Thus, it can be said that the further away the place of destination is, the greater the number of individuals who are part of work migration and the smaller the number of those who are part of education migration. Among migrants who are part of education migration in SMR, about 70 per cent of them were studying at a higher educational institution. To conclude, findings from the study suggest that it is not always necessary for people, in particular for primary migrants who migrate to cities, to move for employment opportunities. In fact, many of them migrate to pursue higher education. Secondly, with regards to employment outcomes, the study suggested that the intention to migrate actually influences the likelihood of being in work at the place of destination. The fact that Central Java s primary migrants are more likely to work in JMR and BBK is because their intention to migrate to JMR and BBK is based on pursuing employment opportunities. They prefer to migrate to JMR or to BBK than to SMR to seek jobs, despite the fact that SMR is closer to their place of origin. This is perhaps because SMR is not considered to offer job opportunities that are available in the JMR and BBK zones. Big cities such as JMR offer a wide variety of jobs (Manning & Pratomo, 2013; 171
194 Chapter 5 McDonald et al., 2013). When sex is considered, the study revealed that females are less likely than males to be working in all economic zones. Females are not less likely to be working because of lower educational qualifications. In fact, females were more likely to have higher education qualifications than males. For instance, the percentage of females with a university degree in SMR was eight per cent while the associated figure was six per cent for males. The absence of females in the labour market is explained by the fact that employment participation is low for married women. The study found that, in all economic zones, more than half of the females were married or ever married. The 19 economic sectors available from the 2010 Indonesian census were grouped into the manufacturing, trade, service and other sectors. The inferential results suggest that Central Java s primary migrants are more likely to work in the manufacturing sector than to work in any of the remaining sectors. Comparatively, Central Java s primary migrants have the greatest likelihood of being in work in the manufacturing sector than in the other sectors in BBK, especially female migrants. It is interesting to find that the manufacturing sector in BBK attracts more female migrants than male migrants. This can be explained by the presence of labour agencies in the recruitment process of potential workers in BBK. Batamindo, which is one of the mechanisms created in 1989 by the economic cooperation agreement between the Indonesian government and the Singaporean government, provides land for manufacturing companies and supplies labour from outside the zone (Shaw & Yeoh, 2000; Yeoh& Jang, 2004). Technically, Batamindo utilises its labour recruitment agency Tunas Karya, which operates in many regions in Java (Lindquist, 2002; 2009). The agency prefers to hire female manufacturing workers due to the types of jobs that demand high attention to detail. Before departing, female employees are given a workshop and training and sign a two-year contract. If employees perform well, it is likely that that their working contract will be extended. The employees live in a dormitory, located inside the industrial park, which is provided by Batamindo. Since most of Central Java s primary migrants come to BBK through the recruitment agency, it is less likely that they are working in other economic sectors. It is evident from the empirical findings that Central Java s primary migrants are also less likely to work in the trade and service sectors in BBK. 172
195 Employment outcomes of Central Java s primary migrants A quite different story is observed among Central Java s primary migrants found in the JMR and SMR zones, in which recruitment agencies are much less likely to be involved. Most migrants received job information from their peers or relatives who were already employed in a particular company. In this case, the migrant network plays a crucial role in helping migrants with jobs and temporary shelter at the place of destination (Purnomo, 2009; Safitri & Wahyuni, 2013; Zhao, 2003). In JMR, as an example, Central Java s primary migrants who are not qualified to work in the formal manufacturing sector, work in the informal sector. Male migrants are more likely to work in the trade sector while female migrants are more likely to work in the service sector. This finding is supported by Manning and Pratomo (2013) and McDonald et al. (2013) who found that male migrants usually work as vendors while female migrants work as domestic helpers. The reason that they end up working in low paid jobs can be explained by their low educational background. Holding a senior high school certificate is a normal requirement for working in the manufacturing or formal retail sectors. This study has shown that not less than 83 per cent of Central Java s primary female migrants working in the service sector had only completed junior high school or less. The associated figure was 64 per cent for male migrants who worked in the trade sector. In addition, this study has indicated that migrant networks play an important role in job search. It is evident from the study that individuals who are living with others have a greater chance of finding a job. The likelihood of being in work among individuals who are living with others is even higher in JMR. This can be explained because by living with others, an individual is exposed to a variety of information about potential employment opportunities (Haryono, 2007). Living with others can be seen as being part of a social network built by migrants. The network is used as a venue where information on job possibilities is spread by word of mouth (Haryono, 2007; Hasmath, 2011). Thus, sharing the same accommodation with others facilitates sharing of job information. Living with others also helps individuals to adapt quickly and easily to the new atmosphere at the place of destination. It also helps them to reduce daily expenses and psychological costs of adjustment in the new location. Education plays a major role in the likelihood of being in work in a particular sector. Those with senior high school qualifications have the greatest likelihood of working in the 173
196 Chapter 5 manufacturing sector or in the trade sector. Those with a university degree are less likely to work in these two sectors. In fact, they are more likely to work in higher-level services. Although further research is needed, the results suggest that the majority of those who work in the manufacturing or trade sectors are working as operators or front liners. The next chapter will compare and contrast migration assimilation and adaptation of Central Java s migrants in the JMR and BBK zones. Inter-marriage is used to measure how migrants adapt, adopt and adjust to the local people and their culture at the place of destination. The JMR and BBK zones are chosen because these zones are considered to be heterogeneous places of destination as they are popular destinations for migrants from other provinces. 174
197 Chapter 6 Marital assimilation amongst Central Javanese people in two destinations: Investigating patterns of exogamous marriage and status exchange Introduction Marital assimilation is considered to be a proxy for social assimilation and acceptance between two groups, usually between migrants and local people at the place of destination (Kalmijn, 1998; Qian & Lichter, 2007). Inter-marriage (exogamy) occurs when an individual marries a spouse of an origin or ethnicity different from his or her own. Exogamous marriage among migrants represents a useful but under-studied social adjustment and acculturation indicator. Previous studies on marital assimilation mostly involved people from various national backgrounds and were mainly conducted in developed countries (Batson, Qian, & Lichter, 2006; Çelikaksoy, Nielsen, & Verner, 2003; Chiswick & Houseworth, 2011; Furtado, 2012; Kalmijn & Van-Tubergen, 2006; Qian & Lichter, 2001). In western societies, patterns of exogamous marriage are usually related to exchanges related to socio-economic status and race or ethnicity. Aiming to fill the gap, this study examines marital assimilation amongst Central Javanese people, Indonesia s biggest migrant and ethnic group, in the Batam-Bintan-Karimun (BBK) and the Jakarta Metropolitan Region (JMR). It is important to examine exogamous marriages of migrants in order to understand the underlying factors that influence migration assimilation and acceptance of the migrant group by other groups, in particular by the local people at the place of destination. Exogamous marriage provides a measure of social distance between groups and of the strength of ethnic group boundaries or solidarities (Kalmijn, 1998). Past studies in the western setting show that patterns of inter-marriage vary across migrant-ethnic origins whereby particular migrant-ethnic groups are more likely to marry natives while other migrant-ethnic groups are less likely (Kalmijn & Van-Tubergen, 2010; Lichter et al., 2007). 7 This chapter was presented in the oral session during the 3 rd Asian Population Association (APA) International Conference, 27 to 30 July 2015, Kuala Lumpur, Malaysia, and during the Annual Conference of the Crawford School, 19 November 2014, Australian National University. 175
198 Chapter 6 Earlier studies also found that patterns of inter-marriage of particular migrant groups differ across places of destination (Gullickson & Torche, 2014; Hou & Myles, 2013). It is argued that each place of destination has its own history of how migrants move in, adjust and assimilate to local people and cultures that influence the degree of groups acceptance of, and boundaries for, inter-marriage (Hou & Myles, 2013). In the context of Indonesia, very little is known about the inter-marriages of migrants, although migration has been a large part of Indonesia s history. Previous studies on marriage patterns in Indonesia focused on differences in age groups and educational levels between husbands and wives (Smits & Park, 2009; Utomo, 2014). These studies found that there has been a decline in age and education gaps between husbands and wives in Indonesia. Utomo (2014) argued that an increase in a wife s education lessens age and education gaps among couples in Indonesia. Another study of ethnic inter-marriages among co-resident couples in Indonesia was recently conducted by Utomo and McDonald (2014). Using a full set of the 2010 Indonesian population census, they examined ethnic inter-marriages among 1,340 ethnic groups listed in the census. Their study finds that ethnic inter-marriages are high in regions with high degrees of ethnic mix. The likelihood of marrying out is higher among younger and educated people than it is among older and less-educated people. The current study utilised a full set of the 2010 Indonesian population census data. The unit of analysis is married co-resident couples found in BBK and JMR. I utilised ethnomigration status (which refers to place of birth/place of origin) and ethnicity of husbands and wives as indicators to investigate inter- and intra-marriage patterns. My primary goal is to examine marital assimilation amongst Central Javanese people, focusing on patterns of exogamous marriage and status exchange. Specifically I ask: to what extent are Central Javanese people in an exogamous marriage? If they marry out, with which groups are they most likely to inter-marry? How do Central Javanese couples compare with other groups in their degree of exogamy? Among Central Javanese husbands and wives, who marries out? What are the relative education levels of the spouses among Central Javanese people who marry out? Is status exchange in relation to education evident among Central Javanese people who inter-marry with local people? 176
199 Marital assimilation amongst Central Javanese people I begin by presenting a theoretical background on marital assimilation, status exchange theory and studies that have been conducted so far in this field. In the empirical part of the chapter, I first provide descriptive information on marriage patterns of Central Javanese people, followed by cross-classifications of husbands and wives by ethno-migration status and ethnicity. I conduct a series of binary logistic regressions to analyse individual level correlates of inter-marriages. I further apply multinomial logistic regression to examine status exchange on education of Central Java s inter-marrying couples. Discussion and conclusions are provided at the end of the chapter. 6.2 Theoretical review and hypotheses Marital assimilation is part of socio-cultural integration at the place of destination and reflects the extent of inter-marriages by migrants through accepting their spouses ethnicity/origin. Chiswick and Houseworth (2011) defined marital assimilation as marriages among individuals of different origin or ethnic backgrounds. Marital assimilation also reflects a situation in which migrants negotiate their own cultures and norms and accept other cultures as part of social integration at the host place. Furthermore, inter-marriage provides a measure of social distance between different groups and of the degree of acceptance and solidarity (Qian & Lichter, 2001). According to Kalmijn (1998) determinants of inter-marriage are often explained by three general notions. Firstly, an individual s preference for a marriage partner, where an individual selects his or her marriage partner based on several socio-economic indicators and/or similarities in cultural background that are most suitable. Socio-economic factors are conceptualised as an economic resource for an individual, in which people maximise their income by searching for a spouse with a better socio-economic status. In the context of gender roles in a household, where men act as breadwinners and women do domestic chores, unmarried men tend to look for good looking women as an exchange for their socio-economic status. In a modern society where women also participate in the labour market, their socio-economic status increases their attractiveness in the marriage market. Men are more likely to marry working women because by doing so, it can help them to expand their employment networks and so the wife can be a secondary earner in the household. In terms of cultural factors, it is likely that an individual decides to marry someone who shares the same culture and values. Marriage is considered to be a long-term 177
200 Chapter 6 commitment, so it is likely that an individual will marry someone who has similar values so that they can get along together. In the process, however, socio-economic and cultural factors come to play together in influencing an individual either to marry someone from his or her own group or to cross group boundaries. Kalmijn (1998) argued that the second factor that influences the propensity of an individual to inter-marry is the role of third parties. Third parties that include parents, family, relatives and communities as well as state laws act as a barrier for individuals to marry out through group identification and sanctions. Group identification is defined as a sense of sharing the same ethnicity or background. The stronger the group identification is, the weaker the likelihood of the members of a group to inter-marry. Third parties influence the members of the group to be in an endogamous marriage so that they do not have to learn new cultural practices and customs in order to communicate with a new member of the family who comes from outside their own group (Carnegie, 2013). In a more rigid group, a sanction can be applied to a member of the group who decides to inter-marry. Sanctions are common for those who are in inter-faith marriages, that is, individuals who marry someone who holds a different religion. The sanction can be in the form of expelling interfaith couples from their own groups (Seo, 2013). The sanction can also come from the state s law if inter-faith marriages are illegal (Burdette et al., 2012). According to Kalmijn (1998), the third factor that influences inter-marriage is the situation of a local marriage market. In this aspect, there are three factors that need to be considered, namely, the size of the group, the location and the composition of the marriage market. The size of a particular group is inversely proportional to the likelihood of being in an exogamous marriage, provided that the process of marriage is random. The smaller the size of a particular group, the greater is the chance of members of the group being in an exogamous marriage. The location of a particular group also influences the likelihood of the members of a group to inter-marry. If a particular group is spatially concentrated, members of the group would be less likely to inter-marry. The presence of a local marriage market, which is quite uniform, decreases the chance of an individual to inter-marry. Preferences of individuals either to marry someone from their own group or marry someone from outside their group are usually associated with either status exchange or 178
201 Marital assimilation amongst Central Javanese people status homogamy theories (Levchenko & Solheim, 2013). The theory of status exchange was originally introduced by Merton (1941) and Davis (1941) in the context of inter-racial marriages between blacks and whites in the United States, in that there is an exchange of racial status with socio-economic status, generally by trading race with educational level. In their studies, Merton (1941) and Davis (1941) found that educated black men would exchange their educational status in order to gain benefits from the racial status of marrying white women. On the same note, low educated white women would exchange their racial status for a better socio-economic status (in this case high education status of the spouse). This is because whites see marrying across racial lines as marrying down (Gullickson, 2006). As the consequence, it is very unlikely that marriage occurs between a white educated woman and a low educated black man. Thus, according to status exchange theory, groups have different levels of status in which individuals belonging to higher-status groups have more flexibility in terms of choice of spouse than persons from lower-status groups (Fu, 2001). Other studies have shown that migrants to English-speaking countries from non-english speaking countries exchange their education, ethnicity, religion and even citizenship to intermarry (Connolly, 2009; Kim & Min, 2010; Levchenko & Solheim, 2013; Seo, 2013). On the other hand, status homogamy theory critiques status exchange theory and argues that individuals choose their spouses based on similarities in ethnicity, education, religion or origin (Kalmijn, 1998). This theory explains how individuals from different backgrounds negotiate their differences and accept each other equally. A strong critique of status exchange theory comes from Rosenfeld (2005), who argues that educational homogamy is dominant among inter-marriage patterns, while status exchange inter-marriage in particular among blacks and whites in the United States is so infrequent that is not strong enough to justify a status exchange theory. Apart from ongoing debate on the role of either status exchange or status homogamy in triggering the likelihood of inter-marrying in developed settings, little evidence is available for developing nations, such as Indonesia. Status exchange or status homogamy theories can be examined through observing education levels of couples who are in inter-marriages. Education is the ultimate indicator for measuring socio-economic status and also for determining inter-marriage patterns (Chiswick & Houseworth, 2011; Furtado, 2012). Education is seen as a facilitator of, and a 179
202 Chapter 6 preference indicator for, inter-marriage. The former interpretation states that educated people are more likely to inter-marry because they have spent more time among people of diverse backgrounds, which may weaken group boundaries. The latter statement demonstrates that educated people are less attached to their own group because higher education removes them from the constraints of their group. Better-educated people tend to have a broader perspective on accepting group differences than do less-educated people. Other factors that determine patterns of exogamous marriage are age and regional location. Younger people may be averse to their culture of origin and more easily adopt the destination culture (Furtado, 2012). As the age of an individual increases, they have stronger bonds to their own group. However, other scholars have argued that as the age of an individual increases, their chance of finding an unmarried spouse within their own group decreases as many of them are already married (Chiswick & Houseworth, 2011). As a result, an individual expands his or her search outside of his or her own group. Individuals living in urban areas where many people from various backgrounds are found have greater opportunities to be in an exogamous marriage than those living in rural areas. According to Chiswick and Houseworth (2011), patterns of marital assimilation among migrants at the place of destination can be approached from two directions: ethnomigration status, which derives from their place of birth, and type of ethnicity. In other words, the concept of migrant is approached from two perspectives, that is, either a person is born outside the site or belongs to non-local ethnic groups. The current study uses both ethno-migration status (born in Central Java) and type of ethnicity (Javanese) to examine marriage pairing patterns among Central Javanese people. Variation of exogamous marriage patterns for both local people and migrant groups is examined for a selected number of migrant groups and ethnicities in the study areas. The selection of migrant groups and ethnicities is based on the group having a substantial share of the total population in each area. At a later stage, this study investigates patterns of status exchange on education among Central Javanese inter-married couples at both places of destination. Based on the above theoretical reviews, a series of hypotheses is proposed by this study: 1. There are differences in inter-marriage patterns across places of destination and groups. 180
203 Marital assimilation amongst Central Javanese people 2. Relative to other groups, Central Javanese people have a high exogamy rate. 3. Better-educated individuals are more likely to be in exogamous marriages. 4. There is an indication of exchange of education and local status among Central Javanese couples who inter-marry with local people. 6.3 Background to the study Central Javanese people are used as the focus of the analysis of inter-marriage patterns in this study for two main reasons. Firstly, Central Java has been the largest source of outmigrants within the nation for decades. Statistics show that in 2010, nearly 7 million people who were born in Central Java lived outside the province and a substantial proportion of them were found in JMR and in BBK. Secondly, Central Java is the heartland of the Javanese ethnic group, the biggest ethnic group in the multi-ethnic nation of Indonesia. Based on the latest population census, out of 1,340 ethnic groups found in Indonesia in 2010, the Javanese constitute 95 million people, accounting for 40 per cent of the total population (Ananta et al., 2014; BPS, 2011, p. 9). The other top four ethnic groups are Sundanese (15.5 per cent), Malay (3.7 per cent) and Batak (3.6 per cent) (BPS, 2011, p. 9). The Javanese ethnic group dominates the composition of migrants in the two selected destinations of the current study. JMR and BBK are both melting pots for migrants in Indonesia and have a wide range of ethnicities. BBK is made up of a group of three islands in Kepulauan Riau province in which Malays constitute the dominant local ethnic group. Although Suku Anak Laut is also considered to be another local ethnic group, its share of the total population is very small. Meanwhile Betawi, Sundanese and Bantenese are the dominant local ethnic groups of JMR. Variation in the local ethnic groups can cause differences in the patterns of Central Javanese inter-marriages. Currently, there is a dearth of literature on the dynamics of marriage pairing in Indonesia. The current study extends the work of Utomo (2014) on marriage pairing patterns in terms of age and education and of Utomo and McDonald (2014) on ethnic inter-marriage in Indonesia. In their study, Utomo and McDonald (2014) use 1,340 categories of ethnicity to examine endogamous marriage patterns in 33 provinces. Their results suggest that the rate of intra-marriage varies across provinces whereby the lowest rate was in Jakarta and the 181
204 Chapter 6 highest rate was in Central Java. They also found evidence of general openness theory of ethnic assortative mating when looking at correlates of endogamy at the individual level. The current study uses a similar as approach to that used by Utomo and McDonald (2014) in which matched married co-resident couples are used as the unit of analysis. A logistic regression model is applied for inferential findings. What makes this study different is that, instead of investigating endogamous marriage patterns, this study examines patterns of exogamous marriages in JMR and BBK. In its analysis, the study investigates patterns of exogamous marriages using two approaches: ethno-migration status and type of ethnicity. Also, this study focuses on selected groups that have a substantial share of the total population in each place of destination. Furthermore, this study examines status exchange on education among Central Javanese couples who inter-married with local people. This chapter contributes to the literature by adding to the under-studied area of marriage pairing in Indonesia. Specifically the study contributes to knowledge about the characteristics of inter-marrying couples of Central Javanese and other selected groups based on ethno-migration status and type of ethnicity in two different places of destination. Furthermore, this study examines whether or not status exchange theory based on intermarriage patterns is applicable in the Indonesian setting. 6.4 Data and methods used in the study This study created a data set of matched husband-wife pairs from a full count of the 2010 Indonesian population census data. The data consists of co-resident married couples in which one of them is the head of the household. As stated by Utomo (2014), this type of data selection has several limitations. Firstly, couples who are living with their parents, inlaws or relatives, and polygamous couples, are overlooked if one is not the head of the household. Secondly, due to the nature of the data collection, it is not possible to identify couples in first marriages or by marriage cohorts. Apart from the above shortcomings, the existing married couples represent all married households at a given time so as to provide an understanding of the extent to which status-matching on education exists in intermarriages. Thus, this data set allows me to map and examine the most current co-resident married couples who are in intra- and inter-marriages. In the multivariate analysis, the data 182
205 Marital assimilation amongst Central Javanese people are controlled for age which to some extent takes account of the length of time since marriage. In the analysis, I first created groups based on their migration status (measured in terms of ethno-migration status which is derived from their place of birth) and type of ethnicity in each place of destination. In total, there is one native group and nine non-native groups. According to ethno-migration status, a native group consists of individuals who were born in the site, while non-native groups are people who were born elsewhere (within Indonesia). For instance, if an individual was born in BBK, he or she is grouped as a locally born person. If a person was born in Central Java province, he or she is classified as being Central Java-born. According to the type of ethnicity, a native group is a group of people who belong to the Malay ethnic group for BBK and a group of people who belong either to the Sundanese, Betawi or Bantenese ethnic groups for JMR. Besides Central Java (for ethnic migration status) or Javanese (for ethnicity), the selection of the non-native groups is based on their top shares of the overall population in each place of destination. As a result, the types of non-native groups found in BBK are different from the types of non-native groups found in JMR. In the descriptive analysis, the number and percentage of the top ten groups of husbands and wives (both by ethno-migration status and ethnicity) are tabulated separately for BBK and JMR. Next, ethno-migration statuses or ethnicities that are numerous among intermarried couples at both of the two places of destination, along with the native group are cross-classified. The aim is to produce percentages of intra- and inter-married couples and to be able to make comparisons of the same groups across the two destination areas. The first part of the inferential analysis is to investigate characteristics of inter-marriages of Central Javanese couples and also other selected couple groups. The rate of exogamy is calculated. In each study area, an exogamous marriage is defined as a marriage that consists of a husband and wife who have different origins or ethnicities. For example, a married couple that consists of a Central Java-born husband and a BBK-born wife in BKK is defined as an exogamous married couple. I first tabulated the proportions of mixed marriages broken down by ethno-migration status and ethnicity, age group, educational level and location. Later, I applied a binary logistic regression model to study the effects of 183
206 Chapter 6 characteristics of exogamous marriages. A binary logit regression model is utilised and run separately based on ethno-migration status and types of ethnicity for husbands and wives in both BBK and JMR. The value of the dependent variable is: The five common groups (both by ethno-migration status and ethnicity) are used as one of the explanatory variables. The local-born/local ethnic group is treated as the reference category. Age, education level and location are control variables that are used in the analysis. Ages are grouped into ten-year age groups. Education in the census data is analysed through the use of a 10-point scale that records levels of education from no schooling to holding a post graduate degree. In this study, education level is placed into five classifications, namely, no schooling, primary school, junior high school, senior high school and above senior high school. Location is classified into urban and rural areas. Past studies applied a log-linear model to examine educational matching on inter-married couples (Batson, Qian & Lichter, 2006; Fu, 2001; Gündüz Hoşgör & Smits, 2002; Qian & Lichter, 2007). As Fu (2001) states in his study on racial inter-marriages in the United States, the advantage of using log-linear analysis in inter-marriage patterns is that it provides insights into the association between husband and wife by controlling differences in group size. However, several scholars hesitate to adopt a log-linear model in analysing inter-marriage patterns due to its complexity, difficulty in interpretation, and the very large number of possible interactions when extra covariates are required (Agresti, 1990, p. 326; Hou & Myles, 2013; Rosenfeld, 2005). As an alternative to a log-linear model, I use a multinomial logit model that reduces the difficulties of log-linear models while at the same time providing the same estimates (Hou & Myles, 2013). Also, a multinomial logit model is preferred from the fact that a log-linear model can be viewed as a binary logistic regression model (Christensen, 1997, p. 57). In addition, multinomial logit models produce identical likelihood ratios, goodness of fit and coefficients for the parameters as does a log-linear model (Hou & Myles, 2013). 184
207 Marital assimilation amongst Central Javanese people To examine status exchange on education among Central Javanese/native inter-married couples, I followed the work of Hou and Myles (2013) on inter-racial marriages and status exchange in Canada and the United States. In their study, they created one explanatory variable, namely, education matching, created from joint interaction between husbands and wives education levels that consists of three categories: educational hypergamy (wives education is lower than husbands education), educational homogamy (wives education is same as husbands education) and education hypogamy (wives education is higher than husbands education). The way Hou and Myles (2013) classified the educational matching of husbands and wives, however, overlooked variations that might exist among husbands and wives with a smaller gap in education and those with a larger education gap. For instance, a marriage between a husband with a university degree background and a wife with a senior high school background might be different from a marriage between a husband with a university degree background and a wife with a junior high school background. The two types of marriage show that wives marry up on education; however, the education gap from the former marriage is smaller than that of latter marriage. In my study, I widen the classification of the education matching variable by taking into account the degree of educational difference between husbands and wives. I created seven categories of educational matching, they are: 1. Educational homogamy, in which husbands and wives have equal education levels. 2. Wives marry up on education, in which the education level of the husbands is one level higher than the educational level of the wives. 3. Wives marry up on education, in which the education level of the husbands is two levels higher than the educational level of the wives. 4. Wives marry up on education, in which the education level of the husbands is more than two levels higher than the education level of the wives. 5. Wives marry down on education, in which the education level of the husbands is one level lower than the education level of the wives. 6. Wives marry down on education, in which the education level of the husbands is two levels lower than the education level of the wives. 7. Wives marry down on education, in which the education level of the husbands is more than two levels lower than the education level of the wives. I chose education homogamy as the reference category. 185
208 Chapter 6 To examine status exchange and educational matching of Central Javanese inter-married couples, a new subset of data is created. This subset consists of the Central Javanese and the native group couples (based on ethno-migration status and ethnicity) aged years old. I chose this particular age group in order to restrict to more recent marriages. I first created four types of marriage from the combination of the Central Javanese and the local people. They are Central Java husband/wife, local husband/wife, Central Java husband/local wife, local husband/central Java wife. The first two groups are endogamous while the other two groups are inter-married couples of Central Javanese and local people. Among the four types of marriage, I chose Central Java endogamous couples as the reference group for the dependent variable. The multinomial logit model is specified as follows: where is the reference category of marriage types and refers to the other three categories of marriage. is a series of other explanatory variables that are used as controlled variables in the models. They are wife s education, husband s age and wife s age. The wife s education variable is the same as that used in the binary logistic regression model whilst the age variable is treated as a continuous variable. 6.5 Findings Descriptive analysis of marital assimilation of Central Javanese people in BBK and JMR based on ethno-migration status and ethnicity Based on ethno-migration status Table 6.1 shows the number and percentage of inter-marriages by ethno-migration status for local-born husbands and wives in BBK and JMR. Overall, the percentage of endogamy among the local-born husbands and wives in BBK is lower than it is in JMR. Among the BBK local-born husbands who are in exogamous marriages, the main origin of their spouses is Riau, a province next to BBK. There are six per cent of local-born husbands with Riau-born spouses. Similar patterns can also be observed for local-born wives, with 186
209 Marital assimilation amongst Central Javanese people slightly higher percentages. The other two biggest ethnic origins that local-born husbands prefer to inter-marry with are Central Java-born and North Sumatra-born, while the other two ethnic origins that are in the top three of marrying local-born wives are East Java-born and Central Java-born. For the JMR local-born exogamous men and women, the percentages of those who married Central Java-born people are higher compared to those who married individuals from other ethnic origins. The percentage of inter-marriages between local-born husbands and Central Java-born wives was five per cent whilst the percentage of local-born wives inter-married to Central Java-born husbands was six per cent. People of other ethnic origins that the locals are more likely to inter-marry with are the West Java-born, the East Java-born, the North Sumatra-born and the West Sumatra-born. Table 6.1 also shows the ethno-migration statuses with whom the local-born husbands and wives in both BBK and JMR commonly inter-marry. They are the Central Java-born, the East Java-born, the West Java-born, the North Sumatra-born and the West Sumatra-born. Geographically speaking, people from the first three ethnic groups originate from Java Island and people of the other two ethnic origins are from Sumatra Island. It is intriguing to investigate further the ethnic inter-marriages between these groups of people with different ethnic origins and the local-born. Among the five common ethnic origins, localborn husbands and wives have a relatively strong preference for Central Java-born spouses. In interpreting the table, it should be kept in mind that many inter-marriages may be marriages between people of the same ethnic group, for example, a marriage between a person of Javanese ethnicity who was born in the local area and a new Javanese migrant who has moved from Central Java. Also, for JMR, an apparent inter-marriage may be a marriage between two persons of Sundanese ethnicity, one born in West Java outside JMR and one born in JMR. Conversely, a marriage between two persons both born in JMR, an apparent endogamous marriage, may be a marriage between persons of different ethnicities, for example, a person of Javanese ethnicity marrying a person of Sundanese ethnicity, but both were born in JMR. 187
210 Chapter 6 Table 6.1 Inter-marriages of local-born husbands and wives by their spouse s ethno-migration status in BBK and JMR, 2010 BBK Local-born husbands Local-born wives Origin of the spouse No. % Origin of the spouse No. % Local-born 51, Local-born 51, Riau 4, Riau 4, Riau Islands (outside BBK) 2, East Java 3, Central Java 2, Central Java 2, North Sumatra 2, North Sumatra 2, East Java 2, Riau Islands (outside BBK) 2, West Java 1, West Sumatra 1, West Sumatra 1, West Java 1, South Sumatra East Nusa Tenggara Others 3, Others 5, Total 73, Total 76, JMR Local-born husbands Local-born wives Origin of the spouse No. % Origin of the spouse No. % Local-born 2,411, Local-born 2,411, Central Java 159, Central Java 196, West Java (outside JMR) 145, West Java (outside JMR) 165, East Java 42, East Java 69, Banten (outside JMR) 26, North Sumatra 35, Lampung 19, Banten (outside JMR) 25, North Sumatra 17, West Sumatra 25, Yogyakarta 16, Yogyakarta 24, West Sumatra 15, South Sumatra 17, Others 49, Others 78, Total 2,904, Total 3,049, Next, the selected common ethnic origins found in BBK and JMR along with the localborn are put together into cross-tabulations of husbands and wives by ethno-migration status as shown in Table 6.2. The five ethnic origins that are frequent but common to both BBK and JMR are used to facilitate comparisons across the two destinations. Diagonal lines of the matrix show, for each of the ethnic origins, the percentages that endogamous (intra-married couples) marriages constitute of all marriages. The total percentage of endogamy in BBK is 60 per cent, somewhat lower than it is in JMR, which stands at 68 per cent. Thus, it can be stated that people in BBK are more likely to intermarry than are people in JMR. The prevalence of migrants in BBK is reflected by the fact that marriages where both the husband and the wife were born in BBK constitute only 18 per cent of all marriages. In BBK, the percentage of local-born husbands inter-marrying is 188
211 Marital assimilation amongst Central Javanese people highest for those marrying other ethnic origins (mainly Riau), but the next highest is for wives from Central Java. The same is true for local-born, BBK wives inter-marrying except that the percentage is slightly higher for East Java than it is for Central Java. In JMR, 45 percent of all marriages are between husbands and wives where both were born in JMR. Among local-born husbands and wives who marry out, the percentage having spouses from Central Java is followed relatively closely by West Sumatra. The percentage of local-born husbands marrying Central Java wives reached 2.98 per cent of all marriages, while the percentage of Central Java husbands having local-born wives was slightly higher, at 3.67 per cent. Focusing upon the inter-marriages of men and women born in Central Java and excluding marriages with local-born people, the following observations can be made: In BBK, both men and women from Central Java were more likely to marry with a person in the Others category (mainly Riau) followed by persons from East Java. In JMR, men from Central Java were more likely to marry women in the Others category followed by women from West Sumatra. In JMR, women from Central Java were more likely to marry men in the Others category followed by men from West Java outside JMR. 189
212 Chapter Table 6.2 Percentage distributions of marriages by ethno-migration status of husbands and wives in BBK and JMR, 2010 Husbands ethno-migration status Others Localborn Wives ethno-migration status Central North East Java Java Sumatra West Sumatra West Java Total BBK Others Local-born Central Java East Java North Sumatra West Sumatra West Java Total Others Localborn Wives ethno-migration status West Java Central (Outside East Java Java JMR) North Sumatra West Sumatra Total JMR Others Local-born Central Java West Java (Outside JMR) East Java North Sumatra West Sumatra Total
213 Marital assimilation amongst Central Javanese people Further descriptive analysis has been carried out by investigating the characteristics of individuals who are in exogamous marriages. Table 6.3 demonstrates the percentage of exogamy of co-resident married couples by ethno-migration status, age group, education level and location in both BBK and JMR. Among the ethno-migration status groups in BBK, the exogamy rate of Central Java-born people is well above the average while the exogamy rate of North Sumatra-born people is well below the average. A quite different picture is found in JMR, where all people of migrant-ethnic origins have higher exogamy rates than the average rate because of the low exogamy rate among the numerous localborn population, but here the rate of exogamy among migrants from Central Java is lower than for all the other groups excluding East Java. In BBK, the peak point of inter-marriage occurs within the age group years old Forty two per cent of people in this age group are in inter-marriages. From age 30 onwards, the inter-marriage rate falls as age increases. Meanwhile, the highest percentage of exogamy in JMR is found among individuals aged years old, slightly older than in BBK, but again it falls off at older ages. With regard to education level, it can be seen that the exogamy rate increases sharply in both BBK and JMR as educational attainment increases. Roughly, one out of two people with tertiary qualifications is in an inter-marriage in both places. In terms of location, it can be seen from Table 6.3 that those who are urban residents are more likely to be in exogamous marriages than those who are living in rural areas. 191
214 Chapter 6 Table 6.3 Exogamy rate of co-resident married couples in BBK and JMR, 2010 Characteristics BBK % Exogamous JMR Ethno-migration status BBK Others Local-born (Ref.) Central Java East Java North Sumatra West Sumatra West Java Ethno-migration status JMR Others Local-born (Ref.) Central Java West Java (Outside JMR) East Java North Sumatra West Sumatra Age groups < Education level No schooling Primary high school Junior high school Senior high school Above senior high education Location Urban Rural Total sample 574,038 10,678,954 Overall exogamy rate Based on ethnicity Given that people born in the same location (BBK or JMR) may have different ethnicities, it is important to examine marital assimilation based on the enumerated ethnicity rather than place of birth. Central Java is the heartland of the Javanese ethnic group which makes up the largest ethnicity in Indonesia and the vast majority of the population in Central Java belongs to the Javanese ethnic group. Not less than 95 per cent of people in Central Java are Javanese (Ananta et al., 2014). 192
215 Marital assimilation amongst Central Javanese people In BBK, Malay is the largest local ethnicity. Another local ethnic group, the Suku Anak Laut, constitute only a small number of people. The Chinese were a numerically dominant ethnic group, in particular on Bintan Island. However, since the development of Batam as a new economic growth centre in the 1970s and following the formation of the Triangle Economic Growth co-operation in the 1990s, large numbers of people with various ethnic backgrounds have come into the region. As a result, BBK now consists of many ethnic groups. Based on the 2010 Census, 28 per cent of people in BBK were Javanese. In second position were Malay people who accounted for nearly 19 per cent of the total population. Minangkabau, Batak Toba and Chinese ethnicities were also among the top five ethnic groups. A tremendous inflow of migrants from Java to the region since the 1990s led to the Javanese replacing the Malays as the largest ethnic group in the region. This current study treats Malays as the local ethnic group of BBK. Table 6.4 shows the ethnicities of the spouses of Malay husbands and wives in BBK. It is observed that 73 per cent of Malay husbands marry Malay descendants and the same is also true for Malay wives, with a slightly lower percentage. Among Malay husbands, 12 per cent of their spouses were Javanese while around five per cent of Malay husbands had Minangkabau spouses. Similar patterns are evident for Malay wives. 193
216 Chapter 6 Table 6.4 Malay husbands and wives by their spouse s ethnicity in BBK, 2010 Malay husbands Malay wives Ethnicity of the spouse No. % Ethnicity of the spouse No. % Malays 38, Malays 38, Javanese 6, Javanese 7, Minangkabau 2, Minangkabau 2, Sundanese 1, Bugis 1, Bugis Sundanese Batak Toba Chinese Palembang Riau Malays Riau Malays Palembang Chinese Batak Toba Others 2, Others 4, Total 52, Total 55, JMR has been a melting pot of all ethnic groups in Indonesia for a long time. There are three major local ethnic groups that represent JMR, namely, the Sundanese, the Betawi and the Bantenese. The Sundanese make up the largest ethnic group in JMR, where one out of three people in the region is recognised as being Sundanese. Combined as one group, the Sundanese, the Betawi and the Bantenese represent 57 per cent of the population in JMR. The proportion of Javanese in the JMR is high, reaching 29 per cent. Three per cent of the population are of Chinese descent. There were notable proportions of other ethnic groups found in JMR such as the Minangkabau, Malay and Batak. Table 6.5 below describes marital patterns of Sundanese, Betawi and Bantenese husbands and wives. Among couples of the three local ethnicities, it is Bantenese couples that have the highest percentage of marrying within their own group. Nine out of ten Bantenese men marry Bantenese women. Also, across these local ethnic groups, the percentage of women being in intra-marriages is lower than it is for men. Among Bantenese husbands and wives who marry exogamously, their spouses are mostly either Javanese, Sundanese or Betawi. It also can be seen from Table 6.5 that the percentage of Sundanese husbands who married endogamously reached 82 per cent, while the associated figure was 78 per cent for Sundanese wives. Meanwhile, eight per cent of Sundanese husbands married Javanese spouses, while Sundanese wives married to Javanese men reached 10 per cent. 194
217 Marital assimilation amongst Central Javanese people Table 6.5 Sundanese, Betawi and Bantenese husbands and wives by their spouse s ethnicity in JMR, 2010 Sunda husbands Sunda wives Ethnicity of the spouse No. % Ethnicity of the spouse No. % Sundanese 1,365, Sundanese 1,365, Javanese 131, Javanese 177, Betawi 117, Betawi 129, Minangkabau 27, Minangkabau 11, Malays 6, Malays 8, Bantenese 6, Chinese 3, Chinese 3, Bantenese 3, Batak Karo 1, Batak Karo 3, Batak Toba 1, Batak Toba 1, Others Others 42, Total 1,661, Total 1,746, Betawi husbands Betawi wives Ethnicity of the spouse No. % Ethnicity of the spouse No. % Betawi 914, Betawi 914, Javanese 141, Javanese 169, Sundanese 129, Sundanese 117, Minangkabau 7, Minangkabau 12, Malays 5, Malays 7, Bantenese 3, Batak Karo 3, Batak Karo 1, Banten 2, Chinese 1, Chinese 2, Batak Toba Batak Toba 1, Others 24, Others 40, Total 1,229, Total 1,272, Bantenese husbands Bantenese wives Ethnicity of the spouse No. % Ethnicity of the spouse No. % Bantenese 102, Bantenese 102, Sundanese 3, Javanese 3, Javanese 2, Sundanese 3, Betawi 2, Betawi 3, Others 1, Others 1, Malays Malays Minangkabau Minangkabau Chinese Chinese Batak Karo Batak Karo Batak Toba Batak Toba Total 112, , The percentage of Betawi husbands marrying women within their own group was 74 per cent and 72 per cent of Betawi wives married endogamously. Thus, of the three local ethnicities, the Betawi were the most likely to intermarry. Betawi husbands and wives who marry out are most likely to marry Javanese and Sundanese descendants. Both in BBK and 195
218 Chapter 6 JMR, there are several common ethnicities with whom local ethnic groups marry: the Javanese, the Minangkabau, the Batak Toba, the Sundanese and the Chinese. Further analysis has been conducted by examining patterns of inter-marriage among the selected ethnic groups in both BBK and JMR as shown by Table 6.6 below. For BBK, there are seven ethnic groups: Malays, Javanese, Minangkabau, Batak Toba, Chinese, Sundanese and others. While for JMR, apart from the seven selected ethnicities, two of the local ethnic groups, Bantenese and Betawi, are added to the analysis. Relative to BBK, the percentage of couples being in an endogamous marriage in JMR was 75 per cent, higher than it was in BBK, 71 per cent. In other words, it can be said the percentage of couples in inter-marriages in BBK is higher that it is in JMR. Malays are considered to be the local ethnic group in BBK. In BBK, the percentage of Malay wives with Javanese husbands was 2.49 per cent, slightly higher than the percentage of Malay husbands with Javanese wives. Across all ethnicities, the percentage of intermarriage between the Malay and Javanese ethnic groups was the greatest. The next highest percentage of inter-marriage is found between the Malay and the Minangkabau ethnic groups. The percentage of Minangkabau husbands marrying Javanese wives is higher than the percentage of Javanese husbands marrying Minangkabau wives. In JMR, there are three ethnicities that are assumed to be the local ethnic group; they are Sundanese, Betawi and Bantenese. If the three ethnicities are combined as the local ethnic group, the percentage of the local ethnic group in an endogamous marriage is 50 per cent. Among all couples in JMR, endogamous Sundanese marriages made up 25 per cent. The associated figures are 17 per cent and two per cent for Betawi and Bantenese, respectively. Among the local ethnicities, the percentage of Javanese inter-marrying with the Sundanese is the greatest. Javanese husbands who married Sundanese wives reached 3.32 per cent of all marriages in JMR whilst the percentage of Javanese wives who married Sundanese husbands was slightly lower at 2.46 per cent. The Javanese were also likely to have Betawi spouses. 196
219 Marital assimilation amongst Central Javanese people 195 Table 6.6 Percentage distributions of marriages by ethnicity of husbands and wives in BBK and JMR, 2010 Husbands ethnic group Malays Javanese Wives ethnic group Minang- Batak Chinese kabau Toba Sundanese Others Total BBK Malays Javanese Minangkabau Batak Toba Chinese Sundanese Others Total Husbands ethnic group Javanese Wives ethnic group Batak Chinese Toba Betawi Sundanese Minangkabau Bantenese Others Total JMR Sundanese Javanese Minangkabau Batak Toba Chinese Betawi Bantenese Others Total
220 Chapter 6 Endogamy was very high among the Chinese with 94 per cent of Chinese wives being married to Chinese husbands and 90 per cent of Chinese husbands being married to Chinese wives. The percentage of all marriages consisting of Sundanese or Javanese wives who married Chinese husbands was two times higher than Chinese wives who married Sundanese or Javanese husbands. The basic characteristics of married couples who are in ethnic inter-marriages in both BBK and JMR are exhibited in Table 6.7. The overall exogamy rate in BBK is 29 per cent, slightly higher that it is in JMR, at per cent. Among the selected ethnicities in BBK, the Javanese, the Minangkabau and the Sundanese have exogamy rates above the average. One out of three Javanese in BBK is in an exogamous marriage. The rate of exogamy among the Sundanese is the greatest, reaching 60 per cent. On the other hand, as opposed to the rest of the ethnicities, the Chinese and Batak Toba have low exogamy rates. Only eight per cent of Chinese couples were in exogamous marriages while the associated figure was 18 per cent for Batak Toba couples. In JMR, the exogamy rates of the Javanese, the Minangkabau and the Betawi are higher than average. Twenty seven per cent of the Javanese couples are in an exogamous marriage whilst the exogamy rate of the Minangkabau ethnic group is the greatest. The Chinese and Batak Toba are ethnicities with low rates of exogamy. In terms of age group compositions, those who are in the younger age groups have higher rates of exogamy both in BBK and JMR. Individuals with the highest exogamy rates are those aged years old in BBK and people aged years old in JMR. In terms of education levels, the higher the education levels, the greater the exogamy rates. Meanwhile, those living in urban areas have greater exogamy rates than those living in the countryside. Based on the descriptive findings, it can be said that the characteristics of husbands and wives in exogamous marriages that are measured by ethnicity or ethno-migration status produce similar results. Patterns of exogamous marriage, however, differ across sex, in that the percentage of females inter-marrying is higher than for males. The patterns are also subject to places and approaches in that the percentage of exogamous marriage is higher in BBK than it is in JMR and the rate of exogamy produced from ethno-migration status is higher than it is from ethnicity. 198
221 Marital assimilation amongst Central Javanese people Table 6.7 Exogamy rate of co-resident married couples in BBK and JMR, 2010 Ethnicity BBK Ethnicity JMR Age groups Characteristics BBK Malay Javanese Minangkabau Batak Toba Chinese 8.44 Sundanese Others % Exogamous JMR Sundanese Javanese Minangkabau Batak Toba Chinese 7.89 Betawi Bantenese 9.66 Others < Education level No schooling Primary high school Junior high school Senior high school Above senior high education Location Urban Rural Total sample 576,670 10,686,832 Overall exogamy rate Inferential analysis of the marital assimilation of Central Java married couples based on ethno-migration status and ethnicity in BBK and JMR Based on ethno-migration status The likelihood of co-resident married couples being in an exogamous marriage is examined separately for husbands and wives in BBK and JMR, as shown in Table 6.8. The reason for conducting this kind of analysis is to investigate the extent to which people from a 199
222 Chapter 6 particular ethnic group are likely to be in an exogamous marriage. For each husband and wife, the logistic regression model for the likelihood of being in exogamous marriage is conducted twice. Firstly, the model uses only migrant-ethnic origin as an explanatory variable. Secondly, other explanatory variables such as age groups, education levels and location, as controlled variables, are added into the model. In BBK, both husbands and wives of migrant-ethnic origins are more likely to be in an exogamous marriage than are husbands and wives of local people (Model 1 and Model 3) except for the North Sumatra-born. The likelihood of Central Java-born husbands being in an inter-marriage is 2.3 times higher than it is for the local-born. A similar pattern is true for Central Java-born wives, with lower propensities. When the effect of other variables such as age, education levels and locations are controlled, it is observed that Central Java husbands and wives have a tendency to inter-marry (Model 2 and Model 4). The propensity of a Central Java husbands to marry out is 1.8 times more likely than the reference category. The associated figure is 1.5 for Central Java wives. On the contrary, the opposite is true for North Sumatra-born husbands and wives, in that they are less likely to be in an exogamous marriage. The effect of age seems insignificant in influencing husbands to be in exogamous marriages. On the contrary, women in younger age groups are significantly more likely to inter-marry while women in the older age groups are less likely to have done so. The education variable positively influences the likelihood of being in an exogamous marriage. The propensity to marry out is greatest among people with a tertiary qualification. Compared to those with primary school certificates, those with a tertiary education are two times more likely to marry out. Meanwhile, those who live in rural areas are less likely to marry out than are those who live in urban areas. In JMR, people from all migrant-ethnic origins are more likely to be in exogamous marriages (Model 5 and Model 7). After controlling for other variables, all migrant-ethnic origins are more likely to be in exogamous marriages, except for East Java-born wives (Model 6 and Model 7). After controlling for other independent variables, Central Javaborn husbands are nearly three times more likely to be in an exogamous marriage, while the same is true for Central Java-born wives, but with a lower likelihood. Unlike in BBK, 200
223 Marital assimilation amongst Central Javanese people North Sumatra-born husbands and wives are more likely to inter-marry in JMR. In JMR, the likelihood of West Sumatra-born husbands and wives being in exogamous marriages is the greatest. Table 6.8 Likelihood of being in exogamous marriages of co-resident married couples based on ethno-migration status in BBK and JMR, 2010 BBK JMR Characteristics Husbands Wives Husbands Wives Model 1 Model 2 Model 3 Model 4 Model 5 Model 6 Model 7 Model 8 Ethno-migration status Others 1.759* 1.331* 1.299* 0.946* Local born (Ref.) Central Java 2.327* 1.755* 2.070* 1.528* East Java 2.716* 2.110* 1.859* 1.408* North Sumatra 0.923* 0.600* 0.920* 0.571* West Sumatra 1.265* 0.871* 1.386* 0.891* West Java 1.498* 1.093* 1.389* 1.097* Others 6.632* 4.725* 4.560* 3.259* Local born (Ref.) Central Java 3.653* 2.934* 2.626* 2.192* West Java (Outside JMR) 7.210* 5.449* 4.306* 3.272* East Java 3.321* 2.106* 1.510* 0.904* North Sumatra 4.614* 3.243* 2.451* 1.564* West Sumatra 6.597* 5.666* 5.128* 4.345* Age groups (Ref.) * * * 1.121* 1.360* * 1.436* * 1.109* 1.334* * * * 0.903* * 0.489* 0.906* 0.828* Education level No schooling 0.858* 0.867* 0.743* 0.671* Primary high school (Ref.) Junior high school 1.407* 1.359* 1.776* 1.742* Senior high school 1.737* 1.691* 2.609* 2.434* Above senior high school 1.984* 1.857* 3.429* 3.214* Location Urban (Ref.) Rural 0.716* 0.651* 0.276* 0.231* Constant 0.426* 0.360* 0.489* 0.431* 0.097* 0.110* 0.137* N (000) 287, ,019 3, , ,477 Prob>Chi Note: * significant at 5 per cent alpha. 201
224 Chapter 6 Table 6.8 also shows that, unlike in BBK, in JMR the likelihood of being in exogamous marriages among husbands and wives is influenced significantly by age. Husbands in the age group 30 to 60 years old are more likely to inter-marry. For the wives, the likelihood of marrying out starts from the age of 20 years old. Education affects the chance of marrying out for both husbands and wives. As the level of education increases, the likelihood of inter-marriage increases. Those who are urban residents are more likely to marry out than those who are rural residents. To conclude, it is interesting to find that the likelihood of people being in exogamous marriages varies across ethnic origins. Central Java-born people are more likely to marry out than are local-born people. North Sumatra-born people are less likely to marry out in BBK, however, they are more likely to marry out in JMR. Among all ethnic origins, the likelihood of Central Java-born people being in an exogamous marriage is greatest in BBK while people from West Sumatra have the greatest likelihood of being in an exogamous marriage in JMR. The effect of age in influencing inter-marriages varies. Education levels positively influence the chance of marrying out. It is also evident that those who live in rural areas are less likely to be in mixed marriages Based on ethnicity This section analyses the likelihood of being in an exogamous marriage among the selected ethnicities in BBK and JMR as depicted by Table 6.9. The findings suggest that, after controlling for other explanatory variables, in BBK, all ethnic groups are less likely to be in inter-marriages as opposed to the local ethnic group, except for Sundanese husbands and wives. For instance, Javanese husbands are less likely to be in an exogamous marriage compared to local-ethnicity husbands. The same is true for Javanese wives. The Batak Toba and the Chinese ethnic groups have the lowest likelihood of being in exogamous marriages. Batak Toba wives were 0.4 times less likely to be in an inter-marriage, while the associated figure was 0.3 times less likely for Batak Toba husbands. A quite different result is found in JMR, in which the Javanese and the Minangkabau ethnic groups are more likely to be in inter-marriages as opposed to the local ethnic group. 202
225 Marital assimilation amongst Central Javanese people Table 6.9 Likelihood of being in exogamous marriages of co-resident married couples based on ethnicity in BBK and JMR, 2010 BBK JMR Characteristics Husbands Wives Husbands Wives Model 1 Model 2 Model 3 Model 4 Model 5 Model 6 Model 7 Model 8 Ethnicity Local ethnic group (Ref.) Javanese 1.159* 0.916* 1.014* 0.798* Minangkabau 1.183* 0.852* * Batak Toba 0.435* 0.284* * Chinese 0.373* 0.373* * Sundanese 3.353* 2.618* * Others 1.592* 1.331* * Local ethnic group (Ref.) Javanese 1.873* 1.187* 1.307* 0.843* Minangkabau 3.863* 2.256* 2.225* 1.202* Batak Toba 1.642* 0.865* 0.878* 0.443* Chinese 0.522* 0.307* 0.233* 0.132* Others 2.147* 1.562* 1.623* 1.174* Age groups (Ref.) * * * * * * * * 0.822* 0.881* * 0.730* 0.724* * 0.716* 0.640* Education level No schooling 0.897* 0.951* 0.689* 0.652* Primary high school (Ref.) Junior high school 1.495* 1.427* 1.885* 1.837* Senior high school 1.877* 1.736* 2.743* 2.516* Above senior high school 2.110* 1.793* 3.394* 3.018* Location Urban (Ref.) Rural 0.686* 0.636* 0.188* 0.157* Constant 0.373* 0.282* 0.389* 0.209* 0.145* 0.268* 0.183* N (000) Prob>Chi Note: * significant at 5 per cent alpha. 203
226 Chapter 6 However, after controlling for other explanatory variables, it is only the Javanese husbands who are significantly more likely to be in inter-marriage, while the Javanese wives are not. Minangkabau husbands and wives have greater likelihoods of inter-marrying than do local people. Among Batak Toba and Chinese ethnic groups, both the husbands and the wives are less likely to inter-marry. The effect of age on the likelihood of being in an exogamous marriage varies according to sex and destination. In BBK for instance, age of husbands is insignificant in influencing the probability of being in an inter-marriage. In JMR, husbands in the older age groups are significantly less likely to be in an exogamous marriage. The age of wives influences the likelihood of being in exogamous marriages among couples in both BBK and JMR. In BBK, women aged years old are more likely to inter-marry while women aged 40 years old and above are less likely to inter-marry. In JMR, however, the age of women positively influences the likelihood of being in exogamous marriage for women age 60 years old and below. Meanwhile, women aged above 60 years old are less likely to be in inter-marriage. In terms of education levels, it is evident from Table 6.9 that for both husbands and wives in BBK and JMR, education positively influences the likelihood of being in an exogamous marriage. Those who are in tertiary education have the greatest likelihood of being in an exogamous marriage. With regards to the regional variable, it is also evident that those who are living in rural areas are less likely to be in an exogamous marriage. As mentioned earlier the reference category used for JMR consists of three local ethnic groups, namely the Sundanese, the Betawi and the Bantenese. To enrich the current study, further analysis has been conducted by un-grouping the local ethnic groups and examining the likelihood of being in an exogamous marriage separately for each of the local ethnic groups, as shown in Table 6.10 below. The first four models used the Sundanese ethnic group as the reference group, while the second four models used the Betawi and the last four models used the Bantenese as the reference group. Taking the Sundanese as the reference group, it is shown that Javanese husbands, Minangkabau and Betawi husbands and wives are more likely to be in exogamous marriages. Batak Toba, Chinese and Banten 204
227 Marital assimilation amongst Central Javanese people ethnicities have a lesser likelihood of being in inter-marriage than people in the reference category. When Betawi is used as the reference category, it is only the Minangkabau ethnic group who are more likely to inter-marry, while the rest of the ethnic origins are less likely to be in inter-marriage. The Batak Toba and Chinese ethnic groups have a lesser likelihood of being in inter-marriages. As opposed to the Betawi ethnic group, the Javanese husbands are 0.9 times less likely to inter-marry, while the associated figure is 0.7 for the Javanese wives. A quite different picture is shown when the Bantenese are taken as the reference category. The Sundanese, the Javanese, the Minangkabau and the Betawi are more likely to be in an inter-marriage. The propensity of Javanese husbands of being in inter-marriage is 1.5 times more likely than the reference category, while the associated figure is 1.2 times more likely for the Javanese wives. Minangkabau husbands and wives have the greatest likelihood of being in inter-marriage. An intriguing result is found among the Batak Toba ethnic group, in that Batak Toba husbands are more likely to inter-marry while Batak Toba wives are less likely to be in mixed marriages. Meanwhile, the Chinese are significantly less likely to be in inter-marriage. Based on findings from the descriptive and inferential analyses, one can conclude that BBK has a higher percentage of exogamous marriage than does JMR. Among non-local ancestry, one third of the Javanese are in an exogamous marriage. Minangkabau, interestingly, has the highest rate of exogamy in JMR while the highest exogamy rate is Sundanese in BBK. Relative to local ancestry husbands and wives, only Minangkabau husbands and Sundanese husbands and wives are more likely to marry out in BBK. In JMR also, when the Sundanese, the Betawi and the Bantenese are combined as the local ethnic group, Minangkabau ethnic groups are also more likely to be in exogamous marriages. In both BBK and JMR, Chinese husbands and wives are less likely to marry out. The same is also true for the Batak Toba. Age affects the likelihood of being in inter-marriage among husbands and wives differently. Wives in younger age groups are significantly more likely to be in exogamous marriages, while the opposite is true for wives in older age groups. On the contrary, husbands in older 205
228 Chapter 6 age groups are less likely to marry out while the effect of age seems insignificant for husbands in younger age groups. Education positively influences the likelihood of being in exogamous marriages in both BBK and JMR. Those who are urban residents are more likely to be in mixed marriages than those who are living in rural areas. 206
229 205 Marital assimilation amongst Central Javanese people Table 6.10 Likelihood of being in exogamous marriages of co-resident married couples based on ethnicity in JMR, 2010 Ethnicity Age groups Characteristics Sundanese as reference Betawi as reference Bantenese as reference Husbands Wives Husbands Wives Husbands Wives Model 1 Model 2 Model 3 Model 4 Model 5 Model 6 Model 7 Model 8 Model 9 Model 10 Model 11 Model 12 Sundanese 0.630* 0.770* 0.712* 0.881* 2.179* 1.299* 2.440* 1.433* Javanese 1.802* 1.196* 1.254* 0.835* 1.135* 0.921* 0.893* 0.735* 3.927* 1.553* 3.059* 1.196* Minangkabau 3.716* 2.292* 2.133* 1.193* 2.342* 1.766* 1.519* 1.051* 8.100* 2.977* 5.205* 1.709* Batak Toba 1.580* 0.885* 0.842* 0.440* * 0.600* 0.388* 3.443* 1.149* 2.054* 0.631* Chinese 0.502* 0.314* 0.223* 0.131* 0.316* 0.242* 0.159* 0.115* 1.095* 0.408* 0.544* 0.188* Betawi 1.587* 1.298* 1.404* 1.136* 3.459* 1.686* 3.426* 1.627* Bantenese 0.459* 0.770* 0.410* 0.698* 0.289* 0.593* 0.292* 0.615* Others 3.798* 2.336* 2.106* 1.235* 2.393* 1.799* 1.500* 1.088* 8.278* 3.034* 5.140* 1.770* (Ref.) * * * * * * * * * * 1.056* * 0.916* 1.056* * 0.879* 0.800* 0.879* 0.800* 0.879* * 0.721* 0.709* 0.721* 0.709* 0.721* * 0.637* 0.702* 0.637* 0.702* 0.637* Education level No schooling 0.704* 0.656* 0.704* 0.656* 0.704* 0.656* Primary high school (Ref.) Junior high school 1.838* 1.828* 1.838* 1.828* 1.838* 1.828* Senior high school 2.605* 2.491* 2.605* 2.491* 2.605* 2.491* Above senior high school 3.083* 2.973* 3.083* 2.973* 3.083* 2.973* Location Urban (Ref.) Rural 0.194* 0.162* 0.194* 0.162* 0.194* 0.162* Constant 0.217* 0.152* 0.279* 0.186* 0.344* 0.197* 0.392* 0.211* 0.100* 0.117* 0.114* 0.130* N (000) Prob>Chi Note: * significant at 5 per cent alpha.
230 Chapter Testing status exchange on education among Central Javanese inter-marriage couples by ethno-migration status and ethnicity Descriptive analysis of educational matching by ethno-migration status and ethnicity Table 6.11 provides cross-classifications on the educational levels of wives for both intra- and inter-marrying co-resident married couples separately in BBK and JMR. For each type of marriage, couples are divided into three groups, namely wives who marry up on education (husband s education is higher than wife s education), educational homogamy (husband and wife have equal education levels), and wives who marry down on education (husband s education is lower than wife s education). For wives who marry up or marry down, their education differences compared against their husbands are segregated into three groups: one level higher or lower than husbands education, two levels higher or lower than husbands education, and more than two levels higher or lower than husbands education. There are several points that can be highlighted from examining Table Firstly, it is observed that in both BBK and JMR, more than half of the married couples have equal levels of education. Educational homogamy in inter-married couples is slightly lower than it is in intra-married couples. Secondly, percentages of wives marrying up are greater than percentages of wives marrying down among intra- and inter-married couples. The discrepancy is more profound in JMR, in particular among local-born husbands and Central Java-born wives. The proportion of Central Java-born wives who married husbands with higher education levels is three times higher than for Central Java-born wives with lower-educated husbands. Thirdly, among couples where the wife marries up or down in both intra- and intermarried couples, the majority of the couples hold one level of educational difference. Fourthly, it is unclear if status exchange exists among inter-married couples found in JMR and BBK. For instance, in BBK Central Java-born wives who are in inter-marriages have greater percentages of both marrying up and marrying down than do Central Java-born wives who have Central Java-born husbands. Despite the simplicity of the cross-classification tables in providing a rapid assessment of educational gaps between husbands and wives, Table 6.11 does not provide strong evidence as to whether patterns of inter-marriages are influenced by status exchange. As an illustration, a 208
231 Marital assimilation amongst Central Javanese people greater percentage of Central Java-born wives being in inter-marriage than being in intramarriage could demonstrate a larger gap in education levels between Central Java-born wives and local-born husbands than Central Java-born wives and husbands. Thus, it is important to apply inferential statistics to investigate whether or not status exchange theory applies in intermarriage patterns among Central Java-born husbands and wives by controlling for group differences on educational attainments. Table 6.11 Educational matching by inter-marriage among Central Java-born and local-born husbands and wives in BBK and JMR, 2010 Central Javaborn husband/ Central Javaborn wife Central Javaborn husband/ Local-born wife Local-born husband/ Central Javaborn wife Local-born husband/ Local-born wife BBK Educational homogamy (%) Wives marry up on education (%) level higher levels higher > 2 levels higher Wives marry down on education (%) level lower levels lower > 2 levels lower Wives marry up - wives marry down N of couples 16,867 3,327 3,379 49,710 JMR Educational homogamy (%) Wives marry up on education (%) level higher levels higher > 2 levels higher Wives marry down on education (%) level lower levels lower > 2 levels lower Wives marry up - wives marry down N of couples 569, , ,509 2,493,958 The descriptive analysis has been carried out by taking ethnicity as a base for investigating educational matching among intra- and inter-married couples in both areas. Ethnicity is used 209
232 Chapter 6 as a variable to examine inter-marriage patterns between non-natives and local people and also to measure whether or not status exchange theory is applicable. In this section, I replaced Central Java-born couples with Javanese couples and local-born couples with local-ethnic couples. I used an origin ethnicity code provided by the BPS-Statistics office. I used code 114 to select the Javanese ethnic group. In BBK, there are actually two local ethnic groups, namely the Malays and the Suku Anak Laut. Since the size of the Suku Anak Laut is very small and the Malays are dominant among local populations of BBK, I assumed the local ethnicity of BBK to be Malay with an ethnicity code of 107. For JMR, there are three dominant local ethnic groups, Betawi (code 111), Sunda (code 113) and Banten (code 123). Thus, in the analysis I pooled all these three ethnic groups as the local ethnic group of JMR. Similar to the work I conducted in the previous sub-section, I constructed a crossclassification of co-resident married couples who are in inter- and intra-marriages, based on the education levels of the wives, as shown in Table Overall, the educational matching of Central Javanese and local people shows similar patterns either measured by ethno-migration status or ethnicity. For instance, the percentage of both husbands and wives in inter- and intra-marriages who have equal education levels is the greatest. A substantial difference is in particular shown for Javanese husbands/local-ethnic wives in BBK. The percentage of wives who married down on education is the smallest across marriage groups. As a consequence, the gap between wives who married up and down for Javanese husbands/local-ethnic wives is the greatest. Also, it is shown that the educational gap between husbands and wives for both intra- and inter-marriages is the greatest at one level higher or lower of education. 210
233 Marital assimilation amongst Central Javanese people Table 6.12 Educational matching by inter-marriage among Javanese and localethnic husbands and wives in BBK and JMR, 2010 Javanese husband/ Javanese wife Javanese husband/ Local-ethnic wife Local-ethnic husband/ Javanese wife Local-ethnic husband/ Local-ethnic wife BBK Educational homogamy (%) Wives marry up on education (%) level higher levels higher > 2 levels higher Wives marry down on education (%) level lower levels lower > 2 levels lower Wives marry up - wives marry down N of couples 72,324 9,457 8,915 40,782 JMR Educational homogamy (%) Wives marry up on education (%) level higher levels higher > 2 levels higher Wives marry down on education (%) level lower levels lower > 2 levels lower Wives marry up - wives marry down N of couples 1,208, , ,213 2,762,130 From the two approaches to measuring educational matching among co-resident married couples in both BBK and JMR, one can suggest that, both in intra- and inter-marriages, the majority of couples have equal education levels. Relative to intra-married husbands and wives, wives in inter-married couples are more likely to marry up than to marry down on education. The majority of inter-married couples with wives who have married up have one level of educational difference. In the next section, a multinomial logistics regression model is carried out to examine an exchange on education among inter-married couples in both regions. 211
234 Chapter Inferential analysis The majority of married co-resident couples, as found in the descriptive analysis, regardless of their ethno-migration status or ethnicity, marry someone with an equal educational level. It is important for migrant groups to blend with local people and culture in order to accelerate their adaptation and adjustment and also to expand their networks at the host place. The aim of status exchange on education for migrants is to facilitate them gaining local status at the place of destination through an exchange of their high educational levels by marrying lowereducated local people. Table 6.13 investigates patterns of marrying up or marrying down for Central Java-born husbands and wives who are in inter-marriages compared to Central Java-born intra-married couples separately for BBK and JMR. The idea is to understand whether or not Central Javaborn husbands or Central Java-born wives who inter-married locals are more likely to marry down on education than are Central Java-born husbands/wives after controlling for other variables. The models are controlled for wife s education, husband s age and wife s age. The reference group is the Central Java-born co-resident married couples who are in intramarriages. Relative to Central Java-born husbands/wives who are in intra-marriages, and after controlling for wife s education, husband s age and wife s age, the value of the odds ratio for educational hypergamy for Central Java-born husbands/local-born wives is greater than one and increases as levels of educational difference increase, both in BBK and JMR. This indicates that localborn wives of Central Java-born husbands are more likely to marry up than to marry equally on education as opposed to Central Java-born intra-married couples. For instance, the likelihood of local-born wives/central Java-born husbands marrying up on education two levels higher is 1.97 times more likely than to marry equally on education, relative to Central Java-born intra-marriages in BBK. The associated figure is somewhat higher in JMR, with the value of odds ratio being In BBK, as opposed to Central Java-born intra-marriages, Central Java-born wives of localborn husbands are more likely to marry down than to marry equally on education. The odds of marrying down increase as the levels of educational differences between husbands and wives increase. In contrast, the same is not true in JMR. As opposed to Central Java-born 212
235 Marital assimilation amongst Central Javanese people intra-marriages, Central Java-born wives of local-born husbands are less likely to marry down than to marry equally on education. This means that results for BBK support the status exchange on education theory in that both Central Java-born husbands and wives who intermarried local people were more likely to have married down on education. In JMR, however, the status exchange theory is only partially supported among Central Java-born husbands who inter-married local-born wives. With regards to other explanatory variables, findings from BBK show that wives with university degree backgrounds are more likely to be in inter-marriages between Central Javaborn husbands/local-born wives. The age of the husband significantly influences the likelihood of inter-marrying. In JMR, education level and the age of the wife positively influence the likelihood of inter-marrying. Table 6.13 Multinomial logistic regression models of Central Java-born intermarriages, with Central Java-born intra-marriages as the reference, BBK and JMR Variable Central Javaborn husband/ Local-born wife OR p- value BBK Local-born husband/ Central Javaborn wife OR p- value Central Javaborn husband/ Local-born wife OR p- value JMR Local-born husband/ Central Javaborn wife OR p- value Educ. homogamy (Ref.) Wives marry up 1 level higher levels higher > 2 levels higher Wives marry down 1 level lower levels lower > 2 levels lower Wife s education No schooling (Ref.) Primary high school Junior high school Senior high school University degree Husband, age Wife, age Constant Findings from Table 6.13 suggest that patterns of Central Java-born inter-marriages provide support for status exchange theory for both sexes in BBK but only for Central Java-born 213
236 Chapter 6 husbands in JMR. In BBK, both Central Java-born husbands and wives who married locals are more likely to have low-educated spouses. This shows that Central Java-born husbands and wives who want to secure their place in a destination marry low-educated local spouses. In JMR, it is only Central Java-born husbands who marry down on education to local-born wives. The reason is perhaps related to the structure of the marriage market and the population size of local-born husbands in JMR. Also, it can be seen that a wife s education significantly influences the likelihood of being in an inter-marriage. The effect of this variable is greater than it is in BBK. To check the robustness of the findings, I also ran the same models by using the Javanese intra-married couples as the reference groups and included all other controlled variables. My aim was to test whether or not status exchange on education matters among Javanese intermarried couples relative to Javanese intra-married couples. Table 6.14 shows patterns of marrying up or marrying down for Javanese husbands and wives who are in inter-marriages, compared to Javanese intra-married couples separately, for BBK and JMR. Overall, the results show similar patterns to ethno-migration status. Status exchange theory, using Javanese intra-married as the reference group, was supported in both JMR and BBK and across both sexes. Table 6.14 shows that in both BBK and JMR, local-ethnic wives of Javanese husbands are more likely to marry up than to marry equally on education, as opposed to Javanese intra-married couples. After controlling for wife s education, husband s age and wife s age, in BBK, the likelihood of local-ethnic wives marrying up one level higher on education to Javanese husbands is 1.4 times more likely than to marry equally on education, relative to Javanese intra-marriages. The associated figure is the same in JMR. As educational differences between husbands and wives increase, the likelihood of local-ethnic wives to marry up to Javanese husbands increases. For instance, the odds of local-ethnic wives marrying up two levels higher on education to Javanese husbands is 1.8 times more likely than to marry equally, as opposed to Javanese intra-marriages. The associated figure is higher in JMR, being 2.2 times more likely. It is also evident from Table 6.14 that Javanese wives/local-ethnic husbands are more likely to marry down on education in both BBK and JMR. For instance, the likelihood of Javanese wives of local-ethnic husbands marrying down two levels lower on education is 1.47 times more likely than to marry equally on education relative to Javanese intra-married couples. The associated figure is 1.48 times more likely in JMR. 214
237 Marital assimilation amongst Central Javanese people Table 6.14 Multinomial logistic regression models of Javanese inter-marriages, with Javanese intra-marriages as the reference, BBK and JMR Variable Javanese husband/ Local-ethnic wife OR p- value BBK Local-ethnic husband/ Javanese wife OR p- value Javanese husband/ Local-ethnic wife OR p- value JMR Local-ethnic husband/ Javanese wife OR p- value Educ. homogamy (Ref.) Wives marry up 1 level higher levels higher > 2 levels higher Wives marry down 1 level lower levels lower > 2 levels lower Wife s education No schooling (Ref.) Primary high school Junior high school Senior high school University degree Husband, age Wife, age Constant Findings from Table 6.14 suggest that patterns of Javanese inter-marriages on status exchange on education theory are the same across destinations and across sexes when the reference category is Javanese intra-marriages. Both Javanese husbands and wives who are in intermarriages exchange their high educational level to secure local status by marrying loweducated local-ethnic spouses. Findings for other explanatory variables when Javanese intra-marriages are used as the reference group show similar patterns when they are compared to Central Java-born intramarriages as the reference group. In JMR, a wife s education is important among Javanese inter-married couples. As the wife s level of education increases, the likelihood of being in an inter-marriage increases. In BBK, the effect of a wife s education on the propensity to be in inter-marriage is only significant among those who have university degrees. Meanwhile, the age of the wife does not significantly influence the likelihood of being in inter-marriage in BBK. 215
238 Chapter Discussion and conclusion The aim of this study has been to investigate patterns of marital assimilation of Central Javanese people, measured by ethno-migration status and types of ethnicity, in particular in relation to patterns of exogamous marriages and as regards testing of status exchange theory. As regards the characteristics of those who are in exogamous marriages, I extended the work of Utomo and McDonald (2014) on assortative mating of ethnic marriage pairings in Indonesia. I focused on Central Javanese marital assimilations at the two most prominent places of destination: the Jakarta Metropolitan Region (JMR) and the Batam-Bintan-Karimun (BBK). I investigated marital assimilation of Central Javanese people according to their ethnomigration status and ethnicity. When it comes to testing status exchange theory I adopted the work of Hou and Myles (2013). I tested whether status exchange theory of inter-married couples is applicable in the Indonesian setting. I extended past research on status exchange theory of inter-marriage models among racial groups in the developed setting by using two approaches: ethno-migration status and ethnicity of Central Javanese people and local people. I chose BBK and JMR as the setting of the study due to their historical backgrounds as melting pots for many Indonesians, including the Central Javanese people. This study found that inter-marriage patterns are subject to locations and approaches. The rate of exogamous marriages is lower in JMR than in BBK, whether measured by ethno-migration status or ethnicity. This can be explained, as mentioned in Chapter 5, by BBK having institutional labour agencies which recruit young migrants from all around the provinces, including those from Central Java. By doing so, the types of migrants found in BBK are more diverse than in JMR and the migrants represent a much larger fraction of the population than is the case in JMR. Thus, it is speculated that the size of migrant groups, the composition of the local marriage market and the region s migration history can explain such patterns. In addition, the percentage of exogamous marriages measured by ethno-migration status is higher than when measured by ethnicity both in JMR and BBK. This may be because the category, Javanese, includes people from three provinces: Central Java, East Java and Yogyakarta. It is also presumably because a lot of the local born are ethnic Javanese. If this is the case, this suggests that ethnicity is a better variable for measuring patterns of inter-marriages that ethnomigration status. 216
239 Marital assimilation amongst Central Javanese people The percentages of exogamous marriages for Central Javanese husbands/wives are higher when measured by ethno-migration status than they are by type of ethnicity. Also, Central Javanese people tend to marry local people rather than migrants of other groups. The reason that JMR has a lower exogamy rate than BBK can be explained by the size of the groups in JMR which are bigger than those in BBK. The size of the group influences patterns of intermarriages in such a way that the larger the size of a particular group, the smaller the chance of a member of the group marrying out (Kalmijn, 1998). The fact that the ethno-migration status approach finds a higher level of exogamy rates than does the type of ethnicity approach suggests that group boundaries are weaker when place of origin is used as an indicator of exogamous marriage patterns than when type of ethnicity is. The empirical findings on the odds of husbands and wives being in exogamous marriages suggest that Central Java-born husbands and wives are more likely to be in exogamous marriages than are local-born people. It is evident that there is no such sex difference in intermarriages among the Central Java-born people. The patterns are the same in BBK and JMR and for other groups as well, except for North Sumatra-born people in BBK. When type of ethnicity is considered, there is a substantial difference in inter-marriage patterns in BBK and JMR whereby all ethnic groups are less likely to inter-marry in BBK. In JMR, the Javanese and the Minangkabau are more likely to be in exogamous marriages however, the Batak Toba and Chinese ethnic group people are less likely to inter-marry. This finding falls in line with the work of Utomo and McDonald (2014) who found that, in Jakarta province, the Batak Toba and the Chinese ethnic groups have higher endogamy rates compared to the rest of the ethnic groups. For instance, more than 80 per cent of the Batak Toba ethnicity is in endogamous marriages, and a far higher percentage is found for Chinese. It is likely that the Batak Toba and Chinese group boundaries are quite rigid, decreasing the chance of members of the groups inter-marrying, as argued by Kalmijn (1998). Differences in cultures and religions provide two main reasons for explaining why Batak Toba and Chinese are less likely to intermarry. This finding is in line with previous studies (Burdette et al., 2012; Carnegie, 2013; Seo, 2013). Statistics show that the majority of the population in JMR are Muslim while the Batak Toba and the Chinese ethnicities are mostly non-muslim. Thus it is understandable that people from the Batak Toba and Chinese ethnic groups have a low likelihood of intermarrying. 217
240 Chapter 6 Education positively influences the likelihood of being in inter-marriages for both husbands and wives in BBK and JMR. This finding is in line with theory and past studies that argued that better-educated people are more likely to be in exogamous marriages than are lesseducated people (Furtado, 2012; Kalmijn, 1998). This study has also shown that those who live in rural areas are less likely to inter-marry than those who live in urban areas, and reflects that regions consisting of people from various origins and ethnic groups increase the chance of individuals inter-marrying. The current chapter has also examined the status exchange on education theory of Central Java-born/Javanese who inter-marry with local-born/local-ethnicity spouses. Findings from the descriptive analysis have shown that educational homogamy dominates patterns of interand intra-married couples at the two places of destination. Also, more wives are marrying up than marrying down. This is perhaps explained by the differences in education levels between men and women. The data show that in both BBK and JMR, smaller numbers of women than men have graduated from senior high school and above. The results from testing the theory of status exchange on education among Central Javanese people who inter-married local people reveal that, when the reference category is Javanese intra-marriages, Javanese people who are in inter-marriages are more likely to marry down than to marry equally on education across destinations and sex. This means that both Javanese husbands and wives exchange their high educational levels with local status by marrying loweducated local-ethnic people in both BBK and JMR. When the reference category is Central Java-born intra-marriages, the results provide similar findings in that there is evidence that in BBK, both Central Java-born husbands and wives who are in inter-marriages are more likely to have lower-educated spouses. Findings from JMR support the status exchange on education theory partially, in that it is only Central Java-born husbands who are in intermarriages and have lower-educated spouses. Central Java-born intra-marriages and Javanese intra-marriages are taken as the reference categories in testing theory of status exchange on education among Central Javanese people who inter-married local people because the theory suggests that migrants will exchange their socio-economic status for local status by marrying lower-educated local people. Thus, the two references are used to measure whether migrants are willing to cross group boundaries in 218
241 Marital assimilation amongst Central Javanese people order to gain access to a host place. The reason why migrants are willing to marry local-born people is to secure their place at a destination (Furtado, 2012). Thus, the two reference categories are used to test the presence of status exchange on education among Central Javanese people who inter-marry local people. Findings from BBK and JMR reveal that there is evidence that Central Javanese people exchange their high educational status to gain local status by marrying low-educated local people. For migrant groups, it is important for them to marry local people because it can help them improve their socio-economic status, expand networks among local-born people and adapt quickly to local cultures (Furtado, 2012). In turn, they can assimilate easily and quickly with people in host regions. In JMR, the evidence of status exchange is partial, that is, it only applies to Central Java-born husbands who are in inter-marriages but not to Central Java-born wives in inter-marriages. The possible hypothesis could be that the composition of the marriage markets and the size of ethnic groups (Kalmijn, 1998) in JMR cause Central Javaborn wives in inter-marriages to be less likely to marry down than to marry equally on education, as opposed to Central Java-born intra-marriages. The findings also reveal the effect of other control variables such as education. Education of wives positively influences the likelihood of being in inter-marriage. Thus, educated wives seek spouses from outside their own group. This result is in line with the theory that explains that education facilitates and increases preferences for inter-marrying (Chiswick & Houseworth, 2011). Ages of husbands and wives, to some extent influences the likelihood of being in intermarriage among Central Javanese people. This study has tested the status exchange theory in the context of Indonesia and found evidence that status exchanges on education affect the chance of inter-marrying among Central Java-born/Javanese ethnic groups and local-born/local ethnic groups in BBK and JMR. It is important to note that this result cannot be generalised to all ethnic groups in Indonesia. Further study is needed to examine status exchange on education among other ethnic inter-marriages. The next chapter, the last chapter of the thesis, will summarise and conclude the thesis findings. 219
242
243 Chapter 7 Conclusions 7.1 Introduction Migration within Indonesia has a long history, a history associated with the uneven distribution of population across the archipelago that has persisted over centuries. Throughout this history, out-migration has been associated with population policy and, in particular, with one province, Central Java. To date, there have been extensive studies on migration issues in the context of the impacts and consequences of migration on migrants in a scope of a particular province or a group of regions. However, little is known about the broader picture of inter-provincial migration in Indonesia based on a full set of all five Indonesian censuses (1971, 1980, 1990, 2000 and 2010 censuses), and how Central Java, a province that sends the greatest number of migrants, is situated in the overall picture of migration within Indonesia. Also, limited research has been done to compare and contrast the employment outcomes and marital assimilation of the Central Javanese people who migrate to several places of destination. The thesis is established by using a variety of empirical tools to address different topics in the migration literature in each analytical chapter. The argument of the thesis is that Central Java remains the main source of migrants and has strong connectedness with Jakarta and other new economic geographies, and whilst it is young Central Javanese people who have the greatest probability of migrating, their employment outcomes vary across destinations. Also Central Javanese migrants are likely to inter-marry local people more than those from some other migrantethnic origins. The research strategy of the thesis includes the examination of four main topics in the migration literature. Firstly, the thesis examines patterns and changes regarding Indonesia s inter-provincial migration during 1971 to 2010, in particular, in relation to in- and outmigration flows, spatial concentrations and structural patterns across provinces. Secondly, the thesis explores the conditional probabilities of migration among Central Java s primary, onward and return migrants based on their age structures, sexes and places of destination. Thirdly, the thesis investigates the employment outcomes of Central Java s primary migrants in the Semarang Metropolitan Region (SMR), the Jakarta Metropolitan Region 221
244 Chapter 7Chapter 7 (JMR) and the Batam-Bintan-Karimun (BBK) zones. Fourthly, the thesis examines marital assimilation and status exchange on education amongst Central Javanese people in JMR and BBK. The aim of this chapter is to summarise the thesis findings and theoretical implications of the thesis as well as to suggest future research in migration studies in Indonesia. The chapter is organised as follows. Firstly, I begin by describing the introduction and the research strategy of the thesis. In section two, I summarise the thesis findings from four research questions. Then, I outline theoretical implications of the thesis in section three. Section four describes potential future research in migration studies in Indonesia. 7.2 Summary of the thesis findings Indonesia s inter-provincial migration between 1971 and 2010: Flows, spatial concentrations and structural patterns across provinces The scatter plots of provincial in- and out-migration rates over show that the majority of provinces are clustered in the bottom of each graph, meaning that most of the provinces have low in- and out-migration rates. A few provinces deviated far from the diagonal lines, such as Lampung which deviated far above the diagonal line in the 1971 and 1980 censuses as a result of its leading role as a destination in transmigration policy. Another province that deviated far from the diagonal line is Jakarta. The position of Jakarta shifted from the upper left to the bottom right of the graph across the censuses, indicating a reduction in the number of in-migrants and an increasing number of out-migrants as the metropolitan development of Jakarta extended beyond the boundary of the province of Jakarta. Several other provinces that are also allocated above the diagonal lines, indicating high in-migration, are Riau, East Kalimantan and Central Kalimantan. The coefficient of correlation that has been calculated from the rates of provincial in- and out-migration is found to be positively significant for the 1971, 1990 and 2010 censuses. This means that during the five years preceding each of these censuses, the economically advantaged provinces were drawing a lot of in-migrants but at the same time were also the source of many out-migrants. 222
245 Conclusions The aggregate system-wide index (Aggregate Coefficient of Variation, ACV) increased between the 1971 and 2000 Censuses, although there was a slight decrease at the 1980 Census, indicating a greater spatial concentration of migration flows. The increases in the system-wide ACVs were caused by increases in out-migration CV field indices, while the in-migration field indices fell by a smaller amount. Overall, this means that migrants increasingly came from a larger number of origins. Provincial concentration of migration flows for the whole migration system decreased slightly in 2010, due mainly to reduction in the out-migration ACV. The in-migration ACV, at the same time, experienced a moderate increase. This situation indicates that in-migrants were being drawn from a lesser number of origins while out-migrants had more diverse destination choices. When the new provinces were grouped, the overall system-wide ACV decreased and this was due to a reduction of in-migration ACV values. However, the opposite is true when new provinces are segregated from old provinces. The overall system-wide ACV experienced an increase. Such an increase is solely contributed by the value of in-migration, which increased from 2.17 to 2.32 during that period. Based on these findings, one could say that separating new provinces from their origin provinces can change conclusions about overall patterns of the migration system. The origins of in-migrants are becoming more concentrated while the destinations of migrants are becoming less concentrated. The mean CV values of in-migration and out-migration have shown that the CV values for in-migration are decreasing over time, translating into more selected origins for inmigrants. Overall, provinces tended to maintain similar rankings for the diversity of their in-migrants from 1971 to Among all provinces, it is Aceh that consistently had a high CV value for in-migration over the periods of analysis. This means that Aceh draws inmigrants from a few selected origins. The average CV value for provincial out-migration decreases, but the CV values for several well-known destination provinces tend to increase. For instance, Jakarta, the capital of the nation, experienced a moderate increase in its CV value and stood out as the province with the highest CV value for out-migration in This reflects the movement of people to districts surrounding Jakarta, here encapsulated as movement to one destination, West Java. Relative to Jakarta s CV value for in-migration, Jakarta s CV value for out-migration is higher, implying that potential migrants had fewer viable options in terms of possible destinations. Central Java had a relatively high out- 223
246 Chapter 7Chapter 7 migration CV value in both 1971 and 2000, indicating that the choices of destination of migrants originating from Central Java were less diverse than for Indonesia as a whole. A possible hypothesis here is that migrants from Central Java were less well educated on average than migrants from other provinces, meaning they had fewer choices. The origin main effect components of inter-provincial migrations confirm that Central Java remained the main source of migrants across provinces over the decades. The share of Central Java s out-migration rocketed from 19 per cent in 1971 to 26 per cent in 1980 and remained stable at levels above 20 per cent over the last two periods. Results from the multiplicative component model showed that there was a strong connectedness between Central Java and other provinces in Java. In the early periods, there were a number of migrants from Central Java who were found in several provinces in Sumatra and Kalimantan. A strong connectedness between Central Java and Jakarta and between Central Java and West Java is mostly due to the effect of Jakarta s economic expansion to its peripheral regions, which coincidently fall under West Java s administration. It is evident from the study that 57 per cent of Central Java s out-migrants were found in these two provinces. Of the total Central Java out-migrants found in West Java, 60 per cent of them lived either in Bogor, Bekasi or Depok, regions belonging to West Java that have land borders with Jakarta. Another province that also has a strong connectedness to Central Java is Yogyakarta. Findings from the destination main effect components of inter-provincial migrants showed the expected result that Jakarta and West Java experienced high percentages of migrants entering these provinces. The share of Jakarta s in-migration was a mirror image of the share of West Java s in-migration. In 1971, the share of Jakarta s in-migration was 28 per cent; it had decreased to 13 per cent in A reversed pattern is found for West Java. In 1971, the share of West Java s in-migration was 10 per cent, and this increased to 27 per cent in A reduction in the share of Jakarta s in-migration does not mean that the attractiveness of Jakarta has decreased. This is rather due to living costs of Jakarta, which are far higher than in West Java. In order to cope with this situation, many migrants live in regions under West Java s administration that are located near Jakarta, and keep their activities in Jakarta. Data from the 2010 census revealed that 85 per cent of migrants originating from Jakarta were concentrated in Bogor, Bekasi and Depok while the other
247 Conclusions per cent were found in the remaining regions in West Java or in Banten, the province bordering Jakarta to the west Characterisation of Central Java s primary, onward and return migrants: Conditional probabilities of migration by age and sex Total migrations undertaken by Central Java-born people were 510,477 migrations in the five years preceding the 1971 Census and increased strongly to 1,217,112 migrations in Among the three types of migrants, primary migrants, return migrants and onward migrants, it is primary migrants who dominate overall migration patterns. In 1971, there were 352,295 primary migrants from Central Java equal to 69 per cent of total movements. The figure increased threefold to 913,943 in 2010, translating into 75 per cent of total migrations undertaken by Central Java-born people. At the same time, the share of return migrants to overall migrations went down. In 1971, the share of return migrants in total migrations was 23 per cent, and this decreased to 9 per cent in Meanwhile, the share of onward migrants substantially increased both numerically and proportionately. In 2010, onward migrants contributed 16 per cent of total migrations, doubling from 8 per cent in Central Java s primary and onward migrants are mostly concentrated in provinces on Java Island. Over time, the proportion of Central Java s primary migrants found in Java is getting larger. The figure increased from 66 per cent in 1971 to 73 per cent in The associated figures were 65 per cent and 73 per cent for onward migrants, respectively, during the same period of time. Twelve per cent of Central Java s primary migrants were found in Sumatra. In 2010, a substantial proportion of primary migrants were found in Riau and Riau Island. Central Java returnees are also coming from provinces on Java Island, in particular from Jakarta and West Java. In 2010, more than half of the Central Java return migrants came from these two provinces. In terms of age, in 2010, the greatest percentage of primary migrants was found in the age group 20 to 24 years old. Meanwhile, the peak for Central Java s onward and return migrants was for those aged 25 to 29 years old. 225
248 Chapter 7Chapter 7 The conditional probabilities of migration for Central Java s primary, onward and return migrants show similar patterns. From 1971 to 1990, the conditional probabilities of migration for the three types of migrants increased gradually and then slightly reduced in Out of a thousand Central Java-born people who resided in the province during the five years before the 1971 Census, 23 people had undertaken an initial move. The figure increased to 42 in 1990 and then declined to 31 in Meanwhile, the conditional probabilities of migration for return and onward migrants were 18 and 34 people for every thousand populations at risk for each type of migrant in 2010, respectively. When age and sex were considered in calculating the conditional probabilities of migration for each type of migrant, the study found that out of a thousand population at risk for primary migrants in 2010, the number of people aged 20 to 24 years old who were undertaking an initial move was the highest, with 107 people, having increased from 89 people in For onward and return migrants, the propensity to migrate was the highest for the age group years old. In 2010, the conditional probability of migration for people aged years was 59, having decreased slightly from 64 in For return migrants, the rate was 29 for people in the age group years old in 2010, reducing from 40 in In addition, the conditional probabilities of migration did not differ much between males and females. In terms of the choice of destination, female migration rates were higher than the male rates in Java, while the reverse was the case for provinces outside of Java. This confirms many other studies that have found that men tend to move longer distances than women Employment outcomes of Central Java s primary migrants in different economic zones Findings from the descriptive analysis of the thesis suggest that Central Java s primary migrants do not necessarily migrate to cities merely for employment possibilities. Those who moved to the City of Semarang were equally as likely to move for education or work. However, the large majority of those moving to JMR and BBK were employed. In line with the descriptive findings, results from the inferential analysis reveal that Central Java s primary migrants are less likely to work in SMR than non-migrants; however, they are more likely than non-migrants to work in JMR and BBK. When sex is considered, Central Java s 226
249 Conclusions primary male migrants found in JMR and BBK have better employment prospects than non-migrants. Findings from other independent variables suggest that the likelihood of being in work increases with age, while individuals who had completed senior high school are more likely to work in JMR and BBK as opposed to non-migrants. Married males are more likely to work than unmarried males. And those who are living with others are more likely to work than those who are living alone. The analysis of employment outcomes of Central Java s primary migrants further examined their likelihood of being in work in different sectors. The study reveals that Central Java s primary migrants are more likely to work in the manufacturing sector, the trade sector, and the service sector as opposed to non-migrants. Among those who are working in the manufacturing or trade sectors, females, senior high school graduates, and unmarried people dominate the sectors. Among those who are working in the service sector, their likelihood of being in work increases with education. The likelihood of working in manufacturing, trade or service sectors decreases with age. With regards to living arrangements, individuals who are living with others are more likely to work in the trade or service sectors than to work in the rest of the sectors, as opposed to people living alone. The study also found that individuals who reside in JMR and BBK are more likely to work in the manufacturing or trade sectors than any of the other sectors, as compared to people who reside in SMR. I also examined the likelihood of Central Java s primary migrants being in work in a specific sector for each economic zone separately. In SMR, I found that as opposed to non-migrants, both Central Java s primary male and female migrants are more likely to work in the manufacturing sector than to work in the remaining sectors. The odds of Central Java s primary male migrants working in the trade sector are three times higher than of them working in the rest of the sectors, while the associated figure is two times higher for Central Java s primary female migrants. Meanwhile, the likelihood of Central Java s primary female migrants working in the service sector is slightly greater than the odds of Central Java s primary male migrants working in the same sector. I found similar results in JMR, where Central Java s primary migrants are also more likely to work in the manufacturing sector than to work in the rest of the sectors, as opposed to non-migrants. The odds of working in the manufacturing sector for Central Java's primary male migrants 227
250 Chapter 7Chapter 7 are two times higher, with slightly higher odds for Central Java s primary female migrants. Both Central Java s primary male and female migrants are also more likely to work in the trade and service sectors than to work in any of the remaining sectors. In BBK, I found that the likelihood of Central Java s primary migrants working in the manufacturing sector in BBK is six times higher than of them working in the remaining sectors, as opposed to non-migrants. The odds are even higher than those found in SMR and JMR. Across the sexes, the likelihood of Central Java s primary female migrants working in the manufacturing sector is ten times higher while the associated figure is five times higher for Central Java s primary male migrants Marital assimilation amongst Central Javanese people in two destinations: Investigating patterns of exogamous marriage and status exchange The thesis found that the percentages of marital assimilation of Central Javanese husbands and wives are higher when measured by ethno-migration status than they are by type of ethnicity. Also, Central Javanese people tend to marry local people rather than people from other migrant groups. The fact that the ethno-migration status approach finds a higher level of exogamy than does the type of ethnicity approach suggests that group boundaries are weaker when place of origin is used as an indicator for exogamous marriage patterns than when type of ethnicity is. In addition to that, overall exogamous marriage is lower in JMR than it is in BBK, whether measured by ethno-migration status or ethnicity. The reason that JMR has a lower exogamy rate than BBK can be explained by the size of the groups in JMR, which are bigger than those in BBK. Findings from the inferential analysis suggest that, as opposed to local-born people, Central Java-born husbands and wives are more likely to be in exogamous marriages, both in BBK and JMR. The same patterns are also shown by other ethno-migration status groups. When type of ethnicity is considered, there is a substantial difference in inter-marriage patterns in BBK and JMR whereby all ethnic groups are less likely to inter-marry in BBK. In JMR, the Javanese and the Minangkabau are more likely to be in exogamous marriages, however, people from the Batak Toba and Chinese ethnic groups are less likely to inter-marry. It is likely that, unlike the Javanese, the group boundaries of Batak Toba and Chinese are quite rigid, thus decreasing the chance of the members of the groups inter-marrying. Differences 228
251 Conclusions in cultures and religions provide two main reasons for explaining why Batak Toba and Chinese are less likely to inter-marry. Statistics show that the majority of the population in JMR are Muslim while the Batak Toba and those of Chinese ethnicity are mostly non- Muslim. With regards to the other variables, the study reveals that education positively influences the likelihood of being in inter-marriages for both husbands and wives in BBK and JMR. This study has also shown that those who live in rural areas are less likely to inter-marry than those who live in urban areas, and finds that regions consisting of people from various origins and ethnic groups increase the chance of an individual to be in an inter-marriage. While the effect of age varies across sexes, places and approaches, exogamous marriages tend to be more common at younger ages. I have also examined the status exchange on education theory of Central Javaborn/Javanese people who inter-marry local-born/local-ethnic group people. Findings from the descriptive analysis have shown that educational homogamy dominates patterns of inter- and intra-married couples at the two places of destination. Also, more wives are marrying up than marrying down. Thus, it can be said that while education homogamy is the mode in both ethno-migration status and ethnicity pairing types, homogamy matters least in Central Java inter-marriages, where both Central Javanese husbands and wives are more willing to marry up or to marry down on education. Findings from the inferential analysis in testing status exchange on education theory among Central Javanese people who inter-marry local people have revealed that status exchange theory is in evidence among Central Javanese inter-marriages in both BBK and JMR. Central Java-born intra-marriages and Javanese inter-marriages are used to investigate whether or not Central Javanese migrants are willing to exchange their high educational levels for local status by marrying lower-educated local people. As opposed to Javanese intra-marriages, Javanese husbands and wives who are in inter-marriages are more likely to marry lower-educated local-ethnic spouses than to marry equally on education in both BBK and JMR. When Central Java-born intra-marriages are used as the reference category, the findings show that there is evidence of status exchange on education in BBK in which both Central Java-born husbands and wives who are in inter-marriages, are more likely to 229
252 Chapter 7Chapter 7 marry down than to marry equally on education. Meanwhile, the evidence of status exchange is partial in JMR where, the theory applies only for Central Java-born husbands who are in inter-marriages but not for Central Java-born wives who are in inter-marriages. This is possibly related to the structure of the marriage markets and the size of ethnic groups in JMR. 7.3 Theoretical implications The study has shown that Central Java plays a crucial role in migration patterns within Indonesia. This province has consistently been the main source of migrants over the decades. Over the censuses, the share of Central Java s out-migration is the greatest; on average, one out of five migrants is a Central Javanese migrant. In the early periods of analysis, transmigration from Central Java to destination provinces, in particular to Sumatra, was evident. In addition, Central Java s out-migration was among the top three in 19 receiving provinces and was at the top position in six provinces in Among the top six of Central Java s migrant recipient provinces, Jakarta received 215,984 of Central Java s migrants in On the other side of the spectrum, the number of migrants who come to Central Java is small. In 2010 itself, the volume of in-migrants was a quarter of the total number of migrants leaving the province and only around 64 thousand people who had previously liveded in Jakarta came to Central Java. The huge difference between Central Java s migrants who come to Jakarta and those who return to Central Java from Jakarta provides unbalanced flows of migrants. An important theoretical implication of this thesis is that the theory of push and pull factors of migration (Lee, 1966) is applicable in the context of internal migration in Indonesia, but not in Central Java migration patterns. In his theory, Lee argued that, for every flow of migration, there is always a counter-flow and the features of origin and destination, the presence of intervening obstacles and economic performance influence the flows. Relative to other big provinces that contribute significantly to the national economy, the economic performance of Central Java is left far behind. It is most likely that the volume of migration out of Central Java will continue in the future due to emerging diversity in the places of destination, such as the Batam enclaves, which in this study is in the BBK zone, and other promising new economic geographies in the outer islands, such as in Kalimantan. This is also influenced by increasing human capital and diminution of 230
253 Conclusions intervening obstacles through the work of migrant networks at the host place. Thus, it can be said that the number of migrants originating from Central Java will remain high in the future while the number of migrants coming to Central Java will remain low due to the limited factors attracting people to enter the province. The continuous increase in the number of Central Java s primary migrants, young individuals who are undertaking an initial move, indicatess how the stages of the life cycle influence migration decision making (White & Lindstrom, 2005). Young people encounter many important life decisions such as entering the labour market, continuing to higher levels of education or entering married life. Migration is viewed as an alternative for the young to facilitate their choices in the life cycle. In addition to that, the push factors from the place of origin play a crucial role in facilitating people, in particular the young, to migrate. Lee (1966) argued that in agricultural areas, children are mostly trained for urban pursuits. In this case, the young are exposed to information through formal education or families mentioning that urban areas offer a variety of opportunities. In some societies, culturally speaking, the young have to leave their homelands to pursue a better life at the places of destination (Murad, 1980). For young populations, in particular, Jakarta remains their leading destination. This is true in the sense that opportunities tend to be highly localised (Deichmann et al., 2008) and that migrants usually follow information and established routes from previous migrants (Hasmath, 2011; Hendrix, 1975). This also explains why the numbers of returnees are so low, and the labour agencies in recruiting migrants may be established at their place of origin (Lindquist, 2009). The stages of migration as proposed by Ravenstein (1885) seem to be diminished in the study in that the majority of primary migrants move directly to the centre of economic activities and the proportion of those who undertake corrective movement by returning to their place of origin is decreasing. The motivation for the majority of migrants to move to cities is to seek better employment in the non-agricultural sector. The theoretical implication of the thesis finding is that employment outcomes of migrants are subject to place and sex. Rationally, individuals migrate to cities for employment possibilities because cities offer more employment than their place of origin. The types of employment offered in cities are subject to the economic 231
254 Chapter 7Chapter 7 structure of each city. Thus, different cities offer different types of employment, which in turn can favour a particular sex. SMR, BBK and JMR are developed zones but are formed differently. Relative to SMR and BBK, JMR has long been known as an enclave economic zone and was naturally created. And, as the most developed place in the archipelago, its economic nature is dominated by the secondary and tertiary sectors. As a consequence, migrants are mostly involved in the manufacturing and services sectors. Central Java s primary migrants often have a strong migrant network in JMR and quite often follow the types of job held by previous migrants (Purnomo, 2009; Safitri & Wahyuni, 2013). Thus, in many cases, one can observe the origin of migrants from their type of employment. McDonald et al. (2013) and Manning and Pratomo (2013) support the idea that destinations offer different type of jobs and quite often favour a particular sex. Findings from this study show that Central Java s primary migrants who participate in short distance movements, that is, intra-provincial migration, (those who migrate to SMR) have a tendency to study or work. In contrast, the motive of the majority of Central Java s primary migrants who are found in JMR and BBK is employment. The theoretical implication of this result is that the intention to move among young migrants is related to the places of destination and the presence of networks at the places of destination. As distance increases migrants rely more on the role of networks at the places of destination. Migrants who are found in far distant destinations encounter greater uncertainty and less information than migrants who are found in short distant destinations. The presence of networks in destinations can be used as channels for word-of-mouth exchanges about job possibilities (Hasmath, 2011). In the context of Indonesia, the role of networks is extended to sharing accommodation and daily expenses in order to reduce living costs and increase savings (Haryono, 2007). The ultimate adaptation undertaken by migrants at the host place is inter-marrying with local people. Findings from the thesis reveal that patterns of exogamous marriage are subject to places and measurement approaches. The theoretical implication of this result is that geographical location, the size of ethnic groups, and the composition of marriage markets matter in influencing the likelihood of being in an exogamous marriage. The degree of a group s concentration in a specific region influences the propensity to marry out negatively. The fact that the Javanese in BBK are more concentrated than the Javanese 232
255 Conclusions in JMR is related to the history and cultural backgrounds of BBK and JMR. Unlike JMR which formed a mixed culture where Javanese is one of the ethnic groups, BBK on the other hand is the land of the Malay people. The cultural background between the Javanese and the Malay is relatively different. Thus, it makes sense that the geographical location of the Javanese in BBK is more concentrated than in JMR. In relation to the measurement approach, the study finds that the percentages of marital assimilation among Central Java husbands and wives are higher when measured by ethno-migration status rather than measured by ethnicity, in both JMR and BBK. This is presumably because many local-born people are ethnic Javanese. If that is the case, this study suggests that ethnicity is a better variable for measuring patterns of exogamous marriages than ethno-migration status. In terms of status exchange on education among Central Javanese people who inter-marry local people, the study uses Central Java-born intra-marriages and Javanese intra-marriages as the study categories. For both categories, there is evidence of status exchange on education between migrant groups and local people. When Javanese intra-marriages are used as the study group, both Javanese husbands and wives who inter-marry local people, in both BBK and JMR, are more likely to marry down than to marry equally on education. When Central Java-born intra-marriages are used as the study group, Central Java-born husbands and wives who are in inter-marriages in BBK are more likely to marry down than to marry equally on education whilst, in JMR, only Central Java-born husbands who are in inter-marriages are more likely to marry down than to marry equally on education; the same is not true for Central Java-born wives who are in inter-marriages. Thus, there is only partial evidence of status exchange on education in JMR. The theoretical implication from this research is that there is a tendency for status exchange on education among Central Javanese people who inter-marry locals in both destinations. Although it needs further research, one can say that Central Javanese husbands who are in inter-marriages have a stronger preference to marry down on education than Central Javanese wives who are in inter-marriages. This can be seen from the result that Central Java-born husbands who are in inter-marriages in BBK and JMR are more likely to marry down on education while it is only in BBK that Central Java-born wives who are in inter-marriages have a propensity to marry down on education. Comparing ethnicity and ethno-migration status in testing status exchange on education 233
256 Chapter 7Chapter 7 among migrant groups and local people, the ethnicity of married couples seems to be the better alternative to test status exchange on education. Ethnicity is very likely to be a stronger marker for group identity than ethno-migration status. 7.4 Implications for policy debates Migration out of Central Java has been part of migration history that has shaped Indonesia s demography over the centuries. Population resettlement policy, the transmigration program, played a major role in redistributing Central Java s population across the nation. Since the 2000s, the impact of the transmigration program has been more muted than it was during the previous era, but, the volume of outward migration of people from Central Java remained high. This was due to the effect of spontaneous migrants, that is, migrants who move voluntarily, and the presence of strong migrant networks at the places of destination that facilitate migration processes. In the 2000s, the majority of Central Javanese migrate to more developed provinces such as Jakarta Metropolitan Region and Riau Islands. The direction of spontaneous migrants follows economic opportunities, which is the opposite direction to the transmigration program that was aimed to allocate people to less-developed provinces in the outer islands. Importantly, of those who migrate to urban areas, the majority are primary migrants, that is, the group of young people with no previous migration experience in their lifetime. As a consequence, the population composition in the developed provinces is becoming condensed, dominated by young working age populations. On the other hand, the population of Central Java is continuously losing the most productive members of populations and ageing rapidly. Based on the thesis findings, there are several key points that should be considered by the Government of Indonesia. Firstly, regarding the population resettlement policy, that is, the transmigration program, the Jokowi administration has put the policy back onto the agenda after being long abandoned. The thesis does not have the capacity to judge whether to support the program or not, but the thesis findings have shown that, in the past, the transmigration program helped in establishing migration pathways. Also, past studies have shown that there was little evidence that transmigrants fuelled conflicts with local people in transmigration sites (Barter & Cote, 2015). There are, however, aspects of the program that the current government should take into consideration. There needs to be a clear procedure for recruiting migrants and selecting sites, achievable targets for the numbers of 234
257 Conclusions migrants, continuous and close monitoring, and frequent evaluation. With compulsory secondary education, it must also be remembered that future young migrants will be educated and less inclined to work in agriculture. The continuous outflow of migrants from Central Java going to other provinces, in particular, to Jakarta, is mostly due to development imbalances across provinces. Past experience has shown that policies that attempt to stop people moving to cities or to sweep people who were non-residents out of Jakarta were unsuccessful. An alternative way to reduce development gaps across provinces would be to accelerate economic growth across provinces, in particular, in economically unattractive provinces. One way to do this is by creating new economic geographies in provinces outside Java through forming specific economic zones based on local natural resources and competitiveness. This idea has been well covered in the Masterplan for Acceleration and Expansion of Indonesia s Economic Development (Masterplan Percepatan dan Perluasan Pembangunan Ekonomi Indonesia MP3EI). The main objective of this economic roadmap is to support the acceleration and expansion of economic development in Indonesia. One important strategy of MP3EI is the establishment and development of six economic corridors in each of the major islands based on the potential and natural resources inherent to each corridor. In ideal conditions, if the government of Indonesia is consistent in implementing the program, though there is no guarantee that inter-provincial migration flows can be reduced, this can at least interest migrants in considering alternative destinations. This could change overall patterns of interprovincial migration. Nevertheless, the economic zone created around the city of Semarang, SMR, has been relatively unsuccessful to this point in attracting investment and, hence, movement from within the province of Central Java. It is evident therefore that the Government of Central Java and the district governments in Central Java need to be more effective in creating employment opportunities for the young in all local economic zones that have been created in Central Java. Given that migration of Central Java s young population will continue into the future, governments in Central Java should upgrade the levels of education and skills of the young potential migrants. This can be done through specific training conducted by legitimate institutions under the Central Java government. It is also preferable that the migration 235
258 Chapter 7Chapter 7 process is facilitated by the local government or through labour agencies as has been done in the case of movement to BBK. 7.5 Suggestions for future research While the history of inter-provincial migration in Indonesia has provided evidence that Central Java has played a significant role as the leading source of migrants over the decades, there are few studies that focus specifically on the origin-destination-specific patterns of migration and how Central Java s migration situates in the overall picture and on how migrants out of Central Java adjust to the employment and people at the place of destination. A number of specific findings of the thesis can be explored and enhanced with future research. The discussion in Chapter 4 can be enriched by extending the geographical scope of the analysis to othe provinces. Patterns of primary, onward and return migrants for each of in- and out-migration for each province across five censuses could indicate provinces with low numbers of primary migrants and high numbers of return migrants, for example. Further analysis can be done by applying statistical tools in examining differences among primary, onward and return migrants. This study can also be approached from a qualitative perspective, for example: What are the issues faced by return migrants at the place of origin? What are the issues faced by onward migrants at the place of destination? Findings from Chapter 5 reveal that the employment outcomes of Central Java s primary migrants are subject to places of destination and sex. Future qualitative research could explore how primary migrants deal with daily activities and how they build connections at the place of destination. Deeper consideration of issues regarding how migrants with no previous migration seek employment at the place of destination and how their employment outcomes differ from those who have undertaken an initial move is warranted. In this regard, studies comparing destination preferences of primary migrants and onward migrants and differences in socio-economic characteristics among primary migrants and onward migrants who originate from different provinces would be most useful. Findings from Chapter 6 show that Central Javanese people have a tendency to marry out and those who marry out are more likely to have better-educated spouses. Further 236
259 Conclusions exploration in relation to marital assimilation and status exchange on education issues highlighted by this thesis would benefit from qualitative research on how migrants accept differences in cultural background. Also, this issue can be explored more deeply by applying the same techniques across other ethnic groups. In the light of the findings of the thesis, though it is likely that Central Javanese people are willing to inter-marry, the majority of migrant-ethic groups/ethnicity seem to prefer to marry within their own groups. For future research this study can be enriched by investigating: What are individuals reasons and situations for marital assimilation and acculturation in big cities? Do other ethnic groups produce the same preferences and expectations of marital assimilation at the same place of destination or in different places of destination? Are there gender-related differences in the trend and mechanism of the deviations between migration expectation and outcomes? For Indonesia, a nation consisting of thousands of islands, numerous ethnicities, and diverse religions, continuing this study in future research would provide comprehensive knowledge regarding patterns and sequences of migration and information about how migrants succeed, survive and live peacefully with local people at the places of destination. This could enhance better understanding in migration studies in Indonesia and be used as input to the formulation of policies regarding migration. 237
260
261 References Adhiati, M., & Bobsien, A. (2001). Indonesia's transmigration programme-an update. A report prepared for Down to Earth. Retrieved from /Transmigration20update pdf Aditiasari, D. (2015, April 27). Jokowi anggarkan Rp 1.4T untuk transmigrasi, 1 orang dapat Rp 3,5 juta/bulan, Detikfinance. Retrieved from Agresti, A. (1990). Categorical data analysis. New York: John Willey. Alam, N., & Barkat, K. (2011). Out-migration from Matlab-a rural area of Bangladesh. Asian Population Studies, 7(1), Allison, P. D. (1999). Comparing logit and probit coefficients across groups. Sociological Methods & Research, 28(2), Alonso-Villar, O., & Río, C. (2013). Occupational segregation in a country of recent mass immigration: evidence from Spain. The Annals of Regional Science, 50(1), Ammarell, G. (2002). Bugis migration and modes of adaptation to local situations. Ethnology, 41(1), Ananta, A., Arifin, E. N., Hasbullah, M. S., Handayani, N. B., & Pramono, A. (2014). A new classification of Indonesia's ethnic groups (based on the 2010 population census). (Working paper no. 1). Singapore: ISEAS. Anderson, J. E. (1979). A theoretical foundation for the gravity equation. The American Economic Review, 69(1), Arndt, H. W. (1983). Transmigration: Achievements, Problems, Prospects. Bulletin of Indonesian Economic Studies, 19(3), Aydemir, A., & Robinson, C. (2008). Global labour markets, return, and onward migration. The Canadian Journal of Economics/Revue canadienne d'economique, 41(4), Bailey, A. J. (1993). Migration history, migration behavior and selectivity. The Annals of Regional Science, 27(4), Barbieri, A. F., & Carr, D. L. (2005). Gender-specific out-migration, deforestation and urbanization in the Ecuadorian Amazon. Global and Planetary Change, 47(2 4), , Carr, D. L., & Bilsborrow, R. E. (2009). Migration within the frontier: The second generation colonization in the Ecuadorian Amazon. Population Research and Policy Review, 28(3), Bardhan, P. K., & Mookherjee, D. (2006). Decentralization and local governance in developing countries: a comparative perspective (Vol. 1). Cambridge, United States: The MIT Press. Barter, S. J., & Cote, I. (2015). Strife of the soil? Unsettling transmigrant conflicts in Indonesia. Journal of Southeast Asian Studies, 46(1),
262 Chapter 7 Batson, C. D., Qian, Z., & Lichter, D. T. (2006). Interracial and intraracial patterns of mate selection among America s diverse Black populations. Journal of Marriage and Family, 68(3), Batubara, H. (2015, February 9). Blusukan ke kampung kumuh, Menteri Marwan tawarkan transmigrasi, Detiknews. Retrieved from Becker, G. S. (1973). A theory of marriage: Part I. Journal of Political Economy, 81(4), Belanger, A., & Rogers, A. (1992). The internal migration and spatial redistribution of the foreign-born population in the United States: and International Migration Review, 26(4), Beshers, J. M., & Nishiura, E. N. (1961). A theory of internal migration differentials. Social Forces, 39(3), Bilsborrow, R. E., McDevitt, T. M., Kossoudji, S., & Fuller, R. (1987). The impact of origin community characteristics on rural-urban out-migration in a developing country. Demography, 24(2), Bird, R. M., & Vaillancourt, F. (2008). Fiscal decentralization in developing countries. New York: Cambridge University Press. BPS. (2011). Kewarganegaraan, suku bangsa, agama, dan bahasa sehari-hari penduduk Indonesia. Jakarta: Badan Pusat Statistik.. (2012). Trends of selected socio-economics indicators of Indonesia. Jakarta: Badan Pusat Statistik.. (2013). Statistical yearbook of Indonesia. Jakarta: Badan Pusat Statistik.. (2014). Statististical yearbook of Indonesia. Jakarta: Badan Pusat Statistik. Brown, K. S., & Bean, D. F. (2005). International migration. In L. D. Poston & M. Micklin (Eds.), Handbook of population (pp ). New York: Kluwer Academic/Plenum Publisher. Burdette, A. M., Haynes, S. H., & Ellison, C. G. (2012). Religion, race/ethnicity, and perceived barriers to marriage among working-age adults. Sociology of Religion, 73(4), Carnegie, M. (2013). Inter-marriage and reciprocal household exchange practices in a mixed community in Roti, Indonesia. The Australian Journal of Anthropology, 24(1), Celikaksoy, A., Nielsen, H. S., & Verner, M. (2006). Marriage migration: just another case of positive assortative matching?. Review of Economics of the Household, 4(3), Chiswick, B. R., & Miller, P. W. (2009). Earnings and Occupational Attainment among Immigrants. Industrial Relations: A Journal of Economy and Society, 48(3), , & Houseworth, C. (2011). Ethnic inter-marriage among immigrants: Human capital and assortative mating. Review of Economics of the Household, 9(2), Christensen, R. (1997). Log linear models and logistic regression. New York: Springer. 240
263 References Christina, A. D. (2006). Why do people migrate? An empirical analysis of the Argentinean case. Paper prepared for the 41 Annual meeting of the AAEP, November, Connolly, J. (2009). Forbidden intimacies: Christian Muslim inter-marriage in East Kalimantan, Indonesia. American Ethnologist, 36(3), Cybriwsky, R., & Ford, L. R. (2001). City profile Jakarta. Cities, 18(3), DaVanzo, J. S., & Morrison, P. A. (1981). Return and other sequences of migration in the United States. Demography, 18(1), Davis, B., & Winters, P. (2001). Gender, networks and Mexico-US migration. The Journal of Development Studies, 38(2), Davis, K. (1941). Inter-marriage in caste societies. American Anthropologist, 43, De-Brauw, A., & Giles, J. (2008). Migrant opportunity and the educational attainment of youth in rural China. (World Bank Policy Research Working Paper Series No. 4526). Retrieved from: Deichmann, U., Lall, S. V., Redding, S. J., & Venables, A. J. (2008). Industrial location in developing countries. The World Bank Research Observer, 23(2), Détang-Dessendre, C., Goffette-Nagot, F., & Piguet, V. (2008). Life cycle and migration to urban and rural areas: Estimation of a mixed logit model on French data. Journal of Regional Science, 48(4), , C., Piguet, V., Bertrand, S., & Rabenoro, M. (2002). Life cycle variability in the microeconomic determinants of urban-rural migration. Population (English Edition, 2002), 57(1), , C., Drapier, C., & Jayet, H. (2004). The Impact of migration on wages: Empirical evidence from French youth. Journal of Regional Science, 44(4), Dey, E. L., & Astin, A. W. (1993). Statistical alternatives for studying college student retention: A comparative analysis of logit, probit, and linear regression. Research in Higher Education, 34(5), Dwitjahyo, A. (2005). Model skedul migrasi keluar dan masuk propinsi Jawa Barat hasil Sensus Penduduk (Master Thesis, Bogor Agricultural University, West Java). Retrieved from Etzo, I. (2008). Internal migration: a review of the literature. (MPRA paper no. 8783). Working paper no of University of Cagliari). Retrieved from: /8783/1/MPRA_paper_8783.pdf Fan, C. C. (2005). Inter-provincial migration, population redistribution, and regional development in China: 1990 and 2000 census comparisons. The Professional Geographer, 57(2), Farmer, F. L., & Moon, Z. K. (2009). An empirical examination of characteristics of Mexican migrants to metropolitan and nonmetropolitan areas of the United States. Rural Sociology, 74(2),
264 Chapter 7 Febrianto, A., & Hardi, E. (2011). Orang Minangkabau dan Batak Mandailing di Nagari Buayan. Humanus, 10(1), 1-8. Firman, T. (1992). The spatial pattern of urban population growth in Java, Bulletin of Indonesian Economic Studies, 28(2), (1997). Land conversion and urban development in the northern region of West Java, Indonesia. Urban Studies, 34(7), (1999). Metropolitan expansion and the growth of female migration to Jakarta. Asia Pacific Viewpoint, 40(1), (2004). Demographic and spatial patterns of Indonesia's recent urbanisation. Population, Space and Place, 10(6), Fitt-Ajewole, R. L. (2008). Intermarriage, assimilation, and transnationalism: New directions. (Master Thesis). Retrieved from ProQuest Theses and Dissertations. Paper 81. Foulkes, M., & Newbold, K. B. (2000). Migration propensities, patterns, and the role of human capital: Comparing Mexican, Cuban, and Puerto Rican inter-state migration, The Professional Geographer, 52(1), Frank, A. (2004). Proses mobilitas dan strategi adaptasi orang Tanibar di Kota Jayapura, Propinsi Papua. Jurnal Humaniora, 16(2), Fraser, H., & Uche, C. (2010). Intra-regional migration and sustainable development: A study of four Carribean Countries. American Review of Political Economy, 8(2), Fu, V. K. (2001). Racial inter-marriage pairings. Demography, 38(2), Fuguitt, G. V., & Heaton, T. B. (1995). The impact of migration on the non-metropolitan population age structure, Population Research and Policy Review, 14(2), Furtado, D. (2012). Human capital and inter-ethnic marriage decisions. Economic Inquiry, 50(1), , & Theodoropoulos, N. (2011). Inter-ethnic marriage: a choice between ethnic and educational similarities. Journal of Population Economics, 24(4), Gmelch, G. (1980). Return migration. Annual Review of Anthropology, 9, Gordon, M. M. (1964). Assimilation in American life: The role of race, religion, and national origins. University of Massachusetts: Oxford University Press. Grant, E. K., & Vanderkamp, J. (1986). Repeat migration and disappointment. Canadian Journal of Regional Science, 9(3), Greenwood, M. J. (1997). Internal migration in developed countries. In R. R. Mark & S. Oded (Eds.), Handbook of Population and Family Economics (Vol. Volume 1, Part B, pp ). Amsterdam, Netherlands: Elsevier Science Publishers. Gullickson, A. (2006). Educational and black-white interracial marriage. Demography, 43(4),
265 References, & Torche, F. (2014). Patterns of racial and educational assortative mating in Brazil. Demography, 51, Gündüz Hoşgör, A., & Smits, J. (2002). Inter-marriage between Turks and Kurds in Contemporary Turkey: Inter ethnic Relations in an Urbanizing Environment. European Sociological Review, 18(4), Hadiz, V. R. (2004). Decentralization and democracy in Indonesia: A critique of neo institutionalist perspectives. Development and Change, 35(4), Hagen-Zanker, J. (2008). Why do people migrate? A review of the theoretical literature. A Review of the Theoretical Literature. (Working paper no. 2). The Netherlands: Maastricht Graduate School of Governance. Hamid, E. S. (1999). Perubahan pola recent migration antar propinsi di Indonesia: Analisis hasil SUPAS Logika, 3, (4), Hardjono, J. M. (1977). Transmigration in Indonesia. Kuala Lumpur, Malaysia: Oxford University Press.. (1986). Transmigration: Looking to the future. Bulletin of Indonesian Economic Studies, 22(2), Harris, J. R., & Todaro, M. P. (1970). Migration, unemployment and development: a twosector analysis. The American Economic Review, Haryono, T. J. S. (2007). Jaringan Sosial Migran Sirkuler: Analisis tentang Bentuk dan Fungsi. Media Masyarakat Kebudayaan dan Politik, 10(2), Hasmath, R. (2011). From job search to hiring and promotion: The labour market experiences of ethnic minorities in Beijing. International Labour Review, 150(1/2), He, J., & Pooler, J. (2002). The regional concentration of China's inter-provincial migration flows, Population and Environment, 24(2), Heckmann, F., & Bosswick, W. (2005). Integration and integration policies. (Working paper). Germany: European Forum for Migration Studies. Hendrix, L. (1975). Kinship and Economic-Rational Migration: a Comparison of Microand Micro-level Analyses. Sociological Quarterly, 16(4), Hill, H., Resosudarmo, B., & Vidyattama, Y. (2009). of Indonesia: location, connectivity, and resources. In Huang Y. & Bocchi, A.M. (Ed.), Reshaping economic geography in East Asia, (pp ). Washinton, DC: The World Bank.. (2008). Indonesia's changing economic geography. Bulletin of Indonesian Economic Studies, 44(3), Hoefte, R. (1998). In place of slavery: a social history of British Indian and Javanese laborers in Suriname: United States: University Press of Florida. 243
266 Chapter 7 Hou, F., & Myles, J. (2013). Inter-racial marriage and status-caste exchange in Canada and the United States. Ethnic and Racial Studies, 36(1), Hugo, G. (1980). Population movement in Indonesia during the colonial period: Indonesia - Australian Perspectives. Canberra: Australian National University. Hugo, G. (1997). Changing patterns and processes in population mobility. In G. W. Jones & T. H. Hull (Eds.), Indonesia Assessment: Population and Human Resources (pp ). Canberra and Singapore: ANU Canberra and ISEAS Singapore.. (2000). The Impact of the crisis on internal population movement in Indonesia. Bulletin of Indonesian Economic Studies, 36(2), (2001). Population mobility and HIV/AIDS in Indonesia UNDP, UNAIDS & ILO (Eds.), Indonesia Internal and International Population Mobility: Implications for the Spread of HIV/AIDS. Indonesia: UNAIDS.. (2007). Population geography. Progress in Human Geography, 31(1), , Hull, T. H., Hull, V. J., & Jones, G. W. (1987). The demographic dimension in Indonesian development. Singapore: Oxford University Press. ILO. (2004). Migration: opportunities and challenges for poverty reduction Indonesia: Working out of poverty. Jakarta: ILO. JICA., & RI. (2012). Jabodetabek urban transportation: Policy integration project in the Republic of Indonesia. Jakarta: JICA. Jones, H. R. (1990). Population geography. New York: Guilford Press. Kalmijn, M. (1998). Inter-marriage and homogamy: Causes, patterns, trends. Annual Review of Sociology, , & Van-Tubergen, F. (2006). Ethnic inter-marriage in the Netherlands: Confirmations and refutations of accepted insights. European Journal of Population/Revue européenne de Démographie, 22(4), , & Van-Tubergen, F. (2010). A comparative perspective on intermarriage: Explaining differences among national-origin groups in the United States. Demography (pre- 2011), 47(2), Kam, W. P., & Kee, K. N. (2009). Batam, Bintan and Karimun - Past histroy and current development towards being a SEZ. Singapore: Lee Kuan Yew School of Public Policy, National University of Singapore. Khotijah, S. (2008). Analisis faktor pendorong migrasi warga Klaten ke Jakarta. (Master Thesis, Diponegoro University, Semarang, Central Java). Retrieved from Kim, C., & Min, P. G. (2010). Marital patterns and use of mother tongue at home among native-born Asian Americans. Social Forces, 89(1), King, R., & Skeldon, R. (2010). Mind the gap! : Integrating approaches to internal and international migration. Journal of Ethnic and Migration Studies, 36(10),
267 References Kurniawan, F. R. (2012). Pernikahan pasangan beda etnis antara etnis Jawa dengan etnis Tionghoa. (Diploma thesis, Sebelas Maret University, Solo, Central Java). Retrieved from Lee, E. S. (1957). Methodological considerations and reference tables. In K. S. & S. D. Thomas (Eds.), Population redistribution and economic growth, United States (Vol. 1, pp ). Philadelphia: American Philosophical Society.. (1966). A theory of migration. Demography, 3(1), Lee, S. L. (2008). Racial and ethnic comparison of migration selectivity: Primary and repeat migration. (Doctoral dissertation, Utah State University, Utah, US). Retrieved from Levchenko, P., & Solheim, C. (2013). International marriages between Eastern Europeanborn women and US-born Men. Family Relations, 62(1), Lewis, W. A. (1954). Economic development with unlimited supplies of labour. Manchester School, 22(2), Lichter, D. T., Brown, J. B., Qian, Z., & Carmalt, J. H. (2007). Marital assimilation among Hispanics: Evidence of declining cultural and economic incorporation?. Social Science Quarterly, 88(3), Lindquist, J. A. (2002). The Anxieties of mobility: Development, migration, and tourism in the Indonesian borderlands. United States of America: University of Hawaii Press.. (2009). The anxieties of mobility: Migration and tourism in the Indonesian borderlands (D. Chandler & R. S. Kipp Eds.). Honolulu: University of Hawai'i Press. Lipscombe, L. (1972). Overpopulation in Java: Problems and reactions. Canberra, Australia: Australian National University. Lottum, J. V., & Marks, D. (2012). The determinants of internal migration in a developing country: Quantitative evidence for Indonesia, Applied Economics, 44(34), Lu, Y. (2010). Rural-urban migration and health: Evidence from longitudinal data in Indonesia. Social Science and Medicine, 70(3), Lyons, L. T., & Ford, M. (2007). Where internal and international migration intersect: Mobility and the formation of multi-ethnic communities in the Riau islands transist zone. International Journal on Multicultural Societies, 9(2), Manalu, E. F. (2012). Pernikahan sebagai identitas diri (Studi fenomenologi tentang pernikahan campur suku Batak dengan suku lainnya di Banjarmasin, Kalimantan Selatan). (Master thesis, Padjajaran University, Bandung, West Java). Retrieved from /uploads/2012/04/ pustaka_unpad_pernikahan_sebagai_identitas_diri.pdf Manning, C., & Pratomo, S. D. (2013). Do migrants get stuck in the informal sector? Findings from a household survey in four Indonesian cities. Bulletin of Indonesian Economic Studies, 49(2),
268 Chapter 7 Mantra, I. B. (1984). Lifetime migration in Indonesia based on 1971 and 1980 census data. The Indonesian journal of geography, 14(47), Marinelli, E. (2013). Sub-national graduate mobility and knowledge flows: An exploratory analysis of onward-and return-migrants in Italy. Regional studies, 47(10), Martono, P. A. (2008). Keterkaitan antar sektor ekonomi dan antar daerah di wilayah Kedungsepur. (Master thesis, Diponegoro University, Semarang, Central Java). Retrieved from: Masey, D. S., Arango, J., Hugo, G., Kouaoci, A., Pellegrino, A., & Taylor, J. E. (1993). Theories of international migration: A review and appraisal. Population and Development Review, 19(4), , & España, F. G. (1987). The social process of international migration. Science, 237(4816), McDonald, P., Utomo, I. D., Reimondos, A., Utomo, A., Hull, T. H., & Jones, G. W. (2010). Human capital outcomes of young migrants to Greater Jakarta. Paper presented at the International Seminar on Youth Migration and Transition to Adulthood in Developing Countries, Rio de Janeiro, Brazil, 8-10 December , Utomo, I. D., Utomo, A., Reimondos, A., & Hull, T. H. (2013). Migration and transition to adulthood: Education and employment outcomes among young migrants in Greater Jakarta. Asian Population Studies, 9(1), McKenzie, D. J. (2008). A profile of the world's young developing country international migrants. Population and Development Review, 34(1), McNicoll, G. (1968). Internal migration in Indonesia: Descriptive notes. Indonesia, 5, Merton, R.K. (1941). Intermarriage and the social structure: Fact and theory. Psychiatry, 4, Mincer, J. (1978). Family migration decisions. Journal of Political Economy, 86, Mohamad, A. (2014, February 6). Bappenas akui 30 tahun terakhir ekonomi luar Jawa tak meningkat, Merdeka. Retrieved from Morawska, E. (2001). Structuring migration: The case of Polish income-seeking travelers to the West. Theory and Society, 30(1), (2003). Disciplinary agendas and analytic strategies of research on immigrant transnationalism: Challenges of interdisciplinary knowledge. The International Migration Review, 37(3), Morrison, P. A., & Davanzo, J. (1986). The prism of migration: Dissimilarities between return and onward movers. Social Science Quarterly, 67(3), Moultrie, T., Dorrington, R., Hill, A., Hill, K., Timaeus, I., & Zaba, B. (2013). Tools for demographic estimation. Cape Town, South Africa: International Union for the Scientific Study of Population (IUSSP). Muhidin, S. (2002). The Population of Indonesia. Amsterdam: Rozenberg Publisher. 246
269 References. (2003). Migrated household in Indonesia: An exploration of the intercensal survey data In B. Yeoh, V. Prachuabmoh, W. Lutz, A. J. McMichael, E. N. Arifin, T. W. Devasahayam, S. Jatrana & M. Toyota (Eds.), Asians On the Move: Spouses, Dependants and Households (Vol. 8). Singapore: Asian MetaCentre for Population and Sustainable Development Analysis. Murad, A. (1980). Merantau: Outmigration in a matrilineal society of West Sumatra. Australia: The Australian National University. Nekby, L. (2006). The emigration of immigrants, return vs onward migration: evidence from Sweden. Journal of Population Economics, 19(2), Newbold, K. B. (1997a). Primary, return and onward migration in the U.S. and Canada: Is there a difference? Papers in Regional Science, 76(2), (1997b). Race and primary, return, and onward inter-state migration. The Professional Geographer, 49(1), (1998). Outmigration from California: The role of migrant selectivity. Geographical Analysis, 30(2), (2001). Counting migrants and migrations: Comparing lifetime and fixed-interval return and onward migration. Economic Geography, 77(1), (2005). Spatial scale, return and onward migration, and the Long-Boertlein index of repeat migration. Papers in Regional Science, 84(2), , & Bell, M. (2001). Return and onwards migration in Canada and Australia: Evidence from fixed interval data. International Migration Review, 35(4), , & Cicchino, S. (2007). Inter-regional return and onwards migration in Canada: Evidence based on a micro-regional analysis. Canadian Journal of Regional Science, 30(2), Newman, W. M. (1973). American Pluralism: A Study of Minority Groups and Social Theory. New York: Harper & Row Publishers, Inc. Nitisastro, W. (1970). Population trends in Indonesia. United States of America: Cornell University Press. Nivalainen, S. (2003). Where do migrants go?: An analysis of rural and urban destined/originated migration in Finland in (Working paper no. 66). Finland: Pellervo Economic Research Institute. Oey, M., & Astika, K. S. (1978). Social and economic implications of transmigration in Indonesia. Jakarta: Lembaga Penyelidikan Ekonomi dan Masyarakat, Fakultas Ekonomi, Universitas Indonesia.. (1982). Target-target transmigrasi dan realisasinya. In J. M. Hardjono (Ed.), Transmigrasi: dari kolonisasi sampai swakarsa. Jakarta: PT Gramedia. 247
270 Chapter 7 Pardede, E. L., & Nasution, P. (2013). Female vs male migrants in Batam city manufacture: better equality or still gender bias. Paper presented at the 27th IUSSP International Population Conference Busan, Korea, August Park, R. E., & Burgess, E. W. (1921). Introduction to the sicence of sociology. Chicago, Illinois: The University of Chicago Press. Peachey, K. J. (1998). Where there is sugar, there are ants: Planning for people in the development of Batam, Indonesia. (Master thesis, Canada, The University of British Columbia). Retrieved from Pelzer, K. J. (1945). Pioneer settlement in the Asiatic tropics. New York: International Secretariat Institute of Pacific Relations and American Geographical Society. Plane, D., & Mulligan, G. (1997). Measuring spatial focusing in a migration system. Demography, 34(2), Portes, A. (2008). Migration and social change: Some conceptual reflections. Paper presented at the Theorizing key migration debates, Oxford University, 1 July Priyanto, A. (1991). Migran pedagang kaki lima di Kota Bogor (Studi perbandingan pedagang Suku Jawa, Sunda dan Minang). (Master thesis, Bogor Agricultural University, Bogor, West Java). Retrieved from: Purnomo, D. (2004). Studi tentang pola migrasi migran sirkuler asal Wonogiri ke Jakarta. (Master thesis, Diponegoro University, Semarang, Central Java). Retrieved from (2009). Fenomena migrasi tenaga kerja dan perannya bagi pembangunan daerah asal: Studi empiris di Kabupaten Wonogiri. Jurnal Ekonomi Pembangunan: Kajian Masalah Ekonomi dan Pembangunan, 10(1), Purnomo, N. R. (2014, September 8). JK: Program transmigrasi lebih baik tanpa paksaan. Tak hanya rumah dan tanah gratis, Kontan. Retrieved from Qian, Z., & Lichter, D. T. (2001). Measuring marital assimilation: Inter-marriage among natives and immigrants. Social Science Research, 30(2), (2007). Social boundaries and marital assimilation: Interpreting trends in racial and ethnic inter-marriage. American Sociological Review, 72(1), Raffles, T. S. (1988). The history of Java. Malaysia: Oxford University Press. Raharto, A., & Noveria, M. (2005). Youth migration and change in Indonesia. In F. Gale & S. Fahey (Eds.), The Challenges of generational change in Asia: Proceedings of the 15 th Biennial General Conference Association of Asian Social Science Research Councils (pp ). Bangkok: Regional Unit for Social and Human Sciences in Asia and the Pacific, UNESCO. Ranis, G., & Fei, J. C. H. (1961). A Theory of Economic Development. The American Economic Review, 51(4),
271 References Ravenstein, E. G. (1885). The laws of migration. Journal of the Statistical Society of London, 48(2), Raymer, J., Abel, J. G., Disney, G., & Wisniowski, A. (2011). Improving estimates of migration flows to Eurostat. UK: ESRC Centre for Population Change.., Bonaguidi, A., & Valentini, A. (2006). Describing and projecting the age and spatial structures of interregional migration in Italy. Population, Space and Place, 12, , & Rogers, A. (2007). Using age and spatial flow structures in the indirect estimation of migration streams. Demography, 44(2), Rebhun, U., & Goldstein, S. (2009). Dynamics of internal migration determinant for American Jews, and Population Research and Policy Review, 29, Richard, M. A. (1992). Ethnic Groups and Marital Choices : Ethnic History and Marital Assimilation in Canada, 1871 and Vancouver, Canada: UBC Press. Rogers, A. (1990). Return migration to region of birth among retirement-age persons in the United States. Journal of Gerontology, 45(3), , & Belanger, A. (1990). The importance of place of birth in migration and population redistribution analysis. Environment and Planning, 22, , Jones, B., Partida, V., & Muhidin, S. (2007). Inferring migration flows from the migration propensities of infants: Mexico and Indonesia. The Annals of Regional Science, 41(2), , Muhidin, S., Jordan, L., & Lea, M. (2004). Indirect estimates of age-specific interregional migration flows in Indonesia based on the mobility propensities of infants. Paper presented at the 4 th Colorado Conference on the Estimation of Migration, Estes Park, Colorado, September , & Raymer, J. (1998). The spatial focus of US inter-state migration flows. International Journal of Population Geography, 4(1), , & Raymer, J. (2005). Origin dependence, secondary migration, and the indirect estimation of migration flows from population stocks. Journal of Population Research, 22(1), , & Sweeney, S. (1998). Measuring the spatial focus of migration patterns. The Professional Geographer, 50(2), Romdiati, H., & Noveria, M. (2006). Mobilitas penduduk antar daerah dalam rangka tertib pengendalian migrasi masuk ke DKI Jakarta. Jurnal Kependudukan Indonesia, 1(1), Rosenfeld, M. J. (2005). A critique of exchange theory in mate selection. American Journal of Sociology, 110(5),
272 Chapter 7 Safitri, Y. M., & Wahyuni, E. S. (2013). Jaringan sosial dan strategi adaptasi tenaga kerja migran asal Lampung di Desa Jayamukti, Kecamatan Cikarang Pusat, Kabupaten Bekasi, Provinsi Jawa Barat. Jurnal Sosiologi Pedesaan, 1 (1), Salzmann, T., Edmonston, B., & Raymer, J. (2010). Demographic aspects of migration (V. Metzger & T. Rollnik-Manke Eds. 1 ed.). Germany: Springer Fachmedien Wiesbaden GmbH. Sanders, S. R., & Brown, D. L. (2012). The Migratory response of labor to special economic zones in the Philippines, Population Research and Policy Review, 31, Sardjono, M. A., & Inoue, M. (2007). Indonesia Country Report 2004: Indonesian Local Community Forest Management Practices for Global Environmental Balance. Prepared for the Institute for Global Environmental Strategies, Kanagawa, Japan. Retrieved from /614/ attach/fc2_2006.pdf Seo, M. (2013). Falling in love and changing gods: Inter-religious marriage and religious conversion in Java, Indonesia. Indonesia and the Malay World, 41(119), Shaw, M. P., & Yeoh, C. (2000). Singapore's overseas industrial parks. Regional studies, 34(2), Sibel, C., & Gulay, H. (2011). Migration from rural to urban and the role of informal sector for alleviating the poverty: The case study of Turkey. Economics, Management, and Financial Markets, 6(1), Sirkeci, I. (2007). Human Insecurity and Streams of Conflict for a Re-conceptualization of International Migration. Population Review, 46(2), Sjaastad, L. A. (1962). The costs and returns of human migration. Journal of Political Economy, 70, Sjamsu, M. A. (1960). Dari Kolonisasi ke Transmigrasi Jakarta: Djambatan. Skeldon, R. (1990). Population mobility in developing countries: A reinterpretation. Belhaven Press, London..(1992). On mobility and fertility and transitions in East and Southeast Asia. Asian and Pacific Migration Journal, 1(2), (2012). Migration transitions revisited: their continued relevance for the development of migration theory. Population, Space and Place. 18 (2), Smits, J., & Park, H. (2009). Five decades of educational assortative mating in 10 East Asian Societies. Social Forces, 88(1), Spaan, E. (1994). Taikongs and calos: The role of middlemen and brokers in Javanese international migration. International Migration Review, 28(1), Stark, O., & Bloom, D. E. (1985). The new economics of labour migration. American Economic Review, 75,
273 References Sudibia, I. K. (2011). Kecenderungan pola dan dampak migrasi penduduk di Provinsi Bali periode Piramida, 7(2), Suharso, Speare, A. J., Redmana, H. R., & Husin, I. (1976). Rural-urban migration in Indonesia. Jakarta: National Institute of Economic and Social Research (LEKNAS-LIPI). Tan, Y. (2008). Resettlement in the three gorges project: an Asian perspective. Hongkong: Hongkong University Press. Thissen, F., Fortuijn, J. D., Strijker, D., & Haartsen, T. (2010). Migration intentions of rural youth in the Westhoek, Flanders, Belgium and the Veenkoloniën, The Netherlands. Journal of Rural Studies, 26(4), Tirtosudarmo, R. (2009). Mobility and human development in Indonesia. UNDP. Geneva. Titus, M. J. (1978). Interregional migration in Indonesia as a reflection of social and regional inequalities. Tijdschrift voor economische en sociale geografie, 69(4), Tobler, W. (1995). Migration: Ravenstein, Thornthwaite, and beyond. Urban geography, 16(4), Todaro, M. P. (1969). A Model of labor migration and urban unemploymnet in less developed countries. The American Economic Review, 59(1), UN. (1970). Manual VI: Methods of measuring internal migration. New York: United Nations.. (1981). Migration, urbanization and development in Indonesia. New York: United Nations.. (2011). Population distribution, urbanization, internal migration and development: an International perspective. New York: United Nations. UNDP. (2009). Overcoming barriers: Human mobility and development. New York: UN. Utomo, A. (2014). Marrying up? Trends in age and education gaps among married couples in Indonesia. Journal of Family Issues, 35(12), , & McDonald, P. (2014). Development, social change and assortative mating: ethnic marriage pairing in Indonesia. Paper presented at the Chaire Quetelet 2014: 40th edition, Fertility, childlessness and the family: A pluri-disciplinary approach, Louvan-la- Neuve, Belgium, 5-7 November , Reimondos, A., Utomo, I., McDonald, P., & Hull, T. H. (2014). What happens after you drop out? Transition to adulthood among early school-leavers in urban Indonesia. Demographic Research, 30(41), , Reimondos, A., Utomo, I. D., McDonald, P., & Hull, T. H. (2013). Female migrants and the transition to adulthood in greater Jakarta. The Annals of the American Academy of Political and Social Science, 648(1), Vidyattama, Y. (2014). Inter-provincial migration and regional growth in Indonesia. Papers in Regional Science. Advanced online publication. 251
274 Chapter 7 White, J. M., & Lindstrom, P. D. (2005). Internal migration. In L. D. Poston & M. Micklin (Eds.), Handbook of Population (pp ). New York: Kluwer Academic/Plenum Publisher. Wolfel, R. L. (2005). Migration in the new world order: Structuration theory and its contribution to explanations of migration. Geography Online, 5(2), Yeoh, C., S.M., L., & Jang.W.R. (2004). Integrating business opportunities in contiguous economies: Perspectives from Singapore's gambit in Indonesia. Paper presented at the Pan-Pacific Conference XXI (International Business and Global Project Management), Singapore, Yu, W., Pu, Y., Chen, G., & Wang, J. (2011). The spatial concentration patterns of interprovincial migration flows in China, Paper presented at the International Conference on GeoInformatics. Zelinsky, W. (1971). The Hypothesis of the Mobility Transition. Geographical review, 61(2), Zhao, Y. (2003). The Role of migrant networks in labor migration: The case of China. Contemporary Economic Policy, 21(4),
275 Appendices 253
276
277 253 Appendices Appendix 1 Figures of provincial CV values for out-migration,

278 254 Chapter 7 Appendix 2 Figures of provincial CV values for in-migration,

, Semarang (SMR)")
 JMR SMR BBK")
279 255 Appendices Appendix 3 Maps of Jakarta Metropolitan Region (JMR), Semarang Metropolitan Region (SMR) and Batam Bintan Karimun (BBK) JMR SMR BBK
280 Chapter 7 Appendix 4 Questionnaires of the 1971 Population census 258
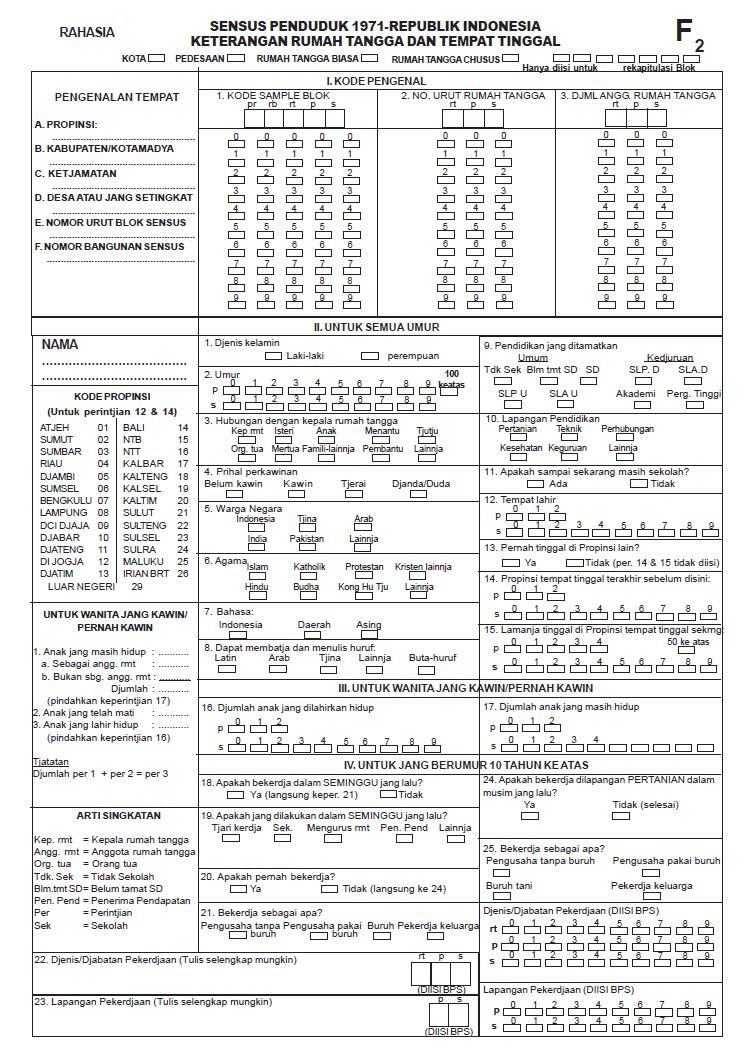
281 259 Appendices
282 Chapter 7 Appendix 5 Questionnaires of the 1980 Population census 260
283 261 Appendices
284 262 Chapter 7
285 263 Appendices
286 264 Chapter 7
287 265 Appendices

288 Chapter 7 Appendix 6 Questionnaires of the 1990 Population census 266
289 267 Appendices
290 268 Chapter 7

291 269 Appendices

292 270 Chapter 7
293 271 Appendices

294 Chapter 7 Appendix 7 Questionnaires of the 2000 Population census 272
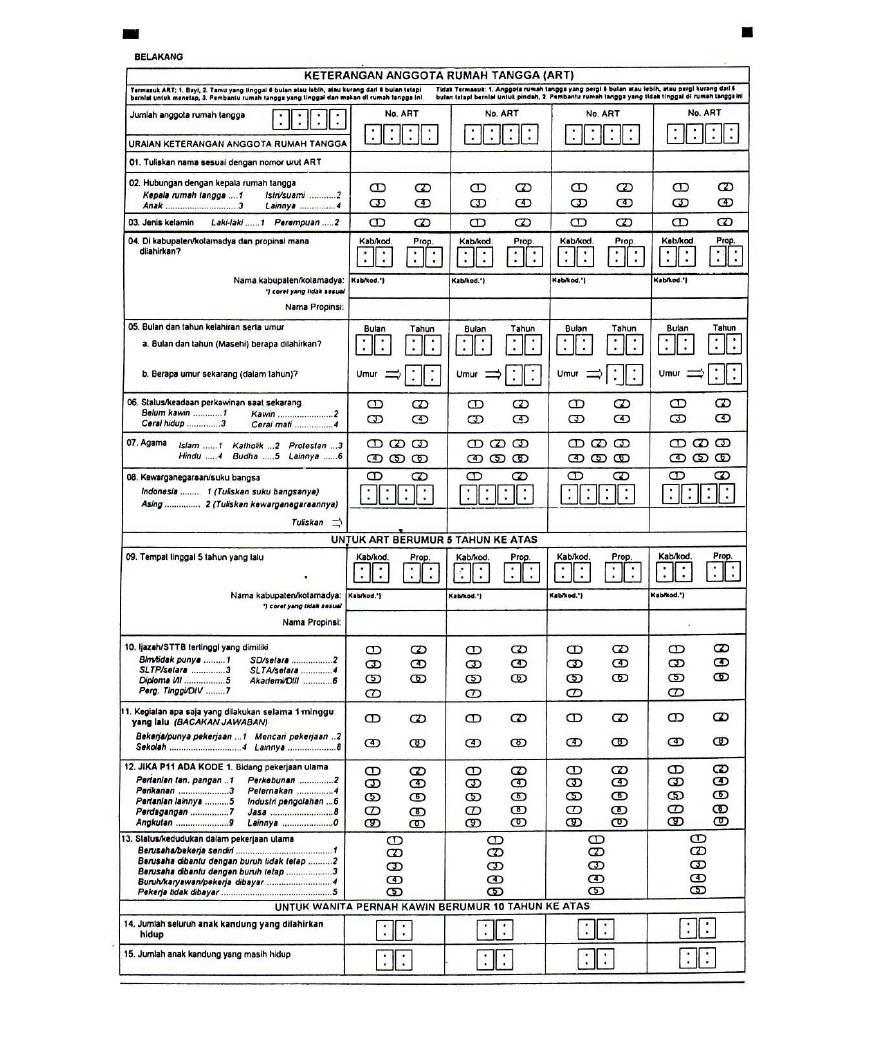
295 273 Appendices

296 Chapter 7 Appendix 8 Questionnaires of the 2010 Population census 274
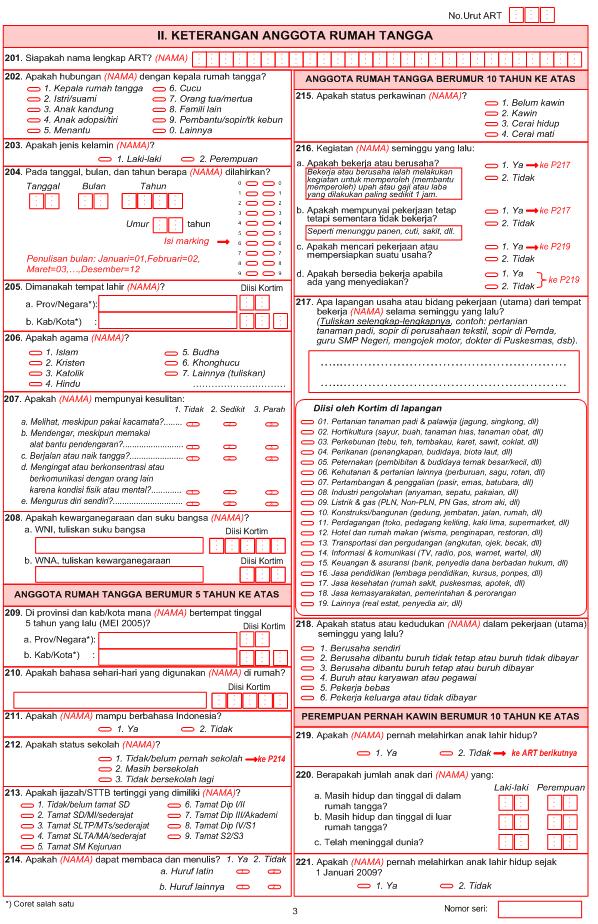
297 275 Appendices

298 276 Chapter 7
THE EMPLOYABILITY AND WELFARE OF FEMALE LABOR MIGRANTS IN INDONESIAN CITIES
 SHASTA PRATOMO D., Regional Science Inquiry, Vol. IX, (2), 2017, pp. 109-117 109 THE EMPLOYABILITY AND WELFARE OF FEMALE LABOR MIGRANTS IN INDONESIAN CITIES Devanto SHASTA PRATOMO Senior Lecturer, Brawijaya
(606) Migration in Developing Countries Internal migration in Indonesia: Mobility behaviour in the 1993 Indonesian Family Life Survey
 Migration in Developing Countries Internal migration in Indonesia: Mobility behaviour in the 1993 Indonesian Family Life Survey") Session Theme: Title: Organizer: Author: (606) Migration in Developing Countries Internal migration in Indonesia: Mobility behaviour in the 1993 Indonesian Family Life Survey Philip Guest Elda L. Pardede
Session Theme: Title: Organizer: Author: (606) Migration in Developing Countries Internal migration in Indonesia: Mobility behaviour in the 1993 Indonesian Family Life Survey Philip Guest Elda L. Pardede
Economic Indicator Evaluation Based on Shape Deformation Analysis of Indonesian Provinces Statistics
 Economic Indicator Evaluation Based on Shape Deformation Analysis of Indonesian Provinces Statistics Catur Apriono 1, Riri Fitri Sari 1, Yuriko Yano 2, and Yukari Shirota 2 ABSTRACT This paper presents
REGIONAL LABOUR MARKETS DURING DEREGULATION IN INDONESIA Have the Outer Islands Been Left Behind?
 REGIONAL LABOUR MARKETS DURING DEREGULATION IN INDONESIA Have the Outer Islands Been Left Behind? By Chris Manning Abstract Indonesian labour markets have undergone a major transformation over the past
Toward Rising Non-Permanent Population Mobility: A case of commuters in Indonesia 1
 Toward Rising Non-Permanent Population Mobility: A case of commuters in Indonesia 1 Evi Nurvidya Arifin (enarifin@gmail.com) Universitas Indonesia and Universitas Respati Indonesia Aris Ananta (arisananta@gmail.com)
Development in Southeast Asia's lagging Regions: Comparing Papua, Southern Thailand and Mindanao
 Development in Southeast Asia's lagging Regions: Comparing Papua, Southern Thailand and Mindanao Indonesia Project Arndt-Corden Department of Economics Crawford School of Public Policy ANU College of Asia
THESES SIS/LIBRARY TELEPHONE:
 THESES SIS/LIBRARY TELEPHONE: +61 2 6125 4631 R.G. MENZIES LIBRARY BUILDING NO:2 FACSIMILE: +61 2 6125 4063 THE AUSTRALIAN NATIONAL UNIVERSITY EMAIL: library.theses@anu.edu.au CANBERRA ACT 0200 AUSTRALIA
Regional Labor Markets during Deregulation
 Public Disclosure Authorized POLICY RESEARCH WORKING PAPER 1728 Public Disclosure Authorized Public Disclosure Authorized Regional Labor Markets during Deregulation Have the Outer Islands Been Left Behind
Emigrating Israeli Families Identification Using Official Israeli Databases
 Emigrating Israeli Families Identification Using Official Israeli Databases Mark Feldman Director of Labour Statistics Sector (ICBS) In the Presentation Overview of Israel Identifying emigrating families:
DOES POST-MIGRATION EDUCATION IMPROVE LABOUR MARKET PERFORMANCE?: Finding from Four Cities in Indonesia i
 DOES POST-MIGRATION EDUCATION IMPROVE LABOUR MARKET PERFORMANCE?: Finding from Four Cities in Indonesia i Devanto S. Pratomo Faculty of Economics and Business Brawijaya University Introduction The labour
Provincial Poverty Rates in Indonesia,
 Provincial Poverty Rates in Indonesia, 2006 2011 September 2013 This publication was produced by DAI/Nathan Group for review by the United States Agency for International Development (USAID). It is made
YOUTH EMPLOYMENT REPORT IN INDONESIA. an update
 YOUTH EMPLOYMENT REPORT IN INDONESIA an update 1 Copyright@International Labour Organization 2004 First published 2004 Publications of the International Labour Office enjoy copyright under Protocol 2 of
5. Destination Consumption
 5. Destination Consumption Enabling migrants propensity to consume Meiyan Wang and Cai Fang Introduction The 2014 Central Economic Working Conference emphasised that China s economy has a new normal, characterised
The determinants of internal migration in a developing country: quantitative evidence for Indonesia,
 The determinants of internal migration in a developing country: quantitative evidence for Indonesia, 1930-2000 J. van Lottum a * and D. Marks b a Cambridge Group for the History of Population and Social
Executive summary. Strong records of economic growth in the Asia-Pacific region have benefited many workers.
 Executive summary Strong records of economic growth in the Asia-Pacific region have benefited many workers. In many ways, these are exciting times for Asia and the Pacific as a region. Dynamic growth and
The Population of Malaysia. Second Edition
 The Population of Malaysia Second Edition The Institute of Southeast Asian Studies (ISEAS) was established as an autonomous organization in 1968. It is a regional centre dedicated to the study of socio-political,
People. Population size and growth
 The social report monitors outcomes for the New Zealand population. This section provides background information on who those people are, and provides a context for the indicators that follow. People Population
How Important Are Labor Markets to the Welfare of Indonesia's Poor?
 S /4 G 6 POLICY RESEARCH WORKING PAPER 1665 How Important Are Labor Markets to the Welfare of Indonesia's Poor? Andrew D. Mason Jacqueline Baptist Because poverty mainly afflicts agricultural and self-employed
18 th MIICEMA Seminar TOWARD ECONOMIC STABILITY AND SUSTAINABLITY
 Coordinating Ministry for Economic Affairs Republic of Indonesia 18 th MIICEMA Seminar TOWARD ECONOMIC STABILITY AND SUSTAINABLITY Edi P. Pambudi Assistant Deputy Minister Monetary & Balance of Payment
Trends in Poverty and Inequality in Decentralising Indonesia
 Trends in Poverty and Inequality in Decentralising Indonesia Riyana Miranti, Yogi Vidyattama, Erick Hansnata, Rebecca Cassells and Alan Duncan NATSEM, University of Canberra Presentation to the Working
Spatial Concentration of the Informal Small and Cottage Industry in Indonesia
 MPRA Munich Personal RePEc Archive Spatial Concentration of the Informal Small and Cottage Industry in Indonesia Brata Aloysius Gunadi Faculty of Economics, Atma Jaya Yogyakarta University 2007 Online
Transitions to residential independence among young second generation migrants in the UK: The role of ethnic identity
 Transitions to residential independence among young second generation migrants in the UK: The role of ethnic identity Ann Berrington, ESRC Centre for Population Change, University of Southampton Motivation
Socio-Economic Factors on Indonesia Education Disparity
 International Education Studies; Vol. 8, No. 12; 2015 ISSN 1913-9020 E-ISSN 1913-9039 Published by Canadian Center of Science and Education Socio-Economic Factors on Indonesia Education Disparity Yuni
Indonesia and The Implementation of ASEAN Economic Community
 Indonesia and The Implementation of ASEAN Economic Community International Business Management Esther Kezia Simanjuntak 3099190 ABSTRACT Asean Economic Community (AEC) 2015 is a free market realization
Faces of Economic Inequality in the Iraqi Kurdistan ( ): The Role of Regulation
: The Role of Regulation") Faces of Economic Inequality in the Iraqi Kurdistan (2004-2010): The Role of Regulation Submitted by Nyaz Najmudleen Noori to the University of Exeter as a thesis for the Degree of Doctor of Philosophy
Faces of Economic Inequality in the Iraqi Kurdistan (2004-2010): The Role of Regulation Submitted by Nyaz Najmudleen Noori to the University of Exeter as a thesis for the Degree of Doctor of Philosophy
University of Groningen. Inter-regional migration in Indonesia Wajdi, Nashrul; Mulder, Clara; Adioetomo, Sri Moertiningsih
 University of Groningen Inter-regional migration in Indonesia Wajdi, Nashrul; Mulder, Clara; Adioetomo, Sri Moertiningsih Published in: Journal of Population Research DOI: 10.1007/s12546-017-9191-6 IMPORTANT
The Evolving Composition of Poverty in Middle-Income Countries: The Case of Indonesia,
 WORKING PAPER The Evolving Composition of Poverty in Middle-Income Countries: The Case of Indonesia, 1991 2007 Andy Sumner The King s International Development Institute King s College, London WORKING
Rural-to-Urban Labor Migration: A Study of Upper Egyptian Laborers in Cairo
 University of Sussex at Brighton Centre for the Comparative Study of Culture, Development and the Environment (CDE) Rural-to-Urban Labor Migration: A Study of Upper Egyptian Laborers in Cairo by Ayman
INDONESIA INDONESIA ANNUAL PUBLIC OPINION SURVEYS 2007 REPORT
 INDONESIA INDONESIA ANNUAL PUBLIC OPINION SURVEYS 2007 REPORT FEBRUARY 2008 This publication was produced for review by the United States Agency for International Development by Democracy International,
DRIVERS OF DEMOGRAPHIC CHANGE AND HOW THEY AFFECT THE PROVISION OF EDUCATION
 DRIVERS OF DEMOGRAPHIC CHANGE AND HOW THEY AFFECT THE PROVISION OF EDUCATION This paper provides an overview of the different demographic drivers that determine population trends. It explains how the demographic
Human Development Research Paper 2009/19 Mobility and Human Development in Indonesia. Riwanto Tirtosudarmo
 Human Development Research Paper 2009/19 Mobility and Human Development in Indonesia Riwanto Tirtosudarmo United Nations Development Programme Human Development Reports Research Paper April 2009 Human
LAW OF THE REPUBLIC OF INDONESIA NUMBER 6 OF 2014 CONCERNING VILLAGE BY THE GRACE OF GOD ALMIGHTY THE PRESIDENT OF THE REPUBLIC OF INDONESIA
 COPY LAW OF THE REPUBLIC OF INDONESIA NUMBER 6 OF 2014 CONCERNING VILLAGE BY THE GRACE OF GOD ALMIGHTY THE PRESIDENT OF THE REPUBLIC OF INDONESIA, Considering : a. that Village has the rights of origin
Centre for Economic Policy Research
 The Australian National University Centre for Economic Policy Research DISCUSSION PAPER Rural Urban Migration in Indonesia: Survey Design and Implementation Budy P. Resosudarmo, Chikako Yamauchi, and Tadjuddin
Online Appendices for Moving to Opportunity
 Online Appendices for Moving to Opportunity Chapter 2 A. Labor mobility costs Table 1: Domestic labor mobility costs with standard errors: 10 sectors Lao PDR Indonesia Vietnam Philippines Agriculture,
Survey period October 8-24 th 2018
 Survey period October 8-24 th 2018 Jl. Cikini V No. 15A, Menteng Jakarta Pusat Telp: (021) 31927996/98, Fax: (021) 3143867 Website: www.lsi.or.id, Email: info@lsi.or.id Introduction The National Strategy
Gendered Migration Patterns, Processes and Outcomes: Results from a Household Survey in Ponorogo, Indonesia
 Gendered Migration Patterns, Processes and Outcomes: Results from a Household Survey in Ponorogo, Indonesia Khoo Choon Yen, Maria Platt, Brenda S.A. Yeoh, Silvia Mila Arlini, Grace Baey, Theodora Lam,
Indonesia. The Dynamics of Minimum Wage in Indonesia s Manpower System. I. Introduction. Ikomatussuniah
 Indonesia The Dynamics of Minimum Wage in Indonesia s Manpower System Ikomatussuniah I. Introduction II. Minimum wage and PP 78 III. Conclusion I. Introduction Wages 1 are one of the important components
People. Population size and growth. Components of population change
 The social report monitors outcomes for the New Zealand population. This section contains background information on the size and characteristics of the population to provide a context for the indicators
Characteristics of Poverty in Minnesota
 Characteristics of Poverty in Minnesota by Dennis A. Ahlburg P overty and rising inequality have often been seen as the necessary price of increased economic efficiency. In this view, a certain amount
Detailed Methodology
 METHODOLOGY Detailed Methodology!!" # $ % #& ' $&(&)*% +&!!! ' && & #, *-!!./& &!!. # # 0 1 $' ' & & & ' 2 # # ' 3#/' #&,4% (5 &' ' & ' 6 *' #' 7##2 *' # ' 7#&2 8&#&&!!9# &!!./0' : 4% +& ' ' # ' ' # '
The Relationship Between HouseRent, Income Inequality and Households Consumption
 The Relationship Between HouseRent, Income Inequality and Households Consumption International Journal of Applied Business and Economic Research ISSN : 0972-7302 available at http: www.serialsjournal.com
2.2 THE SOCIAL AND DEMOGRAPHIC COMPOSITION OF EMIGRANTS FROM HUNGARY
 1 Obviously, the Population Census does not provide information on those emigrants who have left the country on a permanent basis (i.e. they no longer have a registered address in Hungary). 60 2.2 THE
Report. This version available at: Originally available from LSE IDEAS. Available in LSE Research Online: May 2012
 Dionisius A. Narjoko and Teguh Y. Wicaksono ASEAN: perspectives on economic integration: achieving the ASEAN Economic Community agenda: an Indonesian perspective Report Original citation: Narjoko, Dionisius
The Impact of International Migration on the Labour Market Behaviour of Women left-behind: Evidence from Senegal Abstract Introduction
 The Impact of International Migration on the Labour Market Behaviour of Women left-behind: Evidence from Senegal Cora MEZGER Sorana TOMA Abstract This paper examines the impact of male international migration
SPATIAL CONCENTRATION OF THE INFORMAL SMALL AND COTTAGE INDUSTRY IN INDONESIA, *
 SPATIAL CONCENTRATION OF THE INFORMAL SMALL AND COTTAGE INDUSTRY IN INDONESIA, 1998-2004 * ALOYSIUS GUNADI BRATA (aloy.gb@gmail.com) Faculty of Economics, Atma Jaya Yogyakarta University [ Draft - July
Document Courier Pickup and Passback Domestic (within Indonesia only)
") Document Courier Pickup and Passback Domestic (within Indonesia only) The information provided in this document is especially for visa applicants who wish for PT VFS Services Indonesia (hereinafter referred
Document Courier Pickup and Passback Domestic (within Indonesia only) The information provided in this document is especially for visa applicants who wish for PT VFS Services Indonesia (hereinafter referred
EMPLOYMENT AND POPULATION ADJUSTMENT IN RURAL AUSTRALIA. Anne Margaret Garnett
 EMPLOYMENT AND POPULATION ADJUSTMENT IN RURAL AUSTRALIA Anne Margaret Garnett A thesis submitted for the degree of Doctor of Philosophy The University of Canberra Canberra April 2007 ABSTRACT Rural regions
University of Groningen. Interregional migration in Indonesia Wajdi, Nashrul
 University of Groningen Interregional migration in Indonesia Wajdi, Nashrul IMPORTANT NOTE: You are advised to consult the publisher's version (publisher's PDF) if you wish to cite from it. Please check
Subsequent Migration of Immigrants Within Australia,
 Population Research and Policy Review (2018) 37:1053 1077 https://doi.org/10.1007/s11113-018-9482-4 ORIGINAL RESEARCH Subsequent Migration of Immigrants Within Australia, 1981 2016 James Raymer 1 Bernard
Law No. 26 Year Establishing the Ad Hoc Human Rights Court
 Law No. 26 Year 2000 - Establishing the Ad Hoc Human Rights Court REPUBLIC OF INDONESIA ACT 26 OF 2000 CONCERNING HUMAN RIGHTS COURTS WITH THE MERCY OF GOD ALMIGHTY THE PRESIDENT OF THE REPUBLIC OF INDONESIA,
Emerging Patterns of Indonesia s International Migration. Aris Ananta* Institute of Southeast Asian Studies
 Malaysian Journal of Economic Emerging Studies Patterns 51 of (1): Indonesia s 29-41, 2014International Migration ISSN 1511-4554 Emerging Patterns of Indonesia s International Migration Aris Ananta* Institute
Poverty Profile. Executive Summary. Kingdom of Thailand
 Poverty Profile Executive Summary Kingdom of Thailand February 2001 Japan Bank for International Cooperation Chapter 1 Poverty in Thailand 1-1 Poverty Line The definition of poverty and methods for calculating
2009 International Forum on Legal Aid National (or Regional) Report
 Report") 2009 International Forum on Legal Aid National (or Regional) Report 1. Providers of Legal Aid (a) Who are the providers of legal aid services in your country? In practice, the civil society, especially
2009 International Forum on Legal Aid National (or Regional) Report 1. Providers of Legal Aid (a) Who are the providers of legal aid services in your country? In practice, the civil society, especially
Poverty Reduction and Economic Growth: The Asian Experience Peter Warr
 Poverty Reduction and Economic Growth: The Asian Experience Peter Warr Abstract. The Asian experience of poverty reduction has varied widely. Over recent decades the economies of East and Southeast Asia
Migrant Youth: A statistical profile of recently arrived young migrants. immigration.govt.nz
 Migrant Youth: A statistical profile of recently arrived young migrants. immigration.govt.nz ABOUT THIS REPORT Published September 2017 By Ministry of Business, Innovation and Employment 15 Stout Street
IDS WORKING PAPER Volume 2012 No 409
 IDS WORKING PAPER Volume 2012 No 409 The Evolving Composition of Poverty in Middle-Income Countries: The Case of Indonesia, 1991 2007 Andy Sumner November 2012 Poverty and Inequality Research Cluster The
CHAPTER 2 CHARACTERISTICS OF CYPRIOT MIGRANTS
 CHAPTER 2 CHARACTERISTICS OF CYPRIOT MIGRANTS Sex Composition Evidence indicating the sex composition of Cypriot migration to Britain is available from 1951. Figures for 1951-54 are for the issue of 'affidavits
Commuting and Minimum wages in Decentralized Era Case Study from Java Island. Raden M Purnagunawan
 Commuting and Minimum wages in Decentralized Era Case Study from Java Island Raden M Purnagunawan Outline 1. Introduction 2. Brief Literature review 3. Data Source and Construction 4. The aggregate commuting
opportunities and international students'
 Rebecca Tlatlik Place-related factors, employment opportunities and international students' migration Intention Evidence from Göttingen, Germany kassel university Table of Contents Abbr eviations Definitions
DOL The Labour Market and Settlement Outcomes of Migrant Partners in New Zealand
 DOL 12414 The Labour Market and Settlement Outcomes of Migrant Partners in New Zealand Ministry of Business, Innovation and Employment (MBIE) Hikina Whakatutuki Lifting to make successful MBIE develops
An Integrated Analysis of Migration and Remittances: Modeling Migration as a Mechanism for Selection 1
 An Integrated Analysis of Migration and Remittances: Modeling Migration as a Mechanism for Selection 1 Filiz Garip Harvard University February, 2009 1 This research was supported by grants from the National
Institute for Public Policy and Economic Analysis
 Institute for Public Policy and Economic Analysis The Institute for Public Policy and Economic Analysis at Eastern Washington University will convey university expertise and sponsor research in social,
FP083: Indonesia Geothermal Resource Risk Mitigation Project. Indonesia World Bank B.21/15
 FP083: Indonesia Geothermal Resource Risk Mitigation Project Indonesia World Bank B.21/15 10 January 2019 Gender documents for FP083 Indonesia: Geothermal Resource Risk Mitigation Project Gender Action
Labour Market Reform, Rural Migration and Income Inequality in China -- A Dynamic General Equilibrium Analysis
 Labour Market Reform, Rural Migration and Income Inequality in China -- A Dynamic General Equilibrium Analysis Yinhua Mai And Xiujian Peng Centre of Policy Studies Monash University Australia April 2011
THE EFFECTS OF PARENTAL MIGRATION ON CHILD EDUCATIONAL OUTCOMES IN INDONESIA
 THE EFFECTS OF PARENTAL MIGRATION ON CHILD EDUCATIONAL OUTCOMES IN INDONESIA A Thesis submitted to the Faculty of the Graduate School of Arts and Sciences of Georgetown University in partial fulfillment
Contents. Acknowledgements...xii Leading facts and indicators...xiv Acronyms and abbreviations...xvi Map: Pacific region, Marshall Islands...
 Contents Acknowledgements...xii Leading facts and indicators...xiv Acronyms and abbreviations...xvi Map: Pacific region, Marshall Islands... xii CHAPTER 1: CENSUS ORGANIZATION AND OPERATIONS...1 CHAPTER
ECONOMIC GROWTH AND EMPLOYMENT
 Graduate School of Development Studies ECONOMIC GROWTH AND EMPLOYMENT Analysis The Relationship between Economic Growth and Employment in Indonesia Period 1993-2003 A Research Paper presented by: LILI
KEY FINDINGS: IFES INDONESIA ELECTORAL SURVEY 2010
 KEY FINDINGS: IFES INDONESIA ELECTORAL SURVEY 2010 September 2010 Funded by the Australian Agency for International Development (AUSAID) In August 2010, IFES contracted Polling Center of Jakarta to conduct
NATIONAL PUBLIC OPINION SURVEY. Republic of Indonesia. August 2003
 . NATIONAL PUBLIC OPINION SURVEY 2003 Republic of Indonesia August 2003 Table of Contents INTRODUCTION 3 SUMMARY 4 Overall Situation 4 Satisfaction with Institutions and Leaders 5 Representative Bodies
Inequality and Child Well Being: The Case of Indonesia *
 Inequality and Child Well Being: The Case of Indonesia * Arianto A. Patunru ACDE, Australian National University Santi Kusumaningrum CCP, University of Indonesia February 2013 Abstract: We discuss the
Migration, Poverty & Place in the Context of the Return Migration to the US South
 Migration, Poverty & Place in the Context of the Return Migration to the US South Katherine Curtis Department of Rural Sociology Research assistance from Jack DeWaard and financial support from the UW
11. Demographic Transition in Rural China:
 11. Demographic Transition in Rural China: A field survey of five provinces Funing Zhong and Jing Xiang Introduction Rural urban migration and labour mobility are major drivers of China s recent economic
The business case for gender equality: Key findings from evidence for action paper
 The business case for gender equality: Key findings from evidence for action paper Paris 18th June 2010 This research finds critical evidence linking improving gender equality to many key factors for economic
FEMALE MIGRATION AND EMPLOYMENT (A CASE STUDY IN KECAMATAN PASAR REBO, JAKARTA)
") FEMALE MIGRATION AND EMPLOYMENT (A CASE STUDY IN KECAMATAN PASAR REBO, JAKARTA) by Aswatini Anaf A thesis submitted in partial fulfilment of the requirements for the degree of Master of Arts in Demography
FEMALE MIGRATION AND EMPLOYMENT (A CASE STUDY IN KECAMATAN PASAR REBO, JAKARTA) by Aswatini Anaf A thesis submitted in partial fulfilment of the requirements for the degree of Master of Arts in Demography
Fiscal Impacts of Immigration in 2013
 www.berl.co.nz Authors: Dr Ganesh Nana and Hugh Dixon All work is done, and services rendered at the request of, and for the purposes of the client only. Neither BERL nor any of its employees accepts any
Policy Brief on Migration and Urbanization
 The Republic of the Union of Myanmar 2014 Myanmar Population and Housing Census Policy Brief on Migration and Urbanization Department of Population Ministry of Labour, Immigration and Population With technical
Poverty Profile. Executive Summary. Republic of Indonesia
 Poverty Profile Executive Summary Republic of Indonesia February 2001 Japan Bank for International Cooperation Chapter 1 Poverty in Indonesia 1-1 Poverty Line The official government poverty figures are
Irregular Migration in Sub-Saharan Africa: Causes and Consequences of Young Adult Migration from Southern Ethiopia to South Africa.
 Extended Abstract Irregular Migration in Sub-Saharan Africa: Causes and Consequences of Young Adult Migration from Southern Ethiopia to South Africa. 1. Introduction Teshome D. Kanko 1, Charles H. Teller
Peruvians in the United States
 Peruvians in the United States 1980 2008 Center for Latin American, Caribbean & Latino Studies Graduate Center City University of New York 365 Fifth Avenue Room 5419 New York, New York 10016 212-817-8438
INEQUALITY IN THE DISTRIBUTION OF HOUSEHOLD EXPENDITURES IN INDONESIA: A THEIL DECOMPOSITION ANALYSIS
 The Developing Economies, XXXVII-2 (June 1999): 197 221 INEQUALITY IN THE DISTRIBUTION OF HOUSEHOLD EXPENDITURES IN INDONESIA: A THEIL DECOMPOSITION ANALYSIS TAKAHIRO AKITA RIZAL AFFANDI LUKMAN YUKINO
ECONOMIC AND SOCIAL IMPACTS OF THE MIGRATION OF SRI LANKAN TRANSNATIONAL DOMESTIC WORKERS ON FAMILIES AND CHILDREN LEFT BEHIND SWARNALATHA UKWATTA
 ECONOMIC AND SOCIAL IMPACTS OF THE MIGRATION OF SRI LANKAN TRANSNATIONAL DOMESTIC WORKERS ON FAMILIES AND CHILDREN LEFT BEHIND SWARNALATHA UKWATTA MA (Demography), PGD (Cartography), PGD (Population Studies),
USJI Seminar Washington, DC (19 February 2013) Toward a New Paradigm for Resettlement Policy. Mikiyasu Nakayama
 Toward a New Paradigm for Resettlement Policy. Mikiyasu Nakayama") USJI Seminar Washington, DC (19 February 2013) Beyond dland-for-land: L d Toward a New Paradigm for Resettlement Policy Mikiyasu Nakayama International Research Project Implications of resettlement associated
USJI Seminar Washington, DC (19 February 2013) Beyond dland-for-land: L d Toward a New Paradigm for Resettlement Policy Mikiyasu Nakayama International Research Project Implications of resettlement associated
Population and Dwelling Counts
 Release 1 Population and Dwelling Counts Population Counts Quick Facts In 2016, Conception Bay South had a population of 26,199, representing a percentage change of 5.4% from 2011. This compares to the
Mapping migrants: Australians wide-ranging experiences of immigration
 No. 13 December 2018 Mapping migrants: Australians wide-ranging experiences of immigration Charles Jacobs Mapping migrants: Australians wide-ranging experiences of immigration Charles Jacobs POLICY Paper
Combating Corruption in a Decentralized Indonesia EXECUTIVE SUMMARY
 EXECUTIVE SUMMARY Decentralization and corruption in Indonesia. A year after regional autonomy entered into force in 2001, a wave of corruption cases swept across Indonesia s newly empowered regional parliaments.
The data for this report is drawn from the time period 1 January January 2016 (13 months).
.") January 2015 - January 2016 1 Overview This report captures an overview of interest from prospective international students looking at Malaysia. The data in this report is informed by the Hotcourses Insights
January 2015 - January 2016 1 Overview This report captures an overview of interest from prospective international students looking at Malaysia. The data in this report is informed by the Hotcourses Insights
The Jordanian Labour Market: Multiple segmentations of labour by nationality, gender, education and occupational classes
 The Jordanian Labour Market: Multiple segmentations of labour by nationality, gender, education and occupational classes Regional Office for Arab States Migration and Governance Network (MAGNET) 1 The
Analyzing Bank Negara Malaysia's Behaviour in Formulating Monetary Policy: An Empirical Approach
 A thesis submitted for the degree of Doctor of Philosophy of The Australian National University December 2008 Analyzing Bank Negara Malaysia's Behaviour in Formulating Monetary Policy: An Empirical Approach
Rethinking Migration Decision Making in Contemporary Migration Theories
 146,4%5+ RETHINKING MIGRATION DECISION MAKING IN CONTEMPORARY MIGRATION THEORIES Rethinking Migration Decision Making in Contemporary Migration Theories Ai-hsuan Sandra ~ a ' Abstract This paper critically
Internal Migration to the Gauteng Province
 Internal Migration to the Gauteng Province DPRU Policy Brief Series Development Policy Research Unit University of Cape Town Upper Campus February 2005 ISBN 1-920055-06-1 Copyright University of Cape Town
Human development in China. Dr Zhao Baige
 Human development in China Dr Zhao Baige 19 Environment Twenty years ago I began my academic life as a researcher in Cambridge, and it is as an academic that I shall describe the progress China has made
Exemplar for Internal Achievement Standard. Geography Level 2
 Exemplar for Internal Achievement Standard Geography Level 2 This exemplar supports assessment against: Achievement Standard 91246 Explain aspects of a geographic topic at a global scale An annotated exemplar
INFOSTAT INSTITUTE OF INFORMATICS AND STATISTICS Demographic Research Centre. Population in Slovakia 2004
 INFOSTAT INSTITUTE OF INFORMATICS AND STATISTICS Demographic Research Centre Population in Slovakia 24 Bratislava, December 25 2 Population of Slovakia 24 Analytical publication, which assesses the population
Dominicans in New York City
 Center for Latin American, Caribbean & Latino Studies Graduate Center City University of New York 365 Fifth Avenue Room 5419 New York, New York 10016 212-817-8438 clacls@gc.cuny.edu http://web.gc.cuny.edu/lastudies
Sustainable cities, human mobility and international migration
 Sustainable cities, human mobility and international migration Report of the Secretary-General for the 51 st session of the Commission on Population and Development (E/CN.9/2018/2) Briefing for Member
The Economic and Social Outcomes of Children of Migrants in New Zealand
 The Economic and Social Outcomes of Children of Migrants in New Zealand Julie Woolf Statistics New Zealand Julie.Woolf@stats.govt.nz, phone (04 931 4781) Abstract This paper uses General Social Survey
CENSUS ANALYSIS. St. BRENDAN s PARISH, FLEMINGTON 2011 Census Details
 CENSUS ANALYSIS The Pastoral Research Office of the Australian Catholic Bishops Conference, auspiced by the Australian Catholic University in Fitzroy, has in January released the 2011 census data for each
How does development vary amongst regions? How can countries promote development? What are future challenges for development?
 Chapter 9- Development How does development vary amongst regions? How can countries promote development? What are future challenges for development? Human Development Index (HDI) Development process of
The Office of the United Nations Special Representative of the Secretary- General (SRSG) for International Migration
 for International Migration") RESPONSE DATE 21 September 2017 TO SUBJECT The Office of the United Nations Special Representative of the Secretary- General (SRSG) for International Migration INPUT TO THE UN SECRETARY-GENERAL S REPORT
RESPONSE DATE 21 September 2017 TO SUBJECT The Office of the United Nations Special Representative of the Secretary- General (SRSG) for International Migration INPUT TO THE UN SECRETARY-GENERAL S REPORT
RESULTS FROM WAVE XIV OF TRACKING SURVEYS. 1 July 2004
 RESULTS FROM WAVE XIV OF TRACKING SURVEYS 1 July 2004 Methodology Waves I, II, IX, and X surveys were conducted using face-to-face interviews with 1250 respondents (each wave), selected by multi-stage