Chronic Poverty and Remote Rural Areas in Eastern India
|
|
|
- May Foster
- 5 years ago
- Views:
Transcription
1 Chronic Poverty and Remote Rural Areas in Eastern India By Bijaya Kumar Malik and S. K. Mohanty International Institute for Population Sciences Govandi Station Road, Deonar Mumbai Paper to be presented Forthcoming 2006 Annual Meeting Program March 30- April 1 Westin, Bonaventure, Los Angeles, California Organized By Population Association of America (PAA) 1 1 Bijaya Kumar Mallik is Research Scholar and S.K.Mohanty is Lecturer at International Institute for Population Sciences, Mumbai, (India).
2 CHRONIC POVERTY AND REMOTE RURAL AREAS IN EASTERN INDIA Abstract: This paper attempts to understand the levels and differentials in poverty using non income data in eastern states of India, namely, Orissa and Bihar. The data of national family and health survey, is utilized. The measure of poverty is substantiated with the nutritional measure. In-addition to this, the poverty is examined with the remoteness, measured with respect to distance of the village from the nearest town and district head quarter. The finding revealed that along with distance of the village, the family size, ownership of land holding, caste, educational level are significant predictor of poverty in rural India as well as the eastern states of India. 1.1 Background: The concept of poverty in its multidimensional form include just not income and calories intake but also access to land and credit, nutrition, health and longevity, literacy and safe drinking water, sanitation and infrastructure facilities (Mehta and Saha, 2001). The three main perspective of poverty as defined in context of human development are Income Perspective, Basic Need Perspective, as well as Capability Perspective (Parr and Shiva, 2004). While income poverty is only one aspect of the deprivation of the right to essential development, assets and opportunities to education, water & sanitation, employment social and political participation are additional elements of the deprivation of capability and employment (Sen, 1998). There is some broad consensus on the definition of chronic poverty, as severe deprivation of basic human needs over an extended period of time. But there is no unanimity as to what constitutes the basic needs. Over a period of time, the `basic needs has expanded to encompass not only food, water, shelter and clothing, but access to other assets such as education, health, participation in political process, security and dignity. Those who are chronically poor are poor in several ways, not only in terms of income. Chronically poor households are those that suffer multi-dimensionality of their poverty, they are perpetually haunted by food scarcity; they have no resources to send their children to school or provide health. Chronic poverty in its multidimensional form related to income, consumption, health education, isolation, voice and security (Bird and Hume, 2003). Chronic poverty can 2
3 be studied at individual, household, socio-economic group or special region. Bird and Hume cited that individual, household and group located in more RRAs are more prone to chronic poverty. The RRAs are generally characterized by low levels of physical, social and human capital. These factors include geographical remoteness (physical distance from the urban center), geographical isolation (difficult to access because of topology), physical constraints (agricultural activities), interlocking sets of economic, social, and political factor shape pattern of poverty trap, market failure-under investment, state failure: infrastructure, enabling environment, basic services and social protection, public policy weakness and poor services in family planning, higher dependency ratio due to high fertility, mortality and out migrants and exposure to higher levels of risk and lower levels of social protection. Out-migration also plays an important role in aggravating the poverty. In addition to this, people living in remote rural areas have to cope with high levels of risk in the form of ill health or injury, natural disaster, harvest failure, terms of trade deterioration, reduced access to work or vulnerability to violence and conflict. Chronic poverty is closely associated with low paid, irregular and insecure work; work related ill health (injuries, lung disease). Similarly, the relationship of poverty and population growth is a long contested issue among Demographers and Economist. The general empirical observation that poorer countries tend to have higher population growth rates and that larger household tend to be poorer. It establishes a positive causal relation between poverty and fertility at the macro and micro levels. Thus, poverty is considered a key factor driving high fertility and therefore high rate of population growth, consequently delaying the demographic transition. The existing literature, mainly based on either cross sectional or aggregate data, shows that the relationship between poverty and population growth is not unidirectional. Neo Malthusian argued that high birth rate affects the savings and investment and hence lower the economic growth of the country. Their approach was taken in policy matters by supporting family planning as a means of poverty reduction to developing countries in 1960s and 1970s. The failure to recognize that the linkage between the poverty and high fertility in both directions was the major shortcomings of neo-malthusian (Merrick Thomas, 2002). 3
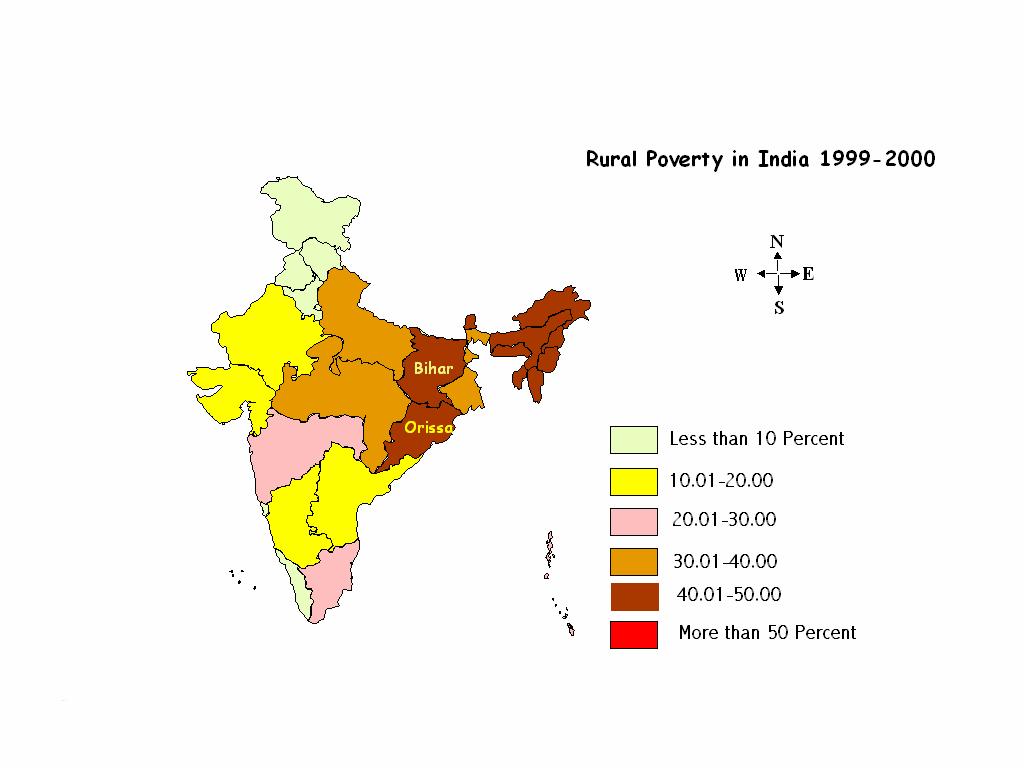
4 1.2. Need of the Study: In India, the estimates of poverty are derived by Planning commission, Govt. of India on the data collected by National Sample Survey based on calories intake. Based on these measures, the percentage of population living below poverty line has reduced from 54.9 percent in to 26.1 percent in based on 30 days recall period. However, these estimates are subject to criticism owing to recall lapse and other limitations. The Below Poverty Line Survey (BPL), used for many official purposes is a non-monetary and non-consumption measure to identify the poor. The BPL 2002 used a total of 13 variables in classifying the poor household. A score of 0, 1, 2, 3 and 4 was assigned to every household in respect of each of the indicator. These indicators focus on the deprivations in the capabilities space and have many limitations (Sundaram, 2003). Srinivasan and Mohanty (2004), utilizing the data of National Family Health Survey (a set of consumer durables and literacy status of the adult member) classified household as abject deprivation, moderate deprivation, just above deprivation and well above deprivation. Reddy (2004) in his article How to Identify Rural Poor? An Alternative Approach utilizing the data of National Sample Survey of 50 th round used 17 variables to classify poor household. The policy makers and administrator are looking for an alternative approach to identify the rural poor household in the country. The tenth five-year plan ( ) aimed at reduction poverty level to percentages for the country and the Millennium Declaration aimed at reducing the poverty by half by the year 2015 from its level in However, research studies had indicated that as economic growth accelerate for the country, the regional disparities widened in 1990s among the states of India. Even with the estimates of the Planning Commission, the pace of the poverty reduction is highly unequal across the states of India. The state of Orissa, Madhya Pradesh and Bihar remained at high level of poverty while the states of Tamil Nadu, Himachal, Punjab and Gujarat reduced the level of poverty substantially. Also the rapid growth of population particularly in the states of Bihar, Madhya Pradesh, Uttar Pradesh and Rajasthan is aggravating the situation. However the prevalence of rural poverty is highest in the eastern states of India as compared to other regions of India, 4
5 particularly in the state of Bihar and Orissa. Moreover, the pace of decline in poverty in these regions is the lowest. Even the levels and trends in poverty is not uniform within the states, districts as well as rural and urban areas. Although the poverty is declining in India, one third of the population, that is around 300 million people, still subsist below the Poverty line (Mehta 2005). Two thirds of those living in poverty in India are undernourished. On average 5% of rural households and 2% of urban households cannot access two square meals a day. However, in rural households in Orissa, the figure is 15%. Starvation-related deaths do occur despite the accumulation of 50 million tons of food grains in the government stores. The prevalence of chronic poverty in remote rural areas was also evident in a study from India, in which Surveyed in National Family Health Survey -2 in the year ( ) were surveyed twice, in 1993 and again in In eastern rural part of India, stunting is highest and most persistent in midland and mountainous areas the regions most poorly served by transportation. This survey allows comparison of monetary and nutritional indicators of poverty among adults, and other non-monetary indicators, such as school enrolments and height for age among children. Though a number of studies carried out on the levels, differentials as well as spatial distribution of poverty but there are a few studies, which focus on the chronic poverty and linking it to remote rural areas. The quantitative studies on chronic poverty uses repeated cross sectional survey in assessing dynamics, proxies for the persistent poverty, depth and multidimensionality and other methods of using household survey. One of the main difficulties in such exercise is the availability of integrated data on poverty and distance at different point of time. The study by Mehta and Kapoor outlined the chronic poverty among tribes in Orissa is due to degradation of forest who end up being agricultural laborers in an economy as well as low demand for laborers. 5
6 We have also hypothesized that that people living in remote rural areas (RRAs) account for the substantial proportion of the chronically poor. Further, the above hypothesis is verified using the cross sectional data of national and family health survey, 2 ( ). This study also attempts to understand Why do people stay poor? Here it is looking at how structural factors; vulnerability and shocks combine to entrench poverty. For example, if you look at a household of young children headed by a recently widowed low-caste woman in northern India there is a whole range of factors that make it hard to get out of poverty. These include social status, discrimination, illiteracy, absence of services and support. We will be focusing the analysis in the states of Bihar and Orissa, as prevalence of poverty is high in these two states. Some of the specific questions to be addressed by this study are: 1. Whether variation in physical remoteness operates as an important factor influencing poverty within a macro setting of a region/state? 2. Whether social identity (i.e. Tribal ness) is more important factor as compared to spatial characteristics such as availability of forest-produce and physical remoteness in explaining high incidence of poverty in the region? 3. What kind of policy support has reached the people in this remote region? Who have benefited more than the other? Whether physical remoteness influences differential performance of delivery mechanism for providing the nation s support? 1.3. Objectives: Accordingly, the broad objective of the paper is to understand the linkage of poverty and remoteness in India. However, the specific objectives are as follows: 1. To examine extent of poverty in the eastern region of India and on the country based on non-income criteria. 2. To examine the linkage of remote ness and level of deprivation in eastern India 3. To understand the correlates of deprivation in rural areas including the household and community factors 6
7 1.4. Data Source and Methodology: Most of the studies on chronic poverty are based on longitudinal data. But in this paper we have used the cross sectional data (Data of National Family and Health Survey 2) in quantifying the chronic poverty. We have used the terminology of deprived, poor as synonymous to chronic poverty. The data of national family health survey 2, conducted during is used for above purpose. The NFHS-2 was conducted under rigorous conditions of scientific sampling design, training of investigators and high quality data collection and edit procedures in the country. The NFHS-2 covered a sample of 92,486 households representing about 95 percent of country s population. They were primarily designed to provide reliable information on fertility, mortality, contraceptive use and related factors in the country at state level separately for the rural and urban areas. These were done primarily questioning the ever-married women in the reproductive ages 15 to 49. However the surveys also collected data from the sampled households on the various amenities in the house and the literacy levels of the family members. These data are used in the following analysis. From the data available in the household schedules of the survey we compiled data on the six variables for the rural areas in the country and eastern states of the country. For each household each variable is given a score of 1 or 0 indicating their presence or absence in the household. As an explanation of the utility of each of the variable, first we perceived that the presence of an adult literate member in a household makes a difference in determining the quality of life of the members in the household. If the household has an adult literate member a score of 1 is assigned and otherwise 0. Similarly, the presence of electricity, and presence of at least one of the amenities such as radio/transistor or bicycle or television is assigned a score of 1 each and otherwise zero. The type of house is again a reflection on the living standard of a family. We have assigned a score of 0 for Kuchha house and 1 for Pucca/Semi Pucca House in rural India; if the household has its own toilet facility a score of 1 is assigned and otherwise zero. We consider land as the prime determinant of economic well being in rural India. Accordingly, if the household has some 7
8 agricultural land a score of 1 is assigned and otherwise 0. The description of the variables is shown in Table 4. The total score for any household varies from 0 to 6. Here 0 means a household does not have any of the specified necessities. These households are categorized as Abject Deprivation-AD ; a household with a score of 1 and 2 is categorized as Moderate Deprivation-MD ; households with a score of 3 or 4 are categorized as Just above Deprivation -JAD ; and those with a score of 5 or 6 as Well above Deprivation- WAD. The deprived or poor or chronic poverty are those classified as Abject Deprivation and Moderate Deprivation (AD+MD). This classification of poor is borrowed from Srinivasan and Mohanty (2004). However, we have further substantiate the deprived with two more indirect measure, namely, weight for age for children under age 3 and Body mass Index of women. The data from the following files are merged and used a. Household file, mainly in identifying the poor based on non income criterion b. Kids file for substantiate the poverty measure with weight for age of child c. Women file, to examine the met and unmet need of family planning d. The village file to relate the distance of the village with the prevalence of poor and non poor The analysis includes bivariate analysis, statistical significance and logistic regression analysis is used to understand the determinant of poor household. Multidimensional of deprivation has been identified on key dimensions of living standard such as education, health, lack of access to facilities, poor quality of housing conditions. We have used the above-mentioned six variables and the weight for age of children below three years of age as well as the body mass index to substantiate the chronic poverty Discussion and Results: a. Background The demographic, social and socio-economic indicators of India and two of the eastern states of India, namely, Bihar and Orissa is given in table 1. The state of Bihar with a population of 83 million as of 2001 lags behind in the process of demographic transition as well as socio economic development. The state is one of the economically back ward state 8
9 with low state per capita income and higher percentage of population as agricultural laborers. The state of Orissa, though relatively better in demographic indicator as compared to Bihar, also economically less developed. The level of Infant mortality rate of Orissa is one of the highest though the total fertility rate is relatively lower. The percentage of population living below poverty line in the state is maximum in the country. A comparison of relative proportion of poor and state population (table 2) reveals that the state of Orissa with 3.57 percentage on national population accounts for 6.5 percent of national poor. Similarly, the state of Bihar with percent of national population accounts for percentage of national poor. This proportion is highest as compared to any other states of India. Even the most populous and economically less developed state like Uttar Pradesh with 17 percent of national population accounts for 20 percent of India s poor. It may also be noted that not only the level of poverty is high, but the pace of poverty reduction is slow in the state of Orissa. The state of Orissa has recorded 1.4 percent reduction in poverty as compared to 9.87 percent for the country during and However, the state of Bihar has recorded 12 percent decline in poverty ratio during this period. Fig 1: Relative Share of Population and Poor in Bihar, Orissa and maharashtra Percentage State share in national population % of national poor in the state 2 0 Bihar Orissa Maharashtra State 9
10 As mentioned before, the poverty level is not uniform within the regions or district of the same state as well as across social groups. In the state of Orissa, the prevalence of poverty is as high as 87 percent in southern region as compared to 32 percent in the coastal region (table 3 b). Further the prevalence of poverty is higher among scheduled tribe as compared to other social groups. b. Classification of Poor or deprived With this background we have analyzed the national family and survey data to quantify the poverty or deprivation in these states as well as the country. The analysis is carried out only for rural areas. Table 4 provides the methodology used in quantifying poor and non poor. The household with a composite score of 0 is labeled as abject deprivation while with a score of 1 or 2 moderate deprivations. For our analysis we conceive these two groups (Abject Deprivation as well as moderate deprivation) as poor or deprived or chronic poor while others are classified as non -poor. According to this classification, 4.3% of the households in rural India are in Abject Deprivation with none of the six characteristics described above, and 27.2 % of the households are in deprivation (AD+MD). In other words the poor constitute about 31.5 percent of national population while such percentage is 50 percent in Bihar and 45 percent in Orissa (table 5a and table 5b). This classification also close to the poverty estimates of planning commission, though not same. c. Validation of deprivation index: We have validated the deprivation score with the indirect measure of poverty, namely, the weight for age of children below age three years and body mass index of women. Among the anthrop-metric measures for children s nutritional status (weight for age, height for age and weight for height), the weight for age is the most significant variables in understanding the nutritional status of children. It is hypothesized that the poor household likely to have higher proportion of underweight children. Moreover, it may be reflection of chronic poverty. Some research studies used the variable, weight for age as proxy of chronic poverty. The cross classification of weight for age and body mass index of women with the deprivation index is given in table 6 (a) and table 6 (b). This validation is done for rural 10
11 India. It is found that the proportion of malnourished as well as severely malnourished varies inversely with the deprivation level. About 47 percent children belonging to households under abject deprivation are malnourished as compared to 39.8 percent children belonging to moderate deprivation level, 37 percent children belonging to just above deprivation level and 30 percent for those well above deprivation level in rural India. Similar pattern is also observed for severely malnourished. As compared to poor and non poor, about 41 percent children belonging to poor households are malnourished as compared to 35 percent for non-poor. The differences are statistically significance. Fig 2: Malnourished of children among Poor and Non- Poor in Rural India Percentage Poor Poor/Non Poor 34.9 Non Poor The similar analysis has been also carried out for body mass index of women. In general it is validated that, the children and women belonging to poor households are more likely to be underweight and have low body mass index respectively in rural India. 11
12 d. Distance and Poverty: One of the main objective of this paper is to understand the extent of poverty and differentials in poverty by the remoteness of rural areas. In NFHS 2, a community questionnaire was canvassed indicating the distance of the village from the nearest town and the distance of the village from the district head quarter. Both the variables are used along with the integrated data of household. The distance of the village from the nearest town is reclassifies as less than 10 kilometer, kilometer, kilometer and 30 kilometer and above. It is hypothesized that the extent of poverty is likely to be more in those villages father from the town. The poverty is measured with respect to poor and nonpoor. There is significant difference in the extent of poor by the distance of the village. About 28 percent households within the distance of less than 10 kilometer are poor as compared to 39 percent for those living 30 kilometer and above from the nearest town in the rural India (table 7 (a)). However, there is not much difference in the range of kilometer and kilometer. To further substantiate the analysis, the distance of the village is cross-classified by standard of living of the households. The standard of living index is a composite index comprising of set of consumer durables, type of house and land holding of the household. It is taken as proxy of economic status of the household. It may be seen that 42 percent households falls under low standard of living in the distance of less than 10 kilometer from the town while it is 53 kilometer in case of 30 kilometer and above. Similarly, only 6 percent households are classified as high standard of living index in the distance of 30 kilometer and above as compared to 12 percent for less than 10 kilometer for the country. Both the variable showed that the extent of poverty is relatively more in the remote villages as compared to those close to town. 12
13 Fig 3: Percentage of Poor households by disatnce of Village from nearest town in Rural India Percentage Poor Less than Distance in Killometer In addition to the distance of the town, the distance of the village from the nearest district headquarter is also categorized as less than 25 kilometer, kilometer, kilometer and 76 kilometer and above. We have conceptualized so as many of the facilities are located at district head quarter. Here also, the extent of poverty varies directly with the distance from the district head quarter. About 28 percent households in the distance of less than 25 kilometer are poor as compared to 31 percent in the distance of kilometer, 34 percent in the distance of kilometer and 36 percent in the distance of 76 kilometer and above. The pattern is similar with respect to standard of living index. About 41 percent households in the distance of 25 kilometer or less are poor as compared to 45 percent in the distance of kilometer, 47 percent in the distance of kilometer and 51 percent in the distance of 76 kilometer and more from the district head quarter. This is the general pattern for the rural areas of the country. 13
14 The similar distribution is also given for the state of Bihar and Orissa. In case of Bihar and Orissa, the similar pattern prevails with marginal variation. For example, about 47 percent households are poor in the range of less than 10 kilometer from the nearest town while it is 53 kilometer in the range of kilometer and 51 percent for 20 kilometer or above in the state of Bihar. The similar is the pattern with respect to the standard of living index of the households. However, the pattern is more clearer in case of distance from the district headquarter. It is found that about 45 percent households in the distance of less than 25 kilometer are poor as compared to 51 percent in the distance of kilometer, 59 percent in the distance of kilometer and 58 percent in the distance of 76 kilometer and above in the state of Bihar. The similar is the pattern with respect to standard of living index of the households. In case of Orissa, about 43 percent households are classified as poor in the distance of less than 10 kilometer as compared to 45 percent in the range of kilometer, 49.7 kilometer in the range of kilometer and 42 percent in the range of 30 kilometer and above. The similar pattern is also observed in case of standard of living index of the household. From the above analysis, it may be said that the remoteness is linked to chronic poverty in the country as well as the eastern states of India. e. Correlates of Rural poor: To understand the correlates that perpetuate poor in poor condition, a logistic regression equation is estimated. The dependent variable is dichotomous in nature, taking the value of 0 for being poor and 1 for being non-poor. The independent variables are a set of household and community variables including the distance of the village from the town and district head quarter as used in bivariate analysis. These are age of the household, household size, caste of the head of the household, ownership of land holding, size of the village population, educational level of the head of the household, distance of the village from the town and distance of the district headquarter from the village. The classification of these categories along with the reference categories is shown in table 8. Three set of regression equation for rural India, for the state of Orissa as well as for Bihar is given in the table. The age of the household is recategorised as less 14
15 than 30 years, years and above 50 years. The odds of being not poor are high with increase head of household. The odd ratio of being non-poor is 1.35 for the age of household years and 2.08 for age of the household 51 and above. The coefficient is also significant for the country. However, for the state of Orissa and Bihar, the coefficient is significant for the age group 51 years and above. The chance of not being poor varies directly with household size in rural India as well as for both the sates. The coefficients are significant indicating that larger family may relatively less prone in poverty trap as compared to smaller families. The caste of the head of the household is also found significant in the model. As compared to scheduled caste, the scheduled tribes are more disadvantageous while the others are better off. This is true for the country as well as for the states of India. In rural areas, land is one of the main source of livelihood. According the ownership of land holding is taken as one of the predictor in the model. It is found that the ownership of land holding is an important and significant predictor of not being poor for the country as well as for both the states of India. The odd ratio of not being poor is 5.41 for those own land and statistically significant. The same is true for both the states. The educational level of household is used as an independent variable in the model. It is found that the poverty is highly correlated with the educational level of the household. With increase in educational levels, the odds of not being poor are quite high for India as well as for the states. The variable is significant for the country as well as for the states. The distance of the village from the nearest town is recategorised as less than 20 kilometer and 20 kilometer and above. It is found that the distance is a significant variable in the model. The villages located in the 20 kilometer or above are more likely to have poor households as compared to villages in distance of 20 kilometer or less. The similar pattern is also found for the distance of the village from the district head quarter. 15
16 1.6. Concluding Remark: From the above analysis, it is found that the non-income measure can be suitable in identifying the poor household in rural areas. The levels of poverty remained higher in the state of Bihar and Orissa. It is also found that underweight of children is higher among poor households as compared to non-poor. The remoteness of the village is found to be associated with the level of deprivation or poor. Those living in remote villages are more likely to live in chronic poverty as compared to those living closure to the town or city center. The multivariate analysis revealed that household size, caste of the household, ownership of land holding, educational level of the household, village size are significant predictor of poverty. In addition to this the distance of the village from the nearest town as well as distance of the village from the district also associated with poverty. The study suggests that the policy makers should develop the methodologies for giving space and incentives to chronically poor people to escaping from that vicious circle of the chronic poverty where no political voice and taste of modernization are the dream for chronically poor people those who are dwelling far from the town or city in the rural eastern part of India. 16
17 References: Economic Survey ( ): Ministry of Finance, Economic Division, New Delhi. Haan A and Dubey A, (2005): Poverty, Disparities, or the development of Underdevelopment in Orissa, EPW, Vol-40, No-22 and 23. Heslop, K (2001): Chronic poverty and older people in the developing world, Help Age International, CPRC-10, Manchester. Hulme, D. and Shepherd, A (2003): Conceptuality Chronic Poverty, World Development, Vol. 31, and No.3. Hulme, D., Shepherd, A. and Moore, K (2001): Chronic Poverty: Meanings and Analytical frameworks, IDPM, Manchester. International Institute for Population Sciences (IIPS), National Family Health Survey (NFHS 2), : India, Mumbai, IIPS, Kothari, Uma (2005): Migration and Chronic poverty Institute for Development Policy and Management, Unversity of Manchester. Meghani, S (2003): A State Level Examination of Rural Poverty in India from , Economic Department, Stanford University, California. Mehta, A.K. and Shah, A (2001): Chronic Poverty in India: Overview study, Chronic Poverty Research Center, Working Paper-7, Manchester. Merrick Thomas W, (2002): Population and Poverty: New Views on an old controversy, International Family Planning perspectives, Vol-28, No-1. Moore, K (2001): Frameworks for understanding the intergenerational transmission of poverty and well being in developing countries, International Development Department, United Kingdom. Padhi, Shakti (1998); poverty in orissa: A Disaggregated Analysis,(Unpublished),Nabkishore Choudhari Institute of Development Studies, Bhubaneswar. Parr S.F and Shiva A.K, (2004): The Concept of human Poverty, Reading in Human Development, Oxford University Press, New Delhi. Planning Commission (2001) Approach paper to the Tenth Five Year Plan, , Government of India, New Delhi,
18 Planning Commission (2002): National Human Development Report, Oxford University Press, March, New Delhi. Planning Commission (2005): Poverty in Orissa: An Overview, Panchayatraj Administration, New Delhi. Planning Commission, (2002): Poverty alleviation in rural India strategy and program, Tenth Five Year Plan vol. II, New Delhi. Reddy B. Sambi, (2004): How to identify rural poor? An Alternative Approach, Journal of Social and Economic Development, ISEC, Bangalore, Vol-6, No-2. Registrar General of India, (2002): Sample Registration System statistical Report, New Delhi. Sen, Amartya. 2004: Development as Capability Expansion, in Readings in Human Development, Eds Sakiko Fuuda-Parr and A.K.Shivkumar, OUP (paper back edition, 2004). Srinivasan K and Mohanty S K, (2004): Deprivation of Basic Amenities by Caste and Religion: Empirical Study Using NFHS Data. EPW, Vol-39, No-7. Sundaram K, (2003): On Identification of Households below Poverty Line in BPL Census-2002, EPW, Vol-38, No-9. UNDP, 1998: Human Development Report 1998, OUP, New Delhi. 18
19 19
20 20
21 21
22 Causes and Manifestation of Poverty Causes Poverty Manifestation Internal Causes Lack of willpower Laziness Lack of skills/ knowledge Lack of drive Lack of hope External Factors Lack of employment opportunities Discrimination Lack of social cohesiveness Lack of education Lack of technology Weak income generating capacity Lack of financial resources Lack of integrity Culture Lack of institutional framework Malnutrition Ill health Low self esteem Powerlessness Illiteracy Humiliation Related social problems o Child labor o Drugs o Prostitution o Breaking of family bonds o Delinquenc y o Lack of hope 22
23 Table-1. Socio-Economic and Demographic Characteristics of Bihar and Orissa Variables Year Year & Sources Bihar Orissa India Demographic Variables Total Population (million) CBR TFR IMR Use of Modern method (contraception) Decadal growth rate Sex Ratio Percentage pop.(0-4) Density Census 2001 SRS SRS SRS NFHS 2 ( ) Census (2001) Census (2001) SRS (2002) Census of India, Social Variables Literacy Male Female Total Life expectancy Male Female Total Percent Below Poverty Line Census of India, 2001 Census of India, 2001 Census of India, 2001 SRS ( ) SRS ( ) SRS ( ) Planning commission, Economic Variables Percentage of Agricultural laborer. NET State Domestic Product Per Capita Census (2001) Economic Survey ( ) 48.0 Rs Rs Rs 24,482 23
24 Table 2: Incidence and Concentration of Income poverty in seven selected states of India. State State share of India s poor population State share of India s Population Percentage of the population of the state that is in poverty Percentage Reduction in poverty Percentage Reduction in poverty) ( & ( & Asam Bihar* M..P. * Maharastra Orissa U.P.* W.B All India * Including the districts in the now newly formed states. Sources: Mehta and Shah (2003) based on government of India, poverty estimates for ,press information Bureau, February22, and March 1997 and Government of India, 2001 provisional population tables. Table-3 (a): Deprivation at the Regional Level in Rural and Urban: Different Dimension State Region Percentage Severely poor Percentage Poor Rural Child Mortality Female Literacy Total Literacy Electricity Toilet facility Orissa Southern Bihar Central Bihar Northern Bihar Southern Urban Orisaa Coastal Orissa Southern Bihar Northern (Sources: Planning Commission, June 2000 and NIRD, India Rural Development Report, 1999). 24
25 Table-3 (b): Head Count Ratio by Regions and Social Groups (Rural): Social Groups S.T. S.C. Other All Coastal Southern Northern All (Orissa) Note: Based on estimates by Haan & Dubey (2003), Table, and P-12. Variab le Rural Table 4: Alternative measures in defining poverty Variables used in computing Household Deprivation Score (HDS) Variable used 1.Adult Literacy 2.Type of House 3.Electricity 4.Drinking water facility 5.Radio/transi stor or bicycle or Television 6.Land Holding Description 0= No adult literate in the household 1= Presence of any adult literate in household 0= Kuchha House 1= Semi Pucca / Pucca House 0 = House is not electrified 1= House is Electrified 0= No arrangement within the residence 1= Own arrangement within the residence 0 = Neither radio nor transistor nor bicycle nor TV 1= At least one of these 0= No land 1= Have some land Categorization of households on deprivation based on total score 0: Abject Deprivation (AD) 1-2: Moderate Deprivation (MD) 3-4: Just Above Deprivation (JAD) 5-6: Well Above Deprivation (WAD) 25
26 Table 5 (a): Percentage distribution of households on deprivation score in Rural India, Composite score India Bihar Orissa N Table 5 (b): Percentage distribution of households on Household Deprivation Score in eastern states of India, Rural Abject Deprivation (AD) Moderate Deprivation (MD) Just above Deprivation (JAD) Well above Deprivation (WAD) Bihar States Orissa Poor (AD+MD) Non-poor (JAD+WAD) N
27 Table 6 (a): Percentage distribution of children on nutritional status of children by levels of deprivation in India, Composite score Malnourished N Severely Malnourished N AD MD JAD WAD Poor Non Poor All Table 6 (b): Percentage distribution of women on levels of deprivation in India, AD MD JAD WAD Less than (Normal) Above N Poor Non Poor Total
28 Table-7 (a): Remoteness and Rural poverty Distribution of poor by distance of village from the nearest town and district head quarter in India. Distance of village from nearest town < km Than km km & 10k.m above Distance of village from nearest dist. Head quarters < Than km 26 km km km & above Poor Non-poor N SLI Low Medium High N Table-7(b) Remoteness and Rural poverty Distribution of poor by distance of village from the nearest town and district head quarter in eastern states of India. States Deprivations And B I H A R O R I S S A SLI < Than 10k.m. Poor Non-poor SLI Low Medium High Poor Non-poor SLI Low Medium High Distance of village from nearest town km km km & above Distance of village from nearest dist. Head quarters < km Than & 25 km km above km
29 Table 8: Result of Logistic Regression showing the correlates of poor in Rural India Variables Age of Head of Household Less than 30 (R) Household Size Less than 5 (R) Exp (B): India 1.35* 2.08* 1.58* 2.49* Exp (B): Orissa * 1.79* 4.09* Exp (B): Bihar * 1.69* 3.67* Caste Schedule Caste (R) Schedule Tribe Others 0.709* 1.496* 0.633* 1.63* 0.864* 1.87* Ownership of land holding No (R) Yes 5.41* 10.44* 9.82* Size of Village Population Less than 1000 (R) Above 2000 Educational level of HH Head No education (R) Incomplete primary Complete primary Incomplete secondary Complete secondary Higher 1.05* 1.40* 3.21* 5.01* 7.55* 12.48* 25.61* * 5.60* 7.21* 23.38* 41.52* 1.33* 1.77* 4.18* 6.84* 9.45* 18.66* 40.42* Distance of village from town Less than 20 kilometer (R) 20 kilometer and above Distance of village from district Head Quarter Less than 50 kilometer (R) 50 kilometer or more 0.749* * * Significant at 1 percent level 29
CHAPTER 3 SOCIO-ECONOMIC CONDITIONS OF MINORITIES OF INDIA
 CHAPTER 3 SOCIO-ECONOMIC CONDITIONS OF MINORITIES OF INDIA 73 List of Contents S.No. Chapter-3 Socio economic condition of Minorities of India on the Page number basis HDI indicators 3.1 Defination of
A Comparative Study of Human Development Index of Major Indian States
 Volume-6, Issue-2, March-April 2016 International Journal of Engineering and Management Research Page Number: 107-111 A Comparative Study of Human Development Index of Major Indian States Pooja Research
Inequality in Housing and Basic Amenities in India
 MPRA Munich Personal RePEc Archive Inequality in Housing and Basic Amenities in India Rama Pal and Neil Aneja and Dhruv Nagpal Indian Institute of Technology Bobmay, Indian Institute of Technology Bobmay,
Population Stabilization in India: A Sub-State level Analysis
 Published Quarterly Mangalore, South India ISSN 0972-5997 Volume 5, Issue 4; Oct -Dec 2006 Original Article Population Stabilization in India: A Sub-State level Analysis Authors Brijesh C. Purohit Advisor,
Migrant Child Workers: Main Characteristics
 Chapter III Migrant Child Workers: Main Characteristics The chapter deals with the various socio, educational, locations, work related and other characteristics of the migrant child workers in order to
Female Migration for Non-Marital Purposes: Understanding Social and Demographic Correlates of Barriers
 Female Migration for Non-Marital Purposes: Understanding Social and Demographic Correlates of Barriers Dr. Mala Mukherjee Assistant Professor Indian Institute of Dalit Studies New Delhi India Introduction
CONTENTS INTRODUCTION ORIGIN AND REGIONAL SETTING DISTRIBUTION AND GROWTH OF POPULATION SOCIAL COMPOSITION OF POPULATION 46 53
 CONTENTS CHAPTER PAGE NOs. INTRODUCTION 1 8 1 ORIGIN AND REGIONAL SETTING 9 19 2 DISTRIBUTION AND GROWTH OF POPULATION 20 44 3 SOCIAL COMPOSITION OF POPULATION 46 53 4 SEX COMPOSITION OF POPULATION 54
Dimensions of rural urban migration
 CHAPTER-6 Dimensions of rural urban migration In the preceding chapter, trends in various streams of migration have been discussed. This chapter examines the various socio-economic and demographic aspects
Perspective on Forced Migration in India: An Insight into Classed Vulnerability
 Perspective on in India: An Insight into Classed Vulnerability By Protap Mukherjee* and Lopamudra Ray Saraswati* *Ph.D. Scholars Population Studies Division Centre for the Study of Regional Development
Access to agricultural land, youth migration and livelihoods in Tanzania
 Access to agricultural land, youth migration and livelihoods in Tanzania Ntengua Mdoe (SUA), Milu Muyanga (MSU), T.S. Jayne (MSU) and Isaac Minde (MSU/iAGRI) Presentation at the Third AAP Conference to
Political participation and Women Empowerment in India
 Political participation and Women Empowerment in India Dr Satyavrat Singh Rawat Associate Professor, Department of Economics NREC College Khurja Abstract Political participation is a mechanism which enables
Lecture 1. Introduction
 Lecture 1 Introduction In this course, we will study the most important and complex economic issue: the economic transformation of developing countries into developed countries. Most of the countries in
An Analysis of Rural to Urban Labour Migration in India with Special Reference to Scheduled Castes and Schedules Tribes
 International Journal of Interdisciplinary and Multidisciplinary Studies (IJIMS), 2015, Vol 2, No.10,53-58. 53 Available online at http://www.ijims.com ISSN: 2348 0343 An Analysis of Rural to Urban Labour
INDIAN SCHOOL MUSCAT SENIOR SECTION DEPARTMENT OF SOCIAL SCIENCE CLASS: IX TOPIC/CHAPTER: 03-Poverty As A Challenge WORKSHEET No.
 INDIAN SCHOOL MUSCAT SENIOR SECTION DEPARTMENT OF SOCIAL SCIENCE CLASS: IX TOPIC/CHAPTER: 0-Poverty As A Challenge WORKSHEET No. : 4 (206-7) SUMMARY WRITE THESE QUESTIONS IN YOUR CLASS WORK NOTE BOOK 5,
International Institute for Population Sciences, Mumbai (INDIA)
") Kunal Keshri (kunalkeshri.lrd@gmail.com) (Senior Research Fellow, e-mail:) Dr. R. B. Bhagat (Professor & Head, Dept. of Migration and Urban Studies) International Institute for Population Sciences, Mumbai
Kunal Keshri (kunalkeshri.lrd@gmail.com) (Senior Research Fellow, e-mail:) Dr. R. B. Bhagat (Professor & Head, Dept. of Migration and Urban Studies) International Institute for Population Sciences, Mumbai
Measures of Poverty. Foster-Greer-Thorbecke(FGT) index Example: Consider an 8-person economy with the following income distribution
 index Example: Consider an 8-person economy with the following income distribution") Foster-Greer-Thorbecke(FGT) index Example: Consider an 8-person economy with the following income distribution Individuals Income 1 0.6 2 0.6 3 0.8 4 0.8 5 2 6 2 7 6 8 6 Poverty line= 1 Recall that Headcount
Foster-Greer-Thorbecke(FGT) index Example: Consider an 8-person economy with the following income distribution Individuals Income 1 0.6 2 0.6 3 0.8 4 0.8 5 2 6 2 7 6 8 6 Poverty line= 1 Recall that Headcount
Regression Model Approach for Out-Migration on Demographic Aspects of Rural Areas of Pauri Garhwal
 175 Regression Model Approach for Out-Migration on Demographic Aspects of Rural Areas of Pauri Garhwal Pankaj Bahuguna, Research Scholar, Department of Statistics, H.N.B.G.U., Srinagar (Garhwal) Uttarakhand
A Multi-dimensional Framework for Understanding, Measuring and Promoting Inclusive Economies Growth and Poverty Reduction: India s Experience
 A Multi-dimensional Framework for Understanding, Measuring and Promoting Inclusive Economies Growth and Poverty Reduction: India s Experience Shashanka Bhide Madras Institute of Development Studies, Chennai
DEMOGRAPHIC CHANGES AND GROWTH OF POPULATION IN UTTAR PRADESH: TRENDS AND STATUS
 DOI: 10.3126/ijssm.v3i4.15961 DEMOGRAPHIC CHANGES AND GROWTH OF POPULATION IN UTTAR PRADESH: TRENDS AND STATUS Sandeep Kumar Baliyan* Giri Institute of Development Studies (GIDS), Lucknow 226024 *Email:
Population, Health, and Human Well-Being-- Portugal
 Population, Health, and Human Well-Being-- Portugal EarthTrends Country Profiles Demographic and Health Indicators Portugal Europe World Total Population (in thousands of people) 1950 8,405 548,206 2,519,495
The Poor in the Indian Labour Force in the 1990s. Working Paper No. 128
 CDE September, 2004 The Poor in the Indian Labour Force in the 1990s K. SUNDARAM Email: sundaram@econdse.org SURESH D. TENDULKAR Email: suresh@econdse.org Delhi School of Economics Working Paper No. 128
Social Science Class 9 th
 Social Science Class 9 th Poverty as a Challenge Social exclusion Vulnerability Poverty Line Poverty Estimates Vulnerable Groups Inter-State Disparities Global Poverty Scenario Causes of Poverty Anti-Poverty
University of Bristol - Explore Bristol Research. Peer reviewed version. Link to publication record in Explore Bristol Research PDF-document
 Nandy, S., & Daoud, A. (Accepted/In press). Political regimes, corruption, and absolute child poverty in India a multilevel statistical analysis. Paper presented at FISS Conference, Sigtuna, 2014, Sigtuna,
Poverty profile and social protection strategy for the mountainous regions of Western Nepal
 October 2014 Karnali Employment Programme Technical Assistance Poverty profile and social protection strategy for the mountainous regions of Western Nepal Policy Note Introduction This policy note presents
II. MPI in India: A Case Study
 https://ophi.org.uk/multidimensional-poverty-index/ II. in India: A Case Study 271 MILLION FEWER POOR PEOPLE IN INDIA The scale of multidimensional poverty in India deserves a chapter on its own. India
Urban Poverty and Vulnerability of Street Children
 Chapter3 Urban Poverty and Vulnerability of Street Children India is the second most populous country in the world with an estimated 400 million children up to the age of 18 (UNFPA, 2005). Acceleration
Internal and international remittances in India: Implications for Household Expenditure and Poverty
 Internal and international remittances in India: Implications for Household Expenditure and Poverty Gnanaraj Chellaraj and Sanket Mohapatra World Bank Presented at the KNOMAD International Conference on
Levels and Trends in Multidimensional Poverty in some Southern and Eastern African countries, using counting based approaches
 Poverty and Inequality in Mozambique: What is at Stake? 27-28 November 2017 Hotel Avenida Maputo, Mozambique Session 1: Poverty and Inequality Levels and Trends in Multidimensional Poverty in some Southern
RECENT CHANGING PATTERNS OF MIGRATION AND SPATIAL PATTERNS OF URBANIZATION IN WEST BENGAL: A DEMOGRAPHIC ANALYSIS
 46 RECENT CHANGING PATTERNS OF MIGRATION AND SPATIAL PATTERNS OF URBANIZATION IN WEST BENGAL: A DEMOGRAPHIC ANALYSIS Raju Sarkar, Research Scholar Population Research Centre, Institute for Social and Economic
Changing Economic Status and Life Style of Migrated Tribal Women s (A Geographical Study of Dindori District)
") Changing Economic Status and Life Style of Migrated Tribal Women s (A Geographical Study of Dindori District) Dr. Lokesh Shrivastava D. Litt. 1, Dr. Ritu Rani 2, Shashikant Nag 3 Dept.of Post Graduate
Changing Economic Status and Life Style of Migrated Tribal Women s (A Geographical Study of Dindori District) Dr. Lokesh Shrivastava D. Litt. 1, Dr. Ritu Rani 2, Shashikant Nag 3 Dept.of Post Graduate
Socio Economic and Regional Disparities: Some Implications for India
 Int. Journal of Management and Development Studies 5(4): 61-66 (2016) ISSN (Online): 2320-0685. ISSN (Print): 2321-1423 Impact Factor: 0.715 Socio Economic and Regional Disparities: Some Implications for
Halve, between 1990 and 2015, the proportion of people whose income is less than $1 a day
 6 GOAL 1 THE POVERTY GOAL Goal 1 Target 1 Indicators Target 2 Indicators Eradicate extreme poverty and hunger Halve, between 1990 and 2015, the proportion of people whose income is less than $1 a day Proportion
MIGRATION AND URBAN POVERTY IN INDIA
 1 Working Paper 414 MIGRATION AND URBAN POVERTY IN INDIA SOME PRELIMINARY OBSERVATIONS William Joe Priyajit Samaiyar U. S. Mishra September 2009 2 Working Papers can be downloaded from the Centre s website
Sri Lanka. Country coverage and the methodology of the Statistical Annex of the 2015 HDR
 Human Development Report 2015 Work for human development Briefing note for countries on the 2015 Human Development Report Sri Lanka Introduction The 2015 Human Development Report (HDR) Work for Human Development
Internal migration and current use of modern contraception methods among currently married women age group between (15-49) years in India
 years in India") Internal migration and current use of modern contraception methods among currently married women age group between (15-49) years in India Pushpendra Mishra 1, Bhaskar Mishra 2 and Jay Shankar Dixit 3 Abstract:
Internal migration and current use of modern contraception methods among currently married women age group between (15-49) years in India Pushpendra Mishra 1, Bhaskar Mishra 2 and Jay Shankar Dixit 3 Abstract:
Inclusive Growth, Poverty and Social Sector Development in India
 Inclusive Growth, Poverty and Social Sector Development in India P. Ponmuthusaravanan Ph.D. Research Scholar, Department of Economics, Annamalai University, Tamil Nadu, India G. Ravi Professor, Department
Rural-Urban Partnership For Inclusive Growth In India
 ISSN: 2278 0211 (Online) Rural-Urban Partnership For Inclusive Growth In India Amar Kumar Chaudhary Registrar, Ranchi University, Ranchi, India Abstract: It is rightly appropriate that the academicians,
Laos: Ethno-linguistic Diversity and Disadvantage
 Laos: Ethno-linguistic Diversity and Disadvantage Elizabeth M. King Dominique van de Walle World Bank December 2010 1 The Lao People s Democratic Laos is one of the poorest countries in Southeast Asia
Human Development Indices and Indicators: 2018 Statistical Update. Pakistan
 Human Development Indices and Indicators: 2018 Statistical Update Briefing note for countries on the 2018 Statistical Update Introduction Pakistan This briefing note is organized into ten sections. The
ANALYSIS OF POVERTY TRENDS IN GHANA. Victor Oses, Research Department, Bank of Ghana
 ANALYSIS OF POVERTY TRENDS IN GHANA Victor Oses, Research Department, Bank of Ghana ABSTRACT: The definition of poverty differs across regions and localities in reference to traditions and what society
Rural Migration and Social Dislocation: Using GIS data on social interaction sites to measure differences in rural-rural migrations
 1 Rural Migration and Social Dislocation: Using GIS data on social interaction sites to measure differences in rural-rural migrations Elizabeth Sully Office of Population Research Woodrow Wilson School
Internal Migration and the Use of Reproductive and Child Health Services in Peru
 DHS WORKING PAPERS Internal Migration and the Use of Reproductive and Child Health Services in Peru Lekha Subaiya 2007 No. 38 November 2007 This document was produced for review by the United States Agency
DISPARITY IN HIGHER EDUCATION: THE CONTEXT OF SCHEDULED CASTES IN INDIAN SOCIETY
 IMPACT: International Journal of Research in Humanities, Arts and Literature (IMPACT: IJRHAL) ISSN(E): 2321-8878; ISSN(P): 2347-4564 Vol. 2, Issue 4, Apr 2014, 35-42 Impact Journals DISPARITY IN HIGHER
Economic and Social Council
 United Nations Economic and Social Council Distr.: General 27 December 2001 E/CN.3/2002/27 Original: English Statistical Commission Thirty-third session 5-8 March 2002 Item 7 (f) of the provisional agenda*
Does Migration Improves Indian Women s Health and Knowledge of AIDS
 Does Migration Improves Indian Women s Health and Knowledge of AIDS Research Paper for Oral presentation at 2004 Annual Meeting of Population Association of America April 1-3, 2004 Boston, USA By Praween
Access to Food, Poverty and Inequality by Social and Religious groups in India: Estimation with Unit Level Data. Panchanan Das & Anindita Sengupta
 Access to Food, Poverty and Inequality by Social and Religious groups in India: Estimation with Unit Level Data Panchanan Das & Anindita Sengupta Background Food security under trade liberalisation of
Socio - Economic Impact of Remittance on Households in Lekhnath Municipality, Kaski, Nepal
 Economic Literature, Vol. XII (39-49), December 2014 Socio - Economic Impact of Remittance on Households in Lekhnath Municipality, Kaski, Nepal Ananta Raj Dhungana, PhD 1 * Dipendra Pandit** ABSTRACT The
Internal Migration, Remittance, and Contraceptive Use in India. Session 265: Internal Migration and Wellbeing. IUSSP 2013 Busan, Korea
 Internal Migration, Remittance, and Contraceptive Use in India Session 265: Internal Migration and Wellbeing IUSSP 2013 Busan, Korea Apoorva Jadhav Population Studies Center, University of Pennsylvania
Human Development Indices and Indicators: 2018 Statistical Update. Eritrea
 Human Development Indices and Indicators: 2018 Statistical Update Briefing note for countries on the 2018 Statistical Update Introduction Eritrea This briefing note is organized into ten sections. The
Prologue Djankov et al. (2002) Reinikka & Svensson (2004) Besley & Burgess (2002) Epilogue. Media and Policy. Dr. Kumar Aniket
 Reinikka & Svensson (2004) Besley & Burgess (2002) Epilogue. Media and Policy. Dr. Kumar Aniket") Media and Policy EC307 ECONOMIC DEVELOPMENT Dr. Kumar Aniket University of Cambridge & LSE Summer School Lecture 2 created on June 6, 2010 READINGS Tables and figures in this lecture are taken from: Djankov,
Media and Policy EC307 ECONOMIC DEVELOPMENT Dr. Kumar Aniket University of Cambridge & LSE Summer School Lecture 2 created on June 6, 2010 READINGS Tables and figures in this lecture are taken from: Djankov,
Incidence of Urban Poverty in Tamil Nadu: A Micro Level Socio- Economic Analysis
 Volume-8, Issue-1 February 2018 International Journal of Engineering and Management Research Page Number: 161-168 Incidence of Urban Poverty in Tamil Nadu: A Micro Level Socio- Economic Analysis Dr. R.
Human Development Indices and Indicators: 2018 Statistical Update. Cambodia
 Human Development Indices and Indicators: 2018 Statistical Update Briefing note for countries on the 2018 Statistical Update Introduction Cambodia This briefing note is organized into ten sections. The
Overview of standards for data disaggregation
 Read me first: Overview of for data disaggregation This document gives an overview of possible and existing, thoughts and ideas on data disaggregation, as well as questions arising during the work on this
Poverty Profile. Executive Summary. Kingdom of Thailand
 Poverty Profile Executive Summary Kingdom of Thailand February 2001 Japan Bank for International Cooperation Chapter 1 Poverty in Thailand 1-1 Poverty Line The definition of poverty and methods for calculating
Human Development Indices and Indicators: 2018 Statistical Update. Indonesia
 Human Development Indices and Indicators: 2018 Statistical Update Briefing note for countries on the 2018 Statistical Update Introduction Indonesia This briefing note is organized into ten sections. The
Research on urban poverty in Vietnam
 Int. Statistical Inst.: Proc. 58th World Statistical Congress, 2011, Dublin (Session CPS055) p.5260 Research on urban poverty in Vietnam Loan Thi Thanh Le Statistical Office in Ho Chi Minh City 29 Han
A BRIEF NOTE ON POVERTY IN THAILAND *
 A BRIEF NOTE ON POVERTY IN THAILAND * By Medhi Krongkaew ** 1. Concept of Poverty That poverty is a multi-dimensional concept is beyond dispute. Poverty can be looked upon as a state of powerlessness of
PREDICTORS OF CONTRACEPTIVE USE AMONG MIGRANT AND NON- MIGRANT COUPLES IN NIGERIA
 PREDICTORS OF CONTRACEPTIVE USE AMONG MIGRANT AND NON- MIGRANT COUPLES IN NIGERIA Odusina Emmanuel Kolawole and Adeyemi Olugbenga E. Department of Demography and Social Statistics, Federal University,
Human Development in State of New Andhra Pradesh- Emerging Issues and Policy Perspectives
 RESEARCH ARTCLE Human Development in State of New Andhra Pradesh- Emerging Issues and Policy Perspectives Dr. Guest faculty, Dept. of Economics,AcharyaNagarjuna University, Guntur ABSTRACT K. KISHORE BABU
AN ANALYSIS OF SOCIO-ECONOMIC STATUS OF SCHEDULED CASTES: A STUDY OF BORDER AREAS OF JAMMU DISTRICT
 Indian Streams Research Journal ISSN:-2230-7850 AN ANALYSIS OF SOCIO-ECONOMIC STATUS OF SCHEDULED CASTES: A STUDY OF BORDER AREAS OF JAMMU DISTRICT ORIGINAL ARTICLE Pradeep Arora and Virendar Koundal Research
Determinants of Household Poverty: Empirical Evidence from Pakistan
 MPRA Munich Personal RePEc Archive Determinants of Household Poverty: Empirical Evidence from Pakistan Muhammad Tariq Majeed and Muhammad Nauman Malik Quaid-i-Azam University, Islamabad, Pakistan. 2014
Human development in China. Dr Zhao Baige
 Human development in China Dr Zhao Baige 19 Environment Twenty years ago I began my academic life as a researcher in Cambridge, and it is as an academic that I shall describe the progress China has made
(EPC 2016 Submission Extended Abstract) Projecting the regional explicit socioeconomic heterogeneity in India by residence
 Projecting the regional explicit socioeconomic heterogeneity in India by residence") (EPC 2016 Submission Extended Abstract) Projecting the regional explicit socioeconomic heterogeneity in India by residence by Samir K.C. & Markus Speringer Wittgenstein Centre (IIASA, VID/ÖAW, WU) (kc@iiasa.ac.at
(EPC 2016 Submission Extended Abstract) Projecting the regional explicit socioeconomic heterogeneity in India by residence by Samir K.C. & Markus Speringer Wittgenstein Centre (IIASA, VID/ÖAW, WU) (kc@iiasa.ac.at
A PREVENTIVE APPROACH TO AVOID POVERTY FROM SOCIETY
 A PREVENTIVE APPROACH TO AVOID POVERTY FROM SOCIETY SUNITA RANI Research Scholar, department of economics CDLU, SIRSA (India) ABSTRACT The main reason of undevloping country is poverty. India is also one
INTRODUCTION I. BACKGROUND
 INTRODUCTION I. BACKGROUND Bihar is the second most populous State of India, comprising a little more than 10 per cent of the country s population. Situated in the eastern part of the country, the state
CASTE BASED LABOUR MARKET DISCRIMINATION IN RURAL INDIA A Comparative Analysis of some Developed and Underdeveloped States
 [VOLUME 5 I ISSUE 2 I APRIL JUNE 2018] e ISSN 2348 1269, Print ISSN 2349-5138 http://ijrar.com/ Cosmos Impact Factor 4.236 CASTE BASED LABOUR MARKET DISCRIMINATION IN RURAL INDIA A Comparative Analysis
Regional Composition of Migrant and Non -Migrant Workers in Maharashtra, India
 International Journal of Interdisciplinary and Multidisciplinary Studies (IJIMS), 2017, Vol 4, No.2,152-156. 152 Available online at http://www.ijims.com ISSN - (Print): 2519 7908 ; ISSN - (Electronic):
Rural to Urban Migration and Household Living Conditions in Bangladesh
 Dhaka Univ. J. Sci. 60(2): 253-257, 2012 (July) Rural to Urban Migration and Household Living Conditions in Bangladesh Department of Statistics, Biostatistics & Informatics, Dhaka University, Dhaka-1000,
Template Concept Note for Knowledge Products
 Template Concept Note for Knowledge Products Project Number: 46465 Regional Capacity Development Technical Assistance (R-CDTA) Date of Submission: 15th Jan 2015 South Asia Urban Knowledge Hub (Cofinanced
1400 hrs 14 June The Millennium Development Goals (MDGs): The Role of Governments and Public Service Notes for Discussion
: The Role of Governments and Public Service Notes for Discussion") 1400 hrs 14 June 2010 Slide I The Millennium Development Goals (MDGs): The Role of Governments and Public Service Notes for Discussion I The Purpose of this Presentation is to review progress in the Achievement
1400 hrs 14 June 2010 Slide I The Millennium Development Goals (MDGs): The Role of Governments and Public Service Notes for Discussion I The Purpose of this Presentation is to review progress in the Achievement
Public Affairs Index (PAI)
") Public Affairs Index (PAI) A Closer look at Andhra Pradesh NOTE: All the data and rankings presented in PAI represent the united Andhra Pradesh (before the bifurcation) Contents of the Presentation About
Public Affairs Index (PAI) A Closer look at Andhra Pradesh NOTE: All the data and rankings presented in PAI represent the united Andhra Pradesh (before the bifurcation) Contents of the Presentation About
Health Outcomes of Children in Northern Uganda: Does Current IDP Status Matter?
 Health Outcomes of Children in Northern Uganda: Does Current IDP Status Matter? Carlos Bozzoli and Tilman Brück Work in progress Bonn, 4 May 2009 Overview Motivation Literature Methodological approach
Source: Retrieved from among the 187 developing countries in HDI ranking (HDR, 2011). The likeliness of death at a
. The likeliness of death at a") Figure 1 Source: Retrieved from http://hdr.undp.org/en/data/trends The multi-dimensional poverty value for Bangladesh is.292 and it sets Bangladesh 146th among the 187 developing countries in HDI ranking
Figure 1 Source: Retrieved from http://hdr.undp.org/en/data/trends The multi-dimensional poverty value for Bangladesh is.292 and it sets Bangladesh 146th among the 187 developing countries in HDI ranking
GENDER FACTS AND FIGURES URBAN NORTH WEST SOMALIA JUNE 2011
 GENDER FACTS AND FIGURES URBAN NORTH WEST SOMALIA JUNE 2011 Overview In November-December 2010, FSNAU and partners successfully piloted food security urban survey in five towns of the North West of Somalia
CAMBODIA SYSTEMATIC COUNTRY DIAGNOSTIC Public Engagement
 CAMBODIA SYSTEMATIC COUNTRY DIAGNOSTIC Public Engagement Nov Dec 2016 Contents Objectives of the Engagement Country Context Main research questions I. What are the challenges to sustaining economic growth?
FOOD SECURITY MONITORING, TAJIKISTAN
 Fighting Hunger Worldwide BULLETIN February 2017 ISSUE 18 Tajikistan Food Security Monitoring Highlights The food security situation presents expected seasonal variation better in December after the harvest,
CHAPTER IV SOCIO ECONOMIC STATUS OF WOMEN IN SOUTH INDIA
 CHAPTER IV SOCIO ECONOMIC STATUS OF WOMEN IN SOUTH INDIA 4.1 Employment 47 4.2 Education 51 4.3 Economic Status of women 55 4.4 Women s Participation in Decision Making 65 References 73 CHAPTER IV SOCIO
Determinants of Rural-Urban Migration in Konkan Region of Maharashtra
 Agricultural Economics Research Review Vol. 24 (Conference Number) 2011 pp 503-509 Determinants of Rural-Urban Migration in Konkan Region of Maharashtra V.A. Thorat*, J.S. Dhekale, H.K. Patil and S.N.
Poverty Data Disaggregation: Experiences and Suggestions of China. Wang Pingping Department of Household Surveys of National Bureau of China (NBS)
") Poverty Data Disaggregation: Experiences and Suggestions of China Wang Pingping Department of Household Surveys of National Bureau of China (NBS) Disaggregated poverty data is important for most of the
Poverty Data Disaggregation: Experiences and Suggestions of China Wang Pingping Department of Household Surveys of National Bureau of China (NBS) Disaggregated poverty data is important for most of the
IX Geography CHEPTER 6 : POPULATION
 IX Geography CHEPTER 6 : POPULATION Introduction: The people are important to develop the economy and society. The people make and use resources and are themselves resources with varying quality. Resources,
Contents. List of Figures List of Maps List of Tables List of Contributors. 1. Introduction 1 Gillette H. Hall and Harry Anthony Patrinos
 Contents List of Figures List of Maps List of Tables List of Contributors page vii ix x xv 1. Introduction 1 Gillette H. Hall and Harry Anthony Patrinos 2. Indigenous Peoples and Development Goals: A Global
KERALA: A UNIQUE HUMAN DEVELOPMENT MODEL IN INDIA?
 Chapter 3 KERALA: A UNIQUE HUMAN DEVELOPMENT MODEL IN INDIA? 3.1 Introduction 53 3.2 The Demographic Dimension 59 3.3 The Health Dimension 65 3.4 The Knowledge Dimension 70 3.5 The Standard of Living Dimension
Migration and Informality
 Migration and Informality Alakh N. Sharma Dhruv Sood Institute for Human Development NIDM Building, 3 rd Floor, IP Estate Mahatma Gandhi Marg New Delhi-110002 Why People Migrate? Labour migration is an
The Role of Migration and Income Diversification in Protecting Households from Food Insecurity in Southwest Ethiopia
 The Role of Migration and Income Diversification in Protecting Households from Food Insecurity in Southwest Ethiopia David P. Lindstrom Population Studies and Training Center, Brown University Craig Hadley
Nature of Multidimensional Poverty Incidence in Rural Nepal: Empirical Evidences from Bhalam VDC, Kaski
 Economic Literature, Vol. XII (16-25), December 2014 Nature of Multidimensional Poverty Incidence in Rural Nepal: Empirical Evidences from Bhalam VDC, Kaski Lekha Nath Bhattarai, Ph. D. ABSTRACT This paper
STRENGTHENING RURAL CANADA: Fewer & Older: Population and Demographic Crossroads in Rural Saskatchewan. An Executive Summary
 STRENGTHENING RURAL CANADA: Fewer & Older: Population and Demographic Crossroads in Rural Saskatchewan An Executive Summary This paper has been prepared for the Strengthening Rural Canada initiative by:
Inclusive Growth in Bangladesh: A Critical Assessment
 2 ND SANEM ANNUAL ECONOMISTS CONFERENCE MANAGING GROWTH FOR SOCIAL INCLUSION Inclusive Growth in Bangladesh: A Critical Assessment Towfiqul Islam Khan Research Fellow, CPD Dhaka:
GROWTH OF SCHEDULED CASTE POPULATION
 CHAPTER NO. 4 GROWTH OF SCHEDULED CASTE POPULATION 4.1 INTRODUCTION 4.2 TREND IN GROWTH OF SCHEDULED CASTE POPULATION 4.2.1 TAHSIL WISE GROWTH RATE OF SCHEDULED CASTE POPULATION 4.2.2 TAHSIL WISE MALE
IB Diploma: Economics. Section 4: Development Economics COURSE COMPANION. First Edition (2017)
") IB Diploma: Economics Section 4: Development Economics COURSE COMPANION First Edition (2017) Economic development... 3 Nature of economic growth and economic development... 3 Common Characteristics of
IB Diploma: Economics Section 4: Development Economics COURSE COMPANION First Edition (2017) Economic development... 3 Nature of economic growth and economic development... 3 Common Characteristics of
Developing a Regional Core Set of Gender Statistics and Indicators in Asia and the Pacific
 Developing a Regional Core Set of Gender Statistics and Indicators in Asia and the Pacific Preparatory Survey Questionnaire REGIONAL CONSULTATIVE WORKSHOP TO DEVELOP A FRAMEWORK AND CORE SET OF GENDER
POVERTY AND INEQUALITY IN SOUTH WEST BENGAL: AN OVERVIEW
 Jharkhand Journal of Social Development, Vol. V, No.1 & 2, 2013 ISSN 0974 651x POVERTY AND INEQUALITY IN SOUTH WEST BENGAL: AN OVERVIEW Rajarshi Majumder Associate Professor, Department of Economics, University
STRENGTHENING RURAL CANADA: Fewer & Older: The Coming Population and Demographic Challenges in Rural Newfoundland & Labrador
 STRENGTHENING RURAL CANADA: Fewer & Older: The Coming Population and Demographic Challenges in Rural Newfoundland & Labrador An Executive Summary 1 This paper has been prepared for the Strengthening Rural
Ghana Lower-middle income Sub-Saharan Africa (developing only) Source: World Development Indicators (WDI) database.
 Source: World Development Indicators (WDI) database.") Knowledge for Development Ghana in Brief October 215 Poverty and Equity Global Practice Overview Poverty Reduction in Ghana Progress and Challenges A tale of success Ghana has posted a strong growth performance
Knowledge for Development Ghana in Brief October 215 Poverty and Equity Global Practice Overview Poverty Reduction in Ghana Progress and Challenges A tale of success Ghana has posted a strong growth performance
Briefing Paper Series No Overview of Poverty in Sri Lanka
 Briefing Paper Series No 13 2013 Overview of Poverty in Sri Lanka - 2013 Overview of Poverty in Sri Lanka - 2013 Shakeela Jabbar and Dinushka Senanayake revised by Ishara Rathnayake A Centre for Poverty
Or7. The Millennium Development Goals Report
 Or7 The Millennium Development Goals Report 2009 1 Goal 1 Eradicate extreme poverty and hunger Target 1.A Halve, between 1990 and 2015, the proportion of people whose income is less than one dollar a day
POVERTY ESTIMATE IN INDIA. Dr. P.Jeyashree, Assistant professor, PG & Research department of Economics, Urumu Dhanalakshmi College,
 Available online at: http://euroasiapub.org ISSN(o): 2249-7382 Impact Factor(SJIF): 6.939 POVERTY ESTIMATE IN INDIA Dr. P.Jeyashree, Assistant professor, PG & Research department of Economics, Urumu Dhanalakshmi
TOPICS INCLUDE: Population Growth Demographic Data Rule of 70 Age-Structure Pyramids Impact of Growth UNIT 3: POPULATION
 TOPICS INCLUDE: Population Growth Demographic Data Rule of 70 Age-Structure Pyramids Impact of Growth UNIT 3: POPULATION # of individuals in a given area Uniform equally spaced Clumped/Clustered individuals
Eleonora Escalante, MBA - MEng Strategic Corporate Advisory Services Creating Corporate Integral Value (CIV)
") Eleonora Escalante, MBA - MEng Strategic Corporate Advisory Services Creating Corporate Integral Value (CIV) Leg 7. Trends in Competitive Advantage. Industry 4.0: Only if it reduces the Citizens poverty
Eleonora Escalante, MBA - MEng Strategic Corporate Advisory Services Creating Corporate Integral Value (CIV) Leg 7. Trends in Competitive Advantage. Industry 4.0: Only if it reduces the Citizens poverty
CROSS BORDER MOVEMENT AND ACHIEVEMENTS OF MIGRANT WORKERS - CHANGING PERSPECTIVES ISSN
 CROSS BORDER MOVEMENT AND ACHIEVEMENTS OF MIGRANT WORKERS - CHANGING PERSPECTIVES ISSN 2277-5846 P. Mohanraj Research Scholar, Department of Management, Erode Arts and Science College, Erode, Tamil Nadu,
Levels and Dynamics of Inequality in India: Filling in the blanks
 Levels and Dynamics of Inequality in India: Filling in the blanks Peter Lanjouw (Vrije University Amsterdam) Summary of Findings from the India Component of the UNU-WIDER Inequality in the Giants Project