DEMOGRAPHIC CHANGE AND THE EXPANSION OF URBAN AREAS IN MARYLAND, 1970 TO Marie Howland University of Maryland, College Park.
|
|
|
- Rosamond Johnson
- 5 years ago
- Views:
Transcription
1 DEMOGRAPHIC CHANGE AND THE EXPANSION OF URBAN AREAS IN MARYLAND, 1970 TO 2000 by Bernadette Hanlon Center for Urban Environmental Research and Education UMBC Marie Howland University of Maryland, College Park Mike McGuire Center for Urban Environmental Research and Education UMBC January, 2007 Center for Urban Environmental Research and Education (CUERE) University of Maryland, Baltimore County (UMBC) 1000 Hilltop Circle Baltimore, MD Tel: (410) Research for this project was supported by a grant from The Maryland Center for Agroecology with funds from USDA-CSREES
2 TABLE OF CONTENTS List of Tables...ii List of Figures....iii EXECUTIVE SUMMARY CHAPTER ONE INTRODUCTION 12 CHAPTER TWO MARYLAND S CHANGING POPULATION 15 CHAPTER THREE HOUSING DEVELOPMENT. 35 CHAPTER FOUR MARYLAND S ECONOMY 41 CHAPTER FIVE MARYLAND S AGRICULTURE CHAPTER SIX LAND COVER CHANGE IN TRANSITIONING COUNTIES...76 CHAPTER SEVEN INFLUENCES ON GROWTH AND POLICY AND PLANNING IMPLICATIONS...93 CHAPTER EIGHT CONCLUSION 108 APPENDIX i
3 LIST OF TABLES Table 1.1 Metropolitan and non-metropolitan counties in Maryland, Table 2.1 Population change in Maryland, 1970 to Table 2.2 Household formation by county, 1970 to Table 2.3 Household formation projections to Table 2.4 Population density by county, 1980 to Table 2.5 African American population by county, 1990 to Table 2.6 In- and out-migration in metropolitan and non-metropolitan Maryland, 1995 to Table 2.7 Sources of net migration gains and losses for Maryland counties, 1995 to Table 3.1 Housing development in Maryland counties, 1970 and Table 3.2 Housing development in urban cores in Maryland, 1990 to Table 4.1 Employment in Metropolitan Maryland, Table 4.2 Employment in Non-Metropolitan Maryland, Table 5.1 Average size of farms in acres by county, 1978 to Table 7.1 Location quotients for Frederick County.. 94 ii
4 Table 7.2 Commuting from Frederick County.. 96 Table 7.3 Logistic model results (the probability a parcel remains in agriculture)...99 Table 7.4 Mean values for variables iii
5 LIST OF FIGURES Figure E.1 Map of probability land will change from agricultural to urban use 10 Figure 2.1 Change in population density by census tract in Maryland, 1990 to Figure 2.2 Foreign born by county, 1990 and Figure 3.1 Residential development in Worcester County..37 Figure 3.2 Examples of major places in Maryland.38 Figure 4.1 Employment by industry in Maryland, 1969 to Figure 4.2 Employment by industry in metropolitan Maryland, 1969 to Figure 4.3 Total employment in the Baltimore and suburban Washington DC regions, 1969 to Figure 4.4 Employment by industry within metropolitan counties, Figure 4.5 Employment by industry within metropolitan counties, Figure 4.6 Employment by industry in non-metropolitan Maryland, 1969 to Figure 4.7 Total employment by non-metropolitan county, Figure 4.8 Employment by industry within non-metropolitan counties, Figure 4.9 Location quotients for different industries in Maryland, iv
6 Figure 4.10 High technology establishments by zip code, Figure 4.11 Employment centers in Central Maryland.61 Figure 5.1 Percent of land area in farms by county, 1978 and Figure 5.2 Farm acres by county, 1978 to Figure 5.3 Number of farms by county, 1987 to Figure 5.4 Change in the number of farms by zip code, 1987 to Figure 5.5 Farm size in Montgomery County, 1982 to Figure 5.6 Farm size in Worcester County, 1982 to Figure 5.7 Real agricultural property values by county, 1986 to 2005 (in 2005 dollars)...75 Figure classification for Montgomery and Frederick counties 78 Figure classification for Frederick and Montgomery counties 79 Figure classification for Frederick and Montgomery counties 80 Figure 6.5 Progression of urbanization for Frederick and Montgomery counties, 1986, 1995, and Figure 6.6 Montgomery County classification totals..82 Figure 6.7 Frederick County classification totals 85 v
7 Figure 6.8 Change in developed LPI Figure 6.9 Change in forest LPI Figure 6.10 Change in agriculture/open LPI Figure 7.1 Distance from non-agricultural parcel.100 Figure 7.2 Distance from the interstate highway..100 Figure 7.3 Quality of land in agricultural production Figure 7.4 Map of probability land will change from agricultural to urban use Figure A.1 Classification Workflow..112 vi
8 EXECUTIVE SUMMARY Maryland has witnessed tremendous changes in population, economy and landscape in recent decades. We outlined these changes in Chapters Two through Five. In this study, we also measured the extent of changes in developed land, agricultural/open land and forested land in two counties in Maryland over three time periods. We subsequently implemented a statistical model to identify the conditions that influence a parcel s change from agriculture to urban use. Here we summarize the results and implications of the findings from this study. Population trends From 1970 to 2000, Maryland s population increased by almost 1.4 million people. Current projections suggest that Maryland s population will grow to 6.7 million by 2030, an increase of additional 1.4 million since the 2000 Census. Counties that witnessed the most substantial population change between 1970 and 2000 are in the metropolitan areas of Baltimore and Washington DC. Of these counties, Montgomery County experienced the largest increase with the addition of 350,000 people during this period, a 67 percent increase. Recent figures suggest this county will grow from about 873,000 in 2000 to more than 1.1 million by Howard County witnessed the largest percentage population change 300 percent from 1970 to 2000; followed not far behind by Calvert County at 261 percent and Charles County at 153 percent. Traditionally rural counties also experienced substantive increases in population over the thirty year period. Combined, counties in Southern Maryland witnessed an increase of - 1 -
9 more than 165,000 people since the 1970s, a growth rate of 140 percent. Worcester County, beginning with a population of a little over 25,000 in 1970, almost doubled in population by Similarly, St. Mary s County experienced a population increase of 80 percent. Population increases of this nature put tremendous strain on both the natural resources and local infrastructure of what are primarily rural counties. Household formation also increased in Maryland from 1970 to The number of households, particularly among metropolitan counties, has increased in large numbers although the rate of household formation in non-metropolitan counties is higher than that of metropolitan counties. From 1970 to 2000, the number of households in metropolitan counties increased by 717,820 households, or by 68 percent. During this same period, the number of households increased in rural or non-metropolitan counties by more than 88,000, or by 73 percent. Projections indicate that household formation will continue at a rapid pace, particularly in counties such as Charles and Frederick. There are projected household increases of over 80 percent from 2000 to 2030 in both these counties. Non-metropolitan counties are also expected to see large increases in the number of households, with the projected addition of more than 108,000 households between 2000 and Among these nonmetropolitan counties, the largest projected growth in households is in Cecil County where there is expected to be an additional 30,000 households by Household formation of this magnitude means large numbers of additional housing, and added strain on the public school system and other services
10 An analysis of population density in Maryland indicates that much of the growth has followed major highways and roads. The principal urban centers along these routes have expanded at a tremendous pace. Immigration is a key driver of population growth, although domestic migration does matter for specific counties. For instance, there was an in-migration to Maryland of populations from surrounding states, particularly into Prince Georges County. Analyzing the movement of people within Maryland, we found that few metropolitan counties experienced net migration gains from rural counties. In fact, for counties such as Prince George s and Harford there was substantially more out-migration to rural counties than in-migration of rural populations between 1995 and This suggests that there is some out-migration from metropolitan to non-metropolitan areas of the state. Outmigration or sprawling further out from the metropolitan areas to rural areas greatly impacts farmland, forested areas and open space in the state. Housing Development Trends To keep in step with population growth and change, housing development has occurred at a rapid pace in Maryland with the addition of almost 900,000 houses from 1970 to Most of this additional housing was built in metropolitan counties although some rural counties experienced substantial development. For instance, Somerset Cecil and Cecil counties more than doubled their housing stock from 1970 to Specific areas within rural Maryland also witnessed large increases. For instance Ocean City added 38,000 new housing units, including individual condos, from 2000 to 2003 alone. Housing expansion - 3 -
11 in such small urban centers of the state is important since these centers act as a springboard from where further development occurs. This subsequently has tremendous consequences for the loss of farmland and open space surrounding these once small rural towns. Employment Trends There have been massive shifts in the economy of Maryland that both reflect and drive population growth throughout the state. Job growth, as with population growth, has occurred at a tremendous pace with the workforce expanding from 1.6 million in 1969 to 3.1 million in 2001, a growth rate of 86 percent. During these thirty years, there has been a shift away from farm and manufacturing employment to a more service-based, hightechnology economy. Employment has shifted location, dispersing away from central cities to employment centers primarily in the Central Maryland region. Metropolitan counties are important sources of employment for the state. Employment in the Washington suburban counties of Montgomery, Frederick and Prince George s combined increased from almost 450,000 workers in 1969 to more than 1.1 million workers in 2001, a job growth rate of 147 percent. The Baltimore region has more workers 1.5 million in 2001 but the workforce in the region is growing at a slower pace than the suburban counties of Washington DC. The Washington DC area, in particular, is the site for many professional jobs in industries located along I-270 and I
12 Employment structure in both metropolitan and non-metropolitan counties has changed dramatically in recent decades. Farming is less important as a source of employment in every county; and manufacturing employment has taken a sharp decline in recent decades. Among rural counties, the effects are quite devastating. For instance, in 2001, fourteen percent of Washington County s workforce was employed in the manufacturing sector, the highest percentage rate for manufacturing employment among metropolitan counties in the state. However, this represents a decline in manufacturing employment from 30 percent of total employment in Washington County in Many rural counties have turned to the retail trade and service sectors as sources of employment in the new economy. Employment growth in the retail sector of nonmetropolitan counties was substantial with the addition of almost 32,000 retail jobs from 1969 to 2001, a growth rate of 123 percent. In 2001, the service sector accounted for 30 percent of non-metropolitan county employment. At the same time, farming accounts for three percent of employment in non-metropolitan counties. The local economies of rural counties rely less on the land or manufacturing sector and more on consumer growth and service. This reliance encourages further urban growth. Trends in Farming In the past 30 years, there has been a dramatic reduction of land in farms in Maryland. Land in farms in the state declined from 2.6 million acres in 1978 to about 2 million acres in Similarly, the number of farms in the state declined from 14,776 farms in 1987 to 12,198 in
13 Metropolitan counties in both the Washington DC and Baltimore areas experienced decline in the percentage of land area in farming from 1978 to The most extreme cases were Harford, Howard, Frederick and Montgomery counties. The land area in farming declined by around 13 percent in each of these counties from 1978 to Non-metropolitan counties in Maryland also experienced a loss of land in farms. The Eastern Shore as a whole had more than 1 million acres of land in farms in 1978, declining to less than 973,000 acres by 2002, a loss of 114,707 acres. The largest loss of acres in farms from 1978 to 2002 occurred in Kent County which lost a total of 21,401 acres of farmland during this period. The number of farms in the Baltimore region declined by 609 farms from 1987 to 2002, and the suburban Washington DC counties lost 489 farms during this same period. Among regions in the state, the Lower Eastern Shore experienced the largest decline, with the number of farms in this region dropping from a high of 2,203 in 1987 to 1,567 in 2002, a loss of 636 farms. We analyzed changes in farm size and found that, in some cases, farm size increased in recent decades. For instance, in Wicomico County, the average farm size increased from 116 acres in 1978 to 173 acres by Similarly, in Caroline County, the average farm size increased from 183 to 227 from 1978 to The most profound case of a change in the structure of farmland among rural counties occurred in Worcester County where the average size of farms increased by 150 acres from 1978 to Looking closer at - 6 -
14 Worcester County, there has been an increase in the percentage of farms between 10 and 50 acres in size as well as an increased in the percentage of farms 1,000 acres or more in size. Small farm producers are important in Worcester County. However, the county has also witnessed increased importance of large farm production as the percent of farms over 1,000 acres increased from 4 percent in 1982 to 10 percent in These changes in farm size indicate more profound changes in the nature of farming in Maryland. On the one hand, there is increased importance in large farm production while, on the other hand, farming is adapting to urban development with increased reliance on small farm production and recreational farming that accomdates the urban consumer. Land cover change and fragmentation of land classification types Chapters Two and Five show a clear pattern of overall population, housing and employment growth and decentralization to non-metropolitan areas. In Chapter Six and Seven, we performed more detail analyses in Montgomery and Frederick counties to determine the affect of this growth and decentralization on agricultural land and open space. To analyze these effects, we performed an object based classification of land cover for Montgomery and Frederick Counties for the years 1986, 1995 and In this analysis, we fused remote sensing data and tax assessment data to obtain a more accurate assessment of the extent of developed land over time. Figures 6.2, 6.3 and 6.4 are maps of the results of our land classification over multiple time periods. Our analysis found evidence of urban encroachment of agricultural/open - 7 -
15 and forested land in both Frederick and Montgomery counties. According to our analysis, Montgomery County lost a total of 20,884 acres of agricultural/open land and 15,003 acres of forested land from 1986 to During this same period, the amount to developed land grew by 32,122 acres, 11,509 acres of low density development and 20,613 acres of high-to-medium density development. There was more high-to-medium than low density development in Montgomery from 1986 to 2001, suggesting the possibility of in-fill development over this time period; and the county lost more agricultural/open land than forest during this period. Frederick County lost a total of 14,744 acres of agricultural/open land and 11,243 acres of forested land from 1986 to During this same period, the county gained 25,809 acres of developed land, 12,475 acres of low density development and 13,334 acres of high-to-medium density development. As with Montgomery County, there was more high-to-medium density development than low-density development from 1986 to This again suggests the likelihood of in-fill development. Frederick County lost more agricultural/open land than forest to urban development. Development in Frederick County occurred largely along major roads and, particularly around towns that line I-70. Development in Montgomery County consisted of in-fill development of previous existing low density development and that the expansion of low density development along the Potomac River and around towns such as Damascus and Germantown
16 Examining these land classifications closer, we found evidence of fragmentation of forested and agricultural/open land and the consolidation of developed areas in parts of Montgomery and Frederick counties. The location of these areas is displayed in the maps in Figure 6.7, Figure 6.8 and Figure 6.9 in Chapter Six. Influences on location of future growth and its implications We developed a statistical model to determine the conditions that influence a parcel s change from agricultural to residential use. The results of our analysis point to the significance of certain variables in influencing land use change from agricultural to urban use. Our findings suggest that the smaller an agricultural parcel, the more likely it will change to urban use; the closer an agricultural parcel to non-agricultural parcels, the more likely it will change to urban use; the closer an agricultural parcel is to the interstate exit, the more likely it will change to urban use; and the less agriculturally productive a parcel is, the more likely is will change to urban use. Since a change in the status of an agricultural parcel is a function of its closeness to highway exits, it is important that land conservation policy and transportation policy work together to optimize the preservation of valuable farmland. Also, since a shift in land use is likely for agricultural parcels near residential parcels or for small agricultural properties, preventing farm fragmentation by residential development is paramount. Maintaining a consolidation of valuable agricultural parcels is the best strategy for preservation of farmland
17 Using the results of our statistical analysis, we mapped probability scores for agricultural parcels in Frederick County. This map is displayed in Figure E.1. Figure E.1 Map of probability land will change from agricultural to urban use
18 Areas in Frederick County most likely to stay in agricultural production are in the northeastern and southwestern portions of the county. The several reddish-orange pockets spread throughout the middle of the county are most likely to shift to residential land uses. There are a number of hotspots for growth as indicated by the areas of red or deep pink. The value of this map for land use policy is threefold. First, where reddish areas fall into Priority Funding Areas, market forces will encourage development where the county government wants this growth to go. Much of this land area is around Frederick City and around some smaller towns or rural villages in the county. We predict that the agricultural properties within these areas will continue to be developed. Second, in those locations of high probability that fall outside the Priority Funding Areas, government intervention will be required to keep such areas in agricultural use. As this map indicates, there are such areas, particularly in the southern part of the county. These parcels, if not already protected, need appropriate land use controls such as agricultural easements to prevent continued urban encroachment. Thirdly, when the red colored parcels fall in areas deemed environmentally sensitive, the County should pay attention to be sure the appropriate land use controls are in place to keep these areas from turning to residential developments. The results of our analysis indicate that left to market forces, all these reddish areas will transition from agriculture to residential use
19 CHAPTER ONE INTRODUCTION Maryland has witnessed tremendous changes in population, economy and landscape in recent decades. This study reports on these, and examines the conditions that encourage urbanization and growth to occur in specific locations in the state. There are three primary objectives outlined. First, we examine and describe the transformation of population, housing economy and agriculture in Maryland counties from 1970 to 2000, with some references to future projections. Second, using innovative methodologies, we measure the loss and fragmentation of agricultural land over three time periods 1986, 1992 and 2001 in Frederick and Montgomery counties. Third, we identify the location of potential growth resulting from the conversion of agricultural land into urban development in the transitional county of Frederick. We also explore the policy and planning implications of the results of this analysis for Frederick County. Approach and organization of the report This report uses a number of different approaches and methodologies to describe and analyze the processes and results of urban growth in Maryland. First, we use an analytical approach to demonstrate changes in the population, economic structure, and agriculture economy at a broad county level scale. We analyze and describe changes in the local economies and population structure of both rural and urban counties. In this case, non-metropolitan counties are loosely defined as rural counties and metropolitan counties, urban counties
20 More precisely, metropolitan or urban counties are part of a metropolitan statistical area. Under the 2000 standards, the U.S. Bureau of the Census defines metropolitan statistical areas as having a central county or counties with an urbanized area of at least 50,000 people, plus adjacent outlying counties having a high degree of economic integration with the central county, as measured through commuting patterns. In the case of Maryland, metropolitan counties are those counties that are part of the Washington- Baltimore consolidated metropolitan statistical area (CMSA). Non-metropolitan counties are those counties that are outside the metropolitan area. Metropolitan and nonmetropolitan counties are listed in Table 1.1. Table 1.1 Metropolitan and non-metropolitan counties in Maryland, 2000 Metropolitan Counties Anne Arundel County Baltimore City Baltimore County Calvert County Carroll County Charles County Frederick County Harford County Howard County Montgomery County Prince George's County Queen Anne's County Washington County Non-Metropolitan Counties Allegany County Caroline County Cecil County Dorchester County Garrett County Kent County Somerset County St. Mary's County Talbot County Wicomico County Worcester County The local populations, agriculture and economic growth of these counties are explored and compared. This examination is outlined in Chapters Two, Three and Four of the report. Next, using Landsat imagery, we measured the extent of urban development within Montgomery and Frederick counties, performing an object based classification of land
21 cover for years 1986, 1995 and Others have used Landsat imagery to determine the extent of development in the Maryland region. Our methodology is novel in that it integrates MD Property View data with Landsat imagery in an object-oriented classification. Details on the methods as well as the results of this land classification are outlined in Chapter Six. Third, we develop a logit probability model to determine the conditions that influence a parcel's change from agriculture to residential use in Frederick County. We spatially analyzed the model results by mapping the probability a parcel would change from agricultural to a residential use over the next four years to assuming conditions such as road infrastructure remains constant. The results and policy and planning implications of this model are outlined in Chapter Seven
22 CHAPTER TWO MARYLAND S CHANGING POPULATION Maryland is the nineteenth most populated state in the United States. Its population has increased by 35 percent in the past thirty years. In 1970 the population was 3.9 million, increasing to 5.3 million by 2000, an addition of almost 1.4 million people. Current projections suggest that Maryland s population will continue to grow to 6.7 million by Household formation, a driving force behind land consumption and residential development, is following a similar path. The total number of households in Maryland was 1.1 million in 1970 compared to almost two million in The number of households is expected to increase to 2.6 million by Population change As Table 2.1 indicates, all counties in Maryland except Baltimore City and Allegany County experienced population increases since As to be expected, many metropolitan counties in the Baltimore and Washington DC regions experienced the highest growth in population in the state in the last three decades. From 1970 to 2000, these metropolitan counties experienced a total increase of more than 1.2 million people. This trend is likely to continue with the metropolitan counties projected to increase by almost 1.2 million people by Of these counties, Montgomery County witnessed the largest increase of 350,000 people from 1970 to 2000, a 67 percent increase. Recent figures suggest this county will grow to more than 1.1 million by Projections suggest that Maryland will increase in population and employment as a result of the federal Base Realignment and Closure (BRAC) process. As much as possible, our projection figures are based on recent analyses of the BRAC impacts
23 Anne Arundel County and Howard County experienced population increases of more than 192,000 and 185,000 people respectively. Combined, the counties in Southern Maryland witnessed an increase of more than 165,000 people since the 1970s, the second largest growth in population regionally. Howard County witnessed the largest percentage population change 300 percent from 1970 to 2000; followed not far behind by Calvert County at 261 percent and Charles County at 153 percent. Table 2.1 Population change in Maryland, 1970 to 2000 Metropolitan Counties (%) Anne Arundel 297, , ,117 65% Baltimore City 905, , ,605-28% Baltimore 621, , ,215 21% Calvert 20,682 74,563 53, % Carroll 69, ,897 81, % Charles 47, ,546 72, % Frederick 84, , , % Harford 115, , ,212 89% Howard 61, , , % Montgomery 522, , ,532 67% Prince George's 660, , ,948 21% Queen Anne's 18,422 40,563 22, % Washington 103, ,923 28,094 27% Total 3,529,584 4,750,159 1,220,575 35% Non-Metropolitan Counties (%) Allegany 84,044 74,930-9,114-11% Caroline 19,781 29,772 9,991 50% Cecil 53,291 85,951 32,660 61% Dorchester 29,405 30,674 1,269 4% Garrett 21,476 29,846 8,370 39% Kent 16,146 19,197 3,051 19% Somerset 18,924 24,747 5,823 31% St. Mary's 47,388 86,211 38,823 82% Talbot 23,682 33,812 10,130 43% Wicomico 54,236 84,644 30,408 56% Worcester 24,442 46,543 22,101 90% Total 392, , ,512 39% The non-metropolitan counties also experienced population increases. More than 150,000 people were added to non-metropolitan counties from 1970 to 2000, a population
24 growth rate of almost 40 percent. In raw numbers, St. Mary s County experienced the largest increase in population with an addition of almost 39,000 people. This was followed by Cecil County s population increase of more than 32,000 from 1970 to The percent increase in population is substantial in many traditionally rural counties. For instance, Worcester County, beginning with a population of a little over 25,000 in 1970, almost doubled in population by Similarly, St. Mary s County experienced a population increase of 80 percent. Changes of this nature puts a strain on the agricultural landscape, natural resources and local economies of rural counties, the various aspects of which are explored in following chapters. Household formation Household formation, a driver of housing development, has been substantial in many counties in Maryland, particularly in the metropolitan counties. As Table 2.2 demonstrates, overall, metropolitan counties experienced an increase of more than 700,000 households from 1970 to 2000, a growth rate of 68 percent. Montgomery County witnessed the largest increase in the number of households. From 1970 to 2000, the number of households in Montgomery County increased by almost 168,000. Baltimore County had the second largest increase in the number of households, adding more than 114,000 households from 1970 to Anne Arundel and Prince George s counties were not far behind with an increase in households of more than 97,000 and 93,000 respectively between 1970 and
25 In terms of percentage increase in households, Howard County had the largest percentage increase of 433 percent from 1970 to Calvert County was not far behind with a percentage increase of almost 360 percent. Charles County more than doubled the number of households and Frederick County experienced a 180 percent increase in households from 1970 to Table 2.2 Household Formation by County, 1970 to 2000 Metropolitan Counties Anne Arundel 81, ,670 97, % Baltimore City 289, ,996-31,353-11% Baltimore 184, , ,987 62% Calvert 5,540 25,447 19, % Carroll 19,623 52,503 32, % Charles 12,098 41,668 29, % Frederick 24,926 70,060 45, % Harford 32,026 79,667 47, % Howard 16,880 90,043 73, % Montgomery 156, , , % Prince George's 192, ,610 93,647 49% Queen Anne's 5,795 15,315 9, % Washington 32,463 49,726 17,263 53% Total 1,054,327 1,772, ,820 68% Non Metropolitan Counties Allegany 27,857 29,322 1,465 5% Caroline 6,360 11,097 4,737 74% Cecil 14,242 31,223 16, % Dorchester 9,725 12,706 2,981 31% Garrett 6,315 11,476 5,161 82% Kent 5,109 7,666 2,557 50% Somerset 5,945 8,361 2,416 41% St. Mary's 12,100 30,642 18, % Talbot 7,914 14,307 6,393 81% Wicomico 17,170 32,218 15,048 88% Worcester 7,869 19,694 11, % Total 120, ,712 88,106 73% In the rural, non-metropolitan counties of Maryland there has also been considerable household formation and growth, with the addition of more than 88,000 households from 1970 to The rate of household formation of 73 percent for non-metropolitan counties is 5 percent more than the household growth rate in metropolitan counties
26 Worcester County witnessed the largest percentage increase at 150 percent, while Cecil County saw the largest number increase at almost 17,000 households. Wicomico County is not far behind, with an increase of more than 15,000 households from 1970 to This increase in households is happening across most counties of Maryland, even in areas of population decline (i.e. Allegany County). As Table 2.3 indicates, there will be an increase in household formation in the future. Overall, the number of households is expected in increase by more than 550,000 in the metropolitan counties of the state by The number of households in nonmetropolitan counties is expected to increase from 208,000 in 2000 to 317,000 by Among metropolitan counties, Charles and Frederick counties stand out. The number of households in Charles County is expected to increase by almost 36,000 by 2030, an 86 percent increase. In Frederick County, the number of households is projected to increase by more than 57,000 by 2030, an 82 percent increase. Among non-metropolitan counties, the highest rates of household formation are in St. Mary s and Cecil counties. In St. Mary s, it is anticipated that the number of households will increase by almost 29,000 by In Cecil County, projections indicate that the number of households will almost double by Household formation has a direct effect on land consumption as it leads to substantial housing development and a subsequent loss of agricultural and forested land. In the past, the doubling and tripling of households puts a direct strain on natural resources and agricultural land, especially in the traditional rural counties of Maryland. Household
27 projections suggest this is likely to continue into the future, changing the nature of land use throughout the state. Table 2.3 Household formation projections to 2030 Metropolitan Counties Anne Arundel 178, ,225 49,555 28% Baltimore City 257, ,950 7,954 3% Baltimore 299, ,700 46,823 16% Calvert 25,447 38,625 13,178 52% Carroll 52,503 71,900 19,397 37% Charles 41,668 77,650 35,982 86% Frederick 70, ,575 57,515 82% Harford 79, ,300 37,633 47% Howard 90, ,600 37,557 42% Montgomery 324, , ,310 36% Prince George's 286, ,850 93,240 33% Queen Anne's 15,315 25,125 9,810 64% Washington 49,726 75,875 26,149 53% Total 1,772,147 2,324, ,103 31% Non Metropolitan Counties Allegany 29,322 30, % Caroline 11,097 19,125 8,028 72% Cecil 31,223 61,825 30,602 98% Dorchester 12,706 17,725 5,019 40% Garrett 11,476 14,100 2,624 23% Kent 7,666 10,075 2,409 31% Somerset 8,361 10,500 2,139 26% St. Mary's 30,642 59,325 28,683 94% Talbot 14,307 18,725 4,418 31% Wicomico 32,218 47,175 14,957 46% Worcester 19,694 28,500 8,806 45% Total 208, , ,588 52% Population density Population density, an important indicator of the competition for space in the environment, has also changed dramatically in recent decades. As to be expected, the densest counties in Maryland are the metropolitan counties of Baltimore City, Montgomery, Prince George s, Baltimore, Anne Arundel and Howard counties. As Table 2.4 indicates, Montgomery County had the largest population density increase of all Maryland counties, increasing by almost 600 people per square mile from 1980 to
28 2000. Howard County, while having a relatively low population density in 2000 when compared to other metropolitan counties, had a density increase of 511 people per square a mile from 1970 to Table 2.4 Population density by county, 1980 to 2000 Metropolitan Counties to 2000 Anne Arundel 886 1,027 1, Baltimore City 9,798 9,109 8,058-1,739 Baltimore 1,097 1,156 1, Calvert Carroll Cecil Charles Frederick Harford Howard Montgomery 1,169 1,531 1, Prince Georges 1,366 1,500 1, Queen Anne s Washington Non-Metropolitan Counties to 2000 Allegany Caroline Dorchester Garrett Kent Somerset St. Mary s Talbot Wicomico Worcester The non-metropolitan rural counties also experienced an increase in population density. Wicomico County has 224 people per square mile, the highest population density of all non-metropolitan counties. This county also experienced the highest increase in population density, experiencing a density increase of 54 people per square mile from 1980 to

29 Figure 2.1 illustrates the population density change from 1990 to 2000 by census tract, providing a more detailed picture of density increases, particularly in the Baltimore/Washington corridor, around Baltimore city, Washington DC, and in parts of Southern Maryland. Figure 2.1 Change in Population Density by Census Tract in Maryland, 1990 to 2000 Areas between Frederick City and Washington DC also increased in density, much of it following Interstate 270 and nearby. In fact, population density increases have generally followed major highways and roads with places such as Aberdeen and Havre de Grace further north along I-95, developing rapidly. Highway access and population growth are intertwined, and residential development occurs along major transportation routes
30 Population diversification The population of Maryland has become more diverse, particularly in the last two decades. One aspect of this diversification is increasing minority suburbanization. There was an increase in the number of African American and ethnic populations, particularly in the suburban counties of Baltimore and Washington DC. There were total of 1.4 million African Americans living in Maryland in 2000, 28 percent of the total population. From 1990 to 2000, the number of African Americans in the state increased by more than 280,000. In 2000, 95 percent of the African American population lived in the metropolitan counties, and the remaining 5 percent in the non-metropolitan or rural counties. More than 1.3 million African Americans or 29 percent of the metropolitan population lived in the metropolitan counties of Maryland. As Table 2.5 indicates, since 1990, the metropolitan counties in Maryland have witnessed an increase of more than 278,000 African Americans. Increases were significant for the suburbs of Maryland. The percentage of African Americans living in the suburban counties of Prince George s and Montgomery was almost 63 percent and 15 percent respectively in Twenty percent of Baltimore County s population and more than 14 percent of Howard County was African American in While the African American population of the central city of Washington DC declined from 66 percent to 59 percent from 1990 to 2000, the suburban counties of Frederick, Montgomery and Prince George s experienced an increase from 28 percent African
31 American in 1990 to almost 35 percent African American in While the percentage of the African American population in Baltimore City increased in the 1990s, the number of African Americans decreased from 435,768 to 418,951 as the city lost African American as well as white populations. Meanwhile, the number of African Americans in the suburban counties of Baltimore and Howard increased from 107,000 in 1990 to more than 187,000 in 2000, and in Baltimore County alone the African American population increased by over 66,000, an increase of more than eight percent in the 1990s. Table 2.5 African American population by county, 1990 to 2000 Metropolitan Counties Black Black Black Black (%) (%) Anne Arundel 50, , Baltimore City 435, , Baltimore 85, , Calvert 8, , Carroll 2, , Charles 18, , Frederick 8, , Harford 15, , Howard 22, , Montgomery 94, , Prince George's 367, , Queen Anne's 3, , Washington 7, , Total 1,119, ,398, Non-Metropolitan Counties Black Black Black (%) 2000 Allegany 1, , Caroline 4, , Cecil 3, , Dorchester 8, , Garrett Kent 3, , Somerset 8, , St. Mary's 10, , Talbot 5, , Wicomico 16, , Worcester 7, , Total 70, , Black 2000 (%)
32 Other metropolitan counties experienced an increase in African American population. Combined, the metropolitan counties in Southern Maryland experienced an increase of almost 15,000 African Americans in the 1990s, bringing the total African American population to more than 41,000 by Charles County witnessed the largest increase, jumping from an African American population of 18,419 to one of 31,411. The African American population of rural Maryland was almost 79,000 in 2000, 14 percent of the total rural population. There was an addition of almost 9,000 African Americans in rural Maryland in the 1990s, maintaining a stable percentage of African Americans over the decade. A substantial percentage of the population of the Lower Eastern Shore counties of Somerset, Wicomico, and Dorchester were African American in By the end of the 1990s, forty one percent of Somerset County s population was African American followed by 30 percent of Dorchester County s population. African Americans have a long history of settlement in the Eastern Shore of Maryland, back since the times of slavery and beyond. Although in raw numbers, the increases in African American population can be substantial, in some rural counties they declined in percentage terms. For instance, the African American population decreased by almost 5 percent from 1970 to 2000 in Worcester County. In Caroline, Cecil, Kent, Talbot, and Worcester counties the total population growth outpaced the growth in African American population
33 Another aspect of diversification in Maryland is immigration. This is a driver of population growth in the state 2. In recent decades, the foreign born population has increased dramatically. The number of foreign born residents in Maryland was less than 125,000 in 1970, quadrupling to more than 518,000 by By 2002, Maryland ranked tenth among states in numbers of immigrants admitted. Most immigrants entering the Maryland in recent decades settled in the suburban counties of Montgomery and Prince George s. More than half of all new immigrants in the 1980s settled in Montgomery County, and three quarters of new immigrants during this period settled in Montgomery and Prince George s counties combined. In the 1990s, there was a slight shift in immigrant settlement patterns to the suburban counties of Baltimore, Howard, Anne Arundel, and Frederick counties. During the 1990s, almost 11 percent of new immigrants settled in Baltimore County, bringing the number of foreign born residents in the county to almost 54,000 by Howard County attracted five percent of entering immigrants in the 1990s for a total of more than 28,000 foreign born residents by However, as Figure 2.2 indicates, despite this change in settlement patterns, Montgomery County still had the largest number or immigrants more than 230,000 in 2000, followed closely behind by more than 110,000 foreign born in Prince George s County that same year. 2 According to a recent analysis by the Maryland Department of Planning, the influx of immigrants to the state in the 1990s accounted for almost 45 percent of Maryland s population gain during this time period. Their analysis indicates that more than 89 percent of population growth during the 1990s in Montgomery County is explained by immigration. Similarly, 71 percent of the population increase in Prince George s County is due to the influx of immigrants
34 In Howard County, more than half of all foreign born in 2000 were Asian. Similarly, 38 percent of the foreign born in Montgomery County were from Asia. Montgomery County also had an equal percentage of Latin American immigrants, and almost half of the foreign born in Prince George s County were Latin American in Among the Latin American immigrants in the Baltimore/Washington region, the majority are from El Salvador, Mexico and Guatemala while Asians tend to come from China, Korea and India. The regional economy of the Baltimore/Washington corridor is highly attractive to the foreign born. Many of the high-skilled immigrants are from Asia, working in the high-technology sector while lower-skilled workers tend to emigrate from Latin American. Montgomery Prince George's Baltimore Baltimore City Howard Anne Arundel Frederick Harford Charles Wicomico Carroll Washington St. Mary's Calvert Cecil Worcester Talbot Queen Anne's Allegany Caroline Somerset Dorchester Kent Garrett , , , , ,000 Figure 2.2 Foreign born by county, 1990 and
35 In- and out-migration of population Population change is partly the result of a flow into and out of the state. To further tease out the sources of in-migration for each county, we examined population movement in the state from 1995 and There was a tremendous amount of population movement during this time period with more than 1.6 million moving in, out and among the counties of the state. As Table 2.6 indicates, from 1995 to 2000, 642,459 people moved into Maryland and 514,875 moved out of the state for a net migration of more than 127,584 people. Table 2.6 In- and out-migration in metropolitan and non-metropolitan Maryland, 1995 to 2000 Total Inmigration Inmigration (other states) Inmigration abroad In-migration (surrounding states) Maryland 642, , , ,113 Metropolitan 581, , , ,269 Non-metropolitan 60,648 55,471 5,177 26,844 Total Outmigration Outmigration (other states) Outmigration abroad Outmigration (surrounding states) Maryland 514, , ,687 Metropolitan 465, , ,762 Non-metropolitan 49,579 49, ,925 Netmigration Netmigration (other states) Netmigration abroad Netmigration (surrounding states) Maryland 127,584-19, ,307 9,426 Metropolitan 116,515-25, ,130 6,507 Non-metropolitan 11,069 5,892 5,177 2,919 In our analysis of in-migration, we found that three quarters of all in-migrants to Maryland moved from other states and the remaining quarter from abroad. Of the interstate in-migrants, forty percent were from Maryland s surrounding states. Between
36 and 2000, there were a total of 514,875 people who moved out of Maryland, with all of them moving to other parts of the United States. A third of all out-migrants moved to surrounding states. In fact, more people moved out of Maryland to other states than vice versa as Maryland witnessed a net loss in inter-state migrants of almost 20,000 people. This net loss was offset by the net gain of 147,307 people from abroad from 1995 to Also, the inter-state net loss was to faraway states since Maryland had a net gain of almost 9,500 people from surrounding states. The sources of migration gains in Maryland were in-migration from abroad. There was net out-migration at the domestic level despite more in-migrants than out-migrants from surrounding states. Analyzing within Maryland, a similar picture emerges for the metropolitan counties. To begin, in-migration to Maryland was mostly to metropolitan areas with 89 percent of all in-movers migrating to metropolitan counties between 1995 and The majority of the population from abroad to Maryland moves to metropolitan counties, with less than four percent of these movers entering rural counties. Foreign migration is an important source of migration gains for metropolitan counties with 142,130 migrants from aboard entering between 1995 and Three quarters of in-migrants to the metropolitan counties came from other states. However, there was a net loss in domestic migration for metropolitan counties with a loss 25,000 people to other states. Rural counties, on the other hand, experienced a net migration gain from both domestic and foreign migration. Domestic migration gains from 1995 to 2000 for rural Maryland
37 were 5,892, a similar statistic to gains of 5,177 for foreign migration. Almost half of all domestic migration gains for rural counties were from surrounding states. Contributions to population in rural Maryland came equally from domestic migration and migration from abroad. Migration also occurs internally within Maryland. Many counties in Maryland attracted populations from other counties between 1995 and More than 465,100 Marylanders moved internally within the state over this five year period. We found that more than 390,000 people or 44 percent of metropolitan out-movers moved internally within the metropolitan counties during this same time period. Meanwhile, more than 33,000 or 3.8 percent of all metropolitan county out-movers migrated to non-metropolitan counties in Maryland. At the same time, more than 26,000 or a quarter of rural county out-movers moved into metropolitan counties, and almost 13,500 or 15 percent moved internally within rural or non-metropolitan areas of Maryland. There were more residents of rural counties who moved into metropolitan counties than vice versa. Almost four percent of the outmigrants of metropolitan counties moved to rural Maryland from 1995 to 2000 while 44 percent of the out-movers of metropolitan counties moved internally within the metropolitan area. An analysis of migration patterns at a county level enables us to determine the sources of migration gains and losses for Maryland. We found that all of the counties, with the exception of Somerset County and Baltimore City, had overall migration gains but that
38 the sources of these gains varied. Examining net migration gains for each county, we found an important contributor for many of the metropolitan counties was migration from abroad. Migration gains from other states were less important for metropolitan counties, with the exception of Prince George s County which has net domestic migration gains of almost 18,000 people. Montgomery County had the largest net migration gains from abroad with 55,967 in-migrants from outside the U.S. between 1995 and In fact, if it were not for in-migration from abroad, Montgomery County would have a net migration loss since there were more out-movers to other parts of Maryland and other states than in-movers from these areas to the county between 1995 and During this same time period, almost 60,000 people in-migrated to Prince George s County from states surrounding Maryland, with more than 20,000 people in-migrating from these states than out-migrating to them. Most other metropolitan counties had net migration losses or minimal net migration gain from other states, surrounding or otherwise. Aside from foreign migration, the source of net migration gains for most metropolitan counties was from other counties in Maryland. For instance, Baltimore County had a net migration gain from metropolitan counties of more than 46,000 people. The in-migration of more than 77,000 people from Baltimore city accounts for the importance of metropolitan level net migration gains for Baltimore County, and also explains the netmigration loss experienced by the City from 1995 to
39 An interesting finding in our analysis of net migration is the fact that few metropolitan counties experienced net migration gains from rural counties in Maryland. For counties such as Prince George s and Harford there was substantially more out-migration to rural counties than in-migration of rural populations between 1995 and For instance, there were more than 2,700 out-movers from Harford County to the Upper Eastern Shore county of Cecil but less than 1,000 moving the opposite direction. Table 2.7 Sources of net migration gains and losses for Maryland counties, 1995 to 2000 Rural counties Total Net All Metro Rural Other Surrounding Migration Maryland Counties Counties States states Abroad Allegany 1, , Caroline 806 1,058 1, Cecil 4,486 2,573 2, ,341 1, Dorchester Garrett Kent Somerset -6,000-6,806-6, St Mary's 6,284 2,060 2, ,815 1,484 1,409 Talbot 1, Wicomico 3,980 2,864 2, ,144 Worcester 4,074 3,238 2, Metropolitan Total Net All Metro Rural Other Surrounding Counties Migration Maryland Counties Counties States states Abroad Anne Arundel 14,245 8,532 10,971-2,439-4, ,384 Baltimore City -79,567-73,418-73, ,805-6,738 12,656 Baltimore 59,456 45,113 46,474-1, ,359 14,379 Calvert 7,312 5,485 5, ,135 1, Carroll 6,521 9,927 10, ,561-2,691 1,155 Charles 6,029 4,870 6,371-1, ,081 Frederick 11,755 9,178 9, ,601 Harford 10,367 8,325 10,570-2, ,793 3,011 Howard 19,126 11,434 11, ,602 Montgomery 28,342-16,262-14,641-1,621-11,363 1,689 55,967 PG 15,091-33,034-30,475-2,559 17,658 19,505 30,467 Queen Anne s 3,809 3,391 4, Washington 6,900 9,330 3,139 6,191-3,238-1, A different picture emerges when analyzing migration patterns from 1995 and 2000 for the rural counties. The majority of net migration gains for rural Maryland are from the
40 metropolitan counties in the state. This is especially true for St. Mary s, Wicomico and Worcester counties with net migration gains from metropolitan counties of 2,060, 2,864 and more than 32,000 respectively. St. Mary s County also experienced substantially inmigration from other states without losing population to these states. Half of St. Mary s County net migration gains from other states were from surrounding states. There were also substantial net migration gains from abroad for rural counties from 1995 to St. Mary s and Wicomico counties experienced net migration gains from abroad of more than 1,400 and 1,200 respectively from 1995 to Summary of analysis of population change From 1970 to 2000, Maryland s population increased by 1.4 million people. Current projections suggest that Maryland s population will increase by an additional 1.4 million by The largest population increases occurred in Montgomery, Anne Arundel, Howard and Prince George s counties. The non-metropolitan counties also experienced population increases with the addition of more than 150,000 people from 1970 to Household formation has also increased in Maryland during this time period. The number of households, particularly metropolitan counties, has increased in large numbers although the rate of household formation in non-metropolitan counties is higher than in metropolitan counties. Projections indicate that metropolitan counties, particularly Charles and Frederick, are likely to witness large increases in the number of households by An analysis of population density indicates that much of the growth has followed major highways and roads, and around existing urban centers in the state. Much of the population growth in the state is driven by foreign immigration. In terms of
41 domestic migration patterns, there was an in-migration of populations from surrounding states, particularly into Prince Georges County. Analyzing the movement of people within Maryland, few metropolitan counties experienced net migration gains from rural counties. In fact, for counties such as Prince George s and Harford there was substantially more out-migration to rural counties than in-migration of rural populations between 1995 and
42 CHAPTER THREE HOUSING DEVELOPMENT IN MARYLAND To keep pace with population growth and household formation, housing development has occurred at a rapid pace in Maryland, particularly in the last decade. In 1970, there were almost 1.3 million housing units in the state. By 2000, an additional 895,469 housing units were built for a total of 2.1 million, almost a 72% increase. In the 1990s, Maryland witnessed an increase of more than 250,000 units, and the number of housing units per square mile increased from units in 1990 compared to units in Table 3.1 Housing development in Maryland counties, 1970 and 2000 Metropolitan Counties Anne Arundel 89, ,937 97, % Baltimore City 305, ,477-5,053-2% Baltimore 190, , ,052 65% Calvert 7,932 27,576 19, % Carroll 20,175 54,260 34, % Charles 13,577 43,903 30, % Frederick 26,292 73,017 46, % Harford 33,487 83,146 49, % Howard 18,096 92,818 74, % Montgomery 161, , , % Prince George's 200, , ,741 51% Queen Anne's 6,841 16,674 9, % Washington 34,585 52,972 18,387 53% Total 1,108,248 1,882, ,276 70% Non Metropolitan Counties Allegany 29,660 32,984 3,324 11% Caroline 7,033 12,028 4,995 71% Cecil 16,421 34,461 18, % Dorchester 11,008 14,681 3,673 33% Garrett 8,683 16,761 8,078 93% Kent 6,300 9,410 3,110 49% Somerset 14,214 34,081 19, % St. Mary's 6,996 10,092 3,096 44% Talbot 9,070 16,500 7,430 82% Wicomico 18,430 34,401 15,971 87% Worcester 13,751 47,360 33, % Total 141, , ,193 86% Figures for this table are from the U.S. Bureau of the Census
43 Much of the housing development occurred in metropolitan counties. From 1970 to 2000, these counties added almost 775,000 new housing units. The Baltimore region witnessed substantial housing development in the last three decades, particularly in Carroll, Queen Anne s and Howard counties. These counties combined added almost 120,000 housing from 1970 to In raw numbers, housing development in Montgomery, Prince George s and Baltimore counties far outpaces other counties in the metropolitan area. In Montgomery County alone, more than 173,000 housing units were built between 1970 and During this period, the Southern Maryland counties of Charles and Calvert built almost 50,000 new houses, with the majority of these housing units built in Charles County. The percentage change in housing units from 1970 to 2000 in counties of the Baltimore- Washington and Southern Maryland regions was dramatic. For instance, Howard County experienced a 400 percent increase in the number of housing units during this period. This is followed by a 250 percent increase in Calvert County; a 225 percent increase in Charles County; and a 200 percent increase in Frederick County. Housing development also occurred in the non-metropolitan counties of Maryland Between 1970 and 2000, these rural counties added more than 121,000 housing units. Somerset Cecil and Cecil counties witnessed substantial development, more than doubling their housing stock from 1970 to During this same period, the number of housing units in Wicomico County increased by almost 16,000 units
44 Figure 3.1 illustrates the extent of residential development Worcester County. Particularly noticeable is the extent of development in the Salisbury area and along the Ocean City shoreline. According to the 2004 tax assessment data, Worcester County added more than 38,000 new housing units, including individual condos, from 2000 to Figure 3.1 Residential development in Worcester County

45 The housing development in Worcester County is prompted by the continuing expansion of Ocean City as a tourism hub and location of vacation homes. Similar to Ocean City, many one-time rural villages in Maryland expanded in recent decades. Figure 3.2 illustrates the places in Maryland that are fast growing or important urban centers or, in some cases, edge cities. Figure 3.2 Examples of major places in Maryland These places generally fall along major transportation routes, with many fast-growing towns developing along Route 50 to Ocean City, I-70, I-270, I-95, and Route 68 going west. We examined housing development from 1990 to 2000 in a number of these places, some of which are labeled in the above map. We focused on change in the historic and new urbanizing cores on the outer reaches of metropolitan counties and in the more rural counties of the state. As Table 3.2 indicates, some fast-growing towns such as
46 Myersville in Frederick County and Stevensville along Route 50 in Queen Anne s County more than doubled their housing stock in ten years. Similarly, places such as Bel Air, Mount Airy, Odenton and Thurmont are expanding. Table 3.2 Housing development in urban cores in Maryland, 1990 to to 00 Percent change Hagerstown 16,361 17, % Columbia 30,651 35,289 4,638 15% Westminster 5,469 6,704 1,235 23% Gaithersburg 16,059 20,562 4,503 28% Frederick 16,611 22,052 5,441 33% Bowie 13,066 18,622 5,556 43% Olney 7,267 10,429 3,162 44% Bel Air South 10,296 15,384 5,088 49% Charlestown % Waldorf 5,038 7,821 2,783 55% Elkridge 5,581 8,733 3,152 56% Thurmont 1,387 2, % Fallston 1,828 2,893 1,065 58% Crofton 4,718 7,616 2,898 61% Sykesville 870 1, % Mount Airy 1,313 2, % Hampstead 1,110 1, % Ocean Pines 4,184 7,117 2,933 70% Bel Air North 5,116 8,883 3,767 74% Pittsville % North Beach % Odenton 4,378 7,902 3,524 80% Owings Mills 4,102 9,437 5, % Myersville % Chevy Chase % Linganore 1,506 4,237 2, % Eldersburg 3,301 9,399 6, % Stevensville 658 2,172 1, %
47 Our analysis of land cover change within the transitioning counties of Montgomery and Frederick outlined in Chapter Six similarly illustrates the importance of small urban centers to growth. Land cover change, particularly the expansion of low-density development, moves outwardly from small towns within urbanizing counties. This growth puts tremendous strain on water resources, transportation networks and local government services.. The development of these rural towns, edge cities, and suburbs has a profound effect on surrounding areas as their boundaries expand, and incoming migrants are attracted by employment, amenities and service provision. The formation of these urban centers, particularly on the fringe and in rural areas often results in a loss of farmland and open space; and the subsequent expansion of the road network further encourages additional housing and employment. Summary of analysis on housing development Housing development has occurred at a rapid pace in Maryland in recent decades. This development occurred in metropolitan counties, but there is tremendous development in rural counties. In some cases, such as housing development in Ocean City, the results relate specifically to the development of tourist destinations. Housing expansion also occurred in many smaller urban centers throughout the state. The development of these areas has tremendous consequences for the loss of farmland and open space in Maryland
48 CHAPTER FOUR MARYLAND S ECONOMY In recent decades, there were a number of marked changes to the economy in the Maryland that both fuel and reflect urban expansion in many parts of the state. Established and developing employment centers within the state were instrumental to spurring population growth, and while farming continues to be an important contributor to some local economies, this industry is not a major source of employment for the newly established population. In the following sections, we highlight major changes in the structure of the labor force, and the development of centers of employment particularly in the Central Maryland region. Employment change in Maryland Between 1969 and 2001, employment in Maryland grew from 1.6 million to 3.1 million workers, a job growth of more than 86 percent. As Figure 4.1 demonstrates, much of the employment growth in Maryland was in the service sector. This sector added almost 800,000 service jobs from 1969 to In 2000, there were more than 1.1 million service workers. By 2000, service employment accounted for more than a third of all employment in Maryland, compared to 20 percent in Maryland s closeness to Washington DC provides opportunities for government employment, particularly at the federal level. In 2000, more than half a million workers were employed in the government sector, an increase of more than 100,000 workers since
49 1969. Of these workers, more than 15,000 were employed in civilian federal government agencies, and more than 30,000 employed in state and local government agencies in State and local government employment accounted for ten percent and federal government employment five percent of total employment that year. 1,200,000 1,000, , , , , Farm employment Construction Manufacturing Retail trade Finance, insurance, and real estate Services Government and government enterprises Figure 4.1 Employment by industry in Maryland, 1969 to 2000 Examining further within sectors, employment in finance, insurance and real estate (FIRE) increased by almost 145,000 jobs from 1969 to 2000, with the FIRE workforce comprising eight percent of total employment in the state by The construction industry grew by more than 10,000 workers from 1969 to This industry accounted for six percent of total employment in 1969 and Retail trade, in 2000, had more than 500,000 workers, an increase of more than 238,000 workers since This sector
50 was 16 percent of total employment in both 1969 and Both retail trade and construction industry kept pace with the rising population. During this same period, the manufacturing and farming sectors experienced employment decline. Farming was not a major source of employment in 1969, and it has continued to decline in importance. In 1969, there were a little more than 28,000 farm workers. This figure declined by 9,000 workers by Employment in the manufacturing followed a similar trend with the loss of more than 28,000 workers in the last three decades. This sector comprised 17 percent of total employment in Maryland in 1969, declining to six percent by Overall the sectors of services, retail trade, and government far outweigh manufacturing and farming as sources of employment in the state. Employment change in metropolitan Maryland The pattern of job growth in the metropolitan counties is similar to the pattern of job growth for Maryland as a whole. As Figure 4.2 indicates, metropolitan counties witnessed large increases in employment in the FIRE and service sectors. Service employment more than tripled from 1969 to Currently, there are more than one million service workers in metropolitan Maryland. This sector is by far the most important employment sector, accounting for almost 40 percent of total employment within metropolitan counties. Among industrial sectors, employment in FIRE experienced the second largest percentage increase, rising by 133 percent from 1969 to In percentage terms, this
51 rate was followed closely behind by the construction sector which almost doubled in employed workers between 1969 and As a whole, metropolitan counties in Maryland lost manufacturing workers. This sector experienced a decline from a high of almost 260,000 workers in 1969 to almost 158,000 in As expected in the growth areas of metropolitan Maryland, farm employment declined. There were almost 17,000 farm workers in 1969, declining to more than 11,000 workers by A major employer among metropolitan counties is the government sector, employing almost 470,000 workers in 2000, or 17 percent of the metropolitan counties workforce. 1,200,000 1,100,000 1,000, , , , , , , , , , Farm employment Construction Manufacturing Retail trade Finance, insurance, and real estate Services Government and government enterprises Figure 4.2 Employment by industry in metropolitan Maryland, 1969 to
52 This is followed closely by retail trade. In 1969, there were 244,000 retail trade workers in the metropolitan counties in Maryland, increasing to more than 450,000 workers by Sixteen percent of workers in metropolitan Maryland were employed in retail trade in Table 4.1 Employment in Metropolitan Maryland, 2000 Metropolitan Counties, 2000 Percent of Metropolitan County Employment 2000 Percent of State Employment, 2000 Total employment 2,793, % 90% Farm employment 11,581 0% 61% Construction 182,858 7% 91% Manufacturing 158,578 6% 84% Retail trade 451,212 16% 89% FIRE 231,323 8% 92% Services 1,021,575 37% 92% Government 469,277 17% 91% As Table 4.1 indicates, in 2000, ninety percent of all employment in Maryland was in the metropolitan counties of the state. That same year, 92 percent of total state service and FIRE employment in the state was in metropolitan counties. Not far behind was government and construction employment which both comprise 91 percent of Maryland employment in these sectors. More than 60 percent of farm employment in Maryland was in the metropolitan counties in Despite the urban nature of these counties, they are still a substantial source of employment within the farming sector of the state. Employment growth and change in metropolitan counties Examining within metropolitan counties, we found that the most significant increases in employment were in counties in suburban Washington DC. Employment in Montgomery,
53 Frederick and Prince George s counties combined increased from almost 450,000 workers in 1969 to more than 1.1 million workers in 2001, a job growth rate of 147 percent. As Figure 4.3 demonstrates, suburban Washington DC outpaced Baltimore region in terms of growth rate from 1969 to 2000, although the Baltimore region has more workers. The Baltimore region had 1.5 million workers in 2000 compared to 984,000 workers in 1969, a job growth rate of 56 percent. Of counties within the Baltimore region, Howard County had the largest percent increase in employment, increasing its workforce from around 17,000 in 1969 to more than 165,000 in 2001, a job growth rate of more than 840 percent. 1,800,000 1,600,000 1,400,000 1,200,000 1,000, ,000 Baltimore Region Suburban Washington DC 600, , , Figure 4.3 Total employment in the Baltimore and suburban Washington DC regions, 1969 to
54 Southern Maryland s job growth was more than 220 percent for the years 1969 to Sparsely populated, rural counties in 1969, Charles, Calvert and St. Mary s counties witnessed substantial employment increases. For instance, beginning with a base of 15,000 workers in 1969, Charles County s workforce grew to more than 50,000 by Calvert County s workforce grew by more than 350 percent and St. Mary s workforce by 160 percent from 1969 to As Figures 4.4 and 4.5 demonstrates, the employment structure within the metropolitan counties of Maryland varies by county and has changed over time. Among metropolitan counties, Queen Anne s County relies most heavily on farm employment. Four percent of its workforce was employed in the farming sector in 2000, a decline from 18 percent in Two percent of the workforce of Washington, Frederick, Calvert and Carroll counties were employed in farming in Declines among these counties varied. In percentage terms, among these counties, the highest rates of decline in farm employment was in Calvert were farm employment decreased by 11 percent from 1969 to In raw numbers, the largest decrease was in Frederick County with the loss of more than 700 farm workers during this period. In 2000, Carroll County had the highest percentage of construction workers among metropolitan counties with 13 percent of its workforce employed in this sector, an increase from seven percent in In both Queen Anne s and Calvert counties, ten percent of workers were employed in construction in 2000, compared to six percent in both counties in
55 Washington Queen Annes Howard Harford Frederick Charles Carroll Calvert Baltimore County Baltimore City Anne Arundel PG Montgomery 0% 10% 20% 30% 40% 50% 60% 70% 80% 90% 100% Farm employment Construction Manufacturing Retail trade Finance, insurance, and real estate Services Government and government enterprises Other Figure 4.4 Employment by industry within metropolitan counties, 1969 Washington Queen Annes Howard Harford Frederick Charles Carroll Calvert Baltimore County Baltimore City Anne Arundel PG Montgomery 0% 10% 20% 30% 40% 50% 60% 70% 80% 90% 100% Farm employment Construction Manufacturing Retail trade Finance, insurance, and real estate Services Government and government enterprises Other Figure 4.5 Employment by industry within metropolitan counties,
56 Nine percent of the workforce of Montgomery County and eight percent of the workforce of Prince George s County were employed in construction in Prince George s County experienced a slight increase one percent in construction employment by 2000; Montgomery County, one the other hand, experienced a decline to six percent of total employment in In 2000, fourteen percent of Washington County s workforce was employed in the manufacturing sector, the highest percentage rate for manufacturing employment among metropolitan counties in the state. However, this represents a decline in manufacturing employment from 30 percent of total employment in Washington County in In both Montgomery and Prince George s counties, about four percent of the workforce was in manufacturing in both 2000 and Three percent of Charles County s workforce is in manufacturing, a slight decline from four percent in Frederick and Howard counties once relied heavily on the manufacturing sector. This contrasts with Baltimore city where 20 percent of the workforce was in manufacturing in 1969, declining to six percent of the workforce by Sixteen percent of Frederick County s workforce was employed in manufacturing in 1969, declining to seven percent by There were even larger declines in Howard County where 23 percent of the workforce was employed in manufacturing in 1969 compared to five percent in Both Howard and Frederick counties shifted from rural, manufacturing counties to more service-based local economies in recent decades
57 The retail trade sector has grown in every metropolitan county in Maryland. In 2000, almost a quarter of the workforce of Queen Anne s County was employed in the retail trade sector, and increase from 14 percent of the workforce in This sector is the most important source of employment for the county. In both Calvert and Harford counties, retail workers comprised 20 percent of total employment, an increase from 15 percent and 11 percent of respective workers. In both Montgomery and Prince George s counties, employment in retail trade declined as a percentage of total employment. In Montgomery County, 18 percent of the workforce was employed in the retail trade sector in 1969, declining to 14 percent of the workforce in In Prince George s County, 21 percent of the workforce was employed in the retail trade sector in 1969, declining to 17 percent of the workforce in Typically, the more rural metropolitan counties rely more heavily on the retail trade sector than those counties that have better adapted to the high-technology, service-based economy. The exception to this is Howard County home to the Columbia Mall and other retail outlets where retail trade employment increased from 13 percent in 1969 to 17 percent in Among metropolitan counties, Prince George s and Anne Arundel counties had the lowest percentage of FIRE workers six percent in both counties among their employment pool in Queen Anne s and Montgomery counties, on the other hand, had the highest percentage of FIRE workers ten percent in both counties in This was an increase from four percent of the workforce in Queen Anne s County and nine percent of the workforce in Montgomery County in
58 Many metropolitan counties rely heavily on the service sector. Almost half of all workers in Montgomery County were employed in services in 2000, an increase from 29 percent of the workforce in In Baltimore City, 42 percent of workforce was in the service sector in 2000, an increase from 21 percent of total employment in Queen Anne s local economy is the least service-oriented with 23 percent of the workforce in service employment in 2000, an increase from 17 percent in Employment among metropolitan counties in Maryland, across the board, has become more service-based in the last three decades. Metropolitan counties in Maryland experienced declines in government employment, in some cases quite dramatic decreases. For instance, in Hartford County, government services employment decreased from more than half of the workforce in 1969 to 21 percent of the workforce in In Anne Arundel, a similar decline occurred as government services employment declined by 25 percent from 1969 to In Charles County, government services comprised 37 percent of total employment in 1969, declining to only eight percent of the workforce by There is definite evidence of a shrinking of government service employment, although in counties such as Anne Arundel and Prince Georges counties, this sector is still an important element of the local economy. Employment growth and change in non-metropolitan counties Non-metropolitan counties experienced an increase of almost 125,000 jobs between 1969 and As with metropolitan counties, the industrial sector that witnessed the largest
59 employment growth was the service sector, increasing by more than 230 percent or more than 60,000 jobs from 1969 to 2000 (see Figure 4.6). 120, , ,000 90,000 80,000 70,000 60,000 50,000 40,000 30,000 20,000 10, Farm employment Construction Manufacturing Retail trade Finance, insurance, and real estate Services Government and government enterprises Figure 4.6 Employment by industry in non-metropolitan Maryland, 1969 to 2000 Employment growth in the retail sector of non-metropolitan counties was also substantial with the addition of almost 32,000 retail jobs from 1969 to 2000, a growth rate of 123 percent. Both the government sector and the FIRE sector experienced an addition of more than 12,000 jobs from 1969 to 2000, with the largest percentage increase of more than 185 percent in the FIRE sector. Both agricultural and manufacturing employment declined from 1969 to 2000 in non-metropolitan counties in Maryland. Manufacturing employment declined by more than 9,000 jobs, 23 percent of total employment; and farm employment decreased by more than 4,000 workers, 35 percent of total employment
60 Despite this decline, farming employment in the non-metropolitan counties accounts for 39 percent of statewide farm employment. Table 4.2 Employment in Non-Metropolitan Maryland, 2000 Non Metropolitan Counties, 2000 Percent of Non- Metropolitan County Employment in 2000 Percent of State Employment in 2000 Total employment 297, % 10% Farm employment 7,494 3% 39% Construction 16,197 6% 10% Manufacturing 29,648 10% 16% Retail trade 57,786 19% 11% FIRE 18,768 6% 8% Services 88,747 30% 8% Government 47,197 16% 9% As with metropolitan counties in Maryland in 2000, the most important employment sector in non-metropolitan counties of Maryland was the service sector, accounting for 30 percent of non-metropolitan county employment. Retail trade, another important industrial sector for both metropolitan and non-metropolitan counties, was 19 percent of non-metropolitan employment, 11 percent of the state employment. While manufacturing employment declined in the non-metropolitan counties of Maryland, this sector accounted for 10 percent of non-metropolitan county employment in This compares to six percent of metropolitan employment that same year. Farming accounts for only three percent of total employment in non-metropolitan counties in Examining within non-metropolitan counties, we find some interesting features. As Figure 4.7 demonstrates, St. Mary s County had the largest increase in jobs, adding more
61 than 30,000 new jobs from 1969 to The main sectors of employment growth in this county during this period were retail trade, manufacturing, FIRE and services. The only sector to decline was farming with a loss of almost a quarter of farm workers. 60,000 50,000 40,000 30,000 20,000 10, Alleghany Garrett Caroline Cecil Dorchester Wicomico Talbot St Mary's Somerset Kent Worcester Figure 4.7 Total employment by non-metropolitan county, 2000 Second among non-metropolitan counties in employment growth during this time period was Wicomico County. By 2000, this county had the highest number of workers almost 52,000. Wicomico County s workforce grew by almost 25,000 workers from 1969 to The major growth sectors were FIRE, services and government. FIRE and government employment more than doubled while service employment more than tripled during this time period
62 The lowest gains in employment were in Allegany County. From 1969 to 2000, total employment in this county grew by less than 2,000 workers. The sectors to lose workers include farming, construction and manufacturing. The manufacturing sector declined by almost 65 percent, a loss of almost 8,000 workers. A growth sector is services. The number of workers in this sector more than doubled from 1969 to Worcester, Garrett and Cecil counties experienced similar levels of increase in employment. The number of employed workers increased from 13,000 to more than 31,000 in Worcester County from 1969 to 2000; in Cecil County total employment increased from more than 20,000 to almost 32,000 over this same time period; and in Garrett County, total employment grew by more than 11,000 workers. In Cecil and Worcester counties, there was a decline in farm and manufacturing employment, and in Cecil County, employment in the government sector also declined. In Garrett County, farm employment remained the same with a slight increase by nine workers; and manufacturing employment grew from 650 workers in 1969 to more than 1,500 workers in During this period, the number of service and retail trade workers increased counties, with larger increases in these sectors in Worcester County. Total employment in Talbot County more than doubled from 1969 to As with other non-metropolitan counties, the growth rate was highest in the service sector which almost tripled over the three decades. The construction and retail sectors in Talbot County grew by more than 120 percent and 150 percent, respectively. Manufacturing
63 employment barely grew and farm employment declined. Government services employment grew by more than 73 percent. Caroline, Kent and Somerset counties had similar levels of total employment in 2000, and similar rates of employment growth from 1969 to In Caroline County, total employment increased by 60 percent, in Kent County there was an increase in employment of 58 percent and in Somerset County, employment grew by 53 percent over the thirty year period. In each case, farm employment declined, and in the case of Somerset and Kent counties, manufacturing employment declined. In Kent County, manufacturing employment grew slightly. Meanwhile, service employment more than tripled in Caroline County and almost tripled in Somerset and Kent counties. Industrial structure varies within the non-metropolitan counties as indicated by Figure 4.8. In 2000, close to seven percent of Kent and Caroline counties workforce was employed in farming compared to only one percent of Talbot County s workforce. Construction employment is highest at in Talbot County seven percent of the workforce and lowest at five percent in both Allegany and St. Mary s counties. Manufacturing employment is substantial in some non-metropolitan counties. For instance, 23 percent of the workforce in Dorchester County and 14 percent of Wicomico and Caroline counties was employed in the manufacturing sector in Typically, the workforce in non-metropolitan counties was employed in either retail trade or services that year. For instance, almost 60 percent of the workforce of Worcester County was
64 employed in both sectors. In Allegany County, 22 percent of the workforce was employed in the retail and 31 percent was employed in services sector. Worcester Kent Somerset St Mary's Talbot Wicomico Dorchester Cecil Caroline Garrett Alleghany 0% 10% 20% 30% 40% 50% 60% 70% 80% 90% 100% Farm employment Construction Manufacturing Retail trade Finance, insurance, and real estate Services Government and government enterprises Figure 4.8 Employment by industry within non-metropolitan counties, The highest rate of service employment was in Talbot County where 35 percent of the workforce is employed in this sector in The lowest rate was 20 percent of Somerset County s workforce. St. Mary s County and Somerset County shared the highest ranking for government employment at 28 percent of the workforce in both jurisdictions in Construction employment was highest in Garret and Talbot counties. Eight percent of the workforce in both counties was employed in this sector in In terms of FIRE 3 Data excludes some employment sectors
65 employment, ten percent of Wicomico County s workforce was employed in this sector in 2000, the highest rate among non-metropolitan counties that year. Industry advantage and concentrations of employment in Maryland To determine industry specialization in Maryland, we employed a location quotient (LQ) analysis comparing Maryland s economy to the national economy. The LQ technique identifies areas of specialization and industry advantage in the state economy. When the LQ score is greater than one, it is likely that the state specializes in that particular industrial activity. In contrast, when the LQ score is less than one, the state does not specialize in that activity, and it is possible that the state must import that industry. The results of the LQ analysis for Maryland are outlined in Figure 4.9. We found that Maryland outpaces the nation (i.e. LQ greater than one) in services but under performs in agriculture and manufacturing. Maryland scored an LQ of 1.6 for the professional, scientific and technical services sector, 1.3 for construction, more than 1.2 for real estate, 1.2 for educational services and more than one for public administration services. The LQ results for the construction and real estate industries indicate that the Maryland economy has benefited from the growth in population. The high LQ score for professional, scientific and technical services sector is likely the result of closeness to defense and research industries close to Washington DC. This booming sector will attract more people to the state as evidenced by recent decisions on military base realignment. Meanwhile, producing industries such as agriculture and manufacturing are not areas of
66 specialization for the Maryland economy, and the LQ results suggest the state must import from these sectors Agriculture, Forestry, Fishing and Hunting Mining Utilities Construction Manufacturing Wholesale Trade Retail Trade Transportant and Warehousing Information Finance and Insurance Real Estate and Rental and Leasing Professional, Scientific, and Technical Services Management of Companies and Enterprises Administrative and Support Educational Services Health Care and Social Assistance Arts, Entertainment, and Recreation Accommodation and Food Services Other Services (except Public Administration) Public Administration Unclassified Figure 4.9 Location quotients for different industries in Maryland, 2001 In looking more closely at Maryland s area of specialization within the professional, scientific, and technical services sector, in recent years the state has developed a niche in the technology sector. As Figure 4.10 indicates, this industrial advantage plays out spatially with concentrations of high technology establishments primarily along the I-270 corridor in Montgomery County, outside Washington DC, and in outer suburbs of the Baltimore region
, NASA Goddard Space Flight Center, Army Research")
67 The presence of important federal research agencies, particularly in the suburbs of Washington DC, is crucial to high technology growth. These agencies include such government bodies as the National Institutes of Health, the Food and Drug Administration, National Security Agency (NSA), NASA Goddard Space Flight Center, Army Research Laboratory, and National Geospatial-Intelligence Agency (NGA). These agencies, coupled with such major research developments as the Human Genome Project, have put Maryland at the forefront in terms of biotechnology, bioscience, defense and aerospace. Figure 4.10 High technology establishments by zip code, 2000 Central Maryland is a focus for much employment throughout the state. Figure 4.11 illustrates the major centers of employment. Examining data on employment in


68 transportation analysis zones, we found that I-270 corridor in the Rockville and Gaithersburg area, north of Baltimore City along I-83, in Frederick City, and along I-95 between Baltimore and Washington DC are important centers of employment for Maryland. Transportation routes are essential for location of both industry and employees in the state. Figure 4.11 Employment centers in Central Maryland
69 Summary of analysis of employment There have been massive shifts in the economy of Maryland that both reflect and drive population growth throughout the state. Job growth, as with population growth, has occurred at a tremendous pace with the workforce expanding from 1.6 million in 1969 to 3.1 million in 2001, a growth rate of 86 percent. During these thirty years, there has been a shift away from farm and manufacturing employment to a more service-based, hightechnology economy. Employment has shifted location, dispersing away from central cities to employment centers primarily in the Central Maryland region. Metropolitan counties are important sources of employment for the state. Employment in the Washington suburban counties of Montgomery, Frederick and Prince George s combined increased from almost 450,000 workers in 1969 to more than 1.1 million workers in 2001, a job growth rate of 147 percent. The Baltimore region has more workers 1.5 million in 2001 but the workforce in the region is growing at a slower pace than the suburban counties of Washington DC. The Washington DC area, in particular, is the site for many professional jobs in industries located along I-270 and I- 70. Employment structure in both metropolitan and non-metropolitan counties has change dramatically in recent decades. Farming is less important as a source of employment; and manufacturing employment has taken a sharp decline in recent decades. Among rural counties, the effects are quite devastating. For instance, in 2001, fourteen percent of Washington County s workforce was employed in the manufacturing sector, the highest
70 percentage rate for manufacturing employment among metropolitan counties in the state. However, this represents a decline in manufacturing employment from 30 percent of total employment in Washington County in Many rural counties have turned to the retail trade and service sectors as sources of employment in the new economy. Employment growth in the retail sector of nonmetropolitan counties was substantial with the addition of almost 32,000 retail jobs from 1969 to 2001, a growth rate of 123 percent. In 2001, the service sector accounted for 30 percent of non-metropolitan county employment. At the same time, farming accounts for three percent of employment in non-metropolitan counties. The local economies of rural counties rely less on the land or manufacturing sector and more on consumer growth and service. This reliance encourages further urban growth
71 CHAPTER FIVE MARYLAND S AGRICULTURE Population growth, housing development and changes in the regional economy have greatly impacted the extent of Maryland s farmland. In 1978, 2.6 million acres or 42 percent of land in the state was in farms 4. By 2002, this number had declined to about 2 million acres of land in farms, a third of the land area of the state. Every county in the state experienced a decline in farmed land during this period, with dramatic decline in some cases. More than half of the land area of the Upper Eastern Shore counties the most farmed region in Maryland was comprised of farms in 2002, a decline from more than 65 percent of the land area in As Figure 5.1 indicates, the Eastern Shore counties of Queen Anne s and Kent, 65 percent of the land area was in farms in However, in 1978, in both counties more than three quarters of the land area was in farming. In Talbot County, 61 percent of the land area was farmed in 2002, a decline from 68 percent in Caroline County witnessed a similar trend with 56 percent county in farming in 2002, a decline from 65 percent in A census farm is defined as an agricultural operation that produces crop, poultry, animal products or other agricultural products intended for sale. For the 1981 and 1986 Censuses, a census farm was defined as a farm, ranch or other agricultural holding with sales of agricultural products of $250 or more during the previous 12 months. For the 1976 Census, a census farm was defined as a farm, ranch or other agricultural holding of one acre or over with sales of agricultural products of $1,200 or more during
72 The most dramatic decline in the percentage of land area in farms occurred in the Southern counties of Calvert and St. Mary s. In Calvert County, the percentage of land in farms was 37 percent in 1978, declining to 21 percent by In St. Mary s County, 45 percent of the land area was in farms in 1978, declining to 29 percent of land area in % 80% % 60% 50% 40% 30% 20% 10% 0% Anne Arundel Baltimore County Carroll Harford Howard Frederick Montgomery Prince George's Calvert Charles St. Mary's Allegany Garrett Washington Caroline Cecil Kent Queen Anne's Talbot Dorchester Somerset Wicomico Worcester Figure 5.1 Percent of land area in farms by county, 1978 and 2002 Metropolitan counties in both the Washington DC and Baltimore areas also experienced decline in the percentage of land area in farming from 1978 to The most extreme cases were Harford, Howard, Frederick and Montgomery counties. In each county, the land area in farming declined by around 13 percent from 1978 to Carroll County also witnessed substantial decline in the percent of land in farms. In 1978, 62 percent of
73 the county was in farming compared to 51 percent in In Frederick County, 59 percent of the land area was in farming in 1978, declining to 46 percent by Maryland has lost almost 537,000 acres of land in farms since 1978, and farm acreage declined in almost every county. As Figure 5.2 indicates, Frederick County witnessed the largest decline in farm acreage among all Maryland counties, losing more than 53,000 acres of land in farms over a thirty year period. As the largest county in the state, Frederick had the largest number of acres in farming with more than 195,000 acres in 2002 compared to 248,000 acres in ,000 10,000 0 Baltimore Region DC Region Southern MD Western MD Upper Eastern Shore Lower Eastern Shore -10,000 acres -20,000-30,000-40,000-50,000-60,000 Anne Arundel Baltimore County Carroll Harford Howard Frederick Montgomery Prince George's Calvert Charles St. Mary's Allegany Garrett Washington Caroline Cecil Kent Queen Anne's Talbot Dorchester Somerset Wicomico Worcester Figure 5.2 Farm acres by county, 1978 to
74 Overall, the suburban counties of the Washington DC region lost more than 125,000 acres of land in farms, almost a quarter of statewide losses in land area in farms. Montgomery County lost more than 40,000 acres of farmland from 1978 to Prince George s County also experienced a substantial decline in farmland, losing more than 32,000 acres in the three decades. The land in farms declined in the Baltimore region by more than 141,000 acres from 1978 to Despite the growth boundary of the Urban Rural Demarcation Line (URDL) in Baltimore County, this county still lost almost 42,000 acres of land in farms from 1978 to In Howard County, the number of farm acres declined by more that 20,000 acres during this same period, and in Hartford County, farm acreage declined from more than 116,000 acres in 1978 to more than 81,000 in Southern Maryland lost a total of 95,000 acres of land in farms from 1978 to The largest decline in acreage was in Charles County with a decline of more than 37,500 acres over this time period. St. Mary s also experienced substantial decline as the number of farms acres declined from more than 104,000 in 1978 to a little over 68,000 in The rural counties in Maryland also experienced a loss of land in farms. The Eastern Shore as a whole had more than 1 million acres of land in farms in 1978, declining to less than 973,000 acres by 2002, a loss of 114,707 acres. The largest loss of acres in farms from 1978 to 2002 occurred in Kent County with the loss of more than 21,000 acres of land in farms during this time period. Wicomico County also experienced substantial
75 losses as the land in farming declined by more than 18,600 acres over the 24-year period. Caroline County was not far behind with a loss of more than 18,300 acres. Queen Anne s County witnessed substantial decreases, with the number of farms acres declining from more than 173,000 acres in 1978 to about 155,000 acres in Western Maryland lost almost 60,000 acres of land in farms over the three decades. The largest decline was in Washington County as land in farms declined from more than 151,000 acres in 1978 to 125,000 acres in The total number of farms in Maryland also declined in recent decades. In 1987, there were 14,776 farms, declining to 12,198 by Every county, with the exception of Talbot and Allegany counties, experienced a decline in the number of farms during this time period. 1,600 1,400 1, , Number of Farms Anne Arundel Baltimore Carroll Harford Howard Frederick Montgomery Prince Georges Calvert Charles St.Marys Alleghany Garrett Washington Caroline Cecil Kent Queen Annes Talbot Dorchester Somerset Wicomico Worcester Figure 5.3 Number of farms by county, 1987 to
76 The number of farms in the Baltimore region declined by 609 farms from 1987 to 2002, and the suburban Washington DC counties lost 489 farms during this same period. Among regions in the state, the Lower Eastern Shore experienced the largest decline, with the number of farms in this region dropping from a high of 2,203 in 1987 to 1,567 in 2002, a loss of 636 farms. Southern Maryland also witnessed substantial decline in the number of farms. This region had 1,819 farms in 1987, declining to 1,316 farms by Among counties, the most significant decline occurred in Wicomico County where the number of farms dropped from 774 in 1987 to 512 in This was followed closely behind by Worcester and Prince George s counties. In Worcester County, there were 631 farms in 1987, declining to 403 farms by In Prince George s County, there was a loss of 231farms during this same period. The county with the largest number of farms in 2002 was Frederick County with 1,273 farms. Frederick lost 166 farms from 1987 to Carroll County had 1,058 farms in 2002, a decline from 1,238 farms in To provide a more detailed analysis, we examined the loss of farms by zip code. As Figure 5.4 demonstrates, many zip codes lost a substantial number of farms with at least four large zip codes in the Lower Eastern Shore losing more than 100 farms from 1987 to One zip code in Carroll County experienced a loss of more than 101 farms. A similar pattern exists for a zip code in Washington County. Also zip codes particularly around Frederick City experienced a decline in the number of farms from 1987 to Areas of Southern Maryland and south Prince George s County lost farms, with many zip codes losing more than 50 farms from 1987 to

77 Figure 5.4 Change in the number of farms by zip code, 1987 to 2002 The decline in the number of farms has different meanings for different counties. For instance, the loss of a farm in Queen Anne s County compared to, say, Anne Arundel County is more significant in terms of lost acreage because of the larger farm size in Queen Anne s compared to Anne Arundel. The average size of farms varied among counties and across decades throughout the state. In 1978, the average farm size in Maryland as a whole was 168 acres. This figure
78 fluctuated over the next three decades and the average farm size was 170 acres in As to be expected, the average farm size in the non-metropolitan counties of Maryland was generally larger than the average farm size in the metropolitan counties. In most cases, the average farm size increased among the more traditionally rural counties in Maryland from 1978 to 2002, and, in general, the average farm size among metropolitan counties declined or remained similar over the period. Table 5.1 Average size of farms in acres by county, 1978 to MARYLAND Metropolitan Counties Anne Arundel Baltimore County Calvert Carroll Charles Frederick Harford Howard Montgomery Prince George s Queen Anne s Washington Non Metropolitan Counties Allegany Caroline Cecil Dorchester Garrett Kent Somerset St. Mary s Talbot Wicomico Worchester In terms of metropolitan counties, an exception is Queen Anne s County where the average farm size remained relatively stable at about 350 acres over the 24 year period. The metropolitan county with the smallest farms is Baltimore County with the average
79 farm size at 91 acres in 2002, a decline from 126 acres in In Harford County, the average farm size declined from 160 acres in 1978 to 119 acres in Farms in Howard County also became smaller with farm size declining to an average of 109 acres by Frederick and Washington counties both experienced a decline in the average size of farms. In the case of Frederick, the average size of the farm declined from 178 to 154 acres from 1978 to In the case of Washington County, the average farms size declined by 11 acres during this period. Montgomery County, of all metropolitan counties, experienced the most profound decline in average farm size, with farm size declining from 173 acres in 1978 to 130 acres in % 45% 40% 35% 30% 25% % 15% 10% 5% 0% 1-9 acres acres acres acres acres acres acres acres acres acres 1,000-1,999 2,000 or more Figure 5.5 Farm size in Montgomery County, 1982 to
80 As Figure 5.6 demonstrates, between the years from 1982 to 2002, Montgomery County witnessed a sharp increase in the percentage of farms between ten and 50 acres in size. In general, during this same period, the percent of farms more than 500 acres declined. Increased development and urban growth has encouraged the proliferation of small farms and the loss of large farms in the county. Many small farmers benefit from closeness to urban markets. Examining more traditionally rural counties, farm size increased in a number of counties. For instance, in Wicomico County, the average farm size increased from 116 acres in 1978 to 173 acres by Similarly, in Caroline County, the average farm size increased from 183 to 227 from 1978 to In some cases, there was a decrease in average farm size among non-metropolitan counties. In Allegany, the average farm size declined from 208 acres in 1978 to 142 acres in The most profound case of a change in the structure of farmland among rural counties occurred in Worcester County where the average size of farms increased by 150 acres from 1978 to A closer examination of changes in farm size in Worcester County indicates, on the one hand, the proliferation of very large farms (i.e. more than 1,000 acres) and, on the other hand, a decline in the percentage of very small farms (i.e. less than 10 acres). As Figure 5.5 indicates, there has been an increase in the percentage of farms between 10 and 50 acres in size as well as an increased in the percentage of farms 1,000 acres or more in size. Small farm producers are important in Worcester County. However, the county has also witnessed increased importance of large farm production as
81 the percent of farms over 1,000 acres increased from 4 percent in 1982 to 10 percent in % 45% 40% 35% Percent of Total Farms 30% 25% 20% % 10% 5% 0% 1-9 acres acres acres acres acres acres acres acres acres acres 1,000-1,999 2,000 or more Figure 5.6 Farm size in Worcester County, 1982 to 2002 These changes in farm size indicate more profound changes in the nature of farming in Maryland. On the one hand, there is increased importance in large farm production while, on the other hand, farming is adapting to urban development with the increased reliance on small farm production and recreational farming that supplies the urban consumer. Among other forces, urban development has greatly impacted the value of agricultural property in Maryland. Statewide, agricultural real property value totaled around $8.3 billion in 2005, an increase from $1.9 billion in
82 In some counties, agricultural property values have increased dramatically in recent decades, and in only one case Prince George s County has agricultural property values declined. 1,000,000, ,000, ,000, ,000, ,000, ,000, ,000, ,000, ,000, ,000,000 0 Anne Arundel Baltimore Carroll Harford Howard Frederick Montgomery Prince George's Calvert Charles St. Mary's Allegany Garrett Washington Caroline Cecil Kent Queen Anne's Talbot Dorchester Somerset Wicomico Worcester Figure 5.7 Real agricultural property values by county, 1986 to 2005 (in 2005 dollars) These changes in agricultural property values offer farmers profound incentives to sell their farms for urban development. It also puts additional strain on local governments and land conservation groups aiming to purchase agricultural easements since they are forced to compete with high market values for agricultural land
83 CHAPTER SIX LAND COVER CHANGE IN TRANSITIONING COUNTIES To analyze the impacts of the population and employment changes identified in Chapters Two through Five on agricultural land, we used Landsat data to perform an analysis of changes in land coverage for Montgomery and Frederick counties at multiple time periods. In this analysis, we fused remote sensing data and tax assessment data to obtain a more accurate assessment of the extent of developed land over time. For this purpose a generalized land use and land cover consisting of classes for developed, agriculture/open, and forested lands was created for the years 1986, 1995, and The classification methodology used to generate this data can be found in Appendix 1. Results Figure 6.2 through to Figure 6.4 show the resulting classification of Montgomery and Frederick Counties for 1986, 1995, and Figure 6.5 depicts a progression of development for Montgomery and Frederick Counties. We describe the results for Montgomery County and then the results for Frederick County. Montgomery County Figure 6.5 shows that some areas of the county remained highly developed from 1986 to These are areas that border Washington DC, typically extending to about 10 kilometers outside the central city. Some areas within this 10 kilometer radius of the city remained low density over the time period, specifically in the Potomac area outside Washington DC. Other areas in Montgomery County remained untouched or
84 agricultural/open and forested from 1986 to These areas are in the northwest of the county, areas bordering Frederick County, and the agricultural reserve in Montgomery County. Other areas of Montgomery, however, witnessed dramatic change. Intense urbanization extends northwest towards Germantown, and development is clearly evident around particular towns and places. For instance, examining immediately around Germantown, there is substantially more developed land in 2001 than in 1995 and 1986 as indicated by the growth in red and orange on the map. Similarly, the surrounding environs of Damascus and Poolesville witnessed similar growth over this time period. There is evidence of in-fill development, particularly south of North Damascus and around Montgomery Village. These areas moved from low density development to high density development. However, there was also an increase in low density development, joining areas south of Damascus with northern areas of Montgomery Village. Also, low density development increased areas along the Potomac River. Figure 6.6 shows a graph depicting the number of acres in each class for Montgomery County. It is evident from this figure that developed land has increased over the time period. According to our analysis, Montgomery County lost a total of 20,884 acres of agricultural/open land and 15,003 acres of forested land from 1986 to During this same period, the amount to developed land grew by 32,122 acres, 11,509 acres of low density development and 20,613 acres of high-to-medium density development

85 Figure classification for Montgomery and Frederick counties


86 Figure classification for Frederick and Montgomery counties


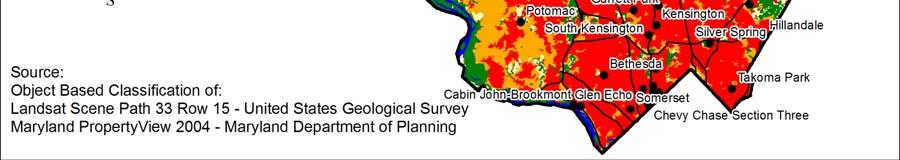
87 Figure classification for Frederick and Montgomery counties


88 Figure 6.5 Progression of Urbanization for Frederick and Montgomery counties (1986, 1995, and 2001)
89 Montgomery County Land Use Change ( ) Land Area (Acres) Developed (Low Density) Developed (High/Medium Density) Agriculture/Open Forest Year Figure 6.6 Montgomery County Classification Totals Examining within multiple years, we found that Montgomery County gained 7,960 acres of low-density development at an average rate of 884 acres per year between 1986 and Low density development slowed somewhat with the county gaining 3,549 acres of this type of development at an average rate of 592 acres per year between 1995 and Montgomery County gained 13,394 acres of high-to-medium density development at an average rate of 1,488 acres per year between 1986 and Again, high-tomedium density development slowed with the county gaining 7,219 acres of this type of development at an average rate of 592 acres per year between 1995 and
90 According to these results, high-to-medium density development is occurring at a faster rate than low density development in Montgomery County. This is good news for the county since it suggests in-fill development. Theoretically, high-to-medium density development is encroaching or changing low-density to high-to-medium density development. However, low-density development is simultaneously expanding. This places importance on the spatial configuration of zoning within the county. The optimal results for land conservation purposes would be to encourage infill in what are currently low density developed areas while at the same time minimizing their expansion. Land in the agricultural/open class decreased between 1986 and Montgomery County lost 10,526 acres of agricultural/open land at an average rate of -1,170 acres per year between 1986 and There was evidence that the loss of agricultural land intensified between 1995 and During this period, the county lost 10,358 acres of agricultural/open land at an average rate of -1,726 acres per year. Land in the forested class also showed a general decline over this time period totaling a loss of 10,653 forested acres at an average rate of -1,184 acres per year between 1986 and 1995; and 4,350 acres at an average rate of -161 acres per year between 1995 and As these findings point out, the rate of loss of forested land slowed in the latter part of the 1990s. Comparing the loss of both agricultural/open and forested lands, our analysis suggests that there was a shift from the development of forested land to the development of agricultural land between 1995 and
91 Frederick County Frederick County, in many ways, is the infant child of Montgomery County in terms of urban development in the sense that development has not occurred on as large a scale. However, there is evidence of urban encroachment on agricultural/open and forested lands in Frederick County between 1986 and As Figure 6.5 indicates, most of urban development is focused around Frederick city, Thurmont, the southeast area along I-70, and around the Lake Linganore area. A great deal of development appears to be low density. Much of the development that has occurred in Frederick between 1986 and 2001 is largely focused around already existing population centers (e.g. Frederick city) and along major roads. Also, areas in the south eastern portion of the County, particularly along the I-70 corridor, developed at low densities, with a smattering of high density development in New Market and Mount Airy. Figure 6.7 is a graph depicting the number of acres in each class for Frederick County. As this graph illustrates, Frederick County is dominated by agricultural/open and forested classes. This is largely due to the historical importance of agriculture in the local economy and the presence of mountainous, government-owned forested land in the northwestern portion of the County. Despite this, Frederick County still experienced growth in developed land between 1986 and Frederick County lost a total of 14,744 acres of agricultural/open land and 11,243 acres of forested land from 1986 to During this same period, the county gained 25,809 acres of developed land, 12,
92 acres of low density development and 13,334 acres of high-to-medium density development. Frederick County Land Use Change ( ) Land Area (Acres) Developed (Low Density) Developed (High/Medium Density) Agriculture/Open Forest Year Figure 6.7 Frederick County Classification Totals Examining within multiple years, we found that Frederick County gained 9,075 acres of low density development at an average rate of 1,008 acres per year between 1986 and 1995; and gained 3,400 acres at an average rate of 567 acres per year between 1995 and As with Montgomery County, the rate of low-density development slowed somewhat in the latter part of the 1990s
93 Frederick County gained 7,103 acres of high-to-medium density at an average rate of 789 acres per year between 1986 and 1995; and 6,231 acres at an average rate of 1,038 acres per year between 1995 and The rate of high-to-medium density development increased in the latter part of the 1990s. Our analysis suggests that Frederick County experienced a large amount of low density growth between 1986 and 1995; and an increased amount of high to medium density development between 1995 and This could signify that infill occurred; converting what was defined as low density development between 1986 and 1995 to high-to-medium density development by Land in the agricultural/open class decreased between 1986 and Frederick County lost 8,573 acres of agricultural/open land at an average rate of -973 acres per year between 1986 and 1995; and lost 6,171 acres at an average rate of -1,029 acres per year between 1995 and This suggests a slight increase in the rate of consumption of agricultural/open land for development at the end of the 1990s. Land in the forested class also showed a general decline over this time period totaling a loss of 7,307 acres at an average rate of -812 acres per year between 1986 and 1995; and 4,036 acres at an average rate of -673 acres per year between 1995 and As with Montgomery County, the rate of consumption of forested land for development slowed somewhat between 1995 and 2001, although Frederick County lost a lot more forested land than Montgomery County during this period. In conclusion, both Montgomery and Frederick Counties experienced an increase in development from 1986 to Development largely occurred around population
94 centers and along transportation corridors. The balance between agriculture/open and forested land and developed land in Montgomery County tipped to favor developed land during this time period. Frederick County still has a large amount of forested and agricultural/open land. However, an increase in development pressure on agricultural land could put this balance in jeopardy. To quantify and visualize different aspects of land cover change, we used the classifications for each year to analyze change in patch consolidation and patch fragmentation using the largest patch index (LPI) statistic. LPI quantifies the percentage of the total landscape area that is comprised by the largest patch in a certain class. The LPI is calculated as the area of the largest patch of a certain type divided by the total landscape area multiplied by 100. A LPI that equals 100 shows that the largest patch dominates 100% of the landscape. As the LPI decreases the landscape is less dominated by a particular class and patches are likely to become more fragmented. We calculated LPI in a hexagonal grid covering Montgomery and Frederick Counties using the Patch Analyst 3 ( extension for ArcView 3.2. Using this software, we created a hexagonal grid to analyze fragmentation within each hexagon. The size of each hexagonal cell is 400 hectares. We grouped the developed classes into one class and calculated the LPI for developed, forest, and agriculture/open classes within each hexagon for 1986 and We then calculated the change of LPI between 1986 and The results of the change in LPI for each class are shown in Figure 6.8, Figure 6.9, and Figure
95 Figure 6.8 is a map of the LPI change for developed classes from 1986 to Darker hexagons on this map show where a decrease in LPI for developed classes. This signifies that the size of the largest developed patch has increased within these polygons. This growth is caused largely by new development. However, an increase in LPI could also indicate consolidation of an existing development resulting from infill, It is evident that there is significant increase in the LPI occurring in areas that showed a large amount of growth in Montgomery County including the area around North Potomac, Germantown, between Olney and Montgomery Village, and south of Damascus. In Frederick County LPI is increasing near Braddock Heights, Clover Hill, Ballenger Creek, to the northeast of Frederick, Linganore Bartonsville, Green Valley, and along the southeastern border along Interstate 70 near Mount Airy, in and in around the city center of Frederick. Figure 6.9 shows the change in LPI for forest classes. The darker hexagons on this map represent where the LPI of forested classes has decreased between 1986 and This signifies that forested patches within these hexagons are becoming more fragmented. The fragmentation of forest patches is largely taking place where land is being developed. In Montgomery County, this includes areas around Ashton-Sandy Springs, Brookeville, south of North Potomac, west of Germantown, and South of Damascus. In Frederick County forested patches are becoming more fragmented in Linganore-Bartonsville, just southwest of New Market, and about 10 miles north of Mount Airy. One cause for this is the increase of smaller low density developments in areas with large contiguous forested patches
96 Figure 6.10 shows change in LPI for agricultural/open classes between 1986 and Darker hexagons represent larger values and signify that the Agricultural/Open patches are becoming more fragmented. Agricultural/Open classes are becoming fragmented in areas where development has increased during this time period. In Montgomery County, the hexagons form sort demarcation line that runs south of Damascus, just west of Germantown and stops immediately west of the Potomac River. There is also fragmentation occurring around Latonsville, south of Montgomery Village, and east of North Potomac. Frederick is experiencing fragmentation of agricultural/open classes near Mount Airy, Ballenger Creek, Clover Hill, Myersville, and just northwest of Middletown


97 Figure 6.8 Change in developed LPI


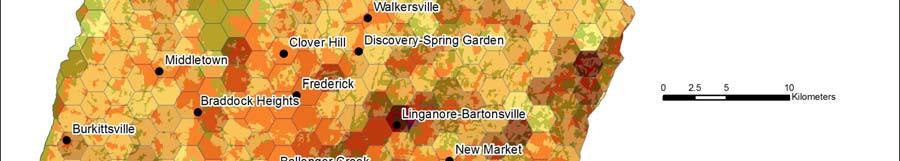
98 Figure 6.9 Change in forest LPI

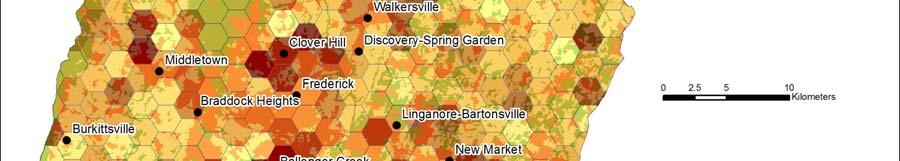

99 Figure 6.10 Change in agriculture/open LPI
100 CHAPTER SEVEN INFLUENCES ON GROWTH AND POLICY AND PLANNING IMPLICATIONS Using Frederick County as a pilot study, we developed a statistical model to determine the conditions that influence a parcel s change from agriculture to residential use. Before giving the results and policy implications of this model, there are six reasons why we chose Frederick County as our case study. First, the population of Frederick County has grown tremendously, particularly in recent decades. Historically, Frederick was a rural county with a population of less than 52,000 at the turn of the last century, only increasing to a little over 72,000 by Since this time, however, the population has increased dramatically. By 2000, the population had more than doubled in three decades to more than 195,000. Projections indicate that this population increase is likely to continue. According to Frederick County s Comprehensive Plan (1995), the county is projected to grow at a faster rate than any of the other Maryland counties contained within the Washington or Baltimore regions. Most recent figures, taking into consideration BRAC, suggest that the population will reach almost 340,000 people by Second, despite this population growth, farming remains an important aspect of the landscape of Frederick. Among Maryland counties, Frederick had the largest number of farms in Frederick also had the largest percentage of land area in farms 46 percent in 2002 among all metropolitan counties
101 Third, farming is important to the economy of Frederick. We employed a location quotient (LQ) analysis, comparing Frederick County s economic activity with the state of Maryland (see Table 7.1). The results of the LQ analysis indicate that Frederick County, compared to other counties in the state, still relies heavily on the farming sector. The LQ score was 3.06 in 2000, indicating that the level of farming employment is 3.06 times more than the average percent in the Maryland economy as a whole. Frederick specializes primarily in dairy farming, and is an important exporter of this industry, particularly to the state of Pennsylvania. Table 7.1 Location quotients for Frederick County (compared to Maryland economy) Industry LQ LQ Farm employment Non-farm employment Private employment Construction Manufacturing Transportation and public utilities Wholesale trade Retail trade Finance, insurance, and real estate Services Government and enterprises Federal, civilian Military State and local government Four, despite its importance, farming has been greatly impacted by urban growth in the county in a number of ways. First, the percentage of land area in farms in Frederick declined by more than 53,000 acres from 1987 to 2002, the largest decline in land in farms among the counties of Maryland. Second, while farming continues to be an
102 important contributor to the Frederick economy, this industry is not a major source of employment for the newly established population. Farm employment has declined in recent decades, and Frederick lost more farm workers that any other metropolitan county in the state. Third, the LQ for farming declined from a high of 4.76 in 1990 to 3.06 in 2000, indicating a decline in farming as an export industry. This decline, combined with the growth in LQ scores for other sectors of the local economy, demonstrates a decreasing specialization in agricultural activities and the growing importance of industries that respond to new urban growth (see Table 7.1). Four, the estimated market value of all agricultural property throughout the county has grown tremendously in recent decades from almost $2.5 million in 1983 to $7.1 million in This increased value provides added incentive for farmers to sell to speculators and developers, putting pressure on the farming industry in the county. Five, the city of Frederick is a major hub of commercial and industrial activity that provides a springboard for urban growth in the county. A well-established historic, urban core, Frederick City expanded greatly in recent decades. The population was 28,086 in 1980 and climbed to 52,767 by 2000, a growth rate of almost 90 percent. This growth can be attributed to Frederick city s central location and attributes as an historic urban core. The city offers a wide-range of natural amenities, art houses, restaurants and other leisure activities. It has maintained its original, historic architecture. Much of the housing in the core of Frederick City is historically preserved, and there are cultural and historical points of interest in many locations nearby. Frederick City, once a market town devoted to agriculture, now contains almost half of all jobs in the county, with employment
103 concentrations in health care and biotechnology. Specialization in biodefense, for instance, is primarily associated with the Fort Detrick army base located in the city. Six, the road transportation network connects Frederick County (via Frederick City) to the Central Maryland regional economy, and is an important driver of growth. There is a convergence of two interstate highways I-270 and I-70 within the Frederick City limits. This road network links residents of Frederick County with employment centers in the greater Washington-Baltimore region. More than 30 percent of workers residing in Frederick County commute mostly to the Washington DC region, specifically to centers of employment along the I-270 corridor. In 2000, 42,046 workers out-commuted from Frederick County. Almost 55 percent of all out-commuters and, as Table 7.2 indicates, 22 percent of all Frederick County workers traveled to Montgomery County, home to many high-tech firms along the I-270 highway. Table 7.2 Commuting from Frederick County Out-Commuting Labor Force Percent of All To Workers Workers Montgomery County 22,867 22% Other Eastern MD Counties 4,117 4% Virginia 4,011 4% Washington, DC 3,025 3% Washington County 2,153 2% I-270, which connects Frederick County to Washington DC, and I-70, which connects the county to Baltimore City were built in 1956 and 1968, respectively. Their continued
104 expansion caters to the growing population and can lead to the conversion of agricultural properties in the County. Based on growth pressures in Frederick, we conducted a logit probability model to statistically identify major determinants of future growth location in the county. We also used this model to map the probability a parcel would change from agricultural to a residential use over the next four years 2004 to 2008 assuming conditions such as road infrastructure remains constant. The variables we expected to influence the probability of a parcel remaining in agriculture rather than changing to residential, and their expected sign are as follows: distance from non-agricultural parcels (+), distance from the inner state highway quality (+), the distance from the nearest town center (+), the distance from Frederick city center (+) and the quality of the land in agricultural production (+). We deemed distance from non-agricultural parcels important based partly on the notion of impermanency. A sense of impermanence in the agricultural industry is enhanced if farmers witness the development of neighboring farms. Farmers are more likely to sell when they observe the loss of surrounding farms. Similarly, agricultural land will be attractive to developers if adjacent land use is residential since roads, schools and other services are already established for potential incoming residents. The parcel size was included in the model as a control variable. We expected the following relationships. The further the property is from residential parcels the more
105 likely the parcel is to stay in agriculture; the greater the distance from the entrance and exits on interstates I-70 and I-270 the less likely to change to residential; the greater the distance from the nearest town the more likely the parcel will stay in agriculture; the greater the distance from the town of Frederick the more likely the parcel is to stay in agriculture; and the greater the potential yield from local soils the more likely the property is to stay in agriculture. We also expected larger parcels were more likely to stay in agriculture because of the cost of subdividing. We used land use change data from the Maryland Property View dataset from 2000 to Matching land uses between 2000 and 2004, we were able to identify parcels that changed from agricultural to residential land uses over that period. We also identified those properties that remained in agriculture over the same time period. When an agricultural parcel was subdivided into residential parcels, we captured each residential parcel as a separate transaction. There were 4,897 parcels in the County of Frederick in our data set. The model dropped only 88 parcels because of missing data. The distance variables were calculated as euclidean distance, rather than distance by road. Distance is measured in meters. The parcel size is measured in meters squared. The quality of the land was measured by examining non-irrigated yield for pasture. We chose pasture since Frederick County is heavily focused on dairy farming. The measurement unit is animal units per month (AUM) the amount of forage required by one mature cow of approximately 1,000 pounds weight per month. The value of land improvement was tested, but found not significant, and therefore dropped from the final model
106 The statistical results of the model are reported in Table 7.3. The statistically significant variables are bolded. These include the land area, distance from non-agricultural properties, distance from the interstate exits, and non-irrigated agricultural yield (a proxy for quality of land for agricultural production). The two variables which were not statistically significant are the distance from the nearest town and the distance from the City of Frederick. The distance from the city of Frederick turns up non-significant because the importance of this distance is captured in our variable measuring distance to the interstate. Distance from the nearest town may be insignificant for similar reasons of because some are too small to encourage surrounding urbanization. The distance measures reported below are in meters, the area is measured in meters. Table 7.3 Logistic model results (the probability a parcel remains in agriculture) Variables Estimate Standard Error Wald Chi- Square Pr >Chi Square Intercept <.0001 Land Area <.0001 Dist_Nonag <.0001 Dist_Inter State Dist_Town Dist_Fred Non_Irryiel <.0001 N = 4795 Figure 7.1 illustrates the impact that distance from the closest non-agricultural parcel; Figure 7.2, the impact of the distance from the interstates nearest I-70 and I-270 entrance or exit; and Figure 7.3, the impact of the quality of land in agricultural production on the probability a parcel will change from agricultural to residential use
107 Probability Land Stays Agricultural 1.2 Probability of Parcel Staying in Agricultural Use Distance from Non-Ag Land in Meters Figure 7.1 Distance from non-agricultural parcel Probability Parcel Stays Agricultural 1.2 Probability of Parcel Staying in Agricultural Use Distance from the Interstate in Meters Figure 7.2 Distance from the interstate highway
108 Quality of Land Probability of Staying in Agricultural Use Quality Land in Agriculture Figure 7.3 Quality of land in agricultural production The probabilities reported in these figures hold all other variables in the model constant at the mean values as shown in Table 7.4. Table 7.4 Mean values for variables Variable Mean Value Land Area sq. meters Dist_Nonag.27 Kilometers Dist_Interstate 5.71 Kilometers Dist_Town 8.14 Kilometers Dist_Fred Kilometers NonIrryiel 5.41 N = 4897 So for example, in Figure 7.1, when all other variables are at their mean value the probability a parcel will stay in agriculture reaches zero when the nearest developed
109 parcel is 50 meters (.03 miles) or less, and reaches 100% when residential parcels are 300 meters (0.19 miles) away or more. Figure 7.2 indicates that when a parcel is 8,310 meters (5.16 miles) or more from the interstate entrance or exit, the probability is nearly 100% that the parcel will remain agricultural. But when a parcel is 10 meters or less from the interstate exit or entrance, and all other variables are at their mean value, the probability falls to.40 that the parcel will remain agricultural. Figure 7.3 demonstrates that when a parcel reaches 8.41 AUM (i.e. forage for cows for a month) the probability that it will remain in agriculture equals 100 percent. But when a parcel reaches 0 AUM and all other variables are at their mean value, the probability falls to.40 that the parcel will remain agricultural. The results of our statistical analysis provided a probability score for each parcel. Figure 7.4 is a map of the resulting probability scores. This figure displays those areas where agricultural parcels are most likely to stay agricultural or change to urban use over the next five years, assuming all external conditions remain constant. The predicted values are based on the results in the model reported in Table 7.3. The external conditions which would have to remain constant are for example, no new investments in road infrastructure; similar demand for agricultural output; and constant oil prices. For example, if oil prices rise, as they have over the past several years, urban uses are less likely to spread into rural areas, since the cost of commuting is rising

110 Figure 7.4 Map of probability land will change from agricultural to urban use
Chesapeake Climate Action Network
 www.gonzalesresearch.com 443-458-5034 Conducted for: Chesapeake Climate Action Network October 2013 Methodology Patrick E. Gonzales graduated from the University of Baltimore in 1981 with a degree in political
SENATE BILL 480. B1, F5, J1 9lr2128 A BILL ENTITLED. Operating Budget Elimination of Inflation Adjustments
 SENATE BILL 0 B, F, J lr By: Senator Pipkin Introduced and read first time: February, 0 Assigned to: Budget and Taxation A BILL ENTITLED 0 AN ACT concerning Operating Budget Elimination of Inflation Adjustments
St. Mary s County Public Hearing
 St. Mary s County Public Hearing County Governments Commission vs. Code Home Rule (January 19, 2016) Types of County Governments in Maryland There are 24 counties in Maryland (23 counties + Baltimore City
Maryland Marijuana Arrests
 Working to Reform Marijuana Laws The NORML Almanac of Marijuana Arrest Statistics Maryland Marijuana Arrests Marijuana Arrests 1995-2002 (Summary) Marijuana Possession Arrests-2002 (Demographics) Marijuana
Recommended Congressional Plan Governor s Redistricting Advisory Committee
 Recommended Congressional Plan Governor s Redistricting Advisory Committee Governor s Redistricting Advisory Committee Membership Jeanne Hitchcock, Chair Senate President Miller House Speaker Busch Richard
Department of Legislative Services Maryland General Assembly 2012 Session
 Department of Legislative Services Maryland General Assembly 2012 Session HB 14 FISCAL AND POLICY NOTE House Bill 14 Ways and Means (Delegate Glenn) Baltimore City Board of School Commissioners - Selection
Gonzales Research & Marketing Strategies
 Gonzales Research & Marketing Strategies Maryland s leader in public opinion polling Maryland Poll Part 1 Most Important Issue Governor s Contest U.S. Senate September 2009 Contact: Laslo Boyd 443-812-4883
Judiciary. District Court Civil Cases Timeliness of Initial Recording of Filings
 Performance Audit Report Judiciary District Court Civil Cases Timeliness of Initial Recording of Filings Initial Recording Times Vary Among the Districts Processing Time Standards Should Be Established
Department of Legislative Services
 Department of Legislative Services Maryland General Assembly 2008 Session SB 84 FISCAL AND POLICY NOTE Senate Bill 84 (Senator Pipkin) Education, Health, and Environmental Affairs State Government - Public
Maryland s leader in public opinion polling Maryland Poll January 2011 Contact: Laslo Boyd
 www.gonzalesresearch.com Maryland s leader in public opinion polling Maryland Poll January 2011 Contact: Laslo Boyd 443-812-4883 Methodology Patrick E. Gonzales graduated from the University of Baltimore
County Government Options in Maryland by Mike Burns. Compiled from MACO website, Whig archives and related correspondence
 County Government Options in Maryland by Mike Burns. Compiled from MACO website, Whig archives and related correspondence Cecil County, along with seven other MD counties, is currently governed a board
Regional Total Population: 2,780,873. Regional Low Income Population: 642,140. Regional Nonwhite Population: 1,166,442
 BALTIMORE REGION Neighborhood change in Baltimore is marked by a major city suburban divide, reflecting its long and troubled history of racial segregation. In the suburbs, only about one in six residents
Case 1:13-cv JKB Document Filed 06/30/17 Page 1 of 10 EXHIBIT 10
 Case 113-cv-03233-JKB Document 186-10 Filed 06/30/17 Page 1 of 10 EXHIBIT 10 Case 113-cv-03233-JKB Document 186-10 Filed 06/30/17 Page 2 of 10 IN THE UNITED STATES DISTRICT COURT FOR THE UNITED STATES
Maryland Chapter of 4-H Club All Stars, Inc. Standard Operating Procedures
 Maryland Chapter of 4-H Club All Stars, Inc. Standard Operating Procedures Article I. PURPOSE Section 1.01 The purpose of this instrument is to standardize operations of the State and County All Star organizations
Department of Legislative Services Maryland General Assembly 2012 Session
 Senate Bill 691 Judicial Proceedings Department of Legislative Services Maryland General Assembly 2012 Session FISCAL AND POLICY NOTE Revised (Senator Shank, et al.) SB 691 Judiciary Earned Compliance
OFFICE OF THE PUBLIC DEFENDER STATE OF MARYLAND
 OFFICE OF THE PUBLIC DEFENDER STATE OF MARYLAND FISCAL YEAR 2011 ANNUAL REPORT With Strategic Plan Paul B. DeWolfe Public Defender www.opd.state.md.us TABLE OF CONTENTS LETTER FROM THE PUBLIC DEFENDER...1
The Potomac Conference
 The Potomac Conference Alice M. Rivlin Director, Brookings February 2006 An Overview of the Washington DC Region Title Slide This conference is focused on the future. Everyone here is eager to develop
Constitution Maryland Activity Coordinators Society, Inc.
 Constitution Maryland Activity Coordinators Society, Inc. Revised September 2012 Article 1 Name The name of this organization shall be the Maryland Activity Coordinators Society, Inc, which shall hereafter
Chapter 1: The Demographics of McLennan County
 Chapter 1: The Demographics of McLennan County General Population Since 2000, the Texas population has grown by more than 2.7 million residents (approximately 15%), bringing the total population of the
A PATHWAY TO THE MIDDLE CLASS: MIGRATION AND DEMOGRAPHIC CHANGE IN PRINCE GEORGE S COUNTY
 A PATHWAY TO THE MIDDLE CLASS: MIGRATION AND DEMOGRAPHIC CHANGE IN PRINCE GEORGE S COUNTY Brooke DeRenzis and Alice M. Rivlin The Brookings Greater Washington Research Program April 2007 ACKNOWLEDGEMENTS
3 SOCIOECONOMIC ANALYSIS
 3 SOCIOECONOMIC ANALYSIS A. INTRODUCTION Cumberland, Maryland has historically been the center for manufacturing and industry within Western Maryland with multimodal (rail, auto, and recreation) transportation
Maryland Judiciary. Annual Statistical Abstract
 Maryland Judiciary Annual Statistical Abstract 201 MARYLAND JUDICIARY Annual Statistical Abstract Fiscal Year 2015 July 1, 2014 - June 30, 2015 Prepared By Court Operations Department Administrative Office
OFFICE OF THE PUBLIC DEFENDER
 OFFICE OF THE PUBLIC DEFENDER STATE OF MARYLAND FISCAL YEAR 2010 ANNUAL REPORT Paul B. DeWolfe Public Defender TABLE OF CONTENTS LETTER FROM THE PUBLIC DEFENDER... 1 MISSION STATEMENT... 2 DECLARATION
Maryland Voter Poll Results: Offshore Wind Power
 To: From: Interested Parties Steve Raabe, OpinionWorks Date: Subject: Overview This Maryland voter poll shows very strong support for the offshore wind proposal being considered by the General Assembly.
Results Embargoed Until Monday, September 25, 2017 at 12:01am
 Results Embargoed Until Monday, September 25, 20 at 12:01am Press Contact Information Mileah Kromer Director, Sarah T. Hughes Field Politics Center mileah.kromer@goucher.edu Chris Landers chris.landers@goucher.edu
Sustainable cities, human mobility and international migration
 Sustainable cities, human mobility and international migration Report of the Secretary-General for the 51 st session of the Commission on Population and Development (E/CN.9/2018/2) Briefing for Member
Baby Boom Migration Tilts Toward Rural America
 Baby Boom Migration Tilts Toward Rural America VOLUME 7 ISSUE 3 John Cromartie jbc@ers.usda.gov Peter Nelson Middlebury College 16 AMBER WAVES The size and direction of migration patterns vary considerably
Results Embargoed Until Tuesday, February 20, 2018 at 12:01am. Hogan Remains Popular; Perceptions of the Maryland Economy Are Positive
 Results Embargoed Until Tuesday, February 20, 20 at 12:01am Press Contact Information Mileah Kromer Director, Sarah T. Hughes Field Politics Center mileah.kromer@goucher.edu Chris Landers chris.landers@goucher.edu
Results Embargoed Until Wednesday, February 24 at 12:01AM. Clinton Continues to Lead in Maryland; Edwards and Van Hollen in Dead Heat
 Results Embargoed Until Wednesday, February 24 at 12:01AM Press Contact Information Mileah Kromer Director, Sarah T. Hughes Field Politics Center mileah.kromer@goucher.edu Chris Landers chris.landers@goucher.edu
MARYLAND STATE FIREMEN S ASSOCIATION Representing the Volunteer Fire, Rescue and Emergency Medical Services Personnel msfa.org
 MARYLAND STATE FIREMEN S ASSOCIATION Representing the Volunteer Fire, Rescue and Emergency Medical Services Personnel msfa.org Doyle E. Cox Report of the First Vice President to the Executive Committee
Department of Legislative Services
 Department of Legislative Services Maryland General Assembly 2008 Session HB 604 FISCAL AND POLICY NOTE House Bill 604 Appropriations (The Minority Leader) Public Benefits - Requirement of Proof of Lawful
Changing Times, Changing Enrollments: How Recent Demographic Trends are Affecting Enrollments in Portland Public Schools
 Portland State University PDXScholar School District Enrollment Forecast Reports Population Research Center 7-1-2000 Changing Times, Changing Enrollments: How Recent Demographic Trends are Affecting Enrollments
What Lies Ahead: Population, Household and Employment Forecasts to 2040 April Metropolitan Council Forecasts to 2040
 The Metropolitan Council forecasts population, households and employment for the sevencounty Minneapolis-St. Paul region with a 30-year time horizon. The Council will allocate this regional forecast to
ADMINISTRATIVE OFFICE OF THE COURTS
 ADMINISTRATIVE OFFICE OF THE COURTS MARYLAND JUDICIAL CENTER 580 TAYLOR AVENUE ANNAPOLIS, MARYLAND 21401 Pamela Harris State Court Administrator 410-260-1295 To: From: MEMORANDUM Persons Seeking Interpreting
Results Embargoed Until Tuesday, April 24, 2018 at 12:01am
 Results Embargoed Until Tuesday, April 24, 20 at 12:01am Press Contact Information Mileah Kromer Director, Sarah T. Hughes Field Politics Center mileah.kromer@goucher.edu Tara de Souza tara.desouza@goucher.edu
CONTENTS vii. Table of Cases Index
 CONTENTS Foreword by Dr. Carl W. Smith... ix Foreword by Dr. Nancy S. Grasmick... xi About the Authors...xiii Acknowledgments... xv List of Common Acronyms...xvii Introduction... xix 1. Local School Board
DRIVERS OF DEMOGRAPHIC CHANGE AND HOW THEY AFFECT THE PROVISION OF EDUCATION
 DRIVERS OF DEMOGRAPHIC CHANGE AND HOW THEY AFFECT THE PROVISION OF EDUCATION This paper provides an overview of the different demographic drivers that determine population trends. It explains how the demographic
Working Overtime: Long Commutes and Rent-burden in the Washington Metropolitan Region
 Working Overtime: Long Commutes and Rent-burden in the Washington Metropolitan Region By Kathryn Howell, PhD Research Associate George Mason University School of Public Policy Center for Regional Analysis
African immigrants in the Washington region: a demographic overview
 African immigrants in the Washington region: a demographic overview Jill H. Wilson, Senior Research Analyst Presented at the DC Mayor s Office on African Affairs 2010 Census Kick-off 1 February 25, 2010
PRESENT TRENDS IN POPULATION DISTRIBUTION
 PRESENT TRENDS IN POPULATION DISTRIBUTION Conrad Taeuber Associate Director, Bureau of the Census U.S. Department of Commerce Our population has recently crossed the 200 million mark, and we are currently
NATIONAL POPULATION PLAN FOR REGIONAL AUSTRALIA
 NATIONAL POPULATION PLAN FOR REGIONAL AUSTRALIA February 2019 KNOWLEDGE POLICY PRACTICE KEY POINTS People vote with their feet and many are showing strong preferences for living in regions. Enhancing liveability
IN THE CIRCUIT COURT FOR ANNE ARUNDEL COUNTY
 IN THE CIRCUIT COURT FOR ANNE ARUNDEL COUNTY NEIL C. PARROTT, et al., Plaintiffs, v. JOHN MCDONOUGH, et al., Defendants. * * * * * * No. 02-C-12-172298 * * * * * * * * * * * * * MEMORANDUM IN OPPOSITION
CONSTITUTION OF Learning Forward Maryland ARTICLE I: NAME, MISSION, AND PURPOSE
 CONSTITUTION OF Learning Forward Maryland ARTICLE I: NAME, MISSION, AND PURPOSE The organization shall be known as Learning Forward Maryland (LFMD). The mission of LFMD shall be to provide vision, leadership
Immigrants and the Restructuring of the Boston Metropolitan Workforce,
 Institute for Immigration Research Immigrants and the Restructuring of the Boston Metropolitan Workforce, 1970-2010 Erin M. Stephens, Justin P. Lowry and James C. Witte JUNE 2015 1 Immigrants and the Restructuring
Juveniles Charged as Adults and Held in Adult Detention Facilities: Trend Analysis and Population Projections
 January 2013 November 30, 2016 Juveniles Charged as Adults and Held in Adult Detention Facilities: Trend Analysis and Population Projections Submitted to: Maryland General Assembly, Pursuant to Chapter
Goucher Poll Releases First Round of Inaugural Results Marylanders Share Perceptions of Same-Sex Marriage, Immigration, and Expanded Gambling
 Press Contact Information Dr. Mileah Kromer Director, Sarah T. Hughes Field Politics Center mileah.kromer@goucher.edu Cell: 724-840-0990 Kristen Pinheiro Director, Media Relations kristen.pinheiro@goucher.edu
Maria del Carmen Serrato Gutierrez Chapter II: Internal Migration and population flows
 Chapter II: Internal Migration and population flows It is evident that as time has passed, the migration flows in Mexico have changed depending on various factors. Some of the factors where described on
Part 1: Focus on Income. Inequality. EMBARGOED until 5/28/14. indicator definitions and Rankings
 Part 1: Focus on Income indicator definitions and Rankings Inequality STATE OF NEW YORK CITY S HOUSING & NEIGHBORHOODS IN 2013 7 Focus on Income Inequality New York City has seen rising levels of income
At Home in the Nation s Capital: Immigrant Trends in Metropolitan Washington
 Center on Urban and Metropolitan Policy Brookings Greater Washington Research Program At Home in the Nation s Capital: Immigrant Trends in Metropolitan Washington Audrey Singer June 12, 2003 Metropolitan
Results Embargoed Until Thursday, February 22, 2018 at 12:01am
 Results Embargoed Until Thursday, February 22, 20 at 12:01am Press Contact Information Mileah Kromer Director, Sarah T. Hughes Field Politics Center mileah.kromer@goucher.edu Chris Landers chris.landers@goucher.edu
Illinois: State-by-State Immigration Trends Introduction Foreign-Born Population Educational Attainment
 Illinois: State-by-State Immigration Trends Courtesy of the Humphrey School of Public Affairs at the University of Minnesota Prepared in 2012 for the Task Force on US Economic Competitiveness at Risk:
Who Benefits from Job Creation at County Level? An Analysis of Leakage and Spillover of New Employment Opportunities in Virginia
 University of Richmond UR Scholarship Repository School of Professional and Continuing Studies Faculty Publications School of Professional and Continuing Studies 1-1-2010 Who Benefits from Job Creation
Department of Labor, Licensing and Regulation. Division of Workforce Development and Adult Learning
 Department of Labor, Licensing and Regulation Division of Workforce Development Filling the Needs and Preparing for Change Limited English Job Seekers: Now and in the Future New American Workforce No person
LIONS CLUBS INTERNATIONAL MULTIPLE DISTRICT 22 CONSTITUTION AND BY-LAWS. Multiple District 22. Serving Delaware, Maryland and District of Columbia
 LIONS CLUBS INTERNATIONAL MULTIPLE DISTRICT 22 CONSTITUTION AND BY-LAWS Multiple District 22 Serving Delaware, Maryland and District of Columbia Definition of Districts Adopted By Council of District Governors
SECTION TWO: REGIONAL POVERTY TRENDS
 SECTION TWO: REGIONAL POVERTY TRENDS Metropolitan Council Choice, Place and Opportunity: An Equity Assessment of the Twin Cities Region Section 2 The changing face of poverty Ebbs and flows in the performance
8AMBER WAVES VOLUME 2 ISSUE 3
 8AMBER WAVES VOLUME 2 ISSUE 3 F E A T U R E William Kandel, USDA/ERS ECONOMIC RESEARCH SERVICE/USDA Rural s Employment and Residential Trends William Kandel wkandel@ers.usda.gov Constance Newman cnewman@ers.usda.gov
EMBARGOED UNTIL THURSDAY 9/5 AT 12:01 AM
 EMBARGOED UNTIL THURSDAY 9/5 AT 12:01 AM Poverty matters No. 1 It s now 50/50: chicago region poverty growth is A suburban story Nationwide, the number of people in poverty in the suburbs has now surpassed
FREQUENTLY ASKED QUESTIONS (FAQs)
") FREQUENTLY ASKED QUESTIONS (FAQs) Q1. When do I need to create a guidelines worksheet in MAGS? A1. A guidelines worksheet should only be initiated and submitted for the scenarios described in the first
FREQUENTLY ASKED QUESTIONS (FAQs) Q1. When do I need to create a guidelines worksheet in MAGS? A1. A guidelines worksheet should only be initiated and submitted for the scenarios described in the first
* COURT OF SPECIAL APPEALS * OF MARYLAND. * No * * * * * * * * * * * * * * * * * * * CERTIFICATE OF SERVICE
 NEIL C. PARROTT, et al., * IN THE v. Appellants, JOHN MCDONOUGH, etc., et al., * COURT OF SPECIAL APPEALS * OF MARYLAND * September Term, 2012 Appellees. * No. 1445 * * * * * * * * * * * * * * * * * *
STRENGTHENING RURAL CANADA: Fewer & Older: Population and Demographic Crossroads in Rural Saskatchewan. An Executive Summary
 STRENGTHENING RURAL CANADA: Fewer & Older: Population and Demographic Crossroads in Rural Saskatchewan An Executive Summary This paper has been prepared for the Strengthening Rural Canada initiative by:
Sentencing Guidelines Data CODEBOOK [FOR DISTRIBUTION WITH DATA REQUESTS]
![Sentencing Guidelines Data CODEBOOK [FOR DISTRIBUTION WITH DATA REQUESTS]](/thumbs/72/67603742.jpg "Sentencing Guidelines Data CODEBOOK [FOR DISTRIBUTION WITH DATA REQUESTS]") Sentencing Guidelines Data CODEBOOK [FOR DISTRIBUTION WITH DATA REQUESTS] September 2017 Data Sources: 1. Paper Worksheets 2. Electronic Worksheets, completed and submitted via Maryland Automated Guidelines
Sentencing Guidelines Data CODEBOOK [FOR DISTRIBUTION WITH DATA REQUESTS] September 2017 Data Sources: 1. Paper Worksheets 2. Electronic Worksheets, completed and submitted via Maryland Automated Guidelines
3Demographic Drivers. The State of the Nation s Housing 2007
 3Demographic Drivers The demographic underpinnings of long-run housing demand remain solid. Net household growth should climb from an average 1.26 million annual pace in 1995 25 to 1.46 million in 25 215.
POPULATION STUDIES RESEARCH BRIEF ISSUE Number
 POPULATION STUDIES RESEARCH BRIEF ISSUE Number 2008021 School for Social and Policy Research 2008 Population Studies Group School for Social and Policy Research Charles Darwin University Northern Territory
MARYLAND STATE FIREMEN S ASSOCIATION CONSTITUTION AND BY-LAWS TABLE OF CONTENTS
 MARYLAND STATE FIREMEN S ASSOCIATION CONSTITUTION AND BY-LAWS TABLE OF CONTENTS Constitution- Page Article I Name and Membership 1 Article II Annual and Special Conventions and Conferences 4 Article III
Geographic Mobility of New Jersey Residents. Migration affects the number and characteristics of our resident population
 Geographic Mobility of New Jersey Residents Migration affects the number and characteristics of our resident population Geographic Mobility of New Jersey Residents More than 4.1 million (or 47.4%) New
In small groups work together to create lists of places you can think of that have highest populations. What continents are these countries located
 In small groups work together to create lists of places you can think of that have highest populations. What continents are these countries located on? What about most populated cities? DO NOT USE A PHONE!!!!!
Land Use, Job Accessibility and Commuting Efficiency under the Hukou System in Urban China: A Case Study in Guangzhou
 Land Use, Job Accessibility and Commuting Efficiency under the Hukou System in Urban China: A Case Study in Guangzhou ( 论文概要 ) LIU Yi Hong Kong Baptist University I Introduction To investigate the job-housing
Extended Abstract. The Demographic Components of Growth and Diversity in New Hispanic Destinations
 Extended Abstract The Demographic Components of Growth and Diversity in New Hispanic Destinations Daniel T. Lichter Departments of Policy Analysis & Management and Sociology Cornell University Kenneth
OLDER INDUSTRIAL CITIES
 Renewing America s economic promise through OLDER INDUSTRIAL CITIES Executive Summary Alan Berube and Cecile Murray April 2018 BROOKINGS METROPOLITAN POLICY PROGRAM 1 Executive Summary America s older
Mapping migrants: Australians wide-ranging experiences of immigration
 No. 13 December 2018 Mapping migrants: Australians wide-ranging experiences of immigration Charles Jacobs Mapping migrants: Australians wide-ranging experiences of immigration Charles Jacobs POLICY Paper
Meanwhile, the foreign-born population accounted for the remaining 39 percent of the decline in household growth in
 3 Demographic Drivers Since the Great Recession, fewer young adults are forming new households and fewer immigrants are coming to the United States. As a result, the pace of household growth is unusually
MULTIPLE CHOICE. Choose the one alternative that best completes the statement or answers the question.
 Exam Name MULTIPLE CHOICE. Choose the one alternative that best completes the statement or answers the question. 1) Geographers define overpopulation as A) too many people compared to resources. B) too
LEAGUE OF WOMEN VOTERS OF MARYLAND STUDY GUIDE: DEVELOPMENT RIGHTS AND RESPONSIBILITIES AGREEMENTS CONTENTS FREDERICK COUNTY LWV POSITION ON DRRAS
 LEAGUE OF WOMEN VOTERS OF MARYLAND STUDY GUIDE: DEVELOPMENT RIGHTS AND RESPONSIBILITIES AGREEMENTS February 6, 2017 The following material is provided by the Study Committee to provide additional background
The Effects of Housing Prices, Wages, and Commuting Time on Joint Residential and Job Location Choices
 The Effects of Housing Prices, Wages, and Commuting Time on Joint Residential and Job Location Choices Kim S. So, Peter F. Orazem, and Daniel M. Otto a May 1998 American Agricultural Economics Association
State of Rural Minnesota Report 2014
 State of Rural Minnesota Report 2014 Introduction In 1997, a group of rural Minnesota advocates came together to create a rural policy think tank that would provide policy makers, rural advocates and concerned
In abusiness Review article nine years ago, we. Has Suburbanization Diminished the Importance of Access to Center City?
 Why Don't Banks Take Stock? Mitchell Berlin Has Suburbanization Diminished the Importance of Access to Center City? Richard Voith* In abusiness Review article nine years ago, we examined the role that
The State of Rural Minnesota, 2019
 P.O. Box 3185 Mankato, MN 56002-3185 (507)934-7700 www.ruralmn.org The State of Rural Minnesota, 2019 January 2019 By Kelly Asche, Research Associate Each year, the Center for Rural Policy and Development
Population Vitality Overview
 8 Population Vitality Overview Population Vitality Overview The Population Vitality section covers information on total population, migration, age, household size, and race. In particular, the Population
Maryland Judiciary FY 2009 Statewide Caseflow Assessment. Methodology- and Datal Application Issues. Circuit Courts
 Maryland Judiciary FY 2009 Statewide Caseflow Assessment Methodology- and Datal Application Issues Circuit Courts Administrative Office of the Courts November 1,2010 FY 2009 Maryland Judiciary Statewide
Summary of the U.S. Census Bureau s 2015 State-Level Population Estimate for Massachusetts
 Summary of the U.S. Census Bureau s 2015 State-Level Population Estimate for Massachusetts Prepared by: Population Estimates Program For Release December 22, 2015 On December 22, 2015, the U.S. Census
Vermonters Awareness of and Attitudes Toward Sprawl Development in 2002
 Vermonters Awareness of and Attitudes Toward Sprawl Development in 2002 Written by Thomas P. DeSisto, Data Research Specialist Introduction In recent years sprawl has been viewed by a number of Vermont
URBAN CONCENTRATION: PROSPECTS AND IMPLICATIONS
 URBAN CONCENTRATION: PROSPECTS AND IMPLICATIONS Roger G. Noll Associate Professor of Economics California Institute of Technology Two familiar phenomena characterize American population distribution. First,
The Brookings Institution
 The Brookings Institution Metropolitan Policy Program Bruce Katz, Director Understanding Regional Dynamics: Implications for Social and Economic Justice Understanding Regional Dynamics: Implications for
The Cost of Segregation
 M E T R O P O L I T A N H O U S I N G A N D C O M M U N I T I E S P O L I C Y C E N T E R R E S E A RCH REPORT The Cost of Segregation Population and Household Projections in the Chicago Commuting Zone
Appendix A: Economic Development and Culture Trends in Toronto Data Analysis
 Appendix A: Economic Development and Culture Trends in Toronto Data Analysis Introduction The proposed lenses presented in the EDC Divisional Strategy Conversation Guide are based in part on a data review.
Population & Migration
 Population & Migration Population Distribution Humans are not distributed evenly across the earth. Geographers identify regions of Earth s surface where population is clustered and regions where it is
At Home in the Nation s Capital: Immigrant Trends in Metropolitan Washington
 Brookings Greater Washington Research Program At Home in the Nation s Capital: Immigrant Trends in Metropolitan Washington Audrey Singer 1 Remarkably, some 47.5 percent of Washington s foreign born arrived
Trends and Changes Affecting Upstate New York. David L. Brown & Robin Blakely-Armitage State of Upstate Conference June 8, 2011
 Trends and Changes Affecting Upstate New York David L. Brown & Robin Blakely-Armitage State of Upstate Conference June 8, 2011 Challenges & Opportunities Change, not stability, is the normal situation
MIGRATION CHALLENGES
 MIGRATION CHALLENGES Trends in People s Movement to and from the Milwaukee Area and Wisconsin Illuminate Important Issues By John D. Johnson and Charles Franklin Marquette Law School launched the Lubar
New Jersey Long-Range Transportation Plan 2030
 New Jersey Long-Range Transportation Plan 2030 Task 7.3 Demographic Analysis Technical Memorandum Prepared for: New Jersey Department of Transportation Prepared by: DMJM Harris, Inc. March 2006 TABLE OF
Results Embargoed Until Wednesday, September 19, 2018, at 12:01 a.m.
 Results Embargoed Until Wednesday, September 19, 20, at 12:01 a.m. Press Contact Information Mileah Kromer Director, Sarah T. Hughes Field Politics Center mileah.kromer@goucher.edu Stephanie Coldren Associate
Greater Golden Horseshoe Transportation Plan
 Greater Golden Horseshoe Transportation Plan Socio-Economic Profile Executive Summary October 2017 PREPARED BY Urban Strategies Inc. and HDR for the Ministry of Transportation SOCIO-ECONOMIC PROFILE -
 http://www.youtube.com/watch?v=ymwwrgv_aie Demographics Demography is the scientific study of population. Demographers look statistically as to how people are distributed spatially by age, gender, occupation,
The Brookings Institution Metropolitan Policy Program Bruce Katz, Director
 The Brookings Institution Metropolitan Policy Program Bruce Katz, Director State of the World s Cities: The American Experience Delivering Sustainable Communities Summit February 1st, 2005 State of the
Population & Migration
 Population & Migration Population Distribution Humans are not distributed evenly across the earth. Geographers identify regions of Earth s surface where population is clustered and regions where it is
The New Metropolitan Geography of U.S. Immigration
 The Brookings Institution Metropolitan Policy Program Audrey Singer, Immigration Fellow The New Metropolitan Geography of U.S. Immigration Mayors Institute on City Design Rethinking Neighborhoods for Immigrants
STRENGTHENING RURAL CANADA: Fewer & Older: The Coming Population and Demographic Challenges in Rural Newfoundland & Labrador
 STRENGTHENING RURAL CANADA: Fewer & Older: The Coming Population and Demographic Challenges in Rural Newfoundland & Labrador An Executive Summary 1 This paper has been prepared for the Strengthening Rural
MULTIPLE CHOICE. Choose the one alternative that best completes the statement or answers the question.
 Chapter 3 Practice Exam Name MULTIPLE CHOICE. Choose the one alternative that best completes the statement or answers the question. 1) Which of the following statements reflects the environmental impact
Shyam S. Bhatia and Kazimierz J. Zaniewski. Department of Geography. University of Wisconsin - Oshkosh
 POPULATION CHANGE IN WISCONSIN, 1980-1990 Shyam S. Bhatia and Kazimierz J. Zaniewski Department of Geography University of Wisconsin - Oshkosh During the 1980's Wisconsin experienced a slow growth in population.
Leaving the Good Life: Predicting Migration Intentions of Rural Nebraskans
 University of Nebraska - Lincoln DigitalCommons@University of Nebraska - Lincoln Publications from the Center for Applied Rural Innovation (CARI) CARI: Center for Applied Rural Innovation November 1998