Inequality and Economic Growth in Emerging Market Economies
|
|
|
- Amanda Howard
- 5 years ago
- Views:
Transcription

1 MASTER THESIS Inequality and Economic Growth in Emerging Market Economies A Comparative Analysis of Indonesia and Korea Muhammad Rihan Handaulah MSc Program Engineering and Policy Analysis Faculty of Technology Policy and Management Delft University of Technology, The Netherlands
2 i
3 Inequality and Economic Growth in Emerging Market Economies: A Comparative Analysis of Indonesia and Korea MASTER THESIS Submitted in partial fulfillment of the requirement for the degree of Master of Science in Engineering and Policy Analysis Author: Muhammad Rihan Handaulah Student number: ri.handaulah@gmail.com Graduation date: 28 November 2014 Graduation Committee: Chairman: Prof. Dr. C.P. van Beers Full Professor, Head of the section Economics of Technology and Innovations First Supervisor: Dr. S.T.H. Storm Section Economics of Technology and Innovations Second Supervisor: Dr. W. Ravesteijn Section Values and Ethics of Technology MSc Program Engineering and Policy Analysis Faculty of Technology, Policy and Management Delft University of Technology, the Netherlands ii
4 iii This page is intentionally left blank
5 Abstract For the last four decades, inequality has been increasing in both industrialized and emerging market countries. Inequality is a concern in development due to social-ethical and economic rationale. Inequality can impair social well-being which leads to political unrest. Also it can trigger the economic instability and hamper the economic growth. Although it is not a recent debate in the development economics, the opinion on this topic is still diverging. Thus, this research aims to examine the relationship between economic growth and inequality then analyze its influencing factors in the context of emerging market economies. It proposes to go beyond most of the earlier studies in the case countries (Indonesia and Korea) by two approaches. First, it employs Theil s T statistics method to assess how the changes in economic structure have driven inequality and economic growth as presumed by Simon Kuznets. Second, it examines the influencing factors of inequality with a special attention to economic policy then puts it into the institutional and historical context of Indonesian and Korean economies. As the conclusion, Indonesia and Korea did not follow Kuznets hypothesis in the earlier phase of their rapid yet equal economic growth from 1960s until 1990s, but the hypothesis held true afterward. In Indonesia, the increasing trend of inequality was mainly driven by the service sector, while in Korea it was driven by the financial sector. This was influenced by the transition from an authoritarian to a democratic regime, which has caused a profound change in their economic policies from a coordinated and planned economy to a more liberal economy. Keywords: inequality, Kuznets hypothesis, Theil s T, economic policy, economic growth iv
6 v This page is intentionally left blank
7 Executive Summary For the last four decades, inequality has been increasing in both industrialized and emerging market countries. Inequality is a concern in development due to its social-ethical and economic rationale. Inequality can impair social well-being which leads to political unrest. Also it can trigger economic instability and hamper economic growth. Indeed, inequality is not a recent debate in development economics. Previous studies have focused on many factors such as economic policy, labor, education, health, culture, technology, political economy, etc. This research aims to examine the relationship between economic growth and inequality, then analyze its influencing factors in the context of emerging market economies. Thus, it proposes to look into the inequality-growth relationship anew and go beyond most of the earlier studies in the case countries (Indonesia and Korea) by two approaches. First, it employs Theil s T statistics method to assess how the changes in the economic structure have driven inequality and economic growth as presumed by Simon Kuznets. Kuznets supposes the existence of an inverted U-shape curve between inequality and economic level in which inequality first rises along the growing economy then followed by a decline inequality despite the economy keeps growing. This pattern is driven by the structural economic transition. Second, it examines the influencing factors of changing inequality with a special attention to economic policy then puts it into institutional and historical context of Indonesian and Korean economies. A regression model is developed to identify the correlation between these factors and inequality. The motivation of this comparative analysis is based on the fact that Indonesia and Korea experienced rapid economic growth and structural transition. They have managed to leap from low income countries in 1960s to high income (middle income for Indonesia) countries nowadays, with massive structural transition from agriculture to industry and services. Moreover, they also experienced some profound changes in their institution which have influenced the orientation of their economic policy, especially in the mid-1990s when both countries fell into the economic crises and most of the new economic policies were suggested by the donor institution. Theil s T method shows, despite the declining trend of economic inequality in terms of sectoral and regional GDP, income inequality is increasing since 1990s in Indonesia and Korea. Theil s T index calculated from regional and sectoral wage data confirms the official Gini ratio measurement. It indicates service sector (in Indonesia) and financial sector (in Korea) as the main driver of this rising income inequality. Then, the regression model shows this trend is correlated with some economic policies which are, for Indonesia case, fiscal policy in terms of declining tax ratio and progressiveness, and economic openness in terms of declining tariff rate. For Korea, these are monetary policy in terms of higher real interest rate, and investment in real economy in terms of declining gross-fixed capital formation. Moreover, there are also correlation between income inequality and technological progress in terms of capital-to-labor ratio in both countries. Looking back to the 1960s-1990s period; Indonesia and Korea not only experienced rapid economic growth but also steady inequality within moderate levels. They have been successful to manage growth with equity. However, this was influenced by the transition from an authoritarian to a democratic regime, which has caused a profound change in their economic policies from a coordinated and planned economy to a more liberal economy. Revisiting the debate about Kuznets theory, it is concluded that the existence of Kuznets curve could be a common phenomenon unless there is a force (more active role of the government) governing income distribution and growth. Therefore, a free-market economy would be more likely to create an unequal economic growth. vi
8 vii This page is intentionally left blank
9 Acknowledgement Despite my keen interest to economics, to choose an economics topic for my master thesis was not an easy decision. Besides my engineering background that is not related to economics, it will somehow determine the shift of my career in the future, so everything should be considered in the right way. With this respect, I am so lucky to have Dr. Servaas Storm as my first supervisor who has patiently guided me to understand the content of this thesis and put wider perspective of some development issues. His abundant helps and advices in many things are really valuable for me. I would like to thank also to Dr. Wim Ravesteijn, my second supervisor, his critical comment has really helped me to put this thesis into policy making context. My gratitude is also dedicated to Prof. Cees van Beers as the chairman of the master thesis committee who grants me a big trust in conducting this research independently. I am also indebted to one of the leading economists in this topic, Prof. James K. Galbraith from University of Texas at Austin, to whom I learn the Theil s T method and his feedback is really valuable to improve this thesis, also his student Jaehee Choi who helped me collect some Korean data. I would like to thank especially to Dr. Bert Enserink, EPA program coordinator, and Ms. Toke Hoek for their professionalism in managing EPA program, to MCIT (Ministry of Communication and Information Technology) who provides me funding during my master study. I am indebted to many people who morally support me in finishing my study, to my EPA friends, my Indonesian friends, my family in Indonesia and especially my beloved wife, Nada Ristya Rahmani who always motivates and helps me to focus in finishing this thesis. Finally, I really hope that this manuscript will contribute to the discourse in economics, and for policy makers, it can be seen as something beneficial. Rihan Handaulah Delft, November 2014 viii
10 ix This page is intentionally left blank
11 Table of Contents Chapter 1 Introduction Background Research problem: inequality and its determinants The relation between inequality and economic growth The determinants of inequality Research: gap, objective, and questions The relevance of Indonesia and Korea case Research methods Outline of the thesis... 8 Chapter 2 Theoretical and empirical analyses of inequality and its causes: a literature review The structural relation between inequality and economic growth Inequality measurement: Gini ratio and Theil s T index The influencing factors of inequality Inequality in emerging market economies measured by Theil s T method Chapter 3 Economic growth, inequality and its influencing factors in Indonesia, The structural relation between economic growth and inequality in Indonesia Economic inequality in Indonesia Income inequality and its contributing elements in Indonesia Technological progress and inequality in Indonesia The influencing factors of inequality in Indonesia Methodology and data Regression result Chapter 4 Economic growth, inequality, and its influencing factors in Korea, The structural relation between economic growth and inequality in Korea Economic inequality in Korea Income inequality and its contributing elements in Korea Technological progress and inequality in Korea The influencing factors of inequality in Korea Methodology and data Regression result Chapter 5 Policy analysis of growth and inequality; from growth with equity era to liberal economy era Policy and institutional change in Indonesia and Korea x
12 5.1.1 Economic policy and institution during growth with equity era The 1997 Asian crisis and economic liberalization Inequality and economic policy in the last two decades Comparative analysis on the structural relation between inequality and economic growth in Indonesia and Korea Comparative analysis of the influencing factors of inequality in Indonesia and Korea Chapter 6 Conclusions and reflection Answering the research questions Question on the structural relation between economic growth and inequality Question on the influencing factors of inequality Question on the policy analysis of inequality Concluding remark: the debate on Kuznets theory and policy for growth with equity Limitation and further research Reflection References Appendix A Appendix B xi
13 List of Figures Figure 1 Trend in global income inequality (mean difference in GNI per capita, Atlas method) between 88 countries, Figure 2 Research flow diagram... 7 Figure 3 The Kuznets' Curve... 9 Figure 4 The Augmented Kuznets Curve Figure 5 The demand shift of skilled-unskilled labor Figure 6 Lorenz curve Figure 7 GDP per capita and GDP growth rate, Indonesia, Figure 8 The decomposition of GDP, Indonesia, Figure 9 The Theil s T index of economic inequality in Indonesia, Figure 10 The contribution of sectors to GDP distribution inequality in Indonesia, Figure 11 The contribution of provinces to GDP distribution inequality in Indonesia, Figure 12 The map of Indonesia by province Figure 13 The Theil's T index of income inequality in Indonesia, Figure 14 The Theil s T index of income inequality (purchasing power adjusted) in Indonesia, Figure 15 Income inequalities in Indonesia measured by the Gini ratio and the Theil s T index Figure 16 The contributors of income inequality in Indonesia by sector Figure 17 The contributors of income inequality in Indonesia by provinces Figure 18 The capital to labor ratio and the Gini ratio in Indonesia, Figure 19 GDP per capita and GDP growth rate, Korea, Figure 20 The decomposition of GDP, Korea, Figure 21 Theil s T index of economic inequality in Korea, Figure 22 The contribution of sectors to economic inequality in Korea, Figure 23 The contribution of provinces to economic inequality in Korea, Figure 24 The map of Korea by region Figure 25 The Theil's T index of income inequality in Korea, Figure 26 Income inequality in Korea measured by the Gini ratio and the Theil s T index Figure 27 The contributors of income inequality in Korea by sector Figure 28 The contributors of income inequality in Korea by province Figure 29 The capital to labor ratio and the Gini ratio in Korea, xii
14 List of Tables Table 1 The share of GDP and working population by sector, Indonesia Table 2 The share of region in GDP and working population, Indonesia Table 3 The cost of living index, derived from provincial minimum wage Table 4 The result of correlation test between Indonesian the Theil s T index and the Gini ratio Table 5 The result of correlation test between the capital to labor ratio and the Gini ratio, Indonesia Table 6 Description and data sources of the variables used in regression analysis Table 7 The dependent and independent variable (missing variables are removed/ replaced) for Regression Analysis, Indonesia Table 8 The regression table of Inequality influencing factor, Indonesia Table 9 The percentage of GDP by sector, Korea Table 10 The share of GDP and number of labor by province, Korea Table 11 The result of correlation test between Indonesian Theil index and Gini ratio Table 12 The result of correlation test between capital to labor ratio and Gini ratio, Korea Table 13 Description and data sources of the variables used in regression analysis Table 14 Dependent and independent variable (missing variables are removed/ replaced) for Regression Analysis, Korea Table 15 The regression table of Inequality influencing factor, Korea Table 16 The comparison of structural relation between inequality and economic growth Table 17 The comparison of inequality influencing factors xiii
15
16 Chapter 1 Introduction 1.1 Background For the last four decades inequality has been increasing in both developing and developed countries (Galbraith, 2007, Stiglitz, 2013, Piketty, 2014). This finding is also confirmed by the survey of global public perception by The World Economic concluding that severe income disparity is the most important global risk (Howell, 2013). Moreover, a study from ILO has shown an increasing ratio between the average incomes of the 20 richest nations with the 20 poorest countries, from 53 in the year 1960 to 121 in 2000 (van der Hoeven, 2010). The same trend can also be seen in the World Bank report which measures inequality between 88 nations based on GNI per capita (Figure 1). These make inequality issue, either within a country or between countries, an urgent matter for the global economy. Figure 1 Trend in global income inequality (mean difference in GNI per capita, Atlas method) between 88 countries, Source: World Bank Development Indicators Database, reprinted from Vogli (2014) How does inequality become a problem in economic development? First, we need to specify what kind of inequality we are concerned about since inequality is an inevitable feature of a society. Inequality always exists, even in countries with an ideological claim of equality such as the (former) communist countries. One could argue that a certain degree of inequality must exist to create incentives for people to study, work, or make economic decisions. However, economists focus on excessive inequality: a degree of income or wealth disparity which is significant enough to create problems in society (Milanovic, 2010). 1
17 Then, the vast impact of inequality or the urgent need of equity in economic development can be described by two rationales; the social-ethical and the economic rationale (Galbraith, 2002). The social-ethical rationale is closely related with the concept of economic justice in which a perceived sense of injustice will accumulate in unequal societies. In some cases in history, this perception of injustice led to rebellion or social unrest (Sen, 1997). But some forms of inequality can also be a hindrance to economic growth, as was highlighted by the classical economists. David Ricardo analyzed income disparity between worker s wage, entrepreneur s profit, and landlord s rent in the early industrialization era. Ricardo explained the income gap which was created when landlords enjoyed windfall rent of their land due to rising demands for workers food and primary commodity (e.g. cotton). In the same time, labor income declined because the entrepreneurs had to maintain their profits share. Hence, while the landlords enjoyed increasing rent and the entrepreneurs still earned their profit, the labors wage were squeezed. This Ricardian analysis was also employed by Karl Marx to diagnose the exploitation of working class that led to severe inequality and escalated into upheavals in history (Cline, 1975). In line with the argument about social justice, inequality could also threat the democracy and create political instability. For example, voter turnout in the US shows to be lower in states with higher inequality (Galbraith and Hale, 2008, Stiglitz, 2013). Galbraith (2002) also shows how the society of Nordic countries compared to less equal southern European countries are more prosperous, stable, and peaceful; with lower rate of unemployment, crime, and poor; also better public services. Another empirical study from Wilkinson and Pickett (2010) correlates inequality with several social and health issues. Inequality is correlated positively with several substantial social problems including such as lower educational score, more drug abuse, higher prevalence of mental illness, higher infant mortality, worse child wellbeing, higher teenage birth rate, higher rate of homicide and imprisonment, more obesity case, and lower social mobility. These problems arose because inequality had created a delicate social fabric, in which social trust and social cohesion diminished (Wilkinson and Pickett, 2010). Meanwhile, the economic rationale for equity in the development mainly focuses on the impact of inequality to economic growth and stability. The argument from Keynesian economists principally emphasizes aggregate demand as the critical part in economic cycle (Krugman, 2012, Palley, 2012). From their perspective, the economic output is determined by the level of aggregate demand that would be undermined if income disparity is high (because the rich groups save or invest more of their income compare to the lower-income groups who spend most of their income). Thus, economic downturn happens when there is an imbalance between the supply side (profit and investment) and the demand side, e.g. due to stagnating wages that causes shrinking consumption. If this happens, a debt bubble in financial sector will be created in order to keep the economy growing in short run, such as subprime mortgage case in the US. This accumulated debt will eventually burst as the crisis when the debtors default in their payments. Therefore, inequality and the way it is generated eventually undermine growth and cause economic instability (Stiglitz, 2013). Another economic rationale comes from some neo-classical economists who argue that sufficient level of equality is necessary for the development because high level of inequality will create a weak fundament for the prudent macroeconomic policy. For example, when comparing Asian tiger countries, which had persistent economic growth and successfully developed their industries since the 1960s, versus Latin America countries, the development economists Felipe Larrain and Rodrigo Vergara noted: Inequality leads to social pressures that governments have attempted to relieve through populist policies. After one or two years of economic expansion inflation soars, real wages fall, unemployment 2
18 starts to increase, and output declines. The policies prove unsustainable, and the government has to switch to another set of policies. Many countries in the [Latin American] region have suffered this populist cycle, some of them more than once. In East Asia, the situation has been the opposite. A very equitable income distribution has facilitated macroeconomic stability in (Rodrik, 1995) In addition, other empirical studies suggest that the relationship between income distribution and economic growth is positive or, at least, neutral (Alesina and Rodrik, 1994, Clark, 2006). Therefore the pursuit of redistribution could principally have a positive effect on economic growth and development. Indeed, inequality is not a recent discourse in economics. It has been one of the main issues in economics since the classical economist such as David Ricardo. Later, inequality became the center of the development debate in the post-world war period when macroeconomic strategies of redistribution with growth were considered as the priority to generate employment and alleviate poverty. At the end of the twentieth century, inequality once again became a focus. This was mainly due to globalization and economic crisis that distort income distribution and exacerbate inequality (Anand and Kanbur, 1993, Galbraith, 2012, Cline, 1975). Nevertheless, the arguments addressing this topic are also still lacking of unanimity that makes research on this topic is relevant. The debate mainly revolves around the effect of inequality on the economy and the explanation of the determinants of inequality 1. In order to make the scope clear, this research will only focus on the influencing factors of inequality in the context of emerging market economies. The relevance of research on inequality in the context of emerging market economies can be explained by two reasons. Firstly, emerging market economies are experiencing rapid growth and structural transition (Fields, 2007). This is an essential feature in studying the relation between economic growth and inequality that is driven by the structural transition as elaborated by the Nobel laureate Simon Kuznets in 1955 based on early industrialized countries (US and Europe) experiences. Secondly, along with the expansion of globalization, emerging market economies are prone to economic openness and pro-market policy as the strategy to boost economic growth. Some literatures have discussed that pro-market policy and economic openness are correlated with growing inequality. Therefore, this study will seek confirmation for the case (Sharma and Morrisey, 2006, Anderson, 2005). 1.2 Research problem: inequality and its determinants Inequality is described as the statistical measurement of income distribution resulting from the social and economic structure shaped by several influencing factors 2 (Edward, 2006, Kuznets, 1955). Hence, the discussion about inequality could be categorized into the description and analysis of inequality trends, also the explanation to its influencing factors The relation between inequality and economic growth A prominent theory that explained the relation between inequality and economic growth was developed by Simon Kuznets. Kuznets theory explains the existence of an inverted U-shape curve between inequality and economic level based on structural economic transition. Kuznets explains his 1 For the debates on the effect of inequality to the economy and the determinants of inequality please see below as some references: GALBRAITH, J. K Inequality and Instability: A Study of the World Economy Just Before The Crisis, New York, Oxford University Press. PALLEY, T. I From Financial Crisis to Stagnation, New York, Cambridge University Press. 2 Statistical methods can be employed to measure inequality such as Gini coefficient, Theil s T, and quintile ratio. 3
19 inverted-u curve as the result of the transition from agricultural to industrial society. Urbanization occurs in the earlier phase of industrialization and leads to a widening gap between urban and rural. Next, the industrialization process continues to produce more income subsequently, causing the restructuration of labor payment by which wage increases and more workers are absorbed by industries. As the result, inequality will decrease along the higher income (Kuznets, 1955). Although the existence of Kuznets inverted U curve has not been uniformly observed, most of the empirical studies support the core proposition of the Kuznets theory that economic inequality is driven by the economic structure and inter-sectoral dynamics 3. This proposition could explain why in several developed countries inequality tends to rise again after a period of decline (Galbraith, 2011). If Kuznets originally explained that inequality was increasing due to the transition from agricultural to industrial economy, then this recent trend is due to the transition from manufacturing sector to service or finance sectors which has changed wages and profits distribution. Thus, Kuznets put forward a fundamental notion that inequality is a matter of economic structure in aggregate level of society, and more specifically, inter-sectoral change within the economy (Galbraith, 2012) The determinants of inequality The recent discourse in the influencing factors of inequality, particularly in the context of emerging market economies, could be classified into macroeconomic and economic openness issues. The macroeconomic issue could be further classified as the monetary policy and fiscal policy debates. The major debate in monetary policy is concerning whether economic priority should be given to the full employment goal or to the low inflation target, and the debate in fiscal policy is regarding the government s role in economy related to tax, government spending, and regulation. A recently popular framework in monetary policy is the inflation targeting framework (Palley, 2012, Anderson, 2005). In principle, it prioritize low inflation target over full employment as the goal of monetary policy. The inflation targeting framework relies on the theory of NAIRU (non-accelerating inflation rate of unemployment) which supposes the central banks to maintain the level unemployment on its natural level of unemployment (NAIRU) in order to avoid accelerated inflation. The central bank will set this level by using monetary instrument specifically high interest rate (Anderson, 2005). Thus, it will exacerbate income disparity through unemployment resulted from this policy (Galbraith, 2012, Palley, 2012). However, the opinions on this issue are not converging yet. On the other hand, it is argued that the inflation targeting framework would lead to lower unemployment thus lower inequality via trickling down effect due to the preferred investment climate (low inflation). Even inflation is believed to worsen income distribution, so curbing inflation will reduce inequality (Ravallion, 2001, Li and Zou, 2002). The second macroeconomic issue is fiscal policy, especially concerning the role of government in economy 4. Proponents of the free market economy generally suppose government should not interfere with market because their intervention may create distortion that leads to inefficiency. It is 3 Several studies about verification of Kuznets curve, see: GALBRAITH, J. K Inequality, unemployment and growth: New measures for old controversies. The Journal of Economic Inequality, 7, BARRO, R. J Inequality and Growth in a Panel of Countries. Journal of Economic Growth, 5, DEININGER, K. & SQUIRE, L New ways of looking at old issues: inequality and growth. Journal of Development Economics, 57, See: GALBRAITH, J. K Inequality and Instability: A Study of the World Economy Just Before The Crisis, New York, Oxford University Press, STIGLITZ, J. E The Price of Inequality, New York, W. W. Norton, DEININGER, K. & SQUIRE, L New ways of looking at old issues: inequality and growth. Journal of Development Economics, 57, , PAPANEK, F. & KYN, O The Effect of Income Distribution of Development, The Growth Rate and Economic Strategy. Ibid.23, 65-75, EDWARD, P Examining Inequality: Who Really Benefits from Global Growth? World Development, 34,
20 called government s failure (Wade, 2004). Practically, the government is expected neither to tax heavily nor to regulate the market. This framework is usually formulated with deregulation, privatization, and anti-subsidy policies or called small government agenda. Stiglitz (2013) argues that this agenda would cause inequality increases since the government s fiscal capacity to serve the public from all level of society will diminish, and consequently, the opportunity of public to afford decent service such as health, housing, and education will become smaller. Meanwhile, the issue of economic openness is mainly about the benefit and cost of the engagement in globalization and participating in free trade agreement, especially its impact to income distribution. In general, the advocates of globalization presume that economic openness, in term of trade and finance, will bring more volume of transaction leading to rapid economic growth and more job creation. This concept is based on neoclassical assumption of the perfect market and the theory of comparative advantage (Palley, 2011). However, this concept is not free from critics. Several studies have been conducted to investigate the effect of engagement in globalization to inequality and they found negative impact of globalization to income distribution (See: Stiglitz, 2013, Wade, 2004, Palley, 2012, Sharma and Morrisey, 2006). This impact happens in two ways. The first is because economic openness creates trade imbalance between developed and developing countries. The second is because economic openness is usually followed by weaker regulation in labor market that causes stagnating wage in industries yet rising profit. The labor s bargaining power in claiming wage is also weakened by the easiness of capital to leave the country. 1.3 Research: gap, objective, and questions The previous description has demonstrated some theoretical and empirical issues of the discourse on inequality. It gives us a rough estimation on how diverse opinions are in each subject. This research proposes to look into the inequality-growth relationship anew and go beyond most of the earlier studies in the case countries. - Regarding the structural relation between economic growth and inequality, the research will enhance the debate about Kuznets theory by employing Kuznets proposition of structural transition as a main factor driving changes in inequality in both countries, and relating the trend with the policy choices. To answer this question, I will first provide a literature survey, because there are already several studies concerning the structure of inequality in the case countries. But the published studies on the case countries mainly focus on regional, gender, and rural-urban inequality and do not explicitly address the question how structural change is affecting inequality. Thus, this research will mainly focus on how a change in economic structure (defined in terms of economic sectors: industry, mining, agriculture, and service) has driven inequality and economic growth in South Korea and Indonesia. - Regarding the determinants of inequality as previously explained, this research will enhance the discourse in two ways. First, it will bring the most recent empirical facts of inequality in the context of emerging countries. Second, it will examine the key determinants of changing inequality over time. Although there are already several deep and comprehensive observations from previous studies in some countries, the recent study case of Korea and Indonesia are not available. Following the case description above, one main question and three sub questions are proposed to be elaborated by the research activities: 5
21 What is the relationship between economic growth and inequality, and how could that be explained and influenced in emerging market economies like Indonesia and Korea? In order to answer this main question, the sub-questions are divided into three groups. The first is about the structural relation between economic growth and inequality, the second is the influencing factors of inequality specifically macroeconomic policy and economic openness, and the last one is the policy aspect of inequality. I. What is the structural relation between economic growth and inequality in both countries? a. How does the dynamic of economic sectors, regions, and technology contribute to economic growth and employment share? b. How does the income inequality as indicated by Theil s T statistics method change over time? II. What are the influencing factors of inequality in both countries? a. What is the effect of macroeconomic policy to inequality? b. What is the effect of economic openness to inequality? III. What is the policy analysis of inequality in both countries? a. How is the comparison of economic policy and institutions in Indonesia and Korea? b. What are possible policy recommendations to create more inclusive economic growth in emerging market economies? 1.4 The relevance of Indonesia and Korea case Emerging market economies are the countries with rapid growth and industrialization, and typically were least developed countries with low incomes in the past decades, but now they are emerging as the middle or even high income countries. Two among them are Indonesia and Korea. An abbreviation of MIST (Mexico, Indonesia, South Korea, and Turkey) was introduced by Jim O Neill of Goldman Sachs, who also popularized BRICS term, to label a group of the most important emerging market economies in the 21 st century. Indonesia and Korea have similar size in economy and belong to the G20 countries. Korea ranks 16 th and Indonesia ranks 17 th in terms of GDP. They also include to a group of eight Asian countries that experienced East Asian Miracle, the popular term to call a group of rapid industrialization countries in Asia and shared some stylized facts in the process of industrialization. Moreover, both countries have same experience of monetary crisis in 1997 and institutional transition from an authoritarian to a democratic regime (Storm and Naastepad, 2005, Stiglitz, 1996). Despite the similarities explained above, in term of GDP per capita and industrialization level, Korea is more advanced than Indonesia (World Bank, 2013). Therefore it is quite reasonable to perceive that Korea represents 1 st tier and Indonesia represents 2 nd tier of successful industrializing country in emerging market economy. Based on these substantial similarities and differences, a comparative study on inequality between Indonesia and Korea is supposed to depict clearer relation between inequality and economic growth in the context of emerging market economy. Furthermore, social relevance of this research is justified by the fact that both countries have been experiencing rising inequality. Despite their impressive economic growth, the official data (OECD and BPS-Statistics Indonesia) shows that the Gini ratio in Korea has increased from 0.26 in 1990 to 0.31 in 2011 and the Gini ratio in Indonesia has increased from 0.32 in 1990 to 0.41 in Therefore, this explanatory research might contribute as a reference for policy making. 6
22 1.5 Research methods The research method comprises three approaches. The first is Theil s T statistic method to investigate the first research question about the structural relation between economic growth and inequality. This statistics method was developed by Henry Theil in 1967 and later has been used extensively by James Galbraith from the University of Texas Inequality Project (UTIP) in early 2000 s to investigate inequality in several countries. It calculates inequality from income data and number of population based on particular groups. These groups can be economic sector, region, social class, urban-rural, or any categorization which is mutually exclusive. 5. The advantage of Theil s T statistic method is that it decomposes inequality into group (sectoral and regional) contribution. Thus, we can analyze which sector or region wins or loses in the term of its income and population share. The second is multivariate regression analysis to investigate correlation of macroeconomic policy and economic openness to inequality in the second question. The core formula for this econometric model will be such as, The detail of the equation will be explained in the next chapter. The research basically attempts to find the correlation between change in inequality as the dependent variable and macroeconomic (monetary and fiscal) policy also economic openness as the independent variables over time. Several studies such as from Cornia (2010) has used similar approach for the Latin America case. The last one is comparative analysis of the institutional context and historical background of those key policies that influence inequality in both countries. It will then be followed by a synthesis of policy recommendation to create a more equal economic growth in emerging market economies. This research method is illustrated in Figure 2. GDP and employment decomposition Payroll and employment (sector and region) Macroeconomic policy Economic openness Inequality (Theil s T) Determining factors of inequality (econometric model) Comparison and policy recommendation Answer to RQ I Answer to RQ II Answer to RQ III Main Question Figure 2 Research flow diagram 5 There are already several studies of inequality in Indonesia using Theil s T statistic method based on inter-regional data between rural and urban region. See: WALKER, D. O Patterns of income distribution among world regions. Journal of Policy Modeling, 29, BAUMOL, W. J. Ibid.On income distribution and growth
23 Data and information required to support this research mainly comprises of: 1) Two levels of economic structural decomposition including: output, employment, and salary 2) Macroeconomic parameters such as: inflation, unemployment, tax to GDP ratio, trade and payment balance, FDI to GDP ratio, capital to labor ratio, Gini index, etc. The data included are within the time-range of the 1990s until the most recent years and are collected mainly from official documents of relevant institutions e.g. World Bank, Indonesian Statistical Bureau (BPS), and Korean Statistics Information Service (KOSIS). The information on prior analyses will be obtained from various academic journals. 1.6 Outline of the thesis This report is organized as follows: Chapter ONE will serve as the introduction and all relevant attributes of the research including: the background, problems and objectives, questions and methodology. Chapter TWO will discuss several important theoretical and empirical issues on inequality and its causes including Kuznets theory about the structural relation between inequality and economic growth, inequality measurement by Gini ratio and Theil s T index, relation between technological change and inequality, and the determinants of inequality. Chapter THREE will address the first and the second research question for the Indonesian case. These are about structural relation between economic growth and inequality, and the second research question about the influencing factors of inequality. For the first research question, Theil s T statistics method will be employed to answer the issue about economic inequality and income inequality, and regression analysis will be employed to answer the second one about the influencing factor of inequality in Indonesia. Chapter FOUR will address the same research questions but for the Korean case. Hence, the organization will be the same as the previous chapter. Nevertheless, in order to make a clear and concise explanation in respect to the research question, chapter three and four will be more descriptive rather than analytic. A thorough and comparative analysis based on findings in the previous chapter will be delivered in Chapter five. Chapter FIVE discusses policy aspect of inequality based on study case in both countries. It compares lesson learned from both cases and synthesizes the policy recommendation. Finally, the (policy) conclusions that answer the research questions are formulated in Chapter SIX. We conclude the report by reflecting on the research project: what have we learned? What could have been done better or differently? What are the implications of this research for future research? 8
24 Chapter 2 Theoretical and empirical analysis of inequality and its causes: a literature review 2.1 The structural relation between inequality and economic growth There are several concepts of economic structure and structural transition in the development economics literature. The most common concept of economic structure is defined as the relative importance of sectors in economy in terms of production. Economic structure also refers to some scales derived from technological or behavioral relations. Furthermore, the concept of structural transition in the development economics mainly refers to the rates of economic accumulation; the change in sectoral composition of economic activity especially on the allocation of employment and factor use in general, the location change of economic activity (e.g. urbanization), and other related aspects of industrialization such as demographic transition and income distribution (Syrquin, 1988). The most prominent theory explaining the relation between structural transition and inequality came from the Nobel laureate Simon Kuznets in He proposed the existence of an inverted-u curve (Figure 1) between inequality and economic level due to structural transition. This theory was formulated from the study about the western countries income distribution in pre- and post- world war era (Kuznets, 1955). Figure 3 The Kuznets' Curve At first, the Kuznets curve illustrates a positive correlation between inequality and income until the curve reaches its peak point. Afterward, the curve inverts which means negative correlation between inequality and income. Kuznets explains his curve as follows. A country typically starts from agriculture as the major sector in its economy. In this economic structure, both income and productivity are low. Then, the country begins to industrialize. Productivity is rising along with the industrialization process. As the consequence, income increases and so does inequality. This pattern emerges as the transition of economic structure from agricultural to Industrial society takes place. Urbanization occurs in the earlier phase of industrialization and leads to widening gap between the 9
25 urban and the rural. Finally, industrialization continues producing more income which leads to restructuring of labor payment. As the result, inequality decreases along with higher level of income (Kuznets, 1955). Several studies have been conducted to verify the Kuznets theory (see: Galbraith, 2009, Barro, 2000, Deininger and Squire, 1998, Campano and Salvatore, 1988, Papanek and Kyn, 1986, Ahluwalia, 1976). The research outcomes vary, either confirming, qualifying, or questioning the theory. Support came from Galbraith (2009), Campano and Salvatore (1988), and (Ahluwalia, 1976). Their studies confirm the existence of relation in the Kuznets curve. Furthermore, Galbraith (2009) qualified the Kuznets theory with evidence in several rich countries where income growth is, one again, correlated positively with increased inequality. He called this as the augmented Kuznets curve illustrated in Figure 4. Source: Galbraith (2011) Figure 4 The Augmented Kuznets Curve Meanwhile, a qualification came from Barro (2000) who argued that, in overall, there is a little relation between income inequality and growth rate. He found that higher inequality tends to retard growth in poor countries but encourage growth in richer ones. Another study from Papanek and Kyn (1986) showed no systematic relationship between inequality and economic growth. Similar results were also obtained by Deininger and Squire (1998) whose empirical study provides only little support for the Kuznets theory. In addition, they also point out that inequality reduces income growth for the poor but not for the rich. Although the existence of Kuznets inverted U curve was not uniformly confirmed, some empirical studies explained above support the core proposition of Kuznets theory that economic inequality is driven by the structural transition that can explain the augmented Kuznets curve from Galbraith (2011) above. If Kuznets originally explained his curve by the transition from agricultural to industrial economy, then the qualification from Galbraith above explains the transition from industrial economy to service economy (especially finance and IT sectors) which consequently changes wages and profits distribution in the most advanced countries. Furthermore, a fundamental aspect in structural transition is technological progress since technology is a key factor that shapes the economic structure of a society. Some major shifts in the trajectory of economy from the industrial revolution in the 17 th century until the information technology revolution in the late 20 th century were driven by the inventions in technology. In neoclassical economics, technology is taken as an exogenous factor which determines the production 10
26 function, which is defined as a set of production factors giving constant return to scale, formulated in the Cobb-Douglas function as follow. Where Y is aggregate output, K is capital which can also represents technology, L is labor, α is the elasticity of output to capital, and Z denotes a constant named Total Factor Productivity. A fundamental insight from this function is the substitutability between technology and labor. Traditionally, technical change is viewed as factor-neutral, meaning that the substitution between capital (or technology) to labor is indifferent to any level of labor. However, the recent technological progress such as the advancement in IT has replaced the labor with a favor to skilled labor over unskilled one. This means technological progress is skill-biased (Violante, 2008). The technological progress is associated with income inequality mainly through the effect of technology to labor market. It shifts the demand of labor from unskilled to skilled labor, so that the skill premium, defined as the wage of skilled labor relative to that of unskilled labor, is higher (Krusell et al., 2000). The shift in the relative demand of the skilled-unskilled labor is illustrated in Figure 5. The demand for skilled workers, measured right to left, shifts to the left; while the demand for unskilled workers, measured left to right, shifts inwards. Given the supplies of the two kinds of labors are fixed, then there is a widening of the wage premium which means leading to income disparity (Atkinson, 2003). Source: Atkinson (2003) Figure 5 The demand shift of skilled-unskilled labor The key aspect of technology in this relation is capital-skill complementarity which means that the elasticity of substitution between capital equipment and unskilled labor is higher than the elasticity between capital equipment and skilled labor. The implication of this aspect is that growth in the stock of equipment increases the marginal productivity of skilled labor, but decreases the marginal productivity of unskilled labor (Krusell et al., 2000). However, the effect of skilled-biased technological progress on income inequality is estimated not as a linear function. The arrival of new technology increases the skill premium because of the demand for skilled labor is high during the first stages of social learning. While most of the sectors make the transition to new technology and the supply of skilled labor increases, the skill premium starts to diminish. This mechanism thus tend 11
 which was formulated by Corrado Gini in 1912.")
27 to generate a kind of alternative Kuznets curve, with inequality first rising and then falling during the transition to a new technological paradigm (Aghion et al., 1999). 2.2 Inequality measurement: Gini ratio and Theil s T index The most popular inequality measurement is the Gini coefficient (or Gini ratio) which was formulated by Corrado Gini in Basically, it is a statistical summary of the Lorenz Curve below. Figure 6 Lorenz curve Data are collected from surveys on household income or expenditure and the ratio is calculated by comparing relative mean difference and mean size. From Figure 6, the Gini ratio is simply defined as, The Gini ratio ranges from a minimum value of zero, where all individual are equal, to a theoretical maximum value of one, where all individuals income are zero except one person, showing absolute inequality. With this feature, it is easy to interpret and compare Gini ratio. For example, it is intuitively easy to understand the meaning of 0.25 Gini coefficients which belong to equal Scandinavian countries, in comparison with 0.5 Gini coefficients which belong to unequal countries such as Brazil and South Africa. Therefore, the Gini ratio become the most common and standard measurement of inequality. Despite its simplicity and easiness to understand, the Gini ratio is limited in describing how inequality is shaped. The decomposition of Gini ratio into its contributing factors is not practical since it is merely an aggregate measurement of income distribution. Furthermore, we need to pay attention to the difference in methodology of data collection or survey for calculating the Gini ratio. In some countries, the expenditure data are used while in other countries, income data are used. Even there is also a difference whether market income or disposable income data are being used (Daamgard, 2013). In this chapter, another less popular method to measure inequality labeled the Theil s T index is introduced. The Theil s T index (Theil, 1967) is normally written as: 12
28 ( ) where n is the number of individuals in the population, y p is the income of the person indexed by p, and µ Y is the population s average income. To make it easier be interpreted intuitively as a direct measure of the discrepancy between the distribution of income and the distribution of individuals between mutually exclusive and completely exhaustive (MECE) groups, the previous formula is expressed as (Conceição et al., 2000): [( ) ( )] With Y representing the population s total income,. The Theil s index in this expression also highlights the Theil s self-similar nature for any grouping structure to aggregate individuals. After grouping all the individuals into m generic MECE groups (economic sector, region, social class, urban-rural, gender, etc.), overall inequality can be decomposed into a between-group component and a within-group component which is (Conceição et al., 2000): with representing within group component formulated with: [( ) ( )] Where i index the group and m is the number of groups, n i represents the number of individuals in group i, and Y i the total income in group i. While representing between group component formulated with: [( ) ( )] From the last formula we can intuitively measure that, due to logarithmic term in formula, between group inequality is determined as; 1) a group that has the same income as the average population does not contribute to inequality, 2) a group that has more than average income contributes positively to inequality and vice versa, while term before logarithmic expression ( )can be interpreted as the magnitude of inequality contribution which determined by how large discrepancy between group s income and average income is, and how large the share of group s member to the total population is. Furthermore, Conceição et al. (2000) also show the practicability of Theil s index in various sequences of nested and hierarchic grouping structures. For example, if there are data of employment number and payroll by sector in each region, we can calculate Theil either based on sector or region as expressed with: 13
29 Thus, the advantage of Theil s T statistic method is that it decomposes inequality into contribution of each component in both dimension (sector and region). We can analyze which sector and region win or lose in the term of income and population share. Following the reason, with decomposition of Theil s index into its component we can explain inequality from the Kuznets notion of structural transition of economic sector. The shortcoming of Theil s T statistic method as the indicator of inequality is, unlike Gini ratio with the scale of 0 to 1, there is not a definite maximum scale. Nominal value of Theil s T is determined by number of components or level of group decomposition. If the group decomposition is smaller, then the maximum scale of Theil s T will be higher also. Thus, we have to be careful not to misinterpret Theil s T, especially when we are comparing Theil values across countries (Indonesia versus South Korea), because a higher Theil s T value does not necessarily indicates greater inequality. A last, conceptual shortcoming of this method is that it only measures income from wage if payroll data is used. It will not count income from other source such as assets or capital return. Thus, we can say that Theil s T index of inequality represents the lower bound of inequality measurement. 2.3 The influencing factors of inequality Over the past three decades, the studies about economic policy in emerging market economies cannot be separated from the framework (the so-called Washington Consensus promoted by mainstream economics and policy makers) about the policies that were needed to promote sustained growth. These policies include macroeconomic stabilization, market liberalization, and greater openness to flows of trade, finance, and direct investment. Over the period, the international financial institutions (e.g. World Bank and IMF) would tie their conditional lending packages to acceptance by governments of these general policy guidelines (Kapstein and Milanovic, 2003). However, these policies did not have neutral distributive effects within countries. In contrary, they are likely to generate new patterns of winners and losers (Kapstein and Milanovic, 2003). Therefore, most of the studies about inequality have been dedicated to address the effect of this policy framework to income distribution. From the literature survey, the factors influencing inequality could be categorized into macroeconomic (monetary and fiscal policy), economic openness, and political economy. The first macroeconomic issue is monetary policy. The main debate in this issue is the priority of monetary policy target between macroeconomic stabilization and employment creation. A recently popular framework in monetary policy is the inflation targeting framework. In principle, the institutions (central bank) that adopt the inflation targeting policy merely sets their goal on monetary stabilization, as mainly indicated by low inflation, rather than play double roles as monetary stabilizer and economic growth engine. In order to reach this single goal, they are willing to take necessary policy at the cost of economic growth and employment creation, such as setting high interest rate that will slow down economic activities (Palley, 2012, Anderson, 2005). The inflation targeting policy relies on the theory of NAIRU (non-accelerating inflation rate of unemployment). The NAIRU theory can be briefly defined as a particular level of unemployment rate which may cause upward spiraling (accelerating) inflation if the real unemployment rate is below this level. To avoid accelerated inflation, the central bank is supposed to maintain unemployment on its NAIRU which means to avoid full employment by using monetary instrument like high interest rate. This monetary stabilization policy is could exacerbate income disparity because of unemployment it creates. When unemployment is higher (than full employment) due to this policy, 14
30 which is typically followed by a more flexible labor market policy, workers are not eager to claim higher wages. Therefore, stagnating wage will lead to more severe income disparity (Anderson, 2005, Storm and Naastepad, 2012). However, opinions on this issue are not converging yet. While Galbraith (2012) and Palley (2012) argue that unemployment caused by the inflation targeting policy is one of the causal factors of inequality, on the other hand, inequality is believed to have a trade-off relation with unemployment, and inflation might worsen income distribution. Thus, the inflation targeting policy is preferred to maintain macroeconomic stabilization without exacerbating income distribution (Ravallion, 2001, Li and Zou, 2002). The second macroeconomic issue is fiscal policy and government s role in the economy (Stiglitz, 2013; Galbraith, 2012; Edward, 2006; Deininger and Squire, 1998; Papanek and Kyn, 1986). As suggested by the Washington Consensus framework, which has been implemented in some developing countries, governments are supposed to maintain their fiscal balance and prudence with minimum budget. Thus, cutting expenditure is considered necessary. Furthermore, in order to encourage dynamism of investment and business climate, governments are supposed to lower their tax rate and not to participate in any business activities nor interfere with the market. This is because government intervention is believed will leads to market distortion which causes inefficiency called government s failure. This framework is commonly implemented as deregulation, privatization, and anti-subsidy formulas (Wade, 2004). Stiglitz (2013) argues that this small-government agenda would lead to increasing inequality because the fiscal capacity of the government to serve the public from all level of society will diminish, and consequently, the opportunity of public to afford decent service such as health, housing, and education will become smaller. When these services are provided through market mechanism, the society will not get the same level of service. The rich can afford the best health and education services while the poor cannot. Stiglitz called this impact of small-government agenda as inequality of opportunity that will perpetuate or even exacerbate inequality of wealth (Stiglitz, 2013). Furthermore, an empirical study about the global consumption pattern from by Edward (2006) reveals that relying merely on growth to reduce inequality is rather inefficient, thus more direct state interventions would be needed. A form of proactive state intervention is suggested by Deininger and Squire (1998) including increase in aggregate investment and acquisition of assets by the lower income class. In another research, Papanek and Kyn (1986) recommend educational participation and a reduction in the share of primary exports in GDP which are favorable to reduce inequality. Following the reasons from these literatures, we may conclude that more state intervention (active fiscal policy) is preferable to reduce inequality. Regarding economic openness, the main question for this issue is who will gain and who will lose from the greater engagement in globalization and participation in free trade, since economic openness will likely affect income distribution. In general, advocates of globalization assume that economic (trade and financial) openness bring more volume of transaction and opportunity, thus it will lead to more rapid economic growth and job creation. This concept is based on neoclassical assumption of the perfect market, and the theory of comparative advantage which is about the gains from trade between economies with different capital labor ratio. The benefits of economic openness for emerging market economies include encouraging best practice adoption; promoting product development; and exposing firms to competition. The success of the East Asian Tiger economies are often referred as the empirical support for their claims (Palley, 2011). 15
31 Nevertheless, globalization is criticized because perfect markets hardly exist in reality (Wade, 2004). The theory of asymmetric information is one of the criticisms to the free market idea explaining that globalization advantages the stronger group (rich countries, investors, or producers) while disadvantages the weaker group (poor countries, workers, or consumers). Therefore, engagement in globalization is seemed to exacerbate income disparity. This happens in two ways. First, it creates trade imbalance between developed and developing countries. Second, economic openness usually relates with the weaker regulations in labor market and the easiness of capital flight. These mechanisms weaken the worker s bargaining position to claim their wage. As the result, there will be stagnating wage despite firms profit keep rising (Stiglitz, 2013, Wade, 2004, Palley, 2012). The empirical evidence from a group of case studies in 11 developing countries in Africa, Central Asia, and Latin America provided no examples that trade liberalization brought positive impacts on growth and equal income distribution (Sharma and Morrisey, 2006). While in the US, engagement in globalization was correlated with growing income disparity that started in the 1970 s (Palley, 2012). Moreover, there was an evidence of mutual trend in increasing global inequality and more global economic integration between the year 1982 and 2000 both in developing and developed countries. There is also a shift in the global economy, which was independent from national policies, caused by a super-bubble in the world financial market as a consequence of global financial liberalization (Galbraith, 2012). However, although the arguments that globalization has caused inequality is convincing, this explanation cannot directly lead to the conclusion that globalization is harmful at all. Instead, it might lead to the idea of modifying the rules of the game, so globalization may bring equal benefits for all. Last, we should also pay attention to the political economy aspect of inequality. The reason to examine the political economy of inequality is because economic policy does not exist in a vacuum but as a result of political decision making process (Galbraith, 2012). As mentioned above, state intervention is needed to create equity in economic development, this leads to another question: what kind of state and to what extent is the intervention favorable for equality, is it a democratic or non-democratic country? Acemoglu and Robinson (2002) have conducted the empirical research on this issue and conclude that democratization is favorable to reducing inequality. Democratization leads to institutional changes that encourage redistribution of assets and create equal opportunity. As the result, inequality will be reduced. However, democracy is not a guarantee for equal society since democracy itself has several formats, such as social democracy or liberal democracy. Galbraith (2011) found that only social democracy regimes relates to lower inequality. Even inequality is typically higher in the newly born democratic country. Furthermore, development may also be associated with two types of non-democratic paths. The first is called autocratic disaster such as authoritarian states under dictatorship with high inequality and low output such as Sub-Saharan African countries, and the second is referred to authoritarian states that have successfully combined rapid economic growth with low inequality such as the East Asian Miracle countries (Acemoglu and Robinson, 2002). In addition, the communist, Islamic, and New Left Latin America regimes are also the example of the states with low inequality and relatively high output (Cornia, 2010, Galbraith, 2011). Based on this empirical fact, it could be concluded that it is not the format of regimes nor the governmental system that determines inequality, but the characteristic of egalitarian regime of the state that actively creates equal opportunities and redistributes welfare. 16
32 2.4 Inequality in emerging market economies measured by Theil s T method Several studies on inequality by using the Theil s T statistics method have been conducted by James K. Galbraith and his fellow in University of Texas Inequality Project (UTIP) recently. In this subchapter, I summarizes several of his works to illustrate the situation in other emerging market countries (China, Brazil, Argentina, and Turkey). The chart of Theil s index and its decomposition into sectors and regions from each case is displayed in Appendix A. China Despite the trend of rising inequality in China seems to have slowed in the mid-2000s, a significant force for continued increasing trend remained to appear. This was associated with the property boom and other speculative activities that concentrated on the national capital, Beijing, particularly related to the 2008 Olympics. The mechanism behind the flow of funds into these sectors was a profits boom associated with the vast increase in Chinese exports that followed Chinese s engagement to WTO in Obviously, the phenomenon of an exports boom leading to a profits boom leading, in turn, to a speculative bubble has some disturbing implications in a country as concerned with the Chinese economic stability. While, there are also implications for the concern with excessive inequality also related developmental imbalances and migration incentives. Clearly, the enormous concentration of capital wealth into the leading cities especially into Beijing contradicted to the Chinese s developmental philosophy of a harmonious society. It also raises a concern about whether Chinese government policy can any longer dictate the broad spatial and sectoral patterns of economic development in the country, since there seemed no effective regulatory control against the flows of profit income. Therefore, the bold promises of the government about expansionary and redistributive policy can, in fact, be questioned (Galbraith et al., 2009). Brazil and Argentina In the past several decades, Argentina and Brazil made similar transitions from import substitution economy to open market economies, and both experienced the instability and stress associated with the neoliberal economic regime. However, following large increases inequality has been made to decline in recent years, as the countries retreated, in some degree, from neoliberal globalization due to the rise of new left regimes in both countries. Particularly, inequality fell in both countries as the share of income from the financial sector and the richest urban centers declined; in both cases these phenomena explain most of the decline in economic inequality. It was enabled by the favorable economic conditions of the years after 2001, when global interest rates fell to near zero and commodity prices recovered; in substantial part this was also due to the pull of a growing Chinese market. However, the two countries still experienced these changes differently. In Argentina, the neoliberal model adopted by the country until the end of the 1990s and inequality rose sharply along with the advanced of financial sector (so did Buenos Aires where financial industry located) compared to the rest of the country. Only after the crisis in 2001, Argentina began to reverse these trends, due to a major policy turn of the government and change in the ideological 17
33 regime. In Brazil, increasing inequality began to get worsen in 1982 during the debt crisis. Brazil was able to substantially stabilize its macroeconomic environment beginning in 1993, with the result that the vast growing of financial sector ended and inequality started to fell in the following years. This was mainly related to a growing role for the public sector. This pattern was established under the Jose Cardoso government and continued under Lula da Silva, despite the change in party control and ideology. However, it was under Lula that poverty in Brazil moved dramatically downward, and supported by the vastly more favorable commodity and credit conditions of the 2000s (Galbraith et al., 2007). Turkey A study from Elveren and Galbraith (2009) finds that pay inequality in Turkey increased after 1980, under the neo-liberal economic regime. Their study was investigating income inequality based on wage data in the Turkish manufacturing sector between 1980 and This trend occurred mainly only in the private sector. However, although the public sector has displayed steady inequality throughout the period, at both the provincial and regional levels, the share of the public sector was shrinking which might compromise the stability. A similar trend was also observed across provinces, specifically interprovincial inequality increased dramatically between 1987 and 1995 and then declined again, thus inequality level in 1991 is the same as the level in Nevertheless, it was also shown that inequality between the broader geographical regions remained steady during the period. Their finding confirms the literature, that there is no convergence between Turkish regions, which is indicated by the disparity between an impoverished East and affluent West. This pattern has been unchanged during the neo-liberal era Turkey. 18
34 Chapter 3 Economic growth, inequality and its influencing factors in Indonesia, The structural relation between economic growth and inequality in Indonesia This sub-chapter addresses the first research question about the structural relation between economic growth and inequality in Indonesia. The first research question is derived into three subtopics; 1) the contribution of economic sectors and regions to economic growth and employment share, 2) the measurement of income inequality in the last twenty years, and 3) the relation between technological progress and inequality. Therefore, the structural relation between inequality and economic growth in Indonesia will be described in three approaches. The first approach is examining the distribution of economic output across sectors and regions. Economic output is indicated by GDP that comprises aggregate wages and profits, therefore the decomposition of GDP by sectors and regions could explain how aggregate income is distributed in the country. To measure the economic inequality, Theil s T index will be derived. Note that we what we here call economic inequality is basically a measure of inequality in the distribution of income (or value added) across sectors and regions. The second approach is measuring income inequality at the individual level of wage-income earners by calculating the Theil s T index from payroll and employment data per sector in each region. Theil s T index is then compared with Gini ratio as the standard measurement of inequality, and also decomposed into its sectoral and regional contributors. Our notion of income inequality must is therefore different from our notion of economic inequality. The last issue addressed in Chapter 3 is analyzing the relation between technological changes as the mean transition in economic structure. This is done by comparing and correlating the capital-to-labor ratio with the trend of income inequality in Indonesia Economic inequality in Indonesia To examine the Indonesian economic inequality, the overall Indonesian economic performance in the last two decades is observed. The chart below shows the trend of the Indonesian GDP per capita in current US$ and the annual GDP growth rate. As depicted, before Asia s crisis of , the annual GDP growth rate was around 7-8 %. At the middle of the crisis, Indonesian economy contracted by 13 %. It was successfully recovered since 2000 with more than 5 % annual growth. Recently, the Indonesian GDP per capita is about US$ 3,

35 Source: World Bank (2014) Figure 7 GDP per capita and GDP growth rate, Indonesia, The concept of economic inequality in principle is defined by how equal the economy output indicated by GDP when divided among the population. In this study, the population is divided into groups of sectors and provinces. Figure 8 illustrates the structure of Indonesian economic growth by sector from At a glance, most of the sectors grew proportionately except for agriculture and mining sectors which grew much slower. Figure 8 The decomposition of GDP, Indonesia, Source: author s calculation based on data from World Bank and BPS-Statistics Indonesia The summary of this chart in number and population share working in each sector are shown in the Table 1 below. 20
36 Table 1 The share of GDP and working population by sector, Indonesia GDP share Population GDP Population GDP share share share share Population share Main sector 1. Agriculture, Forestry, Fishery 19.9% 53.7% 16.3% 44.3% 13.8% 35.1% 2. Mining and Quarrying 13.8% 0.7% 10.3% 0.7% 7.0% 1.4% 3. Manufacturing Industry 20.6% 10.6% 25.9% 13.2% 23.5% 13.9% 4. Electricity, Gas, and Water 1.4% 0.2% 1.1% 0.2% 1.1% 0.2% 5. Construction 5.0% 3.2% 5.1% 4.7% 6.2% 6.1% 6. Trade, Restaurants and Hotel 17.8% 15.0% 18.5% 19.4% 21.6% 20.9% 7. Transportation, Storage, Communication 6.4% 3.3% 5.6% 5.1% 8.4% 4.5% 8. Finance, Insurance, Real Estate and Business Service 4.1% 0.7% 8.5% 1.1% 9.0% 2.4% 9. Service 10.5% 12.6% 8.6% 11.3% 9.4% 15.4% TOTAL 100.0% 100.0% 100.0% 100.0% 100.0% 100.0% Source: author s calculation based on data from BPS-Statistics Indonesia The table above indicates the decline of both GDP and population share in Agriculture sector, while the trade, restaurant, and hotel sector and the finance sector were gaining both GDP share and population share. On the other hand, manufacturing sector s share grew slightly, even its GDP share decreased in the last decade. Furthermore, economic inequality in Indonesia is measured by Theil s T statistics method. As explained in Chapter 3, Theil s T method is defined as the share of group s population to the total population multiplied by the comparison of group s GDP (or income) to average GDP (or income) and the logarithmic function of this comparison. Due to this logarithmic expression, Theil s contribution of the group will be zero if its income is equal with average income, positive if its income is more than average, and negative if its income is below average. Theil s index is the sum of Theil s contribution from each group. Figure 9 The Theil s T index of economic inequality in Indonesia,

37 Source: Author s calculation based on data from BPS-Statistics Indonesia The trend of economic inequality with respect to the number of population who work by sectors and regions is depicted by the Theil s T index in figure 9. Although there was an increasing trend after the 1998 Asia crisis until 2002, overall, a decline of economic inequality occur which means that the economic distribution is getting more equal with respect to the number of population working by sectors in the last two decades. The chart also depicts that inequality between sectors contributed more than between provinces. This means that the trend of a more equal economic distribution in Indonesia is determined by the decreasing trend of inequality between sectors rather than provinces which is more constant. To understand how the trend is shaped, the Theil s index is then decomposed into its sectoral and regional contributions to inequality. The chart in Figure 10 shows the decomposition of Theil s index into its sectoral contribution. The stack bars above the zero line are the sectors with positive contribution (above average, i.e. raising inequality) and the stack bars below the zero line are the sectors with negative contribution (below average, i.e. reducing inequality). The positively contributing sectors from 2000 (from the largest) are the manufacturing, finance, mining, transportation, electricity and trade sectors. While in the early 1990 s the positive contributor was dominated by mining sector. Meanwhile, there was hardly any change in pattern of the agriculture sector and a little portion from the service sector as the negative contributors. Figure 10 The contribution of sectors to GDP distribution inequality in Indonesia, Source: Author s calculation based on data from BPS-Statistics Indonesia There are at least three noteworthy conclusions that can be drawn from this chart. Firstly, the convergence trend of Indonesian economy is mainly driven by the decline of mining sector proportion to overall Indonesian GDP. Moreover, the decomposition of GDP by sectors shows that it is mainly determined by the depletion of Indonesian oil and gas production (the data are from BPS- Statistics Indonesia). Secondly, there is a trend of declining negative contribution of the agriculture sector (in absolute terms). On the contrary, the negative contribution of service sector (in absolute terms) is growing. Last, there is an increasing positive contribution of transport, storage and communication sector. 22

 as below.")
38 The spread of economic inequality across regions (provinces) is illustrated by Figure 11. Also to illustrate the geographical context of the case, the map of Indonesia by province is shown in Figure 12. Figure 11 The contribution of provinces to GDP distribution inequality in Indonesia, Source: Author s calculation based on data from BPS-Statistics Indonesia Figure 12 The map of Indonesia by province To help understand the stack bar diagram above, Table 2 shows the GDP share of region (province or island) as below. Table 2 The share of region in GDP and working population, Indonesia GDP share Population GDP Population share share share GDP share Population share Region/ Island Sumatera (Riau not included) 23.6% 18.3% 19.0% 18.0% 17.4% 17.5% Riau 10.6% 1.6% 7.8% 2.2% 7.2% 2.9% DKI Jakarta 15.5% 3.6% 20.2% 3.6% 21.0% 4.4% 23
39 Java (Jakarta not included) 53.6% 56.7% 49.7% 56.1% 50.9% 52.3% East Kalimantan 6.4% 1.0% 7.1% 1.1% 5.6% 1.9% Other 15.6% 18.3% 15.5% 19.0% 15.1% 17.2% Indonesia 100.0% 100.0% 100.0% 100.0% 100.0% 100.0% Source: author s calculation based on data from BPS-Statistics Indonesia Although the overall economic inequality is declining, Indonesian economy is still dominated by a couple of regions. The chart and table shows how Jakarta, the capital of Indonesia, still overruns other provinces extremely which means that the contribution of Jakarta to regional economic inequality is remaining high. This is mostly resulted from the financial and trade sectors, which contributes 28% and 22% to Jakarta s GDP respectively. There are only two other above average provinces with positive contribution to economic inequality which are East Kalimantan and Riau. These two provinces are the main producers of Indonesian oil, gas, and coal. In conclusion, there are two main findings concerning Indonesian economic inequality. The first is the converging trend of the economy into more equal growth in the last two decade, which is driven by the declining negative contribution from agriculture sector and oil production depletion. The second is the economic inequality among regions still persists with Jakarta dominating the economic share, mostly by financial and trade sectors Income inequality and its contributing elements in Indonesia Although the economic inequality as measured by Theil s T index of GDP contribution could be a good proxy in the aggregated level, it is still not enough to represent inequality in the level of individual income since GDP is the aggregate measurement of wage and profit created. With this approach, one still needs to decompose GDP into its source as either wages or profits, and to which party earned that income; government, private, household, or foreigners. Therefore, we need a more specific dataset to infer inequality as close as possible to the level of individual income As explained in previous chapter, Theil s T statistics method can employ aggregate data which is categorized by group to approach variation in individual level and resemble it perfectly (Conceição et al., 2000). Thus, a dataset of number of worker and payroll (average wage) by sector in each region would be representative for measuring income inequality. The regular survey in Indonesia to measure these variables is SAKERNAS (National Workforce Survey) by Indonesian statistics office (BPS). This survey comprises all provinces and is categorized into 9 main sectors. Unfortunately, the survey sample in 2000 and 2001 was taken only from the main islands, not from each province. Also the survey before 1989 was categorized into 5 main sectors. Since Theil s T method can only be used on a consistent aggregation level, the data of 2000, 2001 and prior to 1989 was not used. In addition, the survey was not conducted in 1990 and
40 Figure 13 The Theil's T index of income inequality in Indonesia, Source: Author s calculation based on data from BPS-Statistics Indonesia Theil s T index of income inequality from Indonesian payroll data is shown in figure 13. It shows the decreasing trend before the 1998 Asia crisis and increasing trend afterward. Nevertheless, we should be cautious when using payroll data as the source of inequality measurement because Indonesia has a very large area with significant disparity in infrastructure development. Consequently, there are some variations in general prices for each region. Considering this problem, the payroll data must be adjusted to the level of purchasing power as the real measurement of income rather than currency. Therefore, for this calculation, payroll is divided by the relative index of cost of living (average value = 1). For this purpose, we use provincial minimum wage as the relative index of cost of living. The reason for using provincial minimum wage is because minimum wage must accord to the local standard cost of living as mandated by Indonesian labor law 6. Also it has included all consumption in one basket which makes it more useful as an indicator of purchasing power. Table 3 shows the relative cost of living in Indonesia which are varied from 0.68 to Table 3 The cost of living index, derived from provincial minimum wage PROVINCE Index PROVINCE Index PROVINCE Index Aceh 1.34 West Java+ Banten 0.82 South Kalimantan 1.10 North Sumatera 1.12 Central Java 0.73 East Kalimantan 1.13 West Sumatera 1.07 DI Yogyakarta 0.79 North Sulawesi + Gorontalo 1.04 Riau 1.09 East Java 0.68 Central Sulawesi 0.90 Jambi 0.97 Bali 0.90 South + West Sulawesi 1.02 South Sumatera + Babel 1.02 West Nusa Tenggara 0.96 South Eastern Sulawesi 0.95 Bengkulu 0.88 East Nusa Tenggara 0.88 Maluku +North Maluku 0.93 Lampung 0.83 West Kalimantan 0.84 Papua + West Papua 1.42 DKI Jakarta 1.32 Central Kalimantan 1.05 INDONESIA 1.00 Source: author s calculation based on data from BPS-Statistics Indonesia 6 Indonesian labor law, Act number 13/
41 Figure 14 shows the Theil s T index of income inequality after adjusted to purchasing power, in which the inequality between provinces is more stable than the previous one. It means that the variation in income inequality is mainly determined by within province or between sectors inequality. However, it cannot be directly concluded that inequality between provinces in Indonesia is low because if it is true, the Theil s index will be very close to zero, which does not appear in the chart. Figure 14 The Theil s T index of income inequality (purchasing power adjusted) in Indonesia, Source: author s calculation based on data from BPS-Statistics Indonesia Another notable finding is that the trend of the Theil s T index of income inequality resembles the trend of Gini ratio of expenditure, which is the standard and official inequality measurement in as shown in Figure 15 and verified with the correlation test in table 4. The Gini ratio data is derived from the household expenditure survey in SUSENAS (National Socio Economic Survey) conducted by BPS-Statistics Indonesia every three years before 1996 and annually after. This resemblance could verify the validity of Theil s T index of income inequality measurement in this report. 26
42 Figure 15 Income inequalities in Indonesia measured by the Gini ratio and the Theil s T index Source: author s calculation based on data from BPS-Statistics Indonesia Table 4 The result of correlation test between Indonesian the Theil s T index and the Gini ratio LINT(Theil) LINT(Gini) Pearson Correlation 1,492 * LINT(Theil) Sig. (2-tailed),028 N Pearson Correlation,492 * 1 LINT(Gini) Sig. (2-tailed),028 N *. Correlation is significant at the 0.05 level (2-tailed). Both the Gini Ratio and the Theil s T index show a similar trend of inequality in the last two decades. Overall, there is an increasing pattern since the 1998 Asia Crisis although the Gini ratio curve and the Theil s T index curve diverge after Surprisingly, this pattern is in clear contrast with the decreasing trend of economic inequality measured by Theil s T index of GDP in the previous section. As shown earlier, an advantage of the Theil s T method is its decomposition into inequality contributing elements which are regions or sectors, and this decomposition could explain how this pattern is shaped. Inequality contributors by sector in Indonesia are depicted in Figure 16 below. 27
 service, finance, mining, and transport sectors, while the negative contributors are (from the largest) agriculture, trade, construction, and manufacturing sectors.")
43 Figure 16 The contributors of income inequality in Indonesia by sector Source: author s calculation based on data from BPS-Statistics Indonesia Figure 16 shows the positive contributors of inequality in Indonesia are (from the largest) service, finance, mining, and transport sectors, while the negative contributors are (from the largest) agriculture, trade, construction, and manufacturing sectors. In contrast with its small portion in GDP and its negative contribution to economic inequality as explained in previous section, service sector is the main contributor for inequality in the last two decades. Meanwhile, mining, financial, transport and communication sectors are correlated with their positive contribution to economic distribution as predicted. Furthermore, the Theil s T index of income inequality is decomposed into its regional contributors to analyse the income distribution across regions. The inequality contributors by province in Indonesia are depicted in Figure 17 below. 28
 West Java and Banten, East Java, East Kalimantan, Jakarta, and Riau provinces, while the main negative contributors are (from the largest) North")
44 Figure 17 The contributors of income inequality in Indonesia by provinces Source: author s calculation based on data from BPS-Statistics Indonesia Figure 17 shows the main positive contributors of inequality in Indonesia are (from the largest) West Java and Banten, East Java, East Kalimantan, Jakarta, and Riau provinces, while the main negative contributors are (from the largest) North Sumatera, Aceh, Lampung, South Sumatera, West Nusa Tenggara, and Central Java provinces. West Java + Banten, and East java province respectively, are the most contributing provinces to income inequality. This is not only because of the higher average income in both provinces but also due to the larger share of workers. More than 35 per cents of Indonesian workers are in these provinces. The similarity of both provinces is the larger share of manufacturing sector in their economy. More than 40 per cents of West Java and Banten s GDP and almost 30 per cents of East Java s GDP are created from the manufacturing sector. Meanwhile, East Kalimantan and Riau are the provinces that are rich with natural resources (oil, gas, and coal). Mining industries is very capital intensive and thus the average salaries are higher than the other sectors. Last, Jakarta province, where 20 per cents of Indonesian GDP are created by only 4 per cents of Indonesian population there, contributes positively to inequality. In term of average nominal wages, Jakarta is the highest. However, this calculation includes the standard cost of living as the denominator which makes Jakarta s contribution to inequality is not the highest Technological progress and inequality in Indonesia As mentioned earlier, technological progress is associated with income inequality mainly through the effect of technology on labor market. The substitution between technology and labor is often skill-biased meaning that it favors skilled labor over un-skilled one. Consequently, the skill premium for skilled labor is higher that leads to a widen income gap. One of the indicators of technological progress is capital-to-labor ratio. This ratio compares the number of gross fixed-capital formation in GDP. This is defined as the spending for land improvements; plant, machinery, and equipment purchases; and the construction of roads, railways, building, etc., with the number of labor in a year. This indicator represents the capital intensity, and could also be a good measurement of technological intensity in the economy. 29
45 Figure 18 The capital to labor ratio and the Gini ratio in Indonesia, Source: BPS-Statistics Indonesia and author s calculation based on World Bank s data To figure out the relation between technological progress and inequality, the capital-to-labor ratio is compared with the Gini ratio as shown in Figure 18. It is conclusive that these parameters are correlated positively. When inequality declined around the period of the Asia Crisis in 1997, capitalto-labor ratio also decreased and they rose again afterward. The correlation test, which results are displayed in Table 5, also shows a very significant correlation between them. This finding confirms the theory that inequality is correlated with the technological progress that shifts the structure of economy through the skill-biased it creates in labor market. Table 5 The result of correlation test between the capital to labor ratio and the Gini ratio, Indonesia LINT(Gini) K_L_Ratio Pearson Correlation 1,929 ** LINT(Gini) Sig. (2-tailed),000 N Pearson Correlation,929 ** 1 K_L_Ratio Sig. (2-tailed),000 N **. Correlation is significant at the 0.01 level (2-tailed). 30
46 3.2 The influencing factors of inequality in Indonesia This sub-chapter will address the second research question regarding the influencing factors of inequality. These influencing factors have been elaborated in previous chapters and will be used to examine Indonesian case Methodology and data After observing the trend of inequality and analyzing how the contribution from each sectors and regions shaped the trend, also the relation between technological progress and inequality, we now attempt to figure out the factors that determine inequality in Indonesia. To answer this question, quantitative analysis with statistical modelling, specifically multivariate regression analysis is employed. The relation is modelled with the function as follow: Such model takes the following form of equation: Inequality in each year is indicated by Gini ratio or Theil s T index, X is explanatory variables and y is the error term for each year. For Indonesia s case, I use Theil s T index instead of Gini Ratio because of missing data issue. As mentioned earlier, before 1996 the survey of household expenditure as the basis of Gini ratio calculation was conducted every three years. Following the theoretical framework in previous chapters, there are three influencing factors of inequality which are macroeconomic, economic openness, and political economy. In this analysis I exclude political economy variable due to the difficulty of quantitative measurements.. The macroeconomic variable comprises monetary and fiscal, and each is represented by one or more indicators as the number, so the variable can be employed in the model. These indicators are adapted from the regression model by Cornia (2010) for the case of Latin America countries. The regression variables and indicators for Indonesia s case are explained in Table 4. Table 6 Description and data sources of the variables used in regression analysis Variable Indicator Unit Source Inequality Theil s T index Per mil point Author's calculation Gini ratio Percentage point BPS Monetary Real interest rate Percentage point World Bank Fiscal Economic openness These indicators are explained as follows: Tax revenue Per cents of GDP World Bank Direct tax Per cents of total taxes World Bank Tariff Percentage point World Bank FDI net inflows Per cents of GDP World Bank Real interest rate is a proxy to measure monetary policy. Higher interest rates will suppress investment and the demand for loans. Consequently, the real economy will slow down and the gap between wage and capital income will get bigger. It is expected to have positive correlation with inequality. 31
47 Tax revenue in the percentages of GDP is an indicator of government size and can be specified by the ability to make fiscal expansion. It is expected to have negative correlation with inequality. Direct tax which is defined as the percentages of income tax, profit and capital gain to total tax is a proxy to measure tax progressiveness. It is expected to also correlate negatively with inequality due to the distributional effect of direct tax. Tariff is the trade policy as an indicator of eagerness to engage in globalization. The main agreement in a FTA (free-trade agreement) is to eliminate trade barrier by minimizing or even completely removing tariff in international trade. Tariff is expected to have negative correlation with inequality because lower tariff is the indicator of greater economic openness that might lead to more severe income disparity as explained in chapter 2. Foreign Direct Investment (FDI) net inflow by definition are the net inflows of investment to acquire a lasting management interest in an enterprise operating in an economy other than that of the investor. It is the sum of equity capital, reinvestment of earnings, other long-term capital, and short-term capital as shown in the balance of payments. It is assumed as indicator of economic openness and expected to have positive correlation with inequality. Before regression analysis proceeds, the correlation matrix is completed by handling the missing value. Although the best option in handling missing data is deletion method, it will reduce the statistical power significantly because of low number of observation. Therefore, deletion method is combined with single imputation method by using linear interpolation. Number of observation is reduced from 25 to 19 observations. The final data for regression is shown in Table 5. Table 7 The dependent and independent variable (missing variables are removed/ replaced) for Regression Analysis, Indonesia Inequality Monetary Fiscal Economic openness Real interest Tax revenue Direct tax (% FDI net inflows Year Theils T rate (long-term) (% GDP) of total taxes) Tariff (% GDP) ,22 15,35 15,6 62,9 13,05 1, ,92 17,72 15,7 61,3 12,78 1, ,26 10,75 14,3 58,6 12,51 1, ,23 9,26 15,5 55,3 11,68 1, ,29 8, ,1 10,84 2, ,35 9, ,6 7,73 2, ,54 8, ,6 7,17 2, ,35-24,6 14,9 68 6,61-0, ,62 11,83 15,4 69,4 6,05-1, ,34-1,65 13,45 59,45 5,16-2, ,05 3,72 11,5 49,5 4,13-1, ,77 12,32 11,8 47,2 5,5 0, ,34 10,85 12,3 46,1 4-0, ,09 5,13 12,3 42 4,67 0, ,8-0,25 12,5 68,3 4,39 2, ,79 1,66 12,2 47,7 4,31 1, ,32 2,34 12,4 48,5 3,85 1, ,9-3, ,7 3,5 1, ,31 5,75 11,4 49,5 3,15 0,90 Bold: replaced value with linear interpolation technique 32
48 3.1.2 Regression result The regression analysis is carried out as follow. Based on the rule of thumb that at least five observations are needed for each independent variable, for Indonesia s case the maximum number of independent variable is three for a model because there are only 19 observations (Heijnen, 2012). Then the indicators of each variable are combined. With this combination, eight models are obtained. The result is displayed in Table 8. Variable Indicator Model Inequality Theil index IDN 1 Monetary Fiscal Economic openness Real interest rate (%) [+] Table 8 The regression table of Inequality influencing factor, Indonesia Model IDN 2 Model IDN 3 Model IDN 4 0,164 0,182 0,111-0,08 0,173 0,224 0,149 0,227 Model IDN 5 Model IDN 6 Model IDN 7 Model IDN 8-5, , ,265 Tax revenue (% GDP) - 1,363*** 0,875*** 1,842*** 1,290*** 1,269*** Direct tax (% of total -0,456-0,774-0,058-0,053-0,525 taxes) [-] 0,240* 0,237*** 0,250 0,229 0,215** Tariff (%) -0,249-1,463 0,001-0, [-] 0,682 0,665** 0,648 0,607 0,580** FDI net inflows (% 1,08 0,88 1, ,402 GDP) [+/-] 0,864 1,239 0,872 0,892 1, ,43 95,28 133,91 102,35 132,84 133,93 131,97 98,32 Constant 15,58*** 12,23*** 11,79*** 13,54*** 15,60*** 11,99*** 14,62*** 11,18*** Number of observation Adj. R-squared 0,654 0,459 0,686 0,295 0,633 0,674 0,674 0,491 DW Note: * ) significant at 10% ** ) significant at 5% ***) significant at 1% Number in italic: standard error of coefficient All models, except model IDN 4, come with quite satisfying adjusted R-square number of more than 0.5. It means that the explanatory variable can explain more than fifty per cents of the variation in the independent variables. Regression table indicates significant correlation for tax revenue, direct tax, and tariff, while there is no significant coefficient for real interest rate and FDI net inflow. All exante signs are satisfied by the significant variable. However, we have to be careful with the autocorrelation issue as indicated by the Durbin-Watson coefficient. Based on auto-correlation table, the range for positive auto-correlation is 0-0.7, while no auto-correlation range from 1.4 to 2.6 and negative auto-correlation from 3.3 to 4.0. Thus, Model 1 Model 3, and Model 4 are within zone of indecision, while for the other model we are confident that they do not have auto-correlation issue (Savin and White, 1977). The influencing factors that correlate with inequality in the regression analysis for Indonesia s case include; 1) fiscal policy in the term of tax revenue (in percentages of GDP) which was negatively correlated with inequality, 2) fiscal policy in the term of tax progressiveness as indicated by percentage of direct tax in total tax which also has negative correlation with inequality, and 3) economic openness in the term of tariff which was positively correlated with inequality. On the other hand, monetary policy in the term of real interest rate was found having no significant correlation with inequality. This finding will be analysed and compared more in Chapter 5. 33

49 Chapter 4 Economic growth, inequality, and its influencing factors in Korea, The structural relation between economic growth and inequality in Korea This sub-chapter is assigned to address the first research question for Korea case. Thus, it will employ the same structure and approach as the Indonesia case in previous chapter. These are explaining Korea s economic inequality by examining the distribution of economic output across sectors and regions, measuring income inequality in individual level by calculating the Theil s T index from payroll and employment data per sector in each region, and figuring out the relation between technological changes as the mean transition in economic structure Economic inequality in Korea It begins by observing the overall Korean economic performance at a glance in the last two decades. Figure 19 below shows the trend of the Korean GDP per capita in current US$ and the annual GDP growth rate. Source: World Bank (2014) Figure 19 GDP per capita and GDP growth rate, Korea, Before the Asia crisis in , the annual Korean GDP growth rate was between six to nine per cents. At the middle of the crisis, Korean economy contracted by seven percentage points negative growth. However, Korea recovered quickly, their economy bounced back to nine per cent annual growth in Afterward, Korean economy maintained a positive growth although it was slower than before the crisis, except for the zero growth in the global financial crisis in In twenty 34

50 years, Korea has successfully increased their GDP per capita four-folds from around US$ 5,000 to US$ 20,000. With this level of economy, Korea has become the most advanced country among emerging market economies. The concept of economic inequality in principle is defined by how equal the Gross Domestic Product (GDP) has been divided among the population. In this study, the population is grouped into sectors and provinces. Figure 20 illustrates the structure of Korean economic growth by sector from At a glance, most of the sectors grew proportionately except agriculture and construction sector which seems quite stagnant. Figure 20 The decomposition of GDP, Korea, Source: author s calculation based on data from World Bank and KOSIS (Korea Statistics Office) Table 9 The percentage of GDP by sector, Korea Main Sector Agriculture, forestry and fishing 6,0% 4.1% 3.0% Mining 0,4% 0.3% 0.2% Manufacturing 28,4% 25.9% 31.1% Electricity, gas, steam and water supply 1,5% 2.0% 2.3% Construction 12,1% 7.7% 6.2% Wholesale and retail trade 10,1% 10.1% 8.6% Hotels and Restaurants 2,7% 2.5% 2.1% Transport storage and communication 7,1% 8.3% 9.0% Finance and insurance 5,3% 6.2% 7.3% Real estate and business services 12,1% 13.5% 11.7% Educational services 7,6% 5.8% 5.6% Healthcare Services and Social Services 2,6% 3.1% 3.6% Other community social and public services 4,0% 10.3% 9.4% GDP 100.0% 100.0% 100.0% Source: author s calculation based on data from KOSIS To measure economic inequality in Korea, the same method as in the Indonesia case in the previous chapter is employed. In brief, Theil s T method basically compares the value (GDP or income per capita) of a group, which can be a sector or a region, to the average value multiplied by its share to 35
51 the total population. A group whose value is above average will contribute positively and a group with below average value will contribute negatively, while the share of a group to the total population determines the magnitude of its Theil s contribution. Theil s index is the sum of Theil s contributions from each group. Basically if the GDP is spread evenly across regions and sectors, the Theil s index will be zero. Theil s T index can describe the trend and distribution among sectors and regions (provinces). For this calculation, GDP data and the number of workers by sector in each province are employed. However, the data of number of workers by sector in each province are only available since 1996, and the data of number of workers in agriculture sector in each province is not available. Nevertheless, it is supposed that missing data from the agriculture sector would not be significant since agriculture is minor in Korea: its share in GDP is only about 3%. Figure 21 Theil s T index of economic inequality in Korea, Source: Author s calculation based on data from KOSIS The trend of economic inequality with respect to the number of workers by sector in each province is depicted by Theil s T index in Figure 21. Overall, there was a declining economic inequality in Yet, there is a slightly increasing trend since The figure also depicts inequality between sectors contributing much more than between provinces as we can see that economic inequality between regions is very low with hardly change in the last two decades. Therefore, we can conclude that economic distribution across regions in Korea is relatively equal and economic distribution disparity is overwhelmingly explained by the variation among economic sectors. Furthermore, the Theil s index is decomposed into sectoral and regional contributors to understand how the trend was shaped. Figure 22 shows the decomposition of Theil s index into its sectoral contribution. The stack bars above the zero line are the sectors with positive contribution (above average) and the stack bars below the zero line are the sectors with negative contribution (below average). 36

52 Figure 22 The contribution of sectors to economic inequality in Korea, Source: Author s calculation based on data from KOSIS This chart shows how the sectoral transition, with respect to number of workers, has been dynamic in the last fifteen years. In the years around the Asia crisis from 1996 until 1999, economic inequality in Korea was driven by construction, and real estate and business service sector. This trend then continued until the middle of 2000 s with real estate and business sector overtaking the construction sector. In both periods, manufacturing sector is the most negative contributor to economic inequality. It indicates that this sector is where most Korean worked but had below average GDP per worker. However, manufacturing sector has been becoming less labor-intensive since the mid of 2000 s where the negative contributors are now dominated by health and social service sector and real estate and business service sector. In this period, the positive contributors also changed to transport and communication sector, financial sector, and electricity, gas, and water sector. Although the spread of Korean GDP across regions is very equal, it is interesting to look at the economic inequality among regions. The spread of economic inequality among regions is illustrated in Figure 23 and the map of Korea by province is shown in Figure 24 to help understanding geographical context of the case. 37

 are Chungcheongnam-do, Jeollanam-do, Gyeongsangbuk-do, Gyeongsangnam-do,")
53 Figure 23 The contribution of provinces to economic inequality in Korea, Source: Author s calculation based on data from KOSIS Source: image from Figure 24 The map of Korea by region Korea is divided into nine provinces (Do) and seven metropolitan cities which represent rural and urban area respectively. The chart in Figure 21 indicates that the positive contributors to economic inequality (from largest) are Chungcheongnam-do, Jeollanam-do, Gyeongsangbuk-do, Gyeongsangnam-do, Gyeonggi-do and Incheon, while the negative contributors to inequality (from largest) are Seoul, Busan, Daegu, Daejon, Gwangju, Jeollabuk-do, Jeju, Chungbuk, and Gangwon-do. 38
54 Interestingly, all regions with positive contribution to the economic inequality are the provinces (- do) or rural regions rather than the metropolitan cities. These findings are contrast with the typical economic distribution in developing countries where urban areas enjoy greater advance in economy than rural areas. It also confirms the chart in Figure 21 that the economic inequality between provinces in Korea is relatively low. The data in Table 10 below also show that Korean GDP is evenly distributed among regions as indicated by proportional share of GDP and number of labor in each region. Table 10 The share of GDP and number of labor by province, Korea Region GDP Labor GDP Labor Seoul 29,85% 30,87% 28.7% 28,05% Busan 6,65% 7,81% 6.1% 6,03% Daegu 4,41% 4,89% 3.8% 3,83% Incheon 5,45% 5,97% 4.7% 4,69% Gwangju 2,40% 2,23% 2.6% 2,53% Daejon 2,44% 2,32% 2.6% 2,59% Gyeonggi-do 15,26% 17,38% 21.7% 21,89% Gangwon-do 2,64% 1,98% 2.0% 1,96% Chungcheongbuk-do 2,85% 2,94% 2.9% 2,98% Chungcheongnam-do 3,66% 3,00% 4.1% 4,39% Jeollabuk-do 2,93% 3,02% 2.7% 2,77% Jeollanam-do 4,65% 2,41% 2.5% 2,58% Gyeongsangbuk-do 5,87% 6,08% 5.2% 5,17% Gyeongsangnam-do + Ulsan 10,16% 8,41% 9.6% 9,71% Jeju-do 0,78% 0,70% 0.8% 0,83% Korea 100.0% 100.0% 100.0% 100.0% Source: author s calculation based on data from KOSIS Income inequality and its contributing elements in Korea Here we follow the same method as in the Indonesian case for measuring income inequality. Theil s T index of income inequality was derived from the dataset of number of workers and payrolls (average wage) by sector in each region. The data was gathered from the survey conducted by the Korean Statistics Office (KOSIS), and accessible data were only available from 1996 until Since then, KOSIS has changed their industrial classification in the dataset three times; 12 groups of classification in , 15 groups of classification in , and 17 groups of classification since For the reason of classification consistency, which is essential when comparing Theil s index over time, the data since 2002 were recalculated and grouped into 12 classified sectors as in the earlier classification schedule. This regrouping has been done as well for the regional classification because Ulsan metropolitan area was separated from Gyeongsangnam-do province in Hence, we regrouped Ulsan metropolitan area into Gyeongsangnam-do province in this calculation. As the result, Figure 25 shows the Theil s T index of income inequality in Korea from 1996 until In general, it depicts an increasing pattern of income inequality in the last fifteen years with at least two notable features. First, inequality reached a peak during the Asia crisis period around 1998, and once again, at the global financial crisis in Second, the chart also shows the variation 39
55 in income inequality is determined more by the differences between sectors rather than between regions. Figure 25 The Theil's T index of income inequality in Korea, Source: Author s calculation based on data from KOSIS Moreover, different from the Theil s index calculation for the Indonesian case, Korea does not have any issues with regional disparity as already explained and indicated by similar general prices level in all regions in Korea (KOSIS, 2014). So, the Theil s T index does not need the adjustment to purchasing power. In order to verify the accuracy of this measurement, Theil s T index is then compared with Gini ratio as the standard and more common measurement of inequality. Figure 26 shows that the trend of Theil s T index fits with the trend of Gini ratio. This resemblance is also verified with the correlation test shown in Table 11 indicating that both measurements are significantly correlated. Therefore, the similarity could verify Theil s T index of income inequality measurement in this report. Figure 26 Income inequality in Korea measured by the Gini ratio and the Theil s T index 40
,008 N 22 16 Pearson Correlation,638 ** 1 Theil Sig. (2-tailed),008 N 16 16 **. Correlation is significant at the 0.01 level (2-tailed).")
56 Source: author s calculation based on data from KOSIS Table 11 The result of correlation test between Indonesian Theil index and Gini ratio GINI_MI Theil Pearson Correlation 1,638 ** GINI_MI Sig. (2-tailed),008 N Pearson Correlation,638 ** 1 Theil Sig. (2-tailed),008 N **. Correlation is significant at the 0.01 level (2-tailed). As already mentioned, an advantage of Theil s T statistics method is its decomposition feature into inequality contributors by regions or sectors, and this decomposition could explain how the pattern is shaped. Inequality contributors by sector in Korea are shown in Figure 27 below. Figure 27 The contributors of income inequality in Korea by sector Source: author s calculation based on data from KOSIS Figure 27 shows the positive contributing sectors to income inequality in Korea are (from the largest) finance and insurance; manufacturing; educational services; electricity, gas, and water supply; retail and consumer goods service; mining; and transport, storage, and communication sectors. Meanwhile, the negative contributing sectors are (from the largest) real estate and business 41

57 services; health and social work; hotel and restaurant; other community, social, and personal services; and construction sectors. The interesting information which can be drawn from this graph is that the financial and insurance sector always becomes the most contributing sector to inequality with a great proportion in Theil s T index. Even though the financial and insurance sector is not the largest sector in the Korean economy, on average, this sector is growing faster than the rest. In 2000, the share of finance and insurance sector in GDP was only 6.2 per cent, and by 2010 it became 7.3 per cent in GDP. Meanwhile, the manufacturing sector, within which 36 per cent of Korean GDP was created, was in the position of negative contributor until Besides its large contribution to the Korean GDP, the manufacturing sector also absorbs most of the Korean labor force. Thus, income per worker in the manufacturing sector is lower than the average. Furthermore, Theil s T index of income inequality is decomposed into its regional contributors to analyse income distribution across regions. Inequality contributors by region in Korea are shown in Figure 28 below. Figure 28 The contributors of income inequality in Korea by province Source: author s calculation based on data from KOSIS Figure 28 shows three regions with positive contribution to income inequality in Korea which were (from the largest) Seoul, Gyeongsangnam-do + Ulsan, and Jeollanam-do. However, the contribution of Seoul in Korea Theil s T index is always far greater than the other. Meanwhile, the main negative contributors to income inequality are (from the largest) Gyeonggi-do, Daegu, and Busan, and these regions are always in the bottom rank over fifteen years. The significance of Seoul s contribution to income inequality could be explained by the fact that it accounts for 30 per cents of Korean GDP, mainly from finance and insurance sector accounting for 17.5 percent. This number is greater than the average of finance and insurance sector in Korea GDP which is only 5 per cent, therefore, confirming the previous chart that shows the finance and insurance as the most contributing sector to income inequality in Korea Technological progress and inequality in Korea Following the same approach as the Indonesia case, the technological progress is also indicated by capital-to-labor ratio. This indicator represents the capital intensity, and could also be a good 42
58 measurement of technological intensity in the economy. To figure out the relation between technological progress and inequality in Korea, capital-to-labor ratio is compared with Gini ratio as shown in Figure 29. Figure 29 The capital to labor ratio and the Gini ratio in Korea, Source: KOSIS and author s calculation based on World Bank s data From the chart above and the correlation test results displayed in Table 12 below, it could be concluded that that these parameters are correlated positively although the association between them is not as strong as the Indonesia case. The main difference is the diverging pattern in the years of Asia Crisis around When capital-to-labor ratio decreases, inequality increases. Afterwards, both parameters converge again. The same pattern also occurred in the period of the global financial crisis around This finding confirms the hypothesis that inequality is correlated with technological progress that shifts the structure of economy through the skill-bias it creates in the labor market. However, the situation of crisis was the exception for this correlation. Table 12 The result of correlation test between capital to labor ratio and Gini ratio, Korea GINI_DI K_L_ratio Pearson Correlation 1,527 * GINI_DI Sig. (2-tailed),012 N Pearson Correlation,527 * 1 K_L_ratio Sig. (2-tailed),012 N *. Correlation is significant at the 0.05 level (2-tailed). 43
59 4.2 The influencing factors of inequality in Korea In this sub-chapter, the second research question about the influencing factors of inequality for Korea case will be addressed. The same approach will be used as Indonesia case, so that the structure of this sub-chapter in general will be similar to the one in previous chapter Methodology and data After discussing the trend of inequality and examining how the contribution from each sectors and regions shape the trend of inequality, also discussing the relation between technological progress and inequality, now we attempt to figure out what factors determine inequality in Korea. To answer this question, the same model is also employed as follow. Such model takes the following form of equation: where inequality in each year is indicated by Gini ratio or Theil s T index, X is explanatory variables and y is the error term for each year. For Korea case, Gini ratio is used instead of Theil s T due to the data availability reason. Gini ratio data are available since 1990 while Theil s T index of income inequality is only available since Nevertheless, as shown above, the trend of Theil s T index fits the trend of Gini ratio. Hence using either Gini or Theil will be indifferent. Following the theoretical framework in Chapter 2, there are three influencing factors of inequality which are macroeconomic, economic openness, and political economy. In this quantitative analysis, political economy variable is also left out. Since this variable is difficult to be measured quantitatively, it seems not plausible to be taken into a quantitative model. For the Korean case, Foreign Direct Investment indicator for economic openness variable is not used and replaced by a new variable which is gross fixed capital stock, as the indicator of the intensity of real capital formation within the country. This is because Korean FDI outflow is higher than FDI inflow since plenty of Korean companies move their production plant to the other developing countries. The regression variables and all indicators are explained in Table 13. Table 13 Description and data sources of the variables used in regression analysis Variable Indicator Unit Source (KOR) Inequality Gini ratio Percentage point KOSIS Monetary Real interest rate Percentage point World Bank Tax revenue Per cents of GDP World Bank Fiscal Direct tax Per cents of total taxes World Bank Economic openness Tariff Percentage point World Bank Investment in real economy Gross fixed capital stock Per cents of GDP World Bank Before the regression analysis proceeds, the correlation matrix is prepared by handling the missing value by using the same methods which are deletion and linear interpolation. Then, the number of observation is reduced from 24 to 21 observations. Final dataset for regression analysis is displayed in Table 14 below. 44
60 Table 14 Dependent and independent variable (missing variables are removed/ replaced) for Regression Analysis, Korea Year Inequality Monetary Fiscal Gini Disposable Real interest rate Tax revenue Direct tax (% of income (long-term) (% GDP) total taxes) Economic openness Tariff Capital Gross fixed capital formation (% of GDP) ,6-0,47 14,42 39,55 9,54 37, ,60 13,45 36,96 9,04 38, ,5 2,21 13,72 39,82 8,53 36, ,10 13,55 39,72 7,97 36, ,8 0,62 13,89 39,47 7,40 36, ,1 1,50 14,23 39,29 6,84 37, ,7 3,54 14,48 37,16 15,01 37, ,7 6,94 14,24 34,74 11,97 35, ,5 8,94 14,00 41,26 8,93 30, ,8 9,50 14,29 33,33 5,89 29, ,6 3,36 15,41 38,08 7,24 29, ,7 3,71 14,71 37,20 8,60 28, ,9 3,43 14,43 36,94 9,95 28, ,58 14,95 40,48 9,58 29, ,7 2,79 14,25 40,84 9,21 29, ,1 4,91 14,73 42,72 8,31 28, ,5 6,14 15,19 43,73 7,40 28, ,2 4,38 16,56 46,00 8,00 28, ,4 4,14 16,30 45,13 8,47 29, ,5 2,15 15,45 42,34 8,93 29, ,9 1,83 15,15 42,05 8,71 28, ,9 4,16 15,58 45,31 8,71 27, Regression result The same combination method results in 9 models displayed in Table 15. It shows significant coefficient for real interest rate, fiscal policy (tax revenue and direct tax) in some models. Correlation sign for the fiscal policy is opposite with ex-ante. Interestingly, capital variable is very robust and significant in all models. 45
61 Variable Inequality Monetary Fiscal Table 15 The regression table of Inequality influencing factor, Korea Indicator Gini of Disposable Income Real interest rate (%) [+] Tax revenue (% GDP) [-] Direct tax (% of total taxes) [-] Economic openness Tariff (%) [-] Capital Formation Gross fixed capital formation (% GDP) [+/-] Model KOR 1 Model KOR 2 Model KOR 3 Model KOR 4 Model KOR 5 Model KOR 6 Model KOR 7 Model KOR 8 Model KOR 9 0,105 0,118 0,259 0,362 0,106 0,12 0,072 0,087 0,104 0,072 0,068 0,73 *** ** 0,066 *** 0,072 0,527 1,361 0,536 0,434 0,259 0,276 0,249 * ** * 0,261 0,098 0,277 0,95 0,065 0,056 0,083 0,055 * *** *** 0,055 0,02 0,056-0,101-0,05 0,046 0,034 0,062 0,087 0,089 0,122 0,150 0,093 0,090 0,092-0,287-0,324-0,283-0,317-0,373-0,333-0,373 0,061 0,054 0,057 0,052 0,048 0,056 0,047 *** *** *** *** *** *** *** 28,07 32,70 7,181 15,24 27,97 33,07 38,43 31,14 35,93 5,313 *** 3,669 *** 4,255 * 3,886 ** 5,157 *** 3,561 *** 1,661 *** 5,11 **** 3,215 *** Constant Number of observation Adj. R-squared 0,836 0,826 0,644 0,484 0,844 0,832 0,807 0,823 0,81 DW 1,70 1,44 1,63 0,93 1,70 1,41 0,95 1,59 1,31 Note: * ) significant at 10% ** ) significant at 5% ***) significant at 1% Number in italic: standard error of coefficient All models come with satisfying adjusted R-square number which is around 0.8 (except Model KOR 4). It means that the explanatory variable can explain about eighty per cents of the variation in the independent variables. Regression table indicates significant correlation for real interest rate, tax revenue, direct tax, and gross fixed capital formation, while there is no significant coefficient for tariff. However, not all ex-ante signs are confirmed by the significant variables. Based on autocorrelation table, the range for positive auto-correlation is from 0 to 0.81, while no auto-correlation range from 1.41 to 2.59 and negative auto-correlation from 3.19 to 4.0. Thus, Model 4, Model 7, and Model 9 are within zone of indecision, while for the other model we are confident that they do not have auto-correlation issue (Savin and White, 1977) To sum up, the influencing factors that correlate with inequality in the regression analysis for Korea case includes; 1) monetary policy in the term of real interest rate which is positively correlated with GDP although it was not true for all models, 2) fiscal policy in the term of both tax revenue and direct tax, and 3) real capital formation in the term of gross fixed capital formation as the percentages to GDP. Interestingly, the sign of the second indicators are different with the assumption. Meanwhile, the significance of the last variable is stronger than the others. This finding will be elaborated in next chapter. 46
62 Chapter 5 Policy analysis of growth and inequality; from growth with equity era to liberal economy era 5.1 Policy and institutional change in Indonesia and Korea The 1998 Asian crisis was a crucial stage in the economic path of Indonesia and Korea with two reasons. First, the crisis has altered the pattern of economic growth and inequality in both countries. As explained in Chapter 3 and Chapter 4, before the crisis, inequality level was lower and its trend was quite steady beside rapid economic growth, and the trend of rising inequality appeared afterward. Second, several profound changes in economic policies and institutions have occurred during the crisis. Therefore, understanding the difference in the political and institutional landscape before and after the crisis is pivotal to answer the third research question about the policy analysis of inequality in both countries. Without going into much detail of the crisis, this part explains how the transition happened with focus to the aspects that influence income distribution in both countries Economic policy and institution during growth with equity era In 1993, World Bank issued their World Development Report which categorized Indonesia and Korea into a group of eight Asian countries with rapid and sustained economic growth named high performance Asian economy (HPAEs) with Japan, Taiwan, Hong Kong, Singapore, Malaysia, and Thailand. The East Asian Miracle, to which some economists also referred, was the group of developing countries which have successfully promoted their industry and increased their income level, even their achievement was the best compared to other late industrialized countries in the period of 1960s-1990s (World Bank, 1993). During this period, Indonesian Gross National Product (GNP) was growing at an average annual rate of 6.7%, one of the highest among developing countries. While Indonesian GNP per-capita was around US$ 100 in the mid-1960s, their GNP per-capita had reached almost US$ 1,000 by the early 1990s. As in other HPAEs, Indonesia s economic growth was based on high rates of investment in physical infrastructure, human capital, and high rates of productivity growth, and also experienced rapid demographic transition and export growth (World Bank, 1993). By the mid-1990s, the relative share of agriculture sector in the GDP was 16%, less than one-third of that in 1965 which was 51%. On the other hand, the sustained double-digit growth of manufacturing sector has increased this sector to more than treble its relative share in GDP, and by 1991, it has exceeded that of agriculture. The transformation of the Indonesian GDP was also followed by a transformation in the occupational distribution of the workforce. However, the decline of share of agricultural workforce was slower; it fell from 64% in 1971 to 44% in 1996, and conversely, employment growth in Indonesian industrial sector has been growing high by developing-economy standards (Wie, 2002). 47
63 The sustained economic growth during this period created a significant improvement in the social welfare of the population, as shown by a sharp reduction of absolute poverty as well as rising educational levels and higher life expectancies. From 1976 until 1996, the poverty rate has decreased from 40.1% to 11.3%, a reduction of 28.8 percentage points over 20 years, or an average reduction of 1.44 percentage points per year (Suryahadi et al., 2012). Furthermore, Indonesia also experienced a pretty equal economic growth as indicated by the steady inequality level along with rapid economic growth, different from the typical Kuznets curve. In the same period, the Gini ratio just slightly changed from 0.34 to 0.36, even it has reached a minimum level of 0.32 in the mid-1980s (Timmer, 2007, Stiglitz, 1996). This period of rapid yet equal economic growth was a remarkable achievement of the new order regime s economic policy under President Soeharto who had ruled the country since Meanwhile, Korean economy even grew faster than Indonesia during the last four decades before the crisis with 8.8 % of average annual growth. Due to a slower population growth than Indonesia, GDP per capita has increased from US$ 150 in 1960 to US$ 10,000 in the mid-1990s. With this economic level, Korea joined OECD in Korean economic growth was mainly driven by the massive industrialization, export, and structural transition. The average annual export growth was almost 20% in with rapid increase in manufacturing products percentage (World Bank, 2014). The economic transition occurred from primary sector (agriculture, forestry, fisheries, and mining) to manufacturing and service sectors. The share of primary sector in GDP declined from 27.1% in 1970 to 5.0% in 1997, while the share of manufacturing sector increased from 21.2% to 31.8% during the same period, and the share of the aggregate service sector (including construction, transport and telecommunication, and utilities) increased from 50.2% to 62.8%. Consequently, the employment structure changed rapidly during this period as indicated by the declining share of workers in agriculture from 50.4% in 1970 to 11.6% in 1999 (Kang, 2001). Moreover, similar with Indonesia before the crisis, the Korean impressive economic growth was achieved without exacerbating income distribution. In overall from 1960s until 1990s, inequality hardly changed and sustained within the moderate level, even it was lower than that after the crisis. Despite there was an increase in 1980s, inequality fell again until mid-1990s and then followed by an increasing trend since then (Kwack and Lee, 2007, Lee et al., 2012). Historically, the economic policies and the institutional arrangements of Indonesia and Korea were comparable to some degree. First, before rapid progress starting in 1960s both countries were low income countries which started their industrialization and economic development in the same period. Since Indonesian declared their independence in 1945 from the Dutch colonization, they had been struggling in political turmoil between political faction and separatist movement which sometimes including military campaign. Although Indonesia under their charismatic leader Soekarno was quite prominent and respectable in the international political landscape, there was hardly any significant progress in economic development during Soekarno s era. Even at the end of his presidency, Indonesia was hit by the economic crisis with hyper-inflation and severe deficit of government budget. In 1966, Soeharto succeeded and established the new order regime. Meanwhile, Korean economic development also did not show any significant progress until 1961 when Park Cung Hee started serving the country. Beforehand, Korea was one of the poorest countries which gained their independency in 1948 from Japan and followed by Korean War lasting until Thus, both countries started their modernization from underdeveloped state and poverty. Second, Indonesia and Korea experienced the similar institutional arrangement under authoritarian regime initially. Both Soeharto and Park Cung Hee was the army general who seized the power not 48
64 by a democratic process. Soeharto got his chance for the state leadership after he led the army to cope with an unsuccessful revolution attempted by the communist party, while Park Cung Hee seized his leadership through a military coup. Then, they employed their military resources with centralized command to administer the state and to create stability as the foundation of economic development, even though it was achieved with the expenses of people s freedom of expression, press liberty, and region s autonomy restraints. Soeharto s presidency until 1998 and followed by democratization. Meanwhile Park Cung Hee s presidency lasted until 1979 when he was assassinated, then replaced by another military leader Chun Doo-hwan. However, the democratization in Korea began earlier in 1988, following rallies of pro-democracy movement which resulted in the first democratic election for Korean after several decades. Furthermore, beside centralized governance, their institutional similarity was also the central role of some economic tycoons (chaebols in Korean) as the actor of rapid industrialization beside the state. The Chaebols are some national entrepreneurs who were given more access and favor (in terms of taxes, finances, subsidies, protections, etc.) to execute the government s industrial development strategy. The Korean economic system can be perceived as a catching-up system pursuing substituting strategy or as a system prepared to pursue an independent developmental path by finding the substitutes for the institutions of industrial development. Such an institutional substitute was the state banks chaebols nexus (Chang and Shin, 2003). In Indonesia during Soeharto era, this arrangement also appeared by the domination of Soeharto s business cronies, mostly are local Chinese (Sino-Indonesian) businessmen. Unlike in Korea, the presence of this class was not by a well-planned design initially, but by the pragmatic need of the new order regime to boost investment in early years of recovery after the economic crisis in Soekarno s era. Later, their close connection to Soeharto has favored them in running the business (Wie, 2002). Third, despite more open economy with some market-friendly policies such as abolishing much restriction in foreign direct investment, the government played proactive role in industrialization policy and market regulation. Both Indonesia and Korea aggressively encouraged investment in the targeted sectors, primarily basic industries such as chemical, steel, and machinery; and labor intensive industries like textile, by any possible means, including tax concessions, subsidies, trade protection, and cheap credit. This was because manufacturing production is hard to rely on market solely because of (capital) market imperfections, and given the fact that industrial activities are characterized by increasing returns to scale and low rate of return to individual investments, thus the rate of return to coordinated industrial investments would be higher. Therefore, industrialization requires a Big Push which is the coordination and financing of complementary investments (Storm and Naastepad, 2005). As the illustration of market regulation in Indonesia, although the trade had undergone partial deregulation since the mid-1980s, the domestic market was still highly regulated, especially agriculture. Restraints on domestic competition included cartels, price controls, entry and exit controls, exclusive licensing, dominance of state-owned enterprises in certain industries, and ad hoc government interventions in favor of specific sectors(lee et al., 2012, Wie, 2002). The last feature is the direct central government initiatives in regional and social development, especially in rural area to overcome the widening urban-rural gap due to industrialization. Government invested in education and health facility, rural infrastructure including road, irrigation, and agricultural facilities. In Indonesia, one of the most prominent programs of this policy was named the president instruction or Inpres. Beside from tax revenue, Indonesian government funded this program from windfall profit of oil boom in (Booth, 2000). However, despite massive investment has been put for this program as indicated by increasing education attainment and rising 49
65 agriculture productivity especially in Java Island where half of population live, development gap between Java and outside-java still appears. In Korea, a similar program during the 1970s was named Semaul Undong (New village movement) aiming at generating more income at rural, building basic infrastructure, and capacity-building. Although this was generated a lot of skepticism initially, it resulted in some success by which helped the rural community generate not only farm based income but also non-farm based income. As the result, this active role of government to redistribute income and to develop rural area has resulted in a relatively equitable distribution of income between urban and rural areas (Lee et al., 2012) The 1997 Asian crisis and economic liberalization The Indonesian impressive economic performance since 1960s was interrupted by the Asian crisis in While for Korea this crisis was the second time after the crisis in 1980, yet the crisis in 1997 was more severe than the previous one. The crisis was triggered by a crisis of confidence. It began with the depreciation of the Thai baht in July 1997, which through the contagion effect led to similar currency depreciations in other Asian countries including Malaysia and Philippines, Thus foreign investors and creditors became panic and rush to reduce their exposure to these Asian countries. The currency was depreciated severely, and immediately, many firms which relied on large and un-hedged or short-term offshore loans defaulted their debt. Further, the banks exposed to this hot money were also bankrupt. This led to the catastrophic collapse of real economy (Chang and Shin, 2003, Wie, 2002). Consequently, the Indonesian economy contracted by 13%, and the inflation rate rose to 78 % which was particularly driven by food price inflation by 118%. The aftermath of economic recession were plunging unemployment and millions of people had fallen into poverty, as indicated by rising poverty rate from 17.3% in 1996 to 23.4% in 1999 (Suryahadi et al., 2012). For Indonesia, this crisis is not merely an economic crisis but also a political crisis. Despite the impressive achievement in economic development, the public had an accumulated disappointment and a strong perception of Soeharto s corrupt regime. This was due to the flawed system of corporate governance and the octopus of government-backed businesses run by his family and crony. In May 1998, after a series of riots and escalated demonstrations of what called reformation movement aspiring for democracy and clean government, the 32 years of Soeharto s rule ended (Wie, 2002). Meanwhile, the Asian crisis did not change political institution in South Korea because they had the transition to democracy earlier in 1998, yet this crisis still related to the deeper policy change to a more liberal economic regime that has actually started prior to the crisis. There were two contested explanation of the cause of the crisis. The first is structural problem of crony capitalism and moral hazard by which the IMF-sponsored structural reform program designed. The crisis was based on the perception that the crisis was caused by some structural problems in the economy like the favorable position of Chaebol in Korea and Soeharto s cronies in Indonesia which led to inefficiency, rent seeking activities, and deteriorated prudency when calculating investment risk. The second explanation was the burst of economic bubble which had been building up during the 1990s. The rise of this bubble economy was driven by the massive capital inflows, particularly through the huge loans provided by foreign institutional investors and foreign banks. In Indonesia this bubble economy was initiated by the liberalization of the capital market from any international capital flow restrictions, as regulated in the October 1988 financial sector deregulation package and the June 1994 FDI deregulation package. While in Korea, financial liberalization, including capital account liberalization, gained momentum since 1991, but accelerated since 1993 when Korea signed a bilateral agreement with the US for financial market liberalization and opening (Chang and Shin, 2003, Wie, 2002). 50
66 Further, the country s liberalization continued during and after the crisis. When both countries were struggling to cope with the crisis, the IMF stepped in to initiate a $40 billion program to stabilize Asian economy, particularly monetary stabilization, called the structural adjustment package. Korean signed the agreement on December 1997 and Indonesia in the next month. Under the guidance of IMF s policy framework, the government were supposed to implement sound macroeconomic policies including tight fiscal management; financial sector restructuring; and structural reforms including market deregulation, privatization of state owned enterprises, reducing tariffs and taxes (IMF, 1998). While for Korea, the policy recipe also concerned on dismantling the privilege of Chaebol. This event is crucial in understanding the country s growth dynamics since it has underpinned a profound change in Indonesian economic policy and institution. The crisis did not only alter the economic strategy in order to escape the crisis and recover quickly, but also reshaped the institutional and political landscape due to the people s demand for liberty and regional autonomy. The country then appeared to be set on a new growth trajectory with different drivers and key policies. Moreover, the economic policy environment was reshaped profoundly, with a weakened presidency, unpredictable legislation process, and decentralization of authority and resources to the regions (Basri and Hill, 2011). 5.2 Inequality and economic policy in the last two decades After discussing policy and institutional transformation from the growth with equity era to the liberal economy era, this sub-chapter compares the key policy and economic changes in more detail during the last two decades based on the findings in chapter 3 and 4. It is addressed by two parts; the first part focuses to the structural relation aspect, and the second part focuses to the influencing factors of inequality in both countries Comparative analysis on the structural relation between inequality and economic growth in Indonesia and Korea In chapter 3 and 4, some key findings about the pattern of economic growth and the trend of inequality in both countries have been explained, and these are summarized in a comparison table below. Table 16 The comparison of structural relation between inequality and economic growth Variable Indicator Indonesia Korea Regional economic Theil s T index of GDP High Low inequality Trend of economic inequality Theil s T index of GDP Declining Declining Level of income inequality Trend of income inequality The dominant sector contributing to income inequality Sectoral transition occurring Theil s T index of income inequality; Gini ratio Theil s T index of income inequality; Gini ratio Decomposition of Theil s T index Decomposition of Theil s T index High Increasing Service Agriculture to service Low Increasing Finance Manufacturing to finance 51
67 Relation between technology and inequality Capital-to-labor ratio Positive correlation, very significant Positive correlation, less significant The first finding is the structure economic inequality, in terms of regional and sectoral GDP, with some similarities and differences. The difference is that regional disparity in Korea is low, while this in Indonesia is quite high. It is indicated by the Theil s T index of economic inequality showing the Korean economy is evenly distributed among regions. This regional equity is also confirmed with the data of general price index indicating the difference between regions is almost negligible (KOSIS, 2014), in contrary to a country with high regional economic disparity like Indonesia where the differences in price index between regions are significant. The Indonesian high economic inequality can be illustrated by the capital city Jakarta which dominates the economy with around 20 per cents of share in the Indonesian GDP, while it is only created by 4 per cents of the total of Indonesian population. This was mostly resulted from the service, trade, and sectors. Moreover, beside Jakarta three were only two provinces among 33 provinces in Indonesia with positive contribution to economic inequality which were Riau and East Kalimantan. These two provinces which had above average GDP per capita were the main producers of Indonesian oil, gas, and mining products. On the other hand, both cases show a similarity that the variation in the trend of economic inequality is more determined by the sectoral contribution than the regional contribution. Also there are the declining trends of economic inequality over the last two decades. In Indonesia, this is driven by the declining negative contribution of agriculture sector, and by the depletion of oil and gas production which had positive contributed to the sectoral economic inequality. Meanwhile, In Korea, the declining of the economic inequality is driven by the decreasing of negative contribution from manufacturing sector. This also means the manufacturing sector of Korea becomes less laborintensive. This finding is also confirmed by the data of capital-to-labor ratio that has been rising over the period. In addition, there were a rising positive contributions to economic inequality from the transport and telecommunication; finance and insurance; and electricity, gas, and water supply sectors since the mid-2000s. The trend of lower economic inequality contrasts with the trend of rising income inequality in both countries as indicated by Theil s T index (calculated by the author) and Gini ratio (official data from national statistics office), although the increasing of inequality in Korea not as dramatic as the increasing in Indonesia. Gini ratio of inequality in Indonesia was 0.32 in 1990 and it reached 0.41 recently, while in Korea it only rose from 0.26 to 0.29 over two decades. Indonesian inequality is comparable with other developing countries such as India and China, while Korean inequality is in the same level with the European countries (World Bank, 2014). Even worse, in the comparison of Gini ratio versus Korea, Indonesian inequality level is higher in reality because Indonesian Gini ratio was based on expenditure survey which tends to underestimate the inequality level (Milanovic, 2010). It is also interesting to see how the crisis made impact to income inequality. In Korea, there was a surge of income inequality in the Asia crisis and a little bit of increase in The crisis exacerbated income inequality in two ways. First, income inequality arose along with unemployment due to economic recession. Unemployment increased from 2.5% to 7 %. Second, the crisis hit manufacturing sector severely. Main industry was forced to closed, merger, or acquired by foreign investors (Chang and Shin, 2003). The aftermath was, as indicated by the decomposition of Theil s T index of income inequality, the falling income of the workers in manufacturing sector where more 52
68 than 30 per cents of Korean worked there. However, this surge of income inequality during the crisis did not appear in Indonesia. I would propose two possible explanations. First, given the majority of population work in the agriculture (rural), the crisis ultimately worsened off Indonesia middle class and near-poor population (urban). The middle class lose their employment and near-poor population became poor, but they in the bottom (rural) were not hit by the crisis. Overall, income distribution is not skewed by the crisis. Second, according to the top 1 per cents data, the Asia crisis was associated with a rise in the share of the very richest groups (top 1 per cent and above) which were not measured by household survey or payroll data (Leigh and Eng, 2010). In Indonesia, income inequality was mostly contributed by the service; finance, insurance, and real estate; and mining sectors, while the loser in income distribution was the agriculture sector. Thus, any changes in agriculture sector will have greater effect to income inequality, while for Korea case, manufacturing sector is the key sector of inequality dynamic. The inequality trend which appeared in Korea was the contribution from the finance and insurance sector, while the loser until 2006 was the manufacturing sector and replaced by the service sector (including business, health and social service; hotel and restaurant) afterward. Geographically speaking, the most contributing region to income inequality was Seoul where most of the finance and insurance industries are located there. Last, the correlation between technological change and inequality holds positively in both cases. Indonesian and Korean economy has become more technological intensive over the last twenty years as indicated by capital-to-labor ratio that correlated positively with Gini ratio. This empirical evidence confirms the theory that technological progress will create bias in labor market which favors skilled labor over un-skilled one (Atkinson, 2003). This bias has exacerbated the wage disparity among them Comparative analysis of the influencing factors of inequality in Indonesia and Korea The regression result of the influencing factors inequality is compared in Table 17. Table 17 The comparison of inequality influencing factors Variable Indicator Correlation with inequality Indonesia Korea Macroeconomic (Monetary policy) Real interest rest [+] Not correlated Positive Macroeconomic (Fiscal policy) Tax ratio [-] Direct tax [-] Negative Negative Positive Positive Economic openness Tariff [-] FDI inflow [+] Negative Not correlated Not correlated N/A Investment in real economy Gross fixed capital formation [-] N/A Negative Sign in bracket: expected result 53
69 First, the monetary policy in terms of real interest rate did not correlate with inequality in Indonesia, while it correlated positively in Korea as expected. It was mentioned that higher interest rate represents inflation targeting regime which, in fact, was embraced by Korea since Meanwhile Indonesia started to implement this policy framework later in 2005 (Epstein and Yeldan, 2008). Perhaps this is the reason why there is no significant correlation between real interest rate and inequality in Indonesia. Second, fiscal policy in terms of tax ratio and direct tax correlated negatively with inequality in Indonesia as predicted. Along with of rising inequality, the Indonesian government s revenue from taxes had declined from 15.6% in 1990 to 11.9% recently. Also the progressiveness of tax as indicated by proportion of direct tax in total tax revenue that decline from 62,9% to 49.5% (World Bank, 2014). This empirical evidence is in line with the theory explaining higher tax ratio and more progressive tax correlate with lower inequality. This is due to tax function as the mean of economic redistribution in society, and with higher fiscal capacity, government could provide more services and facilities to the society in all level (Cornia, 2010). In contrary to the prediction, the correlation between tax and inequality was positive in Korea. The Korean tax ratio rose slightly from 14.42% in 1990 to 15.58% in 2001 and the proportion of direct tax rose from 39.55% to 43.51% in the same period (World Bank, 2014). At least there are two possible explanations for this exception. The first one is, given the low inequality level of Korea among emerging market economies and according to the theory, tax increase in this period has acted as the braking force that minimize inequality caused by the other factors (e.g. structural change). While this reasoning is quite intuitive, the other explanation is based on the record of tax reform in Korea. In 1996, tax reform was implemented in Korea designed to establish an advanced tax system and characterized by low tax rates and a broader tax base. To give some illustrations, the second lowest income tax bracket had changed from million won became million won, and the third lowest bracket had changed from million won became million won. For corporate tax, the rate had changed from 18% and 30% became 16% and 18% for the first and the second 100 million won revenue (Yoo, 2000). Hence, this change has lowered the redistributive effect of direct tax despite the increasing tax income and proportion of direct tax in total. The last one is economic openness in terms of tariff rate. Over the last two decades, the Indonesian economy has become more open as indicated by the declining tariff rate from 13.32% in 1990 to 2.59% in 2011 (World Bank, 2014). This number indicates the Indonesian economic strategy to engage globalization and participate in several bilateral or multilateral free-trade agreement, especially its participation in WTO (Palley, 2011). However, the correlation did not appear for the Korean case. Last, there was a strong negative correlation between the investment in real economy, in terms of gross fixed capital formation, and inequality. Since 1990, gross fixed capital formation has declined from 37 % of GDP to 27 % of GDP (World Bank, 2014). This dramatic change illustrates the tendency of Korean economy shifted to either financial sector, as indicated by financial sector contribution in GDP, or capital flight as indicated by the FDI net outflow. 54
70 Chapter 6 Conclusions and reflection 6.1 Answering the research questions After a long investigation, the time has come for me to sum up what has been done. In Chapter 2, I discussed the theoretical perspective of the inequality problem in economic development, the relation between structural transition and inequality as delineated by Kuznets, the measurement of inequality (especially Theil s T statistical method), and the determinants of inequality in the context of emerging market economies, and I surveyed inequality in several emerging market economies. Next, I applied this theoretical framework to the case of Indonesia in Chapter 3, and in Chapter 4 for Korea for the period of two decades. The results were derived by calculating Theil s index and decomposing it into its contributing factors. I also employed regression models to study the factors influencing inequality based on certain hypothesis derived from the theory. Further, I analyze the economic policy and institutional aspects of economic growth in Indonesia and South Korea in Chapter 5 with two parts. The first is by looking back to the 1960s and pointing out several key features of economic growth, policy, and institutional changes during the period of rapid economic growth until the 1997 Asian economic crisis. The second part is by elaborating the policy aspect and comparing the results obtained for Indonesia in Chapter 3 and those obtained for Korea in Chapter Question on the structural relation between economic growth and inequality This study has calculated the alternative indicator of economic inequality and income inequality by using Theil s T statistics method. It was concluded that the economic inequality (as measured in terms of aggregate GDP per sector in each region) has declined steadily over time in both countries. We also discussed how the variation in economic inequality was more explained by sectoral dynamics than regional dynamics. As I have shown, the economic inequality among regions in Korea was significantly low, while in Indonesia, regional disparity was much more apparent. This disparity was shaped by the accumulation of economic activities, especially finance, trade, and service sectors in the capital city Jakarta. Also, some regions that are rich with natural resources (oil, gas, and coal) contributed to the Indonesian economic inequality. Furthermore, technological progress, measured by capital intensity (expressed in terms of the capital-to-labor ratio), were correlated with income inequality in both countries. These findings confirm the theory of skill-biased technology that raises the wage premium for skilled labor relative to un-skilled labor. In contrast to the rather steady decline in economic inequality (measured in terms of aggregate GDP) in both Indonesia and Korea, we find that income inequality (measured as wage inequality across sectors and regions) first unchanged up to the Asian economic crisis of 1997, but thereafter has started to increase in both countries. The Theil s index calculated in this study, for the period of for Indonesia and for Korea, resemble the official inequality data measured with the Gini ratio (BPS, 2014, KOSIS, 2014). Within these periods, Income inequality in Indonesia 55
71 was mainly contributed by service sector, and sectoral transition mostly occurred from agriculture to other sectors. In Korea, financial sector is the main positive contributor to inequality and sectoral transition occurred from manufacturing sector to other sectors. Despite the same increasing trend, inequality in Indonesia is comparably higher than Korea Question on the influencing factors of inequality This study has empirically investigated several economic variables which are assumed to influence inequality by using economic regression model. These factors are monetary policy, fiscal policy, economic openness, and investment in real economy. From the Korean case, it can be concluded that higher interest rate, related with implementation of the inflation targeting policy and lower real capital formation due to financialization of Korean economy, are positively correlated with higher inequality. While from the Indonesian case, I found that relaxed fiscal policy in term of declining tax ratio (tax revenue in percentage of GDP) and lower direct tax ratio, as the indicator of less progressive taxation, are positively correlated with higher inequality. The model also shows that rising economic openness, indicated by significant decrease in tariff rate, is positively correlated with higher inequality. Therefore, monetary policy towards full employment, active fiscal policy with higher tax that will create more space for government budget, and controlled engagement in free trade and globalization are the alternative policies to the current mainstream economic policy that was adopted by most of emerging market economies which have similar experience in increasing inequality as Indonesia and Korea Question on the policy analysis of inequality Both Indonesia and Korea experienced rapid growth with equity during 1960s until 1990s before the 1997 Asian crisis. Their economic performance, policy and institutional arrangement were comparable during the period. First, they started as low income countries which were just recovered from severe economic malaise due to war or political turmoil. Second, they had similarity in their institutional arrangement with authoritarian and centralistic governance, in addition, there was central role of local entrepreneurs/ economic tycoon who operated state s industrialization strategy. Third, proactive government s role in industrialization policy and market regulation was pivotal to coordinate investment in targeted sectors. Last, there was a direct central government initiative in regional and social development, especially in rural area to overcome the widening urban-rural gap due to industrialization. Government heavily invested in education and health facility, rural infrastructure including road, irrigation, and agricultural facilities. This growth with equity era altered to the grow with inequality era since the mid-1990s particularly since the Asian crisis. Coordinated and planned economic regime was abandoned and they shifted to more liberal economic regime, either by the means of political transition (e.g. democratization on 1988 in Korea and 1998 in Indonesia) or as the part of IMF s structural adjustment program in order to help the countries recover from the monetary crisis. The key policies mentioned in previous research question, including lower taxation, less progressive tax scheme, abolishing trade barrier and inflation targeting are the components of liberal agenda in economic governance, beside other policy framework such as market deregulation, privatization, and tight fiscal management including subsidies-cut. 56
72 6.2 Concluding remark: the debate on the Kuznets theory and the policy for growth with equity Revisiting the debate on the Kuznets theory This study aims at answering the main question about relationship between economic growth and inequality, then assessing what kind of favorable policies by which economic growth with equity can be achieved. In other words, this is a revisiting of the debate on the Kuznets theory. Reflecting Indonesia s and Korea s development experience for a half of century, the typical inverted-u Kuznets curve does not appear, instead it shows a pretty flat curve within moderate inequality level from 1960s until the mid-1990s, and it increases afterward as illustrated in Figure 30. Figure 30 The comparison between a typical Kuznets curve and Indonesia/ Korea s experience While the Kuznets curve does not appear for Indonesia and South Korea, does it also mean that the essential notion of the Kuznets theory (structural transition is associated with rising inequality and economic growth) do not hold for the case? It is needless to say that structural transition happens in Korea and Indonesia, since one of the main features of the industrialization in East Asia is rapid demographic and economic transition, particularly from agriculture to manufacturing, and typically followed by urbanization. Following the Kuznets theory, it is inevitable that income disparity would be exacerbated since there is substantial difference between the added value created from agriculture sector and from manufacturing sector, or between the added value created from laborintensive manufacturing and from financial sector with very less labor-intensive. So the achievement of growth with equity during this period, while structural transition was occurring, is an exceptional case. On the contrary, one can ask the question why a similar sectoral transition (but now from manufacturing to finance in Korea, or from agriculture to services in Indonesia) in the later postcrisis period is associated with rising inequality as Kuznets had presumed? This question leads me to a conclusion that based on the observation from Indonesia and Korea, Kuznets theory, including the existence of inverted-u curve, is a common phenomenon unless there is a force governing the distribution of income. This is supported by my analysis in Chapter 5 comparing both economies before and after liberalization. At least there are two forces which distorted the typical Kuznets curve. The first is government planning and coordination to decide the priority which sectors and where to invest. Government has more consideration than merely profitability, but also i.e. labor-intensity (employment) and capacity building. With their authority government can also decide how to inter-connect manufacturing 57
73 industry with agriculture, so there could be spillover effects which enhance added value creation of agriculture sector, or protecting agricultural market to maintain income level of the peasants. The second force is redistribution policy with government s fiscal capacity to fund direct intervention for rural development or poverty alleviation programs. Inpres in Indonesia and Semaul Undong in Korea are the example of how government played crucial role to redistribute the economic output thorough the country (Wie, 2002, Lee et al., 2012). Indeed, this is only possible with generous fiscal capacity. That is why taxation is fundamental in income distribution policy. After economic liberalization by which government played a smaller role in the economy and economic policy is mainly set for achieving Pareto-optimum efficiency, these two forces lost their places. The regression model have displayed how inequality increases along with declining government s role to manage these forces; lower tax revenue, less progressive taxation, free trade, market deregulation, etc. With smaller government role, the typical inverted-u curve appears again due to the absence of redistribution force as in the previous period. The notion of forces which governs income distribution is also pointed out by recently-famous economist, Thomas Piketty. In his observation over the last two centuries of western-world capitalism, Thomas Piketty concludes that inequality is shaped by a converging force and a diverging force. The converging force includes all mechanisms that lead to economic equity such as affirmative action from the state to redistribute the wealth, priority to create economic growth based on real economic activities, progressive taxation, and even wars. While the diverging force includes all processes that lead to exacerbating wealth disparity such as imposing higher rate of return to the capital, financialization, and the accumulation of assets (Piketty, 2014). Policy choice for more equal growth In the context of emerging market economies, the relative backwardness is typically the initial state of a policy making process. Unlike the developed countries which have more balanced option whether aiming higher growth or prioritizing equal redistribution, emerging market economies are supposed to reach the higher level of economy first, referring to a popular jargon among economists, If you want to distribute something, then there must be something to be distributed first. Hence, the very straightforward policy question is: are growth and equity in a trade-off relation? After a reflection on the Kuznets theory based on the experiences of Indonesia and Korea, I would like to state that the relation between economic growth and inequality is ultimately a matter of policy choice. As Stiglitz (2013) noted, Inequality is desired and designed. If we leave the economy merely to market forces, then a typical Kuznets inverted-u curve would appear. This is a qualification of the so-called trickle-down effect : economic growth generally does not trickle down by itself. So, based on the Indonesian and Korean cases, we have learned how a coupling economic growth with equity is plausible if there is an active role of government in coordinating growth and redistributing income. Therefore, it might be rewarding to reconsider monetary policy towards full employment rather than inflation targeting, active fiscal policy with higher and more progressive tax that will create more space for government budget instead of incentive policy for the top-class such as tax holiday, and controlled/ limited engagement in free trade and economic openness, as the alternative for the mainstream economic policy that adopted by most of emerging market economies which have similar experience in increasing inequality. 58
74 Indeed, I hardly believe that a complete return to the economic policy prior liberalization would be fruitful. This is because economic policy cannot be separated from institutions. Indonesia today is different from Indonesia in the Soeharto era, since the social and institutional arrangements have changed dramatically. The rising middle classes who aspire for more liberty, opportunity, and globalization would hesitate to come back to authoritarian era, as Ha Joon-chang explains how middle class aspiration has spurred Korea liberalization in 1990s (Chang and Shin, 2003). Thus, policy makers have to take this institutional aspect into account in taking any policy redistribution measures, so that it fits into the context of their society. In addition, we should also consider what is the effect or cost-effectiveness of such policy measures. It is possible that in the short or mid-term, redistribution policy might hurt economic growth. For example in a country like Indonesia which relies on FDI or labor cheap policy, such policy will trigger capital outflow and consequently unemployment will increase. Therefore, policy makers must have a strong public agreement and legitimacy prior to adopting this agenda. Without substantial political support, they will lose credibility before the policy agenda will bear fruit in terms of lower inequality. 6.3 Limitation and further research The main scientific contribution of this study is to demonstrate the practical applicability of the Theil s T statistics method in measuring and analyzing changes in inequality. For two countries addressed by this study (for which Gini measures of inequality are available) this research gives another measure of inequality. Moreover, this study has contributed to incremental development in practical aspect of the Theil s T statistics method with two experiments. First, this study uses the Theil s T with GDP data to obtain an economic inequality index which is quite uncommon in previous studies on inequality that employ this method. Second, in this study, the Theil s T index of income inequality (based on wage data) was adjusted to purchasing power (general price level) for the case where regional disparity is high such as Indonesia. However, there are a few concerns regarding these experiments. Professor Galbraith (personal communication, October 4, 2014) expressed a concern about the calculation of the Theil index from aggregate GDP data, since GDP is an aggregate of consumption, investment, government spending, and exports. This may be problematic for measuring inequality in its regional dimension, because it is not a priori clear where, for example, government spending should be recorded. Likewise, the measure may be biased because the location of a company might differ from the location of its headquarter where the company profit is accounted. Without careful attention to these inconsistencies of the location factor, the Theil s index of GDP might be misleading. It is a limitation of this study that this location factor was not considered. Therefore, I did not elaborate further the Theil s index based on aggregate GDP in the analysis. Instead I did focus exclusively on the Theil s index of income inequality. There is also a problem with the second indicator: the Theil s index for income inequality. Notwithstanding the fact that it is reasonable to normalize regional wages based on regional price (and purchasing power) disparities, these same price disparities between regions are also part of the inequality observation, because they could drive worker s migration incentives and remittances. Therefore, it would be interesting to make these regional price differences explicit when measuring the Theil s T inequality; but the issue how to do this is still open and should be considered in any future studies using the Theil s T method. 59
75 Another concern from this study is the plausibility of the case generalization as a stylized fact of inequality in emerging market economies. Although most of emerging market economies experienced a similar development path, they differ in some specific institutional arrangement, and differences in culture and social values do matter. It is reasonable therefore not to generalize for the case of all emerging market economies, on the basis of my two case studies (Indonesia and South Korea). However, the current approach of studying inequality could be fruitfully employed in other case countries. Moreover, it should be expanded to include more comprehensive variable such as education, health, and assets acquisition (for instance, see: Cornia (2008)). Regarding the relation of technological change and inequality, this study employs aggregate indicator of technology/ capital intensity in terms of the aggregate capital-to-labor ratio. The limitation of this aggregate indicator is that it could not specify which technology is more skill-biased such as IT, and which one is less skill-biased such as agriculture infrastructure or labor intensive factory. Therefore, separating skill-biased technology and more neutral-factor technology should be considered the future studies. Lastly, and perhaps this is the most important policy research agenda, it will be important to design policy measures of redistribution that fit in with the institutional arrangements of the country in combination with an analysis of the cost-effectiveness of such measures. So, any potential fire-back could be anticipated and shared with the public, in order to attain their political support. 6.4 Reflection During the study in Master Engineering and Policy Analysis program at TU Delft, my interest in economics narrowed down to the field of development economics with two motivations. The first is this field is closely related with the multi-perspective and interdisciplinary approach as the heart of EPA program. The second is, considering my previous education which is unrelated to this discipline, it required me to learn other fields in economics such as labor economics, monetary economics, public finance, international economics, etc. so I can have helicopter view of this discipline. Then I learned an interesting philosophy of development as freedom from Amartya Sen (1999) as the axiology of development economics. Sen mentions the idea of negative liberty versus positive liberty. Negative liberty is actually what Milton Friedman means in his Capitalism and Freedom by avoiding any threats to individual freedom to choose and to pursue their interests. In other words, negative liberty is a freedom from. However, Sen argues that negative liberty is not enough; people must also have a positive freedom which is freedom to. He illustrates how his poor neighbor in Bengali could not work in a decent workplace since he did not have a skill to freely choose the other jobs. Thus, to develop is not only to make people free to do what they want, but also to make people free from any substantial difficulties. Sen puts forward the notion of capability as the mean to gain these freedoms, which its most basic economic term is income or purchasing power. Therefore there are two fundamental goals of economic development which is to generate income and to distribute them fairly, to guarantee the freedom of people. With this motivation, I chose this topic. However, my hardest part since the beginning is to clearly delineate the research definition. I started to read literature without a sufficient strategy and any specific outcome expectation, but I conducted literature study more like an exploratory survey activity. An important shortcoming when I began this study was a quite unclear problem definition and research plan since inequality is a very open topic and can be approached from many sides. My evaluation to this difficulty is insufficient prior knowledge of the field. I realized this after I finished data collection and analysis, putting the result 60
76 into policy context was somewhat difficult then since I can put any variables and perspectives to the analysis. Later I tried to cope with this problem by retreating from reading recent journals, and began to read some textbooks in development economics to construct my structure of knowledge and to understand the context more. This helped me to decide focus on historical perspective of economic growth and policy transition. Another crucial point I had to reflect on is the selection of the method related with data availability. At first I aimed at studying long run inequality trend since the beginning of industrialization of Indonesia and Korea in 1960s by using Theil s T method, with the assumption that longer time frame would be better to understand structural change of the economy with change in policy and institution. Nevertheless, such method needs dense and huge amount of industrial and regional data with consistent categorization, something that I did not anticipate since the beginning. Finally, what I have successfully collected is Theil s T since 1996 for Korea, and since 1989 for Indonesia which required me went back to Indonesia to collect the data manually from the archive. This limitation has made the comparison between the period of 1960s-1990s and after 1990s quite problematic, because for the earlier period I can only use more qualitative data. My lesson learned from this experience is to have prior expectation of data availability before deciding the method selection. 61
77 References ACEMOGLU, D. & ROBINSON, J. A The Political Economy of the Kuznets Curve. Review of Development Economics, 6, AGHION, P., CAROLI, E. & GARCÍA-PEÑALOSA, C Inequality and Economic Growth: The Perspective of the New Growth Theories. Journal of Economic Literature, 37, AHLUWALIA, M. S Inequality, Poverty, and Development. Journal of Development Economics, 3, ALESINA, A. & RODRIK, D Distributive Politics and Economic Growth. The Quarterly Journal of Economics, 109, ANAND, S. & KANBUR, S. M. R The Kuznets process and the inequality development relationship. Journal of Development Economics, 40, ANDERSON, E Openness and inequality in developing countries: A review of theory and recent evidence. World Development, 33, ATKINSON, A. B The Changing Distribution of Income: Evidence and Explanations. German Economic Review, 1, 16. BARRO, R. J Inequality and Growth in a Panel of Countries. Journal of Economic Growth, 5, BASRI, M. C. & HILL, H Indonesian Growth Dynamics. Asian Economic Policy Review, 6, BAUMOL, W. J On income distribution and growth. Journal of Policy Modeling, 29, BOOTH, A Poverty and Inequality in The Soeharto Era: An Assessment. Bulletin of Indonesian Economic Studies, 36, BPS Statistik Indonesia Jakarta: Badan Pusat Statistik. CAMPANO, F. & SALVATORE, D Economic development, income inequality and Kuznets' U-shaped hypothesis. Journal of Policy Modeling, 10, CHANG, H.-J. & SHIN, J.-S Restructuring Korea Inc., London, Routledge. CLARK, D. A The Elgar Companion to Development Studies, Chentelham, Edward Elgar Publisihing. CLINE, W. R Distribution and development: A survey of literature. Journal of Development Economics, 1, CONCEIÇÃO, P., GALBRAITH, J. K. & BRADFORD, P The Theil Index in Sequences of Nested and Hierarchic Grouping Structures: Implications for the Measurement of Inequality through Time with Data Aggregated at Different Levels of Industrial Classification. UTIP Working Paper. CORNIA, G. A Income Distribution under Latin America s New Left Regimes. Journal of Human Development and Capabilities, 11, DAAMGARD, C Gini Coefficient [Online]. MathWorld--A Wolfram Web Resource. Available: [Accessed 06/12/2013. DEININGER, K. & SQUIRE, L New ways of looking at old issues: inequality and growth. Journal of Development Economics, 57, EDWARD, P Examining Inequality: Who Really Benefits from Global Growth? World Development, 34, ELVEREN, A. Y. & GALBRAITH, J. K Pay Inequality in Turkey in the Neo-Liberal Era, The European Journal of Comparative Economics, 6, EPSTEIN, G. & YELDAN, E Inflation targeting, employment creation and economic development: assessing the impacts and policy alternatives. International Review of Applied Economics, 22, FIELDS, G. S How much should we care about changing income inequality in the course of economic growth? Journal of Policy Modeling, 29, GALBRAITH, J. K THE IMPORTANCE OF BEING SUFFICIENTLY EQUAL. Social Philosophy and Policy, 19,
78 GALBRAITH, J. K Global inequality and global macroeconomics. Journal of Policy Modeling, 29, GALBRAITH, J. K Inequality, unemployment and growth: New measures for old controversies. The Journal of Economic Inequality, 7, GALBRAITH, J. K Inequality and economic and political change: a comparative perspective. Cambridge Journal of Regions, Economy and Society, 4, GALBRAITH, J. K Inequality and Instability: A Study of the World Economy Just Before The Crisis, New York, Oxford University Press. GALBRAITH, J. K. & HALE, J. T State Income Inequality and Presidential Election Turnout and Outcomes*. Social Science Quarterly, 89, GALBRAITH, J. K., HSU, S. & WENJIE, Z Beijing Bubble, Beijing Bust: Inequality, Trade, and Capital Inflow into China. Journal of Current Chinese Affairs, 38, GALBRAITH, J. K., SPAGNOLO, L. & PINTO, S Economic Inequality and Political Power: A Comparative Analysis of Argentina and Brazil. Business and Politics, 9. HEIJNEN, P Statistical Modelling, Delft, Delft University of Technology. HOWELL, L Global Risk th Edition: An Innitiative of the Risk Response Network. Geneva: World Economic Forum. IMF Letter of Intent of the government of Indonesia [Online]. Available: KANG, S Globalization and Income Inequality in Korea : An Overview. FDI, Human Capital and Education in Developing Countries. Paris: OECD Development Center. KAPSTEIN, E. B. & MILANOVIC, B Income and Influence: Social Policy in Emerging Market Economies, Michigan, W.E. Upjohn Institute for Employment Research. KOSIS Statistical Database. Korea Statisitics Information Service. KRUGMAN, P End This Depression Now!, New York, W.W.Norton. KRUSELL, P., OHANIAN, L. E., RÍOS-RULL, J.-V. & VIOLANTE, G. L Capital-skill Complementarity and Inequality: A Macroeconomic Analysis. Econometrica, 68, 25. KUZNETS, S Economic Growth and Income Inequality. The American Economic Review, 45, KWACK, S. Y. & LEE, Y. S THE DISTRIBUTION AND POLARIZATION OF INCOME IN KOREA, : A HISTORICAL ANALYSIS JOURNAL OF ECONOMIC DEVELOPMENT, 32, LEE, H.-H., LEE, M. & PARK, D Growth Policy and Inequality in Developing Asia: Lesson from Korea ERIA Discussion Paper Series, ERIA-DP LEIGH, A. & ENG, P. V. D Top Incomes in Indonesia In: ATKINSON, A. & PIKETTY, T. (eds.) Top Incomes: A Global Perspective. New York: Oxford University Press. LI, H. & ZOU, H Inflation, Growth, and Income Distribution: A Cross-Country Study. Annals of Economics and Finance, 3, MILANOVIC, B The Haves and the Have-Nots: A Brief and Idiosyncratic History of Global Inequality, New York, Basic Books. PALLEY, T The Rise and Fall of Export-led Growth. The Levy Institute Working Paper No PALLEY, T. I From Financial Crisis to Stagnation, New York, Cambridge University Press. PAPANEK, F. & KYN, O The Effect of Income Distribution of Development, The Growth Rate and Economic Strategy. Journal of Development Economics, 23, PICKETT, R. W. K The Spirit Level: Why Equality is Better for Everyone, New York, Penguin. PIKETTY, T Capital in the twentyfirst century, New York, Belknap Press. RAVALLION, M Growth, Inequality, and Poverty: Looking Beyond Average. World Development, 29, RODRIK, D King Kong Meets Godzilla: The World Bank and The East Asian Miracle. In: FISHLOW, A., GWIN, C., HAGGARD, S., RODRIK, D. & WADE, R. (eds.) Miracle or Design? Lessons from the East Asian Experience. Washington DC: Overseas Development Council. 63
79 SAVIN, N. E. & WHITE, K. J The Durbin-Watson Test for Serial Correlation with Extreme Sample Sizes or Many Regressors. Econometrica, 45, SEN, A On Economic Inequality, Oxford, UK, Clarendon Press. SHARMA, K. & MORRISEY, O Trade, Growth and Inequality in the Era of Globalization, New York and London, Routledge. STIGLITZ, J SOME LESSONS FROM THE EAST ASIAN MIRACLE. The World Bank Research Observer, 11, STIGLITZ, J. E The Price of Inequality, New York, W. W. Norton. STORM, S. & NAASTEPAD, C. W. M Strategic Factors in Economic Development: East Asian Industrialization Development and Change, 36, STORM, S. & NAASTEPAD, C. W. M Macroeconomics Beyond The NAIRU, New York, Harvard University Press. SURYAHADI, A., HADIWIDJAJA, G. & SUMARTO, S Economic growth and poverty reduction in Indonesia before and after the asian financial crisis. Bulletin of Indonesian Economic Studies, 48, SYRQUIN, M Patterns of Structural Change. In: CHENERY, H. & SRINIVASAN, T. N. (eds.) Handbook of Development Economics. Amsterdam: Noord Holland. THEIL, H Economics and information theory. TIMMER, C. P How Indonesia Connected the Poor to Rapid Economic Growth, Washington DC, Palgrave Macmillan. VAN DER HOEVEN, R Employment, Inequality and Globalization: A Continuous Concern. Journal of Human Development and Capabilities, 11, 1-9. VIOLANTE, G. L. (ed.) Skill-biased technical change, New York: Palgrave Macmillan. VOGLI, R. D Inequality and the environmental crisis: time to dethrone global neoliberalism. Progressive Economy, 1, WADE, R. H Is Globalization Reducing Poverty and Inequality? World Development, 32, WALKER, D. O Patterns of income distribution among world regions. Journal of Policy Modeling, 29, WIE, T. K The Soeharto era and after: stability, development and crisis, In: DICK, H., HOUBEN, V. J. H., LINDBLAD, J. T. & WIE, T. K. (eds.) The Emergence of A National Economy Honolulu: University of Hawaii Press. WORLD BANK The East Asian Miracle: Economic Growth and Public Policy, New York, Oxford University Press. WORLD BANK World Bank Open Data [Online]. Available: ]. YOO, I EXPERIENCE WITH TAX REFORM IN THE REPUBLIC OF KOREA. Asia-Pacific Development Journal, 7,

80 Appendix A Theil s T index and decomposition from other countries cases: China Source: (Galbraith et al., 2009) 65

81 Argentina Source: (Galbraith et al., 2007) 66
82 Brazil Source: (Galbraith et al., 2007) 67
 68")
83 Turkey Source: (Elveren and Galbraith, 2009) 68
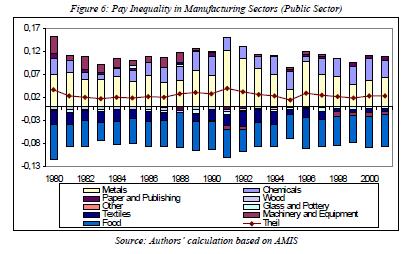
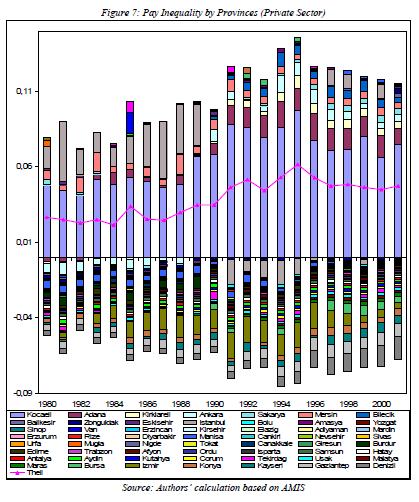
84 69
85 Appendix B REGRESSION RESULT MODEL IDN1 Model Summary b Adjusted R Std. Error of the Model R R Square Square Estimate Durbin-Watson 1,846 a,715,654 5, ,00 ANOVA a Model Sum of Squares df Mean Square F Sig. 1 Regression 1154, ,836 11,705,000 b Residual 460, ,878 Total 1614, Coefficients a Unstandardized Coefficients Standardized Coefficients Model B Std. Error Beta t Sig. 1 (Constant) 129,430 15,583 8,306,000 LINT(Tariff) -,249,682 -,083 -,365,721 LINT(Real_interest),164,173,151,948,359 LINT(Tax_revenue) -5,012 1,363 -,786-3,678,002 MODEL IDN2 Model Summary b Adjusted R Std. Error of the Model R R Square Square Estimate Durbin-Watson 1,744 a,554,459 7, ,328 ANOVA a 70
86 Model Sum of Squares df Mean Square F Sig. 1 Regression 894, ,294 5,801,009 b Residual 719, ,423 Total 1614, Coefficients a Unstandardized Coefficients Standardized Coefficients Model B Std. Error Beta t Sig. 1 (Constant) 95,286 12,238 7,786,000 LINT(Real_interest),182,224,168,811,431 LINT(Tariff) -1,463,665 -,490-2,201,045 LINT(Direct_tax) -,456,240 -,401-1,897,079 MODEL IDN3 Model Summary b Adjusted R Std. Error of the Model R R Square Square Estimate Durbin-Watson 1,861 a,741,686 5, ,268 ANOVA a Model Sum of Squares df Mean Square F Sig. 1 Regression 1196, ,922 13,360,000 b Residual 418, ,860 Total 1614, Coefficients a Unstandardized Coefficients Standardized Coefficients Model B Std. Error Beta t Sig. 1 (Constant) 133,909 11,787 11,361,000 71
87 LINT(Real_interest),111,149,103,746,468 LINT(Tax_revenue) -5,508,875 -,863-6,291,000 FDI_net_inflow 1,080,864,173 1,250,232 a. Dependent Variable: LINT(Theil) MODEL IDN4 Model Summary b Adjusted R Std. Error of the Model R R Square Square Estimate Durbin-Watson 1,647 a,419,295 8, ,495 ANOVA a Model Sum of Squares df Mean Square F Sig. 1 Regression 676, ,652 3,368,049 b Residual 937, ,989 Total 1614, Coefficients a Unstandardized Coefficients Standardized Coefficients Model B Std. Error Beta t Sig. 1 (Constant) 102,353 13,546 7,556,000 LINT(Real_interest) -,080,227 -,074 -,354,729 FDI_net_inflow,880 1,293,141,681,507 LINT(Direct_tax) -,744,237 -,655-3,143,007 72
88 MODEL IDN5 Model Summary b Adjusted R Std. Error of the Model R R Square Square Estimate Durbin-Watson 1,835 a,698,633 5, ,258 ANOVA a Model Sum of Squares df Mean Square F Sig. 1 Regression 1126, ,621 10,777,001 b Residual 487, ,853 Total 1614, Coefficients a Unstandardized Coefficients Standardized Coefficients Model B Std. Error Beta t Sig. 1 (Constant) 132,839 15,607 8,511,000 LINT(Direct_tax) -,058,250 -,051 -,234,819 LINT(Tax_revenue) -5,087 1,842 -,798-2,762,015 LINT(Tariff),001,648,000,002,999 73
89 MODEL IDN6 Model Summary b Adjusted R Std. Error of the Model R R Square Square Estimate Durbin-Watson 1,855 a,732,674 5, ,435 ANOVA a Model Sum of Squares df Mean Square F Sig. 1 Regression 1181, ,925 12,736,000 b Residual 433, ,930 Total 1614, Coefficients a Unstandardized Coefficients Standardized Coefficients Model B Std. Error Beta t Sig. 1 (Constant) 133,927 11,998 11,162,000 LINT(Direct_tax) -,053,229 -,046 -,231,821 LINT(Tax_revenue) -5,256 1,290 -,824-4,073,001 FDI_net_inflow 1,162,872,186 1,332,204 MODEL IDN7 Model Summary b Adjusted R Std. Error of the Model R R Square Square Estimate Durbin-Watson 1,855 a,732,674 5, ,389 ANOVA a Model Sum of Squares df Mean Square F Sig. 1 Regression 1181, ,912 12,734,000 b Residual 433, ,933 74
90 Total 1614, Coefficients a Unstandardized Coefficients Standardized Coefficients Model B Std. Error Beta t Sig. 1 (Constant) 131,971 14,621 9,026,000 LINT(Tax_revenue) -5,265 1,269 -,825-4,147,001 FDI_net_inflow 1,209,892,193 1,355,197 LINT(Tariff) -,138,607 -,046 -,228,823 MODEL IDN8 Model Summary b Adjusted R Std. Error of the Model R R Square Square Estimate Durbin-Watson 1,762 a,581,491 6, ,449 ANOVA a Model Sum of Squares df Mean Square F Sig. 1 Regression 937, ,553 6,462,006 b Residual 677, ,367 Total 1614, Coefficients a Unstandardized Coefficients Standardized Coefficients Model B Std. Error Beta t Sig. 1 (Constant) 98,324 11,182 8,793,000 FDI_net_inflow 1,402 1,113,224 1,259,229 LINT(Tariff) -1,368,580 -,458-2,359,033 LINT(Direct_tax) -,525,215 -,462-2,440,029 75
91 MODEL KOR1 Model Summary b Adjusted R Std. Error of the Model R R Square Square Estimate Durbin-Watson 1,931 a,867,836, ,693 ANOVA a Model Sum of Squares df Mean Square F Sig. 1 Regression 53, ,489 27,668,000 b Residual 8,288 17,488 Total 62, Coefficients a Unstandardized Coefficients Standardized Coefficients Model B Std. Error Beta t Sig. 1 (Constant) 28,070 5,313 5,283,000 Interest_rate,105,068,158 1,542,141 Tax_revenue,527,259,253 2,038,057 LINT(Tariff),020,087,022,231,820 Fixed_capital_stock -,287,061 -,670-4,687,000 76
92 MODEL KOR2 Model Summary b Adjusted R Std. Error of the Model R R Square Square Estimate Durbin-Watson 1,927 a,859,826, ,443 ANOVA a Model Sum of Squares df Mean Square F Sig. 1 Regression 53, ,370 25,922,000 b Residual 8,768 17,516 Total 62, Coefficients a Unstandardized Coefficients Standardized Coefficients Model B Std. Error Beta t Sig. 1 (Constant) 32,702 3,669 8,914,000 Interest_rate,118,073,179 1,622,123 LINT(Tariff),056,089,060,635,534 Fixed_capital_stock -,324,054 -,756-6,035,000 Direct_tax,098,056,190 1,731,102 MODEL KOR3 Model Summary b Adjusted R Std. Error of the Model R R Square Square Estimate Durbin-Watson 1,834 a,695,644 1, ,630 ANOVA a Model Sum of Squares df Mean Square F Sig. 1 Regression 43, ,415 13,657,000 b 77
 7,181 4,255 1,687,109 Interest_rate,259,087,391 2,961,008 LINT(Tariff) -,101,122 -,109 -,832,416 Tax_revenue 1,361,276,654 4,934,000 MODEL KOR4 Model Summary b Adjusted R Std.")
93 Residual 18, ,056 Total 62, Coefficients a Unstandardized Coefficients Standardized Coefficients Model B Std. Error Beta t Sig. 1 (Constant) 7,181 4,255 1,687,109 Interest_rate,259,087,391 2,961,008 LINT(Tariff) -,101,122 -,109 -,832,416 Tax_revenue 1,361,276,654 4,934,000 MODEL KOR4 Model Summary b Adjusted R Std. Error of the Model R R Square Square Estimate Durbin-Watson 1,747 a,557,484 1,23719,928 ANOVA a Model Sum of Squares df Mean Square F Sig. 1 Regression 34, ,565 7,556,002 b Residual 27, ,531 Total 62, Coefficients a Unstandardized Coefficients Standardized Coefficients Model B Std. Error Beta t Sig. 1 (Constant) 15,244 3,886 3,923,001 Interest_rate,362,104,547 3,465,003 LINT(Tariff) -,050,150 -,054 -,335,741 Direct_tax,277,083,538 3,347,004 78
CHAPTER 2 LITERATURE REVIEWS
 CHAPTER 2 LITERATURE REVIEWS The relationship between efficiency and income equality is an old topic, but Lewis (1954) and Kuznets (1955) was the earlier literature that systemically discussed income inequality
HOW ECONOMIES GROW AND DEVELOP Macroeconomics In Context (Goodwin, et al.)
") Chapter 17 HOW ECONOMIES GROW AND DEVELOP Macroeconomics In Context (Goodwin, et al.) Chapter Overview This chapter presents material on economic growth, such as the theory behind it, how it is calculated,
Chapter 17 HOW ECONOMIES GROW AND DEVELOP Macroeconomics In Context (Goodwin, et al.) Chapter Overview This chapter presents material on economic growth, such as the theory behind it, how it is calculated,
Rewriting the Rules of the Market Economy to Achieve Shared Prosperity. Joseph E. Stiglitz New York June 2016
 Rewriting the Rules of the Market Economy to Achieve Shared Prosperity Joseph E. Stiglitz New York June 2016 Enormous growth in inequality Especially in US, and countries that have followed US model Multiple
Edexcel (A) Economics A-level
 Economics A-level") Edexcel (A) Economics A-level Theme 4: A Global Perspective 4.2 Poverty and Inequality 4.2.2 Inequality Notes Distinction between wealth and income inequality Wealth is defined as a stock of assets, such
Edexcel (A) Economics A-level Theme 4: A Global Perspective 4.2 Poverty and Inequality 4.2.2 Inequality Notes Distinction between wealth and income inequality Wealth is defined as a stock of assets, such
AQA Economics A-level
 AQA Economics A-level Microeconomics Topic 7: Distribution of Income and Wealth, Poverty and Inequality 7.1 The distribution of income and wealth Notes Distinction between wealth and income inequality
Trends in inequality worldwide (Gini coefficients)
") Section 2 Impact of trade on income inequality As described above, it has been theoretically and empirically proved that the progress of globalization as represented by trade brings benefits in the form
Section 2 Impact of trade on income inequality As described above, it has been theoretically and empirically proved that the progress of globalization as represented by trade brings benefits in the form
vi. rising InequalIty with high growth and falling Poverty
 43 vi. rising InequalIty with high growth and falling Poverty Inequality is on the rise in several countries in East Asia, most notably in China. The good news is that poverty declined rapidly at the same
There is a seemingly widespread view that inequality should not be a concern
 Chapter 11 Economic Growth and Poverty Reduction: Do Poor Countries Need to Worry about Inequality? Martin Ravallion There is a seemingly widespread view that inequality should not be a concern in countries
Poverty Reduction and Economic Growth: The Asian Experience Peter Warr
 Poverty Reduction and Economic Growth: The Asian Experience Peter Warr Abstract. The Asian experience of poverty reduction has varied widely. Over recent decades the economies of East and Southeast Asia
The Relation of Income Inequality, Growth and Poverty and the Effect of IMF and World Bank Programs on Income Inequality
 BSc Thesis 11/2011 The Relation of Income Inequality, Growth and Poverty and the Effect of IMF and World Bank Programs on Income Inequality Kathrin Buddendieck 880424-142-130 YSS-83312 Supervised by Kees
Inequality in Indonesia: Trends, drivers, policies
 Inequality in Indonesia: Trends, drivers, policies Taufik Indrakesuma & Bambang Suharnoko Sjahrir World Bank Presented at ILO Country Level Consultation Hotel Borobudur, Jakarta 24 February 2015 Indonesia
Reducing income inequality by economics growth in Georgia
 Reducing income inequality by economics growth in Georgia Batumi Shota Rustaveli State University Faculty of Economics and Business PhD student in Economics Nino Kontselidze Abstract Nowadays Georgia has
ARTNeT Trade Economists Conference Trade in the Asian century - delivering on the promise of economic prosperity rd September 2014
 ASIA-PACIFIC RESEARCH AND TRAINING NETWORK ON TRADE ARTNeT CONFERENCE ARTNeT Trade Economists Conference Trade in the Asian century - delivering on the promise of economic prosperity 22-23 rd September
China s (Uneven) Progress Against Poverty. Martin Ravallion and Shaohua Chen Development Research Group, World Bank
 Progress Against Poverty. Martin Ravallion and Shaohua Chen Development Research Group, World Bank") China s (Uneven) Progress Against Poverty Martin Ravallion and Shaohua Chen Development Research Group, World Bank 1 Around 1980 China had one of the highest poverty rates in the world We estimate that
China s (Uneven) Progress Against Poverty Martin Ravallion and Shaohua Chen Development Research Group, World Bank 1 Around 1980 China had one of the highest poverty rates in the world We estimate that
Introduction and Overview
 17 Introduction and Overview In many parts of the world, this century has brought about the most varied forms of expressions of discontent; all of which convey a desire for greater degrees of social justice,
L8: Inequality, Poverty and Development: The Evidence
 L8: Inequality, Poverty and Development: The Evidence Dilip Mookherjee Ec320 Lecture 8, Boston University Sept 25, 2014 DM (BU) 320 Lect 8 Sept 25, 2014 1 / 1 RECAP: Measuring Inequality and Poverty We
Ghana Lower-middle income Sub-Saharan Africa (developing only) Source: World Development Indicators (WDI) database.
 Source: World Development Indicators (WDI) database.") Knowledge for Development Ghana in Brief October 215 Poverty and Equity Global Practice Overview Poverty Reduction in Ghana Progress and Challenges A tale of success Ghana has posted a strong growth performance
Knowledge for Development Ghana in Brief October 215 Poverty and Equity Global Practice Overview Poverty Reduction in Ghana Progress and Challenges A tale of success Ghana has posted a strong growth performance
International Remittances and Brain Drain in Ghana
 Journal of Economics and Political Economy www.kspjournals.org Volume 3 June 2016 Issue 2 International Remittances and Brain Drain in Ghana By Isaac DADSON aa & Ryuta RAY KATO ab Abstract. This paper
Does Inequality Matter for Poverty Reduction? Evidence from Pakistan s Poverty Trends
 The Pakistan Development Review 45 : 3 (Autumn 2006) pp. 439 459 Does Inequality Matter for Poverty Reduction? Evidence from Pakistan s Poverty Trends HAROON JAMAL * The paper explores the linkages between
Prospects for Inclusive Growth in the MENA Region: A Comparative Approach
 Prospects for Inclusive Growth in the MENA Region: A Comparative Approach Hassan Hakimian London Middle East Institute SOAS, University of London Email: HH2@SOAS.AC.UK International Parliamentary Conference
Informal Summary Economic and Social Council High-Level Segment
 Informal Summary 2011 Economic and Social Council High-Level Segment Special panel discussion on Promoting sustained, inclusive and equitable growth for accelerating poverty eradication and achievement
Differences Lead to Differences: Diversity and Income Inequality Across Countries
 Illinois State University ISU ReD: Research and edata Master's Theses - Economics Economics 6-2008 Differences Lead to Differences: Diversity and Income Inequality Across Countries Michael Hotard Illinois
Chapter 10. Resource Markets and the Distribution of Income. Copyright 2011 Pearson Addison-Wesley. All rights reserved.
 Chapter 10 Resource Markets and the Distribution of Income Resource markets differ from markets for consumer goods in several key ways First, the demand for resources comes from firms producing goods and
A poverty-inequality trade off?
 Journal of Economic Inequality (2005) 3: 169 181 Springer 2005 DOI: 10.1007/s10888-005-0091-1 Forum essay A poverty-inequality trade off? MARTIN RAVALLION Development Research Group, World Bank (Accepted:
Executive summary. Strong records of economic growth in the Asia-Pacific region have benefited many workers.
 Executive summary Strong records of economic growth in the Asia-Pacific region have benefited many workers. In many ways, these are exciting times for Asia and the Pacific as a region. Dynamic growth and
Growth, Inequality, and Poverty: An Introduction Nanak Kakwani, Brahm Prakash, and Hyun Son
 Growth, Inequality, and Poverty: An Introduction Nanak Kakwani, Brahm Prakash, and Hyun Son Abstract. The paper provides a summary of all the papers in this special volume. It also gives a brief theoretical
ECONOMIC GROWTH* Chapt er. Key Concepts
 Chapt er 6 ECONOMIC GROWTH* Key Concepts The Basics of Economic Growth Economic growth is the expansion of production possibilities. The growth rate is the annual percentage change of a variable. The growth
and with support from BRIEFING NOTE 1
 and with support from BRIEFING NOTE 1 Inequality and growth: the contrasting stories of Brazil and India Concern with inequality used to be confined to the political left, but today it has spread to a
The Correlates of Wealth Disparity Between the Global North & the Global South. Noelle Enguidanos
 The Correlates of Wealth Disparity Between the Global North & the Global South Noelle Enguidanos RESEARCH QUESTION/PURPOSE STATEMENT: What explains the economic disparity between the global North and the
Mexico: How to Tap Progress. Remarks by. Manuel Sánchez. Member of the Governing Board of the Bank of Mexico. at the. Federal Reserve Bank of Dallas
 Mexico: How to Tap Progress Remarks by Manuel Sánchez Member of the Governing Board of the Bank of Mexico at the Federal Reserve Bank of Dallas Houston, TX November 1, 2012 I feel privileged to be with
Inequality and economic growth
 Introduction One of us is a theorist, and one of us is an historian, but both of us are economists interested in modern debates about technical change, convergence, globalization, and inequality. The central
Explaining the two-way causality between inequality and democratization through corruption and concentration of power
 MPRA Munich Personal RePEc Archive Explaining the two-way causality between inequality and democratization through corruption and concentration of power Eren, Ozlem University of Wisconsin Milwaukee December
Poverty in the Third World
 11. World Poverty Poverty in the Third World Human Poverty Index Poverty and Economic Growth Free Market and the Growth Foreign Aid Millennium Development Goals Poverty in the Third World Subsistence definitions
Latin America was already a region of sharp
 The results of in-depth analyses for Argentina, Brazil, and Mexico reveal two main factors that explain this phenomenon: a fall in the premium that favors skilled over unskilled labor, and more progressive
Growth and Poverty Reduction: An Empirical Analysis Nanak Kakwani
 Growth and Poverty Reduction: An Empirical Analysis Nanak Kakwani Abstract. This paper develops an inequality-growth trade off index, which shows how much growth is needed to offset the adverse impact
The Politics of Development in Capitalist Democracy
 POLI 4062 Comparative Political Economy, Fall 2017 The Politics of Development in Capitalist Democracy Tuesday and Thursday 10:30 11:50 pm, 234 Coates Prof. Wonik Kim, wkim@lsu.edu Office: 229 Stubbs Hall
Trends in the Income Gap Between. Developed Countries and Developing Countries,
 Trends in the Income Gap Between Developed Countries and Developing Countries, 1960-1995 Donghyun Park Assistant Professor Room No. S3 B1A 10 Nanyang Business School Nanyang Technological University Singapore
PERSISTENT POVERTY AND EXCESS INEQUALITY: LATIN AMERICA,
 Journal of Applied Economics, Vol. III, No. 1 (May 2000), 93-134 PERSISTENT POVERTY AND EXCESS INEQUALITY 93 PERSISTENT POVERTY AND EXCESS INEQUALITY: LATIN AMERICA, 1970-1995 JUAN LUIS LONDOÑO * Revista
The Inequalities of. Wealth Distribution: its Economic and. Political Consequences. Dr David Rees
 The Inequalities of Wealth Distribution: its Economic and Political Consequences Dr David Rees Wealth Distribution Exercise Your opinion on wealth distribution is based on what you think is 'fair' or 'unfair'
The World Bank s Twin Goals
 The World Bank s Twin Goals Reduce extreme poverty to 3% or less of the global population by 2030 Boosting Shared Prosperity: promoting consumption/income growth of the bottom 40% in every country 2 these
Full file at
 Chapter 2 Comparative Economic Development Key Concepts In the new edition, Chapter 2 serves to further examine the extreme contrasts not only between developed and developing countries, but also between
title, Routledge, September 2008: 234x156:
 Trade Policy, Inequality and Performance in Indian Manufacturing Kunal Sen IDPM, University of Manchester Presentation based on my book of the same title, Routledge, September 2008: 234x156: 198pp, Hb:
The Politics of Development in Capitalist Democracy
 POLI 4062 Comparative Political Economy, Spring 2016 The Politics of Development in Capitalist Democracy Tuesday and Thursday 1:30 2:50 pm, 218 Coates Prof. Wonik Kim, wkim@lsu.edu Office: 229 Stubbs Hall
Oxfam Education
 Background notes on inequality for teachers Oxfam Education What do we mean by inequality? In this resource inequality refers to wide differences in a population in terms of their wealth, their income
Test Bank for Economic Development. 12th Edition by Todaro and Smith
 Test Bank for Economic Development 12th Edition by Todaro and Smith Link download full: https://digitalcontentmarket.org/download/test-bankfor-economic-development-12th-edition-by-todaro Chapter 2 Comparative
Inclusion and Gender Equality in China
 Inclusion and Gender Equality in China 12 June 2017 Disclaimer: The views expressed in this publication are those of the authors and do not necessarily reflect the views and policies of the Asian Development
CIE Economics A-level
 CIE Economics A-level Topic 4: The Macroeconomy c) Classification of countries Notes Indicators of living standards and economic development The three dimensions of the Human Development Index (HDI) The
Unequal Recovery, Labor Market Polarization, Race, and 2016 U.S. Presidential Election. Maoyong Fan and Anita Alves Pena 1
 Unequal Recovery, Labor Market Polarization, Race, and 2016 U.S. Presidential Election Maoyong Fan and Anita Alves Pena 1 Abstract: Growing income inequality and labor market polarization and increasing
Global Inequality - Trends and Issues. Finn Tarp
 Global Inequality - Trends and Issues Finn Tarp Overview Introduction Earlier studies: background A WIDER study [Methodology] Data General results Counterfactual scenarios Concluding remarks Introduction
The World Bank s Twin Goals
 The World Bank s Twin Goals Reduce extreme poverty to 3% or less of the global population by 2030 Boosting Shared Prosperity: promoting consumption/income growth of the bottom 40% in every country 2 these
Crime and Corruption: An International Empirical Study
 Proceedings 59th ISI World Statistics Congress, 5-3 August 13, Hong Kong (Session CPS111) p.985 Crime and Corruption: An International Empirical Study Huaiyu Zhang University of Dongbei University of Finance
Understanding the dynamics of labor income inequality in Latin America (WB PRWP 7795)
") Understanding the dynamics of labor income inequality in Latin America (WB PRWP 7795) Carlos Rodríguez-Castelán (World Bank) Luis-Felipe López-Calva (UNDP) Nora Lustig (Tulane University) Daniel Valderrama
Understanding the dynamics of labor income inequality in Latin America (WB PRWP 7795) Carlos Rodríguez-Castelán (World Bank) Luis-Felipe López-Calva (UNDP) Nora Lustig (Tulane University) Daniel Valderrama
Economic Growth and Poverty Reduction: Lessons from the Malaysian Experience
 Economic Growth and Poverty Reduction: Lessons from the Malaysian Experience Anoma Abhayaratne 1 Senior Lecturer Department of Economics and Statistics University of Peradeniya Sri Lanka Abstract Over
The Impact of the Interaction between Economic Growth and Democracy on Human Development: Cross-National Analysis
 Edith Cowan University Research Online ECU Publications 2012 2012 The Impact of the Interaction between Economic Growth and Democracy on Human Development: Cross-National Analysis Shrabani Saha Edith Cowan
Economic Disparity. Mea, Moo, Teale
 Economic Disparity Mea, Moo, Teale What are the causes? Impact of Colonialism Population Growth Foreign Debt War Leadership Issues Trade Inequalities Wages and salaries Labour market Taxes Education Globalization
Economic Growth, Foreign Investments and Economic Freedom: A Case of Transition Economy Kaja Lutsoja
 Economic Growth, Foreign Investments and Economic Freedom: A Case of Transition Economy Kaja Lutsoja Tallinn School of Economics and Business Administration of Tallinn University of Technology The main
Poverty in Israel: Reasons and Labor Market Policy
 Poverty in Israel: Reasons and Labor Market Policy Zvi Eckstein and Tali Larom * Policy Paper 2016.08 November 2016 The Aaron Institute s policy papers series is a product of research and policy suggestions
65. Broad access to productive jobs is essential for achieving the objective of inclusive PROMOTING EMPLOYMENT AND MANAGING MIGRATION
 5. PROMOTING EMPLOYMENT AND MANAGING MIGRATION 65. Broad access to productive jobs is essential for achieving the objective of inclusive growth and help Turkey converge faster to average EU and OECD income
Spatial Inequality in Cameroon during the Period
 AERC COLLABORATIVE RESEARCH ON GROWTH AND POVERTY REDUCTION Spatial Inequality in Cameroon during the 1996-2007 Period POLICY BRIEF English Version April, 2012 Samuel Fambon Isaac Tamba FSEG University
Poverty and Inequality
 Chapter 4 Poverty and Inequality Problems and Policies: Domestic After completing this chapter, you will be able to 1. Measure poverty across countries using different approaches and explain how poverty
IMPACT OF GLOBALIZATION ON POVERTY: CASE STUDY OF PAKISTAN
 Romain Pison Prof. Kamal NYU 03/20/06 NYU-G-RP-A1 IMPACT OF GLOBALIZATION ON POVERTY: CASE STUDY OF PAKISTAN INTRODUCTION The purpose of this paper is to examine the effect of globalization in Pakistan
Rising Income Inequality in Asia
 Ryan Lam Economist ryancwlam@hangseng.com Joanne Yim Chief Economist joanneyim@hangseng.com 14 June 2012 Rising Income Inequality in Asia Why inequality matters Recent empirical studies suggest the trade-off
Section 1: Microeconomics. 1.1 Competitive Markets: Demand and Supply. IB Econ Syllabus Outline. Markets Ø The Nature of Markets
 IB Economics Syllabus Outline Mr. R.S. Pyszczek Jr. Room 220 Rpyszczek@BuffaloSchools.org City Honors School at Fosdick- Masten Park 186 East North Street Buffalo, NY 14204 Phone: (7160 816-4230 Fax: (716)
COMPETITION, INEQUALITY AND INCLUSIVE GROWTH
 NOTES BRICS INTERNATIONAL COMPETITION CONFERENCE PANEL DISCUSSION Joel Netshitenzhe, MISTRA Executive Director 13 November 2013 COMPETITION, INEQUALITY AND INCLUSIVE GROWTH It s quite apposite that the
THE RELATIONSHIP BETWEEN DEMOGRAPHIC CHANGE AND INCOME INEQUALITY IN AGING SOCIETY OF THAILAND
 THE RELATIONSHIP BETWEEN DEMOGRAPHIC CHANGE AND INCOME INEQUALITY IN AGING SOCIETY OF THAILAND PAPUSSON CHAIWAT *, and SAWARAI BOONYAMANOND The incidence of poverty in Thailand has been continuously decreased
Interrelationship between Growth, Inequality, and Poverty: The Asian Experience
 Interrelationship between Growth, Inequality, and Poverty: The Asian Experience HYUN H. SON This paper examines the relationships between economic growth, income distribution, and poverty for 17 Asian
Outline: Poverty, Inequality, and Development
 1 Poverty, Inequality, and Development Outline: Measurement of Poverty and Inequality Economic characteristics of poverty groups Why is inequality a problem? Relationship between growth and inequality
POLICY OPTIONS AND CHALLENGES FOR DEVELOPING ASIA PERSPECTIVES FROM THE IMF AND ASIA APRIL 19-20, 2007 TOKYO
 POLICY OPTIONS AND CHALLENGES FOR DEVELOPING ASIA PERSPECTIVES FROM THE IMF AND ASIA APRIL 19-20, 2007 TOKYO RISING INEQUALITY AND POLARIZATION IN ASIA ERIK LUETH INTERNATIONAL MONETARY FUND Paper presented
INEQUALITY IN BANGLADESH Facts, Sources, Consequences and Policies
 Bangladesh Economists Forum INEQUALITY IN BANGLADESH Facts, Sources, Consequences and Policies Azizur Rahman Khan Qazi Kholiquzzaman Ahmad June 21-22, 2014 1 B E F F i r s t C o n f e r e n c e, H o t
Globalization: A Second Look
 12 Globalization: A Second Look Having considered the data, definitions, and methodology, it is now time to revisit some of the conclusions of received wisdom reported in chapters 2 through 4. Several
CAUSES AND CONSEQUENCES OF GROWING INEQUALITY and what can be done about it
 THE FOURTH ANNUAL OXFORD FULBRIGHT DISTINGUISHED LECTURE ON INTERNATIONAL RELATIONS CAUSES AND CONSEQUENCES OF GROWING INEQUALITY and what can be done about it Professor Joseph E. Stiglitz Friday 23 May
A 13-PART COURSE IN POPULAR ECONOMICS SAMPLE COURSE OUTLINE
 A 13-PART COURSE IN POPULAR ECONOMICS SAMPLE COURSE OUTLINE By Jim Stanford Canadian Centre for Policy Alternatives, 2008 Non-commercial use and reproduction, with appropriate citation, is authorized.
Asian Development Review
 2000 Volume 18 Number 2 Asian Development Review Studies of Asian and Pacific Economic Issues Growth, Inequality, and Poverty: An Introduction Nanak Kakwani, Brahm Prakash, and Hyun Son Pro-poor Growth
The Challenge of Inclusive Growth: Making Growth Work for the Poor
 2015/FDM2/004 Session: 1 The Challenge of Inclusive Growth: Making Growth Work for the Poor Purpose: Information Submitted by: World Bank Group Finance and Central Bank Deputies Meeting Cebu, Philippines
19 ECONOMIC INEQUALITY. Chapt er. Key Concepts. Economic Inequality in the United States
 Chapt er 19 ECONOMIC INEQUALITY Key Concepts Economic Inequality in the United States Money income equals market income plus cash payments to households by the government. Market income equals wages, interest,
Asia-Pacific to comprise two-thirds of global middle class by 2030, Report says
 Strictly embargoed until 14 March 2013, 12:00 PM EDT (New York), 4:00 PM GMT (London) Asia-Pacific to comprise two-thirds of global middle class by 2030, Report says 2013 Human Development Report says
Forum «Pour un Québec prospère» Pour des politiques publiques de réduction des inégalités pro-croissance Mardi le 3 juin 2014
 Forum «Pour un Québec prospère» Pour des politiques publiques de réduction des inégalités pro-croissance Mardi le 3 juin 2014 NOUVELLES APPROCHES EN MATIÈRE DE RÉDUCTION DES INÉGALITÉS ET DE POLITIQUES
The impacts of minimum wage policy in china
 The impacts of minimum wage policy in china Mixed results for women, youth and migrants Li Shi and Carl Lin With support from: The chapter is submitted by guest contributors. Carl Lin is the Assistant
Distribution of income and wealth among individuals: theoretical perspectives. Joseph E. Stiglitz Bangalore Advanced Graduate Workshop July 2016
 Distribution of income and wealth among individuals: theoretical perspectives Joseph E. Stiglitz Bangalore Advanced Graduate Workshop July 2016 Outline Description of growth of inequality Brief description
Source: Piketty Saez. Share (in %), excluding capital gains. Figure 1: The top decile income share in the U.S., % 45% 40% 35% 30% 25%
, excluding capital gains. Figure 1: The top decile income share in the U.S., % 45% 40% 35% 30% 25%") The Hecksher-Ohlin-Samuelson (HOS) model Extension of Ricardian model: trade is explained by comparative advantage but those are based on:du modèle ricardien: - differences of endowments in factors of
The Hecksher-Ohlin-Samuelson (HOS) model Extension of Ricardian model: trade is explained by comparative advantage but those are based on:du modèle ricardien: - differences of endowments in factors of
Hot Topic: World Income Inequality Is the world becoming more unequal?
 You are here: How Canada Performs > Hot Topics > World Income Inequality Print Page Hot Topic: World Income Inequality Is the world becoming more unequal? [ September 2011 ] Key Messages Of total world
GLOBALIZATION AND DEVELOPMENT
 GLOBALIZATION AND DEVELOPMENT JOSEPH E. STIGLITZ TOKYO JULY 2007 The Successes of Globalization China and India, with 2.4 billion people, growing at historically unprecedented rates Continuing the successes
Poverty, growth and inequality
 Part 1 Poverty, growth and inequality 16 Pro-Poor Growth in the 1990s: Lessons and Insights from 14 Countries Broad based growth and low initial inequality are critical to accelerating progress toward
The Demography of the Labor Force in Emerging Markets
 The Demography of the Labor Force in Emerging Markets David Lam I. Introduction This paper discusses how demographic changes are affecting the labor force in emerging markets. As will be shown below, the
Assessment of the Impact of Pro-Poor Growth on Poverty in Developing Countries
 Assessment of the Impact of Pro-Poor Growth on Poverty in Developing Countries Ilhem Zorgui Community College of Jazan University Saudi Arabia and Assistant in FSEG Jendouba, Tunisia. Houda Ayed Economics
Inequality in Asia: Trends, Drivers and Policy Implications
 Inequality in Asia: Trends, Drivers and Policy Implications Juzhong Zhuang Deputy Chief Economist Asian Development Bank Presentation at 215 Hitotsubashi University-IMF Seminar on Inequality, March 12-13,
Human Capital and Income Inequality: New Facts and Some Explanations
 Human Capital and Income Inequality: New Facts and Some Explanations Amparo Castelló and Rafael Doménech 2016 Annual Meeting of the European Economic Association Geneva, August 24, 2016 1/1 Introduction
Employment opportunities and challenges in an increasingly integrated Asia and the Pacific
 Employment opportunities and challenges in an increasingly integrated Asia and the Pacific KEIS/WAPES Training on Dual Education System and Career Guidance Kee Beom Kim Employment Specialist ILO Bangkok
How Important Are Labor Markets to the Welfare of Indonesia's Poor?
 Public Disclosure Authorized Public Disclosure Authorized Public Disclosure Authorized Public Disclosure Authorized S /4 POLICY RESEARCH WORKING PAPER 1665 How Important Are Labor Markets to the Welfare
ESTIMATING INCOME INEQUALITY IN PAKISTAN: HIES TO AHMED RAZA CHEEMA AND MAQBOOL H. SIAL 26
 ESTIMATING INCOME INEQUALITY IN PAKISTAN: HIES 1992-93 TO 2007-08 Abstract AHMED RAZA CHEEMA AND MAQBOOL H. SIAL 26 This study estimates Gini coefficient, Generalized Entropy and Atkinson s Indices in
REVIEW POVERTY, INCOME INEQUALITY, AND HEALTH CARE CONSUMPTION IN THAILAND
 REVIEW POVERTY, INCOME INEQUALITY, AND HEALTH CARE CONSUMPTION IN THAILAND Isra Samtisart Center for Health Economics Faculty of Economics, Chulalongkorn University, Bangkok 10330, Thailand Abstract. The
Economic Growth and Poverty Alleviation in Russia: Should We Take Inequality into Consideration?
 WELLSO 2015 - II International Scientific Symposium on Lifelong Wellbeing in the World Economic Growth and Poverty Alleviation in Russia: Should We Take Inequality into Consideration? Dmitry Rudenko a
THE COFFEES OF THE SECRETARY-GENERAL JAMES K. GALBRAITH
 THE COFFEES OF THE SECRETARY-GENERAL JAMES K. GALBRAITH 18 June 2010 THE COFFEES OF THE SECRETARY-GENERAL Bringing New Perspectives to the OECD Secretary-General s Speech Writing and Intelligence Outreach
Macroeconomics and Gender Inequality Yana van der Meulen Rodgers Rutgers University
 Macroeconomics and Gender Inequality Yana van der Meulen Rodgers Rutgers University International Association for Feminist Economics Pre-Conference July 15, 2015 Organization of Presentation Introductory
Online Consultation for the Preparation of the Tajikistan Systematic Country Diagnostic. Dushanbe, Tajikistan March 2017
 Online Consultation for the Preparation of the Tajikistan Systematic Country Diagnostic Dushanbe, Tajikistan March 2017 The Systematic Country Diagnostic (SCD): Designed to be the main analytical input
Income Inequality and Kuznets Hypothesis in Thailand
 INCOME [Asian Economic INEQUALITY Journal 1998, 2000, IN Vol. THAILAND 12 14 No. 3] 4] 421 Income Inequality and Kuznets Hypothesis in Thailand Yukio Ikemoto University of Tokyo Mine Uehara Kyoto University
Macroeconomics and Gender Inequality. Gender inequality is a global issue, pervasive in almost every society. Gender
 Macroeconomics and Gender Inequality Introduction Gender inequality is a global issue, pervasive in almost every society. Gender discrimination has an impact on much of life, including health, education,
Made in China Matters: Integration of the Global Labor Market and Global Labor Share Decline
 Made in China Matters: Integration of the Global Labor Market and Global Labor Share Decline Li Daokui 1 and Xu Xiang 2 Modern macro research expends great effort to identify the driving force of increasing
Lecture 1 Economic Growth and Income Differences: A Look at the Data
 Lecture 1 Economic Growth and Income Differences: A Look at the Data Rahul Giri Contact Address: Centro de Investigacion Economica, Instituto Tecnologico Autonomo de Mexico (ITAM). E-mail: rahul.giri@itam.mx
Is Economic Development Good for Gender Equality? Income Growth and Poverty
 Is Economic Development Good for Gender Equality? February 25 and 27, 2003 Income Growth and Poverty Evidence from many countries shows that while economic growth has not eliminated poverty, the share