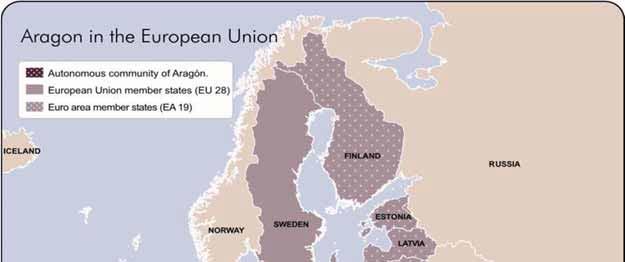
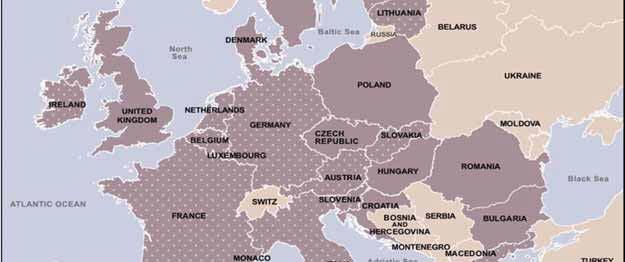
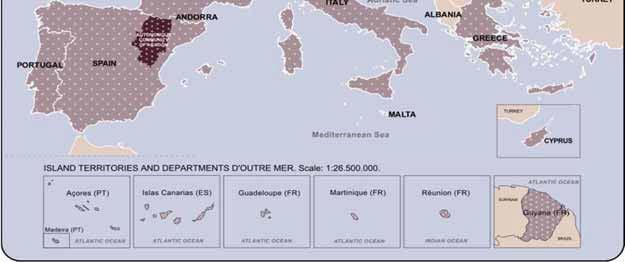
ARAGON IN SPAIN AND THE EU.
|
|
|
- Luke Caldwell
- 6 years ago
- Views:
Transcription
1
2 166
3 167 Population; Labour market. Population Total population as of January 1st* Persons ,318,738 46,445, ,284,430 Population density Inhab/Km Annual population change Persons ,665-3,737 1,780,110 Annual natural population change Persons ,987-1, ,336 Annual net migration Persons ,678-1,761 1,897,446 Total fertility rate Children per woman Life expectancy at birth. Men Years Life expectancy at birth. Women Years Dependency ratio of population aged 65 and more, over population aged Percentage Labour market Employment rate Percentage Female employment rate Percentage Gender gap for the employment rate, person aged (percentage points difference between male and female rates) Percentage points Elderly unemployment rate (55-64) Percentage Unemployment rate Percentage Change in unemployment rate, Percentage points Youth unemployment rate (15 24) Percentage Share of unemployed persons seeking for a job for longer than one year Percentage * Eurostat estimates
4 168 GPD; Specialisation and business concentration. Gross Domestic Product in terms of Purchasing Power Standard (PPS) Gross Domestic Product per inhabitant in PPS Euros en PPS ,500 25,900 28,900 Gross Domestic Product per inhabitant in PPS UE28= Change of GDP per inhabitant in PPS, 2000 as compared to 2004 respect of the average EU-28 Puntos porcentuales Specialisation and business concentration Share of mining, industry and energy employment (sections B to E) over total employment (sections B to N, except K) Percentage Share of construction employment (section F) over total employment (sections B to N, except K) Share of non-financial services employment (sections G to N, except K) over total employment (sections B to N, except K) Share of five divisions with largest employees number over total employment (sections B to N, except K) Porcentaje Percentage Percentage
5 169 Information Society; Science, technology and innovation. Information Society Households with internet access Percentage Average annual change of households with internet acces between 2013 and 2015 Percentage points Households with broadband connections Percentage Average annual change of households with broadband connections between 2013 and 2015 Persons who accessed the internet on average at least once a week Average annual change between 2013 and 2015 of persons who accessed the internet on average at least once a week Percentage points Percentage Percentage points Persons who ordered goods or services on the internet for private use in the last Percentage months Average annual change between 2013 and 2015 of persons who ordered goods or services on the internet for private use Percentage points in the last 12 months Science, technology and innovation Total R&D expenditure as % of GDP Percentage Share of researchers in employed population Percentage ,3 (2) Share of persons with tertiary education who are employed in Science and Technology activities in active population Share of employment in High-Tech sectors in employed population Percentage Percentage (1) Provisional date (2) 2013
6 170 Education; Health. Education Population aged having completed tertiary education (ISCED levels 5-6) Percentage Population aged having completed tertiary education (ISCED levels 5-6) Early leavers from education: Percentage of population aged who have finished no more than a lower secondary education and not involved in further education Health Hospital beds Practising physicians Percentage Percentage per 100,000 inhabitants per 100,000 inhabitants ,7 (1) (1) 2013 Own estimation from Key figures on Europe 2016 edition
7 171 ARAGON BASIC DATA, 2016 Instituto Aragonés de Estadística Agriculture; Transport. Agriculture Share of agriculture in total economy (Gross Value Added at basic prices) Percentage Agricultural labour productivity:gva at basic prices per annual work unit 1,000 euros Production of cows milk on farms 1,000 Tn/Km ,0 (1) Harvest production of cereals Tn/Km Harvest production of potatoes Tn/Km Transport Density of motorway networks Km/1,000 Km ,4(2) Motorisation rate. Number of passenger cars per inhabitants Vehicles ,7(3) Equipment rate for public transport vehicles (motor coaches, buses and trolleybuses) per inhabitants Vehicles ,8 (3) Road freight vehicles 1,000 vehicles , ,3(3) over total vehicles Percentage ,3(3) (1) 2014 (2) 2010 (3) Own estimation from Eurostat
8 172 Tourism. Tourism Overnight stays in hotels and campsites , , ,784,175.7 in hotels and campsites. Average annual growth in campsites compared to total night spents in hotels and campsites, by nonresidents* Percentage Percentage Percentage Tourism intensity: nights spent in hotels and campsites per inhabitant Number , , ,475.8 Average length of overnight stays in hotels Number in campsites Number Bed places in hotels Number ,455 1,906,827 13,522,493 Bed places in hotels per establishment Average number * Non-residents in Spain. Source: Eurostat (Statistical Office of the European Communities) and IAEST according to data from Eurostat.
NOI ITALIA. 100 STATISTICS TO UNDERSTAND THE COUNTRY WE LIVE IN
 03 May 2012 Data publication office tel. +39 06 4673.3105 Press office tel. +39 06 4673.2243-44 ufficiostampa@istat.it 2012 Edition NOI ITALIA. 100 STATISTICS TO UNDERSTAND THE COUNTRY WE LIVE IN Noi Italia.
CHAPTER TITLE MAIN INDICATORS OF THE VISEGRÁD GROUP COUNTRIES
 CHAPTER TITLE MAIN INDICATORS OF THE VISEGRÁD GROUP COUNTRIES MAIN INDICATORS OF THE VISEGRÁD GROUP COUNTRIES Hungarian Central Statistical Office, 218 Czech Statistical Office, 218 Statistics Poland,
2018 BAVARIA S ECONOMY FACTS AND FIGURES
 Bavarian Ministry of Economic Affairs, Energy and Technology 2018 BAVARIA S ECONOMY FACTS AND FIGURES wwwstmwibayernde As of August 2018 Area Population (3006) 1) females males age 0-14 (3112) 15-64 65+
The Demographic Profile of Somalia
 UNITED NATIONS The Demographic Profile of Somalia Population Trends - Mortality - Fertility - Age Structure - Urbanization - International Migration - Education and Youth Unemployment Population Trends
The Demographic Profile of the State of Palestine
 UNITED NATIONS The Demographic Profile of the State of Palestine Population Trends - Mortality - Fertility - Age Structure - Urbanization - International Migration - Education and Youth Unemployment Population
The Demographic Profile of Qatar
 UNITED NATIONS The Demographic Profile of Qatar Population Trends - Mortality - Fertility - Age Structure - Urbanization - International Migration - Education and Youth Unemployment Population Trends Population
The Demographic Profile of Kuwait
 UNITED NATIONS The Demographic Profile of Kuwait Population Trends - Mortality - Fertility - Age Structure - Urbanization - International Migration - Education and Youth Unemployment Population Trends
CANARY ISLANDS HEADLINE ECONOMIC INDICATORS
 29/07/2014 CANARY ISLANDS HEADLINE ECONOMIC INDICATORS 6 6 May 2016 Viceconsejería de Economía y Asuntos Económicos con la UE Department for Economy and European Economic Affairs CANARY ISLANDS HEADLINE
The Demographic Profile of Oman
 UNITED NATIONS The Demographic Profile of Oman Population Trends - Mortality - Fertility - Age Structure - Urbanization - International Migration - Education and Youth Unemployment Population Trends Population
The Demographic Profile of Saudi Arabia
 Infant mortality rate (per 1 live births) UNITED NATIONS The Demographic Profile of Saudi Arabia Population Trends - Mortality - Fertility - Age Structure - Urbanization - International Migration - Education
The Demographic Profile of the United Arab Emirates
 UNITED NATIONS The Demographic Profile of the United Arab Emirates Population Trends - Mortality - Fertility - Age Structure - Urbanization - International Migration - Education and Youth Unemployment
COUNTRY PROFILE. Czech Republic
 COUNTRY PROFILE Czech Republic IMD WORLD COMPETITIVENESS RANKING 18 All data are available from the World Competitiveness Online. Visit our eshop 1 COMPETITIVENESS TRENDS - OVERALL CZECH REPUBLIC OVERALL
Palestine in Figures 2011
 Palestine in Figures 2011 March, 2012 This document is prepared in accordance with the standard procedures stated in the Code of Practice for Palestine Official Statistics 2006. March, 2012 All rights
1. Economy. Economic Aggregates. Foreign Trade. Prices. Financial Statistics. Government Finance. Wages and Compensation. Foreign Investment
 1. Economy Economic Aggregates Foreign Trade Prices Financial Statistics Government Finance Wages and Compensation Foreign Investment GDP at Current Prices, Abu Dhabi Emirate, 2014* Non-oil GDP 952,676
Spain PROMISE (GA693221)
") Spain Population 46.443.959 Population aged 15-29 years old 14,7% Population aged 65 years old and above 19,2% Birth Rate 9,0 International migrant stock as a percentage of the 12,7% total population PROMISE
Spain Population 46.443.959 Population aged 15-29 years old 14,7% Population aged 65 years old and above 19,2% Birth Rate 9,0 International migrant stock as a percentage of the 12,7% total population PROMISE
STOCKHOLM. Yearbook: Summary Results 232
 STOCKHOLM Stockholm is the capital city of Sweden, located on 15 islands where Lake Mälaren enters the Baltic Sea. Stockholm is the centre of an urban region with a population of approximately 1,760,000,
Objective Indicator 27: Farmers with other gainful activity
 3.5. Diversification and quality of life in rural areas 3.5.1. Roughly one out of three farmers is engaged in gainful activities other than farm work on the holding For most of these farmers, other gainful
Population, Health, and Human Well-Being-- Portugal
 Population, Health, and Human Well-Being-- Portugal EarthTrends Country Profiles Demographic and Health Indicators Portugal Europe World Total Population (in thousands of people) 1950 8,405 548,206 2,519,495
RIS 3 Sicily SICILY IN PILLS
 RIS 3 Sicily 2014-2020 SICILY IN PILLS FARO, Portugal, July 4th 2013 Sicily is the largest Italian region, with a surface of 8,5% of the whole national territory. It is the fourth most populated region
Low-skilled adults in Europe and their situation in the labour market
 MLP - Upskilling unemployed adults Low-skilled adults in Europe and their situation in the labour market Brussels, 25 June 2015 Antonio Ranieri Economic and Social Costs of Low Skilled Adults in the EU
QUALITY OF LIFE HEALTH
 QUALITY OF LIFE HEALTH QUALITY Health OF LIFE EXPECTANCY Life expectancy at birth remains one of the most frequently quoted indicators of health status. Gains in life expectancy in OECD countries in recent
National Assessments on Gender and Science, Technology and Innovation (STI) Overall Results, Phase One September 2012
 Overall Results, Phase One September 2012") National Assessments on Gender and Science, Technology and Innovation (STI) Scorecard on Gender Equality in the Knowledge Society Overall Results, Phase One September 2012 Overall Results The European
National Assessments on Gender and Science, Technology and Innovation (STI) Scorecard on Gender Equality in the Knowledge Society Overall Results, Phase One September 2012 Overall Results The European
Official Journal of the European Union L 192/17
 22.7.2011 Official Journal of the European Union L 192/17 REGULATION (EU) No 692/2011 OF THE EUROPEAN PARLIAMENT AND OF THE COUNCIL of 6 July 2011 concerning European statistics on tourism and repealing
Hessisches Statistisches Landesamt. Hesse in figures
 Hessisches Statistisches Landesamt Hesse in figures Edition 2013 Population and Area Population (31.12.) 2011 2012 TOTAL 5 993 771 6 016 481 100 Male 2 928 449 2 943 855 48.9 Female 3 065 322 3 072 626
DEMOGRAPHIC AND ECONOMIC CHANGES CHARACTERIZING THE RURAL POPULATION IN ROMANIA
 DEMOGRAPHIC AND ECONOMIC CHANGES CHARACTERIZING THE RURAL POPULATION IN ROMANIA Agatha POPESCU, Toma Adrian DINU, Elena STOIAN University of Agricultural Sciences and Veterinary Medicine Bucharest, 59
Territorial Evidence for a European Urban Agenda
 ESPON Workshop: Territorial Evidence for a European Urban Agenda The territorial and urban issues in the 6th Cohesion Report Alexandros Karvounis Economic Analysis Unit, DG REGIO 25 November 2014, Brussels
Indicators of Immigrant Integration. Eurostat Pilot Study March 2011
 Indicators of Immigrant Integration Eurostat Pilot Study March 2011 Common Agenda for Integration Common basic principles: 2005 Integration is a dynamic, two-way process of mutual accommodation by all
Annex B: Notes to Charts and Tables
 Annex B: Notes to Charts and Tables Charts Chapter 2 Figure 2.1: All-Island population trends and forecasts (absolute numbers) Figure 2.2: All-Island population trends and forecasts (index 1996=100) Figure
Europe in Figures - Eurostat Yearbook 2008 The diversity of the EU through statistics
 STAT/08/75 2 June 2008 Europe in Figures - Eurostat Yearbook 2008 The diversity of the EU through statistics What was the population growth in the EU27 over the last 10 years? In which Member State is
Context Indicator 17: Population density
 3.2. Socio-economic situation of rural areas 3.2.1. Predominantly rural regions are more densely populated in the EU-N12 than in the EU-15 Context Indicator 17: Population density In 2011, predominantly
1.1. SOCIAL AND ECONOMIC FRAMEWORK Population Economic development and productive sectors
 1. Background 1.1. SOCIAL AND ECONOMIC FRAMEWORK 1.1.1. Population 1.1.2. Economic development and productive sectors 1.2. TRANSPARENCY AND ACCESS TO ENVIRONMENTAL INFORMATION 1.1. Social and economic
Convergence: a narrative for Europe. 12 June 2018
 Convergence: a narrative for Europe 12 June 218 1.Our economies 2 Luxembourg Ireland Denmark Sweden Netherlands Austria Finland Germany Belgium United Kingdom France Italy Spain Malta Cyprus Slovenia Portugal
Europe That Grows Out of the Eradication of Poverty
 Europe That Grows Out of the Eradication of Poverty By Quarto Mondo Italia SPEECH by Mr Luca JAHIER President of Group III 'Various Interests' of the European Economic and Social Committee Rome 14 June
Socio-Economic Profile
 LOCAL HEALTH AREA 7 - Socio-Economic Profile Powell River Comox Cumberland Denman Island Hornby Island Qualicum CENSUS POPULATION LAND AREA POPULATION DENSITY Number % of Region Sq. Km. % of Region Persons
3 Recent developments in euro area labour supply
 3 Recent developments in euro area labour supply Labour supply developments are an important driver of both the economic recovery and longerterm growth. On the structural side, labour supply can be a significant
The Impact of Ireland s Recession on the Labour Market Outcomes of its Immigrants
 The Impact of Ireland s Recession on the Labour Market Outcomes of its Immigrants Alan Barrett and Elish Kelly Economic and Social Research Institute October 2010 Structure of the talk Some pictures of
Veneto in Europe. a comparison with the 27 EU Member States. Economic and social research centre
 Veneto in Europe a comparison with the 27 EU Member States Economic and social research centre Veneto in Europe: a comparison with the 27 EU Member States This report was drawn up by the Study Centre of
Labour Migration and Gender Equality:
 Labour Migration and Gender Equality: Some Lessons from ECA and MENA Regions Prepared by M. Manke, Ph.D RO Vienna, IOM Istanbul, April 2012 Overview 1. Issues and trends: ECA and MENA 2. Challenges 3.
INTERNATIONAL GENDER PERSPECTIVE
 Chapter 7 INTERNATIONAL GENDER PERSPECTIVE OF DEVELOPMENT INDICATORS Women & Men In India 2016 115 116 International Gender Perspective International Gender Perspective of Development Indicators India
Tourism in Europe Trends
 D E T A I L E D T A B L E S Tourism in Europe Trends 1995-98 EUROPEAN COMMISSION 2000 EDITION THEME 4 Industry, trade and services 2000 EDITION Tourism in Europe Trends 1995-98 EUROPEAN COMMISSION THEME
Human Development Indices and Indicators: 2018 Statistical Update. Pakistan
 Human Development Indices and Indicators: 2018 Statistical Update Briefing note for countries on the 2018 Statistical Update Introduction Pakistan This briefing note is organized into ten sections. The
Human Development Indices and Indicators: 2018 Statistical Update. Eritrea
 Human Development Indices and Indicators: 2018 Statistical Update Briefing note for countries on the 2018 Statistical Update Introduction Eritrea This briefing note is organized into ten sections. The
INTERNATIONAL COMPARISON
 Chapter 7 INTERNATIONAL COMPARISON OF GENDER INDICATORS Women & Men in India -2017 125 126 International Comparison of Gender Indicators International Comparison of Gender Indicators India is part of many
Demography. Demography is the study of human population. Population is a dynamic open systems with inputs, processes and outputs.
 Population Demography Demography is the study of human population. Population is a dynamic open systems with inputs, processes and outputs. This means that change constantly occurs in population numbers,
The regional and urban dimension of Europe 2020
 ESPON Workshop The regional and urban dimension of Europe 2020 News on the implementation of the EUROPE 2020 Strategy Philippe Monfort DG for Regional Policy European Commission 1 Introduction June 2010
Labour market trends and prospects for economic competitiveness of Lithuania
 VILNIUS UNIVERSITY Faculty of Economics and Business Administration Luxembourg, 2018 Labour market trends and prospects for economic competitiveness of Lithuania Conference Competitiveness Strategies for
STRENGTHENING RURAL CANADA: Fewer & Older: The Coming Population and Demographic Challenges in Rural Newfoundland & Labrador
 STRENGTHENING RURAL CANADA: Fewer & Older: The Coming Population and Demographic Challenges in Rural Newfoundland & Labrador An Executive Summary 1 This paper has been prepared for the Strengthening Rural
The Economic and Financial Crisis and Precarious Employment amongst Young People in the European Union
 The Economic and Financial Crisis and Precarious Employment amongst Young People in the European Union Niall O Higgins LABESS, CELPE Università di Salerno & IZA, Bonn nohiggins@unisa.it Presentation Overview
Understanding Youth in Arab Countries:
 MPRA Munich Personal RePEc Archive Understanding Youth in Arab Countries: Tahar Harkat and Ahmed Driouchi IEAPS, Al Akhawayn University 10 January 2018 Online at https://mpra.ub.uni-muenchen.de/83843/
Human Development Indices and Indicators: 2018 Statistical Update. Cambodia
 Human Development Indices and Indicators: 2018 Statistical Update Briefing note for countries on the 2018 Statistical Update Introduction Cambodia This briefing note is organized into ten sections. The
Human Development Indices and Indicators: 2018 Statistical Update. Indonesia
 Human Development Indices and Indicators: 2018 Statistical Update Briefing note for countries on the 2018 Statistical Update Introduction Indonesia This briefing note is organized into ten sections. The
ARMENIA EDUCATION, TRAINING AND EMPLOYMENT DEVELOPMENTS 2017 ARMENI 01
 ARMENIA EDUCATION, TRAINING AND EMPLOYMENT DEVELOPMENTS 2017 ARMENI 01 The contents of this paper are the sole responsibility of the ETF and do not necessarily reflect the views of the EU institutions.
2016 Statistical Yearbook. Republic of Palau Bureau of Budget and Planning Ministry of Finance
 2016 Statistical Yearbook Republic of Palau Bureau of Budget and Planning Ministry of Finance REPUBLIC OF PALAU Office of the Minister ELBUCHEL SADANG Minister Message from the Minister of Finance I am
Measuring Social Inclusion
 Measuring Social Inclusion Measuring Social Inclusion Social inclusion is a complex and multidimensional concept that cannot be measured directly. To represent the state of social inclusion in European
Migration and the European Job Market Rapporto Europa 2016
 Migration and the European Job Market Rapporto Europa 2016 1 Table of content Table of Content Output 11 Employment 11 Europena migration and the job market 63 Box 1. Estimates of VAR system for Labor
Potential Migrants. Turin, March, 2012
 Potential Migrants Turin, March, 2012 Profile of Georgia Capital: Tbilisi Population: 4,456,200 (01/01/2011) GDP per capita, PPP, US$: 5,073 in 2010 (World Bank) National GDP: - 3.8% in 2009; 6.4% in 2010
September 2012 Euro area unemployment rate at 11.6% EU27 at 10.6%
 STAT/12/155 31 October 2012 September 2012 Euro area unemployment rate at 11.6% at.6% The euro area 1 (EA17) seasonally-adjusted 2 unemployment rate 3 was 11.6% in September 2012, up from 11.5% in August
Selected macro-economic indicators relating to structural changes in agricultural employment in the Slovak Republic
 Selected macro-economic indicators relating to structural changes in agricultural employment in the Slovak Republic Milan Olexa, PhD 1. Statistical Office of the Slovak Republic Economic changes after
GLOBAL WAGE REPORT 2016/17
 GLOBAL WAGE REPORT 2016/17 WAGE INEQUALITY IN THE WORKPLACE Patrick Belser Senior Economist, ILO Belser@ilo.org Outline Part I: Major Trends in Wages Global trends Wages, productivity and labour shares
THE 2018 EU JUSTICE SCOREBOARD
 THE 2018 EU JUSTICE SCOREBOARD Quantitative data May 2018 This document contains a selection of graphs with quantitative data from the 2018 EU Justice Scoreboard. (The figure numbers correspond to those
Demographic Challenges
 Demographic Challenges Tomas Sobotka Vienna Institute of Demography (Austrian Academy of Sciences), Wittgenstein Centre for Demography and Global Human Capital Background Demographic Changes in Portugal
Quarterly Labour Market Report. February 2017
 Quarterly Labour Market Report February 2017 MB14052 Feb 2017 Ministry of Business, Innovation and Employment (MBIE) Hikina Whakatutuki - Lifting to make successful MBIE develops and delivers policy, services,
France in the European Union
 2008 France in the European Union France in the European Union 2008 Publication manager: Jean- Philippe Cotis Editorial supervision: INSEE Texts: INSEE French official statistical system Maps: INSEE Translation:
germany in the eu 2006
 In the Spotlight germany in the eu 2006 Federal Statistical Office of Germany Imprint Published by: Written by: Statistisches Bundesamt, Federal Statistical Office, Wiesbaden Johanna Mischke, supported
8. REGIONAL DISPARITIES IN GDP PER CAPITA
 8. REGIONAL DISPARITIES IN GDP PER CAPITA GDP per capita varies significantly among OECD countries (Figure 8.1). In 2003, GDP per capita in Luxembourg (USD 53 390) was more than double the OECD average
Social an Cultural Eco-efficiency Indicators in Southeast Finland
 Social an Cultural Eco-efficiency Indicators in Southeast Finland Mr. Niilo Melolinna Senior Researcher, Licentiate in Social Sciences. The Employment and Economic Development Centre for Southeastern Finland
GLOBALIZATION, DEVELOPMENT AND POVERTY REDUCTION: THEIR SOCIAL AND GENDER DIMENSIONS
 TALKING POINTS FOR THE EXECUTIVE SECRETARY ROUNDTABLE 1: GLOBALIZATION, DEVELOPMENT AND POVERTY REDUCTION: THEIR SOCIAL AND GENDER DIMENSIONS Distinguished delegates, Ladies and gentlemen: I am pleased
This country report is going to examine the significant social problem such as poverty and social exclusion and unemployement in Turkey.
 This country report is going to examine the significant social problem such as poverty and social exclusion and unemployement in Turkey. This report also includes best practices in Nazilli and the description
Opportunities and challenges on youth employment in tourism 27 th World Tourism Network on Child Protection ITB, Berlin, March 9, 2012
 Opportunities and challenges on youth employment in tourism 27 th World Tourism Network on Child Protection ITB, Berlin, March 9, 2012 1 B Y D R. W O L F G ANG WEINZ I L O, GENEVA Labour and Tourism 2
ATTRACTIVE DANUBE PROJECT TERRITORIAL ATTRACTIVENESS ANALYSIS OF THE DANUBE REGION
 ATTRACTIVE DANUBE PROJECT TERRITORIAL ATTRACTIVENESS ANALYSIS OF THE DANUBE REGION PhD, MBA Ljiljana Živković, spatial planner Ministry of construction, transport and infrastructure Belgrade, Serbia, liliana.zivkovic@gmail.com
Decent Work Indicators in the SDGs Global Indicator Framework. ILO Department of Statistics & ILO Regional Office for Asia and the Pacific
 Decent Work Indicators in the SDGs Global Indicator Framework ILO Department of Statistics & ILO Regional Office for Asia and the Pacific Content Introduction Monitoring and reporting Decent Work Agenda
9HSTCQE*cgibjh+ Northern Sparsely Populated. Northern Sparsely Populated Areas. OECD Territorial Reviews. OECD Territorial Reviews
 Northern Sparsely Populated Areas This series offers analysis and policy guidance to national and subnational governments seeking to strengthen territorial development policies and governance. These reviews
ASSESSING THE ECONOMIC IMPACT OF FOREIGN WORKERS IN MALTA
 ASSESSING THE ECONOMIC IMPACT OF FOREIGN WORKERS IN MALTA Article published in the Quarterly Review 2016:1, pp. 39-44 BOX 3: ASSESSING THE ECONOMIC IMPACT OF FOREIGN WORKERS IN MALTA 1 Between the late
The new demographic and social challenges in Spain: the aging process and the immigration
 International Geographical Union Commission GLOBAL CHANGE AND HUMAN MOBILITY The 4th International Conference on Population Geographies The Chinese University of Hong Kong (10-13 July 2007) The new demographic
Index. adjusted wage gap, 9, 176, 198, , , , , 241n19 Albania, 44, 54, 287, 288, 289 Atkinson index, 266, 277, 281, 281n1
 Index adjusted wage gap, 9, 176, 198, 202 206, 224 227, 230 233, 235 238, 241n19 Albania, 44, 54, 287, 288, 289 Atkinson index, 266, 277, 281, 281n1 Baltic Countries (BCs), 1, 3 6, 8, 10, 11, 13, 27, 29,
Spain s average level of current well-being: Comparative strengths and weaknesses
 How s Life in Spain? November 2017 Relative to other OECD countries, Spain s average performance across the different well-being dimensions is mixed. Despite a comparatively low average household net adjusted
Nordic Statistics 2018
 Nordic Statistics 2018 Nordic Statistics 2018 Ed: Ulla Agerskov and Silva Mertsola, Nordic Council of Ministers ANP 2018:819 ISBN 978-92-893-5826-2 (PRINT) ISBN 978-92-893-5827-9 (PDF) ISBN 978-92-893-5828-6
Goal 7. Ensure access to affordable, reliable, sustainable and modern energy for all
 Goal 7. Ensure access to affordable, reliable, sustainable and modern energy for all Table 4.1: Selected Indicators for SDG 7 - Energy Efficiency and Access to Modern and Renewable Energy Sources By 2030,
2015/16 Annual review of the Ministry of Business, Innovation and Employment
 2015/16 Annual review of the Ministry of Business, Innovation and Employment Report of the Commerce Committee Contents Recommendation 2 Introduction 2 Financial performance and audit opinion 2 Payroll
Korea s average level of current well-being: Comparative strengths and weaknesses
 How s Life in Korea? November 2017 Relative to other OECD countries, Korea s average performance across the different well-being dimensions is mixed. Although income and wealth stand below the OECD average,
BUILDING RESILIENT REGIONS FOR STRONGER ECONOMIES OECD
 o: o BUILDING RESILIENT REGIONS FOR STRONGER ECONOMIES OECD Table of Contents Acronyms and Abbreviations 11 List of TL2 Regions 13 Preface 16 Executive Summary 17 Parti Key Regional Trends and Policies
Multiple-choice questions
 ambridge Geography for the I iploma: Patterns and hange Multiple-choice questions Section 1: Populations in transition 1 In 1999 the world s population reached: 2 billion 4 billion 6 billion 8 billion
Contents Chapter 1 Background information 13
 Contents Author s preface 9 Chapter 1 Background information 13 1.1. Political and administrative structures 13 1.1.1. The Spanish nation 13 1.1.6. Decentralisation in the field of education 14 1.1.7.
OECD expert meeting hosted by the Norwegian Ministry of Education and Research Oslo, Norway 2-3 June 2008 ICTs and Gender Pierre Montagnier
 OECD expert meeting hosted by the Norwegian Ministry of Education and Research Oslo, Norway 2-3 June 28 ICTs and Gender Pierre Montagnier 1 Conceptual framework Focus of this presentation ECONOMY CONSUMPTION
Euro area unemployment rate at 9.9% EU27 at 9.4%
 STAT/11/76 April 2011 Euro area unemployment rate at 9.9% EU27 at 9.4% The euro area 1 (EA17) seasonally-adjusted 2 unemployment rate 3 was 9.9% in April 2011, unchanged compared with March 4. It was.2%
UNITED NATIONS POPULATION FUND CARIBBEAN SUB-REGION
 UNITED NATIONS POPULATION FUND CARIBBEAN SUB-REGION COUNTRY PROFILE: TRINIDAD AND TOBAGO OVERVIEW The twin island Republic of Trinidad and Tobago is located in the Southern Caribbean, just off the cost
How s Life in Australia?
 How s Life in Australia? November 2017 In general, Australia performs well across the different well-being dimensions relative to other OECD countries. Air quality is among the best in the OECD, and average
Human development in China. Dr Zhao Baige
 Human development in China Dr Zhao Baige 19 Environment Twenty years ago I began my academic life as a researcher in Cambridge, and it is as an academic that I shall describe the progress China has made
London Measured. A summary of key London socio-economic statistics. City Intelligence. September 2018
 A summary of key socio-economic statistics September 2018 People 1. Population 1.1 Population Growth 1.2 Migration Flow 2. Diversity 2.1 Foreign-born ers 3. Social Issues 3.1 Poverty & Inequality 3.2 Life
Human capital and employability in the 14 Partners of the Union for the Mediterranean (UfM) Euro-Med Employment High Level Group Meeting
 Euro-Med Employment High Level Group Meeting") Human capital and employability in the 14 Partners of the Union for the Mediterranean (UfM) Euro-Med Employment High Level Group Meeting Ummuhan Bardak, European Training Foundation (ETF) Brussels, 14
Human capital and employability in the 14 Partners of the Union for the Mediterranean (UfM) Euro-Med Employment High Level Group Meeting Ummuhan Bardak, European Training Foundation (ETF) Brussels, 14
Japan s average level of current well-being: Comparative strengths and weaknesses
 How s Life in Japan? November 2017 Relative to other OECD countries, Japan s average performance across the different well-being dimensions is mixed. At 74%, the employment rate is well above the OECD
THE QOG EU REGIONAL DATASET 2016
 THE QOG EU REGIONAL DATASET 2016 CODEBOOK Scholars who wish to use this dataset in their research are kindly requested to cite both the original source (as stated in this codebook) and use the following
The social situation in the European Union
 The social situation in the European Union ISSN 1681-1658 European Commission The social situation in the European Union 22 European Commission Directorate-General for Employment and Social Affairs The
SPANISH NATIONAL YOUTH GUARANTEE IMPLEMENTATION PLAN ANNEX. CONTEXT
 2013 SPANISH NATIONAL YOUTH 2013 GUARANTEE IMPLEMENTATION PLAN ANNEX. CONTEXT 2 Annex. Context Contents I. Introduction 3 II. The labour context for young people 4 III. Main causes of the labour situation
How s Life in Turkey?
 How s Life in Turkey? November 2017 Relative to other OECD countries, Turkey has a mixed performance across the different well-being dimensions. At 51% in 2016, the employment rate in Turkey is the lowest
EUROPEAN ECONOMY VS THE TRAP OF THE EUROPE 2020 STRATEGY
 EUROPEAN ECONOMY VS THE TRAP OF THE EUROPE 2020 STRATEGY Romeo-Victor IONESCU * Abstract: The paper deals to the analysis of Europe 2020 Strategy goals viability under the new global socio-economic context.
"Population trends in Europe and their impact on the retail insurance business"
 "Population trends in Europe and their impact on the retail insurance business" Rainer Muenz Erste Group, Vienna European Congress of Mutual & Cooperative Insurance Rainer Münz June 18, 2008 Population
Socio-economic and demographic characteristics of the population 1
 Socio-economic and demographic characteristics of the population 1 This section contains a description of the principal demographic and socioeconomic characteristics of the Spanish population.the source
27. Population Population and density
 Sustainable Development Indicators in Latvia 2003 27. Population Indicators 27.1. Population and density 27.2. Population by cities and rural areas 27.3. Population by sex 27.4. Population by main age
How s Life in New Zealand?
 How s Life in New Zealand? November 2017 On average, New Zealand performs well across the different well-being indicators and dimensions relative to other OECD countries. It has higher employment and lower