World Food Programme Haiti. Title. Haiti Urban Food Security Assessment
|
|
|
- Scott Green
- 6 years ago
- Views:
Transcription


1 World Food Programme Haiti Title Haiti Urban Food Security Assessment November Subtitle xxx 2016 Data analysis and collection, May August 2016

2 Acknowledgements Chef-lieu Gourde Mairie Mornes Quartier Ravines Ville Departmental Capital City Currency of Haiti City hall Hills Neighbourhood Gullies City This report is based on the findings of the urban Food Security Assessment that was conducted in June 2016 in Haiti. The Coordination Nationale de la Sécurité Alimentaire (CNSA) and the World Food Programme (WFP) are grateful to all the people who participated in the assessment, including the urban population and enumerators. We express our gratitude to our partners for their support, feedback and comments throughout the process. All rights reserved. Reproduction and dissemination of material in this information product for educational or other non-commercial uses are authorized without any prior written permission from the copyright holders provided the source is fully acknowledged. Reproduction of material in this information product for resale or other commercial purposes is prohibited without written permission. The publication of this report was possible thanks to the collaborative work of different teams in Haiti, WFP Regional bureau in Panama and WFP headquarters in Italy.

3 Photo credits: WFP Haiti/AnneSophie Girard WFP HQ/Catherine Clark
4 Table of Contents Executive summary... 6 Chapter 1: Introduction... 7 I. Introduction... 8 II. Objectives... 9 III. Methodology ONLINE SURVEY SECONDARY DATA REVIEW NEIGHBOURHOODS WEALTH CLASSIFICATION HOUSEHOLD SURVEY Chapter 2: Context Analysis I. Demographics and Urbanization URBANIZATION INTERNAL DISPLACEMENT DUE TO THE 2010 EARTHQUAKE THE QUARTIERS OF THE METROPOLITAN AREA OF PORT-AU-PRINCE II. Macro-economic and poverty trends MACRO-ECONOMIC TRENDS LABOUR MARKET AND POVERTY TRENDS MARKETS AND FOOD PRICES ACCESS TO CREDITS III. Nutrition water sanitation and Health Chapter 3: Food Security I. Food Security Classification an overview II. Food Security, Hunger and Wealth FOOD SECURITY INDEX HOUSEHOLD HUNGER SCALE WEALTH INDEX III. Household Profile SOCIO-DEMOGRAPHIC CHILDREN SCHOOLS ATTENDANCE HOUSING & ASSETS IV. Food Consumption & Food Access FOOD CONSUMPTION SCORE (FCS) FOOD CONSUMPTION SCORE NUTRITION (FCS-N) STREET FOOD CONSUMPTION V. Livelihoods & Income Sources MAIN INCOME SOURCE GROUPS NUMBER OF INCOME SOURCES FOOD INSECURITY, HUNGER, WEALTH BY MAIN INCOME SOURCE GROUP... 31
5 VI. Expenditures SHARE OF FOOD EXPENDITURES DEBT AND CREDIT VII. Shocks & Coping Strategies SHOCKS LIVELIHOODS COPING INSECURITY RELATED COPING VIII. Perspective and Priority Needs PERCEPTIONS OF THE FUTURE PRIORITY NEEDS PREFERRED MODALITY OF ASSISTANCE IX. Migration Chapter 4: Conclusions and Recommendations I. Conclusions and Recommendations MAIN CONCLUSIONS SPECIFIC RECOMMENDATIONS FOR FOOD SECURITY MONITORING GENERAL RECOMMENDATIONS FOR PROGRAMMING ANNEXES Abbreviations and Acronyms List of References... 61

6 Executive summary 2016 has been the third year of consecutive drought in Haiti, worsened by the influence of the El Niño weather phenomenon. These prolonged conditions, with the consequent important crop losses, plunged the country s many rural households into food insecurity. As rural populations are considered to be the most exposed to food insecurity, assessments conducted to estimate the drought s impact on the population s food security have only focused on rural areas. However, there is a concern that food insecurity may increasingly become an urban issue. In Haiti more than half of the population lives in urban centres (about one in two Haitians live in urban areas, and about one in four Haitians live in the Metropolitan Area of the capital Port-au- Prince). Spikes in food prices and political instability may trigger the proliferation of urban food insecurity, particularly in the poorer areas. In June 2016 an Urban Food Security Assessment was conducted by the Coordination Nationale de la Sécurité Alimentaire (CNSA) and the World Food Programme (WFP) to estimate the food insecurity prevalence and to identify community/ neighbourhood factors that can directly influence food insecurity, nutrition and economic vulnerability in the Haiti urban context. The assessment showed that: In the Metropolitan Area of Port-au-Prince, 30 percent of the households are food insecure (about 750,000 people) out of the estimated 2.6 million total inhabitants. The level of severe food insecurity is 2 percent (about 50,000 people); The level of food insecurity in the Metropolitan Area of Port-au-Prince is considerably less than that seen in the drought affected rural areas assessed in the December 2015; The commune of Cité Soleil and the cities of Gonaïves, Jérémie, and Port-de-Paix stand out as having the highest levels of food insecurity; 40 percent of households have unacceptable food consumption; Food insecurity is also driven by economic vulnerability, with 50 percent of households spending over half their budget on food; Increase in prices of food and other goods is the most common shock reported; The majority of households are forced to engage in negative coping strategies, including 25 percent relying on crisis or emergency strategies, which are difficult to reverse. The present report looks at the intricacy of the assessment process, strategies and tools with a specific focus on the context of the analysis. It finally reveals that food insecurity in the Haiti urban scenario should continue to be monitored, as further increases in food prices or other shocks are expected to continue to negatively affect a sustainable urban food security situation in the country. Recognising the need to expand food security surveillance to main Haitian cities, WFP and the CNSA, in collaboration with key food security stakeholders, plan to set-up a food security monitoring system in large cities in order to get regular and timely information, and prevent food crises.

7 CHAPTER I INTRODUCTION


8 I. Introduction More than six years after the January 2010 earthquake that rocked the capital and other areas of the country, Haiti has more recently been impacted by the rise of food prices of many key staples over the past year. These rising prices are caused by the drought and the devaluation of the Gourde (the currency of Haiti) compared to the US Dollar (USD) and the Dominican Peso over the past year. Rural populations are of continued concern with regard to food insecurity. Much of the rural population is chronically vulnerable to food insecurity, particularly to the impacts of drought. A rural Emergency Food Security Assessment (EFSA) 1 was conducted from December 2015, to determine the extent of the impact on these rural populations. Ongoing programmes to assist the most vulnerable in rural areas are also in place. While there is little current information available on the plight of the large population of urban poor in Haiti. Indeed, assessments conducted to estimate the drought s impact on the population s food security have only focused on rural areas, in a country where more than half of the population lives in urban centres. Haiti is also experiencing rapid inflation and political instability, factors that could further hinder food insecurity, particularly in urban areas. In December 2015, the CNSA and WFP conducted a Port-au-Prince case study as part of the Adapting 2 to an Urban World Project, which provided insights on the factors defining vulnerability as well as lessons learnt and recommendations for the adaptation of indicators and approaches within the urban context. Food insecurity, hunger and wealth indicators show similar trends. Urban populations remain vulnerable to food insecurity, particularly in poorer areas. They should continue to be monitored, as further increases in food prices or other shocks will likely result in increases in food insecurity. 1. WFP, Evaluation de la sécurité alimentaire en situation d urgence (ESASU) Haïti. April Available at documents.wfp.org/stellent/groups/public/documents/ena/wfp pdf?_ga= The Adapting project was developed to address an identified gap in urban assessment tool. More information can be found at reliefweb.int/sites/reliefweb.int/files/resources/adapting_to_an_urban_world_2016_stock_taking.pdf Literature review 8

9 II. Objectives Building on the lessons learnt and recommendations of the Port-au-Prince case study, the CNSA and WFP conducted some food security data collection and analysis in the Metropolitan Area of Port-au-Prince and other urban areas to assess the situation. Specific objectives were to: Estimate food insecurity prevalence in urban areas; Identify the main sources of incomes, food, food consumption and expenditures patterns of households; Describe the main shocks and coping strategies of urban households; Provide recommendations for the set-up of an urban observatory; Monitor the food security situation in urban areas. This document presents the results of the four complementary components implemented, as shown by the graph below: Online qualitative survey General perceptions of respondents on food security related issues in their neighbourhoods Click here to view the Preliminary findings report: Literature review Context analysis using secondary data 10-question internet-based qualitative survey Sample: Random respondents surfing the web; 991 responses including 518 complete and 473 partial Literature Topics: Demographics, poverty, migration and urbanization Click here to view the Survey results and the bulletin: Key informants interviews and triangulation using geospatial and satellite data Face-to-face interviews using tablets and Open Data Kit (ODK) application Sample: A two stage representative sample totalling 4490 households: Click here to view the Preliminary findings report: Sample: 12 key informants interviews with 27 key informants i) 2483 households in the Metropolitan Area of Port-au-Prince; ii) 2007 households in other urban areas of the country. Key informant classification of quartiers Three wealth-related groups: very poor, poor, average/ better off Click here to view the Survey results and the bulletin: Urban household food security assessment Household food security indicators Figure 1: The four components implemented in the food security data collection and analysis Metropolitan Area of Port-au-Prince and other urban areas. 9
 developed a 10-question online survey")
 in six communes of the Metropolitan Area of Port-au- Prince namely Carrefour, Cité Soleil, Delmas,")
 uses specifically designed online survey forms that reach random respondents as they surf the web:")


10 III. Methodology 1. Online Survey In order to measure perceptions of the food security situation in greater Port-au-Prince, WFP Vulnerability Analysis and Mapping (VAM) developed a 10-question online survey in French and Creole (See Annex II). The survey was conducted by using the Random Domain Intercept Technology (RIWI) in six communes of the Metropolitan Area of Port-au- Prince namely Carrefour, Cité Soleil, Delmas, Port-au-Prince, Tabarre, and Pétionville and surrounding communes Croix-des-Bouquets and Kenscoff from 20 May to 9 June Example : In focus : The RIWI methodology The Random Domain Intercept Technology (RIWI) uses specifically designed online survey forms that reach random respondents as they surf the web: when users navigate to a link that is broken or inaccurate, they encounter a survey form instead of a broken link notification. Surveys are geolocated, providing a better understanding of the respondent s profile. The exponential growth of global internet access means that in a few years, such surveys could become a widespread and viable tool for measuring food security. Limitations: Figure 2 : Sample online survey question. Respondents could complete the survey in French or Creole. The sample size of 991 responses includes 518 complete and 473 partial responses, i.e. respondents answered at least demographic and urban challenge questions. Very few responses were received from Cité Soleil and Kenscoff. Since a sample generated through an online survey would not be representative of the general population, respondents were asked to provide general perceptions of food security related issues in their neighbourhoods. The sample is mostly male, young, and well-educated. Map Map 1: Metropolitan Areas of Port-au-Prince covered by the online survey. Source: 10


11 Source: WFP/mVAM Secondary data review The secondary data review aimed at identifying urban food security assessments and studies conducted within Port-au-Prince pre-and-postearthquake. The objective was to contextualize the primary data, by covering topics such as urbanization, poverty, macro-economic trends and nutrition and health to identify context specific issues linked to food insecurity and economic vulnerability. 3. Neighbourhoods relative wealth classification In urban contexts, access to public services, hygiene/sanitation conditions, and quality of infrastructure are often community/neighbourhood factors that can directly influence food insecurity, nutrition and economic vulnerability. Building on the lessons learnt and recommendations of the Adapting to an Urban World Port-au-Prince case 3 study, the quartiers (neighbourhoods) of the Metropolitan Area of Port-Au-Prince were classified into relative wealth groups (very poor, poor, average/better off). In order to classify these quartiers, two key informant interviews were conducted in each of the six communes that make up the Metropolitan Area of Port-au-Prince. Each interview consulted two to three key informants, totalling 12 key information interviews, with 27 key Informants. Key informants consisted of staff working in NGOs (national and international) located in the selected areas, along with local leaders, and people working at the Mairie (city hall) of the commune. The key informants were asked to classify the quartiers in their commune into the relative wealth categories. To reduce subjectivity, each classification was defined using general characteristics such as population density, access to latrines/toilets, sanitation/hygiene conditions, access to basic services, quality of construction, etc. Then, the key informant classifications were triangulated using geospatial and satellite data on buildings density. For most of the quartiers, this triangulation process simply verified the key informant findings. Of the 368 quartiers total, three data points were added to quartiers not classified by the key informants, three errors in classification were suspected, verified, and then corrected. These stratifications were also taken into consideration in designing the sample of the ongoing urban food security household survey, which will allow for analysis and reporting by three wealth classifications. Limitations: While the classifications are considered to be generally reliable, they are subject to a few caveats: Quartiers are not homogeneous. Not all households in a very poor quartier are very poor, nor will all households found in average/better off quartiers be middle and upper class; Some cases need further confirmation, so the quartier-specific results should be interpreted carefully if used as a geographic targeting tool. The results continued to be triangulated by field visits and other data sources; The results of the household survey will also be used to check these findings, verifying if the household level indicators of economic vulnerability and food insecurity show worse results in the neighbourhoods with worse classifications. 3. WFP, Adapting to an Urban World. Urban Case Study Port-au-Prince. March Available at files/documents/port_au_prince_report_final_en.pdf 11
 that are a chef-lieu (departmental capital cities).")

12 4. Household Survey The survey sample was designed to give representative estimates for each of the six communes that make up the Metropolitan Area of Port-au-Prince, each of the other nine villes (cities) that are a chef-lieu (departmental capital cities). The results can also be aggregated to provide estimates for the Metropolitan Area of Port-au- Prince and for the ensemble of the other chefslieux. Additionally, the sample can be disaggregated to provide a representative estimate for each of three relative wealth classifications of the different quartiers in the Metropolitan Area of Port-au- Prince. An improved precision was desired in areas with greater populations, so slightly larger sample sizes were allotted to these strata. The sampling methodology employed a twostage cluster sample. A total of 300 section d énumération (SDEs) were randomly selected, with probability proportional to size sampling, and 15 households were randomly selected in each SDE. The planned sample size was 4,500, and the actual sample size is 4,490 households. Probability weights were used in analysis to adjust for the population and sample size differences between the sampling strata (See Annex III). The data collection was done over 23 days (from 12 June to 3 July 2016), by 12 teams (48 enumerators, 12 sampling agents, and 12 team leaders). Tablets were used to collect the data, using an application developed in ODK (See Annex III) Institut Haïtien de Statistique et d Informatique (IHSI), Population totale, population de 18 ans et plus, ménages et densités estimés en March

13 METHODOLOGY 13

14 CHAPTER II CONTEXT ANALYSIS
15 I. Demographics and urbanization 1. Urbanization The population in Haiti is rapidly urbanizing in 1990, 29 percent of the population lived in urban 5 areas. In 2014, that figure had risen to 52 percent, and it is projected to reach 76 percent by This is one of the highest rates of change in the 6 world. Approximately 2.6 million people, i.e. one quarter of Haiti s population, are living in the Metropolitan Area of Port-au-Prince (IHSI, 2015 estimate). In Haiti, an exodus of farmers from the countryside to urban areas began during the 1950s under the 7 Duvalier Regime. The beginning of a significant economic decline in rural areas and the impossibility to compete with cheap rice imports pushed farmers to look for new opportunities, especially in the Metropolitan Area of Port-au- Prince. A 2013 study on urbanization in Haiti estimates that the urbanization rate increased from 12.2% in to nearly 50% in Meanwhile, relatively stable growth was observed within the whole country followed by a rapid economic decline alternating with periods of stagnation. These economic development patterns combined with urban growth have led to a highly unequal distribution of the population across the country, and to a redistribution of the population towards the cities resulting in an increasingly unbalanced urban hierarchy. Although Port-au-Prince remains the primary city, the 2013 Duval study highlights that its weight in the overall urban population has passed from 35 percent in 1950 to 19 percent in This decline is due to the spreading of the capital and the emergence of new towns such as Carrefour, Delmas, Tabarre and Cité Soleil, with an uncontrolled movement towards the outskirts of Port-au-Prince that has gradually created the conurbation between the different towns that surround the city. The period from 1948 to 1968 saw the closure of many provincial ports, which strengthened economic, political and administrative centralization in Port-au-Prince, causing a large territorial imbalance. Then appear the development of the first informal settlements, phenomena that will continue to accelerate during the following decades. In the 70s, Delmas neighbourhood gradually transformed into a large residential suburb for the middle class, becoming today a multifunctional urban area, while Carrefour followed a reverse p r o g r e s s i o n a n d e x p e r i e n c e d s t r o n g impoverishment. In 1982, these areas got the status of municipalities and, the following year, " U r b a n C o m m u n i t y o f P o r t - au- Prince" (Communauté Urbaine de Port-au-Prince) comprising of the municipalities of Port-au-Prince, Gressier, Carrefour, Delmas, Pétion-Ville and Croixdes-Bouquets. 9 Urban growth continued then especially towards the North and the Northeast. The majority of the population lives in the many slums - newly constructed or originating from the degradation of old neighbourhoods - that spread throughout the city. The richest populations are installed in the upper part of the city (Pétion-ville, Thomassin, Fermathe) while the poorest live in the slums in the lowest part of town. (Cité l éternel, Liberté, Bréa, Sanatorium ). The city is organized around three major urban areas, with different socio-economic, cultural, or geographical characteristics: The coastal strip located around the areas of wastewater discharge, directly connected to the centre and the main places of activity of the city which allows residents to develop many informal businesses distributed along major highways. The area of the waterfront is a strategic place of prime importance but represents today a lieu repoussoir (a stymied area). The central area is inserted into the fabric of the city, its main axes constituting significant economic corridors. These districts host a high concentration of inhabitants and economic activities, however the basic infrastructures work poorly (schools, health, etc.). This is an intermediate zone, a transition zone between several neighbourhoods despite its informality, marginal and unhealthy. Finally, the upper part of the city includes a few privileged urban centres like Pétion-Ville, as well as many informal settlements that develop along topographic features where there is significant exposure to natural hazards, and the geography is an obstacle for urban improvement. The breaking up of Port-au-Prince that had begun in the 1980s, whereby suburbs became communes, has not had the expected results. The creation of municipal authorities for Carrefour and Delmas in 1982 and for Tabarre and Cité-Soleil in 2003 have only increased the number of entities without having a significant impact on the quality and effectiveness of services provided to citizens. Instead, this initiative has reduced the municipal authorities capacity for action. 5. Institut Haïtien de Statistique et d Informatique (IHSI), Population totale, population de 18 ans et plus, ménages et densités estimés en Mars United Nations (UN), World Urbanization Prospects: The 2014 Revision. New York, Available at wup/publications/files/wup2014-report.pdf 7. The Duvalier Regime lasted from 1957 to 1986, when Francois Duvalier and his son, Jean-Claude Duvalier, administered over Haiti. 8. Duval C.J., Croissance des villes en taille et en nombre : causes et conséquences. Study presented at the XXVII International Congress on Population. South Korea, August Solidarités Internationale Simon Deprez. Eleonore Labattut. La reconstruction de Port-au-Prince : analyses et réflexions sur les stratégies d intervention en milieu urbain. 15
16 Although urban population has a better access to services than rural populations, about 50 percent of the poorest neighbourhoods of metropolitan Portau-Prince still have limited access to essential community services including health, education, public institutions, police, fire services, banks and markets. Between 30 percent and 40 percent of the neighbourhoods of Cité Soleil, Pétion-Ville, Delmas and Tabarre are missing at least four of these services Internal displacement due to the 2010 earthquake Issues related to urban marginalization (lack of basic services, poverty and exposure to risk) are most evident in the informal settlements in Port-au -Prince. These areas were therefore the most affected areas by the earthquake. Thus, it is in these poor areas that the majority of the risk reduction issues and challenges issues are concentrated. In the immediate aftermath of the 2010 earthquake, a counter urban to rural migration movement took place, with around 600,000 people leaving the affected areas to stay with relatives or friends in the countryside. This meant increasing pressure on already stretched food resources, when in many cases the host families themselves were already food insecure. An additional 160,000 people fled to the border with the Dominican Republic, mostly to extremely poor communities, putting considerable pressure on local services and resources. However, due to the inability of host communities to provide adequate support, along with the lack of jobs and good-quality schooling in rural areas, by August 2010 at least 40% of those who left the quake zone had already returned to 11 metropolitan Port-au-Prince. In Greater Port-au-Prince, UN-Habitat has 12 categorised the different camps in three groups: Camps located in symbolic public spaces, such as the Champs de Mars or the primature which were to be completely dismantled to let spaces regain their original function. Physically occupying the emblematic places of power, they were the most visible and numerous and so they easily attracted media attention. Small camps integrated into the urban fabric, which could become integral parts of existing neighbourhoods. Informal settlements were built similarly, through the appropriation of free land illegally squatted, where the habitat was consolidating gradually, according to the resources available to the family. Large camps outside the city, such as Corail and its consequences that are Canaan 13 and Jerusalem which very quickly became cities, because of the more than 100,000 people settling around Corail in few weeks in the hope of receiving help, getting land or finding work. Many came from the provinces and were not direct victims of the earthquake. As of July 2016, 61,302 displaced people are still living in 33 camps since the 2010 earthquake, with 45,626 residing in 19 camps in the Metropolitan Area of Port-au-Prince. A net decrease of 1,475,145 displaced people and 1,522 camps was observed compared to July 2010, which was the height of displacement. The decrease was possible through the elaboration of rental subsidy programs, leading the relocation of 82,589 households that have left 14 the camps since The Quartiers of the Metropolitan Area of Port-au- Prince The Metropolitan Area of Port-au-Prince is subject to a range of natural hazards that affect different neighbourhoods depending on their geographical location and quality of construction. Steady heavy rains in the capital have consequences which are aggravated by the topography of the city: run-off waters along steep slopes are exacerbated by the absence of vegetation and the constant increase in built-up areas. These water flows dig gullies, transforming heavy rainfalls into floods of mud, carrying sediments and waste towards the sea. Consequences differ depending on the "height" of the quartier in the city: Informal settlements built on steep slopes on the sides of hills (mornes) regularly face landslides which destroy part of the buildings; Homes installed along ravines and gullies are exposed to the collapse of the eroded water banks. Those living within the ravine itself are threatened by flash floods and large deposits of waste; At the bottom of the city, near the coast, the houses are built on unstable land, consisting of accumulated waste and sediment. Frequent floods made these areas truly unhealthy swamps. 10. International Organization for Migration (IOM) and Community Resource Centres, Vulnerability Survey of the Metropolitan Port Au Prince, Haiti. Final report. February Oxfam, Planting now. Agricultural challenges and opportunities for Haiti s reconstruction. Oxfam briefing paper 140. October Available at Solidarités Internationale Simon Deprez. Eleonore Labattut. La reconstruction de Port-au-Prince : analyses et réflexions sur les stratégies d intervention en milieu urbain. 13. Now the three sites are part of Croix des Bouquets IOM, Displacement Tracking Matrix (DTM) Haiti. Round 26. June Available at OIM, Déplacement Matrice de suivi (DTM) Haïti. Round 26. Juin Disponible à l'adresse reliefweb.int/files/resources/dtm_rd26_eng.pdf 16


17 While natural hazards threaten the whole city, the inhabitants of Port-au-Prince are not equally at risk, as social inequality and poverty accentuate the risk exposure. This is reflected even at neighbourhood level, where social inequality have spatial implications, pushing the poorest and least able to protect themselves against risk, to the most dangerous areas i.e. mostly along the banks of gullies (ravines). The quartiers in the Metropolitan Area of Port-au-Prince with likely higher concentrations of poor households are more commonly though not exclusively found in the communes of Cite Soleil, Port-au-Prince, and Carrefour, and they are generally located near the bay (see map 2 below). There are estimated to be roughly 950,000 people living in these very poor neighbourhoods across the Metropolitan Area, 950,000 living in the poor neighbourhoods, and 700,000 living in the average/ better off neighbourhoods. Map 2: Haiti, Port-au-Prince, Metropolitan Area, Relative wealth classification of the quartiers/preliminary results. 17
18 II. Macro-economic and poverty trends 1. Macro-economic trends Haiti remains one of the poorest countries in the world with a Gross Domestic Product (GDP) per capita of US$ 846 in 2014 (World Bank, 2016). After a 5.5% contraction in GDP in 2010 due to the earthquake, Haiti experienced a real growth rate averaging 3.4% and a per capita GDP growth of 2.0% from 2011 to 2015, spurred in part by high levels of reconstruction aid and remittances. However, in fiscal years 2014 and 2015, real GDP growth decreased as a result of the weak performance of the agricultural sector. Haiti is also one of the most unequal countries, with a Gini 15 coefficient of 0.61 as of Since 2014, the Haitian Gourde (HTG) has been depreciating against the USD and the Dominican Peso (DOP), which are both important currencies for the country s food imports. In 2015, the rate of depreciation of the HTG accelerated to 19.7 percent against the USD showing a huge spike in July 2015, and to 17.5 percent against the DOP. It has continued to do so through From January to the first week of March 2016, the HTG depreciated further by 6 percent against the USD and the DOP. In March 2016, the local currency had lost 33 percent of its value compared to March 2015 and it stood at 61.8 to 1 USD, while 1 peso was exchanged at 1.36 HTG, with the Haitian currency losing 29 percent of its value compared to March The depreciation has been exacerbated by the country s political instability, the scaling back of the United Nation Stabilization Mission in Haiti (UN MINUSTAH), and the fear that production losses and the agricultural 16 slowdown could lead to further price inflation. Inflation, and in particular food inflation, increased sharply. Inflation rates have increased significantly since June 2015, coinciding with the sharp drop in the value of the HTG and also reflecting the reduced harvest of that same year. In January 2016, the annualized rate of inflation reached 13.3 percent, double its value at the same time in 2015 (Ministère de l Economie et des Finances, MEF, 2016). More than half of the contribution to the inflation rate has come from the increase in food inflation in each month since July However, prices of non-food items have increased significantly as well. By contrast, the growth in the cost of services has remained relatively stable. Inflation has accelerated to 14.4 percent year on year percent at end of February, mostly driven by higher local food prices following droughts in several parts of the country. 2. Labour market and poverty trends According to the World Bank, only 60 percent of working-age individuals participate in the labour market in Haiti. Unemployment affects 40 percent of the urban workforce, and almost 50 percent of the female workforce and approximately 60 percent 17 of youth. Employment and income-generating opportunities in urban areas (especially the Metropolitan Area) are limited by both the scarcity of jobs and the prevalence of low-paid employment. Among those who find a job, 60 percent have earnings below the 18 minimum wage and women earn, on average, 32 percent less than men. Close to 71 percent of the population lives on USD 3.10 per day (World Bank, 2016). Extreme poverty declined from 31 to 24 percent between 2000 and Urban areas have relatively fared better than rural areas, reflecting more non-agricultural employment opportunities, larger private transfers, more access to critical goods and services and narrowing inequality 19 compared to rural areas. According to the latest household survey (ECVMAS 2012), more than 6 million Haitians live under the national poverty line of US$ 2.42 per day and over 2.5 million live under the national extreme poverty line of US$1.23 per day. The Metropolitan Area of Port-au-Prince has a large proportion of poor households. These households are particularly vulnerable to economic shocks, such as increases in the cost of food, among others. In 2012, there were an estimated 725,000 people living in poverty (29%), of which approximately 125,000 are living 20 in extreme poverty (5 percent). 3. Markets and Food Prices The price of the food basket in Haiti went up by nearly 16% (nominal prices) between the first trimester of 2015 and the first trimester of 2016, and since then it has continued to increase each month. While of concern, the rise is less than that observed during the food price crisis of The relative stability of the price of imported rice has tempered the food basket price increases World Bank, Haiti webpage. 16. WFP, Haiti Market Analysis. April Available at wfp pdf?_ga= Office for the Coordination of Humanitarian Affairs (OCHA), Haiti Transitional Appeal World Bank, Investing in people to fight poverty in Haiti. Reflections for evidence-based policymaking. Washington, Available at World Bank, Ibidem. 21. CNSA, Panier alimentaire et conditions de sécurité alimentaire. Bulletin 13. April Available at panier-alimentaire-et-conditions-de-securite-alimentaire-avril-2016/ 18
19 Minimum wages The president raised the minimum wage, effective May 1 of this year. The last raise in minimum wages was in April, There are 6 classes of minimum wages, each with a different level of increase: a) banks, grocery stores, big shops, etc..: From 260 to 340 Gourdes/ day (+30%); b) buildings and public works, hair salons, delivery services, etc.: From 240 to 285 gourdes/day (+19%); c) Agriculture, forestry, agriculture processing, NGOs, restaurants, etc.: From 225 to 260 gourdes/day (+16%); d) Factories making things for re-export (mainly the textile sector): From 225 to 300 gourdes/day (+33%); (note: this was raised to from 225 to 240 in May, The workers were striking a few weeks ago, demanding 500 gourdes/day). The consumer price index (CPI) for food, drink, and tobacco has increased 16.7 percent between May 2015 and May 2016, and the general CPI in the Metropolitan Area of Port-au-Prince has gone up to 15.1% during this same period. In the last 12 months, increases in local food commodity prices have been even worse than during the 2008 food price crisis. In particular, in the first quarter of 2016, black beans and local maize meal experienced a year-on-year increase four times that of the first quarter of This sharp increase was tempered slightly by the second quarter, with similar increases demonstrated for 2008 and Despite relatively stable month-on -month price increases or decreases in February and April 2016, the price level remains nevertheless significantly high and above the fiveyear average. Maize meal prices were unchanged in June and higher than at the same time last year, reflecting tight supplies from the reduced 2015 harvest and the devaluation of the Gourde. Cereal imports in the 2016/17 marketing year (July/June) are forecast at 650,000 tonnes, 3 percent below 22 last year s record level. The moderate decline in imports mainly reflects the lingering impact of two years of drought reduced outputs on local supplies, particularly for maize and rice. It is worth noting that prices of rice on the international market are at the lowest since However, recent upward trends are noted as well. Imported rice prices remained relatively stable in 2015, helped by a favourable international environment that has seen the USD value of imported rice downward trending 23 for several years. However, since the end of the first quarter of 2016, the price for imported rice has been on the rise despite the slowdown in the depreciation of the HTG against the USD. In June 2016, prices of imported rice remained generally stable in most markets of the country but above their levels from a year earlier, mostly reflecting the depreciation of the Gourde. Findings from the online survey on Food Prices Throughout the communes, food prices were reported to have increased in the period of March May 2016 by most respondents of the online survey. Across metropolitan Port-au-Prince, the price of a plate of spaghetti, a common street food, was most frequently reported as Gourdes, but in the wealthier communes of Delmas and Pétion-Ville, the most commonly reported price range went higher, Gourdes. 4. Access to credit The International Monetary Fund (IMF) estimates that financial intermediation in Haiti is very low, with high costs for financial services and credit 24 highly concentrated. The sector is dominated by two domestic private banks providing about twothirds of the private sector credit, while the formal banking system is concentrated in Port-au-Prince. Bank lending to the private sector remains the lowest in the region (under 20 percent of GDP), despite credit has rapidly increased after the 2010 earthquake. Moreover, relatively few borrowers account for a significant share of credit, and only better-off clients can access credit on favourable terms. Smaller borrowers pay significantly higher rates, reflecting higher perceived risk (IMF, 2015) According to Lundahl, rural informal credit markets in particular tend to display high rates of interest. In this context, close personal relationships can replace formal institutional mechanisms: in most cases, credit comes from informal markets, where the most important sources are traders, friends, family, and rotating credit associations, as further highlighted by Lundahl (2011). The high costs of financial intermediation in Haiti constrain growth not only by limiting access to credit, but also by driving up the costs of receiving remittance transfers, in a country where over half of all households receive remittances from the Haitian diaspora (IMF, 2015). The microfinance sub-sector remains unregulated, with limited data available. A 2013 study verified whether Microfinance Institutions (MFIs) discriminate against the poorest of the poor, in shantytowns of Port-au-Prince, to have access to credit. The study concluded that there is no discrimination regarding the access of the poorest to credit, contrarily to what happens with the formal banking system. The paper also confirms the key role of networks in leading access to credit: the fact that friends receive a loan makes it easier for a head of household to have access to credit as well, thanks to the valuable information provided by that social relation. III. Nutrition, water, sanitation and Health Compared to the 2006 Mortality, Morbidity, and Service Utilization Survey (EMMUS) IV, the 2012 EMMUS V survey showed a reduction from 29 percent to 22 percent in chronic malnutrition (stunting), from 10 percent to 5 percent in global acute malnutrition (wasting), and from 2.2 percent to 1 percent in severe acute malnutrition in children under 5 years. The highest prevalence of wasting was observed in the Nord-Ouest (7.5%) and the lowest in the Sud-Est (3.2%), while it was about 5% in the Metropolitan Area of Port-au- Prince and 6.4% in the camps. 21. Food and Agriculture Organisation (FAO), Global Information and Early Warning System (GIEWS) Haiti country brief. July WFP, IMF, Haiti: selected issues. IMF Country Report 15/158, Lundahl M., Poverty in Haiti. Essays on Underdevelopment and Post Disaster Prospects Lenève J. and Cadet R.L., Microfinance in Haiti: Do the poorest have access to credit? November
.")
20 In 2012, the prevalence of underweight was 7 percent of children under five in the Metropolitan area when the national prevalence reached 11 percent. Barely 1 in 10 children receive all 3 optimal feeding practices of infant and young child (breast milk, complementary feeding and frequency of meals). Despite a rising trend, more than half of children do not receive all the recommended vaccines, with no significant difference between rural and urban areas. Gender inequalities and violence facing women and girls are also among the root causes of malnutrition, as well as the high fertility rate among adolescent girls and in rural areas. 27 According to EMMUS V, about 13% of women in Haiti suffer malnutrition and half of all women (49%) are mildly, moderately, or severely anaemic. The level of poverty is a significant factor of inequity in the coverage of maternal health in particular. Currently, only a quarter of the population has access to improvement sanitation facilities and percent have access to safe water. Although the number of people affected by cholera has decreased significantly since the start of the epidemic, the persistence of cholera in Haiti is mainly due the lack of access to clean water and sanitation facilities and still require significant water, sanitation and hygiene improvements. With the start of the hurricane season, a resurgence of cholera cases was observed in the last few months, especially in the communes of Port-au-Prince, Tabarre and Carrefour. According to the Ministry of Health, nearly 23,000 cases have been registered in 2016, with 211 deaths. Since the cholera outbreak began in October 2010, more than 776,000 cases and 9,000 deaths were recorded, with more than 350,000 cases being recorded in Source: OCHA Fair access to health care services remains a major challenge in Haiti. There are serious disparities between the provision of services in urban and rural areas. Before the earthquake, 47 percent of the population had no access to health care because of the highly centralised nature of the health system. The earthquake has destroyed an estimated 60 percent of the Haiti s health system and a number of hospitals have still not been fully rehabilitated, while others still lack staff and 31 essential medical equipment OCHA, Ibidem. 28. OCHA, Haiti Humanitarian Response Plan. 29. OCHA, Humanitarian bulletin Haiti. Issue 63. July Available at United Nations Children s Fund (UNICEF) ACAPS Haiti crisis analysis 20

21

22 CHAPTER III FOOD SECURITY
23 I. Food Security Classification an overview Using the Consolidated Approach for Reporting 32 Indicators of Food Security (CARI), each surveyed household is classified into one of four food security categories (see Annex I, Table 2). This classification is based on three indicators: The household s current status of food security, using food consumption score groups; The households potential coping capacity, using percentage of total expenditures on food (economic vulnerability); and The use of livelihood coping strategies (asset depletion). Looking at all areas covered by the survey, 30% of households are food insecure, of which 28% are moderately food insecure, and 2% severely food insecure. Although food consumption scores classify 39% of households as food insecure, the other indicators report lower prevalence. To be classified as severely food insecure, a household must have poor food consumption and then either moderate or severe economic vulnerability and moderate or severe asset depletion, or severe asset depletion and severe economic vulnerability, with borderline or poor food consumption. Only a small percent of households (2%) overall fit these criteria. When disaggregating by the Metropolitan Area of Port-au- Prince (PaP) and other areas, only slight differences are seen (see Annex I, Table 2). In the Metropolitan Area of PaP, 29% of households are food insecure (27% moderate, 2% severe), while in other cities, 34% of households are food insecure (30% moderate, 4% severe). In both areas, the prevalence of poor and borderline food consumption are similar. However, households outside the Metropolitan Area of PaP tend to spend more of their total expenditures on food, and slightly more likely to reporting having used emergency coping strategies. II. Food Security, Hunger and Wealth This section presents proxies of food security by the key geographic strata of the survey. Three key indicators are used here: The Food Security Index (FSI) uses a combination of food consumption, expenditures, and coping behaviours to classify households as food insecure (severe and moderate). This indicator can be compared across time and space (for example, it can be compared to the December 2012 EFSA results); The Household Hunger Scale (HHS), which is a perception based indicator based on questions related to food deprivation, or hunger, at the household level. This indicator is also comparable across time and space, and is somewhat comparable between countries/contexts; The Wealth Index (WI), which is a relative measure of household wealth, based on assets, house construction, crowding, and other indicators such as water and sanitation. This indicator is not comparable in terms of absolute prevalence, as it classifies households into five equal size groups of relative wealth (from the poorest 20% to the richest 20%). These indicators consistently identify four areas of greater food insecurity, hunger, and low wealth: Commune of Cité Soleil, Ville de Gonaives, Ville de Jérémie and Ville de Port-de-Paix. Cap Haitien also has an elevated prevalence of reported hunger, and Miragoane is among the areas with highest prevalence of poorer households. It is important to note that all geographic strata have a nonnegligible prevalence of households that are counted amongst the hungry poor. No area is free or even mostly free of food insecurity. 1. Food Security Index As described earlier, the overall prevalence of food security in the areas covered by the survey is 30% (28% moderate food insecurity, and 2% severe food insecurity). In the 15 geographic strata of the survey, the prevalence of food insecurity are generally below 35%, with most areas falling below 30%. However, three areas stand out as having a higher prevalence of food insecurity, as shown in the maps below: Commune of Cité Soleil, where 66% of households are classified as food insecure (58% moderate, 8% severe). Ville de Gonaives, where 48% of households are food insecure (40% moderate, 7% severe). Ville de Jérémie, where 47% of households are food insecure (46% moderate, 7% severe). Ville de Port-de-Paix, where 35% of households are food insecure (32% moderate, 3% severe) More information on CARI can be found at More information on HHS can be found at 23


24 Map 3: Haiti, Urban Food Security Assessment, July 2016 Map 4: Port-au-Prince, Metropolitan Area Food Security Assessment/July
25 2. Household Hunger Scale (HHS) Looking at the HHS, overall, about half of the households in the areas surveyed report having experienced hunger in the past month (52%). Of these, 40% indicated moderate hunger and 12% severe hunger. The prevalence of reported hunger is lower in the Metropolitan Area of Port-au-Prince (48%) than in the other cities (65%). Four of the 15 geographic strata in the survey report prevalence of hunger (moderate or severe) of 60% or more: Ville de Gonaives, where 78% of households reported experiencing hunger in the past month (60% moderate, 18% severe) Ville de Jérémie, where 74% of households reported experiencing hunger in the past month (60% moderate, 15% severe) Ville de Cap-Haitien, where 68% of households reported experiencing hunger in the past month (52% moderate, 16% severe) Commune de Cité Soleil, where 64% of households reported experiencing hunger in the past month (43% moderate, 21% severe). This is the highest prevalence of severe hunger out of all the strata in the survey. Ville de Port-de-Paix, where 60% of households reported experiencing hunger in the past month (52% moderate, 13% severe). (For more details go to Annex I, Table 3) 3. Wealth Index (WI) As noted above, the wealth index is a relative measure of asset wealth, and so can only be compared as richer and poorer. This survey does not calculate a standard threshold such as a poverty line to classify households. Households are divided into five groups that each represented 20% of the households in the surveyed areas based on their relative asset wealth, from the poorest to the richest households. As such, overall, 20% of households will fall into the poorest quintile, 20% into the second poorest quintile, and 40% into the poorest two quintiles (as presented in Annex I, Table 4). Looking at the individual strata, the prevalence of households in the bottom two wealth quintiles give an idea of the relative wealth as compared to the other areas covered by the survey. Five of the 15 geographic strata have 50% or more of households falling into the poorest two wealth index quintiles: quintiles (21% in the second poorest, 54% in the poorest); Commune de Cité Soleil, with 74% of households in the poorest two wealth index quintiles (28% in the second poorest, 45% in the poorest); Ville de Jérémie, with 60% of households in the poorest two wealth index quintiles (28% in the second poorest, 36% in the poorest); Ville de Gonaives, with 56% of households in the poorest two wealth index quintiles (25% in the second poorest, 31% in the poorest); Ville de Miragoane, with 50% of households in the poorest two wealth index quintiles (24% in the second poorest, 26% in the poorest). (For more details go to Annex I, Table 4) III. Household profile 1. Socio-Demographics 53% of the households are headed by a female. Overall, the average size of household is five people. There is little difference in the average household size between the Metropolitan Area of PaP and other cities. 12% of the head of household have no education at all (11% in the Metropolitan Area vs 16% in the other cities). 96% of the head of households have documentation papers, with no difference between the Metropolitan Area of PaP and other cities and very slight difference between male-headed households (98%) and female headed households (94%). 35% of the head of households have a bank account. While there is no difference between the Metropolitan Area and the other cities, it is worth noting the gender disparity: 43% of male-headed households have a bank account, only 29% of female-headed households have one. While 35% of the head of households have a bank account, it varies in line with wealth: only 11% of the poorest have a bank account and it raises up to 67% among the richest. Having a bank account is also more frequent among those having a salaried job (54%) or owning a large business (58%), while it is still rare among those relying on humanitarian assistance and gifts (13%). Only 17% of severely food insecure households have a bank account, compared to 53% of food secure households. There is also a significant gender disparity: only 29% of the female headed households have a bank account against 43% of the male headed households. Ville de Port-de-Paix, with 75% of households in the poorest two wealth index 25
, or did not go to school at all.")
26 2. Children school attendance As part of the household survey, the respondent was asked if each child in the household between the ages of 6-17 went to school regularly this current school year, did not go regularly (missed two weeks or more), or did not go to school at all. Overall, 86% of children 6-17 were reported to have attended school regularly this past year, 9% attended but not regularly, and 4% did not attend at all. There was no meaningful differences between boys and girls (86% of boys attended school regularly, 87% of girls). There were only slight differences between the Metropolitan Area of PaP and the other urban areas covered. There were also only small variations between the different communes/villes covered in the survey, with non-attendance ranging from 1% to 8%. Poor attendance stood out in Port-de-Paix (31%), Gonaives (20%), Pétion-Ville (20%), and Delmas (14%). (See Annex I, Table 5) School attendance was less regular among food insecure, hungry, and poor households: Among food insecure households, 75% of children went to school regularly, as compared to food secure households where 92% went to school regularly. In households reporting severe hunger, 70% of children were reported to go to school regularly, 84% in households reporting moderate hunger, and 94% in households reporting mild or non-existent hunger. In households in the poorest wealth index quintile, 71% of children went to school regularly, as compared to 96% of households in the richest wealth quintile. financial (tuition too high, no sponsor, and other less common responses such as the school materials are too expensive or that children have to work), and there may simply be a homogeneity across different groups of financial constraints as a main reason. 3. Housing & Assets 44% of households are renting their homes. About one third of the head of household own their house and have relevant official documentation (20% of the poorest households and 46% of the richest). Housing ownership is higher among wealthier, food secure households. Another 14% own their house but have no formal paperwork. In the Metropolitan Area of PaP, 1% of the surveyed households live in camps or temporary shelters. The main source of cooking fuel is, by far, charcoal (87%). 9% of households also use gas, mostly in the Metropolitan area of PaP. Main sources of light are electricity (54%) and candles (19%). Gas lamp tends to be more frequently used in other cities (30%) than in the Metropolitan Area of PaP (13%). In terms of sanitation facilities, nearly half of households use private latrines (47%). The two other most used facilities are flush toilets and shared latrines, although some differences are observed between the Metropolitan Area of PaP and other cities, as shown in the below table: Reasons for non-attendance For children 6-17 years old who were reported to have poor/non-attendance during the current school year (13% of all children 6-17 years old), the respondent was asked for the main reason why. The most common reason cited was that the tuition was too expensive (56%). Other most common reasons were no sponsor (13%) and chronic health problem/chronic illness/handicap (11%). In areas outside of the Metropolitan Area of PaP, 26% of children that did not attend school regularly reported the main reason as excluded/sent away (compared to only 2% in the Metropolitan Area of PaP. There is not a strong relationship seen between the reasons for poor/non-attendance and food security, hunger, wealth, or other indicators. This nonrelationship could be observed for two possible reasons. First, the sample is relatively small. Poor or non-attendance (and then data on why) was seen in only 664 children in the sampled households. Additionally, poor or non-attendance was extremely rare in richer, more food secure households, and so the sample size in those strata with info on reasons for poor/non-attendance is small. Second, the reasons are most commonly Another key question asked about housing is the number of rooms inhabited, not including kitchen and bathroom. This question, in combination with the number of people living in the household, allows for calculation of a crowding index, i.e. number of people sleeping per room. The crowding index is higher among food insecure households. Food Security Classification Crowding index (people per room) Mean Median Food security Borderline food security Moderate food insecurity Severe food insecurity
27 IV. Food Consumption & Food Access 1. Food Consumption Score (FCS) Households were asked about specific food groups consumed over a 7 day recall, from which their food consumption score was derived. 60% of households have acceptable food consumption. There is no difference between the Metropolitan Area of PaP and other cities. Food Consomption Score Areas Poor (0-28) Borderline (28-42) Acceptable (> 42 ) Commune de Port-au-Prince 15% 20% 66% Commune de Delmas 20% 23% 57% Commune de Carrefour 11% 24% 65% Commune de Pétion-ville 10% 23% 68% Commune de Cité Soleil 45% 27% 28% Commune de Tabarre 8% 21% 72% Metropolitan Area of PaP 17% 22% 61% Ville de Jacmel 5% 22% 73% Ville de Cap-Haïtien 12% 24% 64% Ville de Fort-Liberté 7% 22% 71% Ville de Gonaïves 29% 20% 51% Ville de Hinche 2% 18% 80% Ville de Les Cayes 17% 25% 58% Ville de Jérémie 24% 41% 35% Ville de Miragoane 15% 27% 58% Ville de Port-de-Paix 21% 20% 59% Other cities 18% 23% 59% All areas surveyed 17% 22% 60% There is almost no difference between male and female headed households, with 16% and 18% of households having a poor food consumption score, respectively. Most frequently consumed food groups are cereal/roots/tubers, oil, sugar and pulses. Fruits and vegetables are only consumed at an average of 2.7 and 1.4 days per week, respectively. Cite Soleil and Jérémie stand out with very low percentage of households with acceptable food consumption (28% and 35%, respectively). Five communes/cities have alarming high percentage of households with poor food consumption: Cite Soleil, Gonaives, Jérémie, Port-de-Paix and Delmas. While they show a general trend of lower frequency of consumption for each food group, it is particularly noticeable in terms of pulses, meat/ fish/eggs, milk (all protein rich foods), and to a lesser extent in terms of oil and sugar. There is a clear link with wealth, as shown below. 87% of wealthiest households had acceptable food consumption, versus only 29% of the poorest households. 27
28 Food Consumption Score by wealth quintile Wealth index (quintile) Poor Borderline Acceptable Poorest 43% 28% 29% 2 22% 27% 51% 3 14% 26% 60% 4 6% 20% 74% Wealthiest 2% 11% 87% 2. Food Consumption Score Nutrition (FCS-N) The food consumption score nutritional adequacy analysis (FCS-N) is derived from the FCS and focuses on three main nutrients: hem iron, protein and vitamin A. By grouping food items in these nutrients, food consumption frequency can be interpreted into consumption frequency of these three key nutrients for the household. The categorization of the nutrient consumption frequency is divided into three groups: Never (0 day), Sometimes (1-6) and Everyday (7 days). Food Consumption Score Nutritional Quality Analysis by area Area Hem Iron Protein Vitamin A 0 days 1-6 days 7 days 0 days 1-6 days 7 days 0 days 1-6 days 7 days Metropolitan Area of PaP 25% 65% 10% 4% 36% 60% 13% 41% 45% Other cities 25% 69% 6% 4% 37% 59% 10% 45% 45 % All areas surveyed 25% 66% 9% 4% 36% 60% 13% 42% 45 % Food Consumption Score Nutritional Quality Analysis by wealth quintile Area Hem Iron Protein Vitamin A 0 days 1-6 days 7 days 0 days 1-6 days 7 days 0 days 1-6 days 7 days Poorest quintile (wealth index) 51% 47% 2% 12% 59% 29% 25% 48% 27% 2nd 31% 64% 5% 3% 46% 50% 17% 47% 37% 3rd 22% 69% 9% 3% 37% 60% 12% 48% 40% 4th 15% 76% 10% 1% 26% 73% 7% 42% 52% Wealthiest quintile 7% 74% 20% 0% 12% 87% 3% 27% 70% 28

29 One quarter of households never consume hem iron, which indicates a risk of iron deficiency anaemia. This condition can have a number of complications on an individual s health and wellbeing, as it has an important role in a number of enzymes involved in the oxidative metabolism and other cell functions. Similar trends are observed between the Metropolitan Area of PaP and other cities. However, results in Cite Soleil show very low hem iron consumption with 56% of households which had not consumed hem iron over the last 7 days before the survey. Proteins plays a vital role in the growth process; individuals require sufficient protein intake to prevent undernutrition. 60% of households consume protein rich food on a daily basis, and only 4% report 0 day of consumption, with no difference between the Metropolitan Area of PaP and other cities. Those encouraging results are tempered by results in Jérémie where 20% of households report never consuming protein rich foods. Vitamin A is important due to its direct link with functioning of eyesight, immune system, growth and reproductive system. 45% of households report consuming vitamin A rich foods daily, but 13% of households report 0 day of consumption, with a peak at 32% in Cite Soleil. The analysis by wealth quintile show that frequency of consumption of nutrient rich foods is linked to wealth. 3. Street Food Consumption Households were asked about their consumption of street food. About 50% of households reported that no one in their household ate street food in the last seven days. Among those who had meals outside the home in the preceding week, around 15% did it once or twice a week and 22% eat food outside the home from three to five days per week both in the Metropolitan Area of PaP and other cities. However, the proportion of households reporting consumption of street food 6-7 days a week was higher in PaP than in other cities. Households reported more frequently adult males than females in PaP (80% vs. 63% respectively) and in other cities (74% vs. 68%) as those eating street food. 23% of households reported children between 5-16 years old to eat street food and 10% reported young children (under five). When reviewing street food consumption by wealth quintiles or by food security status, little differences were observed and no clear patterns appeared. 29

30 V. Livelihoods & Income Sources 1. Main Income Source Groups In the survey, the respondents were asked their three main sources of income. Using their primary source, households were grouped into several general categories. Most households in the urban areas covered by the survey rely on three overall categories: Small commerce and businesses (32% of households), consisting of small commerce (23% of households), and small business owner (9% of households); Daily wage labour (23% of households) consisting of unskilled daily wage labour (11%) and skilled daily wage labour (12%); Salaried jobs (21% of households); In addition, 11% of households reported relying on remittances. Household relying on salaried jobs tend to be more common in the Metropolitan Area of PaP particularly in Delmas, Pétion-ville, and Tabarre. Among the communes in the Metropolitan Area, Cité Soleil has the lowest prevalence of salaried jobs (15%) followed by Carrefour (19%). In the other cities covered by the survey, there are slightly fewer households relying on salaried jobs and small commerce than in the Metropolitan Area of PaP, and slightly more relying on unskilled daily wage labour. The main source of household revenue varied somewhat between male and female-headed households. The differences were mainly found in: Small Commerce (16% of male headed households vs. 30% of female-headed households); Skilled manual labour (18% of male headed households vs. 7% of female-headed households); Salaried job (24% of male headed households vs 19% of female-headed households); Remittances (8% of male headed households vs 14% of female-headed households). 2. Number of income sources 43% of households reported only one income source, 45% reported two sources, and 13% reported three sources (a maximum of three were asked). There are only slight variation between the communes in the Metropolitan Area of PaP with regards to the number of income sources. Looking at the other cities, Jérémie is found to have households with one source most commonly (68% of households), and the least in Cap-Haitien (20%), and Jacmel (21%). Three or more sources are most common in Jacmel (27%), Cap-Haitien (35%) and Gonaives (20%), and range between 3% and 10% of households in the other cities. The number of sources of income is not meaningfully different between male and female-headed households. Although less commonly observed, the following livelihood groups tend to be more often food insecure, hungry, and poor: Households relying on agricultural production/ livestock/fishing/charcoal production as their main income source; Households relying on gifts/humanitarian assistance as their main income source; 30

31 Then, there are livelihood groups that are more frequently found in the urban areas surveyed that tend to be more food insecure, hungry, and poor: Households relying on unskilled daily wage labour; Household relying on small commerce; To a slightly lesser extent, households relying on skilled daily wage labour. Households with fewer income sources also tend to be more food insecure, hungry, and poor. 3. Food insecurity, Hunger and Wealth by main income source group Looking at food security (CARI), some of the most food insecure income source groups are also some of the most uncommon. Among the few households relying on Agricultural production/livestock and on gifts/humanitarian assistance, 52% and 72% are classified as food insecure respectively. Among the more common main income source groups, there is a large range of food insecurity levels: Among the 11% of households relying on unskilled daily wage labour, 51% are food insecure; Among the 23% of households relying on small commerce, 36% are food insecure; Among the 12% of households relying on skilled daily wage labour, 31% are food insecure. (See Annex I, Table 7) The less common livelihood groups of agricultural production/livestock and gifts/humanitarian assistance have the highest prevalence of reported hunger (77% and 82%, respectively). Among the more common livelihood groups, the highest prevalence of hunger are seen in unskilled daily wage labour (68%), skilled daily wage labour (57%) and small commerce (55%). (See Table 10). Looking at the wealth index quintiles, among the less common income source groups, the poorest tend to be the gifts/humanitarian assistance (72% in the poorest two wealth quintiles) and agricultural production/livestock (63% in the poorest two wealth quintiles). Among the more common main sources of income, the poorer groups tend to be unskilled daily wage labour (63% in the poorest two wealth quintiles) and small commerce (52% in the poorest two wealth quintiles). VI. Expenditures 1. Share of Food Expenditures Households were asked about their expenditures in order to derive the share of food expenditures. A high share of household food expenditures as a percentage of the total household expenditures is an indication of economic vulnerability. 20% of households spend more than 65% of their budget on food. There is a huge discrepancy between the Metropolitan Area (15%) and other cities (32%), but no difference between male and female-headed households. Outside the Metropolitan Area, Port-de-Paix (41%), Gonaives (37%), Cap-Haitien (30%) stand out with the highest economic vulnerability based on this indicator, as shown in the table below. (See Annex I, Table 11) 31
32 2. Debt and Credit Overall, an average of 91% food purchases are done with cash, 5% credit, and 4% non-purchase sources. There is some relation to this and hunger and asset wealth. More hungry households spend 81% of their total food purchases using cash, 14% using credit, and 6% non-purchase. Households not suffering from hunger spend 95% of their total purchases using cash, 2% using credit, and 3% non-purchase sources. Looking at richer vs poorer households (using the WI quintiles), households in the poorest WI quintile covered an average of 86% of their food purchases with cash, 9% with credit, and 5% with nonpurchased sources. The other strata were relatively similar, varying from 92% to 94% of food expenditures using cash, and 5% to 2% using credit, and 5% to 2% using non-purchased sources. When faced with financial difficulties, households can either spend savings or go into debt. Poor, food insecure households are much less likely to have savings, and so must rely on credit in times of difficulty. This debt is often accompanied by very high interest rates, further burdening these households. Whereas richer households, relying on savings in difficult times, do not have this same debt burden. Of those that actually got credit, they are usually friends/family (52% of households that got credit cited this at the main source), then local trader (15%), bank (11%), Credit Association (8%), and money lender (5%). VII. Shocks & Coping Strategies Findings from the online survey: Key urban challenges faced by the poor. Respondents were asked to identify the two main difficulties faced by the poor. Unemployment was the most commonly reported difficulty in all communes, which is in line with the high unemployment rate of 40% and the youth unemployment rate of over 60% in urban Haiti (World Bank, 2014). Electricity, and either insecurity or food prices, were the second and third most commonly reported difficulties in all communes except for Cité Soleil, Kenscoff and Port-au-Prince. Health in Cité Soleil appears along with unemployment and insecurity in the top three difficulties, rather than food prices or electricity (though the sample size is small). Flooding also appears in responses after two rainy months, though less frequently, but it may become a larger problem during the hurricane season, which runs from June through November. In Port-au-Prince commune, water and sanitation was the third most commonly selected difficulty. The main difficulties reported reflect a lack of access to basic services found in poor areas of metropolitan Port-au-Prince. Between 30% and 40% of the quartiers of Cité Soleil, Pétion-ville, Delmas and Tabarre are missing at least four of the basic services of health, education, public institutions, police, fireman, banks and markets (IOM and Community Resource Centres 2015). 1. Shocks This section looks at the shocks households were exposed to during the six months previous to the survey. Households were asked if they had experienced any shocks or negative events that had an impact on their household, and what the most significant event was. The most common shock was increase in prices of food and other goods, cited as the main shock by 32% of households. Other common shocks included sickness/accident of a household member (6%), and the death of a household member (5%). One in five households reported having experienced no shock in the past six months. While rare overall, some shocks were more frequently reported in certain areas. Drought/lack of rain was reported by 4% of all urban areas studied, but was a much more common shock in Hinche (40%), Port-de-Paix (24%), Jacmel (20%), Gonaives (21%), and Fort-Liberte (16%). Floods were only cited as the main shock by 2% of households overall, but in Fort-Liberte, 58% of households cited floods as their main shock. 32
 and Restavek (2%).")

33 More households used emergency strategies in Other Cities (11%) than in the Metropolitan Area of PaP (5%). However, Cite Soleil shows worrying findings with 19% of households reporting the use of emergency strategies, mostly begging (18%) and Restavek (2%). Outside of the Metropolitan Area, Cap Haitien and Gonaives have the highest rate of households using emergency strategies (16% and 11% respectively). (See Annex I, Table 12). 3. Insecurity related coping Findings from the online survey: Crime and security 2. Livelihoods coping Households were asked if they had used the mentioned coping strategies over the last 30 days as a result of a lack of food or money to buy food. 36% of households reported no having used coping strategies, while 39% used stress strategies, 18% crisis strategies and 7% Emergency strategies. Stress strategies are the most frequently used; these are reversible activities with no long term impact on the household, such as borrowing money, buying food on credit, spending their savings or using their assets as collateral to borrow money. Crisis strategies include cutting on health and education expenses, taking the children out of school or selling productive assets. Emergency strategies consist of negative, irreversible strategies thus having a long-term impact on the household: begging, selling house or land, or 33 sending children as restavek. Since mid-2015, the security situation throughout metropolitan Port-au-Prince and surrounding communes has been affected by increasing political demonstrations that sometimes turn violent. Crime is also a concern in metropolitan Port-au-Prince, though it is underreported. Reported violent crime is predominantly gang-related and robbery-related. Gang-related violent crime is centralized, mostly in specific areas such as Cité Soleil, whereas robberies occur throughout the city. Over the months of March May 2016, the security situation was reported as deteriorating or unchanged. Households were asked if they have used coping strategies due to insecurity during the last 30 days. Overall, 8% of households reported having abandoned or changed their economic activities due to insecurity. This rate rise up to 21% of households in Cite Soleil. 4% of households reported having to move their family out of the neighbourhood due to insecurity. Mostly observed in the Metropolitan Area of PaP, this coping was cited by 19% of households in Cite Soleil. Similarly, 4% of households reported having sent children to live with other family members due to insecurity, with a peak at 22% in Cite Soleil. While overall 28% of households reported having been afraid to walk in their neighbourhood, the majority of households in Cite Soleil mentioned being afraid (79%). 23% of households reported being afraid even in their home; 76% in Cite Soleil. Households living in the Metropolitan Area of PaP tend to be more likely to use insecurity coping strategies, and findings match with the communes and neighbourhoods known for their level of insecurity, such as Cite Soleil. (See Annex I, Table 13) 34. A restavek (or restavec) is a child who is sent by his or her parents to work for a host household as a domestic servant because the parents lack the resources required to support the child. 33
34 VIII. Perspective and Priority Needs 1. Perceptions of the future Findings from the online survey When asked how the quality of life had evolved for poor people living in their neighbourhoods over the past three months (March-May 2016), the majority of respondents answered deteriorated. In the food security assessment, households were asked how they predicted their situation would be in 6 months: better, the same, or worse than the current time. Overall, 32% say it will be worse, 11% the same, and 21% say it will be better. However, 26% report they don t know (or were unable to give a response). This may be from the fact that the future for many is unpredictable, and so they are hesitant to guess what it holds. Food insecure, poor, and hungry households all respond more frequently that they predict their situation to be worse six months in the future. Among the richest WI quintile, 23% predicted that the future would be worse, and 28% better. Among the poorest WI quintile, 44% predicted it would be worse, and 14% better. Furthermore, households in some areas tended to have a more pessimistic outlook of their futures. In Cite Soleil, 77% of households predicted things to get worse, and only 1% said things would get better. These households were also among the least likely to say they were unsure or give no response, indicating that they were more sure, in general about their futures. 2. Priority Needs Households were asked what their main needs would be in the next six months. Overall, the most common responses were work (46%) and money (28%), followed distantly by food (8%), education (5%) and health services (4%) and shelter (4%). In all groups, work and money remained the most frequently cited priority needs, usually accounting for about 75% of households responses. However, food as a priority need was more frequently cited among poor, hungry, and food insecure households than those better off. This may indicate that amongst the more vulnerable, they identify the need for food as priority over other needs, whereas those slightly better off, they identify money/work as their need, which could be sued to cover food as well as other needs. Among the most food secure households, 4% reported food as their main need, but among the severely food insecure, 18% cited food as the main need. Similarly, amongst the richest wealth index quintile households, 4% reported food as a main priority, but among the poorest wealth index quintile, 12% reported food as a main priority. In all groups, work and money remained the most frequently cited priority needs, usually accounting for about 75% of households responses. However, food as a priority need was more frequently cited among poor, hungry, and food insecure households than those better off. This may indicate that amongst the more vulnerable, they identify the need for food as priority over other needs, whereas those slightly better off, they identify money/work as their need, which could be sued to cover food as well as other needs. Among the most food secure households, 4% reported food as their main need, but among the severely food insecure, 18% cited food as the main need. Findings from the online survey Unemployment was perceived as the main difficulty faced by the poor, followed by electricity. Insecurity and food prices were also commonly reported as main difficulties. Similarly, amongst the richest wealth index quintile households, 4% reported food as a main priority, but among the poorest wealth index quintile, 12% reported food as a main priority. 34

.")
35 3. Preferred modality of assistance Households were asked which modality they would prefer, would their household be eligible to food assistance. Cash is by far the preferred modality by the potential beneficiaries, as shown in the graph on the right. It is worth noting that, as in other surveys, poorer people are more likely to cite food as their preference than rich people, but, in all groups, cash is always the most commonly cited. IX. Migration Overall, 12% of households had at least one member migrate in the past 12 months. This figure is almost double in Tabarre and Cap-Haitien (22% and 25% respectively). The lowest migration figures are found in Cité Soleil and Jérémie, which are also the areas with the highest concentration of poor households. Of household reporting members migrating in the past year, 54% stayed within Haiti, including 20% who stay in the same department. Over one fifth reported migrating to the United States. This figure increases significantly in wealthier areas (e.g. Tabarre and Pétion-ville) where the majority of migrants in these locations go to the United States (65% and 45% respectively). Almost half (48%) migrated for work, versus only 10% who left to study. Almost all households reported that there is lower migration and immigration than usual (85 % and 88% respectively). Only 8% of households reported receiving other members who had immigrated recently. Of these, over three quarters came from other areas of Haiti, including 30% within the same department. 35

36 CHAPTER IV CONCLUSIONS AND RECOMMENDATIONS
37 I. Conclusions and Recommendations 1. Main conclusions Urban populations remain vulnerable to food insecurity, particularly in poorer areas. Unplanned and spontaneous urban expansion raises many constraints affecting poverty and food security, such as shortages in access to basic services, crowded living environment, unemployment, violence, public health risks and poor sanitation. In the urban areas assessed in June-July 2016, 30 percent of the households are food insecure with two percent severely food insecure. The level of food insecurity is considerably less than that seen in the drought affected rural areas assessed in December 2015, where 47 percent of the households were found to be food insecure, with ten percent severely food insecure. In the Metropolitan Area of Port-au-Prince, 29 percent of the households are food insecure i.e. around 755,000 people out of the 2,6 million inhabitants. The level of severe food insecurity is two percent. The commune of Cité Soleil and the cities of Gonaïves, Jérémie and Port-de-Paix stand out as having the highest levels of food insecurity. Food insecurity, hunger and wealth indicators show similar trends. 40 percent of households have unacceptable food consumption. Food insecurity is also driven by economic vulnerability, with 50% of households spending over half of their budget on food. Increase in prices of food and other goods is the most common shock reported. The majority of households are forced to engage in negative coping strategies, including 25 percent relying on crisis or emergency strategies, which are difficult to reverse. The reliance on purchased food along with the vulnerability to food price fluctuation are leading factors in the urban populations food insecurity. Therefore, because of their current high-levels, it will be important to keep monitoring the Gourde exchange rate against the USD and the Dominican Peso due to its previous sharp depreciation along with food prices and cost of the food basket. Due to Haiti s exposure and vulnerability to natural disasters, monitoring of the on-going hurricane season is also recommended, as well as having the political agenda on watch, as it my potentially lead to social unrest. 2. Specific recommendations for food security monitoring The high rate of urbanization in Haiti, the country s elevated risks and vulnerability to natural shocks and the level of food insecurity showed in this analysis, concur to demonstrate the relevance and need to improve our understanding of urban food insecurity in Haiti. So far, food security analysis focused mostly on rural areas, except within the frame of the humanitarian response to the 2010 earthquake. Recognising the need to expand food security surveillance to main Haitian cities, WFP and the CNSA, in collaboration with key food security stakeholders, plan to set-up a food security monitoring system in large cities in order to get regular and timely information, and prevent food crises. In doing so, it will be essential to: Ensure that urban food security monitoring is fully integrated in the overall food security system in place in the country, and collect the key relevant data and indicators; Make the best use of the lessons learnt and methodological guidance provided by the Adapting to an Urban World project led by the global Food Security Cluster and WFP, in particular by building-up on the Port-au- Prince case study. This would be critical to ensure methodological approach and tools are tailor-made for urban contexts; Define the food security monitoring system taking into account linkages with food security observatories (sentinel sites), but also emergency preparedness and response in terms of geographical coverage and frequency of data collection, for instance. This would allow availability of key relevant data in a timely manner for the most vulnerable cities exposed to natural disasters (earthquake, floods, etc.) and it would also pave the road in case of crisis; Consider the use of technologies for: i) an enhanced use of geo-spatial data and analysis, especially for sampling and targeting purposes; ii) more regular and less costly data collections of key food security indicators (pre-crisis and/or real-time crisis monitoring), given the high rates of mobile phones ownership in the Metropolitan Area of Port-au-Prince and the departmental cities; and iii) adopting an open data approach and providing data visualization; 37

38 3. General recommendations for programming The level of food insecurity observed in Haiti in the current context of drought still points out at rural areas rather than urban. While the more food insecure rural areas should continue to be prioritized for food security interventions, the high level of food insecurity found in some urban areas, particularly in urban slums like Cite Soleil, cannot be ignored: they represent a large and very food insecure share of the population that may require specific interventions, beyond that of food security monitoring. Nonetheless, given the complex nature of food insecurity in urban slums chronic and structural by nature it is advisable that any intervention is properly tailored and implemented by the most competent actors in this sector. Indeed, a longterm development strategy is required to address chronic poverty. In entering into the urban settings, coordination and collaboration with key urban stakeholders (and not only food security ones) is crucial to better understand the social and economic dynamics, and finally to contribute to better targeting. Synergies with existing or planned urban programmes, aiming at improving infrastructures and access to basic services at the neighbourhood level, could also be further explored with purpose of strengthening urban job opportunities. It would also be recommended to determine how food security and livelihood activities can work alongside existing social protection programmes, as well as poverty reduction and access to employment measures. In urban areas, cash transfers would most likely be the preferred modality programmatically, and it is also by far the preferred modality by the potential beneficiaries, unless there is evidence that markets are not at all functional. Technology should be used where appropriate and possible, to speed data gathering, make transfers and to maximise associated benefits of technology (such as having two-way communication with recipients). 15
39 I ANNEX: Tables: 1. Sampling and Population Figures 2. Food Security Index in surveyed areas, in Metropolitan Port-au-Prince and other urban areas 3. Household Hunger Scale (HHS) in Metropolitan Port-au-Prince and other urban areas 4. Wealth Index Quintiles (WI) in Metropolitan Port-au-Prince and other urban areas 5. School attendance in Metropolitan Port-au-Prince and other urban areas 6. Number of Source of revenue by food insecurity, hunger and wealth 7. Main source of household revenue by Food Security Classification 8. Source of revenue by Household Hunger Scale (HHS) 9. Source of revenue by Wealth Index Quintiles (WI) 10. (Percentage of respondents reporting) Key urban challenges reported by areas 11. Share of food expenditures by Area 12. Coping Strategy Index by Area 13. Security Perception by Area II ANNEX: Online Survey Questionnaire III ANNEX: Questionnaire for Urban Food Security Assessment


40 1. Sampling and Population Figures
 Commune/Ville Percent of households reporting moderate and severe hunger MODERATE Hunger SEVERE Hunger Commune de Port-au-Prince 43% 32% 11% Commune de Delmas 56%")

41 2. Food Security Index in surveyed areas 3. Household Hunger Scale (HHS) Commune/Ville Percent of households reporting moderate and severe hunger MODERATE Hunger SEVERE Hunger Commune de Port-au-Prince 43% 32% 11% Commune de Delmas 56% 43% 13% Commune de Carrefour 36% 32% 4% Commune de Pétion-ville 58% 41% 17% Commune de Cité Soleil 64% 43% 21% Commune de Tabarre 40% 37% 4% TOTAL Metropolitan Zone of PaP 48% 36% 11% Ville de Jacmel 53% 47% 7% Ville de Cap-Haïtien 68% 52% 16% Ville de Fort-Liberté 39% 37% 2% Ville de Gonaïves 78% 60% 19% Ville de Hinche 31% 30% 0% Ville de Les Cayes 53% 42% 10% Ville de Jérémie 74% 60% 15% Ville de Miragoane 56% 39% 17% Ville de Port-de-Paix 60% 56% 5% TOTAL Other urban Areas 65% 52% 13% ALL areas covered by the survey 52% 40% 12%
42 4. Wealth Index Quintiles (WI) Commune/Ville Percent of households in bottom two Wealth Index Quintiles Percent in SECOND poorest quintile Percent in POOREST quintile Commune de Port-au-Prince 35% 19% 15% Commune de Delmas 29% 15% 14% Commune de Carrefour Sampling and Population Figures 28% 19% 10% Commune de Petionville 40% 21% 18% Commune de Cité Soleil 74% 28% 45% Commune de Tabarre 27% 18% 10% TOTAL Metropolitan Zone of PaP 37% 20% 17% Ville de Jacmel 26% 16% 10% Ville de Cap-Haïtien 38% 17% 21% Ville de Fort-Liberté 47% 22% 25% Ville de Gonaïves 56% 25% 31% Ville de Hinche 30% 15% 15% Ville de Les Cayes 32% 16% 15% Ville de Jérémie 60% 24% 36% Ville de Miragoane 50% 24% 26% Ville de Port-de-Paix 75% 21% 54% TOTAL Other urban Areas 48% 20% 28% ALL areas covered by the survey 40% 20% 20% AMONG children 6-17 years old. School attendance during the current school year Regular attendance Not Regular attendance Not attending at all Total Commune de Port-au-Prince 91% 3% 6% 100% 558 Commune de Delmas 84% 14% 2% 100% 483 Commune de Carrefour 90% 7% 3% 100% 450 Commune de Petionville 72% 20% 8% 100% 408 Commune de Cité Soleil 91% 4% 5% 100% 437 Commune de Tabarre 92% 4% 4% 100% 387 Metropolitan Area of Portau-Prince 5. School Attendance 88% 7% 5% 100% 2723 Ville de Jacmel 96% 2% 1% 100% 227 Ville de Cap-Haïtien 88% 11% 1% 100% 317 Ville de Fort-Liberté 97% 2% 1% 100% 287 Ville de Gonaïves 77% 20% 3% 100% 367 Ville de Hinche 98% 1% 1% 100% 297 Ville de Les Cayes 90% 8% 2% 100% 207 Ville de Jérémie 94% 5% 1% 100% 259 Ville de Miragoane 90% 6% 4% 100% 249 Ville de Port-de-Paix 63% 31% 6% 100% 276 Other urban areas 83% 15% 2% 100% 2486 Total 86% 9% 4% 100% 5209 n (unweighted)
43 Number of sources of household revenue 6. Number of Source of revenue by Food Insecurity, Hunger and Wealth Percent of FOOD INSECURE households (moderate + severe) Percent of Households reporting Moderate and Severe Hunger One source of revenue 35% 58% 48% Two sources of revenue 28% 48% 36% Three more sources of revenue 21% 46% 26% Sampling and Population Figures Total 30% 52% 40% Percent of households in bottom two Wealth Index Quintiles 7. Main source of household revenue by Food Security Classification Main source of household revenue Total (all areas covered by the survey) Agricultural production, livestock, fishing, charcoal Unskilled daily wage labor, domestic service Percent of FOOD INSECURE households (moderate + severe) Percent of MODERATELY food insecure households Percent of SEVERELY food insecure households 30% 28% 2% % 45% 6% % 46% 4% 498 Small commerce 36% 33% 2% 991 Skilled daily wage labor 31% 28% 3% 502 Small business (owner) 19% 18% 1% 416 Driver/Transport 23% 23% 0% 153 Salaried job 15% 14% 1% 994 Owner of a large company 15% 15% 0% 123 Remittances 29% 27% 2% 514 Gifts, humanitarian assistance 72% 52% 20% 75 Other, no response, no source given 47% 44% 3% 93 N (number of households, unweighted) 8. Source of revenue by Household Hunger Scale (HHS) Main source of household revenue Percent of Households reporting Moderate and Severe Hunger MODERATE hunger SEVERE Hunger N (number of households, unweighted) Total (all areas covered by the survey) 52% 40% 12% 4490 Agricultural production, livestock, fishing, charcoal 77% 55% 22% 131 Unskilled daily wage labor, domestic service 68% 45% 23% 498 Small commerce 55% 42% 13% 991 Skilled daily wage labor 57% 47% 11% 502 Small business (owner) 45% 40% 5% 416 Driver/Transport 53% 49% 4% 153 Salaried job 36% 33% 3% 994 Owner of a large company 32% 30% 1% 123 Remittances 53% 39% 14% 514 Gifts, humanitarian assistance 82% 29% 53% 75 Other, no response, no source given 70% 38% 32% 93
44 9. Source of revenue Wealth Index Quintiles (WI) Main source of household revenue Percent of households in bottom two Wealth Index Quintiles Percent in SECON D poorest quintile Percent in POOREST quintile N (number of households, unweighted) Total (all areas covered by the survey) 40% 20% 20% 4490 Sampling and Population Figures Agricultural production, livestock, fishing, 63% 16% 47% 131 charcoal Unskilled daily wage labor, domestic service 61% 22% 39% 498 Small commerce 52% 25% 27% 991 Skilled daily wage labor 41% 22% 19% 502 Small business (owner) 31% 19% 12% 416 Driver/Transport 34% 20% 14% 153 Salaried job 21% 14% 7% 994 Owner of a large company 10% 7% 3% 123 Remittances 32% 18% 13% 514 Gifts, humanitarian assistance 72% 26% 46% 75 Other, no response, no source given 48% 19% 29% 93 Urban challenge 10. Percentage of respondents reporting key urban challenges Carrefour Cité Soleil Croix-Des - Bouquets Commune Delmas Kenscoff Petion -Ville Electricity 32% 10% 34% 32% 20% 23% 30% 30% Flooding 4% 21% 8% 2% 25% 6% 5% 10% Food price 23% 21% 15% 17% 20% 24% 19% 28% Health 16% 26% 11% 12% 10% 17% 17% 14% Housing 10% 10% 7% 14% 10% 13% 14% 12% Insecurity 16% 31% 18% 20% 25% 18% 15% 12% School 13% 10% 14% 11% 15% 11% 13% 10% Transport 17% 0% 17% 12% 5% 11% 9% 12% Unemployment 37% 47% 41% 34% 35% 34% 33% 33% Water 11% 15% 13% 13% 5% 11% 21% 12% PaP Tabarre
45 11. Share of food expenditures Areas < 49% % % 75% and more Total Commune de Port-au-Prince 63% 26% 8% 3% 100% Commune de Delmas Sampling 75% and Population 22% Figures 3% 0% 100% Commune de Carrefour 39% 35% 16% 10% 100% Commune de Petionville 50% 27% 13% 10% 100% Commune de Cité Soleil 36% 39% 16% 9% 100% Commune de Tabarre 56% 33% 9% 2% 100% Metropolitan Area of PaP 55% 29% 10% 5% 100% Ville de Jacmel 52% 37% 7% 3% 100% Ville de Cap-Haïtien 36% 34% 22% 8% 100% Ville de Fort-Liberté 62% 25% 9% 4% 100% Ville de Gonaïves 22% 31% 28% 19% 100% Ville de Hinche 43% 40% 13% 4% 100% Ville de Les Cayes 57% 26% 11% 6% 100% Ville de Jérémie 68% 25% 6% 2% 100% Ville de Miragoane 48% 33% 14% 5% 100% Ville de Port-de-Paix 29% 30% 26% 15% 100% Other Cities (all) 36% 32% 21% 11% 100% All areas surveyed 50% 30% 13% 7% 100% 12. Coping Strategy Index by Area Area Reduced Coping Strategy Index (rcsi) CSI groups (0, 1-9, 10-21, 22-56) Mean No strategy CSI = 0 CSI low (1-9) CSI moderate (10-21) CSI High (22-56) Total Row N % Row N % Row N % Row N % Row N % Commune de PaP % 32% 22% 17% 100% Commune de Delmas % 32% 37% 18% 100% Commune de Carrefour % 42% 18% 6% 100% Commune de Pétionville Commune de Cité Soleil % 32% 35% 20% 100% % 31% 27% 15% 100% Commune de Tabarre % 42% 15% 10% 100% Metropolitan Area of PaP % 34% 25% 15% 100% Ville de Jacmel % 27% 40% 13% 100% Ville de Cap-Haïtien % 22% 37% 12% 100%
46 Ville de Fort-Liberté % 32% 45% 16% 100% Ville de Gonaïves % 33% 27% 20% 100% Ville de Hinche % 44% 30% 12% 100% Ville des Cayes % 35% 29% 12% 100% Ville de Jérémie % 32% 38% 23% 100% Ville de Miragoane % 32% 36% 11% 100% Ville de Port-de-Paix % 41% 21% 7% 100% Other urban areas % 32% 31% 14% 100% Total % 33% 27% 15% 100% Security perception Carrefour Cité Soleil 13. Security Perception by Area Croix-Des - Bouquets Commune Delmas Kenscoff Petion -Ville Deteriorated PaP Tabarre Improved No change Source: WFP/mobile Vulnerability Analysis and Mapping (mvam) Online Survey, June 2016
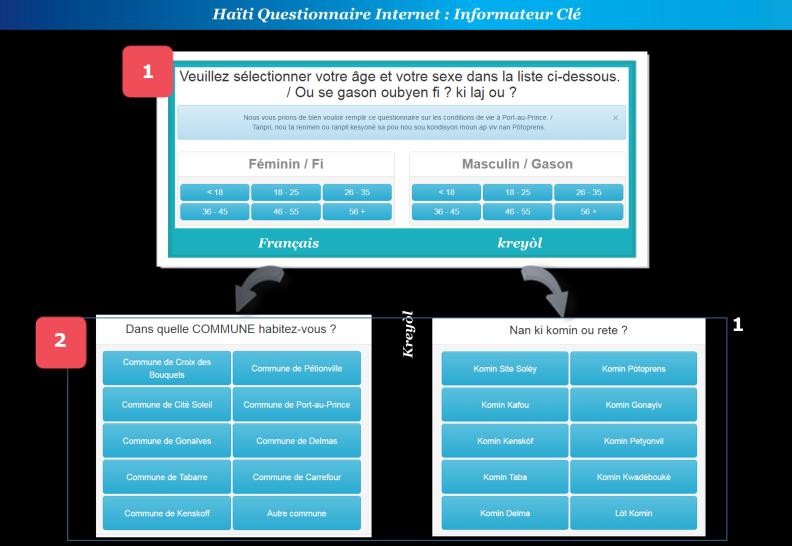

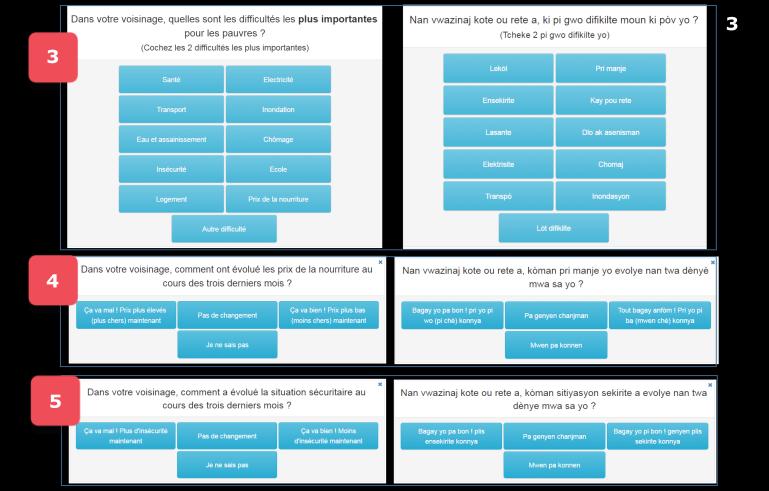
47


48
49

50
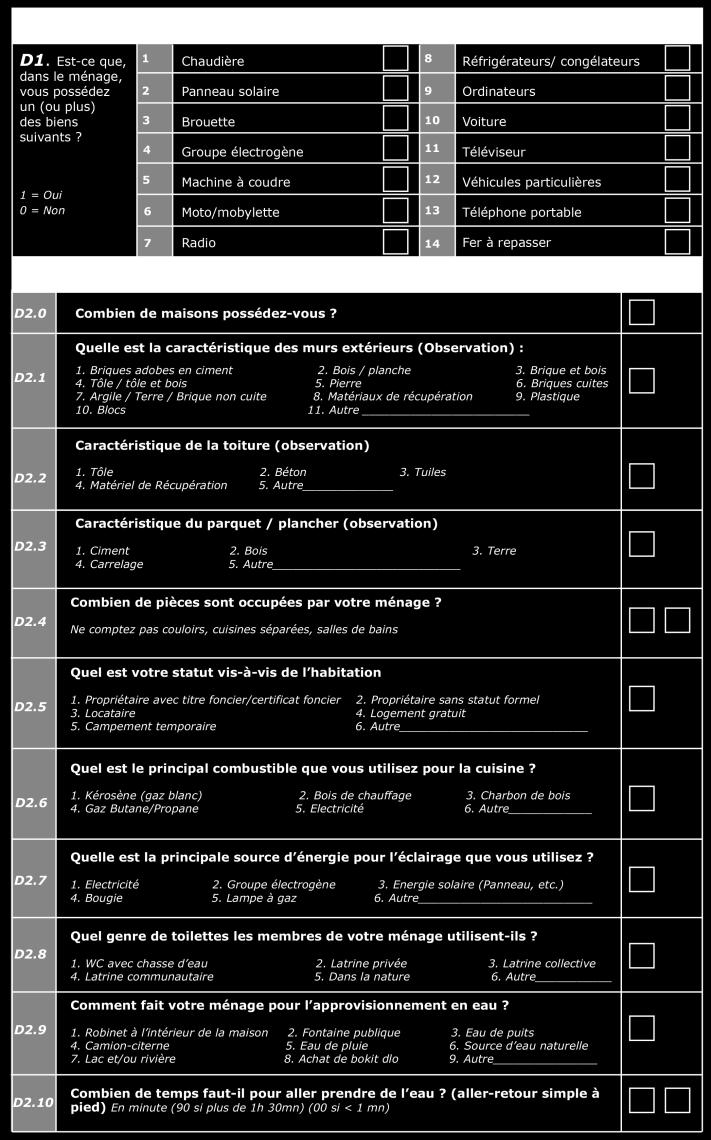
51
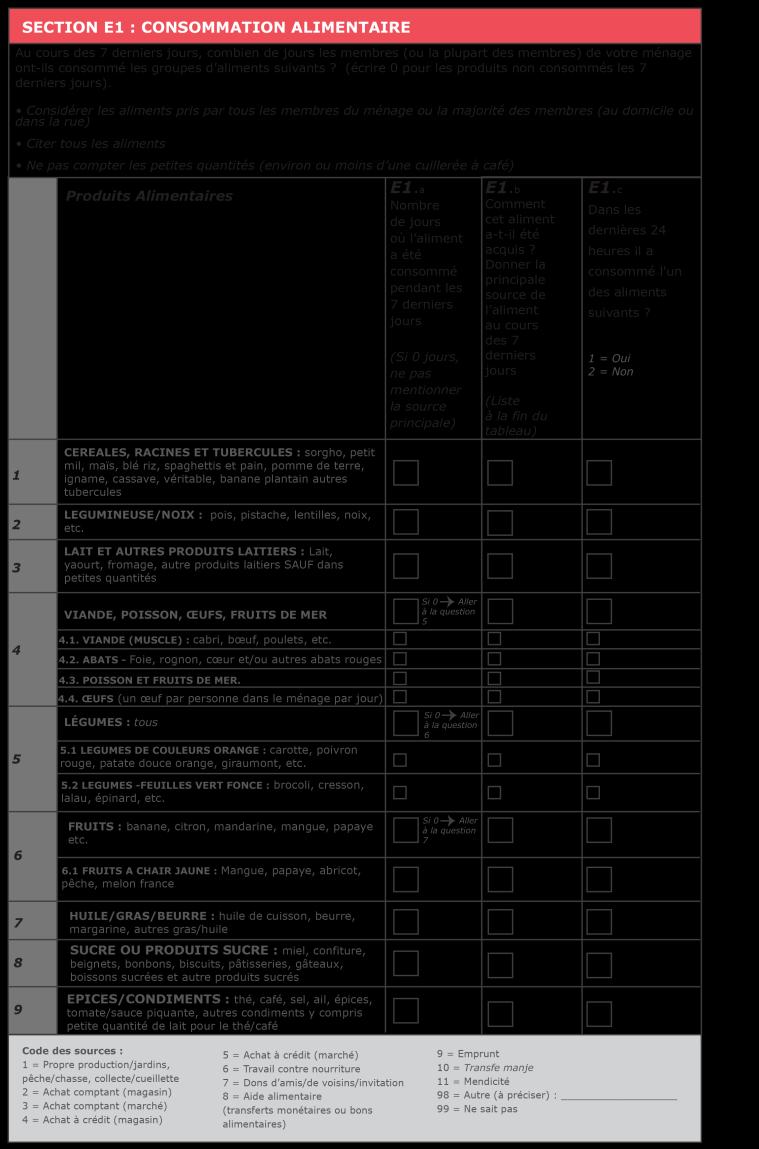
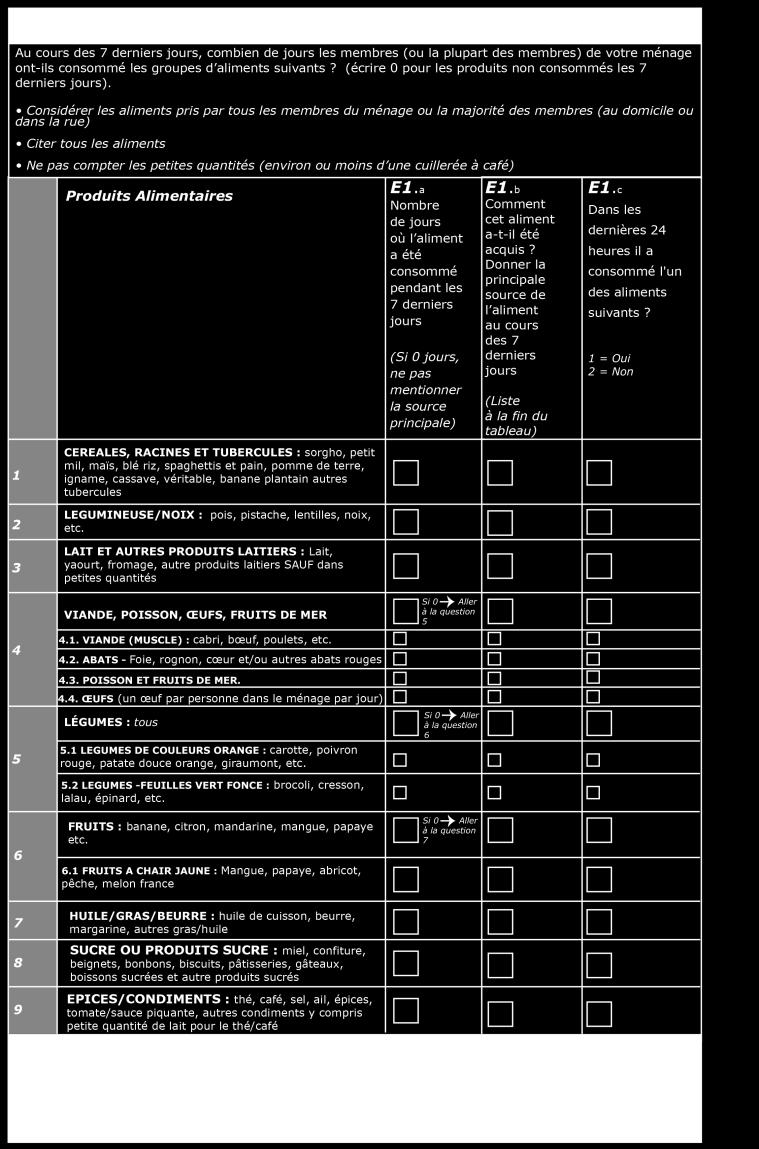
52

53
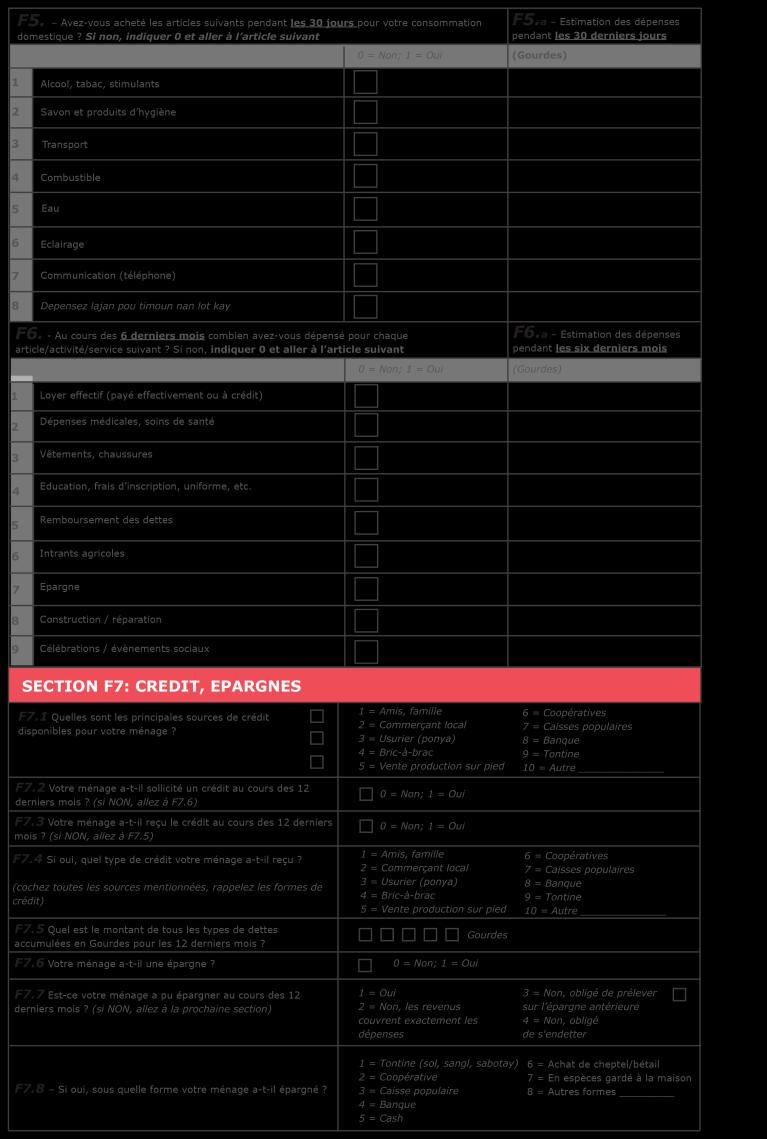
54

55

56
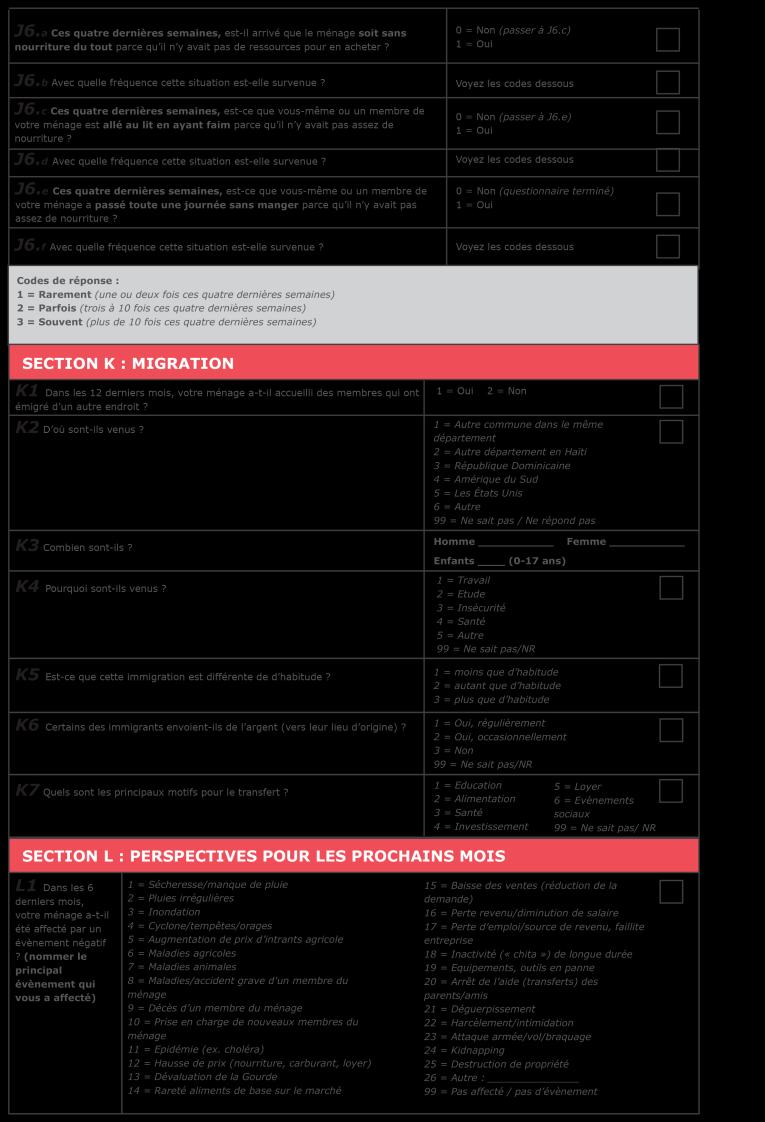

57

58
Haiti Urban Food Security Assessment
 Haiti Urban Food Security Assessment PRELIMINARY FINDINGS Highlights In the urban areas assessed in June 2016, 30% of the households are food insecure with 2% severely food insecure. The level of food
Under-five chronic malnutrition rate is critical (43%) and acute malnutrition rate is high (9%) with some areas above the critical thresholds.
 and acute malnutrition rate is high (9%) with some areas above the critical thresholds.") May 2014 Fighting Hunger Worldwide Democratic Republic of Congo: is economic recovery benefiting the vulnerable? Special Focus DRC DRC Economic growth has been moderately high in DRC over the last decade,
May 2014 Fighting Hunger Worldwide Democratic Republic of Congo: is economic recovery benefiting the vulnerable? Special Focus DRC DRC Economic growth has been moderately high in DRC over the last decade,
FOOD SECURITY MONITORING, TAJIKISTAN
 Fighting Hunger Worldwide BULLETIN February 2017 ISSUE 18 Tajikistan Food Security Monitoring Highlights The food security situation presents expected seasonal variation better in December after the harvest,
ARMENIA COMPREHENSIVE FOOD SECURITY, VULNERABILITY ANALYSIS (CFSVA) UPDATE 2017
 UPDATE 2017") ARMENIA COMPREHENSIVE FOOD SECURITY, VULNERABILITY ANALYSIS (CFSVA) UPDATE 2017 SOCIO-ECONOMIC TRENDS The Armenia Comprehensive Food Security, Vulnerability Analysis (CFSVA) Update presents the current
ARMENIA COMPREHENSIVE FOOD SECURITY, VULNERABILITY ANALYSIS (CFSVA) UPDATE 2017 SOCIO-ECONOMIC TRENDS The Armenia Comprehensive Food Security, Vulnerability Analysis (CFSVA) Update presents the current
Policy, Advocacy and Communication
 Policy, Advocacy and Communication situation Over the last decade, significant progress has been made in realising children s rights to health, education, social protection and gender equality in Cambodia.
Lebanon. Lebanon: the largest per capita recipient of refugees in the world
 October 2014 Fighting Hunger Worldwide Is the Syrian crisis jeopardizing the economy and food security in Lebanon? Special Focus Lebanon The crisis in Syria now already in its third year has had an immense
Zimbabwe Complex Emergency
 BUREAU FOR DEMOCRACY, CONFLICT, AND HUMANITARIAN ASSISTANCE (DCHA) OFFICE OF U.S. FOREIGN DISASTER ASSISTANCE (OFDA) Zimbabwe Complex Emergency Situation Report #3, Fiscal Year (FY) 2009 February 13, 2009
FOOD SECURITY AND OUTCOMES MONITORING REFUGEES OPERATION
 Highlights The yearly anthropometric survey in Kakuma was conducted in November with a Global Acute Malnutrition (GAM) rate of 11.4% among children less than 5 years of age. This is a deterioration compared
Ghana Lower-middle income Sub-Saharan Africa (developing only) Source: World Development Indicators (WDI) database.
 Source: World Development Indicators (WDI) database.") Knowledge for Development Ghana in Brief October 215 Poverty and Equity Global Practice Overview Poverty Reduction in Ghana Progress and Challenges A tale of success Ghana has posted a strong growth performance
Knowledge for Development Ghana in Brief October 215 Poverty and Equity Global Practice Overview Poverty Reduction in Ghana Progress and Challenges A tale of success Ghana has posted a strong growth performance
The Trends of Income Inequality and Poverty and a Profile of
 http://www.info.tdri.or.th/library/quarterly/text/d90_3.htm Page 1 of 6 Published in TDRI Quarterly Review Vol. 5 No. 4 December 1990, pp. 14-19 Editor: Nancy Conklin The Trends of Income Inequality and
Humanitarian bulletin Haiti. Bi-national crisis: one year later, the situation of returnees and deportees remains worrying. In this issue HIGHLIGHTS
 Humanitarian bulletin Haiti Number 62 June 2016 HIGHLIGHTS One year after the expiration of PNRE, about 120,000 people have already arrived in Haiti from Dominican Republic, according to the data collected
The Cambodia COUNTRY BRIEF
 The Cambodia COUNTRY BRIEF The Country Briefs were prepared by governments ahead of the SWA 2019 Sector Ministers Meeting. They are a snap-shot of the country s current state in terms of water, sanitation
Humanitarian NEEDS. Overview People in Need. 2.1m. Dec Credit: OCHA Haiti HAITI
 2 016 Humanitarian NEEDS Overview People in Need 2.1m Dec 2015 Credit: OCHA Haiti HAITI This document is produced on behalf of the Humanitarian Country Team and partners. This document provides the Humanitarian
The Right to Water in Haiti. Mary C. Smith Fawzi, ScD Harvard Medical School/ Partners In Health August 7, 2013
 The Right to Water in Haiti Mary C. Smith Fawzi, ScD Harvard Medical School/ Partners In Health August 7, 2013 Haiti: Demographics Poorest country in the W. Hemisphere Per capita GNP approximately $450;
How s Life in France?
 How s Life in France? November 2017 Relative to other OECD countries, France s average performance across the different well-being dimensions is mixed. While household net adjusted disposable income stands
How s Life in Austria?
 How s Life in Austria? November 2017 Austria performs close to the OECD average in many well-being dimensions, and exceeds it in several cases. For example, in 2015, household net adjusted disposable income
Italy s average level of current well-being: Comparative strengths and weaknesses
 How s Life in Italy? November 2017 Relative to other OECD countries, Italy s average performance across the different well-being dimensions is mixed. The employment rate, about 57% in 2016, was among the
ACP-EU JOINT PARLIAMENTARY ASSEMBLY
 ACP-EU JOINT PARLIAMTARY ASSEMBLY ACP-EU 102.184/16/fin. RESOLUTION 1 on the impact of Hurricane Matthew in Haiti The ACP-EU Joint Parliamentary Assembly, meeting in Nairobi (Kenya) from 19 to 21 December
15+85A. Situation Overview: Western Bahr el Ghazal, South Sudan. Introduction. Population Movement and Displacement
 Situation Overview: Western Bahr el Ghazal, South Sudan January - March 2018 Introduction. Ongoing conflict in Western Bahr el Ghazal (WBeG) State resulted in a continued deterioration of food security
How s Life in Switzerland?
 How s Life in Switzerland? November 2017 On average, Switzerland performs well across the OECD s headline well-being indicators relative to other OECD countries. Average household net adjusted disposable
Area based community profile : Kabul, Afghanistan December 2017
 Area based community profile : Kabul, Afghanistan December 207 Funded by In collaboration with Implemented by Overview This area-based city profile details the main results and findings from an assessment
The World Food Programme (WFP) Jordan FOOD SECURITY OUTCOME MONITORING (FSOM) Quarter 3 (Q3) 2017: Summary Report
 Jordan FOOD SECURITY OUTCOME MONITORING (FSOM) Quarter 3 (Q3) 2017: Summary Report") The World Food Programme (WFP) Jordan FOOD SECURITY OUTCOME MONITORING (FSOM) KEY FINDINGS: Food consumption improved amongst Syrian refugee households in quarter 3 (Q3), for both WFP general food assistance
The World Food Programme (WFP) Jordan FOOD SECURITY OUTCOME MONITORING (FSOM) KEY FINDINGS: Food consumption improved amongst Syrian refugee households in quarter 3 (Q3), for both WFP general food assistance
Eastern and Southern Africa
 Eastern and Southern Africa For much of the past decade, millions of children and women in the Eastern and Southern Africa region have endured war, political instability, droughts, floods, food insecurity
How s Life in Norway?
 How s Life in Norway? November 2017 Relative to other OECD countries, Norway performs very well across the OECD s different well-being indicators and dimensions. Job strain and long-term unemployment are
BEYOND EMERGENCY RELIEF IN HAITI JANUARY 2011
 BEYOND EMERGENCY RELIEF IN HAITI JANUARY 2011 Groupe URD- La Fontaine des Marins- 26 170 Plaisians- France Tel: 00 33 (0)4 75 28 29 35 http://www.urd.org This paper was written by the Groupe URD team in
Horn of Africa Situation Report No. 19 January 2013 Djibouti, Ethiopia, Kenya, Somalia, South Sudan
 Horn of Africa Situation Report No. 19 January 2013 Djibouti, Ethiopia, Kenya, Somalia, South Sudan AT A GLANCE Conditions across the Horn of Africa have improved, however a crisis food security situation
Humanitarian Bulletin Haiti. HAP mid-term review. In this issue HIGHLIGHTS FIGURES FUNDING
 U Humanitarian Bulletin Haiti Issue 30 May 203 HIGHLIGHTS.8 million people remain vulnerable; the revised Humanitarian Action Plan would assist one million of them. Many efforts are ongoing to mitigate
How s Life in the United States?
 How s Life in the United States? November 2017 Relative to other OECD countries, the United States performs well in terms of material living conditions: the average household net adjusted disposable income
How s Life in Belgium?
 How s Life in Belgium? November 2017 Relative to other countries, Belgium performs above or close to the OECD average across the different wellbeing dimensions. Household net adjusted disposable income
How s Life in Canada?
 How s Life in Canada? November 2017 Canada typically performs above the OECD average level across most of the different well-indicators shown below. It falls within the top tier of OECD countries on household
Haiti: Executive Summary of the PDNA after the Earthquake. Sector Evaluation of Damage, Losses and Needs. The Disaster and its Impacts
 Haïti PDNA 2010 1 Haiti: Executive Summary of the PDNA after the Earthquake Sector Evaluation of Damage, Losses and Needs The Disaster and its Impacts Prepared by the Government of the Republic of Haiti,
Poverty profile and social protection strategy for the mountainous regions of Western Nepal
 October 2014 Karnali Employment Programme Technical Assistance Poverty profile and social protection strategy for the mountainous regions of Western Nepal Policy Note Introduction This policy note presents
IOM Fact Sheet Haiti Earthquake Displacement and Shelter Strategy
 IOM Fact Sheet Haiti Earthquake Displacement and Shelter Strategy What is IOM s role in Haiti? IOM is playing a central role in facilitating and promoting safe living conditions for an estimated 2.1 million
Haiti Handicap International - Federal Information - HI in Haiti EN. General country data. a. Figures
 Haiti 2017 General country data a. Figures Total population (in millions) Haiti 10.7 million Total number of refugees under UNHCR protection 97 IHDI 0.30 Gender inequality index N/A* 1 Maternal mortality
EASTERN SUDAN FOOD SECURITY MONITORING
 EASTERN SUDAN FOOD SECURITY MONITORING KASSALA STATE, ROUND 1 JULY 2010 Highlights Round 1 of the FSMS in was carried out at the peak of the lean season. The food security situation in the urban and rural
Living conditions after the earthquake in Haiti : challenges, results and lessons
 2 YEARS OF NOPOOR RESEARCH Mid Term Assessment 20th November 2014, Living conditions after the earthquake in Haiti : challenges, results and lessons Javier Herrera, François Roubaud, Camille Saint- Macary,
Above-average use of food-related coping continued for households in Anbar (20%) and Ninewa (18%) and declined by 11 percent in Salah Al-Din.
 and Ninewa (18%) and declined by 11 percent in Salah Al-Din.") Fighting hunger worldwide Bulletin 11 October 2015 IRAQ October 2015: Food security indicators continue to be poor in Anbar and Ninewa governorates, and for IDPs Highlights Food consumption indicators
Fighting hunger worldwide Bulletin 11 October 2015 IRAQ October 2015: Food security indicators continue to be poor in Anbar and Ninewa governorates, and for IDPs Highlights Food consumption indicators
Tajikistan. Food Security Monitoring System. Highlights. Fighting Hunger Worldwide. June 2014 Number 13
 June 2014 Number 13 Tajikistan Food Security Monitoring System The Food Security Monitoring System (FSMS) provides a seasonal trend of food insecurity in rural Tajikistan by analyzing data from 1,300 rural
How s Life in the United Kingdom?
 How s Life in the United Kingdom? November 2017 On average, the United Kingdom performs well across a number of well-being indicators relative to other OECD countries. At 74% in 2016, the employment rate
Korea s average level of current well-being: Comparative strengths and weaknesses
 How s Life in Korea? November 2017 Relative to other OECD countries, Korea s average performance across the different well-being dimensions is mixed. Although income and wealth stand below the OECD average,
Response to January 12 th 2010 Earthquake
 Response to January 12 th 21 Earthquake DISPLACEMENT TRACKING MATRIX (DTM) HAITI ROUND 24 REPORT As of 31 ST DECEMBER 215 HIGHLIGHTS 14,679 IDP Households or 59,72 IDP Individuals still living in IDP sites
How s Life in Estonia?
 How s Life in Estonia? November 2017 Relative to other OECD countries, Estonia s average performance across the different well-being dimensions is mixed. While it falls in the bottom tier of OECD countries
How s Life in Portugal?
 How s Life in Portugal? November 2017 Relative to other OECD countries, Portugal has a mixed performance across the different well-being dimensions. For example, it is in the bottom third of the OECD in
How s Life in Slovenia?
 How s Life in Slovenia? November 2017 Slovenia s average performance across the different well-being dimensions is mixed when assessed relative to other OECD countries. The average household net adjusted
I. CAMPS FACT SHEET UCLBP & SHELTER AND CCCM CLUSTER HAITI JANUARY 2013
 FACT SHEET UCLBP & SHELTER AND CCCM CLUSTER HAITI JANUARY 2013 I. CAMPS 1.1 Evolution of the number of displaced persons and sites 20102012 (sources DTM December 2012) 450 Households 87 750 (70 700 in
How s Life in Sweden?
 How s Life in Sweden? November 2017 On average, Sweden performs very well across the different well-being dimensions relative to other OECD countries. In 2016, the employment rate was one of the highest
HOUSEHOLD LEVEL WELFARE IMPACTS
 CHAPTER 4 HOUSEHOLD LEVEL WELFARE IMPACTS The household level analysis of Cambodia uses the national household dataset, the Cambodia Socio Economic Survey (CSES) 1 of 2004. The CSES 2004 survey covers
How s Life in Iceland?
 How s Life in Iceland? November 2017 In general, Iceland performs well across the different well-being dimensions relative to other OECD countries. 86% of the Icelandic population aged 15-64 was in employment
KEEPING CHILDREN SAFE, HEALTHY AND LEARNING
 HAITI EARTHQUAKE JANUARY 2012 KEEPING CHILDREN SAFE, HEALTHY AND LEARNING HAITI, TWO YEARS AFTER At the start of a new year, Haïti appears to be turning a corner. The country and its 4,316,000 children
Issue brief. Current Context. Fact box Displacement and shelter in Haiti. Saving lives, changing minds.
 Issue brief HAITI TWO YEARS ON: WHY ARE SO MANY PEOPLE STILL IN CAMPS? Fact box Displacement and shelter in Haiti The estimated number of displaced persons in camps has declined from over 1.5 million in
How s Life in Hungary?
 How s Life in Hungary? November 2017 Relative to other OECD countries, Hungary has a mixed performance across the different well-being dimensions. It has one of the lowest levels of household net adjusted
CAMBODIA SYSTEMATIC COUNTRY DIAGNOSTIC Public Engagement
 CAMBODIA SYSTEMATIC COUNTRY DIAGNOSTIC Public Engagement Nov Dec 2016 Contents Objectives of the Engagement Country Context Main research questions I. What are the challenges to sustaining economic growth?
Executive summary. Strong records of economic growth in the Asia-Pacific region have benefited many workers.
 Executive summary Strong records of economic growth in the Asia-Pacific region have benefited many workers. In many ways, these are exciting times for Asia and the Pacific as a region. Dynamic growth and
Indonesia: Enhanced Water Security Investment Project
 Initial Poverty and Social Analysis March 2018 Indonesia: Enhanced Water Security Investment Project This document is being disclosed to the public in accordance with ADB s Public Communications Policy
HAITI PROGRAMME PLAN 2014
 TI PROGRAMME PLAN 2014 1. Introduction 2014 marks the fourth anniversary of the devastating earthquake that resulted in the loss of life of 230,000 people, destruction of homes and infrastructure, and
Poverty Profile. Executive Summary. Kingdom of Thailand
 Poverty Profile Executive Summary Kingdom of Thailand February 2001 Japan Bank for International Cooperation Chapter 1 Poverty in Thailand 1-1 Poverty Line The definition of poverty and methods for calculating
How s Life in the Netherlands?
 How s Life in the Netherlands? November 2017 In general, the Netherlands performs well across the OECD s headline well-being indicators relative to the other OECD countries. Household net wealth was about
ANNUAL SURVEY REPORT: BELARUS
 ANNUAL SURVEY REPORT: BELARUS 2 nd Wave (Spring 2017) OPEN Neighbourhood Communicating for a stronger partnership: connecting with citizens across the Eastern Neighbourhood June 2017 1/44 TABLE OF CONTENTS
How s Life in the Slovak Republic?
 How s Life in the Slovak Republic? November 2017 Relative to other OECD countries, the average performance of the Slovak Republic across the different well-being dimensions is very mixed. Material conditions,
Information bulletin Haiti: Civil Unrest
 Information bulletin Haiti: Civil Unrest Information Bulletin N 1 Date of issue: February 17, 2019 Date of disaster: Ongoing since July 6 2018 Point of contact: Raphael HAMOIR, Operations Manager, raphael.hamoir@ifrc.org
How s Life in New Zealand?
 How s Life in New Zealand? November 2017 On average, New Zealand performs well across the different well-being indicators and dimensions relative to other OECD countries. It has higher employment and lower
How s Life in Ireland?
 How s Life in Ireland? November 2017 Relative to other OECD countries, Ireland s performance across the different well-being dimensions is mixed. While Ireland s average household net adjusted disposable
global acute malnutrition rate among refugees in Burkina Faso dropped from approximately 18 per cent in 2012 to below 10 per cent in 2013.
 BURKINA FASO 2013 GLOBAL REPORT Operational highlights By the end of 2013, improved security in Mali had prompted the spontaneous return of some 1,600 refugees from Burkina Faso. UNHCR helped to preserve
WOMEN AND GIRLS IN EMERGENCIES
 WOMEN AND GIRLS IN EMERGENCIES SUMMARY Women and Girls in Emergencies Gender equality receives increasing attention following the adoption of the UN Sustainable Development Goals (SDGs). Issues of gender
How s Life in Denmark?
 How s Life in Denmark? November 2017 Relative to other OECD countries, Denmark generally performs very well across the different well-being dimensions. Although average household net adjusted disposable
Japan s average level of current well-being: Comparative strengths and weaknesses
 How s Life in Japan? November 2017 Relative to other OECD countries, Japan s average performance across the different well-being dimensions is mixed. At 74%, the employment rate is well above the OECD
How s Life in Australia?
 How s Life in Australia? November 2017 In general, Australia performs well across the different well-being dimensions relative to other OECD countries. Air quality is among the best in the OECD, and average
Halve, between 1990 and 2015, the proportion of people whose income is less than $1 a day
 6 GOAL 1 THE POVERTY GOAL Goal 1 Target 1 Indicators Target 2 Indicators Eradicate extreme poverty and hunger Halve, between 1990 and 2015, the proportion of people whose income is less than $1 a day Proportion
THE INDICATORS FOR SUSTAINABLE DEVELOPMENT:
 JULY 6, 2018 THE INDICATORS FOR SUSTAINABLE DEVELOPMENT: GENERAL FRAMEWORK 1.1 The Sustainable Development Goals (SDGs) On 25 September 2015, the UN-Assembly General adopted the 2030 Agenda for sustainable
Tajikistan. Fighting Hunger Worldwide. Highlights. Food Security Monitoring System. February 2015 NUMBER 14
 February 2015 NUMBER 14 Fighting Hunger Worldwide Tajikistan Food Security Monitoring System The Food Security Monitoring System (FSMS) provides a seasonal trend of food insecurity in rural Tajikistan
Progress in health in Eritrea: Cost-effective inter-sectoral interventions and a long-term perspective
 UNDER EMBARGO UNTIL 01 DECEMBER 2010 Progress in health in Eritrea: Cost-effective inter-sectoral interventions and a long-term perspective Romina Rodríguez Pose and Fiona Samuels Key messages 1. Despite
From Survival to Thriving Communities
 From Survival to Thriving Communities Two years ago Haiti experienced the worst natural disaster in its history. Hospitals and schools collapsed, bridges fell and homes crumbled. As the dust began to settle,
How s Life in Turkey?
 How s Life in Turkey? November 2017 Relative to other OECD countries, Turkey has a mixed performance across the different well-being dimensions. At 51% in 2016, the employment rate in Turkey is the lowest
How s Life in Poland?
 How s Life in Poland? November 2017 Relative to other OECD countries, Poland s average performance across the different well-being dimensions is mixed. Material conditions are an area of comparative weakness:
CALL FOR ACTION FINAL 19 May 2017
 Inter-Cluster Operational Responses in South Sudan, Somalia, Yemen, and Nigeria Promoting an Integrated Famine Prevention Package: Breaking Bottlenecks Call for Action Despite extensive efforts to address
West Bank and Gaza Poverty and Shared Prosperity Diagnostic
 Public Disclosure Authorized Public Disclosure Authorized West Bank and Gaza Poverty and Shared Prosperity Diagnostic 2011-2017 Public Disclosure Authorized August 14, 2018 Public Disclosure Authorized
LAKE CHAD BASIN - COMPLEX EMERGENCY
 LAKE CHAD BASIN - COMPLEX EMERGENCY FACT SHEET #21, FISCAL YEAR (FY) 2018 SEPTEMBER 30, 2018 NUMBERS AT A GLANCE 7.7 million Estimated People Requiring Humanitarian Assistance in Nigeria s Adamawa, Borno,
East Africa Hunger Crisis East Africa Hunger Crisis Emergency Response Emergency Response Mid-2017 Updated Appeal Mid-2017 Appeal
 ETHIOPIA SOUTH SUDAN East Africa Hunger Crisis East Africa Hunger Crisis Emergency Response Emergency Response Mid-2017 Updated Appeal Mid-2017 Appeal KEY MESSAGES Deteriorating security situation: All
GLOBALIZATION, DEVELOPMENT AND POVERTY REDUCTION: THEIR SOCIAL AND GENDER DIMENSIONS
 TALKING POINTS FOR THE EXECUTIVE SECRETARY ROUNDTABLE 1: GLOBALIZATION, DEVELOPMENT AND POVERTY REDUCTION: THEIR SOCIAL AND GENDER DIMENSIONS Distinguished delegates, Ladies and gentlemen: I am pleased
STRENGTHENING RURAL CANADA: Fewer & Older: Population and Demographic Crossroads in Rural Saskatchewan. An Executive Summary
 STRENGTHENING RURAL CANADA: Fewer & Older: Population and Demographic Crossroads in Rural Saskatchewan An Executive Summary This paper has been prepared for the Strengthening Rural Canada initiative by:
Spain s average level of current well-being: Comparative strengths and weaknesses
 How s Life in Spain? November 2017 Relative to other OECD countries, Spain s average performance across the different well-being dimensions is mixed. Despite a comparatively low average household net adjusted
Oxfam Education
 Background notes on inequality for teachers Oxfam Education What do we mean by inequality? In this resource inequality refers to wide differences in a population in terms of their wealth, their income
Economic and Social Council
 United Nations Economic and Social Council Distr.: Limited 12 July 2006 Original: English For action United Nations Children s Fund Executive Board Second regular session 2006 6-8 September 2006 Item 4
Poverty, Livelihoods, and Access to Basic Services in Ghana
 Poverty, Livelihoods, and Access to Basic Services in Ghana Joint presentation on Shared Growth in Ghana (Part II) by Zeljko Bogetic and Quentin Wodon Presentation based on a paper by Harold Coulombe and
PATHWAYS TO RESILIENCE: TRANSFORMING SYRIAN REFUGEE CAMPS INTO SELF-SUSTAINING SETTLEMENTS
 PATHWAYS TO RESILIENCE: TRANSFORMING SYRIAN REFUGEE CAMPS INTO SELF-SUSTAINING SETTLEMENTS FEASIBILITY STUDY FOR RESILIENCE-BUILDING IN SYRIAN REFUGEE CAMPS AND THEIR NEIGHBOURING HOST COMMUNITIES IN THE
Call for Research Proposals to Assess the Economic Impact of Refugees on host and/or regional economies
 Call for Research Proposals to Assess the Economic Impact of Refugees on host and/or regional economies Background: There is very limited work to date on the economic impact of refugees on host and/or
Chile s average level of current well-being: Comparative strengths and weaknesses
 How s Life in Chile? November 2017 Relative to other OECD countries, Chile has a mixed performance across the different well-being dimensions. Although performing well in terms of housing affordability
How s Life in Mexico?
 How s Life in Mexico? November 2017 Relative to other OECD countries, Mexico has a mixed performance across the different well-being dimensions. At 61% in 2016, Mexico s employment rate was below the OECD
Spatial Inequality in Cameroon during the Period
 AERC COLLABORATIVE RESEARCH ON GROWTH AND POVERTY REDUCTION Spatial Inequality in Cameroon during the 1996-2007 Period POLICY BRIEF English Version April, 2012 Samuel Fambon Isaac Tamba FSEG University
Kenya. tion violence of 2008, leave open the potential for internal tension and population displacement.
 EASTERN AND SOUTHERN AFRICA Kenya While 2010 has seen some improvement in the humanitarian situation in Kenya, progress has been tempered by the chronic vulnerabilities of emergency-affected populations.
FACTSHEET HAITI TWO YEARS ON
 HAITI TWO YEARS ON European Commission s actions to help rebuild the country January 2012 Table of contents 1 EU assistance in brief 3 2 European Commission s humanitarian assistance to Haiti.4 1. Addressing
Chapter Three: Socio-economic Situation
 Chapter Three Socio-economic Situation 77 3.1 Introduction Lebanon is divided into 6 Mouhafazats or governorates as follows: Beirut, North-Lebanon, South-Lebanon, Nabatieh, Mount-Lebanon and Bekaa (see
How s Life in Greece?
 How s Life in Greece? November 2017 Relative to other OECD countries, Greece has a mixed performance across the different well-being dimensions. Material conditions in Greece are generally below the OECD
How s Life in Finland?
 How s Life in Finland? November 2017 In general, Finland performs well across the different well-being dimensions relative to other OECD countries. Despite levels of household net adjusted disposable income
SIERRA LEONE KAMBIA DISTRICT PROFILE
 Population 341,690 1 Male 161,731 1 Female 179,959 1 Ethnic diversity Temne, Susu, Limba, Fula, and Mandingo 2 Geographical area 3108 sq. km (1200 sq. miles) 2 Language District level poverty rate 60%
POLICY BRIEF. Assessing Labor Market Conditions in Madagascar: i. World Bank INSTAT. May Introduction & Summary
 World Bank POLICY INSTAT BRIEF May 2008 Assessing Labor Market Conditions in Madagascar: 2001-2005 i Introduction & Summary In a country like Madagascar where seven out of ten individuals live below the
Human development in China. Dr Zhao Baige
 Human development in China Dr Zhao Baige 19 Environment Twenty years ago I began my academic life as a researcher in Cambridge, and it is as an academic that I shall describe the progress China has made
BANQUE AFRICAINE DE DEVELOPPEMENT
 BANQUE AFRICAINE DE DEVELOPPEMENT Publication autorisée Publication autorisée KENYA: PROPOSAL FOR AN EMERGENCY HUMANITARIAN ASSISTANCE TO POPULATION AFFECTED BY DROUGHT AND FAMINE* LIST OF ACRONYMS AND
How s Life in the Czech Republic?
 How s Life in the Czech Republic? November 2017 Relative to other OECD countries, the Czech Republic has mixed outcomes across the different well-being dimensions. Average earnings are in the bottom tier
1. Global Disparities Overview
 1. Global Disparities Overview The world is not an equal place, and throughout history there have always been inequalities between people, between countries and between regions. Today the world s population