UMKC CENTER FOR ECONOMIC INFORMATION. Economic and Fiscal Contributions of International Immigrants in the State of Kansas
|
|
|
- Alexis Francis
- 6 years ago
- Views:
Transcription
1 UMKC CENTER FOR ECONOMIC INFORMATION Economic and Fiscal Contributions of International Immigrants in the State of Kansas Dr. Peter Eaton 1/10/2013
2 Acknowledgements The Greater Kansas City Hispanic Development Fund, an affiliate of the Greater Kansas City Community Foundation, wishes to thank the generous support from the foundation and business communities for sponsoring this study for Kansas and Missouri. We are especially grateful to our lead researcher Dr. Peter Eaton, Ph.D. from the University of Missouri-Kansas City as well as consultants to the research Dr. John Leatherman from Kansas State University and Dr. Joshua Rosenbloom from the University of Kansas. Brotherhood Bank & Trust DeBruce Companies Greater Kansas City Community Foundation Greater Kansas City Hispanic Development Fund H. Tony & Marti Oppenheimer Foundation Kansas City Southern Charitable Fund Maritz Holdings Inc. Sprint Foundation W.K. Kellogg Foundation Trustee Donor-Advised Fund
3 Executive Summary This is a study of the economic and fiscal contributions of international immigrants in the state of Kansas. The study concludes that immigrants are an integral part of the Kansas economy. Substantially reducing the number of foreign born individuals who have jobs in the state of Kansas would have negative consequences for native employment and income as well as causing a significant deterioration of the state s fiscal situation. Other major findings are: International immigration is responsible for almost all of the recent population growth of the state of Kansas. The international immigration process in Kansas is selective of young males from Mexico and Central America. Unauthorized immigration has slowed in recent years. There is a large concentration of immigrants residing in southwestern Kansas. Without this population, the agribusiness of southwestern Kansas would have difficulty recruiting labor. The other geographic concentration of the immigrant population is in large cities. Immigrants are more likely to have jobs than non immigrants. Immigrants are overrepresented in the construction and manufacturing (meat packing) industries. Immigrants are overrepresented in both the highest skilled occupations and the lowest skilled occupations, and they are concentrated at both extremes of the spectrum of educational attainment. The linkages of immigrant jobs with the rest of the Kansas economy are such that an immigrant job creates almost one additional job. Immigrants pay slightly more state and local taxes per capita than do non immigrants. Immigrants from Mexico and Central America pay slightly less, and unauthorized immigrants pay about 75% of non immigrant per capita state and local taxes. Each dollar of state and local tax revenue generated by the average immigrant job results in more than an additional dollar of state and local taxes. The cost of educating native children of immigrants in the K 12 public school system is much larger than the cost of educating immigrant children. Immigrants more than pay for the state services they use with the state and local taxes they generate directly. Unauthorized immigrants pay for the state services they use with the tax revenue their jobs generate directly. Center for Economic Information Kansas City, January 10, 2013 i
4 Table of Contents Introduction 1 Immigrant Profile. 2 The Economic Contribution of Immigrants in the State of Kansas. 17 Aggregate Economic Contributions of Immigrants 20 Industry Sector Impact.. 21 State and Local Tax Revenue Effects 26 Immigrant Use of State and Local Government Services.. 29 Education (K 12) Services 29 Health Services.. 31 Higher Education and Transportation Services 31 Long Term Adjustments to the Loss of Unauthorized Immigrant Jobs.. 32 Bibliography.. 35 Appendix Tables. 37 ii
5 Forward Early in 2009, researchers at the University of Missouri Kansas City, Kansas State University, and the University of Kansas were contacted by the Greater Kansas City Community Foundation, to explore the possibility of conducting a study of the impact of immigrants on the Kansas and Missouri economies. Over the next several months researchers at the three universities developed an overall analytical framework for such a study and submitted a formal outline of this project to the community foundation. The initial plan called for researchers in each state to conduct the analysis for their respective states. As planning progressed, however, it became apparent this approach would result in considerable duplication of effort. It also was recognized the opportunity for valuable comparisons across the two states would be diminished. Once this became apparent, it was determined the bulk of work on the project should be undertaken by researchers at a single university, with consultation and input from the other scholars who had been involved in formulating the original research plan. As a result, Dr. Peter Eaton of the University of Missouri Kansas City assumed responsibility for conducting the research with Drs. John Leatherman (Kansas State University) and Joshua Rosenbloom (University of Kansas) acting as consultants. The report that follows reflects primarily the efforts of Dr. Eaton, but with advice and suggestions from Drs. Leatherman and Rosenbloom. It maintains the structure and framework of analysis that was developed by the original research team. In addition to consultation on research design, Drs. Leatherman and Rosenbloom provided extensive review comments of the preliminary research report and, now, offer this assessment of the final report. Ultimately, Dr. Eaton made all final decisions regarding approach, assumptions, and analysis. Given the available data sources, certain analytic assumptions were necessary. There simply is no way to quantitatively verify a hypothetical. Thus, many important assumptions are necessary. The assumptions made invariably affect analysis outcomes. The relative conservativeness or aggressiveness of the underlying assumptions will greatly affect the reported outcomes. It is the challenge and choice of the analyst to ensure the assumptions are clear, reasonable, and defensible. In developing the initial plans for the research, we and Dr. Eaton reviewed a large number of related studies which have preceded this effort. We found a wide range of outcomes, some of which lacked transparency of the underlying assumptions. We believe the reports produced by Dr. Eaton reflect the transparency necessary to allow the reader to understand how the underlying data give rise to the report s conclusions. Further, we believe the assumptions therein are within the bounds generally acceptable within the realm of qualified and careful iii
6 academic research. We believe that the results provide a reasonable and accurate reflection of the facts at the time of the study and that the methods used to infer the economic impacts of Kansas and Missouri immigrants have been applied in the generally accepted manner. John C. Leatherman Professor of Agricultural Economics Kansas State University Joshua L. Rosenbloom Professor of Economics University of Kansas 10 January 2013 iv
7 Introduction This is a study of the economic and fiscal contributions of international immigrants to the economy of the state of Kansas. The study was commissioned by the Greater Kansas City Community Foundation. Studies from research institutes on both the right (Cato Institute) and the left (Immigration Policy Center) of the political spectrum have demonstrated the benefits that accrue to American citizens as a result of immigration. There have been studies published for several states which attempt to quantify the general economic consequences and fiscal impact of immigration (Decker 2008, Strayhorn, 2006). This study addresses these issues for the state of Kansas. In particular, a major policy question that is addressed is what would be the result, for the state of Kansas, of a substantial reduction in the amount of immigration? In recent years some states have enacted policies with the intent of substantially reducing unauthorized immigration. This study uses a model of the state of Kansas to quantify the contributions of all immigrants, and immigrants from Mexico and Central America, to the economy of Kansas. From these estimates the study estimates the contribution of unauthorized immigrants to the economy of Kansas. The first section of this study describes the immigrant population in the state of Kansas. The data for this section comes mostly from the American Community Survey. The descriptive data in the charts, tables and maps of the immigrant profile section inform the second section of the study, which analyzes the general economic contributions of immigration in the state. The final section examines the contributions of immigrants to state and local taxes in the state of Kansas, compared to the cost of the major categories of state and local government services for immigrants. 1
8 Immigrant Profile For the purpose of this study, an international immigrant (hereafter immigrant) is defined as a person who was not born in the United States. 1 The study addresses first generation immigrants only and therefore does not address the ethnicity of all Kansas residents. It does address the ethnicity of Kansas residents who were not born in the United States. The first section of the study presents a profile of immigrants. In many cases it makes sense to compare immigrants with the native born population, and therefore many of the data tables also include information regarding the native born population. By native born, we mean born in the United States, or born abroad to parents at least one of whom is a US citizen. In this study we will refer to three immigrant categories all immigrants, immigrants from Mexico and Central America, and unauthorized immigrants. Table 1 and Chart 1 show the nativity of immigrants in the last three years for which data was available at the time of writing. Immigrants made up almost 6.4% of the population of the state of Kansas in Over half of immigrants (54%) are from Mexico and Central America. 2 The immigrant population is growing significantly faster than the native population. A more detailed list of origins of Kansas Immigrants is included in Data Appendix Table A.1. Table 1 Birthplace of Kansas Residents Region of Nativity Growth+ Mexico & Central America % Asia % Europe % Africa % South America & Caribbean % Middle East % Canada % Other % All Immigrants % United States % Source: US Census Bureau, American Community Survey, authors calculations. + percentage growth from 2008 to The only exception to this definition is individuals who are born abroad with one or more US citizens as parents. 2 All survey data are subject to sampling error. The reader should interpret survey results as a midpoint of an interval. The size of the interval depends number of factors. Broadly speaking, the more information we have about something (sample size) the smaller the interval (in percentage terms). So in Table 1, for example, we can speak with more precision about the immigrant population from Mexico and Central America than we can about the immigrant population from the Middle East. 2
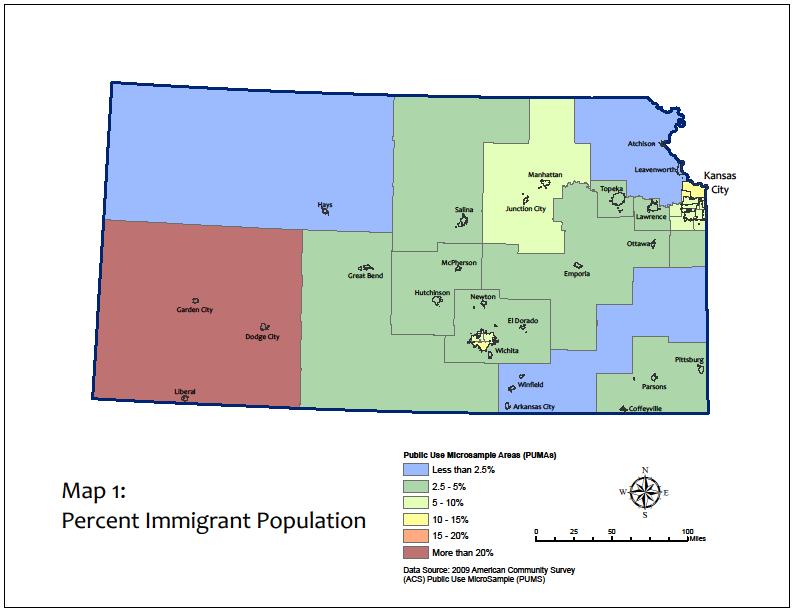
9 The PEW Hispanic Center has developed a methodology for counting unauthorized immigrants (Passel & Cohn, 2009, Appendix D) that makes PEW widely accepted as the best available source for data regarding unauthorized immigrants. PEW cites Kansas as one of the states in which unauthorized immigration has increased most rapidly, in percentage terms, since The estimated number of unauthorized immigrants in Kansas is approximately 65,000 in Chart 1: Birthplace of Kansas Residents % 1% 0% 94% 6% 0% 0% 0% 0% 3% US Mexico & Central America Asia Europe Africa South America & Caribbean Middle East Canada Other Percentages rounded to the nearest percent. A value of 0% means less than 1/2 of one percent This number is unchanged since 2009 and is a decrease since , when the estimated number of unauthorized immigrants peaked at 70,000 (Passel and Cohn, 2011, p. 23). In 2010, Kansas ranked 29 th among states in the estimated count of unauthorized immigrants. Nationwide, PEW estimates that 70% of unauthorized immigrants come from Mexico (59%) and Central America (11%) (Passel and Cohn, 2009, p. 21). 3 If this proportion holds true for the state of Kansas, then in 2009 slightly less than half of the immigrants from Mexico and Central America (47%) were unauthorized immigrants. Combining the PEW estimates with the data in Table 1, the recent trend in the state of Kansas appears to be toward a decrease in unauthorized immigration as a percentage of total immigration (from 40.7% of immigrants in 2008 to 36.3% in 2010). Data from the American Community Survey can be used to map the location of immigrants. The smallest geographical unit for which this can be done is called a PUMA (Public Use Microdata 3 The percentage of unauthorized immigrants originating in Mexico and Central America has been relatively stable over the last decade. 3
10 Area). A PUMA is defined such that it includes a population of at least 100,000 persons. In rural parts of the state, a PUMA will contain several counties. In urban parts of the state, several PUMAs may be included in one county. Map 1 and Map 2 show immigrant population as a percent of PUMA population in 2009 and immigrant population from Mexico and Central America as a percent of total PUMA population in 2009, respectively. It is obvious that there is not a random distribution of the immigrant population. Immigrants are concentrated in the southwestern PUMA and in urban PUMAs. Immigrants from Mexico and Central America are even more concentrated in the southwestern Kansas PUMA and in Kansas urban PUMAs. The reason for this concentration is that these locations have jobs that use immigrant labor. We will address this in more depth in the sections of the profile that deal with the labor force characteristics of immigrants. The demographics of the immigrant population and the non immigrant population are dramatically different. Charts 2A and 2B are age pyramids for the two population groups. The differences are obvious, with the immigrant population much more concentrated in ages that are economically active. 4
11 Age Chart 2A: Age Pyramid for Kansas Immigrants (2009) Female Male Percent Age Chart 2B Age Pyramid for Kansas Non Immigrants (2009) Female Male Percent Table 2 shows similar information for the age and gender distribution of three groups: all immigrants, immigrants from Mexico and Central America, and US natives. In the immigrant population, there are more males than females, whereas the opposite is true in the native population. In the immigrant population there is a much smaller percentage of the population in the very young and very old age categories. This has implications regarding the demand for government services, such as education and health care. Over 80% of the immigrant population, and over 84% of the immigrant population from Mexico and Central America, are between the ages of 19 and 65. This is true for both males and females. This compares with approximately 60% of native males and 58% of native females. This dramatic difference in the working age population is a reflection of one of the long recognized Laws of Migration, that has 5
12 been noted by social scientists since the 19 th Century (Ravenstein, 1885). Namely, that immigration is primarily caused by economic forces. Table 2 Basic Demographics of Kansas Immigrants and Natives, 2009 Age Male Female All All Immigrants % % % % % % % % % % % % % % % Total % % % Mexican & Central American Immigrants % % % % % % % % % % % % % % % Total % % % Natives % % % % % % % % % % % % % % % Total % % % Source: US Census Bureau, American Community Survey
13 7
14 8
15 There is insufficient information in the American Community Survey to analyze separately the age/gender composition of unauthorized Immigrants in the state of Kansas. However if Kansas follows national trends, then the same pattern would prevail of a high percentage of working age males, and a low percentage of the very young and very old, that prevails for the immigrant population as a whole in Kansas. We take this as evidence that the unauthorized immigrants of Kansas follow a similar age/gender breakdown as the United States as a whole. In the country as a whole, only 1.2% of unauthorized immigrants are 65 years of age or older, compared with 12% of natives (Passel and Cohn, 2011, p. 6). Similarly 35% of unauthorized immigrants are males between the ages of 18 and 39, compared with 14% of the population of natives. Table 3 Labor Force Status of Individuals over 18 years of Age (Kansas, 2009) Employment Status Male Female All All Immigrants Employed % % % Unemployed % % % Not in labor force % % % Total % % % Mexican & Central American Immigrants Employed % % % Unemployed % % % Not in labor force % % % Total % % % Natives Employed % % % Unemployed % % % Not in labor force % % % Total % % % Source: US Census Bureau, American Community Survey 2009 The economic causes for migration are also reflected in the labor force status of immigrants, especially males, when compared to that of natives. Table 3 shows that the male labor force participation rate (percent employed plus percent unemployed) is 85% for immigrants versus 75% for natives. The female labor force participation rate is higher for natives than for immigrants, due to the fact that immigrant females are more likely to be young, have young children, and stay at home to care for those children (Fortuny, et al., 2009, p. 1). The labor force participation rate for immigrant males from Mexico and Central America is 89%. Combining Tables 2 and 3 clearly demonstrates that the immigration process is selective of working age males, and that this process is accentuated for immigrants from Mexico and Central America. These results are consistent with national trends. Although there is no direct estimate of the 9
16 labor force participation rates of unauthorized immigrants in Kansas, national data indicate that the labor force participation rate is higher for unauthorized immigrants than for immigrants from Mexico and Central America (Passel and Cohn, 2009, pp ). Recall that the immigrant percentage of the population in Kansas was 6.3% in In the same year, immigrants made up 8.8% of employment. Immigrant males make up 6.5% of the Kansas male population, and 10.0% of employed males, whereas immigrant females make up 5.5% of the Kansas female population and 7.5% of employed females. The same information in Tables 2 and 3 are available for They are included in the Data Appendix as Tables A.2 and A.3. They reflect the fact that 2009 was the second year of a prolonged recession. For all population groups, the employment rate was higher and the unemployment rate was lower in 2008 than in Also notable in Table 3 is the fact that the unemployment rate is higher for immigrants than for natives. This is consistent with national data, and is a reversal of trends (Passel and Cohn, 2009, p. 14). The concentration of immigrants in the construction industry (see Table 4 below), a sector that was disproportionally negatively affected by the recession that began in 2008, explains most, if not all, of this change in trend. Table 4 presents a breakdown of participation in the jobs in broad industrial sectors by immigrants, immigrants from Mexico and Central America, and natives. Each cell in the table shows the percentage of total jobs in that sector that is represented by the specified gender and immigrant status indicated. So, for example, of all jobs in the construction industry in 2009, 11.6% were held by immigrant males from Mexico or Central America. The sum of job percentages held by all immigrants (male and female) and all natives (males and female) is 100% for each sector. The percent of immigrant jobs held by immigrants who are from Mexico or Central America can be inferred from Table 4. For example, we can infer that 91% of jobs held by immigrant males in construction were held by immigrants from Mexico or Central America (11.6%/12.7%). The classification of type of industry in Table 4 is broad sectors of the North American Industrial Classification Systems (NAICS). Within each of these broad categories, there is typically a subcategory in which the industry uses immigrant labor disproportionately in the state of Kansas. For example, in the Agricultural, Forestry, Fishing and Hunting broad category, immigrant labor is disproportionately used in the animal production subcategory. In the Manufacturing broad category, immigrant labor is disproportionately used in the animal processing and slaughtering subcategory. Restaurants and construction are the other two industries that use immigrant labor the most in Kansas. A more detailed version of the industries that employ immigrant labor is included in the Data Appendix as Table A.4. 10
17 Table 4 Participation in Kansas Jobs in Broad Industrial Sectors by Immigrant Status & Gender Immigrants Over 18 from All Immigrants 0ver 18 Mexico & Central America Natives Over 18 Male Female Male Female Male Female Agriculture, Forestry, Fishing & Hunting 6.90% 1.60% 6.90% 1.50% 77.90% 13.70% Mining 9.70% 0.00% 9.70% 0.00% 84.20% 6.10% Utilities 1.10% 2.80% 0.00% 2.80% 73.10% 23.10% Construction 12.70% 0.20% 11.60% 0.20% 79.70% 7.30% Manufacturing 7.00% 5.30% 3.80% 3.00% 64.00% 23.80% Wholesale Trade 7.20% 1.40% 5.80% 0.60% 66.40% 24.90% Retail Trade 2.40% 3.70% 0.80% 1.20% 46.20% 47.70% Transportation & Warehousing 2.90% 0.60% 1.90% 0.20% 71.50% 25.00% Information & Communication 2.60% 2.50% 0.50% 0.00% 47.30% 47.60% Professional, Scientific, Management* 5.80% 4.60% 2.80% 2.70% 49.50% 40.10% Finance, Insurance & Real Estate** 2.30% 1.30% 0.90% 0.20% 40.90% 55.50% Educational, Health & Social Services 2.10% 3.70% 0.30% 1.10% 20.50% 73.60% Arts, Entertainment, Recreation*** 4.90% 5.20% 3.70% 3.50% 39.40% 50.40% Other Services (Except Public Administration) 3.10% 4.80% 1.90% 2.60% 44.10% 48.00% Public Administration 1.40% 0.80% 0.40% 0.00% 48.80% 49.00% Active Duty Military 0.40% 2.60% 0.00% 0.00% 86.50% 10.50% All Jobs for Individuals Over % 3.40% 2.60% 1.50% 47.60% 44.60% Source: American Community Survey, 2009 *Also includes Administration & Waste Management Services **Also includes Rental & Leasing *** Also includes Accommodations, & Food Services Two different dimensions of the jobs of immigrants are important: 1) the type of industry in which immigrants hold jobs and 2) the occupations of immigrants within those industries. Occupations obviously align with industries, so the occupations that show up most frequently for immigrants are consistent with the industries within which immigrants work. Tables 5 and 6 contain occupations for which there were more than one thousand jobs held by immigrants of each gender in The occupation categories used are from the 1990 Standard Occupation codes. The tables also contain the count of occupations held by immigrants from Mexico and Central America. Both tables contain not only the count of jobs for each gender specific occupation, but also the percentage of each gender specific occupation category held by all immigrants. A complete list of immigrant occupations is contained in the Data Appendix as Tables A5 and A6. 11
18 Table 5 Kansas Occupations with > 1000 Male Immigrants over 18 Years of Age Occupation Category 1990 SOC All Immigrants from Mexico & Immigrants Central America Construction laborers 4300 (20.5%) 3962 (18.9%) Gardeners & groundskeepers 3591 (29.4%) 3359 (27.5%) Subject instructors (HS/college) 3367 (33.8%) 0 (0%) Carpenters 3025 (15.8% 2967 (15.5%) Truck, delivery, & tractor drivers 3009 (7.8%) 2806 (7.3%) Cooks, variously defined 2862 (14.5) 1856 (9.4%) Farm workers 2612 (27% 2612 (27%) Butchers & meat cutters 2329 (62.9%) 2103 (56.8%) Janitors 2103 (11.3%) 1678 (9.1% Laborers outside construction 1856 (7.4%) 1078 (4.3% Roofers & slaters 1803 (55.6% 1670 (51.5% Computer software developers 1711 (23.5%) 0 (0%) Assemblers of electrical equipment 1659 (13.7%) 1166 (9.6%) Programmers of numerically controlled machine tools 1525 (51.1%) 361 (12.1%) Misc food prep workers 1489 (33.0%) 996 (22.1%) Managers & administrators, n.e.c (3.0%) 91 (0.2%) Painters, construction & maintenance 1241 (18.0%) 1241 (18.0%) Computer systems analysts & computer scientists 1032 (2.6%) 0 (0%) Source: American Community Survey, 2009 Tables 4 6 paint a picture of the typical immigrant occupation and industry. The jobs tend to be low skilled especially among immigrants for Mexico and Central America. There are a few occupations (teachers, electrical equipment assemblers, computer systems analysts) that have over 1000 immigrants, but all of these have a low incidence of immigrants from Mexico and Central America. For both men and women, the occupation that has the highest percentage of immigrant workers is butchers and meat cutters. Over 70% of butchers and meat cutters are immigrants, and over 75% of immigrant butchers and meat cutters are immigrants from Mexico or Central America. It is obvious that the meat packing industry in Kansas depends heavily on immigrant labor from Mexico or Central America. The findings of this study with respect to industrial and occupation distribution of the immigrant labor force in the state of Kansas are consistent with the findings of a recent national study by the Brookings Institution (Singer, 2012). 12
19 Table 6 Kansas Occupations with > 1000 Female Immigrants over 18 Years of Age Occupation Category 1990 SOC All Immigrants Immigrants from Mexico & Central America Housekeepers, maids, butlers, stewards, lodging quarters cleaners 4080 (38.8%) 3781 (26.6%) Butchers and meat cutters 3505 (78.5%) 2319 (52.0%) Nursing aides, orderlies, and attendants 2588 (6.7%) 317 (0.8%) Janitors 2418 (27.4%) 1845 (20.9% Cooks, variously defined 2398 (12.8%) 2126 (11.4%) Subject instructors (HS/college) 1839 (19.3%) 129 (1.4%) Misc food prep workers 1718 (32.8%) 491 (9.4%) Assemblers of electrical equipment 1674 (19.9%) 0 (0%) Hairdressers and cosmetologists 1590 (18.7%) 650 (7.6%) Child care workers 1531 (9.2%) 657 (3.9%) Supervisors and proprietors of sales jobs 1454 (8.0%) 707 (3.9%) Machine operators, n.e.c (27.9%) 625 (12.4%) Cashiers 1247 (5.4%) 384 (1.7%) Waiter's assistant 1211 (26.4%) 1038 (22.7%) Packers and packagers by hand 1122 (34.8%) 760 (23.6%) Retail sales clerks 1065 (5.4%) 215 (1.1%) Teachers, n.e.c (4.7%) 193 (0.9%) Source: American Community Survey, 2009 The low skill content of immigrant occupations is reflected in Table 7. The Table is divided into two parts. The top part shows the educational attainment of school aged Kansans by immigrant status, and gender. The bottom part of the table shows educational attainment of Kansans 25 years of age or older, by immigrant status and gender. Only 12% of working age (>24) male immigrants from Mexico and Central America and 13% of working age of female immigrants from Mexico and Central America have more than a high school degree. This compares with over 50% for both native males and females. Over 70% of working age male immigrants with birthplaces outside of Mexico and Central America, have more than a high school degree. For working age female immigrants with birthplaces other than Mexico and Central America, 50% have more than a high school degree. If can be inferred that most of the high skilled immigrant occupations are held by immigrants from birthplaces other than Mexico and Central America. 13
20 Table 7 Educational Attainment by Immigrant status, Gender and Broad Age Category (Kansas, 2009) All Immigrants Immigrants from Mexico and Central America Natives Males 6 24 Females 6 24 Males 6 24 Females 6 24 Males 6 24 Females 6 24 Education Freq % Freq % Freq % Freq % Freq % Freq % N/A or no schooling Nursery school grade Grade 5, 6, 7, or Grade Grade Grade Grade year of college years of college years of college years of college All Immigrants Immigrants from Mexico and Central America Natives Males > 24 Females > 24 Males > 24 Females > 24 Males > 24 Females > 24 Education Freq % Freq % Freq % Freq % Freq % Freq % N/A or no schooling Nursery school grade Grade 5, 6, 7, or Grade Grade Grade Grade year of college years of college years of college years of college Source: American Community Survey, 2009 Low skills are typically associated with low income. That relationship shows up in the poverty statistics. The Federal Government establishes, for each household size, a poverty level of income. The household income of each household is then compared to the poverty level, and can be expressed as a percentage of that poverty level. Table 8 shows the percent of individuals who reside in households that have the indicated percentage of the poverty level. The table is also subdivided by gender and immigration status. By Federal guidelines, any individual who resides in a household that has an income level less than or equal to 100% of the poverty level (i.e. the first two rows of table 8), is considered to be poor. By this criterion a little over 14% of native males live in poverty and a little over 16% of native females live in poverty. By the same criterion a much higher percentage of immigrants from Mexico and Central America live in 14
21 Table 8 Poverty Status of Kansans by Gender and Immigrant Birthplace All Immigrants Immigrants from Mexico & Central America Natives Percent of Poverty Male Female Male Female Male Female 0 50% 8.69% 12.59% 6.16% 15.52% 7.89% 8.66% % 13.16% 13.74% 18.85% 22.88% 6.16% 7.42% % 30.55% 27.41% 39.11% 36.61% 16.25% 18.55% % 15.84% 16.78% 18.79% 14.66% 17.68% 17.35% % 8.23% 8.80% 6.72% 5.36% 14.59% 13.80% % 7.33% 6.59% 4.13% 1.30% 12.20% 10.83% 501+% 16.20% 14.09% 6.24% 3.67% 25.23% 23.39% Source: American Community Survey, 2009 poverty (approximately 38% of females and 25% of males). There are many issues involved in using Federal Poverty guidelines as a measure of families in need most research would say that using these guidelines tends to understate the real extent of poverty. 4 Using other criteria would not change the qualitative result from above. In fact, it would reinforce those results. A very large percentage of immigrants and an even larger percentage of immigrants from Mexico and Central America fall in the 101% 200% of poverty category, such that the total percentage of immigrants from Mexico and Central America that falls below 200% of the poverty line is over 64% of males and over 75% of females. Another characteristic of the immigrant population that differs significantly from that of the native population is their housing type. Although a majority of immigrants live in owner occupied housing, the incidence of owner occupancy (55%) is well below that of the native population (almost 70%), as can be seen in Table 9. Notice the low incidence of group quarters residents among immigrants for Mexico and Central America. This will have implications for the demand for certain types of government services among immigrants from Mexico and Central America, addressed in the final part of this study. The American community survey also has a series of questions regarding the amount of property taxes paid. Table 10 shows the distribution of property taxes paid by households by immigrant status. It should be emphasized that some, if not all, of property taxes paid by landlords of rental properties gets passed on to the renters, so that renters indirectly pay property taxes. 4 One alternative to the poverty line is a living wage calculator, ( developed by Pennsylvania State University. 15
22 Table 9 Housing Type of Kansans by Immigrant Status Natives Housing Type Frequency % Group quarters* Owned or being bought (loan) Rental All Immigrants Group quarters* Owned or being bought (loan) Rental Immigrants from Mexico & Central America Group quarters* Owned or being bought (loan) Rental Source: American Community Survey, 2009 *The Census Bureau defines group quarters to include: college residence halls, correctional facilities, residential treatment centers, skilled nursing facilities, group homes, military barracks, workers dormitories, & facilities for the homeless. Table 10 Percent Distribution of Property Tax Amounts Paid by Immigrant Status Immigrants from Mexico & Central Natives All Immigrants America Renters, Group Quarter, etc % 44.97% 44.91% $0 1.54% 2.27% 3.29% $1 $ % 16.71% 25.44% $ 1,000 $1, % 15.16% 16.90% $ 2,000 $2, % 11.56% 7.94% $ 3,000 $3, % 5.49% 0.98% $ 4,000 $4, % 1.30% 0.06% $5,000 $5, % 0.64% 0 $6,000 $6, % 0.91% 0 $7,000 $7, % 0.52% 0 $8,000 $8, % 0.15% 0 $9,000 $9, % 0.04% 0 $10, % 0.26% 0 Source: American Community Survey,
23 The Economic Contribution of Immigrants in the State of Kansas To assess the economic contribution of immigrants we use an economic development assessment software package known as IMPLAN. The package models the economy of a region, and has data appropriate to the region being analyzed built into the software. IMPLAN is commonly used to assess the economic impact of adding or subtracting jobs in a particular industry or set of industries 5. This is accomplished by using Social Accounting Matrices that contain the dollar amounts of all business transactions taking place in a regional economy (in this case, the region is the state of Kansas), based on reports each year by businesses and governmental agencies. The IMPLAN user specifies a change that occurs in a regional economy. For example, a user might want to analyze the effect of adding a meat packing plant in southwestern Kansas that would have 200 jobs. IMPLAN then provides three types of effects that result from the user specified change. The direct effect is the user specified change (200 jobs which would imply an addition to the income stream and output that is specific to the meat packing industry, with associated income, property and indirect business taxes). The indirect effects are determined by the amount of the direct effect spent within the study region on supplies, services, labor and taxes. In our example, the meat packing plant would purchase supplies, machinery, construction labor, etc. The portion of that spending that occurs in Kansas is the indirect effect of the change. Finally the induced effect measures the money that is re spent in the state of Kansas as a result of spending from the direct and indirect effect. This is also known as the multiplier effect. Job holders spend some of their income in Kansas, and this spending generates more spending in the state of Kansas. Each of these steps recognizes an important leakage from the economic study region spent on purchases outside of the defined area. Eventually these leakages will stop the cycle of induced effects. IMPLAN estimates the direct, indirect, and inducts impacts of the specified change on the output, income, jobs, and federal, state and local taxes generated in the regional economy. To estimate the economic contribution of immigrants, we use the American Community Survey count of jobs for all immigrants and for immigrants from Mexico and Central America by very detailed industry (appendix Table A4). 6 Those jobs are removed from the Kansas economy, and the direct, indirect and induced effects are calculated. Table 11 shows that the result of that subtraction of immigrant jobs has a major impact on any general measure of economic activity: jobs, value added, employee compensation, proprietors income, and other property type income. Note that these categories are different measures of economic activity and should not be summed. According to the ACS, the number of jobs held by immigrants in 2009 in those detailed industries was 132, A list of clients can be viewed on the IMPLAN website ( 6 The total number of jobs in the American Community Survey matches closely the total number of jobs used by IMPLAN for its model of the Kansas Economy. There were two minor discrepancies (involving aggregations of categories) between the NAICS categories used by IMPLAN and the ACS. 17
24 Table 11: Aggregate Kansas Immigrant Economic Impact (2009) All Immigrants Direct Indirect Induced Total Direct as % of KS Total Direct + Indirect + Induced as % of KS Total Jobs 132,776 53,975 55, , % 13.5% Value Added 9,710,120,720 4,500,400,055 3,593,600,646 17,804,121, % 13.6% Employee Compensation 5,187,810,411 2,269,861,842 1,801,390,746 9,259,062, % 13.1% Proprietors' Income 694,523, ,440, ,143,293 1,284,107, % 12.8% Other Property Type Income 3,244,303,500 1,471,517,034 1,175,422,004 5,891,242, % 14.4% Mexican & Central American Immigrants Direct Indirect Induced Total Direct as % of KS Total Direct + Indirect + Induced as % of KS Total Mexcian & Central American as % of Immigrant Total Jobs 73,573 32,116 30, , % 7.6% 59.5% Value Added 4,671,458,719 2,524,258,179 1,883,972,472 9,079,689, % 7.0% 56.1% Employee Compensation 2,570,632,574 1,262,772, ,315,461 4,777,720, % 6.8% 55.6% Proprietors' Income 408,347, ,882, ,486,438 $745,716, % 7.4% 60.6% Other Property Type Income 1,393,415, ,794, ,245,709 2,822,454, % 6.9% 55.2% Source: IMPLAN calculations Unauthorized Immigrants Direct Indirect Induced Total Direct as % of KS Total Direct + Indirect + Induced as % of KS Total Unauthorized as % of Immigrant Total Jobs 39,546 17,262 16,426 73, % 4.09% 31.98% Value Added 2,510,921,694 1,356,795,597 1,012,640,298 4,880,357, % 3.76% 30.15% Employee Compensation 1,381,721, ,743, ,572,114 2,568,037, % 3.66% 29.89% Proprietors' Income 219,487, ,812,441 68,524, ,824, % 3.98% 32.57% Other Property Type Income 748,964, ,878, ,233,735 1,517,077, % 3.71% 29.67% Source: Authors Calculations 18
25 The purpose of the IMPLAN simulation exercise is to document the contribution of immigrants to the economy of Kansas. The results are annual results,, and should be interpreted as short run results for the entire state of Kansas. These results do not take into account long term consequences of the elimination of immigrant jobs. The results reflect the economy of the state as it is currently configured. Some possible long term consequences could mitigate the effects of Table 11 and some could exacerbate them. In the following paragraphs I address some of the possibilities. The discussion centers on unauthorized immigrants, since policies aimed at affecting immigration are generally aimed at unauthorized immigration. It might be argued that over time, natives would take the jobs currently being held by immigrants. This is unlikely to occur to any large extent. In 2009 the unemployment rate among Kansas non immigrants was 4.4%. If every unemployed non immigrant were to take a job currently held by an immigrant, there would still be almost 50,000 jobs not taken. It seems more likely that, given the aging of the native population, the long term may require that immigrants make up a larger proportion of the labor force (Papademetriou et al., 2009). It might also be argued that reducing immigrant labor will increase the earnings of nonimmigrants, thus mitigating the effects shown in Table 11. Other studies have shown that native labor and immigrant labor are relatively weak substitutes (Card, 2007). There is some evidence that the wages of low skilled non immigrants are adversely affected by immigration (Borjas, 2003), but at the same time there is evidence that the average wages of the nonimmigrant labor force are increased by immigration (Shapiro & Velluci, 2010; Card, 2007; Orrenius & Zavodny, 2006). Most of the population growth that has occurred in the state since 1990 is due to immigration. In 1990, 2.5% (1990 Demographic Census) of the population in the state was foreign born. In 2010, that percentage had grown to 6.5% (2010 ACS). This study does not take into account potential future growth in the foreign born population, nor does it take into account any indirect or induced effects of such growth. Maps 1 and 2 demonstrated that the relative importance of immigration is not evenly distributed geographically. It would be very difficult to argue that the livestock and meat packing industries of southwestern Kansas would be able to find sufficient labor to operate at their current levels without immigrant labor. The IMPLAN method assumes that industries can scale down operations proportionally to the labor loss. It is altogether possible that without immigrant labor, the meat processing industry of southwestern Kansas would cease to exist, thereby increasing the negative effects of immigrant job loss. On balance, the literature points to a negative correlation between undocumented immigrant jobs and the earnings of the unskilled non immigrant population. The results of the IMPLAN simulation seem reasonable as short term estimates, and we will proceed to analyze those 19
26 results in more detail in the paragraphs that follow. We then proceed to discuss long term adjustments to the elimination of undocumented immigrant jobs. Aggregate Economic Contributions of Immigrants Table 11 indicates that the direct impact of eliminating immigrant jobs is a loss of between 6.9% and 7.9% of the general measures of economic activity. It is reasonable to conclude that immigration is directly responsible for 7% to 8% of the Kansas Economy. When indirect and induced effects are taken into account, this percentage increases to between 12.8% and 14.4%. The average Kansas job multiplier for immigrant jobs is almost 2 (1.828). For every immigrant job in Kansas an additional.828 of a job is created in the Kansas economy. Similarly the value added multiplier is For every dollar of value added by Kansas immigrants, an additional $0.83 of value added is created in the Kansas economy. These impacts take into account the leakages from the Kansas economy associated with immigrant jobs. From Table 11 it can also be seen that immigration from Mexico and Central America is consistently responsible for between 55% and 60% of the total contribution of immigration to these general measures of economic activity. The fact that the percent of jobs (59%) is higher than the percent of employee compensation (55%) indicates that immigrants from Mexico and Central America have relatively low earnings. The job multiplier is slightly higher for immigrants from Mexico and Central America (1.852 vs for all immigrants), indicating that immigrants from Mexico and Central America are engaged in activities that have ties with more labor intensive and/or consume commodities from Kansas that are more labor intensive in their production. Table 11 also presents the aggregate contribution of unauthorized immigration on the Kansas Economy. To estimate the effects of unauthorized immigration, we use the following assumptions: There were 65,000 unauthorized immigrants in Kansas in 2009 (based on PEW estimates) Unauthorized immigrants have the same demographic and labor force characteristics as immigrants from Mexico and Central America (this would be a conservative estimate of the employment rate, according to PEW research (Passel and Cohn, 2009, pp ). since unauthorized immigrants are more likely to have a job than all immigrants from Mexico and Central America). The PEW national estimate is that 70% of unauthorized immigrants are from Mexico and Central America. Each unauthorized immigrant who is working has one job. Under these assumptions, 39,546 jobs were held by unauthorized immigrants in the state of Kansas in The types of jobs held are, by assumption, distributed the same as the jobs held 20
27 by immigrants from Mexico and Central America. The general economic impact of unauthorized immigrants on the Kansas Economy can be seen in the bottom panel of Table 11. Industrial Sector Impact IMPLAN allows the analyst to view the impacts of the posited change on all industries. 7 The next set of tables present the industries that are most sensitive to immigration, and those that are most sensitive to immigration from Mexico and Central America. Each of the five general measures of economic activity has a separate table for immigration and immigration from Mexico and Central America. Table 12: Top 10 Immigration Sensitive Industries Ranked by Total Jobs Attributed to Immigration (KS 2009) Rank Industry Description Direct Indirect Induced Total 1 Food services & drinking places 12,197 2,063 6,250 20,510 2 Construction 15, ,007 3 Administrative support services 8,313 5,802 1,735 15,850 4 Professional, scientific & technical services 7,059 6,859 1,656 15,574 5 Educational services 11, ,062 12,416 6 Food products 9, ,115 7 Wholesale trade 4,112 5,382 1,459 10,953 8 Government & non NAICs 2,227 3,591 2,573 8,391 9 Ambulatory health care 3, ,265 7, Livestock 2,950 4, ,338 Source: IMPLAN calculations (errors due to rounding) We begin with the impact of immigration on jobs. Tables 12 and 13 present the ten most sensitive industries to immigration and to immigration from Mexico and Central America, respectively. 8 The tables are ranked by the total number of jobs attributable to immigration (that is, including indirect and induced jobs). Educational Services ranks in the top ten for all immigrants. Its place is taken by hospitals in the top ten for immigrants from Mexico and Central America. Notice the large differences between indirect effects (employment in other sectors of the Kansas economy that supply the sector in question) and induced effects (traditional multiplier effects of spending in a sector that gets re spent in the Kansas economy). Consider the Kansas livestock industry. Because it purchases much of its inputs from Kansas suppliers, jobs in the Kansas livestock 7 For a detailed explanation of the North American Industrial Classification System (NAICS) industries, see the Bureau of Labor Statistics website ( 8 By our assumptions the impact of unauthorized immigrants is proportional to that of immigrants from Mexico and Central America, so the rankings for unauthorized immigration are the same as those from Mexico and Central America, for all five general measure of economic activity. 21
28 Table 13: Top 10 Immigration Sensitive Industries Ranked by Total Jobs (KS 2009) Attributed to Immigration from Mexico and Central America Ran k Industry Description Direct Indirect Induced Total 1 Construction 14, ,471 2 Food services & drinking places 9,128 1,112 3,411 13,651 3 Administrative support services 7,428 3, ,435 4 Food products 7, ,448 5 Wholesale trade 2,964 3, ,185 6 Livestock 2,950 3, ,394 7 Professional, scientific & technical services 871 3, ,580 8 Government & non NAICs 428 2,022 1,402 3,852 9 Ambulatory health care ,326 3, Hospitals 1, ,270 3,249 Source: IMPLAN calculations (errors due to rounding) industry have strong indirect effects so much so that indirect job creation is greater than direct job creation (4293 jobs versus 2950 jobs in Table 12). The ambulatory health care industry does not purchase much in terms of inputs from the Kansas economy, so its indirect effects are tiny. However, the immigrant jobs in that sector generate a lot of income, some of which is spent in Kansas, resulting in large induced effects. The rankings in Tables 14 and 15 are based on value added by immigration sensitive industries. This ranking contains six different industries than the ranking for jobs. Most importantly, real estate ranks prominently by this criterion for both all immigration and immigration from Mexico and Central America. Notice the very large indirect and induced effects of the real estate industry. Transportation equipment, telecommunications, and lessor of non finance intangible assets (franchises) are added to the rankings for all immigration, but not for immigration from Mexico and Central America, whereas petroleum & coal production and utilities are added to the rankings for immigration from Mexico and Central America, but not for all immigration. 22
Immigrants strengthen Colorado s economy, generating $42 billion of activity in 2011
 Immigrants strengthen Colorado s economy, generating $42 billion of activity in 2011 February 14, 2013 By Christopher Stiffler Economist Executive Summary The foreign-born population is a growing presence
History of Immigration to Texas
 History of Immigration to Texas For most of its history, Texas has attracted settlers from the rest of the nation rather than abroad Mexican immigrants did not begin to settle permanently until late 1970s
Immigrant Employment by Field of Study. In Waterloo Region
 Immigrant Employment by Field of Study In Waterloo Region Table of Contents Executive Summary..........................................................1 Waterloo Region - Part 1 Immigrant Educational Attainment
Briefing Book- Labor Market Trends in Metro Boston
 Briefing Book- Labor Market Two other briefing books focus on the importance of formal education and ESOL courses to Boston s foreign-born residents. While there are a number of reasons why improving immigrant
Release of 2006 Census results Labour Force, Education, Place of Work and Mode of Transportation
 Backgrounder Release of 2006 Census results Labour Force, Education, Place of Work and Mode of Transportation On March 4, 2008 Statistics Canada released further results from the 2006 census focusing on
Labor Supply Factors and Labor Availability for the Geneva (Fillmore County) Labor Area
 Labor Area") Labor Supply Factors and Labor Availability for the Geneva (Fillmore County) Labor Area June 2015 Prepared by: Kenneth M. Lemke, Ph.D. Economist Nebraska Public Power District 1414 15 th Street - P.O.
Labor Supply Factors and Labor Availability for the Geneva (Fillmore County) Labor Area June 2015 Prepared by: Kenneth M. Lemke, Ph.D. Economist Nebraska Public Power District 1414 15 th Street - P.O.
Potential Economic Impacts in Oregon of Implementing Proposed Department of Homeland Security No Match Immigration Rules
 Potential Economic Impacts in Oregon of Implementing Proposed Department of Homeland Security No Match Immigration Rules Prepared by: William K. Jaeger, Ph.D. Professor Department of Agricultural and Resource
Nebraska s Foreign-Born and Hispanic/Latino Population
 January 2011 Nebraska s Foreign-Born and Hispanic/Latino Population Socio-Economic Trends, 2009 OLLAS Office of Latino/Latin American Studies (OLLAS) University of Nebraska - Omaha Off i c e o f La t i
Labor Supply Factors and Labor Availability for the Fillmore County, Nebraska Labor Area
 Labor Supply Factors and Labor Availability for the Fillmore County, Nebraska Labor Area September 2018 Prepared by: Kenneth M. Lemke, Ph.D. Economist Nebraska Public Power District 1414 15 th Street -
California s Congressional District 37 Demographic Sketch
 4.02.12 California s Congressional District 37 Demographic Sketch MANUEL PASTOR JUSTIN SCOGGINS JARED SANCHEZ Purpose Demographic Sketch Understand the Congressional District s population and its unique
Queensland s Labour Market Progress: A 2006 Census of Population and Housing Profile
 Queensland s Labour Market Progress: A 2006 Census of Population and Housing Profile Issue No. 9 People in Queensland Labour Market Research Unit August 2008 Key Points Queensland s Labour Market Progress:
Post-Secondary Education, Training and Labour September Profile of the New Brunswick Labour Force
 Post-Secondary Education, Training and Labour September 2018 Profile of the New Brunswick Labour Force Contents Population Trends... 2 Key Labour Force Statistics... 5 New Brunswick Overview... 5 Sub-Regional
Immigrants are playing an increasingly
 Trends in the Low-Wage Immigrant Labor Force, 2000 2005 THE URBAN INSTITUTE March 2007 Randy Capps, Karina Fortuny The Urban Institute Immigrants are playing an increasingly important role in the U.S.
SPECIAL RELEASE. EMPLOYMENT SITUATION IN NATIONAL CAPITAL REGION January 2012 Final Results
 Republic of the Philippines NATIONAL STATISTICS OFFICE National Capital Region Number: 2013-07 SPECIAL RELEASE EMPLOYMENT SITUATION IN NATIONAL CAPITAL REGION January 2012 Final Results The Labor Force
Facts & Figures in this issue: income employment growth trends baby boomers millennials immigration
 Facts & Figures in this issue: income employment growth trends baby boomers millennials immigration 2017 Baby Boomers The term baby boomer refers to individuals born in the United States between 1946 and
Online Appendices for Moving to Opportunity
 Online Appendices for Moving to Opportunity Chapter 2 A. Labor mobility costs Table 1: Domestic labor mobility costs with standard errors: 10 sectors Lao PDR Indonesia Vietnam Philippines Agriculture,
New Americans in Houston
 New Americans in Houston A Snapshot of the Demographic and Economic Contributions of Immigrants in the Metro Area POPULATION 6.8M.6M Total population in 06 Immigrant population.% Immigrant share of the
Changing Dynamics and. to the United States
 Jeffrey S. Passel Pew Hispanic Center Changing Dynamics and Characteristics of Immigration to the United States International Symposium on International Migration and Development United Nations, Torino,
Latino Workers in the Ongoing Recession: 2007 to 2008
 Report December 15, 2008 Latino Workers in the Ongoing Recession: 2007 to 2008 Rakesh Kochhar Associate Director for Research, Pew Hispanic Center The Pew Hispanic Center is a nonpartisan research organization
COMMUNITY PROFILE TOWNSHIP OF LANGLEY. Township of Langley Immigrant Demographics I Page 1
 COMMUNITY PROFILE TOWNSHIP OF LANGLEY Township of Langley Demographics I Page 1 TOWNSHIP OF LANGLEY IMMIGRANT DEMOGRAPHICS Your quick and easy look at facts and figures around immigration. Newcomers are
Utah s Demographic Transformation
 Utah's Demographic Transformation: Implications for Education and Workforce 27 Council of Councils Southern Utah University Cedar City, Utah October 11, 27 Pamela S. Perlich, Ph.D. Senior Research Economist
COMMUNITY PROFILE BURNABY
 COMMUNITY PROFILE BURNABY Burnaby Demographics I Page 1 BURNABY IMMIGRANT DEMOGRAPHICS Your quick and easy look at facts and figures around immigration. Newcomers are an important and growing part of your
Hearing on: Submitted by: Jeffrey S. Passell. Washington, DCC
 NUMBERS, FACTS AND TRENDS SHAPING THE WORLD Written testimony submitted to U.S. Senate Committee on Homeland Security and Governmental Affairs Hearing on: Securing the Border: Defining the Current Population
Population and Dwelling Counts
 Release 1 Population and Dwelling Counts Population Counts Quick Facts In 2016, Conception Bay South had a population of 26,199, representing a percentage change of 5.4% from 2011. This compares to the
U.S. immigrant population continues to grow
 U.S. immigrant population continues to grow Millions 45 40 35 30 25 20 15 10 5 0 Source: PEW Research Center. All foreign-born immigrants Unauthorized immigrants 40.4 38.0 31.1 12.0 11.1 8.4 2000 2007
Appendix A: Economic Development and Culture Trends in Toronto Data Analysis
 Appendix A: Economic Development and Culture Trends in Toronto Data Analysis Introduction The proposed lenses presented in the EDC Divisional Strategy Conversation Guide are based in part on a data review.
Policy brief ARE WE RECOVERING YET? JOBS AND WAGES IN CALIFORNIA OVER THE PERIOD ARINDRAJIT DUBE, PH.D. Executive Summary AUGUST 31, 2005
 Policy brief ARE WE RECOVERING YET? JOBS AND WAGES IN CALIFORNIA OVER THE 2000-2005 PERIOD ARINDRAJIT DUBE, PH.D. AUGUST 31, 2005 Executive Summary This study uses household survey data and payroll data
The State of Rural Minnesota, 2019
 P.O. Box 3185 Mankato, MN 56002-3185 (507)934-7700 www.ruralmn.org The State of Rural Minnesota, 2019 January 2019 By Kelly Asche, Research Associate Each year, the Center for Rural Policy and Development
EMBARGOED UNTIL THURSDAY 9/5 AT 12:01 AM
 EMBARGOED UNTIL THURSDAY 9/5 AT 12:01 AM Poverty matters No. 1 It s now 50/50: chicago region poverty growth is A suburban story Nationwide, the number of people in poverty in the suburbs has now surpassed
Metro Atlanta Workforce:
 Metro Atlanta Workforce: Industries in Demand & Opportunity Occupations October, 2018 Atlanta Regional Commission For more information, contact: cdegiulio@atlantaregional.org In Sum In looking at a more
Recent Trends in the Market for Hired Farm Labor in the United States
 Recent Trends in the Market for Hired Farm Labor in the United States Steven Zahniser, U.S. Department of Agriculture, Economic Research Service, 1800 M Street NW, Rm. N5134, Washington, DC 20036-5831,
EPI BRIEFING PAPER. Immigration and Wages Methodological advancements confirm modest gains for native workers. Executive summary
 EPI BRIEFING PAPER Economic Policy Institute February 4, 2010 Briefing Paper #255 Immigration and Wages Methodological advancements confirm modest gains for native workers By Heidi Shierholz Executive
Occupational Fatalities Involving Hispanic Workers in the Construction Industry
 Open Journal of Safety Science and Technology, 2013, 3, 1-7 http://dx.doi.org/10.4236/ojsst.2013.31001 Published Online March 2013 (http://www.scirp.org/journal/ojsst) Occupational Fatalities Involving
The foreign born are more geographically concentrated than the native population.
 The Foreign-Born Population in the United States Population Characteristics March 1999 Issued August 2000 P20-519 This report describes the foreign-born population in the United States in 1999. It provides
Le Sueur County Demographic & Economic Profile Prepared on 7/12/2018
 Le Sueur County Demographic & Economic Profile Prepared on 7/12/2018 Prepared by: Mark Schultz Regional Labor Market Analyst Southeast and South Central Minnesota Minnesota Department of Employment and
Unemployment Rises Sharply Among Latino Immigrants in 2008
 Report February 12, 2009 Unemployment Rises Sharply Among Latino Immigrants in 2008 Rakesh Kochhar Associate Director for Research, Pew Hispanic Center The Pew Hispanic Center is a nonpartisan research
COMMUNITY PROFILE COQUITLAM. Coquitlam Immigrant Demographics I Page 1
 COMMUNITY PROFILE COQUITLAM Coquitlam Demographics I Page 1 COQUITLAM IMMIGRANT DEMOGRAPHICS Your quick and easy look at facts and figures around immigration. Newcomers are an important and growing part
Yukon Labour Market Supply and Migration Study
 Yukon Labour Market Supply and Migration Study Prepared by Millier Dickinson Blais for the Yukon Skills Table Final Report March 31, 2014 Millier Dickinson Blais: Yukon Labour Market Supply and Migration
CAEPR Indigenous Population Project 2011 Census Papers
 CAEPR Indigenous Population Project 2011 Census Papers Paper 10 Labour Market Outcomes Matthew Gray, a Monica Howlett b and Boyd Hunter c a. Professor of Public Policy and Director, CAEPR b. Research Officer,
Foreign Migration to the Cleveland-Akron-Lorain Metropolitan Area From 1995 to 2000
 EngagedScholarship@CSU Urban Publications Maxine Goodman Levin College of Urban Affairs 12-22-2005 Foreign Migration to the Cleveland-Akron-Lorain Metropolitan Area From 1995 to 2000 Mark Salling, m.salling@csuohio.edu
THE ECONOMIC EFFECTS OF ADMINISTRATIVE ACTION ON IMMIGRATION
 THE ECONOMIC EFFECTS OF ADMINISTRATIVE ACTION ON IMMIGRATION November 2014 Updated February 2015 Updated February 2015 In February 2015, the Department of Homeland Security (DHS) published a final rule
RESEARCH BRIEF: The State of Black Workers before the Great Recession By Sylvia Allegretto and Steven Pitts 1
 July 23, 2010 Introduction RESEARCH BRIEF: The State of Black Workers before the Great Recession By Sylvia Allegretto and Steven Pitts 1 When first inaugurated, President Barack Obama worked to end the
Gone to Texas: Migration Vital to Growth in the Lone Star State. Pia Orrenius Federal Reserve Bank of Dallas June 27, 2018
 Gone to Texas: Migration Vital to Growth in the Lone Star State Pia Orrenius Federal Reserve Bank of Dallas June 27, 2018 Roadmap History/Trends in migration to Texas Role in economic growth Domestic migration
SPECIAL RELEASE. EMPLOYMENT SITUATION IN NATIONAL CAPITAL REGION April 2013 Final Results
 Republic of the Philippines NATIONAL STATISTICS OFFICE National Capital Region Number: 2013-12 SPECIAL RELEASE EMPLOYMENT SITUATION IN NATIONAL CAPITAL REGION April 2013 Final Results The Labor Force Survey
Our Shared Future: U N D E R S T A N D I N G B O S T O N. #SharedFuture. Charting a Path for Immigrant Advancement in a New Political Landscape
 U N D E R S T A N D I N G B O S T O N Our Shared Future: Charting a Path for Immigrant Advancement in a New Political Landscape Wednesday, April 19 th, 2017 8:30-10:30 a.m. #SharedFuture U N D E R S T
SPECIAL RELEASE EMPLOYMENT SITUATION IN NATIONAL CAPITAL REGION. October 2015 Final Results
 REPUBLIC OF THE PHILIPPINES PHILIPPINE STATISTICS AUTHORITY NATIONAL CAPITAL REGION Number: 2016-08 Date Released: July 31, 2016 SPECIAL RELEASE EMPLOYMENT SITUATION IN NATIONAL CAPITAL REGION October
Economic Structure of Vancouver:
 Factsheet # 1.2 Economic Structure of Vancouver: Role of Vancouver in the Metro Vancouver Region Vancouver as a Regional Centre The city of Vancouver is the largest jobs and population centre in the Metro
Backgrounder. This report finds that immigrants have been hit somewhat harder by the current recession than have nativeborn
 Backgrounder Center for Immigration Studies May 2009 Trends in Immigrant and Native Employment By Steven A. Camarota and Karen Jensenius This report finds that immigrants have been hit somewhat harder
Patrick Adler and Chris Tilly Institute for Research on Labor and Employment, UCLA. Ben Zipperer University of Massachusetts, Amherst
 THE STATE OF THE UNIONS IN 2013 A PROFILE OF UNION MEMBERSHIP IN LOS ANGELES, CALIFORNIA AND THE NATION 1 Patrick Adler and Chris Tilly Institute for Research on Labor and Employment, UCLA Ben Zipperer
The Status of Women in Ventura and Santa Barbara Counties
 The Status of Women in Ventura and Santa Barbara Counties March 3, 2010 Foreword March, 2010 One hundred and fifty-three years ago, thousands of women garment workers marched to change their poverty level
Immigration and the U.S. Economy
 Immigration and the U.S. Economy Pia M. Orrenius, Ph.D. Federal Reserve Bank of Dallas June 19, 2007 Mercatus Center, George Mason University Disclaimer: The views expressed herein are those of the presenter;
SPECIAL RELEASE. EMPLOYMENT SITUATION IN NATIONAL CAPITAL REGION January 2014 Final Results
 Number: 2014-10 Date Released: July 30, 2014 SPECIAL RELEASE EMPLOYMENT SITUATION IN NATIONAL CAPITAL REGION January 2014 Final Results The Labor Force Survey (LFS) is a nationwide survey conducted quarterly
SPECIAL RELEASE. EMPLOYMENT SITUATION IN NATIONAL CAPITAL REGION July 2013 Final Results
 Republic of the Philippines NATIONAL STATISTICS OFFICE National Capital Region Number: 2014-01 Date Released: February 5, 2014 SPECIAL RELEASE EMPLOYMENT SITUATION IN NATIONAL CAPITAL REGION July 2013
Racial Inequities in Fairfax County
 W A S H I N G T O N A R E A R E S E A R C H I N I T I A T I V E Racial Inequities in Fairfax County Leah Hendey and Lily Posey December 2017 Fairfax County, Virginia, is an affluent jurisdiction, with
ECONOMIC IMPACT OF IMMIGRATION IN KANSAS CITY AND THE BI-STATE REGION
 ECONOMIC IMPACT OF IMMIGRATION IN KANSAS CITY AND THE BI-STATE REGION REPORT PREPARED BY: DR. DONNA K. GINTHER DIRECTOR, CSTEP PAT OSLUND, RESEARCH ASSOCIATE JEN BODEN, RESEARCH ASSISTANT Acknowledgements:
IDAHO AT A GLANCE. Community Impacts of Dairy Workers. Highlights. Background. May 2017, Vol. 8, No. 3. McClure Center for Public Policy Research
 McClure Center for Public Policy Research IDAHO AT A GLANCE Community Impacts of Dairy Workers May 2017, Vol. 8, No. 3 Highlights With its predominantly Hispanic workforce, south central s dairy industry
Bottom Line: Bridging the Labour Gap
 Bottom Line: Bridging the Labour Gap March 2018 Tourism HR Canada Published March 2018 Tourism HR Canada ISBN 978-1-55304-760-5 Copyright 2018 Tourism HR Canada. All Rights Reserved. Tourism HR Canada
How Have Hispanics Fared in the Jobless Recovery?
 How Have Hispanics Fared in the Jobless Recovery? William M. Rodgers III Heldrich Center for Workforce Development Rutgers University and National Poverty Center and Richard B. Freeman Harvard University
Far From the Commonwealth: A Report on Low- Income Asian Americans in Massachusetts
 University of Massachusetts Boston ScholarWorks at UMass Boston Institute for Asian American Studies Publications Institute for Asian American Studies 1-1-2007 Far From the Commonwealth: A Report on Low-
CENSUS RESULTS NATIONAL HOUSEHOLD SURVEY
 2011 CENSUS RESULTS NATIONAL HOUSEHOLD SURVEY INTRODUCTION The inaugural National Household Survey (NHS) was a voluntary survey which replaced the mandatory long-form census questionnaire. The NHS was
U.S. Hispanics & Immigration: A Demographer s View
 Jeffrey S. Passel Pew Hispanic Center Washington, DC The Economics of Immigration Construction Economics Research Network Washington, DC December 6, 2007 U.S. Hispanics & Immigration: A Demographer s View
Social and Demographic Trends in Burnaby and Neighbouring Communities 1981 to 2006
 Social and Demographic Trends in and Neighbouring Communities 1981 to 2006 October 2009 Table of Contents October 2009 1 Introduction... 2 2 Population... 3 Population Growth... 3 Age Structure... 4 3
How Important Are Labor Markets to the Welfare of Indonesia's Poor?
 Public Disclosure Authorized Public Disclosure Authorized Public Disclosure Authorized Public Disclosure Authorized S /4 POLICY RESEARCH WORKING PAPER 1665 How Important Are Labor Markets to the Welfare
IMMIGRANTS. Udall Center for Studies in Public Policy The University of Arizona
 ECONOMIC CONTRIBUTIONS of IMMIGRANTS IN THE UNITED STATES A Regional and State-by-State Analysis JUDITH GANS Udall Center for Studies in Public Policy The University of Arizona research support provided
Racial Inequities in Montgomery County
 W A S H I N G T O N A R E A R E S E A R C H I N I T I A T I V E Racial Inequities in Montgomery County Leah Hendey and Lily Posey December 2017 Montgomery County, Maryland, faces a challenge in overcoming
The Effects of Immigration on Age Structure and Fertility in the United States
 The Effects of Immigration on Age Structure and Fertility in the United States David Pieper Department of Geography University of California, Berkeley davidpieper@berkeley.edu 31 January 2010 I. Introduction
Population Estimates
 Population Estimates AUGUST 200 Estimates of the Unauthorized Immigrant Population Residing in the United States: January MICHAEL HOEFER, NANCY RYTINA, AND CHRISTOPHER CAMPBELL Estimating the size of the
Louisville: Immigration Rebirth Matt Ruther, Department of Urban and Public Affairs, University of Louisville
 Louisville: Immigration Rebirth Matt Ruther, Department of Urban and Public Affairs, University of Louisville Germantown. Schnitzelburg. Irish Hill. The names of neighborhoods within Louisville s urban
A Profile of CANADiAN WoMeN. NorTHerN CoMMuNiTieS
 A Profile of CANADiAN WoMeN in rural, remote AND NorTHerN CoMMuNiTieS DeMogrAPHiC Profile in 2006, the last census year for which data are currently available, approximately 2.8 million women resided in
CLACLS. A Profile of Latino Citizenship in the United States: Demographic, Educational and Economic Trends between 1990 and 2013
 CLACLS Center for Latin American, Caribbean & Latino Studies A Profile of Latino Citizenship in the United States: Demographic, Educational and Economic Trends between 1990 and 2013 Karen Okigbo Sociology
The Economic Impact of Spending for Operations and Construction in 2014 by AZA-Accredited Zoos and Aquariums
 The Economic Impact of Spending for Operations and Construction in 2014 by AZA-Accredited Zoos and Aquariums By Stephen S. Fuller, Ph.D. Dwight Schar Faculty Chair and University Professor Center for Regional
Demographic Data. Comprehensive Plan
 Comprehensive Plan 2010-2030 4 Demographic Data Population and demographics have changed over the past several decades in the City of Elwood. It is important to incorporate these shifts into the planning
BENCHMARKING REPORT - VANCOUVER
 BENCHMARKING REPORT - VANCOUVER I. INTRODUCTION We conducted an international benchmarking analysis for the members of the Consider Canada City Alliance Inc., consisting of 11 (C11) large Canadian cities
Over the past three decades, the share of middle-skill jobs in the
 The Vanishing Middle: Job Polarization and Workers Response to the Decline in Middle-Skill Jobs By Didem Tüzemen and Jonathan Willis Over the past three decades, the share of middle-skill jobs in the United
11. Demographic Transition in Rural China:
 11. Demographic Transition in Rural China: A field survey of five provinces Funing Zhong and Jing Xiang Introduction Rural urban migration and labour mobility are major drivers of China s recent economic
Foreign-born Share of Total Population and Labor Force, Civilian labor force age
 484009NLF Foreign-born Share of Total Population and Labor Force, 1970-2010. 18.00 16.4 13.50 9.00 4.50 4.9 4.8 Civilian labor force age 16-64 6.6 6.2 9.3 7.9 12.6 11.1 12.9 Total Popula on 0.00 1970 1980
8AMBER WAVES VOLUME 2 ISSUE 3
 8AMBER WAVES VOLUME 2 ISSUE 3 F E A T U R E William Kandel, USDA/ERS ECONOMIC RESEARCH SERVICE/USDA Rural s Employment and Residential Trends William Kandel wkandel@ers.usda.gov Constance Newman cnewman@ers.usda.gov
Research Brief Issue RB02/2018
 Research Brief Issue RB02/2018 The Northern Territory s non-resident workforce in 2016 Ms Anita Maertens Northern Institute/College of Indigenous Futures, Arts and Society anita.maertens@cdu.edu.au Dr
BY Rakesh Kochhar FOR RELEASE MARCH 07, 2019 FOR MEDIA OR OTHER INQUIRIES:
 FOR RELEASE MARCH 07, 2019 BY Rakesh Kochhar FOR MEDIA OR OTHER INQUIRIES: Rakesh Kochhar, Senior Researcher Jessica Pumphrey, Communications Associate 202.419.4372 RECOMMENDED CITATION Pew Research Center,
Mohave. Coconino. Yavapai. La Paz. Gila. Greenlee. Graham Pinal. Maricopa Yuma. Santa Cruz. Judith Gans
 o Coconino Na va j Mohave Ap ach e Yavapai La Paz Greenlee Gila IMMIGRANTS in ARIZONA Maricopa Yuma Graham Pinal Fiscal and PimaEconomic Impacts Santa Cruz is Coch e Judith Gans Udall Center for Studies
LEFT BEHIND: WORKERS AND THEIR FAMILIES IN A CHANGING LOS ANGELES. Revised September 27, A Publication of the California Budget Project
 S P E C I A L R E P O R T LEFT BEHIND: WORKERS AND THEIR FAMILIES IN A CHANGING LOS ANGELES Revised September 27, 2006 A Publication of the Budget Project Acknowledgments Alissa Anderson Garcia prepared
Understanding Immigration:
 Understanding Immigration: Key Issues in Immigration Debates and Prospects for Reform Presented by Judith Gans Immigration Policy Project Director judygans@email.arizona.edu Udall Center Immigration Program
DRAFT, WORK IN PROGRESS. A general equilibrium analysis of effects of undocumented workers in the United States
 DRAFT, WORK IN PROGRESS A general equilibrium analysis of effects of undocumented workers in the United States Marinos Tsigas and Hugh M. Arce U.S. International Trade Commission, Washington, DC, USA 14
Labor Force Characteristics by Race and Ethnicity, 2015
 Cornell University ILR School DigitalCommons@ILR Federal Publications Key Workplace Documents 9-2016 Labor Force Characteristics by Race and Ethnicity, 2015 Bureau of Labor Statistics Follow this and additional
Population. Table Population Growth and Region of Influence,
 3.11 SOCIOECONOMICS 3.11.1 Environmental Setting The environmental setting for this section presents the baseline population, employment, and housing conditions in the vicinity of the Port of Long Beach.
New Findings on the Fiscal Impact of Immigration in the United States
 New Findings on the Fiscal Impact of Immigration in the United States Pia Orrenius Federal Reserve Bank of Dallas Research Department Working Paper 1704 New Findings on the Fiscal Impact of Immigration
Immigrants and the Restructuring of the Boston Metropolitan Workforce,
 Institute for Immigration Research Immigrants and the Restructuring of the Boston Metropolitan Workforce, 1970-2010 Erin M. Stephens, Justin P. Lowry and James C. Witte JUNE 2015 1 Immigrants and the Restructuring
Pulling Open the Sticky Door
 Pulling Open the Sticky Door Social Mobility among Latinos in Nebraska Lissette Aliaga-Linares Social Demographer Office of Latino/Latin American Studies (OLLAS) University of Nebraska at Omaha Overview
NEW MEXICO DEMOGRAPHICS:
 NEW MEXICO DEMOGRAPHICS: PAST, PRESENT, AND FUTURE FOR-UNM February 7 th, 2014 Albuquerque, NM Jack Baker, PhD Senior Research Scientist Geospatial and Population Studies University of New Mexico PRESENTATION
Economic Linkages and Impact Analysis for the Oregon Sea Grant Programmed and Operated Hatfield Marine Science Center Visitor Center
 Economic Linkages and Impact Analysis for the Oregon Sea Grant Programmed and Operated Hatfield Marine Science Center Visitor Center Oregon State University Extension Service June 2017 Bruce Sorte, Extension
Part 1: Focus on Income. Inequality. EMBARGOED until 5/28/14. indicator definitions and Rankings
 Part 1: Focus on Income indicator definitions and Rankings Inequality STATE OF NEW YORK CITY S HOUSING & NEIGHBORHOODS IN 2013 7 Focus on Income Inequality New York City has seen rising levels of income
Nearly 12 million unauthorized immigrants live in the United States. California is home
 Immigrant Legalization Assessing the Labor Market Effects Laura E. Hill Magnus Lofstrom Joseph M. Hayes AP Photo/SilvAnA XimenA Summary Nearly 12 million unauthorized immigrants live in the United States.
The Consequences of Legalization Versus Mass Deportation in Nevada. Findings and Methodology. Dr. Raúl Hinojosa-Ojeda W W W.AMERICANPROGRESS.
 AP PHOTO/JULIE JACOBSON The Consequences of Legalization Versus Mass Deportation in Nevada Findings and Methodology Dr. Raúl Hinojosa-Ojeda August 2012 W W W.AMERICANPROGRESS.ORG The Consequences of Legalization
The Impact of Interprovincial Migration on Aggregate Output and Labour Productivity in Canada,
 The Impact of Interprovincial Migration on Aggregate Output and Labour Productivity in Canada, 1987-26 Andrew Sharpe, Jean-Francois Arsenault, and Daniel Ershov 1 Centre for the Study of Living Standards
Riverside Labor Analysis. November 2018
 November 2018 The City of Labor Market Dynamics and Local Cost of Living Analysis Executive Summary The City of is located in one of the fastest growing parts of California. Over the period 2005-2016,
Rural and Urban Migrants in India:
 Rural and Urban Migrants in India: 1983-2008 Viktoria Hnatkovska and Amartya Lahiri July 2014 Abstract This paper characterizes the gross and net migration flows between rural and urban areas in India
Characteristics of People. The Latino population has more people under the age of 18 and fewer elderly people than the non-hispanic White population.
 The Population in the United States Population Characteristics March 1998 Issued December 1999 P20-525 Introduction This report describes the characteristics of people of or Latino origin in the United
The Economic Impact of Spending for Operations and Construction by AZA-Accredited Zoos and Aquariums
 The Economic Impact of Spending for Operations and Construction by AZA-Accredited Zoos and Aquariums Prepared for The Association of Zoos and Aquariums Silver Spring, Maryland By Stephen S. Fuller, Ph.D.
Evaluating Methods for Estimating Foreign-Born Immigration Using the American Community Survey
 Evaluating Methods for Estimating Foreign-Born Immigration Using the American Community Survey By C. Peter Borsella Eric B. Jensen Population Division U.S. Census Bureau Paper to be presented at the annual
ECONOMY MICROCLIMATES IN THE PORTLAND-VANCOUVER REGIONAL ECONOMY
 MICROCLIMATES IN THE PORTLAND-VANCOUVER REGIONAL by Sheila Martin, Director of the Institute of Portland Metropolitan Studies, Portland State University 1 Introduction The Regional Labor Market Portland-Vancouver