Urbanization in Indonesia
|
|
|
- Norman Stanley
- 6 years ago
- Views:
Transcription
1
2 UNFPA Indonesia Monograph Series: No.4 Urbanization in Indonesia SEPTEMBER 2015
3 CONTRIBUTORS Authored by: Emeritus Professor Gavin Jones (Australian National University, Canberra and Murdoch University, Perth) Wahyu Mulyana (Executive Director, Urban and Regional Development Institute, Jakarta) DISCLAIMER: Funding for this work was provided by UNFPA, the United Nations Population Fund. The findings, interpretations and conclusions presented in this document are those of the authors, not necessarily those of UNFPA, and do not reflect the policies and positions of the Government of Indonesia.

4 Foreword Urbanization in Indonesia, as in most developing countries today, is rapid, the population as a whole. The next 25 years will see this process continue, with a growing majority of the population living in urban environments and the rural population declining in absolute numbers. Urbanization has the potential to usher in a new era of well-being, resource home to high concentrations of poverty; nowhere is the rise of inequality clearer than in urban areas, where wealthy communities coexist alongside, and separated from, slums and informal settlements. If not managed well, urbanization can put considerable pressure on urban infrastructure and social services, such as housing, education, health care, electricity, water and sanitation and transportation. UNFPA, the United Nations Population Fund, works with partners in Government, the UN system and civil society to advocate for the welfare and sustainability of rapidly urbanizing communities. UNFPA believes that people who move to urban areas should have access to essential social services. In Indonesia, women of reproductive age and young people make up large numbers of those moving to urban centres each year. Such groups require special attention from policymakers to ensure that they retain access to social support systems such as education and healthcare, including reproductive health care. economic corridors occurs in a way that is socially equitable and environmentally sustainable. This will protect the Indonesian population from some common social ills that often accompany accelerated economic development and urbanization. The formulation and implementation of good population development policy depends on policymakers having a true understanding of the way population-related factors are causally connected in the real world, and on widespread access to good population data. This will ensure population and development policies are evidencebased and will help minimize the risk of undesirable and unintended consequences. Therefore UNFPA, as the United Nations development agency concerned with population and development issues, has developed a strong strategic partnership with Government of Indonesia agencies concerned with the collection and use of population data in the country. The monograph on Urbanization in Indonesia is the fourth monograph in this series. It makes extensive use of academicians, and practitioners with the most up-to-date information about Indonesia s urbanization situation. This monograph is a reservoir of knowledge, it entails a compendium analysis of urbanization trends and other socio-demographic outcomes, and a literature review which highlights the inter-relationship between demographic and social change on the one hand, and policies on the other hand. The monograph also recommendations that development policies pay more attention to current urbanization patterns in Indonesia, to make sure migration and urbanization contribute in the best way possible to growth and socio-economic development in Indonesia. iii
5 I would like to thank the authors, Professor Gavin W. Jones and Mr. Wahyu Mulyana for their expertise in researching, its production. In this regard, I especially thank colleagues from the Population and Development Unit, headed by technical assistance to the authors, and Ms Jumita Siagian and Ms Meilawati Maya Dewi for their administrative support. My gratitude also goes to the Advocacy and Communications Unit, Mr Samidjo and Ms Satya Nugraheni for their timely support in ensuring the quality of the monograph s layout and printing. Urbanization Monograph Validation Meeting, held on 5 August For this, my special gratitude goes to the four panel discussants, Professor Tommy Firman of the Regional and Rural Planning Research Group from the Bandung University of Indonesia; Dr Sukamdi of the Centre for Population and Policy Studies, University of Gadjah Mada; and Finally, I wish to thank BPS-Statistics Indonesia for the access to a wide range of data, the 2010 Population Census In conclusion, we are honoured to introduce this compendium publication with an in-depth look into urbanization, which is now a topic of interest among policy makers, academicians, development partners and practitioners Jakarta, September 2015 Jose Ferraris UNFPA Representative iv
6 Contents Foreword... Contents... iii v Acknowledgements... viii Abbreviations And Acronyms... Introduction... ix xi Chapter 1. POPULATION MOBILITY, URBANIZATION AND DEVELOPMENT 1 Chapter 2. URBANIZATION TRENDS Chapter 3. CHARACTERISTICS OF INDONESIA S RURAL AND URBAN POPULATIONS Chapter 4. MIGRATION FLOWS TO AND FROM URBAN AREAS Chapter 5. INDONESIA S MEGA-URBAN REGIONS Chapter 6. CITY SIZE DISTRIBUTIONS NATIONALLY AND BY PROVINCE Chapter 7. JABODETABEK (or JABODETABEKPUNJUR) INDONESIA S FOREMOST MEGA-UBRAN REGIONS Chapter 8. CONCLUSIONS AND RECOMMENDATIONS References Glossary Appendix Tables v
7 LIST OF TABLES Distribution of the employed population across broad industry sectors, Proportion of the GDP and of employment in each sector, 2010 Number and percentage of urban and rural villages in Indonesia, Urban growth and trends in urbanization, Percentage of urban population by province, Growth of Indonesia s largest cities (populations above 500,000), Wanted fertility rates for the three years preceding the survey, 2012 Indonesia s largest cities, average number of household members, Percentage of the population who have never attended school, by age group, across urban and rural areas, 2010 Percentage of educational attainment of household population, 2012 Percentage of educational attainment, population aged 15+, 2010 Population aged 10 years and over who worked during the previous week by main industry, urban and rural areas, 1990 Population aged 10 years and over who worked during the previous week by main industry, urban and rural areas, 2000 Population aged 15 years and over who worked during the previous week by main industry, urban and rural areas, 2010 Percentage of the distribution of the de jure population by wealth quintiles, by residence, 2012 residence, Indonesia, 2012 Lifetime and recent migrants as percentage of total population, urban and rural areas, selected provinces, 2010 Age structure of recent migrants and non-migrants, selected provinces, 2010 Million cities in Indonesia populations of cores and core plus inner zone, and average score of desa included in core and inner zone, 1995 Indonesian mega-urban regions: urban and rural populations in sub-regions, 2010 Population of Indonesia s major mega-urban regions, 2010 Population growth in core and periphery of Indonesian mega-urban regions, Decomposition of growth rates in four major metropolitan regions, Percent of national GDP by metropolitan areas in Java, 2010 Percentage of the urban population by city size class and major island, 2010 Indonesia: Four city primacy index vi
8 4-city primacy index for main island groups and provinces, 2010 Alternative estimates of the population of Jakarta urban agglomeration, Population trends in DKI Jakarta Five-year in-and out-migrants, DKI Jakarta, (in thousands) Main source and destination provinces of migrants to and from DKI Jakarta, Sex ratio of recent migrants to Jakarta MUR by age group and zone, Jabodetabek: percentage of lifetime and recent migration status of the population aged 5+, 2010 DKI Jakarta: trends in recent migration and sources of migrants, Projections of the urban population in Indonesia LIST OF FIGURES Figure 2.1. Increase in rural and urban villages in the period Figure 2.2. Trends in percentage of population living in urban areas, Figure 3.1. Urban and rural age pyramids, 2010 Percentage of lifetime migrants who live in the urban areas, 2010 Maps of the main mega-urban regions in Indonesia Mebidangro Palembang Raya Jabodetabek Punjur Bandung Raya Kedungsepur Gerbangkertosusila Sarbagita Maminasata Figure 6.1. Figure 7.1. Trend of Urban Sprawl in Cekungan Bandung Small and medium urban centres in Indonesia (Population 100,000 to 1 million) Figure 7.2. New residential developments in Jabodetabek, 2010 Figure 7.3. Age pyramid for DKI Jakarta 2010 Jakarta Mega-Urban Region 2010: Percentage of year olds who have completed junior highschool or less Jakarta Mega-Urban Region 2010: Percentage of year olds who have completed tertiary education vii
9 Acknowledgements from the 2010 Population Census and their policy implications be made widely available. When approached by UNFPA to prepare the monograph on urbanization, we were happy to agree, both because of the key importance of the subject for Indonesian planners, and because of the strong backup we knew we would receive from UNFPA Jose Ferraris, or Pak Pepe as we know him, for his guidance and assistance in developing the content and outline assistance and were always ready to respond to our queries. An important stage in the preparation of the monograph was the Validation Workshop. The authors are indebted to for their invaluable suggestions for improvement of the draft that was presented at the Validation Workshop. We acknowledge the assistance of BPS-Statistics Indonesia in making data available and maintaining their welldeserved reputation, both in Indonesia and internationally, for user-friendly policies with regard to access to census data. This ready access to data is important in enabling researchers to contribute to timely and evidence-based government policy making, and is much appreciated. because they were responsible for much careful checking of data and maps, enabling new information on city and town populations to be presented in the Monograph and some comparisons to be made between 2000 and 2010 urbanization data. Special thanks are due to Mr. Joihot Rizal Tambunan (URDI) for his assistance on spatial analysis of population data and Mr. Adriyanto Adriyanto (Phd student at the Australian National University) for his assistance in data collection and compilation. Finally, we wish to thank Ms. Meilawati Maya Dewi for her outstanding administrative and secretarial assistance at all stages of the work. The responsibility for errors and omissions rests entirely with us. Comments and criticisms would be welcome and should be directed to us. Canberra and Murdoch University, Perth Urban and Regional Development Institute, Jakarta Jakarta, September 2015 viii
10 Abbreviations And Acronyms AI ANU BAPPENAS BKSP BPS DHS DKI ESCAP GDP GHG IDR IKK Krismon KSN KSPN MUR NO NO2 NTT NUDS PM10 RTRWN SAPOLA SE SUPAS SUSENAS TFR UN UNFPA URDI USD WHO Agglomeration Index Australian National University Badan Perencanaan Pembangunan Nasional (National Development Planning Agency) Badan Kerjasama Pembangunan (Jabodetabek Development Cooperation Agency) Badan Pusat Statistik (Statistics Indonesia) Daerah Khusus Ibukota (Capital Special Region) Gross Domestic Product The Surabaya mega-urban region: Gresik, Bangkalan, Mojokerto, Surabaya, Sidoardjo, Lamongan Indonesia Rupiah Ibukota Kabupaten (District Capital Town) The Jakarta mega-urban region: Jakarta, Bogor, Depok, Tangerang, Bekasi The Semarang mega-urban region: Kendal, Ungaran, Semarang, Purwodadi Krisis Moneter (Monetary Crisis) Kawasan Strategic Nasional (National Strategic Areas) Kebijakan dan Strategi Perkotaan Nasional (National Urban Strategy and Policy) The Makasar mega-urban region: Makasar, Maros, Sungguminasa, Takalar The Medan mega-urban region: Medan, Binjai, Deli Serdang, Karo Mega-Urban Regions Nitrogen Dioxide National Urban Development Strategy Particulate Matter up to 10 micrometers in size Particulate Matter up to 2.5 micrometers in size Rencana Tata Ruang Wilayah Nasional (National Spatial Plan) Slum Alleviation Policy and Action Plan The Den Pasar mega-urban region: Den Pasar, Badung, Gianyar, Tabanan Survei Penduduk Antar Sensus (The Intercensal Population Surveys) Total Fertility Rate United Nations United Nations Population Fund Urban and Regional Development Institute US Dollar ix
11 x
12 Introduction Indonesia has recently achieved a key milestone: the percentage of population living in urban areas has now passed 50 per cent. As this percentage is expected to keep increasing, we can safely conclude that never again will the majority of Indonesia s population live in rural areas. Instead, the majority will be living in a range of urban settlements, such as small towns, larger towns, cities and mega-urban regions (MUR). This has important implications not only for the kind of lives Indonesian people will live, but also for the planning issues facing government. of urban areas, and discuss particular issues facing Indonesia s mega-urban areas. These issues include infrastructure needs, liveability, sustainability and environmental concerns. This report will then provide a series of conclusions and policy recommendations, with a view to informing planning and practice for Indonesia s development in the future. them as one or the other. Aside from this, even areas that might be considered truly rural are now linked to urban areas through communications such as television, mobile phones, and better public transportation permeated rural areas in such a way that estimates of the Indonesian population living in rural areas currently at 50 per cent need to be carefully interpreted. the context of cross-country analysis, or to determine the aggregate urbanization status of a region. Whilst international reporting and comparison between urban populations can elicit a degree of conformity, it can also be misleading (Alkema et al, 2014; McGranahan and Satterthwaite, 2014). As the sophistication and the density of populations, independent of administrative functions. Attempts to develop and apply more was taken for the World Bank s 2009 World Development Report (Uchida and Nelson 2010; World Bank 2009). The resulting adjustments suggest that part of the explanation for Asia not being much more urban than Africa despite higher incomes per capita is that some of the key countries including India have xi
13 xii
14 1
15 1. What is urbanization? increase in the proportion of a population living in urban areas. If population growth in a country is 2 per cent per annum, for example, and the growth of the urban population is also 2 per cent per annum, urbanization is not taking place. If, on the other hand, the urban population is increasing by 4 per cent per annum in a country where population growth is 2 per cent per annum, then urbanization an increase in the urban share of the total population is taking place. In this example an annual increase of 4 per cent in the urban population there are of the urban population through an excess of births over deaths in urban areas. The was formerly considered rural now meets the criteria for being considered urban. It is growth in the 1990s, accounting for around per cent (Firman et al, 2007: 444). These three categories may seem clear-cut, but in some ways they are not. Consider, for example, migration and natural increase. Net migration contributes directly to urban growth, but once the migrants are settled, their children born in a city add to the natural increase of the urban population. The contribution of migration to urban population increase of the rural population also contributes to the overall size of the rural population, through which rural-urban migrants are drawn. In this sense, the natural increase of the rural population fuels rural-urban migration. 2. Theoretical perspectives on the interrelationship between population mobility, urbanization, changing employment structure and development 2 As they undergo economic development, countries tend to experience a gradual shift in economic activity, and hence in population distribution towards urban areas. This is because development normally involves a decline in agriculture and a rise in industry and services. Industry and services can and do, of course, take place in rural areas, but their key concentration is in urban areas. Typically, product per worker is considerably higher in the industrial and services sectors than in agriculture. Whereas agriculture might be producing 30 per cent of national product, for example, it might employ over 50 per cent of the workforce. Gradually, however, as industry and services expand, surplus labour is drawn away from agriculture, and productivity in agriculture rises, partly out of necessity as rural wages are driven up by a growing shortage of labour in the sector. In many cases, this transformation of the workforce has demographic as well as economic underpinnings. Fertility rates frequently fall as economic development proceeds, and
16 over time, young cohorts entering the workforce stop increasing in size, and eventually begin to contract. If economic development is rapid enough, the absorption of labour in other sectors leads to a shortage of workers in agriculture, driving up wages and requiring productivity advances in the sector if they have not already been taking place. 3. The role of population mobility, urbanization and changing employment structure in Indonesian development since the 1960s (see Table 1.1). In 1971, 66 per cent of the workforce was in employed in primary industry (mainly agriculture), 10 per cent in industry and 24 per cent in services. By 2010, these ratios had changed greatly; 38 per cent in agriculture, 19 per cent in industry and 42 per cent in services. TABLE 1.1., Sector Agriculture Industry Services Total Source Note These changes were accompanied by considerable population redistribution through migration. The transmigration program played a major role in this up to the 1980s, oriented primarily on shifting people from agriculture in Java and Bali to the outer islands of Sumatra and Kalimantan, and to a lesser extent to Sulawesi and Papua. The program peaked in the 1970s, resulting in a substantial net shift of the Indonesian population to those under the transmigration program was much more oriented towards nonagricultural jobs in towns and urban centres. In all provinces except Lampung, the percentage of in-migrants living in urban areas in 1980 was higher and frequently much higher than the proportion of the total population already living in urban areas. As well as spontaneous and planned migration patterns, a lot of movement throughout this period was to cities in Java. For example, whilst Sumatra was a major focus of the migrants was emphatically directed to urban centres, thus nullifying to some extent the 3
.")
17 patterns of migration have been dependant on the economic interests of individuals and families, though in some cases for example, out-migration from West Kalimantan it has been triggered by communal violence (Tirtosudarmo, 2007; Davidson, 2008). As will be discussed extensively in this report, the heavy focus on urban areas has continued to the share of people moving to urban compared to rural areas was double, and for interprovincial migrants, it was triple. Amongst inter-district migrants (the largest group of migrants), the share in urban areas was 1.7 times as high as that in rural areas (Muhidin, a share of recent migrants exceeding 10 per cent of the population and thus have high levels of urbanization the pattern is much more mixed elsewhere (Muhidin, 2014: 330). Regarding employment structure, there has been a substantial shift from agriculture toward industry and services as a share of GDP, although less as a share of employment. This is characteristic of most countries as they develop. As shown in Table 1.2, production per worker is much higher in the industry than in services sector, and in turn much higher in services than in agriculture. It is anticipated that increases in product per head in Indonesia could result from increases in any of these three sectors, but further shifts of labour from agriculture to other sectors would likely be a major component of increases to overall productivity. As shown in Table 1.3, the industry sector grew much faster than 4
18 TABLE 1.2. Sector Employment ( 000) GDP (billion rupiah) Production per worker (million rupiah) Agriculture 42, , Industry* 18,348 3,028, Services 44, , ,928 6,446, Source: BPS online data. *Includes mining, manufacturing, construction, utilities, transport and communication. TABLE 1.3. Average annual growth rate % of GDP GDP Agriculture Industry Services Source: World Bank, successive issues of World Development Indicators. The urbanization that has accompanied this change in economic structure was slow to produce very large cities in Indonesia, and was characterized by continuing links city in Indonesia had reached a population of one million by 1950, with Jakarta reaching this mark in mid-1948 (Dick, 2003: 122-3). Surabaya s population reached one million only in 1958, then grew to almost two million in 1968, before falling to 1.5 million in 1970 as a result of a crackdown on squatter settlements and itinerants (Peters, 2013: 72-3). In the case of Jakarta, growth over the 1950s was spectacular, reaching a population of almost 3 million by 1961, and 8 million by The large contribution of migration to the swelling of Indonesian city populations from the 1950s onwards meant that even by the year 2000, only a relatively small proportion of city dwellers were entirely divorced from their rural roots. This was evident in the large-scale emptying of these cities over Lebaran, as vast numbers returned to their 4. Brief survey of recent developments krismon (monetary crisis) or kristal (total crisis) had largely been resolved by the beginning of the 21st century, and the decade was one of political consolidation, government decentralization and steady economic development, albeit at a pace that could not match that of China or India. 5
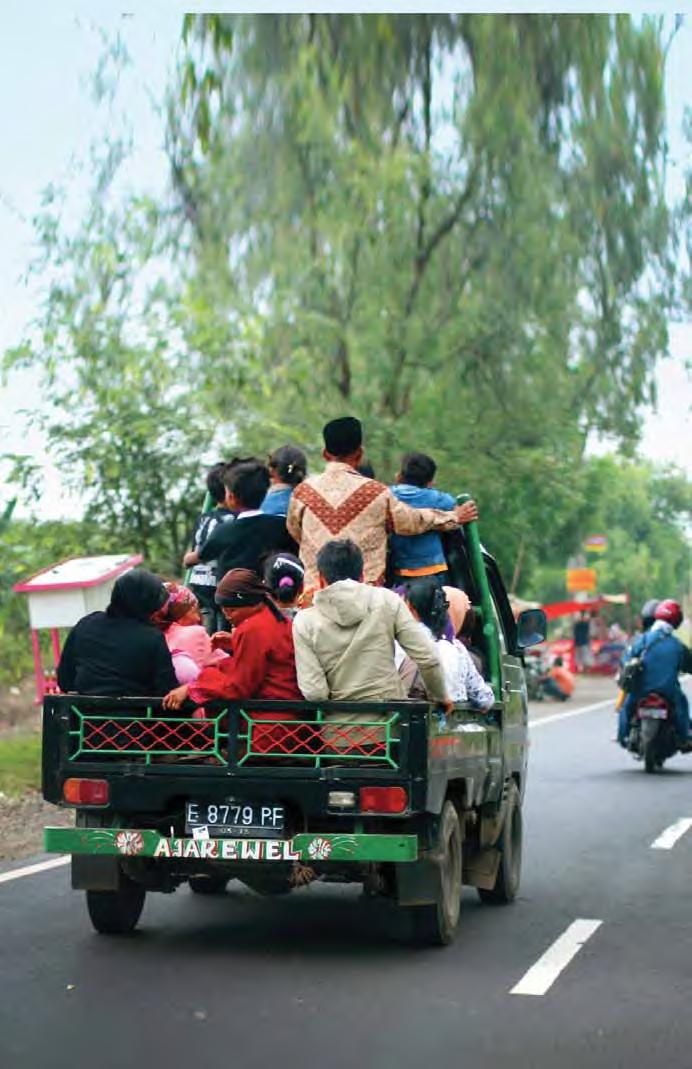
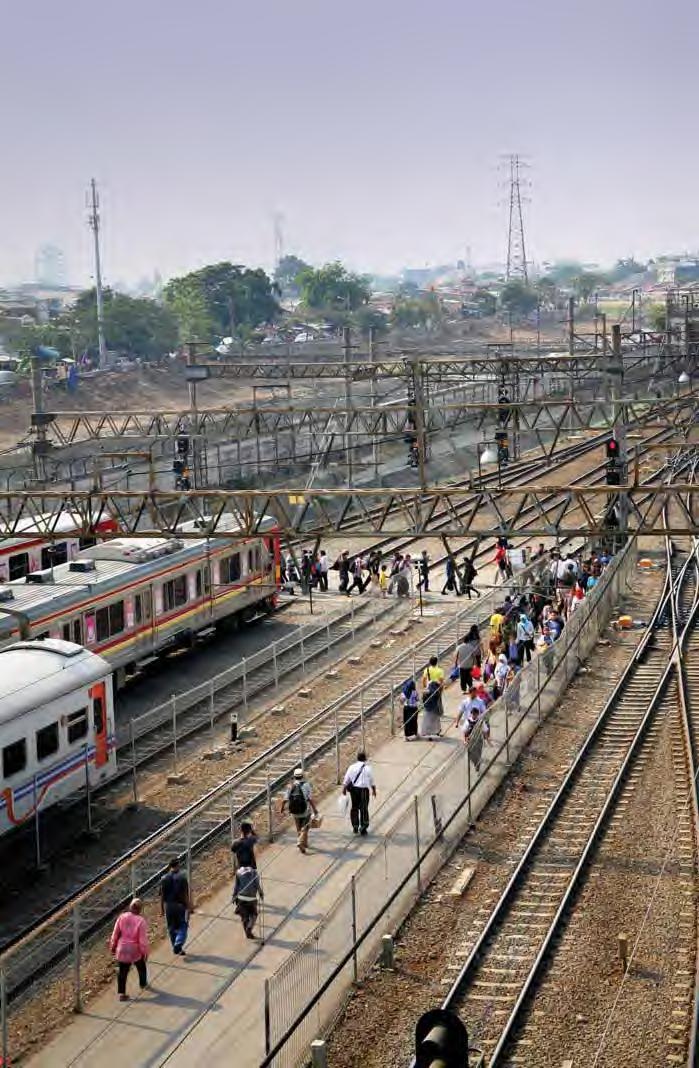
19 G4.2), car ownership increased from 3 million vehicles in 2000 to 9.7 million in 2010 (or by 12 percent annually), and motorcycle ownership increased at a double digit rate. By 2012, there were 77.8 million registered motorcycles in Indonesia, one for every two adults, making up 82.4 per cent of all registered vehicles. Motor vehicle ownership in Indonesia has also been increasing dramatically; by 23 per cent nationally between 2011 and 2013, 26 per cent in Jakarta, 56 per cent in Banten and 37 per cent in West Java (BPS, 2014, Table ). By contrast, infrastructure development has lagged; with no new railways being built, roads and ports becoming congested and poorly maintained, no development of a trans- Java freeway, and inter-provincial shipping facilities remaining poorly developed. Indeed, amongst the largest cities in the world, Jakarta is matched only by Dhaka in having no subway or light rail system. The structure of employment in Indonesia also is not yet consistent with middle-income country status. Low value-added sectors such as social and personal services and wholesale and retail trade create the most jobs, and the informal sector is still large. According to World Bank estimates, over 60 percent of workers are either self-employed, casual workers, unpaid family workers, or employers who hire temporary workers. Amongst the rest of the workforce, only around 35 percent of employees have written contracts (World Bank, 2015: 18). Access to means of communication has continued to change dramatically in Indonesia. Most notably, mobile phone usage has become almost universal. In 2013, there was exactly one mobile phone for every Indonesian, including children. Jakarta had the highest Twitter use among the world s cities, and was the second highest usage of Facebook. 6
20 CHAPTER
21 1. Data issues in studying urbanization in Indonesia: The criteria for being a municipality in Indonesia has changed over time, but there remains considerable inertia in according municipal status. This means that historical factors certain towns as kota administratip. As outlined by Milone (1966): The regency or kabupaten towns the administrative seats of them bupatis which in some instances can at the same time be residency capitals, are also in the majority of cases without municipality status. This is true even in the instances in which they have over 50,000 population, as is the case for some of these cities on Java. Such kabupaten seats as Tjiandjur (62,546 inhabitants), Garut (76,244), Tasikmalaya (125,525), Purwokerto (80,556), Tjilatjap (55,333), Kudus (74,911), Djember (94,089), and Banjuwangi (72,467) have been denied municipality status to date. Since all these cities are on Java, the reason appears to lie in the political pressure to have a certain number of municipalities in newly-developing regions. At the same time it would appear that there is a desire to limit the number of municipalities on Java so that this kind of city will have equal representation throughout Indonesia (Milone, 1966: 66). While this explanation still appears to have considerable force perhaps more as a result dominance of West Sumatran towns among those which have long been recognized as kota madya. For example, amongst the towns which had not gained kota administratip status in 1980, a long list from Java with substantial populations could be found, including Cianjur, Majalaya, Purwakarta, Serang, Karawang, Pemalang, Kudus, Bojonegoro, Tulung Agung, Jombang, Banyuwangi and Situbondo. All of these are much more populous than towns in West Sumatra, such as Payakumbuh, Padang Panjang, Solok and Sawahlunto urban or rural status to each of the 77,126 desa (village, or kelurahan) in Indonesia. Indonesia as urban, and 79.5 per cent as rural. The average population of urban desa was considerably larger than that of rural desa. The number and proportion of urban and rural desa in each province is outlined in Table 2.1, and the trend between the number of urban and rural villages between 2000 and 2010 is summarized in Figure 2.1. A few comments are in order. Firstly, the share of urban desa is generally higher in the provinces of Java-Bali (mostly in the per cent range), consistent with a higher level of urbanization. Comparatively, the share of urban desa in the more isolated provinces of West and Central Sulawesi and Central Kalimantan is well below 10 per cent, particularly 8
22 so in West Papua and Papua (only 2-3 per cent). It is striking that all nine provinces in Sulawesi, Southeast Sulawesi, West Sulawesi, North Maluku, West Papua and Papua. This There are also some apparent anomalies in the data, such as the much higher proportion of urban villages in West Sumatra than in other Sumatran provinces. TABLE 2.1: No Province % of villages Number % of villages Number of villages Urban Rural of villages Urban Rural Total Urban Rural 1 Aceh North Sumatera West Sumatera Riau Jambi South Sumatera Bengkulu Lampung Bangka Belitung * * Riau Islands * * Jakarta West Java Central Java Banten * * Bali W Nusa Tenggara West Kalimantan Cent Kalimantan S Kalimantan North Sulawesi Central Sulawesi Gorontalo * *

23 No Province % of villages Number % of villages Number of villages Urban Rural of villages Urban Rural Total Urban Rural 29 W Sulawesi * * Maluku North Maluku * * West Papua * * Papua Indonesia Source: BPS, *Not yet provinces in
24 FIGURE 2.1. determining the urban and rural status of a village. The National Development Planning Board (Bappenas) uses three administrative categories of urban areas referred to in Law No. 32/2004 on Local Governance (administrative decentralization). These include: i) urban areas as autonomous regions, known as city governments (kota), ii) urban areas within district boundaries (district capital towns), and iii) urban areas spilling over into one or more adjacent administrative areas. The procedure to have an urban area kota is quite complex, involving a proposal from the provincial parliament kota based on population size determined through an urban city with a population above 1 million, ii) large city with a population between 500,000 to 1 million, iii) medium city with a population between 100,000 to 500,000, and iv) small city with a population between 50,000 to 100,000. Thirty-four of Indonesia s kota were established in the period since decentralization ( ), and their number is likely to increase in the future as a result of the continued upgrading of district capital towns (ibukota kabupaten, or IKK) to kota in order to provide them with an administrative powers commensurate with their population size and economic importance, thus separating them from their former districts. The number of IKK may also increase as a result of further subdivision of districts. 11
25 2. Trends in the level of urbanization Urbanization in Indonesia has increased steadily over time (see Figure 2.2 and Table 2.2). 17 per cent, compared to 22 per cent in FIGURE 2.2. Source: Population Censuses, 1971, 1980, 1990, 2000 and changes in the nature of the Indonesian economy and society. In only 30 years, Indonesia transformed from a nation with less than one quarter of its population living in urban areas, to one where half the population lived in urban areas. Not only this, but the urban areas were themselves changing remarkably. In 1980, high rise apartments and shopping malls were rare, even in the largest cities. More generally, the urban population was periods spent in educational institutions and through the rise of modern communication media. TABLE 2.2. Census year Percentage growth per annum Urban population Rural population ,465 32,846 55,434 85, , , , , ,86 119, Urban percentage Rural percentage Urban/rural ratio Source: Population Censuses, 1971, 1980, 1990, 2000 and
26 3. Urban and rural population growth or decline Until recently, the emphasis of Indonesia s population change has focused heavily on shifts in population mean that in some parts of the country particularly rural areas population decline has now set in. Indeed, between the 2000 and 2010 censuses, the rural population grew by just 3.3 per cent compared to 39 per cent for urban areas, across regions, provinces and districts. Nonetheless, population decline in many rural areas, and indeed in some urban areas, has major implications for the wellbeing of the populations concerned, and raises important issues for planning and development. their population living in urban areas. Indeed, if we consider the 63 million people living west of the Central Java-West Java border (i.e. in the provinces of West Java, DKI Jakarta and Banten), 71 per cent were living in urban areas in 2010, a remarkable change from Central Sulawesi and Western Sulawesi, all of which have fewer than 25 per cent of their population living in urban areas. In general, high levels of urbanization are found in provinces with very large cities (Jakarta, West Java, Banten), thriving tourism (Bali), A relatively high correlation is found between level of urbanization and the level of economic development as measured by the Gross Regional Domestic Product per capita in the provinces. The Spearman Rank Correlation between the two is (Firman, forthcoming). The size of the urban population, the percentage of the urban population and its growth rate in each province between 2000 and 2010 is shown in Table 2.4. The growth rates of the urban population between 2000 and 2010 were extraordinarily rapid in Banten, Riau (including Riau Islands), South Kalimantan, Gorontalo, Maluku and Papua (including growth in Gorontalo, Maluku and Papua started from a small urban base. Among larger noteworthy. 13
27 Province Urban population 2000 ( 000) Urban population 2010 ( 000) % increase % Urban 1990 % Urban 2000 % Urban 2010 % Urban 2035 (projected) Aceh 486 1, North Sumatra 4,693 6, West Sumatra 1,228 1, Riau 2,147** 2, ** 31.9** 43.3** Jambi South Sumatra 2,380 2, Bengkulu Lampung 1,429 1, Bangka Belitung Riau Islands 1, SUMATRA 13,981 19, Jakarta 8,389 9, West Java 17,972 28, Central Java 12,554 14, ,801 2, ,226 17, Banten 2,770 7, JAVA 58,980 79, West Kalimantan 1,065 1, Central Kalimantan South Kalimantan 829 1, ,419 2, KALIMANTAN 3,981 5, North Sulawesi 736 1, Central Sulawesi South Sulawesi 2,385** 2, ** 24.1** 29.6** Gorontalo West Sulawesi ,810 5, Bali 1,566 2, West Nusatenggara 1,407 1, Maluku
 and CBS, 2012.")
28 Province Urban population 2000 ( 000) Urban population 2010 ( 000) % increase % Urban 1990 % Urban 2000 % Urban 2010 % Urban 2035 (projected) North Maluku West Papua Papua 553** ** 24.3** 24.9** , , Source: Central Board of Statistics ( and CBS, **Riau Included Riau Islands; South Sulawesi included West Sulawesi; Papua included West Papua. Urban population growth rates for period are for the combined population in the 2000 boundaries. Java overall is a highly urbanized region, but many provinces in the outer islands also experienced a considerable increase in the proportion of population living in urban areas over the period. The sharpest increases were in Riau Islands, Maluku, Bali, and South Kalimantan. Riau Islands has attracted migrants from all over Indonesia to the city of Batam. Riau, from which it was split in 2002, also continues to urbanize rapidly. Bali is an international tourist destination capturing a remarkably high percentage of the foreign tourists who travel to Indonesia. Most provinces outside Java, however, continue to have relatively low levels of urbanization. 15
29 towns and cities grown? This is not an easy question to answer, largely due to the lack determining the population sizes of towns and cities from 2010 Census data some of which had with populations exceeding half a million but were not included in the list of kota administratip time. Appendix Table 1 lists all cities in Java with populations above 100,000 people, as well as outer island provinces and larger towns, sometimes down to populations as small kota administratip. A start has been made with comparing the 2000 and 2010 Census data for towns and cities in Table 2.4, but caution is needed in interpreting the suspiciously high growth rates between 2000 and 2010 for some of these towns and cities. Table 2.5 shows the growth of Indonesian cities with populations above half a million in There were 33 such cities, but as six of them (including DKI Jakarta) were located within the Jakarta mega-urban region, we could consider them separate nodes in one megacity. Similarly, two cities were located within the Surabaya mega-urban region, two region. If we combine these cases into individual mega-urban regions, we can conclude that there were 24 separate mega-cities and other cities in Indonesia with populations exceeding half a million. The growth rate over the and periods for Indonesia s largest cities Jakarta, Surabaya, Bandung and Medan was relatively slow, but this was largely due This will be discussed at greater length in Chapter 5. It can be noted here, however, that the population growth of the entire Jabodetabek mega-urban region over the period was 37 per cent, or amongst the most rapid of Indonesian cities listed below. The that it is the growth rate of the entire population of the Jakarta mega-urban region that should be compared with the growth of other cities, then the rapid growth of Bekasi, Depok, etc. should not be considered independently of their role as part of this megaurban region either. 16
30 City Province Population 1990 Population 2000 Population 2010 Av. Ann. % increase Av. Ann. % increase DKI Jakarta DKI Jakarta 8,259,288 8,356,489 9,607, Surabaya 2,483,871 2,599,796 2,765, Bandung West Java 2,058,049 2,136,260 2,394, Bekasi* West Java 1,663,802 2,334, Medan North Sumatra 1,730,752 1,904,273 2,097, Tangerang* Banten 1,325,854 1,798, Sidoardjo+ 1,339,311 1,772, Depok* West Java 1,143,403 1,738, Semarang Central Java 1,250,971 1,298,643 1,555, Palembang South Sumatra 1,144,279 1,451,419 1,455, Makassar South Sulawesi 944,685 1,100,019 1,338, Tangerang Selatan* Banten 863,575 1,290, Bogor* West Java , , Batam Riau Islands 106, , , Pekan Baru Riau 398, , , Bandar Lampung Lampung 636, , , Padang West Sumatra 631, , , Karawang West Java 660, , Malang 695, , , Den Pasar Bali 532, , Sleman** 738, , Samarinda 407, , , Cikarang West Java 712,111 Tasikmalaya West Java 602, , Kudus Central Java 477, , Banjarmasin S. Kalimantan 481, , , Jambi Jambi 339, , , Serang Banten 458, , Balikpapan 344, , , Pontianak W. Kalimantan 397, , , Bantul** 561, , Cimahi*** West Java 442, , Garut West Java 273, , Source: region. ***Located within the Bandung mega-urban region +Located within the Surabaya mega-urban region. ++Boundary changed between 1990 and
31 What is clear from Table 2.5 is that the majority of Indonesia s fastest-growing cities are outside Java, such as Batam, Pekan Baru, Samarinda, Balikpapan, Den Pasar and Jambi, all of which are located in provinces which, as noted above, were favourably placed for rapid economic growth. 5. Components of urban population growth It is important to understand the extent to which urban population growth in any country areas, (2) a transfer of population from rural to urban areas through net migration urbanization). Can the relative contribution of these components to changing urban growth and levels of urbanization in Indonesia be determined? It can be done, but only in a very rough way. In the and periods, municipalities actually lost populations through migration, though this was certainly not true of Jakarta or of the municipalities in Sumatra. In later periods, however, with the slowing rates of natural increase and the acceleration of economic development, migration came to play a more important role in the growth of urban areas, particularly in the largest cities of Java and outside the island. 18
32 CHAPTER 3. 19

33 1. Fertility and mortality trends younger ages for rural women, who have an average of 1.1 births before their 25 th birthday, substantially above the 0.7 births urban women are having at the same age was 23.0 in urban areas, compared to 21.0 in rural. More than twice as many rural urban counterparts, at 13.1 per cent compared with 6.3 per cent respectively (Statistics Indonesia et al., 2013, p ). is possible to calculate wanted fertility rates in the same manner as the conventional are omitted from the numerator, and the remainder cumulated to form a total wanted fertility rate. This is analogous to the conventional total fertility rate (TFR). The total wanted fertility rate may be interpreted as the number of wanted births that a woman would bear by age 50, if she experienced the wanted fertility rates observed for the past three years. As shown in Table 3.1, the wanted fertility rate was about half a child less than the actual fertility rate. In rural areas, the wanted fertility rate was just above replacement level (a total fertility rate of 2.1), in urban areas it was below replacement level at 1.9, and in DKI Jakarta slightly lower still, at
34 TABLE 3.1. Total wantedertility rate Total fertility rate Rural Urban DKI Jakarta Source: Statistics Indonesia et al., 2013, Table 6.6, Table A-6.3 Turning to mortality, early childhood mortality rates have been declining over time in Table 3.2. These mortality rates are more than 50 per cent higher in rural than in urban areas. TABLE 3.2. Type of mortality Urban Rural Neonatal Post-neonatal Infant mortality Under-5 mortality Source: Statistics Indonesia et al., 2013, Table 8.3. Note: Rates refer to deaths per 1,000 live births. as patterns of migration. In general, one would expect that lower fertility rates in urban concentrated in young adult age groups. Figure 3.1 shows the age pyramids for urban and rural areas of Indonesia, according to relative to the rural population. Comparatively, the elderly population has a higher proportion in rural areas, partly because relatively few old people tend to migrate, and because those who migrated to the cities when they were young want to return to their place of birth for retirement. 21


35 FIGURE 3.1. Source: BPS website, 2010 Population Census. A number of indicators are outlined: the percentages of key functional age groups, the dependency ratio (a rough indicator of the proportion of the dependant age population to the working age population), and the support ratio (the ratio of the working age population to the elderly). Urban areas of Indonesia are at a considerable advantage in having a lower proportion of both young and old dependants compared to rural areas. This becomes clear in the age pyramid, where the considerably higher number of both of working age. TABLE 3.3. Indicator Urban Rural Total Dependency ratio* Support ratio** *Population (0-14)+(65+)/(15-64). **Population (15-64)/(65+). 22
36 3. Household size both the number and size of housing units required. The growth in the number of if the average household size is changing. In the large cities of Indonesia as across the country as a whole the average household size declined sharply between 1990 and 2000, but between 2000 and 2010 there was very little change (see Table 3.4). This was The one city where there was noticeable change in average household size between 2000 and 2010 was Bandung, where it rose from 3.6 to 4.0. City DKI Jakarta Surabaya Bandung Medan Semarang Makassar Source: Population Censuses, 1990, 2000 & Educational characteristics Most children in Indonesia attend school at the primary level, even if they do not attended school across urban and rural areas. While the proportions who have never rural areas they are quite low below 2 per cent at ages In urban areas, they are below 1 per cent at all ages, up to years old. Age group Urban Rural
37 Age group Urban Rural Source: BPS website: The more important statistic is the proportion of people who have reached various levels of education, as shown in Table 3.6. This table has the disadvantage of including all people aged 6 and above, even though many children aged 6-19 have not yet attainment of the urban population, with more than twice as many people having completed secondary school than their rural counterparts, and a much lower proportion of the urban population with incomplete primary education or less. The educational education in urban areas, with almost half as many rural women falling into a lower education category. Women in this age group have completed, on average, 10.1 years of education if they live in urban areas, compared to 6.2 years for those living in rural areas. TABLE 3.6. Incomplete primary or less Completed primary/ incomplete secondary Completed secondary or more Total MALE (aged 6+) Urban Rural Total FEMALE (aged 6+) Urban Rural Total FEMALES AGED Urban Rural Source: Statistics Indonesia et al., 2013, Tables , and
38 More detailed data on educational attainment from the 2010 Census is presented in Table 3.7. It is clear that roughly the same proportion of urban and rural dwellers have completed junior secondary school, yet a much higher proportion of rural dwellers have levels of education below this. Comparatively, a much higher proportion of the urban population have upper secondary education or higher levels, at 45 per cent compared to 16 per cent of rural dwellers. TABLE 3.7. Educational attainment Males Females Urban Rural Urban Rural Urban Rural No education Incomplete primary Completed primary Junior secondary Senior secondary Senior vocational Diploma 1/11/ Diploma 1V/University Total Source: BPS online data Census, The employment structure of rural and urban areas It is a common misconception that most of the rural population is engaged in agriculture and that manufacturing and service sector employment is heavily concentrated in urban areas. In fact, although most agricultural employment is in rural areas, this does not necessarily mean that most rural dwellers are engaged in agricultural activities. This is clear from Table 3.8, which shows that in 2012, only 43 per cent of employed males and 36 per cent of employed females living in rural areas worked in agriculture. This is because there are many other activities taking place in rural areas, ranging from various kinds of manufacturing, to trade, repairs and service activities. Many rural dwellers also commute each day to work in urban areas, almost always in non-agricultural activities. economic activity in response to questions posed in censuses or surveys. In both urban and rural areas, many people are engaged in multiple activities, and the activity in which they spend the most time is not necessarily the one that brings them the most income. distribution of workers across industries or occupations in Tables 3.8 and 3.9 can thus be considered only a rough indication of the actual structure of employment in Indonesia. 25
39 Professional, Technical, managerial Clerical Sales and services Agriculture Industrial worker Missing information Total Urban Rural Urban Rural Source: Statistics Indonesia et al., 2013, Tables and There has also been a tendency for much manufacturing activity to move from large cities to answer the question of how much of manufacturing employment is in rural areas, of rural areas in each census is based partly on the employment structure of each desa. Therefore, if manufacturing grows in a rural area, that area is likely to become urban by This discussion will therefore concentrate more on the structure of employment in urban areas. Tables 3.9 and 3.10 show data from the 1990 and 2000 Censuses on employment structure in urban areas. The industry categories changed between 1990 in size over that period, which in real terms, seems unlikely. Therefore, we must concede the industrial structure of employment in rural and urban areas between 1990 and TABLE 3.9. Industry Urban Rural Total Mining and quarrying Manufacturing Construction Trade, restaurants, hotels
40 Industry Urban Rural Total Transport, storage and communication Finance, insurance, real estate etc Community, social, personal services Source: 1990 Census Report, Series S2, Table 41.3, 41.6, 41.9 TABLE Industry Urban Rural Total Mining and quarrying Manufacturing Construction Trade, restaurants, hotels Transport, storage and communication Finance, insurance, real estate, etc. Community, social and personal services Source: 2000 Census Report, Series L2.2S2, Table 26.7, 26.8, 26.9 When the 2010 employment structure is compared with that in 1990, it is clear that the employment structure within urban and rural areas did not change very much, at least in terms of these broad categories. What is distinctive, however, was the overall employment structure in the country as a whole, mainly resulting from the shift in the urban-rural balance of the labour force. Whilst there was almost no change in the proportion of the rural labour force working of desa labour force living in urban areas, the proportion of the total labour force working in primary industries fell from 49.9 per cent in 1990 to 40.5 per cent in This decline areas, however, there was little change in employment structure across these broad small drop in manufacturing and non-trade services. 27
41 TABLE Industry Urban Rural Total Mining and quarrying Manufacturing Construction Trade Transport and storage Information and communication Finance, insurance, real estate, etc Community, social and personal services Source: BPS website, 2010 Population Census across 1993 and 2007 (World Bank et al, 2011: 13). Recent data on poverty shows that in September 2012, the percentage of poor people was 8.6 per cent in urban areas, compared to 14.7 per cent in rural (Kementerian Perencanaan Pembangunan Nasional, 2013: Table 2.5). Districts with a higher level of urbanization tended to have lower incidences of poverty, about 14 per cent less than rural districts (Sumarto, Vothknecht and Wijaya 2014: 309). As fast growing areas attract migrants, so too does the number of poor people in cities rise. Thus, although the rate of poverty in cities is relatively low, the proportion of the population living in urban areas is increasing, so the absolute number of poor people living in urban areas increased across the period (Kementerian Perencanaan Pembangunan Nasional, 2013: 45), and it probably still is. What is less clear is how many of those who migrate to the city in order to escape poverty actually succeed in doing so. in poverty are very marked. The urban poverty level is well below the national average, and poverty in rural areas is much higher. Although the rural poverty level is declining, in 28

42 2012 it was calculated at 41 per cent in Papua and 38 per cent in West Papua, compared 2014: 443-4). Poverty in these two provinces is therefore very much a rural phenomenon. It is clear from Table 3.12 that urban areas have much higher proportions of their populations in the two highest wealth quintiles than rural areas, at 59 per cent compared to 21 per cent. The nation s capital, Jakarta, has an even higher proportion in these highest wealth quintiles, at 75 per cent. TABLE Area Wealth quintile Lowest Second Middle Fourth Highest Total DKI Jakarta Urban Rural Total Source: Statistics Indonesia et al., 2013, Table
43 7. Household possessions household possessions and means of transportation. The generally higher level of prosperity within the urban population is clearly evident in the ownership rate of rates of television, mobile phones and motorcycles are higher than in rural areas, it is the general increase in income levels of the population, and the decline in prices of items such as mobile phones. TABLE Possession Urban Rural Total Radio Television Mobile telephone Non-mobile telephone Refrigerator Means of transport Bicycle Motorcycle/scooter Rowboat Boat with a motor Animal drawn cart Car/truck Ship Source: Statistics Indonesia et al., 2013, Table 2.4 (see Table 3.13), there was more than one mobile phone for every person in Indonesia, because many people carry more than one. The pattern of usage of such devices makes Indonesia one of the world s most active users of social media. In 2012, Indonesia had 64 million active Facebook users, and in June 2013, 7.5 per cent of the world s Tweets came from Indonesia. 1 tweets came from Jakarta alone. 2 information and for socializing
44 31
45 A companion publication to this report, Internal Migration in Indonesia, reviews the overall of migration in Indonesia between the and periods, except for (a) Sumatra, (b) Java, (c) Kalimantan, (d) Sulawesi, (e) Bali and Nusa Tenggara, (f) Maluku, and (e) Papua. In general, economic corridors represent large islands in Indonesia. From a geographic point of view, inter-economic corridor migration and inter-island migration are thus synonymous. corridors between 1995 and The most striking of these was an increase in net in- almost 10 times as much as in the period. By contrast, Java experienced a net 1995 and There was an increase in the net in-migration to Bali, Nusa Tenggara during Maluku and Papua, on the other hand, witnessed the opposite with increasing tendency for a higher proportion of migrants to move longer distances, a trend the report attributes to improved means of transportation and communication. In of migration. In Indonesia, permanent migration is fairly well measured by population censuses, but there are also intense patterns of shorter-term mobility which link people and places over quite wide distances. The volume of daily commuting to big cities is very large, but this does not involve any change of residence. Circular migration, however, does facto labour force in the cities. 2. Volume of migration urban and rural areas receiving many trans-migrants tended to be more heavily oriented to urban areas. Migration to Papua is a good example if this. While trans-migrants mostly from Java were being settled in rural areas, some of them moved into towns such as Merauke from time, migrants from Sulawesi in particular were moving into the towns to engage in trade and other activities (Aditjondro, 1986). 32


46 Appendix Tables 2 and 3 show, for all Indonesian provinces, the proportion of the of migrants are those who crossed kabupaten/kota boundaries (or, of course, provincial migrants over a lifetime. Figure 4.1 shows the percentage of lifetime migrants who lived in urban areas in DKI Jakarta Banten Jawa Barat Kepulauan Riau Bali DI Yogyakarta Jawa Timur Sulawesi Utara Jawa Tengah Nusa Tenggara Barat INDONESIA Papua Sulawesi Selatan Kalimantan Timur Sumatera Utara Maluku Bangka Belitung Sumatera Barat East Nusa Tenggara Kalimantan Selatan Gorontalo Maluku Utara Aceh Papua Barat Kalimantan Barat Riau Kalimantan Tengah Bengkulu Jambi Sulawesi Tengah Sumatera Selatan Sulawesi Tenggara Sulawesi Barat Lampung % 20% 40% 60% 80% 100% Urban Rural Source 33

47 In 2010, lifetime migrants in Indonesia were primarily living in urban areas with the ratio of urban to rural dwellers at 3:1. Whilst the ratio of the initial movement may have been less skewed to urban areas, by the time of the 2010 Census, it is possible that the area people had moved to had been declared urban. If we compare the proportion of lifetime migrants who are living in urban areas to the total urban population of that province, it is evident that across 16 provinces, the former exceeds the latter by more than 10 percentage points. In seven provinces Kalimantan Barat, Kalimantan Tengah, Bengkulu, Sulawesi Tengah, Papua Barat, Aceh and Maluku Utara it goes the other way; the proportion of migrants living in urban areas falls short of the urban population by and migrants living in urban areas are those with low levels of urbanization. By contrast, those where the urbanization of migrants exceeds that of the total population are more lifetime migrants in urban areas, at the provincial as well as national level. Appendix Tables 2 and 3 give details of lifetime and recent migrants amongst the general populations of Indonesian provinces. In Indonesia as a whole, the share of lifetime migrants is 11.8 per cent, compared to 2.5 per cent for recent migrants. The share of recent migrants in the population was more than three times as high in urban compared 34
48 to rural areas. The only province where migrants share of the rural population was higher than their share of the urban population was Central Kalimantan, with relatively where opening of new rural areas for settlement is still going on. In all other provinces, the share of migrants is much higher in the urban population. Drawing on Appendix Tables 2 and 3, Table 4.1 shows some extreme trends amongst Indonesian provinces in lifetime and recent migrants across urban and rural areas. The areas where the proportion of lifetime migrants is particularly high are those where in- provinces, including Jakarta and Riau Islands, have large proportions of in-migrants because of migration to growing cities. Banten is an extreme example of this, with the proportion of lifetime migrants in urban areas far exceeding that in rural areas. Banten s urban areas mainly on the fringes of the Jakarta metropolis have a high proportion of recent migrants compared to rural areas. Bali, on the other hand, has a booming tourist industry which over a long period has drawn migrants to the greater Den Pasar area, including the Kuta-Legian-Seminyak, Sanur and Jimbaran-Nusa Dua areas. Lifetime migrants Recent migrants Province Urban Rural Urban Rural North Sumatra Riau Lampung Riau Islands DKI Jakarta Banten Central Java Bali West Nusatenggara South Kalimantan South Sulawesi Southeast Sulawesi Papua Source: BPS website, 2010 Population Census 35
49 more prominent than that to the densely populated rural areas. South Sulawesi is a province with a reasonably high proportion of lifetime migrants in urban areas, but only a low proportion in rural areas, and low proportions of recent migrants in both urban and rural areas. There is a fairly high degree of correlation between high proportions of both lifetime and recent migrants. This can be observed, for example, in the cases of Riau (including Riau Lampung is a good example of this. The history of the transmigration program is evident in the high proportion of lifetime migrants, but the province s limited attraction in more less pronounced, is South Sumatra and Central Sulawesi, where even urban areas have failed to attract a large number of recent migrants. Both lifetime and recent migration data show a strong concentration on urban areas, the drawdown of the transmigration program and the rapid urbanization in recent decades. Some of the key transmigrant-receiving provinces illustrate this trend. In 2000, for example, Lampung s rural areas had a slightly higher proportion of lifetime migrants, even in lifetime migration. In the case of recent migration, the urban areas of Lampung retained their advantage, although neither urban nor rural areas of Lampung showed much power to attract inter-provincial migrants. In Southeast Sulawesi in 2000, lifetime migrants were a substantial proportion more than 20 per cent of both urban and rural populations, as were recent migrants. By 2010, however, the proportion of recent migrants had fallen to fairly low levels, twice as high in urban compared to in rural areas. Provinces where the sources of growth in the past had been less dominated by contrasts. In North Sumatra, inter-kabupaten/kota or inter-provincial migration is importance of mining (which contributes mainly to the growth of urban areas) the proportion of recent migrants is quite high in both urban and rural areas. The same is true in Riau. This could be due to resource extraction industries in these provinces being located in rural areas. In Papua, by contrast, very few recent migrants have been going to rural areas. 36
50 urban and rural areas on the demographic structure of urban and rural areas in Indonesia. The young working age population is over-represented amongst the urban population, while both children and the elderly are over-represented amongst the rural population. Table 4.2 gives further information on the age structure of migrants and non-migrants in the capital city of Jakarta, and in a number of key provinces where recent migration has Papua. For comparison, some provinces where migration has played less of a role are information is not available on the age structure of migrants in urban areas, however since migrants are heavily concentrated in urban areas (see Figure 4.1), the ratios in Table 4.2 can be expected to fairly closely represent the situation of both migrants and non-migrants in urban areas. Certainly, this is the case in Jakarta, which is wholly urban, and in Banten and Riau Islands, where migrants are almost exclusively living in urban areas. In all the provinces in the table, recent migrants are heavily concentrated in the young adult ages, year old far more so than the non-migrant population. Province Migrant % aged 5-14 % aged % aged Ratio Migrant Ratio Migrant Nonmigrant Nonmigrant Nonmigrant Ratio Riau Riau Islands DKI Jakarta Banten S. Sulawesi W. Nusatenggara Papua Source: BPS website and unpublished tabulation supplied by BPS age group in the provinces where recent in-migration has been limited (in particular, heavy in-migration to urban areas. This seems to indicate that the heavy concentration 37
51 of migrants at the young adult age is characteristic of migrants in general, irrespective of where they are moving to. It should also be kept in mind that the volume of migration is far larger to provinces such as Jakarta, Banten and Riau Islands than it is to provinces such as South Sulawesi and West Nusatenggara. As for education, migrants to urban areas tend to be better educated on average than their rural counterparts, largely because of the lack of appropriate rural employment opportunities, as well as the fact that urban employment opportunities tend to attract those who have higher level of education. It could also be due to the fact that many rural young people leave their hometowns in order to move to the city and continue their cities also attract less-educated migrants, so more study is needed to understand the 38
52 39
53 Before examining the city size distribution and the extent of urban primacy in Indonesia mega-urban regions. This is because it is not possible to get a realistic picture of city size distributions without coming to terms with the growth of vast urban complexes, particularly in the national capital, DKI Jakarta. Table 2.5 showed the populations of which greatly complicates calculating city size hierarchies as described by rank-size distributions or primacy indices. The key issues are two: (1) whether cities that are part of mega-urban regions should be considered as separate entities or part of the mega-urban region population, and (2) whether revised populations for the largest cities should be used in recognition of the fact that the built-up areas of some of these cities have greatly and costs of urban agglomerations Governments of Southeast Asian countries, along with those in most parts of the developing world, have historically tended to consider the growth of large cities in negative terms. During decades of very rapid population growth across the 1960s, 1970s and 1980s the high rate of natural increase within the population as a whole, together with rural-urban migration, was leading to very rapid population growth in some of the regions large cities. The negative aspects of this were clear, including crowding, the Politicians, policy makers and planners primarily drawn from the more privileged social classes found it hard to see the positive aspects of city growth, and tended to take a the perspective of poor and disadvantaged rural dwellers, however, movement to the in urban and rural incomes, but on the perceived likelihood (on the part of the migrant) What planners often failed to realize was that even without much migration, high fertility was itself leading to substantial population increase in urban areas. Further, as migration their children born in urban areas. As urban fertility rates declined, the role of migration in driving city growth increased. 40
54 Attitudes to city growth gradually shifted over time, as the positive role of large cities queried whether it was possible to demonstrate that the population of any megacity could be too large. Despite the challenges faced by rapidly expanding cities, they do enable most migrants to better their economic situation, and enable agglomeration economies to be realized, with their contribution to national production and to national economic growth well in excess of their proportion of the national population. The 2. What is a mega-urban region? Relationship government usage A number of terms are used internationally to describe large city regions focused on agglomeration is usually taken to mean a built-up or densely populated area containing the city proper, suburbs and continuously settled commuter areas or adjoining territory including the built-up areas of the urban agglomeration, as well as rural-urban fringe areas with a complex mix of activities and changing physical environment sometimes referred to as desa kota (see McGee, 1991: 5-8). Areas (Kawasan Strategic Nasional, or KSN) in Indonesian government usage? As shown in detail in Annex 2, seven metropolitan areas are included as KSN in the National Spatial Plan, including Jakarta, Surabaya, Bandung, Medan, Semarang, Makassar and Den Pasar. These areas spread well beyond urban agglomerations, and are therefore consistent population of less than one million in 2010, while one city with a population exceeding this Palembang was not included as a National Strategic Area. Whilst it is not clear National Strategic Areas are much broader than simply the population size of the city national defence, security, social, economic cultural and environmental aspects, as well as world heritage sites. 41

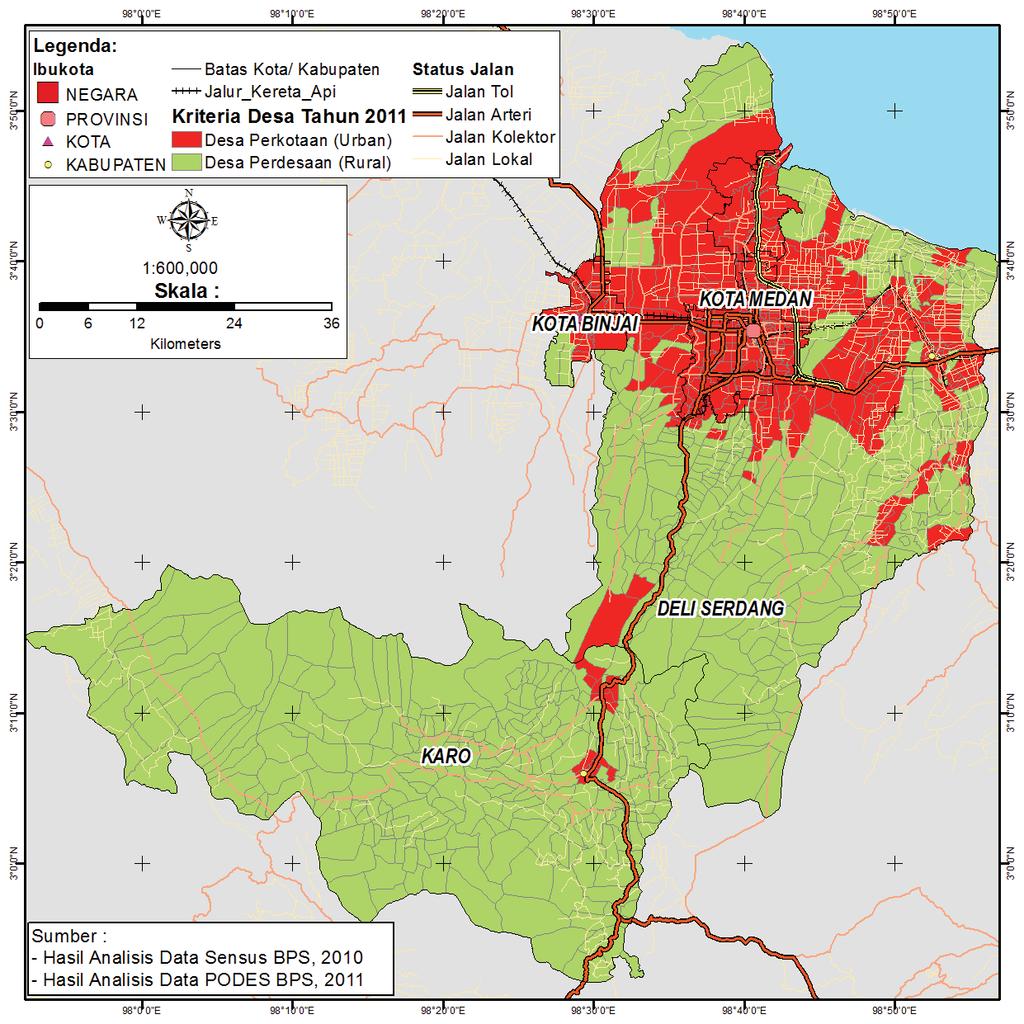
55 3. Studies of Indonesian Mega-Urban Regions (MURs) In 2010, there were 11 cities in Indonesia with population of over one million: Jakarta, Surabaya, Bandung, Medan, Palembang, Semarang, Bekasi, Tangerang, Tangerang Tangerang Selatan and Depok are in the hinterland of Jakarta, and are therefore part of the Jakarta MUR. This leaves seven large cities in Indonesia which could perhaps be approaching a population of one million in 2010, and as already mentioned, another Den Pasar was included in the government s list of National Strategic Areas, presumably because its population would be well over one million if adjoining built- if the adjoining urban areas of Bantul and Sleman are included in its population. The acronyms referring to the mega-urban regions focusing on most of these cities have already become commonplace: Jakarta (Jabodetabek), Surabaya (Gerbangkertasusila), Bandung (Cekungan Bandung), Medan (Mebidangro), Semarang (Kedungsepur), Makassar (Maminasata). censal Survey, it was found that by adding to the urban core groups of desa that met the 42
56 BPS criteria for urban areas and were contiguous to the city or to other groups of desa administrative boundary of the metropolitan area. 3 Thus MUR s were mapped whose the desa added to the core was well below the score of 18, which at that time was the minimum in order to be considered urban. This resulted from the need to include some rural desa, in order to bring them within the inner zone of the mega urban region. desa Population ( 000) Average score (3)/(2) City Core Core plus inner zone Core Inner zone (1) (2) (3) (4) (5) (6) Jakarta 9,112 16, Surabaya 2,695 5, Bandung 2,356 5, Semarang 1,346 3, Makassar 1,066 1, Medan 1,066 3, Source: BPS, UNFPA and ANU, Another way of examining these large cities was to compare the population density having a much less densely populated core than the other cities. This, plus the fact that the average urban score of desa in its inner zone was less than 15 suggests a population 3 million in the core plus the inner zone was somewhat exaggerated compared with the population of the other cities in the study. City core Area (sq. km.) Population (million) Density (per square km) Jakarta 661 9,113 13,787 Bandung 167 2,356 14,136 Semarang 374 1,346 3,604 Surabaya 326 2,695 8,256 Makassar 176 1,086 6,179 Medan 265 1,902 7,177 Source: BPS, UNFPA and ANU, The BPS criterion for an urban desa are given in detail in the Annex. 43
57 The National Urban Development Strategy project, completed in 1985, also produced estimates of urban agglomerations, which in some cases were much larger than the populations of the kota madyas concerned. A striking example was Tegal in Central Java. The kota madya of Tegal had a population of only 131,728, but the contiguous urban area, stretching mainly to the South and West, had a population of 326,803, raising Tegal from 27 th to 14 th place among Indonesian cities at that time (Kingsley, Gardiner and Stolte, 1985: 5-6, 16). Indonesia, called an Agglomeration Index (AI). This method uses three factors: population density, the population of a large urban centre and travel time to that centre. A population persons per square kilometer for Java and 200 for other islands; a 90 minute commute for Jakarta and 60 minutes for other agglomerations across the country. The measure thus estimates the population of metropolitan areas as what it refers to as both city and suburban districts with high population density and proximity to the central city (based on commuting time) (World Bank, 2011b: 13). 5.3). The great majority of these are located in Java, Bali and Sumatra, in which most of numbers of agglomeration areas. There is only one agglomeration (Jayapura) on the vast island of Papua, and also only one in the Maluku archipelago, while Kalimantan and the study concluded that Indonesia has two megacities with populations of more than 10 million (Jakarta and Surabaya), four metropolitan areas with populations in the 5-10 million range, 13 metropolitan areas with populations in the 1-5 million range, and eight medium-sized metropolitan areas with populations ranging from million. Agglomeration Jakarta 17,771,825 23,925,397 26,750,001 Surabaya 7,563,077 9,851,508 10,501,043 Bandung 4,643,009 6,478,492 7,156,927 4,840,456 6,345,099 6,653,353 Cirebon 4,448,249 6,113,864 6,451,311 Semarang 3,640,644 4,878,561 5,049,775 Medan 3,090,761 4,216,854 4,634,417 44
58 Agglomeration Kediri 3,034,169 3,716,133 3,829,444 Pekalongan 2,204,073 3,103,484 3,152,589 Mataram 1,934,520 2,912,095 3,038,078 Surakarta (Solo) 2,320,839 2,930,166 2,995,529 Makassar 1,653,147 2,240,979 2,378,334 Bandar Lampung 2,115,166 1,927,206 2,153,552 Padang 1,225,900 1,567,594 1,788,924 Tegal 1,233,268 1,648,116 1,648,185 Denpasar 922,205 1,324,885 1,431,525 Palembang 1,068,496 1,512,424 1,396,823 Tanjung Balai 793,043 1,148,347 1,211,994 Payakumbuh 767, ,931 1,022,116 Malang 648, , ,651 Madiun 682, , ,756 Pekan Baru 440, , ,126 Banjarmasin 431, , ,018 Manado 406, , ,134 Samarinda 422, , ,827 Pontianak 361, , ,315 Balikpapan 337, , ,150 Jambi 332, , ,226 Pare-Pare 276, , ,625 Sukabumi 106, , ,496 Palu 188, , ,547 Kupang 254, ,895 Bengkulu 204, , ,276 Ambon 250, , ,887 Kendari 211, ,725 Pemat. Siantar 184, , ,416 Probolinggo 158, , ,916 Banda Aceh 234, , ,336 Jayapura 144, , ,991 Tarakan 125, ,038 Gorontalo 106, , ,360 Pangkal Pinang 99, , ,830 Tebing Tinggi 102, , ,428 Sibolga 57,125 83,991 90,618 45
59 Agglomeration Total agglomerations 71,446,308 95,228, ,544,507 Small kota 1,937,781 3,134,664 3,490,274 Urban areas 73,384,089 98,363, ,034,781 Rural areas 81,100, ,862, ,037,139 Total population 154,485, ,225, ,071,920 Source: World Bank, 2011, Table 2.4 estimated size of some of the agglomerations in Java, such as Cirebon (6,451,311), Mataram in Lombok (3,038,078) and Payakumbuh in West Sumatra (1,022,116). While such an index may be relevant for some purposes, it has some clear limitations when applied to densely populated parts of Indonesia. Java is one of the most densely populated regions on earth, comparable to Bangladesh, parts of the Gangetic plain in India and parts of China. In the Indonesian context, the AI has the weakness of ignoring the nature of employment in densely populated areas, and the level of interaction with the city from people living beyond it. For example, the projected population of 6.5 million for the Cirebon Metropolitan Agglomeration no doubt includes large numbers of farmers as a metropolitan agglomeration comparable in population to Surabaya or Bandung. is even harder to justify claiming such a large metropolitan population constituting more than 70 per cent of the entire population of West Nusatenggara at that time even though more than half of the province s workforce were employed in primary industry, and most did not have easy access to the city. This is not to deny that the estimated populations of many Indonesian urban actual functionality of these towns and cities, nor to ignore the importance of potential accessibility. As it stands, however, the vast increase in populations of some Indonesian cities using the AI method over-emphasizes potential accessibility, and under-emphasizes poverty levels of people living within 60 minutes travelling time of Indonesian towns and cities. Despite its shortcomings, the approach of the World Bank report is somewhat consistent with evidence that urban corridors are tending to develop along transportation links between a number of large cities in Java. Firman (forthcoming) argues that the main urban corridors are those linking Jakarta to Bandung, Cirebon to Semarang, Semarang to running all the way from Jakarta to Surabaya, across northern coastal regions between 46

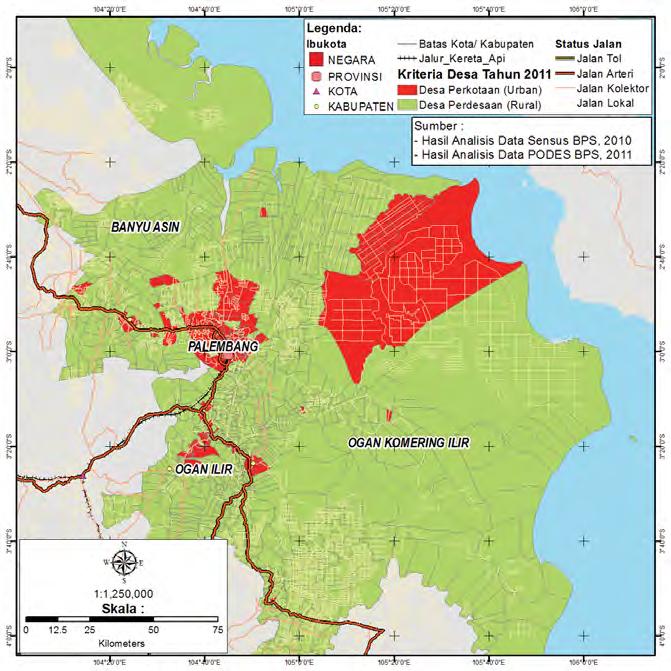
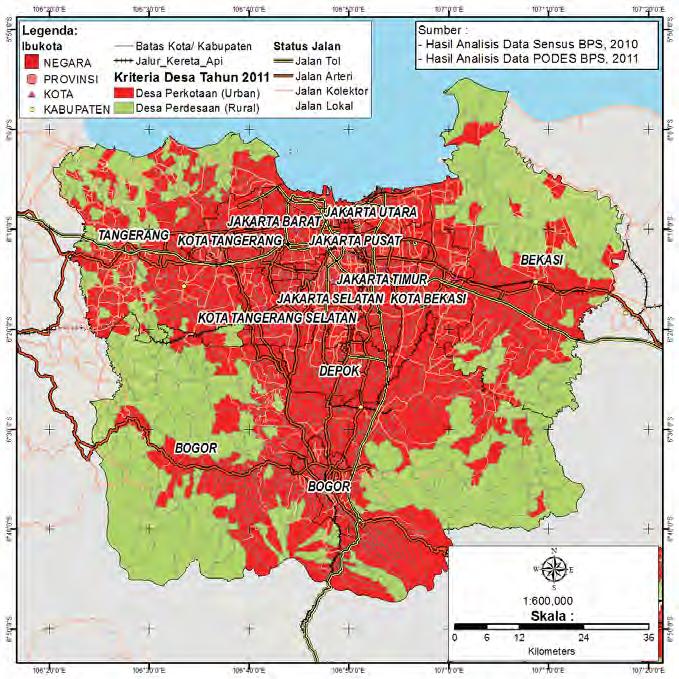
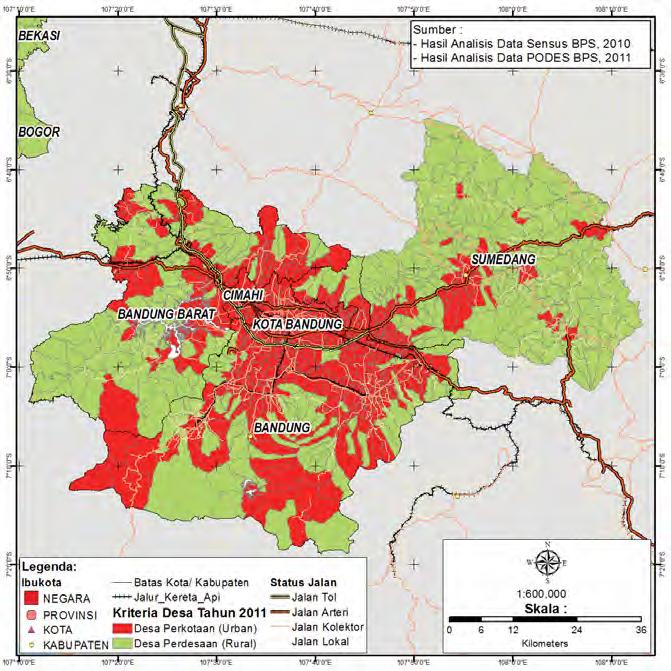
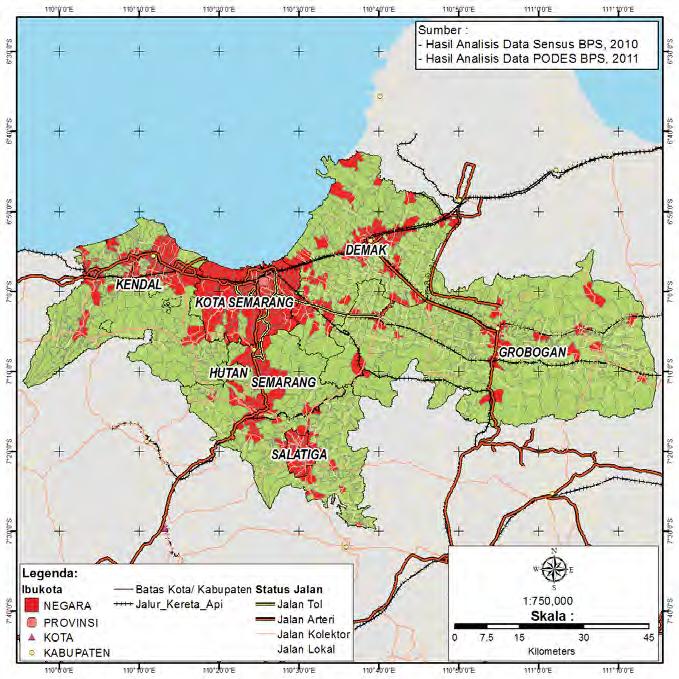
60 Surabaya. To the west of Jakarta, too, it is not unrealistic to perceive an extension of the urban corridor through Serang and Cilegon to Merak, across the sea to Bandar Lampung in Sumatra. Speculation such an urban corridor is tending to emerge does not, however, infer urban, and there are substantial regions of Java mostly southern coastal regions and volcanic areas such as the Ijen plateau where urbanization can hardly be said to have progressed very much. 4. Trends in mega-urban region growth For the purposes of the present study, it is not possible to conduct a major new analysis of the growth of mega-urban regions, since it would have had to involve detailed analysis of maps of the areas surrounding the major cities, and tabulations based on boundaries determined using appropriate criteria. This was done in the BPS-ANU-UNFPA study (2000) and for Jakarta using the 1990 and 2000 census data by Mamas and Komalasari (2008). This approach needs to be applied to the 2010 Census data, but requires a broader and urban regions in Indonesia are shown in Figure 5.1, which can be read in conjunction with the analysis that follows. 47
61 48
62 49
63 50
64 51
65 52
66 53
67 54
68 55
69 In this report, it has been possible to examine in some detail the estimates of the populations of mega-urban regions focused on the largest cities Jakarta, Surabaya, Bandung, Medan, Semarang, Makassar, Palembang and Den Pasar that are often kota populations the contiguous kabupaten or kecamatan that contain some urban overspill. The areas discussed below are shown in the maps of the individual mega-urban regions in Figure 5.1. for these mega-urban regions are shown in Annex 2) MEGA URBAN REGION URBAN RURAL TOTAL % URBAN 2,097,610 2,097, ,450 10, , ,355, ,587 1,790, , , , ,779, ,503 4,485, DKI JAKARTA 9,607,787 9,607, ,334,871 2,334, ,850,185 1,850, ,290,322 1,290, ,959,698 1,959, , , ,108, ,271 2,630, ,046, ,153 2,834, ,785,751 1,002,787 4,788, , , , ,147,936 2,478,799 28,626, ,394,873 2,394, , , KAB.BANDUNG 2,673, ,044 3,178, KAB. BANDUNG BARAT 938, ,506 1,510, , , , ,774,938 1,199,692 7,974,
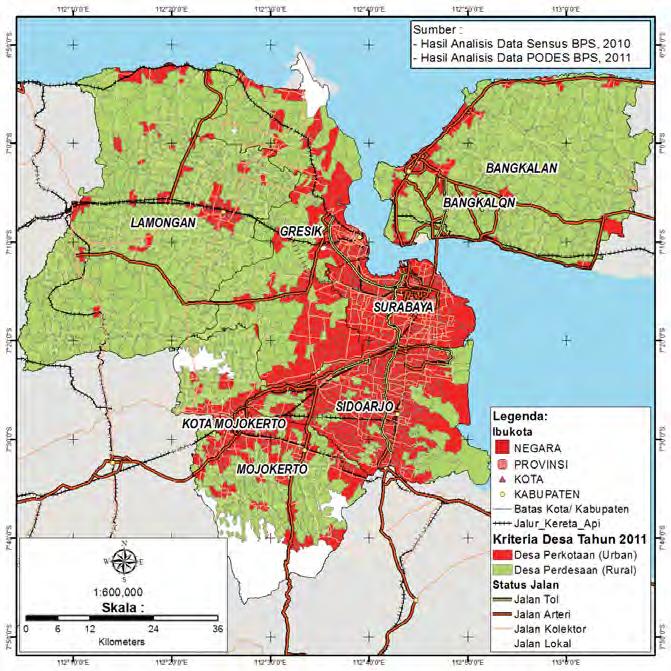
70 MEGA URBAN REGION URBAN RURAL TOTAL % URBAN 1,531,290 24,694 1,555, ,987 40, , , , , , , , , ,783 1,055, ,050 1,097,158 1,358, ,174,290 2,875,656 6,049, ,765,487 2,765, , , , ,130 1,177, ,772, ,454 1,941, , ,417 1,179, , ,041 1,025, KAB. BANGKALAN 214, , , ,316,557 2,798,928 9,115, SARBAGITA 788, , KAB. BADUNG** 438,154 77, , ,999 56, , KAB. TABANAN** 110,646 44, , ,613, ,972 1,791, MAMINASATA 1,331,391 7,272 1,338, , , , , , , KAB. TAKALAR 56, , , ,843, ,267 2,482, ,440,678 14,606 1,455, , , , , , , , , , ,764,339 1,549,335 3,313, *Not all kecamatan in this kabupaten are included. See Annex 2 for details. **Not all kecamatan in this kabupaten are included, consistent with Presidential Decree No 45 year See Annex 2 for details. 57

71 populations of these mega-urban regions (MURs). Referring to Table 5.4, it is surprising to note that in the case of Jakarta, whilst the Jabodetabek-Punjur area contains some areas that are still rural, these amount to only 2.5 million of the population, or less than 10 per cent of Jabodetabek-Punjur overall. In the case of Surabaya, the Gerbangkertosusila area population. The kabupaten of Bangkalan and Lambongan are only 24 and 21 per cent urban respectively, and substantial parts of Gresik and Mojokerto are also rural. Thus the Gerbangkertosusila area gives a decidedly exaggerated estimate of the urbanized population of the Surabaya region, considerably more exaggerated than is the case when Jabodetabek is used to show the mega-urban region population of Jakarta. If the aim is to identify the built-up areas surrounding Surabaya in order to identify the extent of the urban agglomeration, the only parts of the kabupaten of Bangkalan and Lamongan that should be included in the MUR population would be those urbanized areas adjoining the main Surabaya metropolis. Source: Iwan Kustiwan, 2011, URDI s Bunga Rampai Edisi 2 p
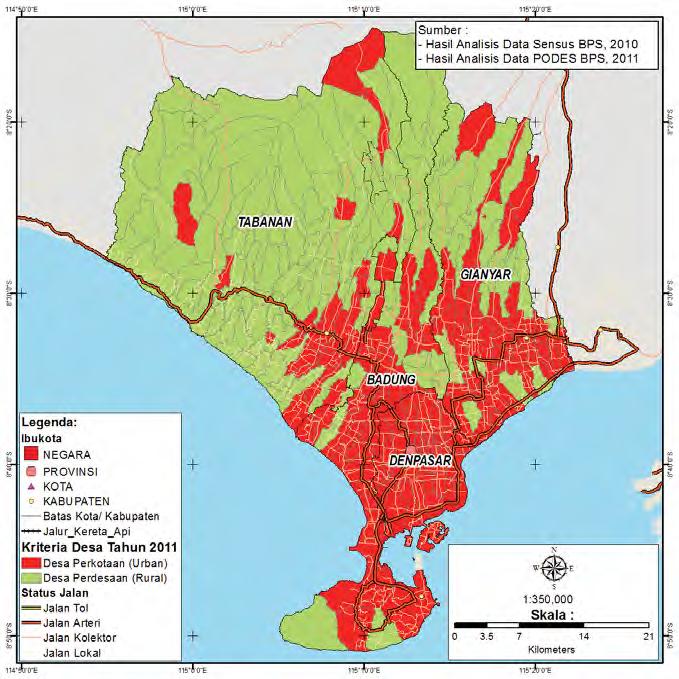
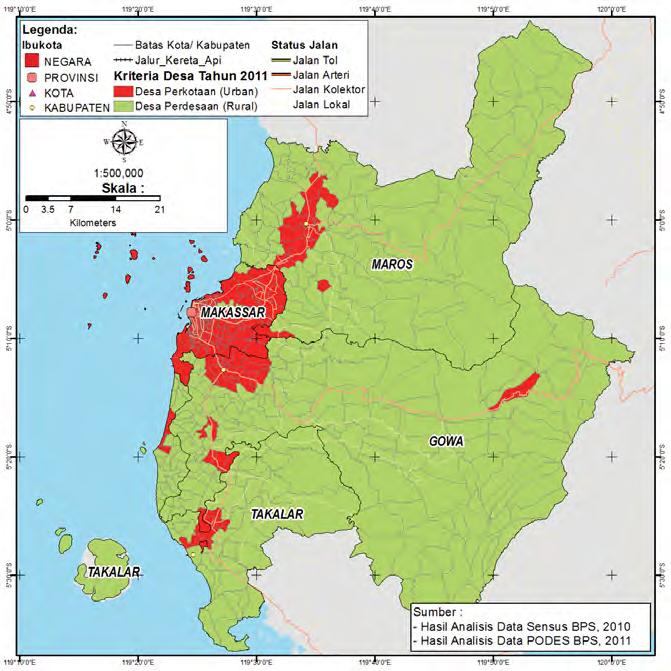
72 The MURs of Semarang, Palembang and Makassar also include very large populations There is a strong case for excluding large parts of the kabupaten of Semarang, Kendal and Demak from the Semarang MUR area, a large part of kabupaten Takalar from the Makassar (Maminasata) population, and most of kabupaten Ilir from the Palembang Raya population. These exclusions would give MUR populations that are more comparable with those included for Jakarta. The cases of Bandung (Cekungan Bandung), Medan (Mebidangro) and Den Pasar (Sarbagita) are closer to that of Jabodetabek, with only 15 per cent, 16 per cent, and 10 surrounding Bandung (Figure 5.2) suggests just how hard it is to decide where the urban agglomeration ends and rural areas begin. area including much rural population can be linked to the city economically, and can comparison of the growth of mega-urban regions in Indonesia is that whilst Jabodetabek gives a close approximation of the population of the urban agglomeration of Jakarta, and the Bandung Raya area gives a close approximation of the population of the urban agglomeration of Bandung (perhaps exaggerated by 10 per cent and 15 per cent, respectively), in the case of Surabaya and Makassar the exaggeration is more of the order of 30 per cent or more, and for Semarang and Palembang, almost 50 per cent. This must be kept in mind in comparing the populations of these MURs, and assessing the primacy indices. In any case, the populations of the mega-urban regions using these broad boundaries are shown in Table 5.5. grew only slowly between 2000 and The picture alters radically when the megaurban areas are used. Using the MUR populations from Col. 3 of Table 5.5, for Jakarta, the growth rate of 1.4 per cent per annum becomes 3.8 per cent. Similarly, for Surabaya, the growth of 0.6 per cent becomes 1.8 percent, and for Bandung 1.1 per cent becomes 3.3 per cent. 59
73 Mega-urban region Population 2010 Urban areas only Urban and rural areas Urban proportion of the MUR population (%) Share of core* in the: MUR population (%) MUR urban population (%) share of Indonesian population (%) (1) (2) (3) (4) (5) (6) (7) JAKARTA (Jabodetabek- Punjur) (Gerbangkertosusila) BANDUNG (Bandung Raya) 26,147,936 28,626, ,316,557 9,115, ,774,938 7,974, ,779,652 4,485, (Kedungsepur) 3,174,290 6,049, MAKASSAR Maminasata) 1,843,053 2,482, (Palembang Raya) 1,764,339 3,313, ,613,388 1,791, *Core is DKI Jakarta, kota Surabaya, kota Bandung, kota Medan, kota Semarang, kota Makassar, kota Palembang and kota Den Pasar respectively. A comparison of growth between 1990, 2000 and 2010 in the core and periphery areas cases from those of the urban areas of MUR s presented in Tables 5.4 and 5.5, but because Katherina and Dalimunthe (2014) had access to 1990 and 2010 data unavailable the case of Jakarta, which was not covered in their study, the estimates of the periphery in the estimates for all years the general aim was to exclude the truly rural areas of kabupaten core in 2010 was probably undercounted compared with both 1990 and Despite Makassar, the growth of the core areas was very slow in the period, and in Surabaya and Medan remained slow in the period, though the pace of growth picked up in Jakarta, Bandung, Semarang and Makassar. In all cases, the growth in the periphery was much more rapid than in the core across both decades. Growth of the overall MUR populations was slower in the more recent decade than in the 1990s, except Jakarta and Makassar. 60
74 MUR Pop 1990 Pop 2000 Pop 2010 Av. Ann. % Increase JAKARTA Core 8,223 8,347 9, Periphery 5,434 9,435 16, MUR 13,656 17,783 25, Core 2,473 2,595 2, Periphery 1,290 2,698 3, MUR 3,764 5,293 6, BANDUNG Core 2,058 2,136 2, Periphery 1,405 2,952 4, MUR 3,463 5,089 7, Core 1,730 1,904 2, Periphery 825 1,321 1, MUR 2,555 3,225 3, Core 1,249 1,346 1, Periphery 619 1,228 1, MUR 1,868 2,575 3, MAKASSAR Core 944 1,100 1, Periphery MUR 1,060 1,321 1, Source: Jakarta Mamas and Komalasari, 2008, Table 5.1, and data from 2010 Population Census; other MUR s Katherina and Dalimunthe, Share of mega-urban regions in the national and urban population While the mega-urban region populations in the third column of Table 5.5 are well in million of the Jabodetabek population lives in desa much of the population of kabupaten, such as Lamongan and Bangkalan (included in 61
75 the Surabaya MUR) and Kendal and Demak (included in the Semarang MUR), are still rural. kabupaten lying close to the largest cities, where population growth is much faster than in on the periphery of Surabaya, had a population growth rate of almost 3.0 per cent per annum, compared with Surabaya s 0.4 per cent. Deli Serdang, adjacent to Medan, grew continued to be evident in the period, where the urban population of Sidoarjo grew by 2.8 per cent per annum, compared with Surabaya s 0.7 per cent, and the urban population of Deli Serdang grew by 2.7 per cent per annum, compared with Medan s 1.1 per cent. per cent of Indonesia s population and over half (53.5 per cent) of its urban population. A more conservative estimate of their populations in which only the urban populations within the MUR boundaries are counted still constitutes 21.5 per cent of Indonesia s overall population and 43.2 per cent of its urban population. These MUR s clearly increased their share of Indonesia s population between 2000 and The more interesting question is whether they increased their share of the urban population. Because of the lack of comparable data for the populations of Palembang and Den Pasar MUR s in 2000, this question can only be answered for the other six MUR s covered by the data in Table 5.6. The percentage of these MUR s as a proportion of Indonesia s total population increased over the period from 17.5 per cent to 20.2 per cent, while their share of the urban population fell very slightly from 41.3 per cent to 40.5 per cent. In other words, population growth in non-mur cities, towns and villages was, if anything, slightly more rapid than in the six MUR s. 6. Characteristics of Indonesian mega-urban regions donut growth and fringe area transformation kota populations, the clear impression is that the growth of these cities is slowing considerably, and that urban growth has shifted to some but certainly not all of the smaller cities. This impression is incorrect, however, because the dynamics of the growth of these megacities requires study of the broader region in which they are located. In is slowing gives a highly misleading impression of overall growth of the mega-urban region. metropolitan area, the core area of the mega-urban region characterized by slow growth or even decline, is the hole in the donut. The growth action, on the other hand, is taking place in the ring of the donut instead. As can be seen in Table 5.5, in the case of Jakarta, 62

76 the share of the core declined from 54.6 per cent in 1980 to 43.2 per cent by 1990, 39.6 per cent in 2000 and 36 per cent in In the case of Surabaya, Surabaya city s share of the total Gerbangkertosusila population declined from 34.0 per cent in 1990 to 31.8 per cent in 2000, and to 31 per cent in For the other cities as well, the core s share of the total population was steadily declining over time. Surabaya grew by only 6 per cent and Palembang did not grow at all. In these four cities, growth was well below the natural increase of the population, implying that there was net out-migration away from the city. In the case of Bandung, the growth rates of surrounding kabupaten (Bandung, Cimahi and Bandung Barat) was over 2 per cent per annum, more than twice that of Bandung city. Semarang and Makassar, however, boundaries of these cities, enabling further population growth to take place within the 4 larger than that of Surabaya, a much larger city. 63
77 DKI Jakarta grew by 14 per cent over the period, but it is likely that its population was undercounted in the 2000 Population Census (see Jones, 2001), and therefore that the increase was exaggerated. If instead we take the increase between 1995, when DKI Jakarta s enumerated population was 9.11 million, compared to population slow growth indeed. boundary of the metropolitan area where transformation of land use and of economic activity is manifesting, that the greatest population growth is taking place. 7. Sources of population growth in the mega-urban regions The growth of urban populations is fuelled not only by natural increase and net migration is less than initially perceived. This was studied for Indonesian metropolitan regions over the period by of 5.8 per cent per annum, approximately 35 per cent was due to natural increase, rural-urban migration. Jabotabek, however, was clearly atypical. Similar analyses of metropolitan Surabaya, metropolitan Bandung and metropolitan Medan indicated less than a third as much in Medan and Bandung (see Table 5.7) Recorded growth rates Jabotabek Surabaya* Medan** Bandung** Urban Rural Total Constant area growth rates 1980 urban area urban area Rural area
78 Jabotabek Surabaya* Medan** Bandung** Natural increase**** Net migration Source: Gardiner, 1997, Table 7.2. *Metropolitan Surabaya Kodya Surabaya, Kab, Sidoarjo, Gresik. **Metropolitan Medan Kodya Medan, Binjai; part of Kab. Deli Serdang. ***Metropolitan Bandung Kodya Bandung, Kab. Bandung, part of Kab. Sumedang. ****Assumed annual rates Jabotabek (0.18), Metropolitan Surabaya (0.18), Metropolitan Medan (0.22), Metropolitan Bandung (0.20). 8. Contribution of mega-urban regions to national economic growth The mega-urban regions are making a disproportionate contribution to national economic growth. This is clear from Table 5.8, which shows that Jabodetabek constituting about 11 per cent of Indonesia s population contributed more than one quarter of national GDP, while Gerbangkertasusila with 2.6 per cent of national population contributed 7 per cent of GDP. Agglomeration Population 2010 (million) Percent of population Percent of 2010 Jakarta (Jabodetabek) Surabaya (Gerbangkertosusila) Bandung (Bandung Raya) Semarang (Kedungsepur) Source PDRB kabupaten/kota di Indonesia, Liveability of Indonesian cities Liveability can be understood as the attributes of a place that contribute to wellbeing Penh, Karachi and Dhaka, Jakarta has very low performance in international liveability The combination of rapid urbanization, economic growth and the lack of government capacity to provide basic services has resulted in the deterioration of the environment. Most cities in Indonesia face a common set of environmental problems, which can lead to the decreasing quality of life and wellbeing of city residents. Some of the problems are related to air pollution, causing respiratory and other health problems, and drainage subsidence due to heavy building construction and uncontrolled underground water pumping, as well as issues of solid and liquid waste management are just some of the 65
79 as many people living in slum areas face inadequate drinking water, and sanitation and associated health problems from waterborne diseases. Some indicators are shown in Table 5.9. Air Quality Open Space Housing Water Supply Sanitation City PM2.5 NO2 % of public open space % of HH Living in slum areas % of HH Using Adequate water source % of HH Using bottle/ gallon water % of HH Using Adequate sanitation Jakarta Bogor Tangerang Bekasi Surabaya Bandung Medan Palembang Semarang Makasar Banjarmasin Menado Ambon Jayapura Source: Note: Air quality measured by the concentration of PM2.5 in the air in micron gram per m3 and NO2 concentrations based on road side monitoring. With more and more of the population living in urban areas, the consumption of fossil fuels for transportation and industry has risen, potentially contributing to greenhouse (PM 10 and PM 2.5 ) compared to the standard. This meant that air quality had worsened, visibility and the maintenance of buildings. An Asian Development Bank study in 2002 showed that total cost of health problems due to air pollution in Jakarta amounted to 1.8 trillion rupiah (IDR) in
80 The availability of urban open space also contributes to better air quality and, by most Indonesian cities is relatively lower than the standard of 20 percent. Bogor has more open space than other cities, since there is a botanical garden in the city centre which is still conserved by the city government. Despite the fact that by law, however, the this. Indonesian cities lack the capacity to provide and invest in low income housing. City of repair. The high urban population growth, the shortage of urban land for housing, and urban low-income households. These factors explain the rapid expansion of slums in large and metropolitan cities such as Jakarta, Bandung and Surabaya. Most slums are life, property and belongings. Access to adequate water supplies through piped water and safe deep-wells is relatively low in the major Indonesian cities, available to less than one-third of households in the cities except Banjarmasin, where piped water from the local water company provides the main source. BPS data also reveals the high percentage of households in Indonesian cities using bottled/gallon water for daily consumption, which is higher than the cost of piped water. In many cases, slum dwellers pay disproportionately more than other urban residents. In Semarang, for example, households pay up to 10 times as much With further urban expansion, environmental conditions in Indonesian cities will worsen long-term sustainability of these hubs. Technical solutions can be found to many of these problems, but increased infrastructure investment and better maintenance are 67
81 68

82 CHAPTER 6. 69
83 1. The Indonesian urban system Basic information about the distribution of Indonesia s urban population across cities of a whole, but also for its major regions. Unfortunately, a detailed analysis of the 2000 and 2010 Population Census data has not yet been undertaken, meaning that the proportion of the urban population living in towns in categories below 100,000 known for earlier years is not yet available for 2000 and have been used. In real terms, this means the population of smaller towns and urban many of these lie within mega-urban regions (as discussed in the previous chapter). While Table 6.1 indicates that cities of more than 1 million people make up 25.5 per cent of Indonesia s urban population, if we use the data on the urban populations of the seven major mega-urban regions from Table 5.5, these seven MURs make up 43.7 per cent of Indonesia s total urban population. share of large cities in their urban populations. While cities with populations of one million or above make up a quarter of Indonesia s urban population, this share is a third in Java. Cities in the half million to one million class are only a small proportion of Java s urban population, but represent a much higher share of the population in Kalimantan, Sumatera and Bali/Nusatenggara. In Sumatra, three cities Batam, Pekan Baru and Bandar Lampung were approaching the one million population mark in 2010, and once they pass this, the share of million cities in Sumatra s urban population for a substantial share of Indonesia s urban population; 38 per cent overall and well over 40 per cent in Sulawesi. It should be kept in mind, though, that particularly in the densely settled Java, many of these small towns and villages are in fact located within the extended areas of larger towns and cities, including the MURs. TABLE 6.1. Indonesia Sumatra Java Bali/Nusa Tenggara Kalimantan Sulawesi Maluku/ Papua 1 mill. and above ,000-1 mill , , , , Less than 100, ,320 19,788 79,950 5,126 5,799 5,843 1,814 70
84 size categories between 2000 and 2010, as well as the share of urban growth over the 2. Primacy and rank-size distributions at the national level Some countries have an urban system that is dominated by one city, and this is generally prove. For example, in countries such as Uruguay and Bangladesh, which are relatively small from a geographic perspective, for one centrally-located city to dominate might scope and archipelagic nature, it would be surprising if one city were to show extreme dominance. The NUDS project in the 1980s concluded that Indonesia had a well-balanced urban size hierarchy with many middle-sized centres, and the largest urban agglomeration, Jakarta, accounted for just under 20 per cent of the nation s urban population, a far lower share than that of countries with serious primacy problems, such as Thailand (Bangkok with 69 per cent) and South Korea (Seoul with 41 per cent). Using the populations of functional study still holds. The largest urban agglomeration, Jakarta (in the form of Jabodetabek), accounted for approximately 22 per cent of the nation s urban population, not much in Jakarta, Surabaya, Bandung and Medan. Because detailed analysis of these megaurban regions based on the 2010 Census has not yet been conducted, the populations of these mega-urban regions for the purpose of this exercise have been approximated by the urban population in the areas going by the acronyms Jabodetabek-Punjur, Gerbangkertosusila, Cekungan Bandung and Mebidangro. Using these adjusted populations of Indonesia s four largest cities, the 4-city primacy 71
85 TABLE 6.3. Year Four city Primacy * * ** from Table 5.6. **Using the urban populations of the MURs from Table 5.5, but excluding Cianjur from Jakarta MUR. The rather low 4-city primacy index for Indonesia is not surprising, given the archipelagic character of Indonesia, with the population distributed over many islands, particularly in Sumatra, Kalimantan and Sulawesi. The distances involved and the limited development and high costs of inter-island shipping means that reasonably large cities tend to be distributed widely over the archipelago. Further, given that three of the four largest cities are on the island of Java, the data indicates that even on Java, Jakarta has not been able to dominate the urban structure, and Surabaya (which up until 1914 was actually larger in population than Jakarta: see Dick, 2003: ) and Bandung have continued to occupy very important positions as major urban complexes. 3. The main islands of Java, Sumatera, Kalimantan and Sulawesi are large, and with the partial exception of Java, surface transportation has been and continues to be poorly been hard for any single city to dominate the urban hierarchy, and reasonably large cities have tended to develop in each province. Therefore we can expect reasonably low primacy indexes at the island level for Sumatra, Kalimantan and Sulawesi, because each contains a number of provinces and in turn, has generated one substantial city. The same would be true of Java, except that Java s urban hierarchy is somewhat distorted by the dominant role of Jakarta as the national capital. At the provincial level, however, there has been a tendency for economic activity to be concentrated in the main city. Usually the administrative capital, this tends to dominate 72
86 Nusatenggara and West Sulawesi as examples where the second city has been fairly close to the main city in population, but these tend to be isolated occurrences. The results of this exercise are shown in Table 6.4. The adjusted populations of the mega-urban regions have again been used. Separate estimates were not made for West Java and Banten, because the cities of Bekasi, Tangerang, Tangerang Selatan, Bogor and Depok form part of the larger Jakarta mega-urban region. ISLAND GROUP OR PROVINCE INDEX ISLAND GROUP INDEX-PROVINCE 1.06 Aceh 0.61 Sumatera Utara 4.79 Sumatera Barat 2.71 Riau 2.24 Kepulauan Riau 2.94 Jambi 2.78 Sumatera Selatan 2.97 Bengkulu 1.89 Lampung 2.55 Bangka Belitung 1.43 JAVA 1.63 Jawa Barat-DKI-Banten 3.17* Jawa Tengah 1.52 * Jawa Timur 4.08 KALIMANTAN 0.40 Kalimantan Barat 1.44 Kalimantan Selatan 1.69 Kalimantan Tengah 0.78 Kalimantan Timur 0.92 Kalimantan Utara Sulawesi Selatan 4.84 Sulawesi Barat 0.51 Sulawesi Tengah 2.32 Gorontalo 2.25 Sulawesi Utara
87 ISLAND GROUP OR PROVINCE INDEX ISLAND GROUP INDEX-PROVINCE Sulawesi Tenggara Bali 4.36 NTB 0.68 NTT 1.55 Maluku 2.79 Maluku Utara 1.31 Papua 1.01 Papua Barat 1.08 *Jawa Barat and Banten not calculated separately because of the issue of overspill of Jakarta mega-urban region into these urban region. Note: for Java, Sumatra, Sulawesi and Other Islands, the adjusted megacity populations (excluding their rural components) shown in Table 5.4 were used. The data in Table 6.4 shows that, on the whole, the expectation of higher primacy indexes at the provincial rather than island level is supported. This is clearly the case in Sumatra, where only one provincial index is lower than the index for Sumatra as a whole, and for Kalimantan, where all of the provincial indexes are considerably higher than the index for Kalimantan as a whole. In Sulawesi, however, half the provincial indexes are lower than the index for Sulawesi as a whole. At the provincial level, the 4-city primacy indexes the nature of provinces where primacy is very high. Some of them are less populous provinces such as Jambi and Maluku, but others are larger provinces such as North 4. There is no real basis for determining the ideal rank-size distribution of cities and towns in any country. Whilst there is a general predilection for the smooth distribution of city sizes, following the Zipf rank-size rule 5 distribution of urban populations in Indonesia follows the rank-size rule fairly closely. It is noteworthy that in the decades of the 1970s, 1980s and 1990s, there was a small but distinctive gap in the distribution of city sizes in the 500,000 to one million range. In 1980, Palembang and Makassar have moved out of the category by crossing the one million population threshold. This gap, however, has been closed with the rapid population increase of many cities formerly with populations below half a million, moving them into the half million to one million range, including Batam, Bandar Lampung, Pekan Baru, Padang, Karawang, Malang, Den Pasar, Samarinda, Tasikmalaya, Banjarmasin, Jambi, 5 This rank-size rule describes an empirical regularity observed in the data for many countries, whereby if a country s cities are ranked from the largest downwards, and then the natural logarithm of the rank and the city size is calculated, a log-linear pattern in the descending size of cities tends to be observed. 74
88 Cikarang, Kudus, Serang, Balikpapan, Pontianak, Cimahi and Garut (see Table 2.5). It is noteworthy that of these 18 cities, only eight are located in Java. This emphasizes the importance of medium-sized city growth outside of Java, a number of which may already have crossed the one million mark by 2015, and others of which are soon to do so. 5. cities is to include those with a population size of 100,000 to one million. The locations of such cities are shown in Figure 6.1. What then, has been the development experience of such cities? In Java, they grew only slowly between , below the national population growth rate. Some of the small and medium cities which do not have the kota Otonom), however, did grow more rapidly, for example Using Susenas data across the period, the World Bank et al. (2011) argued that medium-sized cities in Indonesia (those with population in the range of half to one million) have performed better in terms of agglomeration economies than cities in any other size group, whilst smaller cities (those between 100,000 and 500,000 people) and small urban centres have performed the least well. The World Bank report states (p. 84) capita GDP. Census data, on the other hand, does not appear to indicate such population declines for the period, but rather slow rates of growth in the majority of cases. It is interesting to note that small and medium urban centres in the other islands of Indonesia are experiencing faster population growth than those in Java. The most rapid increase in the period was that of Batam in Riau Islands (8.0 per cent migrants from all over the country, most notably from Java and some parts of Sumatra. (5.1 per cent ), Tarakan (5.2 per cent), Pekanbaru (4.4 per cent ), Den Pasar (4.0 per cent ), Dumai (3.9 per cent), Kendari (3.7 per cent), Bontang (3.7 per cent), Samarinda (3.4 per cent) and Balikpapan (3.1 per cent). Although some of the smaller non-municipality cities in Java appear to have achieved even faster rates of growth (see Appendix Table 1), the expansion of Jakarta and Bandung did indeed have rapid rates of growth. In general, however, small cities in Java tend to function as centres for the distribution and collection of goods, are lacking in infrastructure and skilled labour, and have poor access to major cities and ports (World Bank et al., 2011, p. xiii). By contrast, the more dynamic cities outside of Java function as centres of economic activities, most notably natural resource exploitation such as mining, oil, timber, palm oil plantation, and tourism. 75


89 FIGURE 6.1. Source: Based on data in Appendix Table 1. 76

90 CHAPTER 7. 77
91 1. Jabodetabek is the area comprising Jakarta s metropolitan area (DKI Jakarta), plus parts of the provinces of West Java (Bekasi, Depok and Bogor and the kabupaten of Bekasi and Bogor) and Banten (the cities of Tangerang and South Tangerang and the kabupaten of Tangerang). As Jabodatabek is contained within the administrative boundaries of these areas, without cutting across any administrative boundaries, it is relatively easy to provide data for the whole region. Whilst this is not to say that the whole of Jabodetabek is urban, all but 2.03 million people (or 7.3 per cent of Jabodetabek s population of Interestingly, the Municipality of Greater Jakarta declared in January 1958, subsequently renamed the Special Region of Jakarta Raya in 1961 and declared a province (Daerah Khusus Ibukota Jakarta or special capital region of Jakarta) in 1966 covered an extensive area (662 square km), which was considered wide enough to cope with the expansion of the city. This was far from being the case. DKI Jakarta s share of Jabodetabek s population has been declining steadily, from 54.6 per cent in 1980 to 43.2 per cent in 1990, 39.6 per cent in 2000 (Firman et al., 2007: 446), and 36 per cent in The fact that the Special Region of Jakarta now holds only a third of the mega-urban region s population region as a whole. Infrastructure, transportation, environmental management and social development policies introduced by the DKI in isolation are likely to fail if not meshed into a broader regional cooperative planning and management framework. The change of acronym to refer to the Jakarta mega-urban region over time is revealing of the expansion of the mega-urban region. After the creation of a new city kota Depok, the old acronym Jabotabek was changed to Jabodetabek. Currently, the term Jabodetabekpunjur is frequently used to indicate that areas in Puncak and Cianjur (lying in West Java) should also be included. But there is also evidence that the mega-urban region is spreading through Karawang and into Purwakarta. An acronym to include these areas would clearly be too unwieldy to pronounce. But perhaps it would serve to remind us that the extended Jakarta mega-urban region is also too unwieldy to manage, unless a new form of mega-urban region management can be found. 2. The expansion of the built-up area of Jakarta over time is shown in Figure 7.1. In tracing the growth of the Jakarta metropolis through census statistics, however, there are several important considerations to be made. If dating expansion back from the pre-1970 period, it is reasonable to include only the population of Jakarta city, as up to that time, Bogor, Bekasi and Tangerang were only small towns with limited industrial development and not really linked in terms of employment into the greater Jakarta 78
, while growth was very rapid in the surrounding areas, suggesting that this was")
92 to increase rapidly up to 1995, albeit at a declining annual rate; 4.5 per cent in the period, 3.9 per cent from , 2.4 percent from and 2.1 per cent between 1990 and Between 1990 and 2000, on the other hand, the population barely increased (indeed it decreased between 1995 and 2000), while growth was very rapid in the surrounding areas, suggesting that this was the period when the donut-like growth suspicion of serious under-enumeration of the DKI Jakarta population in FIGURE 7.1. Source: Although there is no entirely satisfactory way to estimate the increasing population of the Jakarta mega-urban region, rough estimates are possible. Table 7.1 shows an estimate in which the DKI Jakarta population is used from 1961 to 1980, then the core and the entire population of the Jabodetabek region, minus the 2 million population of the region living in rural areas is presented for This obviously leads to a serious discontinuity in population between 1980 and 1990, which in a second estimate in Table 7.1 is smoothed by adding to the DKI population in 1980 the populations of Bogor, Depok, Bekasi and Tangerang urban agglomerations as calculated by the National Urban Development Strategy project (Kingsley et al., 1985, Appendix B). 6 the case of Jakarta that the undercount was worse in 2000 than in Although the evidence for this is not totally clear, both the cuts in budget for the 2000 census, the addition of extra questions requested by the Jakarta municipality, which increased the workload of poorly paid interviewers, and the recording of population declines in areas such as South Jakarta, where population increase might have been expected, all point to the likelihood of substantial undercount (Jones, 2008: 44). 79

93 TABLE Estimate 1* Estimate 2** Population ( 000) Av. Ann. Increase (%) Population ( 000) Av. Ann. Increase (%) ,973-2, , , , , , , , , , , Tangerang and Bekasi urban agglomerations as estimated by the National Urban Development Strategy Project. As Table 7.1 shows, the growth rate of the Jakarta MUR has been very rapid between 1961 and 2010, increasing by 8.7 times. This was most rapid over the 1970s and 1980s, and slowest between 1990 and The slowing of growth over the period hard, but may also result in part from under-enumeration of the Jakarta population in the 2000 Population Census. 80
94 As for DKI Jakarta, the slowing of its population growth is shown in Table 7.2. After very rapid growth between 1961 and 1995, Jakarta s growth slowed to a crawl after 1995, partly, as noted above, because of under-enumeration in 2000, but also due to the overspill of the population to neighbouring kota and kabupaten. This resulted from the transformation of land uses in DKI Jakarta, the rapid shift of industry and other commercial activities to areas outside its boundaries, as well as the search by the middle classes for more attractive living environments, a demand met by the development of massive housing and commercial complexes outside Jakarta. This is also evident in the fact that over the 20-year period from 1990 and 2010, Jakarta s population grew by only 0.8 per cent per annum, and over the 15-year period by only 0.3 per cent per annum, evidence that population growth action in the mega-urban region has shifted outside the DKI Jakarta boundaries over the last two decades. TABLE 7.2. Year Population ( 000) Average annual growth rate , , , , , , , Source: Population Census data for all years except 1995, for which year Inter-censal Population Survey data was used. 3. Spatial patterns of development in Jabodetabek The restructuring of land use throughout Jabodetabek that has accompanied the six-fold increase in its population since 1971 has been characterized by the large-scale transfer of industry and housing to cheaper sites outside DKI Jakarta. This has also seen the conversion of land in surrounding DKI from agricultural to a range of non-agricultural uses, especially large-scale housing developments, including new towns, industrial and some on a vast scale was accelerated by the insecurity, crime and potential for uncontrolled riots that accompanied and followed the end of the Suharto regime in This drove the middle class, with its nagging fear of the mob (Dick, 2003: 412, referring to Surabaya), to seek refuge in safer developments in the suburbs. Though most of these integrated housing and commercial developments around Jakarta were Geographically almost inaccessible to the poor because of location and lack of public 81
95 from both the sight of the poor and the danger they pose (Mamas and Komalasari, 2008: 124-5). The unrealistically low price of gasoline, heavily subsidized by the government right up to 2014, also facilitated the urban sprawl by making commuting by car or public transport cheaper than the market price of gasoline would have allowed. The pattern of development in the Jabodetabek area was therefore one where development occurred along an east-west axis from Bekasi to Tangerang and all with populations of a million or more outside Jakarta but within the greater Jakarta included Bogor, Bekasi, Tangerang, Tangerang Selatan and Depok, only Bogor could be said to have been a town of any size in In the present century, the expansion Westwards towards Serang and Cilegon and beyond Bogor and the Puncak to Cianjur. urban regions of Jakarta and Bandung (Firman and Dharmapatni, 1995), particularly since the opening of the freeway between the two cities in FIGURE 7.2. Source: Firman, 2014, Figure
96 4. Trends in employment As well as population growth, the rise of housing estates and commercial and industrial other high-end economic activities have remained in the downtown areas of the city. As a result, apartment blocks have proliferated over the past 15 years, partly as a response by census data on employment, since it is recorded according to place of residence as opposed to place of work. Thus the millions of commuters entering DKI Jakarta every day from places such as Bogor, Depok and Bekasi are enumerated according to where they sleep, even though they are employed in DKI Jakarta. 7 employment (mainly manufacturing) was slightly higher in inner zone Bodetabak than in in DKI Jakarta (Mamas and Komalasari, 2008: Table 5.9). The 2010 Census shows that there continue to be important distinctions in the distribution sector employment. TABLE 7.3. Sector DKI Jakarta Kod. Bekasi Kod. Depok Kod. Tangerang Kod. Tangerang Selatan Kod. Bogor All cities in columns 3-7 (1) (2) (3) (4) (5) (6) (7) (8)* A sector M sector S sector Total A survey of commuters associated with the 2000 Population Census recorded just over one million daily commuters to DKI Jakarta. 83
97 are given in Appendix Table 4. Tangerang stands out as a manufacturing city, a fact well known to Jakarta region residents but shown conclusively by statistics in Appendix Table 4. By contrast, South Tangerang and Depok have much lower proportions of their workforce engaged in manufacturing (9.5 per cent and 12 per cent respectively, as compared with 31 per cent for Tangerang and 15.6 per cent for Jakarta). This is populations commuting to work in Jakarta or, if employed in South Tangerang or Depok themselves, being engaged in industries other than manufacturing. Jakarta stands out as having a higher share of employment in hotels and restaurants than the other cities, 5. The role of migration in population change Migration has played a major role in population change in the Jakarta MUR in two urbanized parts of the Botabek region, and the second being out-migration from DKI to losses through net out-migration (see Table 7.4). The net loss was particularly high in the in Indonesia, Jakarta stands out as having a much higher proportion of in-migrants than any other city, except Batam. There is clearly a great deal of movement both in and out, In/out-migrants In-migrants Net migrants Source: Firman, 2004, Table 5; 2010 Census data A clearer picture of the origins and destinations of migrants to and from DKI Jakarta 7.5. Jakarta s substantial loss of a quarter of a million people over this period was overwhelmingly the result of out-migration to West Java and Banten, counterbalanced and Lampung. More detailed tabulations would reveal that migration to West Java and especially Bekasi, South Tangerang and Depok. For many provinces, whilst there was other. North and South Sumatra are good examples of this. 84

98 Province In-migrants to DKI Jakarta Out-migrants from DKI Jakarta Net migration North Sumatra 18,889 18, West Sumatra 12,274 19,361-7,087 Riau 9,496 4,272 5,224 Riau Islands 2,233 10,349-8,116 South Sumatra 7,648 8, Lampung 20,716 10,129 10,587 West Java 191, , ,420 Central Java 215,620 64, ,058 11,383 17,415-6,032 48,830 24,905 23,925 Banten 60, , ,256 All other provinces 36,936 72,433-35, , , ,502 Source: BPS website for 2010 Population Census data. 85

99 Jakarta (see Figure 7.3). It is clear that there is a strong over-representation of young adult age groups (20-44) in Jakarta compared with Indonesia as a whole. This is because of the strong concentration of in-migrants within these age brackets. It is also evident that females are over-represented in the age group, because of their tendency to migrate at an earlier age than males. FIGURE 7.3. Source: BPS website for 2010 Population Census data. the Jakarta MUR was investigated by comparing the sex ratio in certain age groups using 1990 and 2000 census data. Table 7.6 gives the results. Unfortunately, comparable data could not be obtained for It is clear that in 1990 and 2010, however, not only were young people over-represented amongst migrants to Jakarta, but females were heavily over-represented in the age bracket, especially in DKI Jakarta. This likely resulted largely from more employment opportunities for young women in Jakarta, in domestic and other services and in sales occupations. 86
100 TABLE 7.6. Year and age group DKI Jakarta Inner zone Outer zone Source: Jones and Douglass, 2008, Table Note: The inner and outer zones together make up Bodetabek. Jabodetabek. For example, DKI Jakarta has a higher proportion of its population who are lifetime migrants compared to Bodetabek, but the reverse is true for recent migrants years, especially from Jakarta. Second, in terms of both lifetime and recent migrants, DKI Jakarta has had a greater proportion of migrants from other parts of Indonesia. For Jabodetabek as a whole, 38 per cent of the population are lifetime migrants, compared to 9 per cent who are recent migrants. For DKI Jakarta, 45 per cent of the population are lifetime migrants. While this indicates that more than half the population are locally-born, the importance of migration would be clearer if data were available for the second generation (those born to migrant parents). Adding these to the migrant population would raise the proportion who are either migrants or children of migrants to well over half. TABLE 7.7. DKI Jakarta Bodetabek Total Jabodetabek In-migrants from Bodetabek In-migrants from DKI Jakarta In-migrants from outside Jabodetabek Non-migrants
101 DKI Jakarta Bodetabek Total Jabodetabek In-migrants from Bodetabek 4.2 In-migrants from DKI Jakarta In-migrants from outside Jabodetabek Non-migrants Source: It is interesting to consider what have been the main sources of migration to DKI Jakarta in recent times. As shown in Table 7.8, nearby parts of Java have been dominant. In 2010, 36 per cent. The share of recent migrants originating in North and West Sumatra has been gradually declining, but interestingly, the share originating from Lampung has increased. It is of course cheaper and easier to move to Jakarta from Lampung than from more distant parts of Sumatra North Sumatra West Sumatra South Sumatra Lampung West Java Banten * Central Java West Kalimantan South Sulawesi All other provinces Source: 1990 and 2000 Census Reports; unpublished tabulations from 2010 Census. *Included in West Java. 88
102 urban region a far more mixed ethnic composition than is the case for any other city in Indonesia, except perhaps Batam. though most migrants have originated elsewhere from Java, two key ethnic groups Javanese and Sundanese are spread relatively evenly. In DKI Jakarta, Javanese make up over a third of the population at 36.4 per cent, Betawi at 27.9 per cent, Sundanese at 10.1 per cent, Chinese at 6.6 per cent, all Batak groups at 3.2 per cent and Minangkabau at 2.9 per cent. In the Jakarta mega-urban region as a whole, Sundanese are the most prominent at 32.9 per cent, because of their heavy dominance in Bogor (across both kota and kabupaten). They are followed by Javanese at 27.3 per cent, Betawi at 23.6 per cent, Chinese at 3.3 per cent, all Batak groups at 2.5 per cent, Bantenese at 2.2 per cent, and Minangkabau at 1.9 per cent. The remaining 6.3 per cent of the population are drawn from other ethnic groups from all over Indonesia. 6. Role of migration in changing educational characteristics As it has for Indonesia as a whole, the educational attainment of the population of the in studying educational change in Jakarta, because historically the region has been characterized by relatively low levels of educational attainment (Castles, 1967: ). In the 1930 Census, for example, the percentage of literates in Batavia the former name for Jakarta was only 11.9, much lower than Bandung at 23.6 per cent. The continuing trend of lower educational attainment may indeed be surprising, given that Jakarta is the national capital and has attracted many of the brightest and most ambitious Indonesians from other parts of the country. Low educational attainment has been particularly pronounced in the Jakarta hinterland the area that is now the outer regions of Jabodetabek. The steady downward trend of educational attainment outwards from DKI to the further reaches of Jabodetabek is clear in Figures 7.4 and 7.5, however, it is also apparent that within DKI Jakarta, there is a band than in the cities of Botabek (with the exception of Bogor) but also lower than in some parts of the Tangerang and Bekasi kabupaten. ways. In an earlier study, it was found that in DKI Jakarta recent migrants aged were less educated than non-migrants, although this became less pronounced for ages By contrast, in the inner zone (predominantly what are now the cities of Bekasi, Tangerang, Tangerang Selatan, Depok and Bogor), migration has contributed to higher average educational levels, as it has for Jakarta MUR as a whole. This is predominantly because most migrants to these areas are young, and have on average higher levels of education. When the comparison was restricted to those aged 15-34, there was not Douglass, 2008, ). 89
103 and Tangerang Selatan have somewhat higher educational attainment levels than DKI Jakarta. This is mainly and of the growing city populations in Bodetabek. In the case of DKI Jakarta, migrants aged (both those from Bodetabek and the rest of Indonesia) are over-represented in poorly educated groups, at just lower secondary education or less. Thus, migration patterns are tending to hold down the educational attainment especially those from DKI Jakarta, are much better educated than the non-migrant population. In urban areas of Bodetabek, roughly twice as many recent migrants from DKI Jakarta have senior high school education or the movement of better-educated Jakartans to housing developments in these cities, and clearly has a major impact on educational levels in the Bodetabek population as a whole. Migration from elsewhere in Indonesia is also serving to raise the average education levels in Bodetabek, but not to the same extent as migrants from DKI Jakarta. 7. Infrastructure issues and environmental problems Jakarta is vulnerable to environmental change due to its location on the northern coast of Java island. The other natural disasters, as well as man-made calamities such as pollution and excessive extraction of ground water (Surbakti, Idroes, Simarmata and Firman, 2010). Indeed, it has been argued that Jakarta is one of the 2010) responsibility to implement an integrated water resource management plan for the region. Floods in Jakarta cannot be separated from the contribution of unsustainable land conversion and development in upstream areas, most notably in the Puncak area between Bogor and Cianjur. 90
104 91
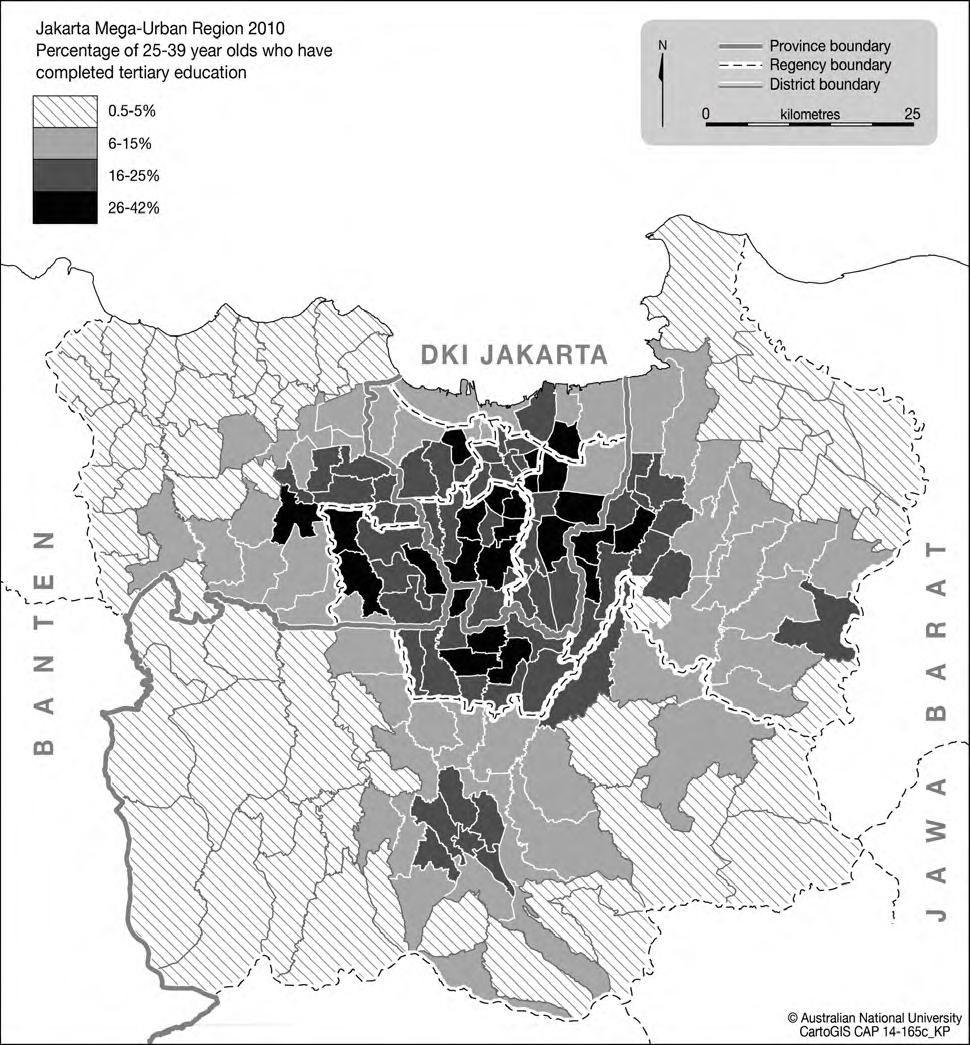
105 92
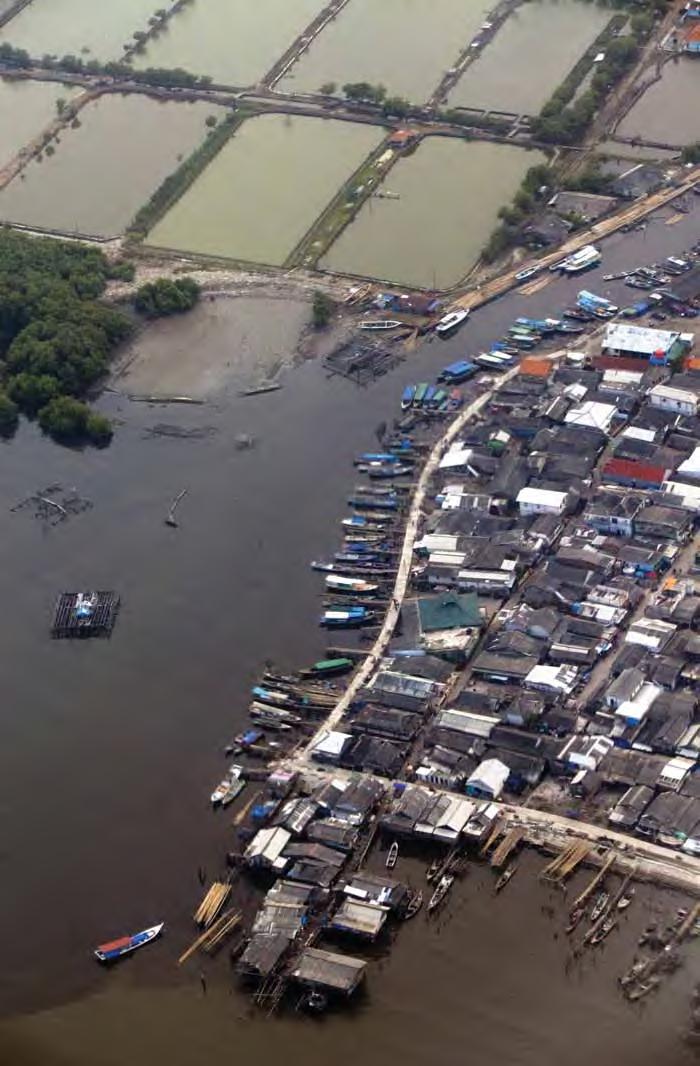
106 93
107 1. Indonesia moving forward from 50% urban: never again will the majority of the population be rural dwellers distinguish rural and urban areas of Indonesia. Not only have rural areas gained access to many of the facilities and lifestyles formerly the exclusive domain of urban dwellers access to television, electronic devices and mobile phones, for example but many rural dwellers are now within commuting range of a town or city and what it has to not all urban population growth in Indonesia results from natural increase or rural- changed substantially, and now meet the criteria for being considered urban areas. Is it time, then, to drop the rural-urban distinction in Indonesia? We believe the answer is no. There is still value in distinguishing between rural and urban areas, and between the urban and rural populations. What does need to be recognized, however, is as rural in terms of access to various resources and facilities, accessibility to or isolation from towns, and the incidence of poverty and their urban counterparts. There is a and one where the villager has to walk for 10 hours to reach a driveable road; and both these kinds of villages can still be found in Indonesia. In any case, the balance of Indonesia s population is certainly shifting in favour of urban areas, and Indonesia s future is as a predominantly urban nation. The rural population has held the majority throughout Indonesia s pre-independence and independence history, but the tables are now turning. Indeed, Indonesia s rural population will gradually decline both as a proportion of the population and in absolute numbers. Despite this, the still very large rural population being disadvantaged in many ways will need the continued attention of government policy. There needs to be recognition that much of Indonesian history and tradition grows from a predominantly rural population, that the A large proportion of the urban population in Indonesia has rural roots and rural connections; many urban dwellers are themselves migrants from rural areas or are the children of former migrants from rural areas, and few can claim that their grandparents were both born in a city. This has helped to maintain a symbiotic relationship between rural and urban areas, with some city people still returning to rural areas to participate in planting and harvesting activities, or to take refuge in times of hardship such as the economic crisis of The cities still empty to a remarkable extent over Lebaran, as people return to their places of origin. But as cities grow larger, more and more urban 94
108 dwellers no longer have connections with rural areas. As in many highly urbanized about rural life, and that city-based politicians and bureaucrats empathize with the needs of rural populations. 2. Projections: urbanization, rural population decline. From Table 8.1, it is clear that the rural population is expected to continue declining in absolute numbers. This decline appears to have set in after 1995, although from the 2000 and According to the United Nations, the urban percentage of the population is expected to reach 65 per cent in 2035, and exactly two thirds (66.6 per cent) according urbanization will remain. By 2035, 90 per cent of those living in Java west of the West Java-Central Java border will be urban dwellers. This massive population of 76 million will be concentrated mainly in the twin mega-urban regions of Jakarta and Bandung. By Barat and Maluku Utara will be living in urban areas. The danger is that as the rural percentage of the population gradually declines to one third of the population, the shift in planning emphasis towards the majority urban population could result in the relative neglect of the still very large rural population, which is expected to still exceed 100 million in This would be very unfortunate, not least because the rural population experiences higher levels of poverty and of other forms of disadvantage. Nations projections are of considerable interest. Unfortunately, these do not include a realistic projection of the urban agglomeration of Indonesia s largest city, Jakarta, or of Indonesia s next three largest cities Surabaya, Bandung and Medan as the projections kota boundaries for the other three cities. Moreover, for some reason, the UN Population Division does not include Bekasi, Tangerang, Tangerang Selatan or Depok in their list of Indonesian cities. their projections for likely future developments, it is anticipated there will be an increase in the number of Indonesian cities with over one million population from seven in 2010 (when the cities in Jakarta s vicinity are all included in the one mega-urban area) to 14 in 2030, using the same criteria. The projections show much faster growth of certain cities outside of Java than within it. Thus, over the 20-year period from , the population of Batam is projected to increase by 167 per cent, Pekan Baru by 91 per cent, Samarinda by 76 per cent, Jambi by 64 per cent, Makassar by 57 per cent and Bandar Lampung by 53 per cent. This is much faster than the projected growth of similar-sized 95
109 cities in Java, with the notable and surprising exception of Tasikmalaya, which is projected to grow by 123 per cent BPS Urban population 118, , , , , ,230 Rural population 119, , , , , ,422 UN Population Division , , , , , , , , , , , ,432 9,630 10,323 11,298 12,589 13,812 2,768 2,853 3,051 3,401 3,760 2,399 2,544 2,771 3,103 3,433 2,101 2,204 2,385 2,669 2, ,391 1,896 2,236 2,486 1,558 1,630 1,761 1,972 2,188 1,336 1,489 1,676 1,895 2,104 1,455 1,455 1,527 1,701 1, ,121 1,354 1,556 1, ,073 1, ,004 1,170 1, ,013 1,159 1, ,126 1, ,156 Source: Bappenas/BPS/UNFPA 2013; UN Population Division, 2014 how can they be narrowed? large part from the lower incomes in rural areas, meaning that as individuals and families, rural dwellers on average have less resources at their disposal than urban dwellers. Furthermore, government revenues in provinces and districts with less productivity are lower on a per capita basis, meaning fewer government resources per head to supply infrastructure and facilities. This can, of course, be countered through cross- 96
110 expect that they can be totally eradicated. 4. Increasing the liveability of Indonesian cities (Dick and Rimmer, 1998), de-population of the urban core and a rush to suburbia. This process has been fostered by a number of factors, including extremely high central-city land values, the rapid growth of large-scale real estate development on lower-priced fringe-area land, and fear among the urban middle classes of a breakdown in law and order in central city areas (at its height at the fall of the Suharto government in 1998 and in subsequent years). This process has been fostered by unrealistically low gasoline prices resulting from government fuel subsidies, holding down the rupiah cost of long commutes by private cars or public transport. The vast new towns are dependent on transportation connecting these towns to the city centre both exacerbates congestion on mega-urban regions? Aside from the scarcity of parks and other urban amenities, the in the MURs. Starting the commute at 5 or 6, as opposed 7a.m., may cut the travel time considerably. Likewise, eating dinner close to the workplace after work and delaying the trip home until 8 or 9 p.m. may also cut the length of the dreaded commute. The question must be raised, however; does this contribute to a high quality of life for those living in the MUR? The wealthier are increasingly investing in apartments close to the downtown workplace to avoid the commute. This option is not viable for the ordinary MUR-dweller. Indonesian city planning can take steps, however, to improve the quality of life for the converting built-up land to public parkland should be seized where possible such as closure of factories or warehouses. Flooding and drainage problems can be ameliorated of existing drainage systems. Perhaps most important to ordinary city dwellers, however, is the improvement of public transportation systems, widening the scope for people to access available jobs. The greatest challenge in this regard is to maintain fares that are 97

111 5. Gender and youth empowerment, access and vulnerabilities Urbanization raises particular issues for the empowerment of women and youth through access to services, employment and other opportunities. While urbanization in general and the growth of very large cities in particular opens up many opportunities for women and youth, at the same time both of these groups face particular vulnerabilities in urban areas. The advantages of urban populations in terms of a number of indicators, shown in Chapter 3, are shared by women and youth. For example, in the household, higher average incomes in urban areas enable women to better budget household needs and necessary expenditure on children. At the same time, widened employment opportunities and rising levels of education may encourage women and men to come to more genderequal household decision-making processes. Urban youth also have better access to a wide range of educational and social opportunities than those in rural areas. Greater anonymity, and relative freedom from social controls enjoyed by city dwellers, however, 98
112 number of fronts such as exposure to sexual harassment, drug dealing, crime and other anti-social behaviours. Sexual harassment in the workplace is common, and the need to reserve sections of Jakarta buses for women to shield them from sexual harassment illustrates that much remains to be done before Indonesian society internalizes norms of respect for women. Patterns of rural-urban migration lead to youth being over-represented in urban areas, those who move to urban areas alone and those who grow up in a family setting in urban areas face certain vulnerabilities. In addition to the pressures on low-income youth in making ends meet, all young people in urban areas must deal with the many personal issues associated with moving through adolescence. In particular, they are subject to readily-accessible pornographic videos, set against a conservative attitude within family and school circles which fails to provide education and advice on sexuality or access to contraception for the sexually active. Premarital sex, which can result in pregnancy, abortion, single motherhood or marriage to an unsuitable partner, is a reality that cannot be ignored. Whilst it is certainly not limited to urban areas, it appears to be more more common in certain rural areas. 6. Urban governance and community involvement The development of Indonesia s mega urban regions is the product of urban fragmentation resulting from decentralisation policy implemented in 2001 (Firman, an appropriate mechanism of governance that can optimize the potential of an urban region, improving its competitiveness and the quality of life of its residents. Governance includes the power exercised not only by formal government institutions, but also by civil society and the private sector. Indonesia s development policy changed markedly with the initiation of political reform in 1997, following governmental regime change triggered by the economic and decentralization, with a transfer of wide-ranging government responsibilities from the national to local governments. This policy has aimed to bring the public decision-making issues of urban planning on the whole remain passive onlookers as the processes of urban change the clearance of slums, shifting of heavier industry from traditional 99
113 that they lack a voice in the planning and political processes that lead to the decisions that will change their lives. The key challenge in Indonesia, as elsewhere, is to develop on these decisions. governance and planning The mega-urban region centred in DKI Jakarta faces massive governance and planning issues, both because of its vast population (larger than that of Australia) and the three kabupaten. This is further compounded when it is recognized that industrial estates outside of Jabodetabek. Under Indonesia s decentralized governance system, in operation since 2004, the power of local government (kabupaten/kota) has increased. This brings with it enormous issues and ensure the sustainability (Firman, 2014: 380) of developments in the region. There is already an institution tasked with coordinating and monitoring development in the region; the Jabodetabek Development Cooperation Agency (Badan Kerjasama Pembangunan - BKSP). All three provincial governors, as well as the heads of kabupaten and municipal governments (bupati and walikota member local governments (Firman, 2014: 380). The establishment of a single authority that would override the authority of the three provincial governments in matters relating to Jabodetabek would create strong political tensions. Firman (2014: ) argues that a more workable model would be to enhance the powers of the BKSP to plan and develop major infrastructure for the whole region, including spatial development, watershed management, solid waste management and transport. The provincial governments would relinquish their authority over these functions, but retain authority over socio-economic development and public former being crucial due to the limited capacity of provincial and local government to complex issues. The main necessity, however, is for all heads of governments in the region to display leadership and a willingness to cooperate to secure the best long-term outcomes for the greater Jakarta area (Firman, 2014: 382). From an international perspective, the issues discussed in this section are not unique to Jabodetabek, but are shared by many of the world s megacities. Tokyo, Mumbai and the 100
114 certainly be closely studying the approaches used in other countries. 8. Recommendations for further research While there has been considerable research into various aspects of Indonesia s cities and their planning and administrative issues, what has been markedly lacking in recent times is demographic-based research into the growth dynamics of Indonesian towns and cities. There is urgent need for a study along the lines of the National Urban Development and towns, and to build a series of strategy options and recommendations on urban trends and issues. Various studies have been conducted since then, including the study of 7 urban agglomerations based on comparison of 1990 Population Census and 1995 Inter-Censal Survey data (BPS, ANU and UNFPA, 2000), and the Bappenas-World Bank studies in thorough study is needed, utilizing a detailed database on change in urban populations, Potensi desa (Podes) data, and 2000 and 2010 Population Census data. This should be used to study changes over time in the urban status of the more than 70,000 kelurahan/ and functional terms, and the growth dynamics of Indonesia s mega-urban regions. The three components of the growth of Indonesian urban areas natural increase, net the sharp increase in urbanization in Java between 2000 and The data for such analysis is potentially available in the desa-level data from the 2000 and 2010 Population Censuses, but the questionable growth trends shown for some of the cities and towns that are not kota administratip spatial analysis, which has not yet taken place. Despite its shortcomings, Appendix Table data, focusing on urban desa and using mapping and GPS approaches to delineate urban areas and urban clusters, is urgently needed as a baseline for future studies on urban growth and other aspects of urbanization, and to form a foundation for evidence-based policy prescriptions. In comparing characteristics of urban and rural populations, not only can population census data be used, but so too can Supas and Susenas data and Demographic and 101
115 2012. The more that demographically-oriented data can be linked with other relevant of mega-urban regions, the more informed policy can become. All that is needed is for government and international agencies to be aware of the great importance of indepth studies of Indonesian urbanization trends and issues, and to be willing to devote usefully into the planning process. Given the major change in the Indonesian administrative structure at the beginning of the 21 st Century, leading to the devolution of many functions to the kabupaten/kota kabupaten/ kota governments relative to provincial/national governments led to any change in the growth rate of kabupaten capitals relative to that of other cities? that would contribute to development planning in Indonesia and that have not yet been conducted, but even restricting consideration to studies with a strong demographic base, it is clear that little attention has been paid so far to the gender aspects of urbanization. opportunities for males and females in the changing urban employment mix, and The inter-relationships between urbanization and ageing are another important area for further study, including the role of migration in modifying the proportions of the Such studies could be of great importance for policymakers responsible for planning There has been a dearth of spatial analysis and thematic mapping using the census data, and even less mapping of change. A key aspect requiring in-depth study is the pattern of changes over time in the status of desa What is needed is not only analysis of changes in the urban or rural status of desa, but also of boundary changes as new districts, sub-districts and villages have been created through splitting of old ones. The most recent 2010 Census boundaries need to be used Technological developments such as satellite imagery and use of night lights data to study urbanization should be fully utilized in Indonesian urbanization studies (see Montgomery land values, and factory employment need to analysed against trends in population change, to produce a comprehensive picture of urbanization trends in Indonesia and the factors driving them. 102
116 ANNEX
117 government units (kota each of the smallest administrative units (desa) is given a functional urban or rural status according to their own characteristics (Firman, 2007). kota madya (province) or second level (kabupaten) capital which did not have kota madya status, or 3) it was another than 80 per cent of the labor force working outside of agriculture were considered urban, even if the generally done by local consensus, meaning there was no statistical basis for systematic application (Milone, 1966, Ch. 7). In the population census of 1971, the criteria of having 50 percent or more of the population working outside of agriculture and the presence of three urban facilities (hospital/ clinic, school and electricity) were added, but again there was no systematic checking of this (Sigit and Sutanto, 1983). As noted by Gardiner (1993:3), there are problems with this kind of framework. Rigidities in administrative boundaries could sometimes lead to substantial over-statement of the actual urban population, if large rural populations were included within the boundary. Conversely, populations could The decision was then made to move to a functional basis for classifying urban populations for the Indonesian population censuses of 1980 and 1990, in order to give a more accurate estimate of the actual urban population, provide a basis to include processes of rural-urban transformation, and to achieve greater transparency in the calculation process (Gardiner, 1993: 4). The process was based on desa/keluruhan), as either rural or urban. A scoring system was used, incorporating three variables: population density, the facilities and services. For each of these variables, a village could be allocated a score between 1 and 10, rising as population density and the number of urban facilities increased and the proportion of households in agriculture decreased. Villages scoring above 21 were automatically considered urban, those with scores below 18 were considered rural, and those with scores of 19 or 20 were re-assessed. It should be noted that maximum values for any single criterion were not required for a village to be per square km to be considered urban, provided that it had a high score on other criteria. This point was misunderstood by many commentators. 104
118 Using the above criteria, the Central Board of Statistics (CBS) used a more technical scoring system in households working in the agriculture sector. A fundamental change was also applied for the urban facilities scoring system, by including accessibility. Although such a system has its weaknesses, the ANNEX TABLE 1. Year 1961 Population Census 1971 Population Census 1980 and 1990 Population Census Criteria of urban area i) Rural area located in municipality ii) Rural area located in the capital city of district iii) More than 80 percent of population working in non agriculture sector, although rural area is not located in municipality and/or the capital city of district i) Rural area located in municipality ii) Rural area located in the capital city of district iii) More than 80 percent of population working in non agriculture sector iv) More than 50 percent of population working in non agriculture sector and at least has three urban facilities (hospital/clinic, school and electricity) A scoring technique was applied for each of three variables: population density per square km, percentage of household working in agriculture sector and the availability of urban facilities. The table below shows the scoring system used. Population density (per sq. km) Households in agriculture (%) Number of urban facilities* Score <500 > >4999 < *Facilities included: primary school, junior high school, senior high school, cinema, hospital, primary health centre, restaurant, public electricity and party equipment rental service. Source: Sigit and Sutanto, and 2010 Population Census There were some changes in the scoring system for the variables of population density and percentage of household working in the agriculture sector. A fundamental change was also applied to the urban facilities scoring sytem by assessing accessibility to the facilities. Source: 105
119 desa) and rural area (Kawasan Perdesaan) Annex Table 2 shows the distribution of rural villages (desa 2005 and There are two terms in Indonesia related to rural (kawasan perdesaan) and village (desa) as mentioned in Law No. 6/2014 on Village (desa) and Law No. 26/2007 on Spatial Planning 8. Rural is management. ANNEX TABLE 2. desa Region Least developed (Tertinggal) Within the region (%) Developing (Berkembang) Self- Developed (Mandiri) % of national Least developed (Tertinggal) Within the region (%) Developing (Berkembang) Self- Developed (Mandiri) % of national Sumatera Jawa and Bali Nusa Tenggara Kalimantan Sulawesi Maluku Papua National Number of Villages at national level Western Part of Indonesia of Indonesia 8,445 50,873 10,635 69,953 20,939 43,391 15,609 79, Source: Village Potential (Potensi desa) 2005 and Note: Includes urban villages (Kelurahan) autonomous authorities to regulate and manage their own government and community interest, based on the initiative of the local community, express opinions and/or following traditional adat procedures under the jurisdiction of Government of Indonesia. The village government is led by the head of the village, who is directly elected by the local community. 8 GoI uses the term Regional Government (Pemerintah Daerah) for sub-national governments, including Provinces (Provinsi), and below that local governments that comprise Cities (kota), and Districts (kabupaten). Cities and Districts have the same preponderantly rural economy. 106
120 City as an administrative region. of individual cities and towns by the Government of Indonesia. In fact, urban and rural population administrative boundaries, and these are still used in the formulation of National Urban Development Policy and Strategy (KSPN, 2013). The National Development Planning Board (Bappenas) used three administrative categories of urban areas referred to in Law No. 32/2004 on Local Governance (administrative decentralization). These include: i) urban areas as autonomous regions known as city governments, ii) urban areas within district boundaries (district capital towns), and iii) urban areas spilling over into one or more adjacent administrative areas. In legal terms of administrative regions, Indonesia in 2015 had 34 provinces, 98 autonomous city governments 9 and 415 district governments. cities (kota Spatial Planning. These include the following categories: i) metropolitan city with a population above 1 million, ii) large city with a population between 500,000 to 1 million, iii) medium city with a population between 100,000 to 500,000 and iv) small city with a population between 50,000 to 100,000. Thirty-four of the kota listed were established in the period since decentralization ( ), and their number is likely to increase in the future as a result of continued upgrading of district capital towns (IKK) to cities (kota), in order to provide them with administrative powers commensurate with their population size and economic importance, thus separating them from their former districts. The number of IKK terms of population size can be seen in Annex Table 3. ANNEX TABLE 3: No Population Number Pop. Combined % 1 Metropolitan Cities More than 1 million 14 27,396, Large Cities 3 Medium Cities Between 500,000 and 1 million Between 100,000 and 500, ,378, ,151, Small Cities Up to 100, , Kota total 98 50,418, Total 67,902, Urban areas total 118,320, Source: Adapted and elaborated from Bappenas KSPN 2011 and BPS Data *Includes kabupaten capitals, kecamatan capitals and urban villages not included in any of the other categories, with widely varying populations
121 kota is quite complex, involving a town to be awarded the status of kota. Any new kota must consist of at least four kecamatan, and must also meet a number of other criteria, including social, political and demographic aspects and administrative capability. 108
122 ANNEX
123 National Spatial Plan (RTRWN) and security, social, economic, cultural and environmental aspects, as well as world heritage sites. There are 7 (seven) metropolitan urban areas included as KSN. These are: 2. Kawasan Perkotaan Medan Binjai Deli Serdang Karo (Mebidangro) 3. Kawasan Perkotaan Jabodetabek-Punjur including Kepulauan Seribu 4. Kawasan Perkotaan Cekungan Bandung 5. Kawasan Perkotaan Kendal Demak Ungaran Salatiga Semarang Purwodadi (Kedung Sepur) 6. Kawasan Perkotaan Gresik Bangkalan Mojokerto Surabaya Sidoarjo Lamongan (Gerbangkertosusila) 7. Kawasan Perkotaan Denpasar Badung Gianyar - Tabanan (Sarbagita) 8. Kawasan Perkotaan Makassar Maros Sungguminasa Takalar (Mamminasata) The Central Government has the authority to formulate spatial planning for national strategic areas, which are then stipulated as Presidential Decrees. Up to now, there have been 4 (four) Presidential Regulations stipulated for Mebidanggro, Jabodetabek-Punjur, Sarbagita and Maminasata No Mega-urban region Coverage area Reference 1. Medan, Binjai, Deli Serdang, Karo (Mebidangro) 2. Jabodetabek- Punjur 3. Cekungan Bandung Mebidangro covers 52 sub-districts: All sub-districts in the City of Medan (21 subdistricts) All sub-districts in the City of Binjai (5 subdistricts) All sub-districts in the District of Deli Serdang (22 sub-districts) 4 (four) sub-districts in the District of Karo Jabodetabek-Punjur covered the following subdistricts: All sub-districts in the City of Jakarta All sub-districts in the City of Bogor All sub-districts in the City of Depok All sub-districts in the City of Tangerang All sub-districts in the City of Tangerang Selatan All sub-districts in the City of Bekasi All sub-districts in the District of Bogor All sub-districts in the District of Tangerang All sub-districts in the District of Bekasi 4 (four) sub-districts in the District of Cianjur Cekungan Bandung covered the following subdistricts: All sub-districts in the City of Bandung All sub-districts in the City of Cimahi All sub-districts in the District of Bandung All sub-districts in the District of Bandung Barat Presidential Regulation No. 62 Presidential Regulation No. 54 West Java Spatial Plan (Local Regulation) 110
124 No Mega-urban region Coverage area Reference 4. Kedung Sepur Kedung Sepur covered the following sub-districts: All sub-districts in the City of Semarang All sub-districts in the City of Salatiga All sub-districts in the District of Semarang All sub-districts in the District of Kendal All sub-districts in the District of Demak All sub-districts in the District of Grobogan Technical Study on Kedung Sepur, Gerbangkertasusila Gerbangkertasusila covered the following subdistricts: All sub-districts in the City of Surabaya All sub-districts in the District of Gresik All sub-districts in the District of Sidoardjo All sub-districts in the District of Lamongan All sub-districts in the District of Mojokerto All sub-districts in the District of Bangkalan 6. Sarbagita 7. Maminasata Sarbagita covered 15 sub-districts: All sub-districts in the City of Denpasar (4 subdistricts) 4 (four) sub-districts in the District of Gianyar 2 (four) sub-districts in the District of Tabanan Maminasata covered 15 sub-districts: All sub-districts in the City of Makasar (14 subdistricts) All sub-districts in the District of Takalar (9 subdistricts) 11 sub-districts in the District of Gowa 12 sub-districts in the District of Maros Presidential Regulation No. 45 Presidential Regulation No
125 References Aditjondro, George, 1986, Datang dengan Kapal, Tidur di Pasar, Buang Air di Kali, Pulang Naik Pesawat alternative estimates, Journal of Population Research, 30(4): population in Indonesia, in Christophe Guilmoto and Gavin W. Jones (eds), Contemporary Population Dynamics in China, India and Indonesia, Dordrecht: Springer. Badan Pusat Statistik (BPS), 2001, Population of Indonesia. Results of the 2000 Population Census, Series: L2.2, Jakarta: BPS. Badan Pusat Statistik (BPS), 2014, Statistical Yearbook of Indonesia 2014, Jakarta: BPS. BPS, ANU and UNFPA, 2000, Pertumbuhan Penduduk dan Perubahan Karakteristik Tujuh Wilayah Aglomerasi Perkotaan di Indonesia , Jakarta: BPS. Indonesia, Vol. 3, pp New Forms of Urbanization Davidson, Jamie, 2008, From Rebellion to Riots: Collective Violence in Indonesian Borneo, Madison: University of Wisconsin Press. Surabaya, City of Work: A Socioeconomic History, , Singapore: Singapore University Press. Urban Studies, 35(12): Migration, Urbanization and Development in Indonesia Bulletin of Indonesian Economic Studies, 28(2), pp , International Development Planning Review, 25(1), pp Place, 10, pp (JBR) Development, Habitat International 33, pp (Jakarta Metropolitan Area), in NA Phelps and F. Wu (eds), International Perspectives on Suburbanization: a Post-Suburban World, New York, Palgrave Macmillan, pp
126 Regional Dynamics in a Decentralized Indonesia, Singapore: Institute of Southeast Asian Studies. at the macro level, in Christophe Guilmoto and Gavin Jones (eds), Contemporary Population Dynamics in China, India and Indonesia, Dordrecht: Springer. and Bandung Metropolitan Area, Review of Urban and Regional Development Studies, 7: Urban Policy and Research, 25(4): Sejahtera; Social Science Research and Consultancy. Planning, in Gavin W. Jones and Pravin Visaria (eds.), Urbanization in Large Developing Countries Clarendon Press, pp Indonesia Assessment: Population and Human Resources, Singapore: Institute of Southeast Asian Studies. Journal of Geography and Geology, 6(4), pp Migrasi Internal Penduduk Indonesia: Hasil Sensus Penduduk 2010, Jakarta: BPS. American Economic Review, 60(1): Urban Development: Theory, Fact and Illusion The Internet in Indonesia s New Democracy, London: Routledge Geography, Bulletin of Indonesian Economic Studies, 44(3): The Urban Transformation of the Developing World Population and Development Review, 8(1): Goh (eds.), Challenge Sustainability: Urban Development and Change in Southeast Asia, Singapore: Marshal Cavendish Academic, pp The Demographic Dimension in Indonesian Development Jellinek, Lea, 1991, The Wheel of Fortune: The History of a Poor Community in Jakarta, Sydney: Allen and Unwin., Bulletin of Indonesian Economic Studies, 20(3), pp
127 , 38(3): Bulletin of Indonesian Economic Studies, 37. Journal of Population Research, 19, pp Challenge Sustainability: Urban Development and Change in Southeast Asia, pp , Singapore: Marshal Cavendish Academic. (eds), Singapore: NUS Press. Jones, Gavin W. and Mike Douglass (eds), 2008,, Singapore: NUS Press. educational gradient in the Jakarta Mega Urban Region: a spatial analysis, Bulletin of Indonesian Economic Studies, LIPI. What Drives Third World City Growth? A Dynamic General Equilibrium Approach, Princeton: Princeton University Press. Kementerian Perencanaan Pembangunan Nasional/Badan Perencanaan Pembangunan Nasional, 2013, Rancangan Kebijakan dan Strategi Pembangunan Perkotaan Nasional (KSPPN), , Jakarta: Bappenas. Mamas, Si Gde Made and Rizky Komalasari, 2008, Jakarta dynamics of change and livability, in Jones and Douglass, op cit. and employment outcomes among young migrants in Greater Jakarta, Asian Population Studies, 9(1): T.G. McGee (eds.), The Extended Metropolis: Settlement Transition in Asia Press, pp McKinsey Global Institute, 2012, The Archipelago Economy: Unleashing Indonesia s Potential, Mera, Koichi, 1982, National Spatial Policies and Urban Development: Lessons from the Japanese Experience Milone, Pauline D., 1966, Urban Areas in Indonesia: Administrative and Census Concepts, Berkeley: Institute of International Studies, University of California. Global Urbanization, Philadelphia: University of Pennsylvania Press. 114
128 Regional Dynamics in a Decentralized Indonesia, Singapore: Institute of Southeast Asian Studies. Cohesion for Development Program, Rimisp, Santiago, Chile. National Research Council, 2003, Cities Transformed: Demographic Change and its Implications in the Developing World, Washington D.C.: The National Academies Press. National Urban Development Strategy Project, 1985, NUDS Final Report, Jakarta: Department of Public Works. Peters, Robbie, 2013, Surabaya, : Neighbourhood, State and Economy in Indonesia s City of Struggle, Singapore: NUS Press. Regional Dynamics in a Decentralized Indonesia, Singapore: Institute of Southeast Asian Studies. The City in Southeast Asia: Patterns, Processes and Policy, Singapore: NUS Press. Rondinelli, D. (1983), Secondary Cities in Developing Countries, California: Sage Publications. Komunikasi Pembangunan Indonesia (Indonesian Development Communication Forum), Jakarta, 18 March. Sawarendro, 2010, Sistem Polder dan Tanggul Laut: Penanganan Banjir Secara Madani di Jakarta, Indonesia Land penduduk 1971 dan 1980, in P.F. McDonald (ed), Pedoman Analisa Data Sensus Indonesia , Canberra: Australian Vice Chancellors Committee Silver, Christopher, 2008, Planning the Megacity: Jakarta in the Twentieth Century, London: Routledge. Statistics Indonesia (Badan Pusat Statistik BPS), National Population and Family Planning Board (BKKBNi), and Indonesia Demographic and Health Survey Jakarta, Indonesia: BPS, BKKBN, Kemenkes, and ICF International. Regional Dynamics in a Decentralized Indonesia, Singapore: Institute of Southeast Asian Studies. Information related to Climate Change in Jakarta City, Paper prepared for the Workshop on Climate Change Vulnerability Assessment and Urban Development Planning for Asian Coastal Cities, Rose Garden Sampran Riverside, Nakorn Pathom, Thailand, August Thee Kian Wee, 2012, Indonesia s Economy since Independence Tim Penyusun, 2011, Bunga Rampai, Pembangunan kota Indonesia dalam Abad 21: Konsep dan Pendekatan Pembangunan Perkotaan di Indonesia Development Institute (URDI). 115
129 Indonesia, in Aris Ananta (ed), The Indonesian Crisis: A Human Development Perspective, Singapore: Institute of Southeast Asian Studies., Jakarta: LIPI. Guha-Khasnobis and S.M.R. Kanbur, Urbanization and Development: Multidisciplinary Perspectives United Nations Population Division, 2014, World Urbanization Prospects: the 2014 Revision World Bank, 2009, World Development Report 2009: Reshaping Economic Geography, Washington, D.C.: World Bank Indonesia: The Rise of Metropolitan Regions: Towards Inclusive and Sustainable Regional Development, Unpublished Report 71740, Jakarta. World Bank, 2015, Indonesia Economic Quarterly: Slower Gains, World Bank, Jakarta, July Xin Meng and Chris Manning (eds), 2010, The Great Migration: Rural-Urban Migration in China and Indonesia, 116
130 Glossary ; The ageing index is calculated as the number of persons 60 years old or over per hundred persons under age 15. ; a measure of urban concentration, using three factors: population density, the population of a large urban centre and travel time to that large urban centre. ; the temporary and usually repetitive movement of a migrant between home and host areas, typically for the purpose of employment ; a group of people sharing a common temporal demographic experience who are observed through time. For example, the birth cohort of 1900 is the people born in that year. There are also marriage cohorts, school class cohorts, and so forth. as the ratio of children (those aged 0-14 years) and the elderly (those aged 65 years and over) to the working age population (those aged years). Desa; a village that has autonomous authority is the status of a person at the place where he/she works. Categories include: 1. Own-account worker, is a person who works at her/ his own risk without being assisted by a paid or unpaid worker. 2. Employer assisted by temporary workers/unpaid worker, a person who works at her/his own risk and is assisted by temporary worker/unpaid worker. 3. Employer assisted by permanent workers/paid workers, is a person who does his/her business at her/his own risk and is assisted by at least one paid permanent worker. 4. Employee money/cash or goods as a wage/salary. 5. Casual employee, is a person who does not work permanently for other people/employer/ institution and receives money or goods as a wage/salary either based on a daily or contract payment system. 6. Family/Unpaid worker, is a person who works for other people without pay in cash or goods. These unpaid workers could be: a. Family members who work for another person in their family, e.g. a wife or child who helps their husband b. A non-family member who works for another person but still has family relations, such as those who help their family relatives to sell goodsin a minimarket and are unpaid. person who weaves hats for their neighbor s home industry business, and is unpaid. 117
131 ; the population of the largest city divided by the sum of the populations of the next three largest cities; a measure of urban primacy ; refers to the change of status of a desa from rural to urban, so that the population of the desa become urban dwellers without any change of residence ; a district, sometimes referred to as regency. A second-level administrative subdivision, on the same level as a kota, immediately below the province and above the sub-district (kecamatan). There are more camat, who is a civil servant. ; a village under the jurisdiction of the kecamatan (sub-district) kabupaten. More generally, perkotaan refers to matters pertaining to urban areas. Lebaran; or Idul Fitri - the holiday at the end of the Muslim fasting month that age could expect to live if current mortality levels observed for ages above that age were to continue for the rest of that person s life. In particular, life expectancy at birth is the average number of years a newborn ; a very large city Mega-urban region (MUR) city, including the built-up areas of the urban agglomeration, as well as rural-urban fringe areas with a complex mix of activities and changing physical environment a city with a population exceeding one million in units of deaths per 1,000 individuals per year. the death of newborns before reaching 28 days of life looking at population dynamics means going beyond mere numbers to examining trends and changes in population growth, demographic structures and societal changes, including migration, urbanization, population density and age structures (being proportions of young and older people in societies) infant deaths occurring between 28 days and 364 days of life 118
132 ; refers to the change of status of a desa from rural to urban or (rarely) from urban to rural ; the average number of children that would be born alive to a woman (or group of fertility rates of a given year. densely settled Java and Bali to outer island provinces ; a corridor, not necessarily totally urbanized but with a number of urban areas located along it, linking major urban areas ; the domination of the urban hierarchy by one large city ; refers to an increase in the proportion of a population living in urban areas. If population growth in a country is 2 per cent per annum, for example, and the growth of the urban population is also 2 per cent per annum, urbanization is not taking place. If, on the other hand, the urban population is increasing by more then 2 per cent per annum in a country where population growth is 2 per cent per annum, then urbanization an increase in the urban share of the total population is taking place. - usually taken to mean a built-up or densely populated area containing the city proper, suburbs and continuously settled commuter areas or adjoining territory inhabited at urban levels of residential density. has to do with the pattern in the descending size of cities that is typically observed. For 119
133 120
134 121
135 APPENDIX TABLE 1 Population of main cities and towns, by province, 2000 and 2010 Province and city Population 2000 Population 2010 % increase Banda Aceh 216, , Lhokseumawe 32, , Langsa 117, , Subulussalam 44,523 67, Bireun 22,892 57, Karang Baru 49,662 52, Meulaboh 38,310 49, Takengon 34,102 37, Sigli 35,506 Sabang 23,535 28, Kutacane 18,457 22, Medan 1,904,273 2,097, Lubuk Pakam 330, , Binjai 213, , Pematang Siantar 241, , Padang Sidempuan 107, , Sei Rampah 174, , Stabat 137, , Tanjung Balai 132, , Kisaran 107, , Tebing Tinggi 124, , Rantau Prapat 103, , Gunung Sitoli 71, , Sibolga 81,699 84, Padang 713, , Payakumbuh 97, , Bukit Tinggi 91, , Batu Sangkar 98, , Parit Malintang 89,639 86, Pariaman 74,336 79, Solok 48,120 59,
136 Province and city Population 2000 Population 2010 % increase Sawah Lunto 50,868 56, Padang Panjang 40,139 47, Painan 38,508 43, RIAU Pekan Baru 585, , Dumai 173, , Tembilahan 80, , Bagan Siapi api 68,372 81, Bengkalis 56,515 72, Pangkalan Kerinci 53,303 66, Bangkinang 37,684 43, Rengat 36,721 42, Batam 437, , Tanjung Pinang 137, , Tanjung Balai Karimun 75,033 96, Bandar Seri Bintan 54,196 37, JAMBI Jambi 416, , Sungai Penuh 88, , Kuala Tungkal 47,032 64, Sarolangun 44,671 46, Bangko 23,020 44, Muara Bungo 39,398 32, Muara Bulian 25,440 26, Palembang 1,451,419 1,455, Lubuk Linggau 124, , Prabumulih 89, , Pagar Alam 118, , Baturaja 99, , Indralaya 133, , Lahat 72,128 87, Sekayu 30,204 44, ,116 41, Kota Kayu Agung 31,846 40,
137 Province and city Population 2000 Population 2010 % increase Pangkal Pinang 125, , Sungai Liat 67,504 82, Manggar 53,496 66, Toboali 26,250 37, Mentok 19,021 36, Bengkulu 279, , Curup 87,262 95, Manna 34,618 42, Kepahiang 19,704 24, Argamakmur 19,137 19, LAMPUNG Bandar Lampung 742, , Gunung Sugih 259, , Pringsewu 179, , Metro 118, , Kotabumi 92, , Kalianda 30,751 37, DKI JAKARTA DKI Jakarta 8,356,489 9,607, JAWA BARAT Bandung 2,136,260 2,394, Bekasi 1,663,802 2,334, Depok 1,143,403 1,738, Bogor 750, , Karawang 660, , Cikarang 712,111 Tasikmalaya 602, , Cimahi 442, , Garut 273, , Purwakarta 276, , Sukabumi 252, , Cirebon 272, , Kuningan 160, , Banjar 156, , Cianjur 128, , Indramayu 110, ,
138 Province and city Population 2000 Population 2010 % increase Sumedang 99, , Telukjambe Timur 107, , Cicurug 94, , Ciamis 86, , Subang 79, , Batang 109,255 Jatinangor 83, , Cipanas 103,911 Majalengka 54, , Kecamatan with urban population above 100,000 in: Kapubaten Bandung 1,398, kecamatan Kab. Bandung Barat 420,438 3 kecamatan Kapubaten Bekasi 358,579 2 kecamatan Kapubaten Bogor 1,970, kecamatan Kapubaten Cirebon 1,550,882 9 kecamatan Tangerang 1,325,854 1,798, Tangerang Selatan 863,575 1,290, Serang 458, , Cilegon 294, , Pandeglang 158, , Rangkasbitung 93, , Kecamatan with urban population above 100,000 in kabupaten Tangerang 1,033,999 6 kecamatan Semarang 1,298,643 1,555, Kudus 477, , Surakarta 490, , Pekalongan 261, , Cilacap 223, , Jepara 262, , Pemalang 146, , Tegal 235, , Purwokerto 213, , Brebes 105, , Salatiga 144, , Sragen 150,
139 Province and city Population 2000 Population 2010 % increase Klaten 115, , Magelang 115, , Sukoharjo 74, , Kecamatan with urban population above 100,000 in kabupaten Tegal 295,358 2 kecamatan Sleman 738, , Bantul 561, , , , Wates 63,449 66, Wonosari 34,875 51, JAWA TIMUR Surabaya 2,599,796 2,765, Sidoardjo 1,339,311 1,772, Malang 756, , Jombang 379, , Gresik 303, , Nganjuk 336, , Jember 291, , Kediri 244, , Tulungagung 257, , Probolinggo 191, , Banyuwangi 101, , Batu 77, , Pasuruan 168, , Madiun 163, , Situbondo 145, , Blitar 119, , Mojokerto 108, , BALI Denpasar 532, , Mangapura/Badung 267, , Gianyar 227, , Singaraja 275, , Tabanan 197, , Negara 163, , Amlapura 114, ,
140 Province and city Population 2000 Population 2010 % increase Semarapura 110, , Bangli 113, , Mataram 315, , Bima 111, , Selong 87, , Praya 54, , Sumbawa Besar 86,252 83, Gerung 92,841 64, Dompu 22,872 42, Kupang 237, , ,101 81, Atambua 41,039 74, Ruteng 55,005 61, Kalabahi 27,001 37, Soe 26,295 35, Larantuka 27,025 32, Kefamenanu 11,787 24, KALIMANTAN BARAT Pontianak 464, , Singkawang 77, , Sungai Raya 120, , Ketapang 70,327 87, Sintang 31,420 54, Sanggau 25,681 38, Nenga Pinoh 11,344 24, Mempawah 20,966 23, Palangka Raya 158, , Sampit 134, , Pangkalan Bun 144, , Kuala Kapuas 8,510 59, Buntok 23,549 30, Muara Teweh 26,721 33, Banjarmasin 527, ,
141 Province and city Population 2000 Population 2010 % increase Banjar Baru 123, , Martapura 81, , Kotabaru 55,160 68, Batulicin 37,175 63, Amuntai 36,979 52, Tanjung 34,657 49, Barabai 30,226 44, KALIMANTAN TIMUR Samarinda 521, , Balikpapan 409, , Bontang 99, , Tanjung Redeb 50,984 89, Sangata 39,409 85, Tenggarong 44,048 71, Tana Paser 22,598 49, KALIMANTAN UTARA Tarakan 116, , Nunukan 26,817 45, Tanjung Selor 19,117 29, Manado 372, , Bitung 140, , Kotamobagu 50, , Tomohon 43,749 91, Airmadidi 19,134 62, Tondano 29,617 40, Tahuna 20,450 26, Gorontalo 134, , Limboto 26,950 52, Marisa 2,201 17, Palu 263, , Luwuk 44,870 58, Toli-Toli 36,338 52, Poso 12,357 34, Bora 6,422 24,
142 Province and city Population 2000 Population 2010 % increase Buol 7,055 22, Parigi 12,617 21, Makassar 1,100,019 1,338, Sungguminasa 136, , Palopo 108, , Pare Pare 108, , Watampone 89, , Turikale 51,436 89, Pinrang 54,635 67, Pangkajene 37,310 51, Bulukumba 49,018 47, Sinjai 38,930 47, Bantaeng 38,128 46, Kendari 200, , Bau-bau 106, , Kolaka 34,665 45, Raha 32,905 42, Unaha 11,516 18, Majene 45,705 58, Polewali 41,425 52, Mamuju 21,185 44, MALUKU Ambon 186, , Tual 25,005 58, Masohi 28,717 31, Dobo 16,194 29, Namlea 11,418 26, MALUKU UTARA Ternate 152, , Soa Siu 30,976 90, Tobelo 26,806 Sanana 11,049 25, PAPUA Jayapura 155, ,
143 Province and city Population 2000 Population 2010 % increase Mimika 106,529 Merauke 21,907 86, Nabire 14,252 61, Wamena 14,765 37, Biak 20,193 36, Serui 10,344 35, PAPUA BARAT Sorong 96, , Manokwari 30, , Kaimana 6,196 20, Fakfak 14,024 19, For Java, this table only includes towns and cities with populations above 100,000 in For some of the smaller provinces in other islands, however, there are very few large towns and cities, so much smaller towns are included, sometimes with populations as small as 20,000. For 2010, the populations of the cities and towns that were not autonomous city governments were estimated from the urban populations at the kecamatan and desa level, checked against maps using GPS are not given separately for all towns that make up the extended urban areas of Jakarta, Bandung, Cirebon, Semarang and Surabaya. Rather, the total urban populations of all the kecamatan with urban populations above 100,000 in the relevant kabupaten are listed. The populations of most of these kecamatan For 2000, the data was only made available to the authors shortly before publication of this report. The populations of the cities and towns that were not autonomous city governments at the time of the 2000 Census were obtained by including the areas of the relevant kecamatan it was not possible to check these in detail against maps, as had been done for the 2010 populations. Therefore, the level of reliability of the 2000 estimates is lower. There are clear anomalies in some cases estimates, and rates of increase or decrease between the time periods should therefore be treated with caution. 130
144 APPENDIX TABLE 2 Percentage of lifetime in-migrants, urban and rural areas, by province, 2000 and 2010 Province Urban areas Rural areas Aceh North Sumatra West Sumatra Riau Riau Islands Jambi South Sumatra Bengkulu Lampung Bangka Belitung DKI Jakarta West Java Central Java Banten Bali NTB NTT West Kalimantan Central Kalimantan South Kalimantan North Sulawesi Central Sulawesi South Sulawesi Southeast Sulawesi West Sulawesi Gorontalo Maluku North Maluku Papua West Papua Source: BPS, 2001, Tables 11.1, 11.2; BPS Website, 2010 Census. 131
145 APPENDIX TABLE 3 Percentage of recent in-migrants, urban and rural areas, by province, 2000 and 2010 Province Urban areas Rural areas All areas Aceh North Sumatra West Sumatra Riau Riau Islands * 16.6 * Jambi South Sumatra Bengkulu Lampung Bangka Belitung DKI Jakarta West Java Central Java Banten Bali NTB NTT West Kalimantan Central Kalimantan South Kalimantan North Sulawesi Central Sulawesi South Sulawesi Southeast Sulawesi Gorontalo Maluku North Maluku Papua West Papua ** 11.1 ** Source: BPS, 2001, Tables 12.1, 12.2; BPS website, 2010 Census. *Included in Riau **Included in Papua 132
146 Working population aged 15+ by industry, cities included Industry group DKI Jakarta Kota Bekasi Kota Depok Kota Tangerang Kota Tang. Selatan Kota Bogor Cols (3) to (7) combined (1) (2) (3) (4) (5) (6) (7) (8) , ,328 (13) community services (14) others. 133
147 134

148
REGIONAL LABOUR MARKETS DURING DEREGULATION IN INDONESIA Have the Outer Islands Been Left Behind?
 REGIONAL LABOUR MARKETS DURING DEREGULATION IN INDONESIA Have the Outer Islands Been Left Behind? By Chris Manning Abstract Indonesian labour markets have undergone a major transformation over the past
THE EMPLOYABILITY AND WELFARE OF FEMALE LABOR MIGRANTS IN INDONESIAN CITIES
 SHASTA PRATOMO D., Regional Science Inquiry, Vol. IX, (2), 2017, pp. 109-117 109 THE EMPLOYABILITY AND WELFARE OF FEMALE LABOR MIGRANTS IN INDONESIAN CITIES Devanto SHASTA PRATOMO Senior Lecturer, Brawijaya
Centre for Economic Policy Research
 The Australian National University Centre for Economic Policy Research DISCUSSION PAPER Rural Urban Migration in Indonesia: Survey Design and Implementation Budy P. Resosudarmo, Chikako Yamauchi, and Tadjuddin
People. Population size and growth. Components of population change
 The social report monitors outcomes for the New Zealand population. This section contains background information on the size and characteristics of the population to provide a context for the indicators
Regional Labor Markets during Deregulation
 Public Disclosure Authorized POLICY RESEARCH WORKING PAPER 1728 Public Disclosure Authorized Public Disclosure Authorized Regional Labor Markets during Deregulation Have the Outer Islands Been Left Behind
University of Groningen. Inter-regional migration in Indonesia Wajdi, Nashrul; Mulder, Clara; Adioetomo, Sri Moertiningsih
 University of Groningen Inter-regional migration in Indonesia Wajdi, Nashrul; Mulder, Clara; Adioetomo, Sri Moertiningsih Published in: Journal of Population Research DOI: 10.1007/s12546-017-9191-6 IMPORTANT
Chapter One: people & demographics
 Chapter One: people & demographics The composition of Alberta s population is the foundation for its post-secondary enrolment growth. The population s demographic profile determines the pressure points
How Important Are Labor Markets to the Welfare of Indonesia's Poor?
 S /4 G 6 POLICY RESEARCH WORKING PAPER 1665 How Important Are Labor Markets to the Welfare of Indonesia's Poor? Andrew D. Mason Jacqueline Baptist Because poverty mainly afflicts agricultural and self-employed
People. Population size and growth
 The social report monitors outcomes for the New Zealand population. This section provides background information on who those people are, and provides a context for the indicators that follow. People Population
DRIVERS OF DEMOGRAPHIC CHANGE AND HOW THEY AFFECT THE PROVISION OF EDUCATION
 DRIVERS OF DEMOGRAPHIC CHANGE AND HOW THEY AFFECT THE PROVISION OF EDUCATION This paper provides an overview of the different demographic drivers that determine population trends. It explains how the demographic
Provincial Poverty Rates in Indonesia,
 Provincial Poverty Rates in Indonesia, 2006 2011 September 2013 This publication was produced by DAI/Nathan Group for review by the United States Agency for International Development (USAID). It is made
Sustainable cities, human mobility and international migration
 Sustainable cities, human mobility and international migration Report of the Secretary-General for the 51 st session of the Commission on Population and Development (E/CN.9/2018/2) Briefing for Member
Human development in China. Dr Zhao Baige
 Human development in China Dr Zhao Baige 19 Environment Twenty years ago I began my academic life as a researcher in Cambridge, and it is as an academic that I shall describe the progress China has made
How does development vary amongst regions? How can countries promote development? What are future challenges for development?
 Chapter 9- Development How does development vary amongst regions? How can countries promote development? What are future challenges for development? Human Development Index (HDI) Development process of
How Important Are Labor Markets to the Welfare of Indonesia's Poor?
 Public Disclosure Authorized Public Disclosure Authorized Public Disclosure Authorized Public Disclosure Authorized S /4 POLICY RESEARCH WORKING PAPER 1665 How Important Are Labor Markets to the Welfare
DOES POST-MIGRATION EDUCATION IMPROVE LABOUR MARKET PERFORMANCE?: Finding from Four Cities in Indonesia i
 DOES POST-MIGRATION EDUCATION IMPROVE LABOUR MARKET PERFORMANCE?: Finding from Four Cities in Indonesia i Devanto S. Pratomo Faculty of Economics and Business Brawijaya University Introduction The labour
STRENGTHENING RURAL CANADA: Fewer & Older: The Coming Demographic Crisis in Rural Ontario
 STRENGTHENING RURAL CANADA: Fewer & Older: The Coming Demographic Crisis in Rural Ontario An Executive Summary 1 This paper has been prepared for the Strengthening Rural Canada initiative by: Dr. Bakhtiar
Contents. Acknowledgements...xii Leading facts and indicators...xiv Acronyms and abbreviations...xvi Map: Pacific region, Marshall Islands...
 Contents Acknowledgements...xii Leading facts and indicators...xiv Acronyms and abbreviations...xvi Map: Pacific region, Marshall Islands... xii CHAPTER 1: CENSUS ORGANIZATION AND OPERATIONS...1 CHAPTER
National Assessments on Gender and Science, Technology and Innovation (STI) Overall Results, Phase One September 2012
 Overall Results, Phase One September 2012") National Assessments on Gender and Science, Technology and Innovation (STI) Scorecard on Gender Equality in the Knowledge Society Overall Results, Phase One September 2012 Overall Results The European
National Assessments on Gender and Science, Technology and Innovation (STI) Scorecard on Gender Equality in the Knowledge Society Overall Results, Phase One September 2012 Overall Results The European
Poverty Profile. Executive Summary. Kingdom of Thailand
 Poverty Profile Executive Summary Kingdom of Thailand February 2001 Japan Bank for International Cooperation Chapter 1 Poverty in Thailand 1-1 Poverty Line The definition of poverty and methods for calculating
HIGHLIGHTS. There is a clear trend in the OECD area towards. which is reflected in the economic and innovative performance of certain OECD countries.
 HIGHLIGHTS The ability to create, distribute and exploit knowledge is increasingly central to competitive advantage, wealth creation and better standards of living. The STI Scoreboard 2001 presents the
Asia-Pacific to comprise two-thirds of global middle class by 2030, Report says
 Strictly embargoed until 14 March 2013, 12:00 PM EDT (New York), 4:00 PM GMT (London) Asia-Pacific to comprise two-thirds of global middle class by 2030, Report says 2013 Human Development Report says
Case Study on Youth Issues: Philippines
 Case Study on Youth Issues: Philippines Introduction The Philippines has one of the largest populations of the ASEAN member states, with 105 million inhabitants, surpassed only by Indonesia. It also has
Abbreviations 2. List of Graphs, Maps, and Tables Demographic trends Marital and fertility trends 11
 CONTENTS Abbreviations 2 List of Graphs, Maps, and Tables 3 Introduction 5 1. Demographic trends 7 2. Marital and fertility trends 11 3. Literacy, education and training 20 4. Migration 25 5. Labour force
Economic Indicator Evaluation Based on Shape Deformation Analysis of Indonesian Provinces Statistics
 Economic Indicator Evaluation Based on Shape Deformation Analysis of Indonesian Provinces Statistics Catur Apriono 1, Riri Fitri Sari 1, Yuriko Yano 2, and Yukari Shirota 2 ABSTRACT This paper presents
Fiscal Impacts of Immigration in 2013
 www.berl.co.nz Authors: Dr Ganesh Nana and Hugh Dixon All work is done, and services rendered at the request of, and for the purposes of the client only. Neither BERL nor any of its employees accepts any
THE DEMOGRAPHIC PROFILE OF THE ARAB COUNTRIES
 Distr. LIMITED E/ESCWA/SDD/2013/Technical paper.14 24 December 2013 ORIGINAL: ENGLISH ECONOMIC AND SOCIAL COMMISSION FOR WESTERN ASIA (ESCWA) THE DEMOGRAPHIC PROFILE OF THE ARAB COUNTRIES New York, 2013
Migration, Mobility, Urbanization, and Development. Hania Zlotnik
 Migration, Mobility, Urbanization, and Development Hania Zlotnik SSRC Migration & Development Conference Paper No. 22 Migration and Development: Future Directions for Research and Policy 28 February 1
Trends in Labour Supply
 Trends in Labour Supply Ellis Connolly, Kathryn Davis and Gareth Spence* The labour force has grown strongly since the mid s due to both a rising participation rate and faster population growth. The increase
STRENGTHENING RURAL CANADA: Fewer & Older: Population and Demographic Crossroads in Rural Saskatchewan. An Executive Summary
 STRENGTHENING RURAL CANADA: Fewer & Older: Population and Demographic Crossroads in Rural Saskatchewan An Executive Summary This paper has been prepared for the Strengthening Rural Canada initiative by:
Poverty Profile. Executive Summary. Republic of Indonesia
 Poverty Profile Executive Summary Republic of Indonesia February 2001 Japan Bank for International Cooperation Chapter 1 Poverty in Indonesia 1-1 Poverty Line The official government poverty figures are
Levels and trends in international migration
 Levels and trends in international migration The number of international migrants worldwide has continued to grow rapidly over the past fifteen years reaching million in 1, up from million in 1, 191 million
Toward Rising Non-Permanent Population Mobility: A case of commuters in Indonesia 1
 Toward Rising Non-Permanent Population Mobility: A case of commuters in Indonesia 1 Evi Nurvidya Arifin (enarifin@gmail.com) Universitas Indonesia and Universitas Respati Indonesia Aris Ananta (arisananta@gmail.com)
Trends in Poverty and Inequality in Decentralising Indonesia
 Trends in Poverty and Inequality in Decentralising Indonesia Riyana Miranti, Yogi Vidyattama, Erick Hansnata, Rebecca Cassells and Alan Duncan NATSEM, University of Canberra Presentation to the Working
STRENGTHENING RURAL CANADA: Fewer & Older: The Coming Population and Demographic Challenges in Rural Newfoundland & Labrador
 STRENGTHENING RURAL CANADA: Fewer & Older: The Coming Population and Demographic Challenges in Rural Newfoundland & Labrador An Executive Summary 1 This paper has been prepared for the Strengthening Rural
vi. rising InequalIty with high growth and falling Poverty
 43 vi. rising InequalIty with high growth and falling Poverty Inequality is on the rise in several countries in East Asia, most notably in China. The good news is that poverty declined rapidly at the same
Statistics Update For County Cavan
 Social Inclusion Unit November 2013 Key Figures for Cavan Population 73,183 Population change 14.3% Statistics Update For County Cavan Census 2011 Shows How Cavan is Changing Population living in 70% rural
Youth labour market overview
 1 Youth labour market overview With 1.35 billion people, China has the largest population in the world and a total working age population of 937 million. For historical and political reasons, full employment
Online Appendices for Moving to Opportunity
 Online Appendices for Moving to Opportunity Chapter 2 A. Labor mobility costs Table 1: Domestic labor mobility costs with standard errors: 10 sectors Lao PDR Indonesia Vietnam Philippines Agriculture,
The Trends of Income Inequality and Poverty and a Profile of
 http://www.info.tdri.or.th/library/quarterly/text/d90_3.htm Page 1 of 6 Published in TDRI Quarterly Review Vol. 5 No. 4 December 1990, pp. 14-19 Editor: Nancy Conklin The Trends of Income Inequality and
Ghana Lower-middle income Sub-Saharan Africa (developing only) Source: World Development Indicators (WDI) database.
 Source: World Development Indicators (WDI) database.") Knowledge for Development Ghana in Brief October 215 Poverty and Equity Global Practice Overview Poverty Reduction in Ghana Progress and Challenges A tale of success Ghana has posted a strong growth performance
Knowledge for Development Ghana in Brief October 215 Poverty and Equity Global Practice Overview Poverty Reduction in Ghana Progress and Challenges A tale of success Ghana has posted a strong growth performance
Population Projection Alberta
 Population Projection Alberta 215 241 Solid long term growth expected Alberta s population is expected to expand by about 2.1 million people by the end of the projection period, reaching just over 6.2
LABOUR AND EMPLOYMENT
 5 LABOUR AND EMPLOYMENT The labour force constitutes a key resource that is vital in the growth and development of countries. An overarching principle that guides interventions affecting the sector aims
Mr. Ali Ahmadov Deputy Prime Minister of the Republic of Azerbaijan, Chairman of the National Coordination Council for Sustainable Development
 Mr. Ali Ahmadov Deputy Prime Minister of the Republic of Azerbaijan, Chairman of the National Coordination Council for Sustainable Development 2 Azerbaijan joined the Millennium Declaration in 2000. To
Indonesia. The Dynamics of Minimum Wage in Indonesia s Manpower System. I. Introduction. Ikomatussuniah
 Indonesia The Dynamics of Minimum Wage in Indonesia s Manpower System Ikomatussuniah I. Introduction II. Minimum wage and PP 78 III. Conclusion I. Introduction Wages 1 are one of the important components
City of Greater Dandenong Our People
 City of Greater Dandenong Our People 2 City of Greater Dandenong Our People Contents Greater Dandenong people 4 Greater Dandenong people statistics 11 and analysis Population 11 Age 12 Unemployment Rate
ECONOMIC GROWTH AND EMPLOYMENT
 Graduate School of Development Studies ECONOMIC GROWTH AND EMPLOYMENT Analysis The Relationship between Economic Growth and Employment in Indonesia Period 1993-2003 A Research Paper presented by: LILI
CONTENTS INTRODUCTION ORIGIN AND REGIONAL SETTING DISTRIBUTION AND GROWTH OF POPULATION SOCIAL COMPOSITION OF POPULATION 46 53
 CONTENTS CHAPTER PAGE NOs. INTRODUCTION 1 8 1 ORIGIN AND REGIONAL SETTING 9 19 2 DISTRIBUTION AND GROWTH OF POPULATION 20 44 3 SOCIAL COMPOSITION OF POPULATION 46 53 4 SEX COMPOSITION OF POPULATION 54
Population Aging, Immigration and Future Labor Shortage : Myths and Virtual Reality
 Population Aging, Immigration and Future Labor Shortage : Myths and Virtual Reality Alain Bélanger Speakers Series of the Social Statistics Program McGill University, Montreal, January 23, 2013 Montréal,
Geo Factsheet September 2000 Number 97
 September 2000 Number 97 Rural and Urban Structures - How and why they vary in LEDCs and MEDs Introduction structure is the percentage distribution of males and females by age group within an area and
Post-Secondary Education, Training and Labour September Profile of the New Brunswick Labour Force
 Post-Secondary Education, Training and Labour September 2018 Profile of the New Brunswick Labour Force Contents Population Trends... 2 Key Labour Force Statistics... 5 New Brunswick Overview... 5 Sub-Regional
Development in Southeast Asia's lagging Regions: Comparing Papua, Southern Thailand and Mindanao
 Development in Southeast Asia's lagging Regions: Comparing Papua, Southern Thailand and Mindanao Indonesia Project Arndt-Corden Department of Economics Crawford School of Public Policy ANU College of Asia
Appendix A: Economic Development and Culture Trends in Toronto Data Analysis
 Appendix A: Economic Development and Culture Trends in Toronto Data Analysis Introduction The proposed lenses presented in the EDC Divisional Strategy Conversation Guide are based in part on a data review.
Changing Times, Changing Enrollments: How Recent Demographic Trends are Affecting Enrollments in Portland Public Schools
 Portland State University PDXScholar School District Enrollment Forecast Reports Population Research Center 7-1-2000 Changing Times, Changing Enrollments: How Recent Demographic Trends are Affecting Enrollments
ASSESSING THE ECONOMIC IMPACT OF FOREIGN WORKERS IN MALTA
 ASSESSING THE ECONOMIC IMPACT OF FOREIGN WORKERS IN MALTA Article published in the Quarterly Review 2016:1, pp. 39-44 BOX 3: ASSESSING THE ECONOMIC IMPACT OF FOREIGN WORKERS IN MALTA 1 Between the late
The Evolving Composition of Poverty in Middle-Income Countries: The Case of Indonesia,
 WORKING PAPER The Evolving Composition of Poverty in Middle-Income Countries: The Case of Indonesia, 1991 2007 Andy Sumner The King s International Development Institute King s College, London WORKING
The Poor in the Indian Labour Force in the 1990s. Working Paper No. 128
 CDE September, 2004 The Poor in the Indian Labour Force in the 1990s K. SUNDARAM Email: sundaram@econdse.org SURESH D. TENDULKAR Email: suresh@econdse.org Delhi School of Economics Working Paper No. 128
New Brunswick Population Snapshot
 New Brunswick Population Snapshot 1 Project Info Project Title POPULATION DYNAMICS FOR SMALL AREAS AND RURAL COMMUNITIES Principle Investigator Paul Peters, Departments of Sociology and Economics, University
Human Population Growth Through Time
 Human Population Growth Through Time Current world population: 7.35 Billion (Nov. 2016) http://www.worldometers.info/world-population/ 2012 7 billion 1999 13 years 12 years 1974 1927 1804 13 years 14 years
and with support from BRIEFING NOTE 1
 and with support from BRIEFING NOTE 1 Inequality and growth: the contrasting stories of Brazil and India Concern with inequality used to be confined to the political left, but today it has spread to a
Low-Skill Jobs A Shrinking Share of the Rural Economy
 Low-Skill Jobs A Shrinking Share of the Rural Economy 38 Robert Gibbs rgibbs@ers.usda.gov Lorin Kusmin lkusmin@ers.usda.gov John Cromartie jbc@ers.usda.gov A signature feature of the 20th-century U.S.
Total age in years
 Figure. % children in employment, 7-14 years age group, 2009 % in employmen nt 16 14 12 10 8 6 4 2 0 2.9 3.2 4.7 5.2 5.6 8.3 10.7 13.5 7 8 9 10 11 12 13 14 Total age in years 6.6 Almost 7% of 7-14 year-olds,
Indonesia and The Implementation of ASEAN Economic Community
 Indonesia and The Implementation of ASEAN Economic Community International Business Management Esther Kezia Simanjuntak 3099190 ABSTRACT Asean Economic Community (AEC) 2015 is a free market realization
SPATIAL CONCENTRATION OF THE INFORMAL SMALL AND COTTAGE INDUSTRY IN INDONESIA, *
 SPATIAL CONCENTRATION OF THE INFORMAL SMALL AND COTTAGE INDUSTRY IN INDONESIA, 1998-2004 * ALOYSIUS GUNADI BRATA (aloy.gb@gmail.com) Faculty of Economics, Atma Jaya Yogyakarta University [ Draft - July
1 Dr. Center of Sociology, Ho Chi Minh National Political Academy, Vietnam.
 Conference "Southeast Asia s Population in a Changing Asian Context June 10-13, 2002 Siam City Hotel, Bangkok, Thailand The Patterns of fertility decline and family changes in Vietnam s emerging market
Maria del Carmen Serrato Gutierrez Chapter II: Internal Migration and population flows
 Chapter II: Internal Migration and population flows It is evident that as time has passed, the migration flows in Mexico have changed depending on various factors. Some of the factors where described on
MEETING THE NEED FOR PERSONAL MOBILITY. A. World and regional population growth and distribution
 30 II. MEETING THE NEED FOR PERSONAL MOBILITY A. World and regional population growth and distribution The world population grew at an annual rate of 1.4 per cent between 1990 and 2000. This is slightly
INDONESIA INDONESIA ANNUAL PUBLIC OPINION SURVEYS 2007 REPORT
 INDONESIA INDONESIA ANNUAL PUBLIC OPINION SURVEYS 2007 REPORT FEBRUARY 2008 This publication was produced for review by the United States Agency for International Development by Democracy International,
Inequality in Indonesia: Trends, drivers, policies
 Inequality in Indonesia: Trends, drivers, policies Taufik Indrakesuma & Bambang Suharnoko Sjahrir World Bank Presented at ILO Country Level Consultation Hotel Borobudur, Jakarta 24 February 2015 Indonesia
Summary of the Results
 Summary of the Results CHAPTER I: SIZE AND GEOGRAPHICAL DISTRIBUTION OF THE POPULATION 1. Trends in the Population of Japan The population of Japan is 127.77 million. It increased by 0.7% over the five-year
Profile of Poverty and Probability of Being Poor in Rural Indonesia
 Profile of Poverty and Probability of Being Poor in Rural Indonesia Susumu Hondai Research Professor, International Centre for Study of East Asian Development, Kitakyushu Working Paper Series Vol. 2005-16
PROJECTING THE LABOUR SUPPLY TO 2024
 PROJECTING THE LABOUR SUPPLY TO 2024 Charles Simkins Helen Suzman Professor of Political Economy School of Economic and Business Sciences University of the Witwatersrand May 2008 centre for poverty employment
INEQUALITY IN THE DISTRIBUTION OF HOUSEHOLD EXPENDITURES IN INDONESIA: A THEIL DECOMPOSITION ANALYSIS
 The Developing Economies, XXXVII-2 (June 1999): 197 221 INEQUALITY IN THE DISTRIBUTION OF HOUSEHOLD EXPENDITURES IN INDONESIA: A THEIL DECOMPOSITION ANALYSIS TAKAHIRO AKITA RIZAL AFFANDI LUKMAN YUKINO
11. Demographic Transition in Rural China:
 11. Demographic Transition in Rural China: A field survey of five provinces Funing Zhong and Jing Xiang Introduction Rural urban migration and labour mobility are major drivers of China s recent economic
Executive summary. Strong records of economic growth in the Asia-Pacific region have benefited many workers.
 Executive summary Strong records of economic growth in the Asia-Pacific region have benefited many workers. In many ways, these are exciting times for Asia and the Pacific as a region. Dynamic growth and
Employment opportunities and challenges in an increasingly integrated Asia and the Pacific
 Employment opportunities and challenges in an increasingly integrated Asia and the Pacific KEIS/WAPES Training on Dual Education System and Career Guidance Kee Beom Kim Employment Specialist ILO Bangkok
Global Employment Trends for Women
 December 12 Global Employment Trends for Women Executive summary International Labour Organization Geneva Global Employment Trends for Women 2012 Executive summary 1 Executive summary An analysis of five
URBAN POVERTY AND MOBILITY IN INDONESIA
 URBAN POVERTY AND MOBILITY IN INDONESIA Indonesia has undergone rapid urbanisation in the last half century, and this is expected to continue over the next two decades Millions 197 75 8 85 9 95 2 5 1 15
IDS WORKING PAPER Volume 2012 No 409
 IDS WORKING PAPER Volume 2012 No 409 The Evolving Composition of Poverty in Middle-Income Countries: The Case of Indonesia, 1991 2007 Andy Sumner November 2012 Poverty and Inequality Research Cluster The
MARRIAGE & PARENTHOOD
 CONTENTS OVERVIEW 3 KEY INDICATORS 4 OVERALL POPULATION 5 AGEING 8 MARRIAGE & PARENTHOOD 10 IMMIGRATION & CITIZENS BY DESCENT 14 1 ANNEX Overall Population Table 1: Total population 16 Table 2: Singapore
Spatial Concentration of the Informal Small and Cottage Industry in Indonesia
 MPRA Munich Personal RePEc Archive Spatial Concentration of the Informal Small and Cottage Industry in Indonesia Brata Aloysius Gunadi Faculty of Economics, Atma Jaya Yogyakarta University 2007 Online
The Demography of the Labor Force in Emerging Markets
 The Demography of the Labor Force in Emerging Markets David Lam I. Introduction This paper discusses how demographic changes are affecting the labor force in emerging markets. As will be shown below, the
Demographics. Chapter 2 - Table of contents. Environmental Scan 2008
 Environmental Scan 2008 2 Ontario s population, and consequently its labour force, is aging rapidly. The province faces many challenges related to a falling birth rate, an aging population and a large
Human Development Indices and Indicators: 2018 Statistical Update. Indonesia
 Human Development Indices and Indicators: 2018 Statistical Update Briefing note for countries on the 2018 Statistical Update Introduction Indonesia This briefing note is organized into ten sections. The
Developing a Regional Core Set of Gender Statistics and Indicators in Asia and the Pacific
 Developing a Regional Core Set of Gender Statistics and Indicators in Asia and the Pacific Preparatory Survey Questionnaire REGIONAL CONSULTATIVE WORKSHOP TO DEVELOP A FRAMEWORK AND CORE SET OF GENDER
Last Time Industrialization in the late 19th Century up through WWII Import Substitution Industrialization (ISI) (1940s 1970s) Export Promotion
 (1940s 1970s) Export Promotion") Last Time Industrialization in the late 19th Century up through WWII Import Substitution Industrialization (ISI) (1940s 1970s) Export Promotion Industrialization TODAY Population growth, distribution,
Last Time Industrialization in the late 19th Century up through WWII Import Substitution Industrialization (ISI) (1940s 1970s) Export Promotion Industrialization TODAY Population growth, distribution,
London Measured. A summary of key London socio-economic statistics. City Intelligence. September 2018
 A summary of key socio-economic statistics September 2018 People 1. Population 1.1 Population Growth 1.2 Migration Flow 2. Diversity 2.1 Foreign-born ers 3. Social Issues 3.1 Poverty & Inequality 3.2 Life
UNFPA SSL EU November 2006
 UNFPA SSL EU November 2006 i FOREWORD Government and other Stakeholders have been eagerly awaiting this report. The long interval between the 1985 and the 2004 population censuses has been mainly attributed
Urbanisation in Asia: An Overview. Graeme Hugo
 Urbanisation in Asia: An Overview Graeme Hugo University of Adelaide Australia Paper prepared for Conference on African Migration in Comparative Perspective, Johannesburg, South Africa, 4-7 June, 2003.
POPULATION STUDIES RESEARCH BRIEF ISSUE Number
 POPULATION STUDIES RESEARCH BRIEF ISSUE Number 2008021 School for Social and Policy Research 2008 Population Studies Group School for Social and Policy Research Charles Darwin University Northern Territory
Demography. Demography is the study of human population. Population is a dynamic open systems with inputs, processes and outputs.
 Population Demography Demography is the study of human population. Population is a dynamic open systems with inputs, processes and outputs. This means that change constantly occurs in population numbers,
MAGNET Migration and Governance Network An initiative of the Swiss Development Cooperation
 International Labour Organization ILO Regional Office for the Arab States MAGNET Migration and Governance Network An initiative of the Swiss Development Cooperation The Kuwaiti Labour Market and Foreign
MIGRATION AND URBANIZATION IN VIET NAM
 GENERAL STATISTICS OFFICE THE 2014 VIET NAM INTERCENSAL POPULATION AND HOUSING SURVEY UNITED NATIONS POPULATION FUND THE 2014 VIET NAM INTERCENSAL POPULATION AND HOUSING SURVEY MIGRATION AND URBANIZATION
Population Outlook for the Portland-Vancouver Metropolitan Region
 Portland State University PDXScholar Institute of Portland Metropolitan Studies Publications Institute of Portland Metropolitan Studies 2007 Population Outlook for the Portland-Vancouver Metropolitan Region
THE IMPACT OF IMMIGRATION ON ENGLAND S HOUSING
 Briefing Paper 7.2 www.migrationwatchuk.org THE IMPACT OF IMMIGRATION ON ENGLAND S HOUSING Summary 1. Every few years the Government produces projections of the number of households in England which help
European Integration Consortium. IAB, CMR, frdb, GEP, WIFO, wiiw. Labour mobility within the EU in the context of enlargement and the functioning
 European Integration Consortium IAB, CMR, frdb, GEP, WIFO, wiiw Labour mobility within the EU in the context of enlargement and the functioning of the transitional arrangements VC/2007/0293 Deliverable
Economic and Social Council
 United Nations Economic and Social Council Distr.: General 27 December 2001 E/CN.3/2002/27 Original: English Statistical Commission Thirty-third session 5-8 March 2002 Item 7 (f) of the provisional agenda*
ndtv.com POPULATION Ann Maureen Samm-Regis
 ndtv.com POPULATION Ann Maureen Samm-Regis Definitions Population is the total number of people living in a specific area at a particular time. Demography: is the study of the population to determine its
Has Globalization Helped or Hindered Economic Development? (EA)
") Has Globalization Helped or Hindered Economic Development? (EA) Most economists believe that globalization contributes to economic development by increasing trade and investment across borders. Economic
Has Globalization Helped or Hindered Economic Development? (EA) Most economists believe that globalization contributes to economic development by increasing trade and investment across borders. Economic
Report. This version available at: Originally available from LSE IDEAS. Available in LSE Research Online: May 2012
 Dionisius A. Narjoko and Teguh Y. Wicaksono ASEAN: perspectives on economic integration: achieving the ASEAN Economic Community agenda: an Indonesian perspective Report Original citation: Narjoko, Dionisius