Why are relatively poor people not more supportive of redistribution? Evidence from a Survey Experiment across 10 countries
|
|
|
- Carmella Dorthy Patrick
- 5 years ago
- Views:
Transcription
1 Why are relatively poor people not more supportive of redistribution? Evidence from a Survey Experiment across 10 countries Christopher Hoy 1 Franziska Mager 2 First Draft (November 2018) Abstract. Using new cross-country and experimental evidence, we test a key assumption of conventional theories about preferences for redistribution, which is relatively poor people should be the most in favour of redistribution. We conduct a survey experiment across 10 countries with over 30,000 participants, half of which are informed of their position in the national income distribution. Contrary to prevailing wisdom, people who are told they are relatively poorer than they thought become less concerned about inequality and do not become more supportive of redistribution. This finding is driven by people using their own living standard as a benchmark for what they consider acceptable for others. JEL-Classification: D31, D63, D72, D83, O50, P16, H23 Keywords: Inequality, Social Mobility, Redistribution, Political Economy 1 Australian National University and corresponding author (christopher.hoy@anu.edu.au), 2 Oxfam Great Britain. The authors are grateful to seminar participants at LSE, Oxford, Kings College, UCL, Australian National University, Australian Labour Econometrics Workshop and the Australasian Development Economics Workshop. We are also very grateful for detailed comments provided on an earlier version of this paper by Russell Toth, Eva Vivalt, Stephen Howes, Emma Samman, Mathias Sinning, Deborah Hardoon and Ben Goldsmith. This paper presents independent analysis and is part of a project funded by the Abdul Latif Jameel Poverty Action Lab Southeast Asia (J-PAL SEA), Oxfam, the University of Sydney Research Excellence Initiative and Equity Economics. The content of the present version of the paper is solely the responsibility of the authors and does not necessary reflect the official views of the funders.
2 1 Introduction It is an unsolved mystery as to why there is often limited support among poorer people for policies where they are set to benefit, such as increases in cash transfers targeted to the poor or in the minimum wage (Kuziemko et al 2014, Roemer 1998, Holland 2018). This lack of support erodes the popularity of governments that are committed to reducing inequality by increasing redistribution (Frank 2004). Recent studies have identified a potential reason for why relatively poor people are not more supportive of redistribution; most of the poorest people in any given country do not realise they are towards the bottom of the national income distribution (Gimpelson and Treisman 2018, Bublitz 2016). Representative surveys across a range of countries have shown the majority of people tend to think they are positioned around the middle of the national income distribution regardless of whether they are rich or poor. These misperceptions are important because preferences for redistribution are more correlated with people s perceived than their actual position in the national income distribution (Gimpelson and Treisman 2018, Hauser and Norton 2017). This raises the question, if relatively poor people were made aware of their position in the national income distribution would they be more concerned about inequality and supportive of redistribution? We answer this question through an online survey experiment with over 30,000 respondents in 10 countries (Australia, India, Mexico, Morocco, Netherlands, Nigeria, South Africa, Spain, the United Kingdom and the United States) using the survey firms, YouGov, IPSOS and RIWI. The sample of respondents is representative of the population with internet access 1 in each country and collectively these 10 countries make up around 30% of the global population and represent about 40% of world GDP. Respondents were randomly allocated to either receive information about their position in the national income distribution (treatment group) or no information (control group). Prior to the treatment, they revealed their perception of the level of national inequality, their preferred level of national inequality, their perceived place in the national income distribution, their total household income and the number of people living in their household. 1 We present the sample average treatment effect in the body of the paper and in the appendix we weight the results by age and gender using census data in each country. The main effects do not differ qualitatively between the sample average treatment effects and nationally representative treatment effects 2
3 After the treatment, respondents were asked questions sourced from existing studies on this topic regarding their views about whether the gap between the rich and poor is too large in their country and whether they thought the government was responsible for closing this gap (Alesina et al 2018, ISSP 2009). We find respondents who are told they are relatively poorer 2 than they thought are less concerned about the gap between the rich and poor in their country and are not any more supportive of the government closing this gap compared to respondents in the control group. This result occurs in seven countries (India, Mexico, Morocco, Netherlands, Nigeria, South Africa and Spain) and there was no effect from this information in the remaining three countries (Australia, United Kingdom and the United States). The overall effect of the treatment was driven by people who prefer low levels of inequality and mainly by respondents in the poorest quintile (however there is still an effect in the second poorest quintile in most countries). We also show there was no treatment effect among respondents who accurately estimated their position in the distribution. Our results are contrary to what most conventional theories of preferences for redistribution would imply, which is informing people they are relatively poorer than they thought would lead to greater support for redistribution (eg. Meltzer and Richard 1981, Benabou and Ok 2001, Piketty 1995, Fehr and Schmidt 1999). However there is little empirical support for existing theories as only a small number of survey experiments have analysed how people s preferences for national redistribution are affected by information (Hauser and Norton 2017) and only one directly tests this hypothesis (Cruces et al 2013). The findings of this previous survey experiment of 1054 respondents in Buenos Aires (the capital of Argentina) were consistent with existing theory as people who found out they are relatively poorer than they thought were more supportive of redistribution compared to a control group. Yet there is also some evidence from related studies that suggest existing theories do not adequately capture how preferences for redistribution are formed. For example, experimental research in the United States by Kuziemko et al (2014) shows last place aversion can exist whereby poor people often prefer when there are people who are poorer than them. Similarly, there are inconsistent findings from the few studies that examine the effect of informing people they are richer than they thought 2 In the poorest or second poorest quintile in the national income distribution 3
4 (Nair 2018, Karadja et al 2017). We illustrate the likely channel that is causing the effect we detect is people using their own standard of living as a benchmark for what they consider acceptable for others by exploring the heterogenous treatment effects and modifying Fehr and Schmidt s seminal model of other-regarding preferences. This notion of "benchmarking" is consistent with one of the two key foundations of conventional theories of preferences for redistribution, which is people are averse to others in society having significantly different incomes to them. However, this study diverges from standard theory by showing people place greater weight on income differences between them and those who are relatively poorer than them as opposed to income differences between them and those who are relatively richer than them. In other words, when considering the national income distribution people are more concerned about the income level of people at the bottom of the distribution as opposed to the income level of people at the top 3. This concept of benchmarking is also in line with the paper by Nair (2018) that shows informing people they are relatively richer than they thought in the global income distribution increases their support for global redistribution. We rule out an alternative channel which is people prefer significant differences in incomes in their country by examining heterogeneous treatment effects based upon respondents preferences for inequality that were provided prior to the treatment. We also provide evidence that last place aversion is unlikely to be driving the results (Kuziemko et al, 2014), by showing the effect is not just driven by people at the bottom of the income distribution (ie. close to last place). This paper contributes to the existing understanding of how people s perceptions of inequality shape their support for redistribution in at least three ways. Firstly, the results draw into question the empirical basis for the predictions of most theories of preferences for redistribution. Importantly, our results are more generalisable than the limited number of previous studies as this is by far the largest survey experiment on how people s preferences for redistribution are affected by information and the first in multiple middle income countries. Secondly, we identify a plausible mechanism (that we refer to as benchmarking ) through which people update their beliefs about inequality that has 3 To put this another way, people seem more concerned about severe poverty as opposed to severe prosperity in their country 4
5 not previously been explicitly highlighted in the literature. This mechanism potentially helps to explain why poorer people are less supportive of redistribution than conventional theories of preferences for redistribution would suggest because benchmarking means there are competing channels through which people think about redistribution 4. The design of our study means we are better placed to explore the mechanisms through which information is having an effect than existing research as we provide a basic treatment, have a large sample size in each country and solicit people s views about inequality prior to the treatment. Finally, our results illustrate poor people s misperceptions of their position in the distribution do not appear to be lowering their concern about inequality and support for redistribution. We provide evidence the opposite is true. Poor people would be even less concerned about inequality if they knew their true position in the national income distribution. This paper is structured as follows. Section 2 provides a theoretical framework of how information can change people s concern about inequality, outlines the predictions that emerge from this framework (which we test) and how existing studies on this topic relate to these predictions. Section 3 outlines the methodology behind the survey experiment and types of econometric analyses that are conducted. Section 4 illustrates the descriptive trends from the survey data are consistent with previous research. Sections 5and6presenttheresultsofthefieldexperimentanddiscusshowthefindingsrelate to the predictions of the theoretical framework and existing theories of preferences for redistribution. 4 On the one hand, poorer people may be more supportive if they are set to benefit from redistribution, but on the other hand their support may be lower if they are less concerned about the absolute living standard of people who are relatively poor. For example, the Meltzer-Richard hypothesis (1981) put simply suggests most people below the median person in the distribution should support redistribution and most people above the median person should not. This is based on whether the individual is potentially set to benefit or lose from redistribution. However benchmarking would imply there is also an effect in the opposite direction. Even though relatively poor people may be likely to benefit from redistribution they are also less likely to think redistribution to the poor is needed. 5
6 2 Theory and Related Literature 2.1 Theoretical framework To illustrate how a person s position in the income distribution relates to their preferences, we start with a seminal model of other-regarding preferences by Fehr and Schmidt (1999). While this model does not explicitly predict how preferences change when individuals are provided with information, we follow Card et al (2012) who modify a similar utility function to illustrate how people update their beliefs. In a simple setting where there are three people and person A consumes between the other two, person A s utility function can be expressed as follows: U(c a,c p,c r )=U(c a ) U(c a c p ) U(c r c a ) In this model an individual s utility (U(c a,c p,c r )) depends on their own consumption (c a )aswellasthedirectionandsizeoftheweightingtheyplaceontheirconsumption relative to those poorer (c p )thanthem( )andricher(c r )thanthem( ). There are two foundational principles to Fehr and Schmidt s (1999) model that are common to most conventional theories of preferences for redistribution (Alesina et al, 2011). Firstly, people are more concerned about the gap between their consumption and those richer than them as opposed to the gap between their consumption and those poorer than them ( > ). Secondly, people are averse to others consuming significantly differently to them ( >0, >0). Collectively these principles imply > >0. Therefore individuals close to the top of the distribution (where c r -c a < c a -c p )havehigherutility (beyond just having a higher level of consumption) then those who are closer to the bottom of the distribution (where c r -c a > c a -c p ). As a result, this would suggest the poorer an individual is the more likely they are to be concerned about the gap in income between the rich and poor. Consequently, it is expected the poorer an individual is the more likely they would be supportive of redistribution (from rich to poor) 5. This 5 Changes in people s utility may not automatically equate to changes in their preferences for redistribution for a range of reasons. For example, if an individual lacks trust in the government then information about their place in the distribution might affect their utility but not their support for redistribution as they may believe the government will not address the problem. As such changes in other-regarding preferences could be considered a necessary but not sufficient condition for preferences 6
7 is the basis for most conventional theories of preferences for redistribution, such as the Meltzer-Richard hypothesis. We modify this model to reflect recent research indicating people s perceptions of their position in the distribution (as opposed to what is actually the case) is more closely correlated with their preferences (Gimpelson and Treisman 2018, Hauser and Norton 2017). Specifically, we show person A s utility is dependent on how they perceive the consumption of the other two individuals, as opposed to their actual consumption levels. The simple three-person model becomes: U(c a,c p (p),c r (p)) = U(c a ) U(c a c p (p)) U(c r (p) c a ) whereby; c p (p) =perceivedconsumptionofpersonpoorerthanc a and c r (p) =perceived consumption of person richer than c a. This revised model provides a framework to illustrate how information about an individual s position in the national income distribution ( cr c a ca c p )isexpectedtoaffect their preferences. If these foundational principles hold (ie. > >0), this would imply the following: Hypothesis: Informing people they are relatively poorer than they thought will increase their concern about the gap between the rich and poor and increase their support for the government to reduce this gap If c r c a > c r(p) c a c a c p c a c p (p) then [U(c a,c p,c r )] I <U(c a,c p (p),c r (p)) Where l =Informationaboutotherpeople sconsumption If the opposite outcome arises than predicted by this hypothesis, it could be due to either the first or second principle lacking empirical support. In other words, people may be more concerned about the gap between their consumption and those poorer than them ( < ) orpeoplemaynotbeaversetoothersconsumingsignificantlydifferently to them ( <0, <0). for redistribution to change. 7
8 2.2 Related literature Only a relatively recent and small literature of survey experiments exists that analyses how people s preferences for redistribution are affected by information (Hauser and Norton 2017). Influential studies by Kuziemko et al (2015) and Alesina et al (2018) show preferences for redistribution can be elastic to information, however neither test the hypothesis above. The only cross-country field experiment that directly relates to the research question in this paper provides a treatment with multiple pieces of information about inequality to respondents, including their position in the national income distribution (Bublitz, 2016). This treatment reduces support for redistribution among people who were richer than they thought in Germany and Russia but has no effect in the remaining four countries (France, Spain, Brazil and the United States). It is challenging to identify the channels that are causing this outcome as respondents were provided with various pieces of information about inequality in their country as well as their position in the distribution. The most relevant studies that examine this hypothesis and how they relate to the two foundational principles of most conventional theories of preferences for redistribution are summarised in Table 1 below. Only one survey experiment directly examines the hypothesis above. Cruces et al (2013) conduct a household survey experiment of 1054 respondents in Buenos Aires (the capital of Argentina) and show information about people s position in the national income distribution boosts support for redistribution among people who were relatively poorer than they thought. This result is consistent with this hypothesis and both of the principles of economic theory mentioned above (ie. > >0). A related study by Kuziemko et al (2014) provides evidence from laboratory experiments and surveys in the United States that last place aversion can exist whereby people near the bottom of the distribution are the least supportive of redistribution, particularly in the form of increases in the minimum wage. It is argued this is because poor people prefer a gap between their consumption and people relatively poorer than them. This finding inconsistent with the hypothesis above and implies the second foundational principle lacks empirical support (ie. <0). 8
9 Table 1: Summary of what key studies conclude regarding the shape of people s utility Foundational I and II hold I only II only principles > >0 <0 > >0 Relevant Cruces et al (2013) Kuziemko et al (2014) Nair (2018) studies Karadja et al (2017) There are two similar survey experiments that examine the effect of informing people they are relatively richer than they thought. The first by Karadja et al (2017) uses a postal survey experiment of 1001 respondents in Sweden and shows informing people they are relatively richer than they thought lowers support for redistribution 6. This result is compatible with this hypothesis and both principles of the theory mentioned above (ie. > >0). The second by Nair (2018), involves an online survey experiment of 1559 respondents in the United States and shows when people were told they were relatively richer than they thought in terms of the global income distribution, they became more supportive of international redistribution. He argues this finding is because people are averse to a large income gap between them and the poorest people in the world. This finding is incompatible with the hypothesis above and implies that the first theoretical principle is violated, but not the second (ie. > >0). 3 Methodology 3.1 Sample selection and sample size This study helps fill the gap in the literature about whether relatively poor people s misperceptions of their position in the national income distribution lowers their support for redistribution by testing the hypothesis above and by exploring if the foundational principles of most conventional theories of preferences for redistribution have empirical support. The survey experiment was conducted with over 30,000 respondents in 10 6 Almost all respondents to this study either underestimated or accurately estimated their position in the income distribution. As such there was too small a sample size (ie. inadequate statistical power) for the authors to directly examine the hypothesis above. 9
10 countries (Australia, India, Mexico, Morocco, Netherlands, Nigeria, South Africa, Spain, the United Kingdom and the United States) during the last three months of Similar to the case in Alesina et al (2018), data was collected of a representative sample of the population with internet access in each country using online survey firms (in our study we used YouGov, IPSOS and RIWI). This resulted in a sample of respondents where younger people and men were over represented compared to a perfectly nationally representative sample, especially in developing countries (see Table 2). Throughout the body of the paper we present the sample average treatment effect and to reduce concerns about the representativeness of the sample we present the treatment effects weighted by the age and gender of the national population in the appendix. In general, the effects are qualitative similar. Table 2: Age and gender of the survey sample and adult population in each country Survey Sample Adult Population Male (%) years old (%) Male (%) years old (%) Australia India Mexico Morocco Netherlands Nigeria South Africa Spain UK US Note: Population data was sourced from the World Bank (2017) In every country, the treatment and control groups had at least 800 respondents and on average there are around 1400 respondents. This is a similar sample size in each country to what was used in Kuziemko et al (2015) and Alesina et al (2018). Previous studies that just provided information about a respondent s position in the distribution only had around 500 respondents in the treatment group (Cruces et al 2013, Karadja et al 2017). As such we have substantially more statistical power to detect heterogeneous effects, such as differences in the effect of information between people based upon their pre-existing perceptions. 10
, while the second included questions about people s concerns about inequality and desire for government action.")
11 3.2 Survey design The survey consisted of two sections; the first collected people s existing perceptions of inequality and background characteristics (see appendix for a list of the questions asked prior to the treatment), while the second included questions about people s concerns about inequality and desire for government action. To measure respondents perception of the level of national inequality, previous studies have used a range of techniques, such as stylised distributions (ISSP, 2009) or asking respondents to estimate quintile shares (Norton et al, 2011). We follow the rationale behind existing approaches, however we minimise measurement error by gathering people s perceptions in an ordinal sense (Kuhn, 2015). Respondents were asked to select one of six options that represent the distribution of income in their country, ranging from perfectly equal to extremely unequal (see Figure 1). They were then asked to select the level of national inequality they would prefer to exist using the same set of options. We compare respondents answers to the question about their perceived level of inequality and preferred level of inequality to determine if they would prefer lower levels of inequality. Figure 1: Question about respondents perception of the existing level of inequality in the United States Respondents were also asked about which quintile they perceived their household to be in the national income distribution (Figure 2). This approach of using a limited 11
 as asking respondents their exact percentile in the distribution is likely to have a large margin of error.")
12 number of options for respondents to select from is similar to other studies (eg. Cruces et al 2013 and Karadja et al 2017) as asking respondents their exact percentile in the distribution is likely to have a large margin of error. The main difference is we use quintiles in this study (as opposed to deciles) to make it easier for people to understand even if they lack basic numeracy. We compare respondents answers to the question about their perceived position in the national distribution to their actual position in the national income distribution to determine if they accurately, under (relatively richer than they thought) or overestimated (relatively poorer than they thought) their position. Figure 2: Question about the position of respondents household in the income distribution The second part of the survey included questions about respondents concern about inequality and their support for redistribution. These questions were sourced from previous studies, specifically the International Social Survey Programme (ISSP) (2009) and Alesina et al (2018). The main outcomes of interest are measured using the questions in Table 3 below. Table 3: Key questions that capture people s concern about the gap between the rich and poor and the degree to which they believe the government is responsible for closing the gap GAP To what extent do you agree with the following statement The gap between the rich and the poor in (COUNTRY X) is too large (Strongly Agree, Agree, Neither Agree or Disagree, Disagree, Strongly Disagree) RESPONSIBILITY To what extent do you agree with the following statement It is the responsibility of the government to reduce the gap between the rich and the poor? (Strongly Agree, Agree, Neither Agree or Disagree, Disagree, Strongly Disagree) 12
 or no information (the control group).")
13 3.3 Details about the information provided to treatment groups Prior to answering the second section of the survey, respondents were randomly allocated to either receive information about their position in the income distribution (see an example in Figure 3) or no information (the control group). Randomisation ensured the effect of information could be determined by comparing average differences in answers to questions between the treatment and control groups. There were few statistically significant differences between treatment and control groups across demographic characteristics and existing perceptions of inequality in each country (see balance table in the appendix). To address any issues related to imbalance between treatment and control groups, we add in a set of control variables as part of the robustness checks we include in the appendix. Data about the income distribution in each country was sourced from the World Bank (WDI 2017, PovcalNET 2017) for the middle income countries and the OECD for high income countries (OECD, 2017). Figure 3: Information treatment shown to respondents in the Treatment group in the United States who belonged to the second richest quintile 3.4 Empirical model We perform two types of empirical analysis to capture the effect of information by comparing differences between the treatment and control groups in each country. We preregistered the analysis we planned on undertaking for this study with the American 13
14 Economic Association RCT registry (ID number AEARCTR ) (Hoy and Mager, 2017). We analyse the effect of information for each country individually because the information provided is tailored for the income distribution each country, the questions relate to redistribution by the national government and the political economy within each country differs. The first type of analysis we conduct is an OLS regression with a binary dependent variable (a linear probability model). This involves creating a dummy variable for the treatment group (T ), which takes on the value 1 if the respondent belongs to the treatment group and the value 0 if the respondent belongs to the control group. We also create a dummy variable for each question in Table 3 which takes on the value 1 if the respondent strongly agrees or agrees with the statement in question j and the value 0 if the respondent does not select one of these options (Y j ). The OLS regression conducted individually for each country can be written as follows: Y j = 0i + 1i T + " Where 1i captures the average difference in the share of respondents in the treatment and control groups that agreed with the statement in question j (ie. the treatment effect). 0i captures the share of respondents in the control group that agreed with the statement in question j and " is the model error term. We also conduct robustness checks whereby we add controls into the regression above as well as weighting the results by the age and gender of the national population. We analyse the heterogeneous treatment effects from information in regards to people s perceived position in the distribution, actual position in the distribution and preferred level of inequality. Using an OLS regression, we interact the treatment dummy with the characteristic (A i ) collected prior to the treatment. This can be written formally as: Y j = 0i + 1i T + 2i A i + 3i T A i + " 14
15 Where 3i captures the average difference in the share of respondents in the treatment and control groups who have characteristic (A i ) that agreed with the statement in question j. 1i captures the effect of the treatment on respondents who do not have characteristic (A i ). 2i captures the average level of characteristic (A i )amongrespondents in the control group. 0i captures the share of respondents in the control group who do not have characteristic (A i ) that agreed with the statement in question j and " is the model error term. The second type of analysis we conduct involves using an ordered logit model to analyse the effect of the information. We follow a similar approach to the first type of analysis whereby we capture the difference in responses between treatment and control groups using the co-efficient of a dummy variable for the treatment group (ie. T ). For simplicity and brevity, in the body of the paper we present tables of the linear probability model regressions and the appendix contains the results of the ordered logit regression. The results are qualitatively similar. 4 Data 4.1 Relationship between perceived position in the national income distribution and preferred level of national inequality We show across the 10 countries in our study, poor and rich people tend to have similar preferences for inequality to be lower than what they perceive it to be (see Table 4). There are some countries where the rich tend to be much less concerned (Spain, Mexico and the Netherlands), however there are others where the opposite is true (India and South Africa). The difference between the richest two quintiles and the poorest two quintiles in terms of their preference for lower inequality ranges from 13 percentage points to negative 15 percentage points. This startling pattern whereby there is limited difference between poor and rich people s desire for lower inequality is similar to what 15
16 has been observed in other studies (Kuziemko et al 2014, Roemer 1998, Holland 2018) and is a key motivation behind this paper. Table 4: Share of respondents that would prefer lower inequality than what they currently perceive to exist (ES) (IN) (MA) (MX) (NG) (NL) (US) (ZA) (UK) (AU) % % % % % % % % % % Poorest two quintiles Richest two quintiles Difference ES - Spain, IN - India, MA - Morocco, MX - Mexico, NG - Nigeria, NL - Netherlands US - United States, ZA - South Africa, UK - United Kingdom, AU - Australia In contrast, there is a noteworthy difference in people s preference for greater equality between people who think they are poor compared to people who think they are rich. This is even the case when only examining differences between people who are actually from the poorest two quintiles. Poor people who perceive they are relatively rich are much less likely to prefer inequality to be lower (see Table 5). Across all countries poor people who perceived themselves to be in the poorest two quintiles were between 13 to 33 percentage points more likely to prefer lower levels of inequality than poor people who perceived themselves to be in the richest two quintiles. This is consistent with recent evidence that suggests people s perception of their position in the distribution is a better predictor of their redistributive preferences than what is actually the case (Gimpelson and Treisman 2018, Hauser and Norton 2017). Table 5: Share of respondents in poorest two quintiles that would prefer lower inequality than what they currently perceive to exist (ES) (IN) (MA) (MX) (NG) (NL) (US) (ZA) (UK) (AU) % % % % % % % % % % Perceived to be in Q1/Q Perceived to be in Q4/Q Difference ES - Spain, IN - India, MA - Morocco, MX - Mexico, NG - Nigeria, NL - Netherlands US - United States, ZA - South Africa, UK - United Kingdom, AU - Australia Q1 - Quintile 1, Q2 - Quintile 2, Q4 - Quintile 4, Q5 - Quintile 5 16
. Only a small minority of respondents correctly selected the actual quintile they belong to, ranging from 14.")
17 4.2 People s misperception of their position in the distribution We show the vast majority of respondents misperceive their position in the income distribution and tend to think they are located in the middle of the distribution regardless of their actual position (Figure 4). Only a small minority of respondents correctly selected the actual quintile they belong to, ranging from 14.8% in Nigeria to 27.4% in the US (see appendix). Between 48.3% to 66.7% of respondents perceived their household to be in the middle quintile of the national income distribution. The correlation co-efficient between perceived and actual position in the national income distribution ranges from as low as 0.16 in Nigeria to as high as 0.43 in Australia (see appendix). We call this misperception a median bias and it has been observed in a number of existing studies (eg. Gimpelson and Treisman 2018). Figure 4: Respondent s perceived place in the income distribution The median bias is due to people who are actually poor overestimating their position in the distribution and people who are actually rich underestimating their position. This is illustrated in Figure 5 whereby in Panel A we show around 60-75% of people in the poorest two quintiles in each country overestimate their place and similarly in Panel B we 17

18 show around 60-75% of people in the richest two quintiles in each country underestimate their place. Figure 5: Share of respondent s that overestimate and underestimate their place in the income distribution The remainder of the paper focuses on people from the poorest two quintiles who don t realise they are (they overestimate their position) and people who are aware they are from the poorest two quintiles (they accurately estimate their place). 18
19 5 Results 5.1 Effect of information based upon respondents pre-existing perception of their position in the income distribution People who overestimated their position Contrary to what most conventional theories of redistribution would predict, informing people in the poorest two quintiles they are relatively poorer than they thought meant they were less likely to agree the gap between the rich and poor is too large. This treatment effect is statistically significant at a p-value of 0.05 in seven of the ten countries (India, Mexico, Morocco, Netherlands, Nigeria, South Africa and Spain) and there is no effect in the remaining three countries (Australia, United Kingdom and the United States) (see Figure 6). Among the seven countries where there is a statistically significant effect, the difference between treatment and control groups was between negative 8.3 to negative 3.9 percentage points. Figure 6: The effect of telling people they are relatively poorer than they thought on whether they agree the gap between the rich and poor is too large We present the share of respondents that agree the gap between rich and poor is 19
20 too large in the control group and the difference between the treatment and control group means for each country (ie. the treatment effect) in Table 6. For example, in the case of Spain 78.5% of respondents in the control group (who overestimated their position and are actually in the poorest two quintiles) agree the gap between the rich and poor is too large, whereas the share of respondents that agree in the treatment group (who overestimated their position and are actually in the poorest two quintiles) is 8.3 percentage points lower. In all 10 countries, this information does not affect people s views about whether the government is responsible for closing the income gap between the rich and poor (see Table 6). Table 6: Effect of treatment on people who overestimated their place (ES) (IN) (MA) (MX) (NG) (NL) (US) (ZA) (UK) (AU) TE - GAP (0.02) (0.02) (0.02) (0.02) (0.01) (0.02) (0.02) (0.02) (0.03) (0.03) Con - GAP (0.02) (0.01) (0.01) (0.01) (0.01) (0.02) (0.01) (0.01) (0.02) (0.02) TE - RES (0.03) (0.02) (0.03) (0.03) (0.02) (0.03) (0.03) (0.02) (0.04) (0.04) Con - RES (0.02) (0.01) (0.02) (0.02) (0.01) (0.02) (0.02) (0.02) (0.03) (0.02) p<0.1, p<0.05, p<0.01 TE - Treatment Effect, Con - Constant term ES - Spain, IN - India, MA - Morocco, MX - Mexico, NG - Nigeria, NL - Netherlands US - United States, ZA - South Africa, UK - United Kingdom, AU - Australia GAP - Binary variable that takes the value of 1 if the respondent agreed or strongly agreed the gap between the rich and poor in their country is too large RES - Binary variable that takes the value of 1 if the respondent agreed or strongly agreed the government is responsible for closing the gap between the rich and poor in their country People who accurately estimated their position This information does not have an effect on respondents who accurately estimated their position in the national income distribution. There was no effect on concern about the gap between the rich and poor from telling these respondents their position in the distribution and almost no effect on whether they thought the government was responsible for closing this gap (see Table 7). 20
21 Table 7 - Effect of treatment on people who accurately estimated their place (ES) (IN) (MA) (MX) (NG) (NL) (US) (ZA) (UK) (AU) TE - GAP (0.05) (0.05) (0.04) (0.05) (0.05) (0.06) (0.04) (0.03) (0.04) (0.04) Con - GAP (0.03) (0.03) (0.03) (0.04) (0.04) (0.04) (0.03) (0.02) (0.03) (0.03) TE - RES (0.05) (0.06) (0.05) (0.07) (0.08) (0.07) (0.05) (0.04) (0.05) (0.06) Con - RES (0.04) (0.04) (0.04) (0.05) (0.06) (0.05) (0.04) (0.03) (0.04) (0.05) p<0.1, p<0.05, p<0.01 TE - Treatment Effect, Con - Constant term ES - Spain, IN - India, MA - Morocco, MX - Mexico, NG - Nigeria, NL - Netherlands US - United States, ZA - South Africa, UK - United Kingdom, AU - Australia GAP - Binary variable that takes the value of 1 if the respondent agreed or strongly agreed the gap between the rich and poor in their country is too large RES - Binary variable that takes the value of 1 if the respondent agreed or strongly agreed the government is responsible for closing the gap between the rich and poor in their country 5.2 Effect of information based upon respondents pre-existing perception of the level of national inequality People who overestimated their position The effect of information on people s concern about the gap between the rich and poor is largely driven by respondents who stated prior to the treatment that they prefer low levels of inequality. This is shown in Table 8 below that illustrates in six of the seven countries where there is a significant effect in Table 6, the effect is driven by respondents who stated prior to the treatment that they prefer low levels of inequality (ie. in India, Mexico, Netherlands, Nigeria, South Africa and Spain). Among these six countries the difference between treatment and control groups was between negative 8.7 to negative 4 percentage points. The exception is in Morocco where the overall effect is driven primarily by people who prefer high levels of inequality, among this group of respondents the difference between treatment and control groups was negative 9.2 percentage points. These is no significant heterogeneous treatment effects in terms of respondents views about the responsibility of the government in closing the gap between rich and poor (see Table 8). 21
22 Table 8 - Heterogeneous treatment effects for respondents who overestimated their place based upon their preferences for the level of inequality in their country (ES) (IN) (MA) (MX) (NG) (NL) (US) (ZA) (UK) (AU) TE - LI - GAP (0.03) (0.02) (0.03) (0.02) (0.02) (0.04) (0.03) (0.02) (0.03) (0.03) TE - HI - GAP n/a (0.06) (0.03) (0.04) (0.04) (0.02) (0.06) (0.05) (0.03) (0.13) n/a TE - LI - RES (0.03) (0.03) (0.04) (0.03) (0.02) (0.05) (0.04) (0.03) (0.04) (0.04) TE - HI - RES n/a (0.10) (0.05) (0.05) (0.07) (0.03) (0.08) (0.07) (0.04) (0.13) n/a p<0.1, p<0.05, p<0.01 TE - Treatment Effect, LI - Prefer Low inequality, HI - Prefer High inequality n/a refers to cases with less than 60 respondents ES - Spain, IN - India, MA - Morocco, MX - Mexico, NG - Nigeria, NL - Netherlands US - United States, ZA - South Africa, UK - United Kingdom, AU - Australia GAP - Binary variable that takes the value of 1 if the respondent agreed or strongly agreed the gap between the rich and poor in their country is too large RES - Binary variable that takes the value of 1 if the respondent agreed or strongly agreed the government is responsible for closing the gap between the rich and poor in their country People who accurately estimated their position Similar to the case above, this information did not have effect on respondents who accurately estimated their position in the income distribution. This is shown in Table 9 where disaggregating the effect of information by prior preferences for the level of inequality does not uncover any statistically significant effects at a p-value of In addition, there is limited effect from information among respondents in terms of their views as to whether the government is responsible for closing the gap between rich and poor (see Table 9). The exception is in India and Nigeria whether there are large effects, but this is based upon a very small sample size (97 and 66 respondents respectively). 22
23 Table 9 - Heterogeneous treatment effects for respondents who accurately estimated their place based upon their preferences for the level of inequality in their country (ES) (IN) (MA) (MX) (NG) (NL) (US) (ZA) (UK) (AU) TE - LI - GAP (0.06) (0.06) (0.05) (0.07) (0.06) (0.08) (0.04) (0.03) (0.03) (0.04) TE - HI - GAP n/a (0.20) (0.11) (0.08) (0.12) (0.13) (0.14) (0.10) (0.07) (0.20) n/a TE - LI - RES (0.05) (0.07) (0.08) (0.09) (0.10) (0.09) (0.07) (0.05) (0.05) (0.06) TE - HI - RES n/a (0.19) (0.10) (0.09) (0.17) (0.19) (0.18) (0.12) (0.07) (0.21) n/a p<0.1, p<0.05, p<0.01 TE - Treatment Effect, LI - Prefer Low inequality, HI - Prefer High inequality n/a refers to cases with less than 60 respondents ES - Spain, IN - India, MA - Morocco, MX - Mexico, NG - Nigeria, NL - Netherlands US - United States, ZA - South Africa, UK - United Kingdom, AU - Australia GAP - Binary variable that takes the value of 1 if the respondent agreed or strongly agreed the gap between the rich and poor in their country is too large RES - Binary variable that takes the value of 1 if the respondent agreed or strongly agreed the government is responsible for closing the gap between the rich and poor in their country 5.3 Effect of information based upon respondents actual quintile in the distribution People who overestimated their position The effect of information is mainly driven by people who are actually in the poorest quintile, however in most countries the effect is still observable among people in the second poorest quintile (but not statistically significant). Table 10 shows that among the seven countries where we observe an overall effect, in six countries the effect is still evident when restricting the sample only to respondents from the poorest quintile. The treatment effect is only statistically significant for three of the countries when restricting the sample to respondents in the second poorest quintile (however the point estimate is similar to that of the poorest quintile in a number of the remaining countries). As is the case above, there is little effect from information on people s views about the role of the government in closing the gap between the rich and poor. As can be seen in Table 10, Nigeria is the only country where there is an effect in which case there was an opposite effect between people who were in the poorest and second poorest quintile. 23
24 Table 10 - Heterogeneous treatment effects for respondents who overestimated their position by quintile (ES) (IN) (MA) (MX) (NG) (NL) (US) (ZA) (UK) (AU) TE - Q1 - GAP (0.02) (0.02) (0.02) (0.02) (0.01) (0.03) (0.02) (0.02) (0.04) (0.03) TE - Q2 - GAP (0.05) (0.04) (0.05) (0.04) (0.03) (0.05) (0.04) (0.04) (0.05) (0.06) TE - Q1 - RES (0.03) (0.02) (0.03) (0.03) (0.02) (0.04) (0.03) (0.03) (0.05) (0.04) TE - Q2 - RES (0.05) (0.05) (0.06) (0.06) (0.04) (0.06) (0.06) (0.06) (0.07) (0.07) p<0.1, p<0.05, p<0.01 TE - Treatment Effect, Q1 - Poorest quintile, Q2 - Second Poorest quintile ES - Spain, IN - India, MA - Morocco, MX - Mexico, NG - Nigeria, NL - Netherlands US - United States, ZA - South Africa, UK - United Kingdom, AU - Australia GAP - Binary variable that takes the value of 1 if the respondent agreed or strongly agreed the gap between the rich and poor in their country is too large RES - Binary variable that takes the value of 1 if the respondent agreed or strongly agreed the government is responsible for closing the gap between the rich and poor in their country People who accurately estimated their position As is the case above there is little to no effect from information among respondents who accurately estimate their place (see Table 11). The exception is among respondents in the poorest quintile in the United States and South Africa where there is an effect from the treatment (in opposite directions) in terms of agreement that the government is responsible for closing the gap between the rich and poor. Further the treatment also led respondents in the second poorest quintile who accurately estimated their position to become more likely to agree the government is responsible for closing the gap between the rich and poor in Australia. Table 11 - Heterogeneous treatment effects for respondents who accurately estimated their position by quintile (ES) (IN) (MA) (MX) (NG) (NL) (US) (ZA) (UK) (AU) TE - Q1 - GAP (0.05) (0.06) (0.05) (0.06) (0.06) (0.07) (0.05) (0.03) (0.04) (0.05) TE - Q2 - GAP (0.09) (0.10) (0.07) (0.11) (0.11) (0.10) (0.06) (0.06) (0.06) (0.07) TE - Q1 - RES (0.06) (0.06) (0.07) (0.08) (0.10) (0.09) (0.07) (0.05) (0.06) (0.08) TE - Q2 - RES (0.10) (0.12) (0.09) (0.14) (0.15) (0.10) (0.10) (0.09) (0.08) (0.09) p<0.1, p<0.05, p<0.01 TE - Treatment Effect, Q1 - Poorest quintile, Q2 - Second Poorest quintile ES - Spain, IN - India, MA - Morocco, MX - Mexico, NG - Nigeria, NL - Netherlands US - United States, ZA - South Africa, UK - United Kingdom, AU - Australia GAP - Binary variable that takes the value of 1 if the respondent agreed or strongly agreed the gap between the rich and poor in their country is too large RES - Binary variable that takes the value of 1 if the respondent agreed or strongly agreed the government is responsible for closing the gap between the rich and poor in their country 24
25 6 Discussion 6.1 Channel through which information is having an effect This survey experiment shows that informing people in the poorest two quintiles of the income distribution they are relatively poorer than they thought tends to lead them to be less likely to agree the gap between the rich and poor in their country is too large and has no effect on their desire for the government to reduce this gap. This trend is driven by people who prefer low levels of inequality and are mainly from the poorest quintile in the income distribution (however in many countries there is still an effect on people in the second poorest quintile). This treatment has little to no effect on people who accurately estimated their position in the national income distribution, which would suggest these effects are not due to simply telling people they are poor. Rather the effect is due to people having their existing misperceptions corrected, as prior to receiving this information they did not think they were relatively poor. The findings from this study are clearly counter to the hypothesis that informing people they are relatively poorer than they thought will increase their concern about the gap between the rich and poor and raise their support for government action to close this gap. On the contrary, informing people they are relatively poorer than they thought lowers their concern about the gap between the rich and poor and this does not affect their preferences for redistribution. To relate this to the model in section 2, recall the modified Fehr and Schmidt utility function captures two foundational principles of most conventional theories of preferences for redistribution. These two principles are; firstly people are more concerned about the gap between their consumption and those richer than them as opposed to the gap between their consumption and those poorer than them ( > ) andsecondlypeopleareaversetoothersconsumingsignificantlydifferently to them ( >0, >0) (collectively this implies > >0). 25
26 Our results only support the second of these principles, whereby relatively poor people are averse to large differences in incomes across society. This can be seen by the fact that the treatment effect is primarily driven by relatively poor people who had expressed a prior preference for low levels of inequality (ie. where >0, >0) in all countries except for Morocco. Given this is the case, we are able to infer the first principle does not hold by the following. When people are told they are relatively poorer than they thought this implies the gap between them and people poorer than them is smaller than they thought (c a c p (p) > c a c p )andthegapbetweenthemandpeoplericherthanthemis larger than they thought (c r (p) c a <c r c a ). Yet they respond by being less concerned about the gap between the rich and poor in their country, even though they prefer low levels of inequality. This response is only consistent with the idea that poorer people are more concerned about the gap between their consumption and those poorer than them compared to the gap between their consumption and those richer than them (ie. < ). If this was not the case, we would expect the treatment effect to be in the opposite direction. Collectively this would imply the following > >0. We refer to this updating of beliefs as benchmarking whereby people use their own standard of living as a reference point for what they consider acceptable for others. This explains the results in our study as follows. People had perceived themselves to have an average living standard compared to other people in their country prior to the treatment even though they are relatively poor. Their previous assessment of their relative status implies they thought there were a similar share of people poorer than them and richer than them in their country (this is as a result of selecting oneself as being around the middle of the income distribution). Upon receiving the treatment this led people to realise two points. Firstly, there are less people in their country with a living standard they considered to be relatively poor. Secondly, what they had considered to be an average living standard (their own standard of living) is actually relatively poor compared to other people in their country. Both of these points would imply respondents should become less concerned about the gap between the rich and 26
27 poor given their utility is weighted as we show it is above (ie. > >0). We call this channel of updating beliefs, benchmarking, as people are using their living standard as a reference point to infer information about the relative living standard of other people in the income distribution. This idea of benchmarking is entirely consistent with the framing of the Fehr and Schmidt model, which is people use their own level of consumption as a reference point for assessing other people s consumption. However we recast the underlying premise of their model in a new light and illustrate how people update their beliefs in light of information. 6.2 How these findings relate to previous studies The regularity of our findings across a diverse range of countries should be considered when assessing how they relate to previous studies. The only other study that directly tests the hypothesis in this paper by Cruces et al (2013) provides evidence that when people are told they are relatively poorer than they thought they become more supportive of redistribution. The difference in results between their findings and the results from our study could be due to a range of factors such as differences in location or the use of a household as opposed to online survey. Our study is based upon representative samples of the population with internet access in each country, whereas Cruces et al (2013) sample is restricted to people living in one city in Argentina. In addition, we use an anonymous online survey as opposed to a household survey like Cruces et al (2013), to minimise the risk of social desirability bias (when a respondent provides an interviewer with the answers that they think they want to hear). The notion of benchmarking that we articulate also helps to explain the findings of a recent study in the United States which shows telling people they are richer than they thought in the global income distribution makes them more supportive of international redistribution (Nair, 2018). Nair shows most respondents to his survey in the United States thought they only had a slightly above average living standard compared to other people around the world and informing them they were among some of the richest people 27
28 on earth drastically changed their views. They became more supportive of foreign aid and more likely to provide money to charities operating in low and middle income countries. This implies a similar utility function to our study ( > >0), whereby people are averse to inequality and are more concerned about the gap between their income and the poorest in society as opposed to the gap between their income and the richest in society. The key difference being we focus on the poorest quintiles in the national income distribution, while Nair focuses on the richest quintile in the global income distribution. We are able to rule out a potential alternative channel that could be driving our results, which is what Kuziemko et al (2014) call last place aversion. They show poorer people can be less supportive of redistribution (particularly in the form of increases in the minimum wage) if it is set to benefit those individuals directly below them. As mentioned in section 2 this would imply the second foundational principle of most theories of preferences for redistribution does not hold as poor people prefer inequality between them and people poorer than them (ie. <0). We present three pieces of evidence to illustrate it is unlikely this is driving our results. Firstly, the effect of information in our study is driven by people who prefer low levels of inequality (ie. >0, >0). Secondly, the main effect is driven not just by people near the bottom of the income distribution (ie. the poorest quintile), but also among people in the second poorest quintile in most countries. Thirdly, the effect we report is in regards to people s concern about inequality, as opposed to their preferences for redistribution. Collectively these three points provide us with enough confidence last place aversion is not an adequate explanation of what is causing the findings to our study. Our research bolsters a finding from other studies on the elasticity of people s preferences for redistribution (Kuziemko et al 2015, Hauser and Norton 2017), which is it is easier for information to alter people s concern about inequality than their desire for government led redistribution. For example, Kuziemko et al (2015) show multiples pieces of information about inequality in the United States does not lead to greater support for redistribution, even though it does have a large impact on people s concern about 28
29 inequality. We show a similar pattern whereby even though we are able to detect effects on people s concern about inequality from the treatment in most countries this does not lead to changes in their preferences for redistribution. The results from our study also relate to recent research by Trump (2017) who shows that providing information about the overall level of inequality to survey respondents can reduce their concern about inequality due to a psychological process known as system justification. System justification theory suggests people are biased to interpret information in a way that does not challenge their pre-existing beliefs about the processes that generate social outcomes (Jost et al, 2004). Trump (2017) draws on this theory to argue their findings are due to people views about the legitimacy of inequality changing, whereby information leads people to be more likely to dismiss income differences to be due to effort. Our findings are similar in the sense that people s pre-existing views about their own standard of living helps to explain why they become less concerned about the gap between the rich and poor in their country when they are told they are relatively poor. That is to say people are more likely to dismiss income differences in society as an issue because they don t consider relatively poor people (like themselves) to have too low a standard of living. 6.3 Implications for theories of preferences for redistribution There are two important implications from our study about theories of redistribution. Firstly, benchmarking means there are competing channels through which people think about redistribution. On the one hand, poorer people may be more supportive if they are set to benefit from redistribution, but on the other hand they may be less supportive if they are less concerned about the absolute living standard of people who are relatively poor. This suggests that existing theories of preferences for redistribution need to be revised. For example, the Meltzer-Richard hypothesis (1981) put simply suggests most people below the median person in the distribution should support redistribution and most people above the median person should not. This is based on whether the individual 29
30 is potentially set to benefit or lose from redistribution. However benchmarking would imply there is also an effect in the opposite direction. Even though relatively poor people may be likely to benefit from redistribution they are also less likely to think redistribution to the poor is needed. Secondly, we add to the growing evidence base that people s perception of their position in the national distribution appears to be more closely aligned with their preferences for redistribution than their actual position in the national income distribution (Gimpelson and Treisman 2018, Hauser and Norton 2017, Kuhn 2015, Engelhardt and Wagener 2014). In addition, the fact information only has an effect on people who misperceived their position (as opposed to people who accurately estimated their place) would imply these misperceptions matter. It is clearly the case that people don t have complete (and/or accurate) information and theories of preferences for redistribution should be modified to reflect this. A practical implication of this is policy makers who are interested in understanding people s support for redistribution in their country should be as concerned (if not more so) of people s perception of inequality as opposed to what is actually the case. 7 Conclusion This study makes a significant contribution by showing how one of the foundational principles of theories of preferences for redistribution lacks empirical support in a diverse range of countries. In contrast to what theory would predict, informing people they are relatively poorer than they thought reduced their concern about the gap between the rich and poor in their country. This effect was primarily driven by people who prefer low levels of inequality and actually belong to the poorest quintile in their national income distribution. We illustrate this effect is due to people being averse to inequality but being more concerned about the gap between their income and the income of people poorer than them (compared to their income and people richer than them). We call this 30
31 effect benchmarking as people are using their standard of living to determine what they consider a reasonable standard of living for others. This phenomenon has a downward effect on poorer people s preferences for redistribution to the poor, even thought they could benefit. Our findings are far more generalisable than other studies to date as we surveyed over 30,000 people from 10 countries that make up 30% of the world s population and 40% of global GDP. Further research on this topic could explore this concept of benchmarking and how it relates to psychological processes, like system justification theory. In addition, future studies could examine what types of information, if anything, could lead poorer people to become more supportive of redistribution. 31
32 8 References Alesina, A and Angeletos, G "Fairness and Redistribution." American Economic Review. 95:4: Alesina, A. Giuliano, P. Bisin, A. and Benhabib, J "Preferences for Redistribution." Handbook of Social Economics Alesina, A. Stantcheva, S. and Teso, E "Intergenerational Mobility and Preferences for Redistribution". American Economic Review. 108:2: Benabou, R. and Ok, E "Social Mobility and the Demand for Redistribution: The POUM Hypothesis". Quarterly Journal of Economics. 116:2: Black, D "On the Rationale of Group Decision-making". Journal of Political Economy. 56:1: Bublitz, E "Misperceptions of income distributions: Cross-country evidence from a randomized survey experiment". IZA conference paper. Card, D. Mas, A. Moretti, E. and Saez, E "Inequality at Work: The Effect of Peer Salaries on Job Satisfaction". American Economic Review. 102:6: Cruces, G. Perez-Truglia, R. and Tetaz, M "Biased perceptions of income distribution and preferences for redistribution: Evidence from a survey experiment". Journal of Public Economics. 98: Davidai, S "Building a More Mobile America - One Income Quintile at a Time". Perspectives in Psychological Science. 10:1: Engelhardt, C. and Wagener, A "Biased Perceptions of Income Inequality and Redistribution". CESifo Working Paper Fehr, E. and Schmidt, K "A Theory of Fairness, Competition and Cooperation". Quarterly Journal of Economics. 114:3: Fernandez-Albertos, J. and Kuo, A "Income Perception, Information, and Progressive Taxation: Evidence from a Survey Experiment". Political Science Research and Methods. 6:1:
33 Filer, J. Kenny, L. and Morton, R "Redistribution, Income and Voting". American Journal of Political Science. 37:1: Frank, T "Whats the Matter with Kansas?". Henry Holt and Co. Gentzkow, M. and Shapiro, J "Ideological Segregation Online and Offline." The Quarterly Journal of Economics. 126: Gimpelson, V. and Treisman, D "Misperceiving Inequality". Economics and Politics. 30:1: Hauser, O. and Norton, M "(Mis)perceptions of Inequality". Current Opinion in Psychology. 18: Holland, A "Diminished Expectations: Redistributive Politics in Truncated Welfare States" World Politics 70:2: Hoy, C. and Mager, F "Cross-country evidence about perceptions of inequality and support for redistribution". AEA trial registriation. Available at Indrakesuma, T. Janz, E. and Wai-Poi, M "A Perceived Divide: How Indonesians perceive inequality and what they want done about it". World Bank Working Paper International Social Survey Programme Module on Social Inequality. Available at Jost, J. Banaji, M. and Nosek. B "A Decade of System Justification Theory: Accumulated Evidence of Conscious and Unconscious Bolstering of the Status Quo." Political Psychology 25:6: Karadja, M. Mollertrom, J. and Sem, D "Richer (and Holier) than Thou" The Effect of Relative Income Improvement on Demand for Redistribution". Review of Economics and Statistics. 99:2: Kuhn, A "The Subversive Nature of Inequality: Subjective Inequality Perceptions and Attitudes to Social Inequality". IZA Discussion Paper Kuziemko, I. Buell, R. Reich, T. and Norton, M "Last-palce Aversion: Evi- 33
34 dence and Redistributive Implications". Quaterly Journal of Economics. 129:1: Kuziemko, I. Norton, M. Saez, E. and Stantcheva, S "How Elastic are Preferences for Redistribution" Evidence from Randomised Survey Experiments". American Economic Review. 105:4: McCall, L. Burk, D. Laperriere, M. and Richeson, J "Exposure to Rising Inequality Shapes Americans? Opportunity Beliefs and Policy Support." Proceedings of the National Academy of Sciences 114(36):9593?98. Meltzer, A. and Richard, S "A Rational Theory of the Size of Government." The Journal of Political Economy. 89:5: Nair, G "Misperceptions of Relative Income and Support for International Transfers in the United States". The Journal of Politics 80:3: Niehues, J "Subjective Perceptions of Inequality and Redistributive Preferences". IW-Trends. Norton, M. and Ariely, D "Building a Better America - One Wealth Quintile at a Time". Perspectives on Psychological Science. 6:9: Norton, M. Neal, D. Govan, C. Ariely, D. and Holland, E "The Not so CommonWealth of Australia: Evidence for a Cross Cultural Desire for a More Equal Distribution of Wealth". Analyses of Social Issues and Public Policy. 14:1: Nyhan, B. and Reifler, J "When Corrections Fail: The persistence of political misperceptions". Political Behavior. 32:2: OECD Compare Your Income. Available at Piketty, T "Social Mobility and Redistributive Politics". Quarterly Journal of Economics. 110:3: Povcal Available at Roemer, J "Why the poor do not expropriate the rich: an old argument in new grab" Journal of Public Economics. 70:3: Trump, K "Income Inequality Influences Perceptions of Legitimate Income 34
35 Differences." British Journal of Political Science World Bank "A Measured Approach to Ending Poverty and Boosting Shared Prosperity". Available at World Development Indicators Available at Zilinsky, J "Learning About Income Inequality: What is the Impact of Information on Perceptions of Fairness and Preferences for Redistribution?" Available at SSRN: or 35
36 9 Appendix CONTENTS 1. Balance table 2. Results with controls 3. Results weighted by age and gender 4. Results using ordered logit regression 5. Further descriptive statistics 6. Details about survey methodology 7. Questions asked prior to treatment 8. Further robustness checks 9.1 Balance table Table A1 - Balance table showing the difference in background characteristics between the share of respondents in control and treatment groups (differences reported in percentage points) (ES) (IN) (MA) (MX) (NG) (NL) (US) (ZA) (UK) (AU) C-T C-T C-T C-T C-T C-T C-T C-T C-T C-T Under 35 years old ** Male ** *** Urban dweller * University education ** Actually in Q1/Q * Perceived to be in Q1/Q Perceive High Inequality ** * ** 0.025* N/A Prefer Low Inequality N/A p<0.1, p<0.05, p<0.01 ES - Spain, IN - India, MA - Morocco, MX - Mexico, NG - Nigeria, NL - Netherlands US - United States, ZA - South Africa, UK - United Kingdom, AU - Australia C - Control, T - Treatment, Q1 - Quintile 1, Q2 - Quintile 2 36
37 9.2 Results with controls Table A2 - Effect of treatment on people who overestimated their place (with controls) (ES) (IN) (MA) (MX) (NG) (NL) (US) (ZA) (UK) (AU) TE - GAP (0.02) (0.02) (0.02) (0.02) (0.01) (0.03) (0.02) (0.02) (0.03) (0.03) Under (0.02) (0.03) (0.02) (0.02) (0.02) (0.03) (0.02) (0.02) (0.04) (0.03) Male (0.02) (0.02) (0.02) (0.02) (0.02) (0.03) (0.02) (0.02) (0.03) (0.03) Perceived Q1/Q (0.02) (0.03) (0.02) (0.02) (0.02) (0.03) (0.02) (0.02) (0.03) (0.03) Perceive HI (0.02) (0.02) (0.02) (0.02) (0.02) (0.03) (0.02) (0.02) (0.04) (0.03) Prefer LI (0.02) (0.02) (0.02) (0.02) (0.02) (0.03) (0.02) (0.02) (0.04) (0.05) Constant (0.03) (0.03) (0.03) (0.03) (0.03) (0.03) (0.03) (0.03) (0.05) (0.06) p<0.1, p<0.05, p<0.01 ES - Spain, IN - India, MA - Morocco, MX - Mexico, NG - Nigeria, NL - Netherlands US - United States, ZA - South Africa, UK - United Kingdom, AU - Australia TE - Treatment effect C - Control, T - Treatment, Q1 - Quintile 1, Q2 - Quintile 2, HI - High inequality, LI - Low inequality GAP - Binary variable that takes the value of 1 if the respondent agreed or strongly agreed the gap between the rich and poor in their country is too large Table A3 - Effect of treatment on people who overestimated their place (with controls) (ES) (IN) (MA) (MX) (NG) (NL) (US) (ZA) (UK) (AU) TE - RES (0.03) (0.03) (0.03) (0.03) (0.02) (0.03) (0.03) (0.03) (0.04) (0.03) Under (0.03) (0.03) (0.03) (0.03) (0.03) (0.03) (0.03) (0.03) (0.05) (0.04) Male (0.03) (0.03) (0.03) (0.03) (0.02) (0.03) (0.03) (0.03) (0.04) (0.03) Perceived Q1/Q (0.03) (0.03) (0.03) (0.04) (0.03) (0.04) (0.03) (0.03) (0.04) (0.04) Perceive HI (0.03) (0.03) (0.03) (0.03) (0.02) (0.03) (0.04) (0.03) (0.04) (0.03) Prefer LI (0.03) (0.03) (0.03) (0.03) (0.02) (0.04) (0.03) (0.03) (0.04) (0.07) Constant (0.04) (0.04) (0.05) (0.05) (0.04) (0.04) (0.05) (0.04) (0.06) (0.07) Observations p<0.1, p<0.05, p<0.01 ES - Spain, IN - India, MA - Morocco, MX - Mexico, NG - Nigeria, NL - Netherlands US - United States, ZA - South Africa, UK - United Kingdom, AU - Australia TE - Treatment effect C - Control, T - Treatment, Q1 - Quintile 1, Q2 - Quintile 2, HI - High inequality, LI - Low inequality RES - Binary variable that takes the value of 1 if the respondent agreed or strongly agreed the governments responsible for closing gap between the rich and poor in their country 37
38 9.3 Results weighted by age and gender Table A4 - Effect of treatment on people who overestimated their place (weighted by age and gender) (ES) (IN) (MA) (MX) (NG) (NL) (US) (ZA) (UK) (AU) TE - GAP (0.02) (0.02) (0.02) (0.02) (0.02) (0.03) (0.02) (0.02) (0.04) (0.03) Con - GAP (0.02) (0.01) (0.02) (0.01) (0.01) (0.02) (0.02) (0.01) (0.03) (0.02) TE - RES (0.03) (0.03) (0.03) (0.03) (0.02) (0.03) (0.03) (0.03) (0.05) (0.04) Con - RES (0.02) (0.02) (0.02) (0.02) (0.01) (0.02) (0.02) (0.02) (0.03) (0.02) p<0.1, p<0.05, p<0.01 ES - Spain, IN - India, MA - Morocco, MX - Mexico, NG - Nigeria, NL - Netherlands US - United States, ZA - South Africa, UK - United Kingdom, AU - Australia TE - Treatment effect, Con - Constant term GAP - Binary variable that takes the value of 1 if the respondent agreed or strongly agreed the gap between the rich and poor in their country is too large RES - Binary variable that takes the value of 1 if the respondent agreed or strongly agreed the governments responsible for closing gap between the rich and poor in their country 9.4 Results using ordered logit regression Table A5 - Effect of treatment on people who overestimated their place (ordered logit) (ES) (IN) (MA) (MX) (NG) (NL) (US) (ZA) (UK) (AU) TE - GAP (0.09) (0.09) (0.09) (0.10) (0.08) (0.09) (0.09) (0.09) (0.16) (0.13) cut1 Constant (0.07) (0.06) (0.06) (0.07) (0.06) (0.07) (0.07) (0.06) (0.11) (0.10) cut2 Constant (0.07) (0.07) (0.07) (0.08) (0.08) (0.07) (0.07) (0.08) (0.13) (0.11) cut3 Constant (0.11) (0.10) (0.10) (0.11) (0.10) (0.09) (0.10) (0.12) (0.22) (0.20) cut4 Constant (0.16) (0.17) (0.14) (0.18) (0.16) (0.14) (0.16) (0.17) (0.39) (0.71) p<0.1, p<0.05, p<0.01 ES - Spain, IN - India, MA - Morocco, MX - Mexico, NG - Nigeria, NL - Netherlands US - United States, ZA - South Africa, UK - United Kingdom, AU - Australia TE - Treatment effect GAP - Respondent 1 (strongly agrees), 2 (agrees), 3 (neither agree or disagree), 4 (disagrees) 5 (strongly disagrees) the gap between the rich and poor in their country is too large 38
39 Table A6 - Effect of treatment on people who overestimated their place (ordered logit) (ES) (IN) (MA) (MX) (NG) (NL) (US) (ZA) (UK) (AU) TE - RES (0.11) (0.10) (0.10) (0.11) (0.09) (0.12) (0.11) (0.10) (0.15) (0.13) cut1 Constant (0.08) (0.07) (0.08) (0.08) (0.07) (0.10) (0.09) (0.07) (0.12) (0.11) cut2 Constant (0.09) (0.08) (0.08) (0.08) (0.08) (0.09) (0.08) (0.08) (0.11) (0.10) cut3 Constant (0.13) (0.12) (0.10) (0.12) (0.10) (0.11) (0.10) (0.10) (0.15) (0.12) cut4 Constant (0.24) (0.23) (0.14) (0.21) (0.18) (0.19) (0.14) (0.21) (0.24) (0.21) p<0.1, p<0.05, p<0.01 ES - Spain, IN - India, MA - Morocco, MX - Mexico, NG - Nigeria, NL - Netherlands US - United States, ZA - South Africa, UK - United Kingdom, AU - Australia TE - Treatment effect RES - Respondent 1 (strongly agrees), 2 (agrees), 3 (neither agree or disagree), 4 (disagrees) 5 (strongly disagrees) the government is responsible for closing gap between the rich and poor 9.5 Further descriptive statistics Table A7 shows the share of respondents that correctly, over and under estimated their position in the national income distribution as well as the correlation between actual and perceived place. Table A7: Correct, over and underestimates of position in income distribution Correctly Select Overestimate Underestimate Select Middle Correlation Quintile (%) Position (%) Position (%) Quintile Coefficient of Actual and Perceived Position Australia India Mexico Morocco Netherlands Nigeria South Africa Spain UK US Across countries, people who belong in the bottom two quintiles of the distribution were disproportionally more likely to be under 35 years old, not have a university education and come from a large family (see Table A8). However there are notable differences 39
40 between people who overestimate and underestimate their place. People who overestimate their place are disproportionally more likely to be under the age of 35 and live in urban areas (while the opposite is true for people who accurately estimate their place). Table A8: Characteristics associated with being in the poorest two quintiles, overestimating and accurately estimating ones position Q1 and Q2 OE place (Q1 and Q2) AE place (Q1 and Q2) Under 35 years old (0.02) (0.01) (0.01) Male (0.02) (0.01) (0.01) Urban dweller (0.03) (0.01) (0.01) University education (0.03) (0.01) (0.01) Household size (0.01) (0.01) (0.01) Constant (0.07) (0.04) (0.03) p<0.1, p<0.05, p<0.01 OLS regression with standard errors clustered at the country level Q1 - Quintile 1, Q2 - Quintile 2, OE - Overestimate, AE - Accurately estimate To illustrate the relationship between perceived position in the national income distribution and people s satisfaction with their standard of living we included a question in the survey experiment in Australia that asked people prior to the treatment Are you satisfied with your current income?. The relationship between people s satisfaction with their current income (among respondents in the poorest two quintiles in the national income distribution) and their perceived position in the distribution is shown in Figure 7 below. 40
 9.")
41 Figure 7: Relationship between people s satisfaction with their current income and their perceived position in the distribution (only for respondents who are actually in the poorest two quintiles in the distribution) 9.6 Details about survey methodology This study randomly allocated respondents into a treatment group and a control group which ensured that the internal validity of the experiment is robust, however the external validity (generalisability) of the findings are dependent on the representativeness of the surveys. The online surveys were conducted by three different survey firms (YouGov, IP- SOS and RIWI) across the 10 countries and captured a nationally representative sample of the internet population in each country. It is not possible to survey people through an online platform if they don t have access to the internet, but this is an increasingly small share of the population in most countries included in this study. For example, 41
42 more than 25% of the population in India 7 and Nigeria 8 are estimated to have access to the internet and the penetration rate is substantially higher in all the other countries in our study. However it is important to note that the findings are only generalisable for the internet population as opposed to the broader population in each country. There was a slight variation in the sampling approach used by the firms. YouGov (conducted survey in the United Kingdom) and IPSOS (conducted survey in Australia) used a traditional panel survey approach whereas RIWI (conducted the surveys in the United States, Spain, the Netherlands, India, Nigeria, South Africa, Morocco and Mexico) reach the general internet population through incorrect and lapsed URLs. Both sampling strategies are internationally respected and have been shown to provide a sample of respondents that is representative of the internet population (Comscore, 2014). We examined how much of a difference the sampling methodology may be making by conducting the same survey using the different approaches in Mexico. In general, the effect of information was similar between the surveys however the level of support for redistribution in the control group tended to be higher in the panel survey. On average across all the countries there was an attrition rate of around 25-30% which is similar to other survey experiments on this topic, such as Kuziemko et al (2015). In addition, there was a slightly higher attrition rate between the treatment and control groups that varied between 2.7 to 4.4 percentage points across countries. This is a similar rate of differential attrition as in Kuziemko et al (2015). The attrition rate was also higher among respondents in the countries where the surveys were conducted by RIWI. Data about the income distribution in each country was sourced from the World Bank (WDI 2017, PovcalNET 2017) for the middle income countries and the OECD for high income countries (OECD, 2017). Respondents were asked about the number of household members as well as the household s total annual income. This information was million-by-june-iamai/articleshow/ cms
.")
43 used to determine their position in the per capita national income distribution. There is a risk respondents did not provide correct information about their household s actual income. In general, people who are asked to report their income, especially over longer periods of time, often underestimate total household income (World Bank, 2014). While this may be the case in this study, all studies that rely on reported income face this challenge. There is no reason to believe there would be systematic differences between treatment and control groups when it comes to under reporting of income. However it is important to note our treatment is based upon informing people of where their reported income would place them in the income distribution, which may not be the same as where their actual income would place them. 9.7 Questions asked prior to the treatment The questions below were asked prior to the treatment and are based upon a respondent in the United States that has five household members. 43


44 This question was adjusted for each country. In the other high income countries, respondents were provided with five options (the two largest political parties in the country, other, would note vote and don t know). In middle income countries, respondents were provided with four options (yes, no, would note vote, don t know) to the question, "If a national election were held today, would you vote for the current government?". 44
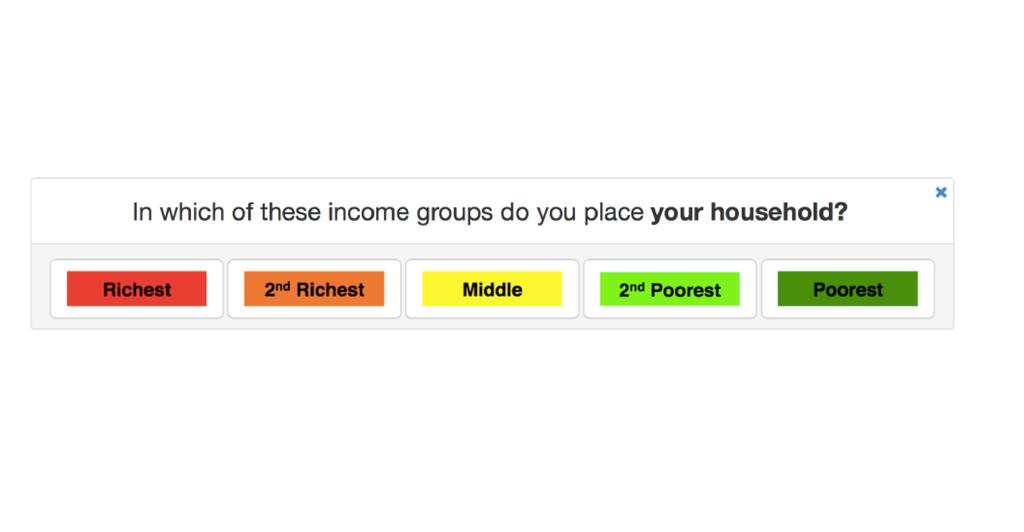
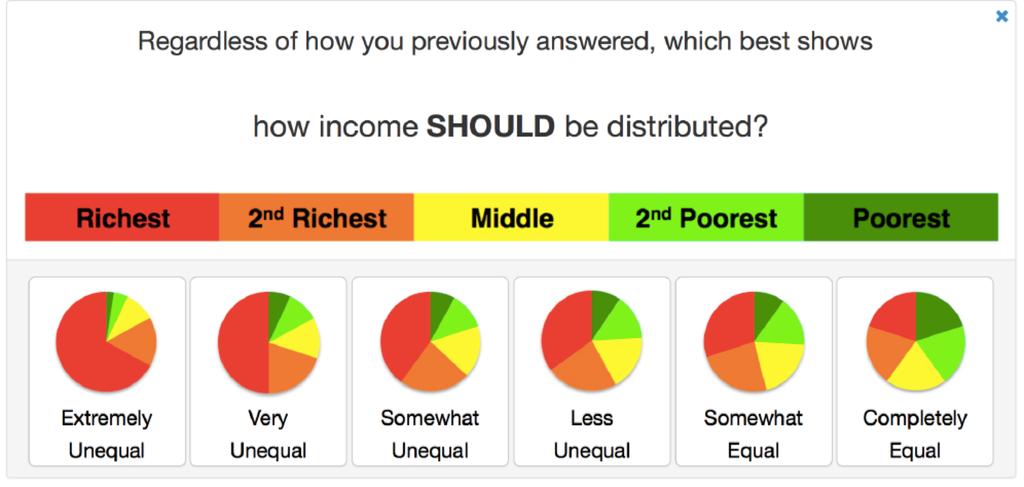
45 45


46 This question was adjusted depending on how respondents answered to the preceding question about the number of people in their household. The five options provided to respondents were roughly equal to the five quintiles of the national income distribution. 46
Crawford School of Public Policy TTPI Tax and Transfer Policy Institute TTPI - Working Paper 1/2018 January 2018 Chris Hoy Franziska Mager Abstract
 Crawford School of Public Policy TTPI Tax and Transfer Policy Institute TTPI - Working Paper 1/2018 January 2018 Chris Hoy The Australian National University PhD Candidate Franziska Mager Oxfam, Great
Voter Turnout, Income Inequality, and Redistribution. Henning Finseraas PhD student Norwegian Social Research
 Voter Turnout, Income Inequality, and Redistribution Henning Finseraas PhD student Norwegian Social Research hfi@nova.no Introduction Motivation Robin Hood paradox No robust effect of voter turnout on
Payments from government to people
 3 PAYMENTS Most people make payments such as for utility bills or domestic remittances. And most receive payments such as wages, other payments for work, or government transfers. The 2017 Global Findex
Europe and the US: Preferences for Redistribution
 Europe and the US: Preferences for Redistribution Peter Haan J. W. Goethe Universität Summer term, 2010 Peter Haan (J. W. Goethe Universität) Europe and the US: Preferences for Redistribution Summer term,
BY Amy Mitchell, Katie Simmons, Katerina Eva Matsa and Laura Silver. FOR RELEASE JANUARY 11, 2018 FOR MEDIA OR OTHER INQUIRIES:
 FOR RELEASE JANUARY 11, 2018 BY Amy Mitchell, Katie Simmons, Katerina Eva Matsa and Laura Silver FOR MEDIA OR OTHER INQUIRIES: Amy Mitchell, Director, Journalism Research Katie Simmons, Associate Director,
Income Distributions and the Relative Representation of Rich and Poor Citizens
 Income Distributions and the Relative Representation of Rich and Poor Citizens Eric Guntermann Mikael Persson University of Gothenburg April 1, 2017 Abstract In this paper, we consider the impact of the
Volume 30, Issue 1. Corruption and financial sector performance: A cross-country analysis
 Volume 30, Issue 1 Corruption and financial sector performance: A cross-country analysis Naved Ahmad Institute of Business Administration (IBA), Karachi Shahid Ali Institute of Business Administration
Gender preference and age at arrival among Asian immigrant women to the US
 Gender preference and age at arrival among Asian immigrant women to the US Ben Ost a and Eva Dziadula b a Department of Economics, University of Illinois at Chicago, 601 South Morgan UH718 M/C144 Chicago,
Expert group meeting. New research on inequality and its impacts World Social Situation 2019
 Expert group meeting New research on inequality and its impacts World Social Situation 2019 New York, 12-13 September 2018 Introduction In 2017, the General Assembly encouraged the Secretary-General to
World changes in inequality:
 World changes in inequality: facts, causes, policies François Bourguignon Paris School of Economics BIS, Luzern, June 2016 1 The rising importance of inequality in the public debate Due to fast increase
IMF research links declining labour share to weakened worker bargaining power. ACTU Economic Briefing Note, August 2018
 IMF research links declining labour share to weakened worker bargaining power ACTU Economic Briefing Note, August 2018 Authorised by S. McManus, ACTU, 365 Queen St, Melbourne 3000. ACTU D No. 172/2018
THE EUROPEAN PROJECT: CELEBRATING 60 YEARS
 THE EUROPEAN PROJECT: CELEBRATING 60 YEARS Contents 01 Reflections on the past 02 The European Union today 03 Looking to the future 2 Ipsos. REFLECTIONS ON THE PAST 3 Ipsos. INTRODUCTION AS SHOWN TO RESPONDENTS:
Building a Better America One Wealth Quintile at a Time. Forthcoming in Perspectives on Psychological Science
 Building a Better America 1 Building a Better America One Wealth Quintile at a Time Michael I. Norton Harvard Business School Dan Ariely Duke University Forthcoming in Perspectives on Psychological Science
Supplementary Materials for
 www.sciencemag.org/cgi/content/full/science.aag2147/dc1 Supplementary Materials for How economic, humanitarian, and religious concerns shape European attitudes toward asylum seekers This PDF file includes
DO POVERTY DETERMINANTS DIFFER OVER EXPENDITURE DECILES? A SRI LANKAN CASE FROM 1990 TO 2010
 International Journal of Economics, Commerce and Management United Kingdom Vol. III, Issue 10, October 2015 http://ijecm.co.uk/ ISSN 2348 0386 DO POVERTY DETERMINANTS DIFFER OVER EXPENDITURE DECILES? A
Table A.1: Experiment Sample Distribution and National Demographic Benchmarks Latino Decisions Sample, Study 1 (%)
") Online Appendix Table A.1: Experiment Sample Distribution and National Demographic Benchmarks Latino Decisions Sample, Study 1 (%) YouGov Sample, Study 2 (%) American Community Survey 2014 (%) Gender Female
Online Appendix Table A.1: Experiment Sample Distribution and National Demographic Benchmarks Latino Decisions Sample, Study 1 (%) YouGov Sample, Study 2 (%) American Community Survey 2014 (%) Gender Female
Perceptions of inequality: perspectives of national policy makers
 6 Perceptions of inequality: perspectives of national policy makers A large amount of research shows that, besides material interests, cognitive and normative factors, i.e. perceptions and values, greatly
The Role of the Public Sector for Combating Inequality and for Promoting Inclusive Growth Combating Inequality Project, Global Labour University
 The Role of the Public Sector for Combating Inequality and for Promoting Inclusive Growth Combating Inequality Project, Global Labour University Christoph Hermann Lecturer, University of Vienna The Role
Household Inequality and Remittances in Rural Thailand: A Lifecycle Perspective
 Household Inequality and Remittances in Rural Thailand: A Lifecycle Perspective Richard Disney*, Andy McKay + & C. Rashaad Shabab + *Institute of Fiscal Studies, University of Sussex and University College,
The determinants of the preferences for redistribution
 The determinants of the preferences for redistribution 13th Winter School on Inequality and Social Welfare Theory Alba di Canazei, Italy (IT13) Brice Magdalou January 8, 2018 CEE-M University of Montpellier,
Global Citizen Reaction to the Fukushima Nuclear Plant Disaster June 2011
 Global @dvisor Global Citizen Reaction to the Fukushima Plant Disaster June 2011 Methodology! These are the findings of the Global @dvisor Wave 20 (G@20), an Ipsos survey conducted between April 6 th and
Educated Preferences: Explaining Attitudes Toward Immigration In Europe. Jens Hainmueller and Michael J. Hiscox. Last revised: December 2005
 Educated Preferences: Explaining Attitudes Toward Immigration In Jens Hainmueller and Michael J. Hiscox Last revised: December 2005 Supplement III: Detailed Results for Different Cutoff points of the Dependent
Oxfam Education
 Background notes on inequality for teachers Oxfam Education What do we mean by inequality? In this resource inequality refers to wide differences in a population in terms of their wealth, their income
The Impact of Unionization on the Wage of Hispanic Workers. Cinzia Rienzo and Carlos Vargas-Silva * This Version, May 2015.
 The Impact of Unionization on the Wage of Hispanic Workers Cinzia Rienzo and Carlos Vargas-Silva * This Version, May 2015 Abstract This paper explores the role of unionization on the wages of Hispanic
Immigrant-native wage gaps in time series: Complementarities or composition effects?
 Immigrant-native wage gaps in time series: Complementarities or composition effects? Joakim Ruist Department of Economics University of Gothenburg Box 640 405 30 Gothenburg, Sweden joakim.ruist@economics.gu.se
Inequality and economic growth
 Introduction One of us is a theorist, and one of us is an historian, but both of us are economists interested in modern debates about technical change, convergence, globalization, and inequality. The central
1. The Relationship Between Party Control, Latino CVAP and the Passage of Bills Benefitting Immigrants
 The Ideological and Electoral Determinants of Laws Targeting Undocumented Migrants in the U.S. States Online Appendix In this additional methodological appendix I present some alternative model specifications
5. Destination Consumption
 5. Destination Consumption Enabling migrants propensity to consume Meiyan Wang and Cai Fang Introduction The 2014 Central Economic Working Conference emphasised that China s economy has a new normal, characterised
English Deficiency and the Native-Immigrant Wage Gap
 DISCUSSION PAPER SERIES IZA DP No. 7019 English Deficiency and the Native-Immigrant Wage Gap Alfonso Miranda Yu Zhu November 2012 Forschungsinstitut zur Zukunft der Arbeit Institute for the Study of Labor
Rural and Urban Migrants in India:
 Rural and Urban Migrants in India: 1983-2008 Viktoria Hnatkovska and Amartya Lahiri July 2014 Abstract This paper characterizes the gross and net migration flows between rural and urban areas in India
DISCUSSION PAPERS IN ECONOMICS
 DISCUSSION PAPERS IN ECONOMICS No. 2009/4 ISSN 1478-9396 IS THERE A TRADE-OFF BETWEEN INCOME INEQUALITY AND CORRUPTION? EVIDENCE FROM LATIN AMERICA Stephen DOBSON and Carlyn RAMLOGAN June 2009 DISCUSSION
II. Roma Poverty and Welfare in Serbia and Montenegro
 II. Poverty and Welfare in Serbia and Montenegro 10. Poverty has many dimensions including income poverty and non-income poverty, with non-income poverty affecting for example an individual s education,
Ghana Lower-middle income Sub-Saharan Africa (developing only) Source: World Development Indicators (WDI) database.
 Source: World Development Indicators (WDI) database.") Knowledge for Development Ghana in Brief October 215 Poverty and Equity Global Practice Overview Poverty Reduction in Ghana Progress and Challenges A tale of success Ghana has posted a strong growth performance
Knowledge for Development Ghana in Brief October 215 Poverty and Equity Global Practice Overview Poverty Reduction in Ghana Progress and Challenges A tale of success Ghana has posted a strong growth performance
ARTNeT Trade Economists Conference Trade in the Asian century - delivering on the promise of economic prosperity rd September 2014
 ASIA-PACIFIC RESEARCH AND TRAINING NETWORK ON TRADE ARTNeT CONFERENCE ARTNeT Trade Economists Conference Trade in the Asian century - delivering on the promise of economic prosperity 22-23 rd September
Biased Perceptions of Income Inequality and Redistribution
 Biased Perceptions of Income Inequality and Redistribution Carina Engelhardt University of Hannover Andreas Wagener University of Hannover Discussion Paper No. 526 ISSN 0949-9962 February 2014 Abstract
Does Inequality Matter for Poverty Reduction? Evidence from Pakistan s Poverty Trends
 The Pakistan Development Review 45 : 3 (Autumn 2006) pp. 439 459 Does Inequality Matter for Poverty Reduction? Evidence from Pakistan s Poverty Trends HAROON JAMAL * The paper explores the linkages between
NATIONAL OPINION POLL: CANADIAN VIEWS ON ASIA
 NATIONAL OPINION POLL: CANADIAN VIEWS ON ASIA Copyright 2014 Asia Pacific Foundation of Canada TABLE OF CONTENTS ABOUT THE ASIA PACIFIC FOUNDATION OF CANADA 2 ABOUT THE NATIONAL OPINION POLL: CANADIAN
May 2018 IPSOS VIEWS. What Worries the World. Michael Clemence
 May 2018 IPSOS VIEWS What Worries Michael Clemence What Worries? Every month across the year, our What Worries the World survey series has asked an online sample of over 18,000 citizens in 26 core countries
The globalization of inequality
 The globalization of inequality François Bourguignon Paris School of Economics Public lecture, Canberra, May 2013 1 "In a human society in the process of unification inequality between nations acquires
Global Corruption Barometer 2010 New Zealand Results
 Global Corruption Barometer 2010 New Zealand Results Ben Krieble TINZ Summer Intern www.transparencynz.org.nz executive@transparency.org.nz Contents Executive Summary 3 Summary of global results 4 Summary
Explaining Cross-Country Differences in Attitudes Towards Immigration in the EU-15
 Soc Indic Res (2009) 91:371 390 DOI 10.1007/s11205-008-9341-5 Explaining Cross-Country Differences in Attitudes Towards Immigration in the EU-15 Nikolaj Malchow-Møller Æ Jakob Roland Munch Æ Sanne Schroll
Income, Deprivation, and Perceptions in Latin America and the Caribbean:
 Income, Deprivation, and Perceptions in Latin America and the Caribbean: New Evidence from the Gallup World Poll Leonardo Gasparini* Walter Sosa Escudero** Mariana Marchionni* Sergio Olivieri* * CEDLAS
THE U.S.-CHINA POWER SHIFT
 THE U.S.-CHINA POWER SHIFT Bruce Stokes Director, Global Economic Attitudes Pew Research Center Funded largely by the Pew Charitable Trusts Non-profit, non-partisan fact tank in Washington Research areas
UTS:IPPG Project Team. Project Director: Associate Professor Roberta Ryan, Director IPPG. Project Manager: Catherine Hastings, Research Officer
 IPPG Project Team Project Director: Associate Professor Roberta Ryan, Director IPPG Project Manager: Catherine Hastings, Research Officer Research Assistance: Theresa Alvarez, Research Assistant Acknowledgements
Europeans support a proportional allocation of asylum seekers
 In the format provided by the authors and unedited. SUPPLEMENTARY INFORMATION VOLUME: 1 ARTICLE NUMBER: 0133 Europeans support a proportional allocation of asylum seekers Kirk Bansak, 1,2 Jens Hainmueller,
Welfare State and Local Government: the Impact of Decentralization on Well-Being
 Welfare State and Local Government: the Impact of Decentralization on Well-Being Paolo Addis, Alessandra Coli, and Barbara Pacini (University of Pisa) Discussant Anindita Sengupta Associate Professor of
GLOBALIZATION 4.0 The Human Experience. Presented to the World Economic Forum by SAP + Qualtrics
 + GLOBALIZATION 4.0 The Human Experience Presented to the World Economic Forum by SAP + Qualtrics 1 Survey methodology An original survey research project with more than 10,000 respondents across 29 countries
The Impact of Unionization on the Wage of Hispanic Workers. Cinzia Rienzo and Carlos Vargas-Silva * This Version, December 2014.
 The Impact of Unionization on the Wage of Hispanic Workers Cinzia Rienzo and Carlos Vargas-Silva * This Version, December 2014 Abstract This paper explores the role of unionization on the wages of Hispanic
Immigration and property prices: Evidence from England and Wales
 MPRA Munich Personal RePEc Archive Immigration and property prices: Evidence from England and Wales Nils Braakmann Newcastle University 29. August 2013 Online at http://mpra.ub.uni-muenchen.de/49423/ MPRA
Corruption and business procedures: an empirical investigation
 Corruption and business procedures: an empirical investigation S. Roy*, Department of Economics, High Point University, High Point, NC - 27262, USA. Email: sroy@highpoint.edu Abstract We implement OLS,
CSI Brexit 2: Ending Free Movement as a Priority in the Brexit Negotiations
 CSI Brexit 2: Ending Free Movement as a Priority in the Brexit Negotiations 18 th October, 2017 Summary Immigration is consistently ranked as one of the most important issues facing the country, and a
Ernst Fehr; Michael Näf und Klaus M. Schmidt: The Role of Equality and Equity in Social Preferences
 Ernst Fehr; Michael Näf und Klaus M. Schmidt: The Role of Equality and Equity in Social Preferences Munich Discussion Paper No. 2005-19 Department of Economics University of Munich Volkswirtschaftliche
An Empirical Analysis of Pakistan s Bilateral Trade: A Gravity Model Approach
 103 An Empirical Analysis of Pakistan s Bilateral Trade: A Gravity Model Approach Shaista Khan 1 Ihtisham ul Haq 2 Dilawar Khan 3 This study aimed to investigate Pakistan s bilateral trade flows with major
Immigrant Legalization
 Technical Appendices Immigrant Legalization Assessing the Labor Market Effects Laura Hill Magnus Lofstrom Joseph Hayes Contents Appendix A. Data from the 2003 New Immigrant Survey Appendix B. Measuring
The Cultural Origin of Saving Behaviour. Joan Costa Font, LSE Paola Giuliano, UCLA Berkay Ozcan*, LSE
 The Cultural Origin of Saving Behaviour Joan Costa Font, LSE Paola Giuliano, UCLA Berkay Ozcan*, LSE Household Saving Rates Source: OECD National Accounts Statistics: National Accounts at a Glance Background
World & Tourism Outlook. Luc Durand President, Ipsos - Quebec
 World & Tourism Outlook Luc Durand President, Ipsos - Quebec October 2013 Ipsos: A World Leader in Research Ipsos is the third largest research company in the world and the first in Canada Every year,
2017 NATIONAL OPINION POLL
 2017 NATIONAL OPINION POLL Canadian Views on Engagement with China 2017 NATIONAL OPINION POLL I 1 2017 NATIONAL OPINION POLL 2 TABLE OF CONTENTS EXECUTIVE SUMMARY ABOUT THE ASIA PACIFIC FOUNDATION OF CANADA
Benefit levels and US immigrants welfare receipts
 1 Benefit levels and US immigrants welfare receipts 1970 1990 by Joakim Ruist Department of Economics University of Gothenburg Box 640 40530 Gothenburg, Sweden joakim.ruist@economics.gu.se telephone: +46
Dr Abigail McKnight Associate Professorial Research Fellow and Associate Director, CASE, LSE Dr Chiara Mariotti Inequality Policy Manager, Oxfam
 Hosted by LSE Works: CASE The Relationship between Inequality and Poverty: mechanisms and policy options Dr Eleni Karagiannaki Research Fellow, CASE, LSE Chris Goulden Deputy Director, Policy and Research,
Rural and Urban Migrants in India:
 Rural and Urban Migrants in India: 1983 2008 Viktoria Hnatkovska and Amartya Lahiri This paper characterizes the gross and net migration flows between rural and urban areas in India during the period 1983
Is the Great Gatsby Curve Robust?
 Comment on Corak (2013) Bradley J. Setzler 1 Presented to Economics 350 Department of Economics University of Chicago setzler@uchicago.edu January 15, 2014 1 Thanks to James Heckman for many helpful comments.
3.3 DETERMINANTS OF THE CULTURAL INTEGRATION OF IMMIGRANTS
 1 Duleep (2015) gives a general overview of economic assimilation. Two classic articles in the United States are Chiswick (1978) and Borjas (1987). Eckstein Weiss (2004) studies the integration of immigrants
CIE Economics A-level
 CIE Economics A-level Topic 4: The Macroeconomy c) Classification of countries Notes Indicators of living standards and economic development The three dimensions of the Human Development Index (HDI) The
The transition of corruption: From poverty to honesty
 February 26 th 2009 Kiel and Aarhus The transition of corruption: From poverty to honesty Erich Gundlach a, *, Martin Paldam b,1 a Kiel Institute for the World Economy, P.O. Box 4309, 24100 Kiel, Germany
Household Income, Poverty, and Food-Stamp Use in Native-Born and Immigrant Households
 Household, Poverty, and Food-Stamp Use in Native-Born and Immigrant A Case Study in Use of Public Assistance JUDITH GANS Udall Center for Studies in Public Policy The University of Arizona research support
International Journal of Humanities & Applied Social Sciences (IJHASS)
") Governance Institutions and FDI: An empirical study of top 30 FDI recipient countries ABSTRACT Bhavna Seth Assistant Professor in Economics Dyal Singh College, New Delhi E-mail: bhavna.seth255@gmail.com
Governance Institutions and FDI: An empirical study of top 30 FDI recipient countries ABSTRACT Bhavna Seth Assistant Professor in Economics Dyal Singh College, New Delhi E-mail: bhavna.seth255@gmail.com
Differences in remittances from US and Spanish migrants in Colombia. Abstract
 Differences in remittances from US and Spanish migrants in Colombia François-Charles Wolff LEN, University of Nantes Liliana Ortiz Bello LEN, University of Nantes Abstract Using data collected among exchange
A REPLICATION OF THE POLITICAL DETERMINANTS OF FEDERAL EXPENDITURE AT THE STATE LEVEL (PUBLIC CHOICE, 2005) Stratford Douglas* and W.
 Stratford Douglas* and W.") A REPLICATION OF THE POLITICAL DETERMINANTS OF FEDERAL EXPENDITURE AT THE STATE LEVEL (PUBLIC CHOICE, 2005) by Stratford Douglas* and W. Robert Reed Revised, 26 December 2013 * Stratford Douglas, Department
A REPLICATION OF THE POLITICAL DETERMINANTS OF FEDERAL EXPENDITURE AT THE STATE LEVEL (PUBLIC CHOICE, 2005) by Stratford Douglas* and W. Robert Reed Revised, 26 December 2013 * Stratford Douglas, Department
RESEARCH NOTE The effect of public opinion on social policy generosity
 Socio-Economic Review (2009) 7, 727 740 Advance Access publication June 28, 2009 doi:10.1093/ser/mwp014 RESEARCH NOTE The effect of public opinion on social policy generosity Lane Kenworthy * Department
Book Discussion: Worlds Apart
 Book Discussion: Worlds Apart The Carnegie Endowment for International Peace September 28, 2005 The following summary was prepared by Kate Vyborny Junior Fellow, Carnegie Endowment for International Peace
Ethnic Diversity and Perceptions of Government Performance
 Ethnic Diversity and Perceptions of Government Performance PRELIMINARY WORK - PLEASE DO NOT CITE Ken Jackson August 8, 2012 Abstract Governing a diverse community is a difficult task, often made more difficult
Inclusive global growth: a framework to think about the post-2015 agenda
 Inclusive global growth: a framework to think about the post-215 agenda François Bourguignon Paris School of Economics Angus Maddison Lecture, Oecd, Paris, April 213 1 Outline 1) Inclusion and exclusion
The determinants of the preferences for redistribution
 The determinants of the preferences for redistribution 13th Winter School on Inequality and Social Welfare Theory Alba di Canazei, Italy (IT13) Brice Magdalou January 8, 2018 CEE-M University of Montpellier,
Forum «Pour un Québec prospère» Pour des politiques publiques de réduction des inégalités pro-croissance Mardi le 3 juin 2014
 Forum «Pour un Québec prospère» Pour des politiques publiques de réduction des inégalités pro-croissance Mardi le 3 juin 2014 NOUVELLES APPROCHES EN MATIÈRE DE RÉDUCTION DES INÉGALITÉS ET DE POLITIQUES
Globalization and Inequality : a brief review of facts and arguments
 Globalization and Inequality : a brief review of facts and arguments François Bourguignon Paris School of Economics LIS Lecture, July 2018 1 The globalization/inequality debate and recent political surprises
The Economic and Social Outcomes of Children of Migrants in New Zealand
 The Economic and Social Outcomes of Children of Migrants in New Zealand Julie Woolf Statistics New Zealand Julie.Woolf@stats.govt.nz, phone (04 931 4781) Abstract This paper uses General Social Survey
Consumer Barometer Study 2017
 Consumer Barometer Study 2017 The Year of the Mobile Majority As reported mobile internet usage crosses 50% 2 for the first time in all 63 countries covered by the Consumer Barometer Study 1, we look at
Reducing income inequality by economics growth in Georgia
 Reducing income inequality by economics growth in Georgia Batumi Shota Rustaveli State University Faculty of Economics and Business PhD student in Economics Nino Kontselidze Abstract Nowadays Georgia has
Research Report. How Does Trade Liberalization Affect Racial and Gender Identity in Employment? Evidence from PostApartheid South Africa
 International Affairs Program Research Report How Does Trade Liberalization Affect Racial and Gender Identity in Employment? Evidence from PostApartheid South Africa Report Prepared by Bilge Erten Assistant
Gender attitudes in the world of work: cross-cultural comparison
 Gender attitudes in the world of work: cross-cultural comparison Natalia Soboleva Junior research fellow Laboratory for comparative social research HSE nsoboleva@hse.ru the Third LCSR International Workshop
Perceived Income Inequality and Corruption
 GLOBAL RELATIONS FORUM YOUNG ACADEMICS PROGRAM ANALYSIS PAPER SERIES No.2 Perceived Income Inequality and Corruption DR. ÇINAR BAYMUL University of Oxford, Ph.D. in International Development Consultant,
Beyond Gini: Income Distribution and Economic Development. Pushan Dutt INSEAD, Corresponding author
 Working Paper Series 2015/99/EPS/DSC Beyond Gini: Income Distribution and Economic Development Pushan Dutt INSEAD, pushan.dutt@insead.edu Corresponding author Ilia Tsetlin INSEAD, ilia.tsetlin@insead.edu
Trade: Behind the Headlines The Public s View
 Trade: Behind the Headlines The Public s View Bruce Stokes Director, Global Economic Attitudes WTO, Geneva, September 26, 2017 THE ECONOMIC CONTEXT HAS IMPROVED October 3, 2017 www.pewproject.org 2 Views
7 ETHNIC PARITY IN INCOME SUPPORT
 7 ETHNIC PARITY IN INCOME SUPPORT Summary of findings For customers who, in 2003, had a Work Focused Interview as part of an IS claim: There is evidence, for Ethnic Minorities overall, of a significant
State of the World by United Nations Indicators. Audrey Matthews, Elizabeth Curtis, Wes Biddle, Valery Bonar
 State of the World by United Nations Indicators Audrey Matthews, Elizabeth Curtis, Wes Biddle, Valery Bonar Background The main objective of this project was to develop a system to determine the status
Europe s Hidden Inequality i
 Focus on Europe London Office October 2010 Europe s Hidden Inequality i Income distribution in the European Union (EU) is much more unequal than the EU itself avows: indeed, it is more unequal than in,
Why is there Cross-Country Variation in Female Labor Force Participation Rates? The Role of Male Attitudes Toward Family and Sex Roles
 Why is there Cross-Country Variation in Female Labor Force Participation Rates? The Role of Male Attitudes Toward Family and Sex Roles Heather Antecol Department of Economics Claremont McKenna College
English Deficiency and the Native-Immigrant Wage Gap in the UK
 English Deficiency and the Native-Immigrant Wage Gap in the UK Alfonso Miranda a Yu Zhu b,* a Department of Quantitative Social Science, Institute of Education, University of London, UK. Email: A.Miranda@ioe.ac.uk.
Household Income inequality in Ghana: a decomposition analysis
 Household Income inequality in Ghana: a decomposition analysis Jacob Novignon 1 Department of Economics, University of Ibadan, Ibadan-Nigeria Email: nonjake@gmail.com Mobile: +233242586462 and Genevieve
Assimilation and Cohort Effects for German Immigrants
 Assimilation and Cohort Effects for German Immigrants Authors Sebastian Gundel and Heiko Peters Abstract Demographic change and the rising demand for highly qualified labor in Germany attracts notice to
London Measured. A summary of key London socio-economic statistics. City Intelligence. September 2018
 A summary of key socio-economic statistics September 2018 People 1. Population 1.1 Population Growth 1.2 Migration Flow 2. Diversity 2.1 Foreign-born ers 3. Social Issues 3.1 Poverty & Inequality 3.2 Life
Remittances and the Brain Drain: Evidence from Microdata for Sub-Saharan Africa
 Remittances and the Brain Drain: Evidence from Microdata for Sub-Saharan Africa Julia Bredtmann 1, Fernanda Martinez Flores 1,2, and Sebastian Otten 1,2,3 1 RWI, Rheinisch-Westfälisches Institut für Wirtschaftsforschung
Inclusion and Gender Equality in China
 Inclusion and Gender Equality in China 12 June 2017 Disclaimer: The views expressed in this publication are those of the authors and do not necessarily reflect the views and policies of the Asian Development
3 Wage adjustment and employment in Europe: some results from the Wage Dynamics Network Survey
 3 Wage adjustment and in Europe: some results from the Wage Dynamics Network Survey This box examines the link between collective bargaining arrangements, downward wage rigidities and. Several past studies
The Politics of Global Poverty Diverse Perspectives on Measurement MARKUS LEDERER & ANDREA SCHAPPER REVIEW
 REVIEW MARKUS LEDERER & ANDREA SCHAPPER The Politics of Global Poverty Diverse Perspectives on Measurement Review of: Sudhir Anand, Paul Segal and Joseph E. Stiglitz (eds.): Debates on the Measurement
Worlds Apart: Measuring International and Global Inequality
 Worlds Apart: Measuring International and Global Inequality Carnegie Endowment for International Peace Washington, September 28, 2005 1. Inequality today 2. Inequality between world citizens today 3. Does
Is Global Inequality Really Falling?
 Presentation at session on Global Inequality, WIDER Conference 2018 Is Global Inequality Really Falling? Martin Ravallion Georgetown University 1 Defining global inequality The prevailing approach pools
Natural Resources & Income Inequality: The Role of Ethnic Divisions
 DEPARTMENT OF ECONOMICS OxCarre (Oxford Centre for the Analysis of Resource Rich Economies) Manor Road Building, Manor Road, Oxford OX1 3UQ Tel: +44(0)1865 281281 Fax: +44(0)1865 281163 reception@economics.ox.ac.uk
INTERNAL SECURITY. Publication: November 2011
 Special Eurobarometer 371 European Commission INTERNAL SECURITY REPORT Special Eurobarometer 371 / Wave TNS opinion & social Fieldwork: June 2011 Publication: November 2011 This survey has been requested
INCREASED OPPORTUNITY TO MOVE UP THE ECONOMIC LADDER? EARNINGS MOBILITY IN EU:
 INCREASED OPPORTUNITY TO MOVE UP THE ECONOMIC LADDER? EARNINGS MOBILITY IN EU: 994-2 Denisa Sologon Cathal O Donoghue Work in Progress July 29 Working Paper MGSoG/29/WP3 Maastricht Graduate School of Governance