Communities in Context: The Health Context for Official Language Minority Communities February 27, 2017
|
|
|
- Garry Bond
- 5 years ago
- Views:
Transcription
1 Communities in Context: The Health Context for Official Language Minority Communities February 27, 2017 Research Team Official Languages Branch Canadian Heritage
2 Overview Health Context Indicators Proportion of health institutions which are designated to deliver minority-language services. Proximity to health institutions OLMC participation in health industry OLMC health professionals Composite Indicators Geo-spatial complexity Demographic vitality Demo-linguistic vitality Socio-cultural diversity Socio-economic vitality Purpose and Organization of this Document This document provides an overview of the methodology and high-level observations of a series of composite indicators for key dimensions of community vitality listed in the box on the left and provides data and indicators of specific aspects of the health context for OLMCs. Health Context Indicators The calculation of minority-language designated institutions is based on a database developed by the ICRML. The proximity indicators illustrate the proportion of the OLMC population who live within 10 km of a health establishment designated to deliver services in the official-language minority community. Data on the presence of the OLMC in the health industry and health professions as percentages and as a minority-majority index. Composite Indicators The section for each composite indicator contains: a short description of the rationale and importance to policy and community development; a list of components on which the composites are based; a graph of the weights assigned to each component; a pan-canadian map displaying the relative vitality of sub-provincial regions for each dimension. For the maps, the colours of the circles represent the level of vitality for the dimension being measured and the size of the circle represent the size of the OLMC in the given territory. 2
3 Regional examples Examples The following pages present the 5 composite indicators and 3 health context indicators for a sample of five economic regions, one in each region of the country. Edmunston-Woodstock (Atlantic) Gaspésie Îles-de-la-Madeleine (Québec) Toronto (Ontario) Sud-est du Manitoba (Prairies/Terrirories) Lower Mainland Southwest (West/Yukon) 3
 where they form 50.")
4 Edmundston Woodstock (NB) There are 39,735 Francophones living in Edmundston - Woodstock (NB) where they form 50.4 % of the population.
5 Gaspésie Îles-de-la-Madeleine (QC) There are 9,950 Francophones living in Gaspésie - Iles-de-la-Madeleine (QC) where they form 10.7 % of the population.
6 Toronto (ON) There are 91,760 Francophones living in Toronto (ON) where they form 1.7 % of the population.
7 Southeast (MB) There are 8,863 Francophones living in Southeast (MB) where they form 8.5 % of the population.
8 There are 36,548 Francophones living in Lower Mainland - Southwest (BC) where they form 1.4 % of the population. Composite Indicators of Community Vitality Lower Mainland Southwest (BC)
9 Health Context Public Health Institutions with Minority-Language Service Obligations Canada less Quebec According to the CIRLM database of health institutions, 16.5% of establishments outside Quebec are designated to offer at least some services in the minority language
10 Health Context Public Health Institutions with Minority-Language Service Obligations Quebec and its Administrative Regions According to the CIRLM database of health institutions, 17% of establishments in Quebec are designated to offer at least some services in the minority language

11 Health Context Proportion of the OLMC Population Living within 10km of a Health Establishment Designated to Provide Minority-Language Services

12 Health Context Proportion of the OLMC Population Living within 10km of a Health Establishment Designated to Provide Minority-Language Services

13 Health Context Proximity of OLMC Populations to Health Institutions Designated to Deliver Minority-Language Services 13
14 Health Context OL Minority Presence in the Healthcare and Social Assistance Industry, Minority-Majority Index, Canada, less Québec Québec Canada Note: The minority-majority index compares the OL minority's presence in the industry with that of the majority. A value greater than 1.00 indicates that the minority is more present than the majority. A value less than 1.00 indicates that the minority is less present with the majority. Presence in the Healthcare and Social Assistance Industry, 2011 We observe that younger Francophones in a minority situation (aged 25-44) are more likely to be employed in the healthcare and social assistance industry (mmi=1.10) than their Anglophone counterparts. Older Francophones (aged 45-64) were less likely to be so employed than their Anglophone counterparts (mmi=0.90). For Quebec Anglophones, the trend is going in the opposite direction as younger Anglophones (aged 25-44) were much less likely to be employed in this sector than their Francophone counterparts (mmi=0.64) 14
15 Health Context OLMC Participation in the Health Care and Social Assistance Industry

16 Health Context OLMC Participation in the Health Care and Social Assistance Industry Minority-Majority Index

17 Health Context OLMC Participation in the Health Care and Social Assistance Industry

18 Health Context OLMC Participation in the Health Care and Social Assistance Industry Minority-Majority Index
19 Health Context OL Minority Participation in Health Occupations, Minority-Majority Index, Canada, less Québec Québec Canada Note: The minority-majority index compares the OL minority's presence in the industry with that of the majority. A value greater than 1.00 indicates that the minority is more present than the majority. A value less than 1.00 indicates that the minority is less present with the majority. OLMC Presence in Health Occupations, 2011 We observe that younger Francophones in a minority situation (aged 25-44) are more likely to be employed in health occupations (mmi=1.10) than their Anglophone counterparts. Older Francophones (aged 45-64) were slightly less likely to be so employed than their Anglophone counterparts (mmi=0.97). For Quebec Anglophones, the trend is going in the opposite direction as younger Anglophones (aged 25-44) were much less likely to be employed in this field than their Francophone counterparts (mmi=

20 Health Context OLMC Presence in Health Occupations
21 Health Context OLMC Presence in Health Occupations Canada, less Quebec Minority-Majority Index

22 Health Context OLMC Presence in Health Occupations
23 Health Context OLMC Presence in Health Occupations Canada, less Quebec Minority-Majority Index
24 Geo-spatial complexity Community Development and Policy Implications Populations with a simple geo-spatial status provide greater potential for mobilization and a simpler challenge for effective service delivery. Populations with a complex geo-spatial situation will present greater challenges for mobilization and service delivery and may face challenges of community cohesiveness and identity.
25 Geo-spatial Complexity Variables and Measures Geographic Concentration (based on standard distance) Geographic Proximity (based on distance band measure) Geographic Clustering (based on average nearest neighbour) Population density Rural/urban breakdown 25

26 Geo-spatial Complexity Component Weights 26
27 Geo-spatial Context 27
28 Demo-linguistic Vitality Community Development and Policy Implications Populations with a high demo-linguistic vitality are more able to use their language in a variety of settings and show a higher tendency to pass on their language to their children. In such cases, the majority-language population is more likely to know the minority language, giving it a higher status and contributing to a greater likelihood that the minority language will remain strong into the future. Low demo-linguistic vitality suggests that the minority language is losing ground, both in public spaces and in the home setting as there are fewer interactions in that language.
29 Methodology Demo-linguistic Vitality Variables and Measures Bilingualism in the majority population Intergenerational change (25-44 age group compared to the age group), Change over time (2011 compared to 1996) Linguistic continuity based on language(s) used at home and at work, either most frequently, or regularly Family dynamics in the minority population group Exogamy rate Intergenerational transmission of minority language o as a known language, o as a home language and o as mother tongue 29

30 Demo-linguistic Vitality Component Weights 30
31 Demo-linguistic Vitality 31
32 Demographic Vitality Community Development and Policy Implications Populations with a high demographic vitality are better able to erect and maintain institutions and networks that are important to overall community vitality. They are also likely to be more visible in public settings and may benefit from enhanced recognition from the majority institutions and governments at all levels.
33 Methodology Demographic Vitality Variables and Measures Size and proportion of populations with the minority-language as their first official language spoken (multiple responses assigned equally among declared languages) Local circumstance (proportion living in CSDs where they comprise more than 500 persons or higher than 5% of the local population) Age structure and dependencies (youth, seniors and overall) 33

34 Demographic Vitality Component Weights 34
35 Demographic Vitality 35
36 Socio-cultural Diversity Community Development and Policy Implications Populations with a high level of socio-cultural diversity demonstrate potential for growth as they have a proven capacity to attract others from different areas and different identity characteristics. This high level of diversity could present challenges in community identity and test the host population s capacity to maintain a strong socio-linguistic identity.
37 Methodology Socio-cultural Diversity Variables and Measures Immigrants Inter-provincial migrants Recent arrivals (immigrant and interprovincial) Visible minority groups Persons with Aboriginal identity Intergenerational change (25-44 age group compared to the age group) Change over time (2011 compared to 1996) Minority-majority index (Compares the value for the OLMC with the OL majority with whom it shares a territory) 37
38 Socio-cultural Vitality Component Weights 38
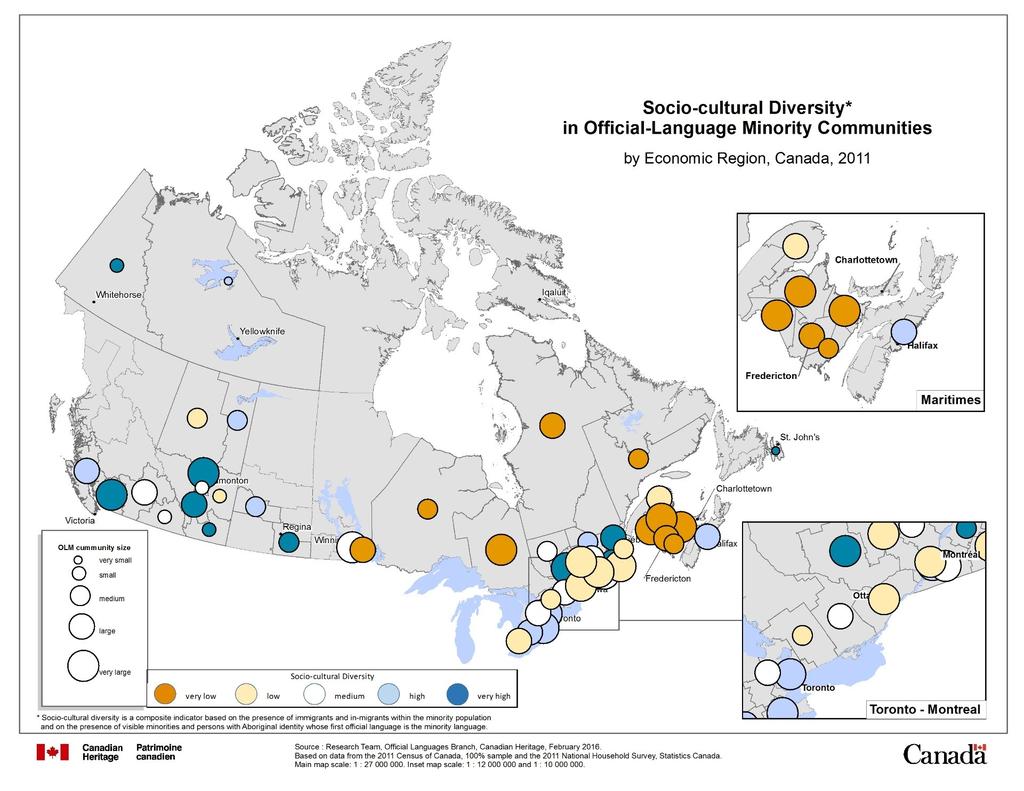
39 Socio-cultural Diversity 39
40 Socio-economic Vitality Community Development and Policy Implications Populations with low socio-economic status are: more likely to experience material deprivation; less likely to have access to education and training; more likely to rely on government transfers as a source of income; may face health challenges and may be more apt to leave their region in search of economic and educational opportunities.
41 Methodology Socio-economic Vitality Variables and Measures Low educational attainment (high school diploma or lower) Unemployed and out of the labour force Low income (less than $20k) Intergenerational change (25-44 age group compared to the age group) Change over time (2011 compared to 1996) Minority-majority index 41

42 Socio-economic Vitality Component Weights 42
43 Socio-economic Vitality 43
44 Institutional Presence Community Development and Policy Implications Communities with low institutional presence are more apt to seek services and to participate in organizations and networks where their language is less present which will de-value the status and utility of the minority language. They are also less likely to show capacity for collective action and may face challenges in making their particular challenges and needs known to government actors and mainstream organizations.
45 Methodology Institutional Presence Variables and Measures Schools Post-secondary institutions Media outlets Community organizations Cultural organizations Other organizations Institutional presence, density, proximity and completeness 45

46 Institutional Presence Component Weights 46
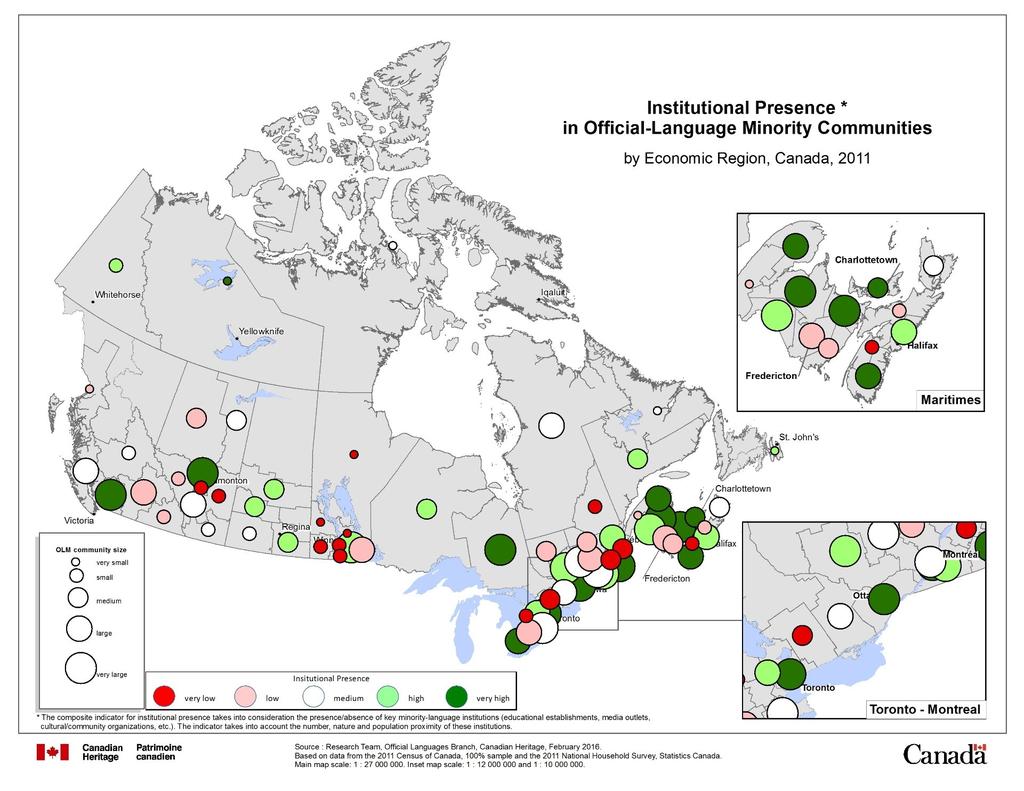
47 Institutional Presence 47
48 Presence of Federal Offices Community Development and Policy Implications Communities with a high presence of federal offices with minoritylanguage service obligations and potential for community vitality support are more apt to be able to function in their language and to receive material and symbolic support for community aspirations. They are more likely to be able to use their language in transactions with the federal government which benefits them both in functional and symbolic terms.
49 Methodology Presence of Federal Offices Variables and Measures Count of Federal Offices Minority-language obligations of federal offices Presence of federal offices with high potential for community vitality support Presence of federal offices which are included in Road Map 2 Presence, frequency, proximity 49

50 Presence of Federal Offices Component Weights 50
51 Presence of Federal Offices 51
52 OLMC Participation in the Health Care and Social Assistance Industry Community Development and Policy Implications Communities with a high level of participation in the health care/social assistance industries are more likely to encounter members of their language group while accessing services which brings about obvious linguistics advantages in the service transaction. There is also enhanced potential for engagement between the health establishments and the minority population as health professionals will naturally be participate in minority community networks (cultural, social, educational, etc.). This enhanced engagement can contribute to successfully linking minority concerns and priorities to decision makers.
53 Appendices
54 Feasibility Criteria Feasibility Criteria for Composite Indicators Information is relevant to the issues being studied Replicable over time Data is available at a reasonable cost (financial, human resources) Data is available at useful levels of geography (ex. census division, economic region, province/territory) 54
55 Concepts First Official Language Spoken (FOLS) is a linguistic concept derived from three census questions on language (knowledge of official languages, mother tongue and home language). Multiple responses are distributed equally among declared languages. The Official-Language Minority Community (OLMC) is the population in a given province or territory with the minority official language (English in Quebec and French outside Quebec) as their First Official Language Spoken. Multiple responses are distributed equally among declared languages. The Linguistic Continuity Index (LCI) compares the number of those who speak a given language as their home language with the number who had that language as a mother tongue. Mother Tongue (MT) refers to the first language learned at home in childhood and still understood at the time of the census. Multiple responses are distributed equally among declared languages. Home Language (HLa) refers to those who speak a given language most often at home. The language spoken at least regularly at home (HLab) is the total of the responses to the two home language questions (Part A - most often and Part B - regularly) in the Census. Multiple responses are distributed equally among declared languages. The language of work (LWa) refers to those who speak a given language most often at work. The language spoken at least regularly at home (LWab) is the total of the responses to the two language of work questions (Part A - most often and Part B - regularly) in the Census. Multiple responses are distributed equally among declared languages. Rural and Urban Areas In this study, Census Agglomerations and Census Metropolitan Areas with census tracts are treated as urban while all other areas are classed as rural. Concepts and Relative Indices Relative Indices The Intergenerational Index (intergen) compares the value for the younger adult population (aged 25-44) with the older half of the working age population (aged 45-64) in a given OL minority population. The intergenerational index suggests whether a particular situation is improving or deteriorating across time. The temporal index (temp9611) compares the value for the OL minority population in a given region in 2011 with the same population in A temporal index higher than 1.00 indicates that the value is more present in 2011 than it was in 1996 and a temporal index lower than 1.00 means that the characteristic is less present in 2011 than it was in Intergenerational transmission rates measure the tendency for the minority language to be passed on from parents to children as a mother tongue, home language or known language. The minority-majority index (MMI) compares the value for the OL minority population with the OL majority with whom it shares a territory. A value greater than 1.00 indicates that the characteristic is more present in the minority than in the majority while a value of less than 1.00 means that the characteristic is less present in the minority group. The Relative Population Growth (RPG) measures the change in proportion (or population share) of a given population. An RPG of greater than 1.00 indicates that the given population's share of the population increased over the time period in question while an RPG of less than 1.00 indicates a decrease in the population share. The Exogamy Rate expresses the proportions of persons with a given mother tongue who are in a couple relationship with persons who do not share that mother tongue. 55
56 Contact information William Floch Martin Durand Elias Abou-Rjeili Équipe de recherche Programmes d appui aux langues officielles Patrimoine canadien 15-7, Eddy Gatineau (Québec) K1A 0M5 56
Statistical portrait of English-speaking immigrants in Québec
 Statistical portrait of English-speaking immigrants in Québec Lorna Jantzen in collaboration with Fernando Mata February 2012 Research and Evaluation The views and opinions expressed in this document are
STRENGTHENING RURAL CANADA: Fewer & Older: Population and Demographic Crossroads in Rural Saskatchewan. An Executive Summary
 STRENGTHENING RURAL CANADA: Fewer & Older: Population and Demographic Crossroads in Rural Saskatchewan An Executive Summary This paper has been prepared for the Strengthening Rural Canada initiative by:
STRENGTHENING RURAL CANADA: Fewer & Older: The Coming Population and Demographic Challenges in Rural Newfoundland & Labrador
 STRENGTHENING RURAL CANADA: Fewer & Older: The Coming Population and Demographic Challenges in Rural Newfoundland & Labrador An Executive Summary 1 This paper has been prepared for the Strengthening Rural
STRENGTHENING RURAL CANADA: Fewer & Older: Population and Demographic Challenges Across Rural Canada A Pan-Canadian Report
 STRENGTHENING RURAL CANADA: Fewer & Older: Population and Demographic Challenges Across Rural Canada A Pan-Canadian Report This paper has been prepared for the Strengthening Rural Canada initiative by:
STRENGTHENING RURAL CANADA: Fewer & Older: The Coming Demographic Crisis in Rural Ontario
 STRENGTHENING RURAL CANADA: Fewer & Older: The Coming Demographic Crisis in Rural Ontario An Executive Summary 1 This paper has been prepared for the Strengthening Rural Canada initiative by: Dr. Bakhtiar
International Immigration and Official-Language Minority Communities : Challenges and Issues for the Canadian Linguistic Duality
 International Immigration and Official-Language Minority Communities : Challenges and Issues for the Canadian Linguistic Duality Jean-Pierre Corbeil, Ph.D. Statistics Canada Annual meeting of the Language
Catalogue no. of Quebec
 Catalogue no. A of Quebec How to obtain more information For information about this product or the wide range of services and data available from Statistics Canada, visit our website at www.statcan.gc.ca,
QUEBEC ANGLOPHONES WHO STAYED AND THOSE WHO LEFT. A COMPARISON OF KEY CHARACTERISTICS,
 QUEBEC ANGLOPHONES WHO STAYED AND THOSE WHO LEFT. A COMPARISON OF KEY CHARACTERISTICS, 1971 2001 1 William Floch Department of Canadian Heritage Abstract Quebec s English-speaking community, once a strong,
Portrait of Official-Language Minorities in Canada: Francophones in Nova Scotia
 Catalogue no. 89-642-X No. 009 ISBN 978-1-100-20089-7 Analytical Paper Portrait of Official-Language Minorities in Canada: Francophones in Nova Scotia by Camille Bouchard-Coulombe, Jean-François Lepage
Immigrant and Temporary Resident Children in British Columbia
 and Temporary Resident Children in British Columbia January 2011 During the five-year period from 2005 to 2009, on average, approximately 40,000 immigrants arrived in B.C. annually and approximately 7,900
Demographics. Chapter 2 - Table of contents. Environmental Scan 2008
 Environmental Scan 2008 2 Ontario s population, and consequently its labour force, is aging rapidly. The province faces many challenges related to a falling birth rate, an aging population and a large
BRIEF SUBMITTED BY RDÉE ONTARIO IN CONNECTION WITH THE CANADIAN HERITAGE CONSULTATIONS ON THE NEXT ACTION PLAN ON OFFICIAL LANGUAGES
 BRIEF SUBMITTED BY RDÉE ONTARIO IN CONNECTION WITH THE CANADIAN HERITAGE CONSULTATIONS ON THE NEXT ACTION PLAN ON OFFICIAL LANGUAGES TOWARDS FULL PARTICIPATION BY FRANCOPHONE ONTARIO IN ONTARIO S AND CANADA
Immigrant DELTA, B.C Delta Immigrant Demographics I
 Immigrant demographics DELTA, B.C. - 2018 Immigrant Demographics I Page 1 DELTA IMMIGRANT DEMOGRAPHICS Your quick and easy look at facts and figures around immigration. Newcomers are an important and growing
TOWNSHIP OF LANGLEY, B.C Township of Langley Immigrant Demographics I
 Immigrant demographics TOWNSHIP OF LANGLEY, B.C. - 2018 Township of Langley Immigrant Demographics I Page 1 TOWNSHIP OF LANGLEY IMMIGRANT DEMOGRAPHICS Your quick and easy look at facts and figures around
Aboriginal Youth, Education, and Labour Market Outcomes 1
 13 Aboriginal Youth, Education, and Labour Market Outcomes 1 Jeremy Hull Introduction Recently, there have been many concerns raised in Canada about labour market shortages and the aging of the labour
THE ETHNIC DIVERSITY SURVEY. Content and Data Availability
 THE ETHNIC DIVERSITY SURVEY Content and Data Availability September 2004 Statistics Canada Statistique Canada Canadian Heritage Patrimoine canadien Ethnic Diversity Survey objectives To provide information
Aboriginal Peoples in Canada: First Nations People, Métis and Inuit
 Aboriginal Peoples in Canada: First Nations People, Métis and Inuit 2011 National Household Survey (NHS) Social and Aboriginal Statistics September 16, 2013 Main analytical document Aboriginal Peoples
Languages of work and earnings of immigrants in Canada outside. Quebec. By Jin Wang ( )
") Languages of work and earnings of immigrants in Canada outside Quebec By Jin Wang (7356764) Major paper presented to the Department of Economics of the University of Ottawa in partial fulfillment of the
Languages of work and earnings of immigrants in Canada outside Quebec By Jin Wang (7356764) Major paper presented to the Department of Economics of the University of Ottawa in partial fulfillment of the
Profile of the New Brunswick Labour Force
 Profile of the New Brunswick Labour Force October 213 213 Profile of the New Brunswick Labour Force Province of New Brunswick PO 6, Fredericton NB E3B 5H1 www.gnb.ca 213.11 ISBN 978-1-465-247-1 (Print
2001 Census: analysis series
 Catalogue no. 96F0030XIE2001006 2001 Census: analysis series Profile of the Canadian population by mobility status: Canada, a nation on the move This document provides detailed analysis of the 2001 Census
Post-Secondary Education, Training and Labour September Profile of the New Brunswick Labour Force
 Post-Secondary Education, Training and Labour September 2018 Profile of the New Brunswick Labour Force Contents Population Trends... 2 Key Labour Force Statistics... 5 New Brunswick Overview... 5 Sub-Regional
Tracking Trends in Kingston
 Tracking Trends in Photo: 22, Courtesy of City Hall Total Population: 152,358 Population Changes for CMAs, 21 to 26 25 19.2 2 15 1 11.6 9.2 8.9 8.2 6.6 59 5.9 55 5.5 54 5.4 51 5.1 51 5.1 5 5. 46 4.6 3.8
The Implications of New Brunswick s Population Forecasts
 The Implications of New Brunswick s Post-Secondary Education, Training and Labour September 2017 In spring 2017, two papers (i) New Brunswick Population Snapshot and (ii) Small Area Population Forecasts
Integration of Internationally-educated Immigrants into the Canadian Labour Market: Determinants of Success
 Catalogue no. 81-595-M No. 094 ISSN: 1711-831X ISBN: 978-1-100-19203-1 Research Paper Culture, Tourism and the Centre for Education Statistics Integration of Internationally-educated Immigrants into the
Post-Secondary Education, Training and Labour January New Brunswick Analysis 2016 Census Topic: Immigration
 Post-Secondary Education, Training and Labour January 2018 New Brunswick Analysis 2016 Census Topic: Contents General Information... 2 Overview... 2 Population... 2 Demographics... 3 Sub-Provincial...
Skills Proficiency of Immigrants in Canada:
 Skills Proficiency of Immigrants in Canada: Findings from the Programme for the International Assessment of Adult Competencies (PIAAC) Government of Canada Gouvernement du Canada This report is published
Immigrant. coquitlam, B.C Coquitlam Immigrant Demographics I
 Immigrant demographics coquitlam, B.C. - 2018 Immigrant Demographics I Page 1 coquitlam IMMIGRANT DEMOGRAPHICS Your quick and easy look at facts and figures around immigration. Newcomers are an important
Chapter One: people & demographics
 Chapter One: people & demographics The composition of Alberta s population is the foundation for its post-secondary enrolment growth. The population s demographic profile determines the pressure points
Longitudinal Immigration Database (IMDB)
") Longitudinal Immigration Database (IMDB) www.statcan.gc.ca Telling Canada s story in numbers Tristan Cayn November 16, 2017 Overview What is the Longitudinal Immigration Database (IMDB)? Background Linkage
Longitudinal Immigration Database (IMDB) www.statcan.gc.ca Telling Canada s story in numbers Tristan Cayn November 16, 2017 Overview What is the Longitudinal Immigration Database (IMDB)? Background Linkage
Immigrant PORT COQUITLAM, B.C Port Coquitlam Immigrant Demographics I
 Immigrant demographics PORT COQUITLAM, B.C. - 2018 Immigrant Demographics I Page 1 PORT COQUITLAM IMMIGRANT DEMOGRAPHICS Your quick and easy look at facts and figures around immigration. Newcomers are
new westminster, B.C New Westminster Immigrant Demographics I
 Immigrant demographics new westminster, B.C. - 2018 Immigrant Demographics I Page 1 new westminster IMMIGRANT DEMOGRAPHICS Your quick and easy look at facts and figures around immigration. Newcomers are
Artists and Cultural Workers in Canadian Municipalities
 Artists and Cultural Workers in Canadian Municipalities Based on the 2011 National Household Survey Vol. 13 No. 1 Prepared by Kelly Hill Hill Strategies Research Inc., December 2014 ISBN 978-1-926674-36-0;
Verdun borough HIGHLIGHTS. In 1996, the Verdun borough had a population of 59,714. LOCATION
 Socio-economic profile borough February 2002 HIGHLIGHTS In 1996, the borough had a population of 59,714. LOCATION Between 1991 and 1996, the population of the borough declined by 2.6%. One-person households
Brief of the Office of the French Language Services Commissioner
 Brief of the Office of the French Language Services Commissioner Issues concerning the enumeration of rights-holders under section 23 of the Canadian Charter of Rights and Freedoms Presented to The House
Changing our ways: Why and how Canadians use the Internet
 Changing our ways: Why and how Canadians use the Internet By Heather Dryburgh Introduction Canadian households are increasingly buying home computers and connecting to the Internet (Dickinson & Ellison,
Readily Available Immigration Data
 Readily Available Immigration Data Tristan Cayn Research Officer, Strategic Research and Statistics PMC Node Meeting Calgary, Alberta November 25, 2008 Overview What immigration data is readily available?
Canada s Health Region Peer Groups. How do we compare?
 Canada s ealth Region Peer Groups ow do we compare? Prepared by James aggerstone September 18, 2014 The following document is a draft document prepared to bring some of the evidence about this subject
Assessment of Demographic & Community Data Updates & Revisions
 Assessment of Demographic & Community Data Updates & Revisions Scott Langen, Director of Operations McNair Business Development Inc. P: 306-790-1894 F: 306-789-7630 E: slangen@mcnair.ca October 30, 2013
Social and Demographic Trends in Burnaby and Neighbouring Communities 1981 to 2006
 Social and Demographic Trends in and Neighbouring Communities 1981 to 2006 October 2009 Table of Contents October 2009 1 Introduction... 2 2 Population... 3 Population Growth... 3 Age Structure... 4 3
SPEECH BY THE COMMISSIONER OF OFFICIAL LANGUAGES FOR NEW BRUNSWICK, KATHERINE D ENTREMONT
 SPEECH BY THE COMMISSIONER OF OFFICIAL LANGUAGES FOR NEW BRUNSWICK, KATHERINE D ENTREMONT Fifth Annual Meeting of the Language Rights Support Program (LRSP) Demo-linguistic Evolution and Immigration in
Population Aging, Immigration and Future Labor Shortage : Myths and Virtual Reality
 Population Aging, Immigration and Future Labor Shortage : Myths and Virtual Reality Alain Bélanger Speakers Series of the Social Statistics Program McGill University, Montreal, January 23, 2013 Montréal,
The Changing Face of Canada s Public Education System. Discussion Paper for the Pan-Canadian Consultation Process. By Laura Eggertson.
 The Changing Face of Canada s Public Education System Discussion Paper for the Pan-Canadian Consultation Process By Laura Eggertson Fall 2006 Produced by The Learning Partnership with funding from TD Bank
Release of 2006 Census results Labour Force, Education, Place of Work and Mode of Transportation
 Backgrounder Release of 2006 Census results Labour Force, Education, Place of Work and Mode of Transportation On March 4, 2008 Statistics Canada released further results from the 2006 census focusing on
OBSERVATION. TD Economics A DEMOGRAPHIC OVERVIEW OF ABORIGINAL PEOPLES IN CANADA
 OBSERVATION TD Economics May 1, 213 A DEMOGRAPHIC OVERVIEW OF ABORIGINAL PEOPLES IN CANADA Highlights New data from the National Household Survey (NHS) show that just over 1.4 million people identified
Gender wage gap among Canadian-born and immigrant workers. with respect to visible minority status
 Gender wage gap among Canadian-born and immigrant workers with respect to visible minority status By Manru Zhou (7758303) Major paper presented to the Department of Economics of the University of Ottawa
A Statistical Profile of Artists and Cultural Workers in Canada Based on the 2011 National Household Survey and the Labour Force Survey
 A Statistical Profile of Artists and Cultural Workers in Canada Based on the 2011 National Household Survey and the Labour Force Survey Vol. 12 No. 2 Prepared by Kelly Hill Hill Strategies Research Inc.,
Telephone Survey. Contents *
 Telephone Survey Contents * Tables... 2 Figures... 2 Introduction... 4 Survey Questionnaire... 4 Sampling Methods... 5 Study Population... 5 Sample Size... 6 Survey Procedures... 6 Data Analysis Method...
NORTHERN ONTARIO IMMIGRATION PROFILE. Michael Haan & Elena Prokopenko
 NORTHERN ONTARIO IMMIGRATION PROFILE Michael Haan & Elena Prokopenko FALL 2015 This Employment Ontario project is funded by the Ontario government The views expressed in this document do not necessarily
Post-Secondary Education, Training and Labour July New Brunswick Analysis 2016 Census Topic: Age & Sex
 Post-Secondary Education, Training and Labour July 2017 New Brunswick Analysis 2016 Census Topic: Age & Sex General Information On May 3, 2017, the second wave of data from the 2016 Census of Population
Rural Demographics & Immigration in Canada. Robert Annis and Jill Bucklaschuk Rural Development Institute Brandon University
 Rural Demographics & Immigration in Canada Robert Annis and Jill Bucklaschuk Rural Development Institute Brandon University Presentation Overview Presentation Overview Rural & Small Town (RST) Demographics
The Chinese Community in Canada
 Catalogue no. 89-621-XIE No. 001 ISSN: 1719-7376 ISBN: 0-662-43444-7 Analytical Paper Profiles of Ethnic Communities in Canada The Chinese Community in Canada 2001 by Colin Lindsay Social and Aboriginal
Post-Secondary Education, Training and Labour April New Brunswick Analysis 2016 Census Topic: Journey to Work
 Post-Secondary Education, Training and Labour April 2018 2016 Census Topic: Journey to Work Contents General Information... 2 Section 1 Place of Work... 2 1.1 Overview... 2 1.1 Sub-Provincial... 3 Section
Measuring Identities, Diversity and Inclusion: Results from the 2016 Census
 Measuring Identities, Diversity and Inclusion: Results from the 2016 Census www.statcan.gc.ca Telling Canada s story in numbers Jane Badets Assistant Chief Statistician Social, Health and Labour Statistics
Aboriginal Communities in Profile: Quinte, Kingston, Rideau Building healthy and vibrant communities
 Aboriginal Communities in Profile: Quinte, Kingston, Rideau Building healthy and vibrant communities The Ontario Trillium Foundation is an agency of the Government of Ontario. Métis Elder photo courtesy
MOBILITY AND MIGRATION THE CHALLENGE TO COMMUNITY VITALITY IN THE EASTERN TOWNSHIPS OF QUEBEC
 MOBILITY AND MIGRATION THE CHALLENGE TO COMMUNITY VITALITY IN THE EASTERN TOWNSHIPS OF QUEBEC Jan Warnke Townshippers Association, special collaborator Abstract Upon noting that the -speaking population
CENSUS BULLETIN #5 Immigration and ethnocultural diversity Housing Aboriginal peoples
 CENSUS BULLETIN #5 Immigration and ethnocultural diversity Housing Aboriginal peoples October 25, 217 Bulletin Highlights: 86.1 per cent of the Brampton s 216 surveyed population held a Canadian citizenship
Thesis Advisor s Name: Trudi Bunting. Permission to put a copy as a sample Geog393 proposal: No
 A Comparison of Standard of Living Rates of First and Second Generation Chinese Immigrants in the Vancouver Census Metropolitan Area from a Spatial Perspective Thesis Advisor s Name: Trudi Bunting Permission
The wage gap between the public and the private sector among. Canadian-born and immigrant workers
 The wage gap between the public and the private sector among Canadian-born and immigrant workers By Kaiyu Zheng (Student No. 8169992) Major paper presented to the Department of Economics of the University
DIVERSITY IN SASKATCHEWAN
 DIVERSITY IN SASKATCHEWAN Prepared for the: Saskatchewan Cooperative Association January 2016 Doug Elliott Sask Trends Monitor 444 19th Avenue Regina, Saskatchewan S4N 1H1 306-522-5515 sasktrends@sasktel.net
Migration is a global phenomenon, one that includes adults, youth and children alike. And Australia is a country built on migration with almost 50%
 1 Migration is a global phenomenon, one that includes adults, youth and children alike. And Australia is a country built on migration with almost 50% of our population either a first-born or second-born
CANADIAN DATA SHEET CANADA TOTAL POPULATION:33,476,688 ABORIGINAL:1,400,685 POPULATION THE ABORIGINAL PEOPLE S SURVEY (APS) ABORIGINAL POPULATION 32%
 ABORIGINAL POPULATION 32%") CANADA TOTAL POPULATION:33,476,688 ABORIGINAL:1,400,685 THE ABORIGINAL PEOPLE S SURVEY (APS) The 2012 Aboriginal Peoples Survey (APS) is a national survey of First Nations, Métis and Inuit people living
CANADA TOTAL POPULATION:33,476,688 ABORIGINAL:1,400,685 THE ABORIGINAL PEOPLE S SURVEY (APS) The 2012 Aboriginal Peoples Survey (APS) is a national survey of First Nations, Métis and Inuit people living
NATIONAL HOUSEHOLD SURVEY: LABOUR FORCE, EMPLOYMENT, AND INCOME
 Clause No. 15 in Report No. 1 of was adopted, without amendment, by the Council of The Regional Municipality of York at its meeting held on January 23, 2014. 15 2011 NATIONAL HOUSEHOLD SURVEY: LABOUR FORCE,
Language Proficiency and Earnings of Non-Official Language. Mother Tongue Immigrants: The Case of Toronto, Montreal and Quebec City
 Language Proficiency and Earnings of Non-Official Language Mother Tongue Immigrants: The Case of Toronto, Montreal and Quebec City By Yinghua Song Student No. 6285600 Major paper presented to the department
A Profile of CANADiAN WoMeN. NorTHerN CoMMuNiTieS
 A Profile of CANADiAN WoMeN in rural, remote AND NorTHerN CoMMuNiTieS DeMogrAPHiC Profile in 2006, the last census year for which data are currently available, approximately 2.8 million women resided in
The Impact of Canadian Immigrant Selection Policy on Future Imbalances in Labour Force Supply by Broad Skill Levels
 The Impact of Canadian Immigrant Selection Policy on Future Imbalances in Labour Force Supply by Broad Skill Levels Alain Bélanger Population Change and Life Course Cluster Conference on Income, health,
Putting Numbers into Action: Aboriginal Data on the Statistics Canada Website
 Putting Numbers into Action: Aboriginal Data on the Statistics Canada Website Findings from the 2011 National Household Survey (NHS) Social and Aboriginal Statistics Division, Statistics Canada Outline
2011 National Opinion Poll: Canadian Views on Asia
 2011 National Opinion Poll: Canadian Views on Asia Table of Contents Methodology Key Findings Section 1: Canadians Mental Maps Section 2: Views of Canada-Asia Economic Relations Section 3: Perceptions
New Brunswick Population Snapshot
 New Brunswick Population Snapshot 1 Project Info Project Title POPULATION DYNAMICS FOR SMALL AREAS AND RURAL COMMUNITIES Principle Investigator Paul Peters, Departments of Sociology and Economics, University
Social Profile of Oakville An Overview
 Social Profile of Oakville An Overview Prepared by Community Development Halton Funding support provided by the United Way of Oakville 2004 Community Development Halton, all rights reserved. Copies of
BACKGROUNDER The Making of Citizens: A National Survey of Canadians
 BACKGROUNDER The Making of Citizens: A National Survey of Canadians Commissioned by The Pierre Elliott Trudeau Foundation in collaboration with Dalhousie University Purpose Prior to the eighth annual Pierre
how neighbourhoods are changing A Neighbourhood Change Typology for Eight Canadian Metropolitan Areas,
 how neighbourhoods are changing A Neighbourhood Change Typology for Eight Canadian Metropolitan Areas, 1981 2006 BY Robert Murdie, Richard Maaranen, And Jennifer Logan THE NEIGHBOURHOOD CHANGE RESEARCH
Chinese Immigration to Canada
 Chinese Immigration to Canada Lesson Overview: The purpose of this lesson is to encourage students to learn aspects about immigration to Canada. Students are asked to use Statistics Canada s website and
Article Aboriginal Population Profile for
 Component of Statistics Canada Catalogue no. 89-638-X o. 20000 2006 Aboriginal Population Profiles for Selected Cities and Communities: Article 2006 Aboriginal Population Profile for 20 How to obtain more
BACKGROUNDER The Common Good: Who Decides? A National Survey of Canadians
 BACKGROUNDER The Common Good: Who Decides? A National Survey of Canadians Commissioned by The Pierre Elliott Trudeau Foundation in collaboration with the University of Alberta Purpose: Prior to the ninth
A Social Profile of the Halton Visible Minority Population
 Halton Social Planning Council and Volunteer Centre A Social Profile of the Halton Visible Minority Population December 2000 Prepared by Ted Hildebrandt Senior Planner Lyn Apgar - Research Associate December
Rural Manitoba Profile:
 Rural Manitoba Profile: A Ten-year Census Analysis (1991 2001) Prepared by Jennifer de Peuter, MA and Marianne Sorensen, PhD of Tandem Social Research Consulting with contributions by Ray Bollman, Jean
Canada at 150 and the road ahead A view from Census 2016
 Canada at 150 and the road ahead A view from Census 2016 Dr. Doug Norris Senior Vice President and Chief Demographer 2017 Environics Analytics User Conference November 8, 2017 Canada continues to lead
City of Montréal HIGHLIGHTS. En 1996, the ville de Montréal had a population of 1,775,788.
 Socio-economic profile City of Montréal February 2002 HIGHLIGHTS En 1996, the ville de Montréal had a population of 1,775,788. Between 1991 and 1996, the population of Montréal increased by 0.01%. One-person
Community Social Profile Cambridge and North Dumfries
 Community Trends for 2013 in Cambridge, North Dumfries, Wellesley, Wilmot and Woolwich Community Social Profile - Cambridge and North Dumfries Published December 2014 Community Social Profile Cambridge
Understanding the Occupational Typology of Canada s Labour Force
 Understanding the Occupational Typology of Canada s Labour Force Author: Taylor Brydges, Taylor.Brydges@rotman.utoronto.ca p.416.946.7300 f.416.946.7606 Martin Prosperity Institute Joseph L. Rotman School
Rural Newfoundland and Labrador Profile: A Ten-year Census Analysis ( )
") Rural Newfoundland and Labrador Profile: A Ten-year Census Analysis (1991-2001) Prepared by Jennifer de Peuter, MA and Marianne Sorensen, PhD of Tandem Social Research Consulting with contributions by
Rural Newfoundland and Labrador Profile: A Ten-year Census Analysis (1991-2001) Prepared by Jennifer de Peuter, MA and Marianne Sorensen, PhD of Tandem Social Research Consulting with contributions by
PRINCE EDWARD ISLAND POPULATION REPORT 2017
 OVERVIEW PRINCE EDWARD ISLAND POPULATION REPORT 2017 DIAGRAM 1: PRINCE EDWARD ISLAND POPULATION, AS OF JULY 1, 1998-2017 155,000 150,000 145,000 140,000 135,000 130,000 On September 27, 2017 Statistics
Changing Faces Profile of Burlington Newcomers. November 2010
 Changing Faces Profile of Burlington Newcomers November 2010 2010 Community Development Halton, all rights reserved. Copies of this document may be reproduced non-commercially for the purpose of community
Immigrant Seniors in British Columbia
 Immigrant Seniors in British Columbia December 2010 Immigrant Seniors in British Columbia Most people who immigrate as seniors come to B.C. to reunite with their families. In fact, 86.2% of the 5,733 new
Guelph 3Ts Reference Report
 Guelph 3Ts Reference Report Benchmarking Project: Ontario Competes Ontario in the Creative Age April 2009 REF. 2009-BMONT-009 Contents Introduction... 3 Technology Results... 4 Talent Results... 5 Tolerance
Developing Immigrants Literacy and Essential Skills
 Developing Immigrants Literacy and Essential Skills Summary of the Background Report on British Columbia Presented by: M. Bassirou Diene, Employment specialist, Fédération des Francophones de la Colombie-Britannique
Immigration and Ethnocultural Diversity in Quebec
 Immigration and Ethnocultural Diversity in Quebec The National Household Survey (NHS) Regional analysis January 2014 Immigration and Ethnocultural Diversity in Canada was part of the first release of data
SSRL Evaluation and Impact Assessment Framework
 SSRL Evaluation and Impact Assessment Framework Taking the Pulse of Saskatchewan: Crime and Public Safety in Saskatchewan October 2012 ABOUT THE SSRL The Social Sciences Research Laboratories, or SSRL,
WORKFORCE ATTRACTION AS A DIMENSION OF REGIONAL COMPETITIVENESS
 RUR AL DE VELOPMENT INSTITUTE WORKFORCE ATTRACTION AS A DIMENSION OF REGIONAL COMPETITIVENESS An Analysis of Migration Across Labour Market Areas June 2017 WORKFORCE ATTRACTION AS A DIMENSION OF REGIONAL
Alberta Immigrant Highlights. Labour Force Statistics. Highest unemployment rate for landed immigrants 9.8% New immigrants
 2016 Labour Force Profiles in the Labour Force Immigrant Highlights Population Statistics Labour Force Statistics Third highest percentage of landed immigrants in the working age population 1. 34. ON 2.
Canadians Knowledge & Perception of the War of 1812 Final Report
 Canadians Knowledge & Perception of the War of 1812 Final Report TNS Canadian Facts, June 6, 2011 Submitted to: Department of Canadian Heritage 1 Contracting Details POR #: POR 071 10 Department of Canadian
The Impact of Interprovincial Migration on Aggregate Output and Labour Productivity in Canada,
 The Impact of Interprovincial Migration on Aggregate Output and Labour Productivity in Canada, 1987-26 Andrew Sharpe, Jean-Francois Arsenault, and Daniel Ershov 1 Centre for the Study of Living Standards
Rural Poverty in Canada. Robert Annis and Lonnie Patterson Rural Development Institute Brandon University
 Rural Poverty in Canada Robert Annis and Lonnie Patterson Rural Development Institute Brandon University Presentation Overview Poverty as a Human Rights Issue Poverty in Canada Poverty in Rural Canada
The literacy skills of New Brunswick francophones: Demographic and socioeconomic issues
 Catalogue no. 89-657-X2016001 ISSN 2371-5006 ISBN 978-0-660-06284-6 Ethnicity, Language and Immigration Thematic Series The literacy skills of New Brunswick francophones: Demographic and socioeconomic
TIEDI Labour Force Update September 2012
 The Toronto Immigrant Employment Data Initiative (TIEDI) s Labour Force Update aims to provide upto-date labour market data on immigrants. This monthly report relies on data from the Labour Force Survey
Disparities, Health Services Policies, and Minority Francophone Older Adults in Canada
 Disparities, Health Services Policies, and Minority Francophone Older Adults in Canada Hubert Tote Alimezelli University of Saskatchewan Background Compared to the majority, people from minority communities
FPT Action Plan for Increasing Francophone Immigration Outside of Quebec. March 2, 2018
 FPT Action Plan for Increasing Francophone Immigration Outside of Quebec March 2, 2018 Introduction 1 French-speaking immigrants contribute to the strength and prosperity of our country, while adding to
Youth Criminal Justice in Canada: A compendium of statistics
 Youth Criminal Justice in Canada: A compendium of statistics Research and Statistics Division and Policy Implementation Directorate Department of Justice Canada 216 Information contained in this publication
MONITORING THE METROS: A MUCH-AWAITED 2011 UPDATE
 THE METRO BEAT TD Economics MONITORING THE METROS: A MUCH-AWAITED 211 UPDATE The 211 National Household Survey release on May 8 th provides a demographic and diversity update across Canada. This is the
Acadian and Francophone Community Prince Edward Island Government Joint Working Group Report
 Acadian and Francophone Community Prince Edward Island Government Joint Working Group Report Acknowledgements The Acadian and Francophone Community Prince Edward Island Government Joint Working Group would