INTRODUCTION OF THE EURO IN THE MORE RECENTLY ACCEDED MEMBER STATES
|
|
|
- Georgina Harris
- 5 years ago
- Views:
Transcription


1 Eurobarometer INTRODUCTION OF THE EURO IN THE MORE RECENTLY ACCEDED MEMBER STATES REPORT Fieldwork: April 2013 Publication: June 2013 This survey has been requested by the European Commission, Directorate-General for Economic and Financial Affairs (DG ECFIN) and co-ordinated by Directorate-General for Communication. This document does not represent the point of view of the European Commission. The interpretations and opinions contained in it are solely those of the authors.
2 Eurobarometer Introduction of the euro in the more recently acceded Member States Conducted by TNS Political & Social at the request of the European Commission, Directorate-General for Economic and Financial Affairs (DG ECFIN) Survey co-ordinated by Directorate-General Communication
3 FLASH TABLE OF CONTENTS INTRODUCTION... 4 MAIN FINDINGS... 7 I. AWARENESS OF THE EURO Citizens awareness of the euro area and the euro s introduction Awareness of the current number of euro area countries Expected date of the euro s adoption Can new Member States choose whether or not to adopt the euro? Familiarity with the design of euro banknotes Familiarity with the design of euro coins Experience with euro cash Euro banknotes Euro coins Where do people use the euro? II. INFORMING CITIZENS ABOUT THE EURO Self-perceived level of information Timing, channels and content of information Timing for the receipt of information about the euro Trusted distributors of information on the euro Preferred channels for information campaign Most favoured topics of information campaigns Main activities and events essential to be included in an information campaign
4 FLASH III. THE EURO: PERCEPTIONS AND SUPPORT FOR ITS INTRODUCTION Consequences of the euro s introduction Consequences at a national level Personal consequences of the euro s introduction Support for the single currency Opinions within the respondents social environment The most desired timeframe for the adoption of the euro IV. CONSEQUENCES OF ADOPTING THE EURO The consequences in general Political and economic consequences of introducing the euro Will the changeover to the euro increase prices? Favourable political and economic consequences of the euro Practical consequences of the euro changeover Potential inconveniences of the introduction of the euro Concerns regarding abuses and cheating on prices during the changeover Changes due to the euro s introduction Effects on national identity due to the adoption of the euro Control over a nation s economic policy ANNEXES Technical specifications Questionnaire Tables 3
5 FLASH INTRODUCTION All EU Member States are to adopt the common currency, the euro, once they have fulfilled the criteria defined in the Maastricht Treaty on the Functioning of the European Union (with the exception of Denmark and the UK, which have a specific opt-out from these Treaty provisions). There is no common strategy or fixed timetable for the introduction of the euro in the Member States that joined in or after 2004, but the Treaty does require them to join the euro area at an undefined date in the future. Of the countries that joined the EU in or after 2004, Slovenia, Cyprus and Malta joined the euro area in 2007 and 2008; Slovakia followed in January 2009; and Estonia joined in January Before adopting the euro, a country must comply with the Maastricht criteria including membership of the Exchange Rate Mechanism II (ERM II) for a minimum of two years. Lithuania and Latvia are members of ERM II, while Poland, the Czech Republic, Hungary, Bulgaria and Romania have not yet joined it. It is also important to note that Latvia is currently taking active steps to introduce the euro in the near future. In January 2013, the Latvian parliament voted to seek entry into the single currency, and the government is aiming to adopt the euro formally in January However, the European Commission and the European Central Bank are still reviewing Latvia s application, and they are due to publish their views on whether the timing is right for the country s accession in June. The opinions of Latvian respondents have naturally been influenced by these developments. The European Commission keeps track of general opinions, levels of knowledge and familiarity with the single currency among citizens of the respective countries in view of the introduction of the euro in the Member States that joined the EU in 2004 or later. This survey is the fifteenth of its kind, following earlier Eurobarometer surveys in the period The objectives of this survey are identical to those of previous rounds: to identify and track citizens perceptions in the new Member States outside the euro area (the NMS7 ) regarding the future introduction of the common currency. The NMS7 refers collectively to Bulgaria, the Czech Republic, Hungary, Latvia, Lithuania, Poland and Romania. The main themes of this report are an examination of: levels of knowledge about and experience of the euro among citizens in the NMS7 citizens feelings about how well they have been informed and their preferred information channels NMS7 citizens perceptions of, and support for, the single currency their expectations about the adoption of the euro and the potential inconveniences they foresee. 4
6 FLASH This report sums up the main attitudes towards the euro in the NMS7 and describes the climate of opinion in each of the countries which are due to adopt the common currency at a future date. It should be noted that average perceptions might change because of the different composition of samples in comparison to previous rounds: Slovenia was dropped from the surveys in 2007, Malta and Cyprus in 2008 and Slovakia in Estonia was excluded as of May In addition, Bulgaria and Romania joined the surveys from autumn This questionnaire is comparable with those conducted previously for some questions, although several have been amended and some new questions have been added (though there are no new questions in the latest wave). ************** The Eurobarometer web site can be consulted at the following address: We would like to take the opportunity to thank all the respondents across the continent who have given of their time to take part in this survey. Without their active participation, this study would simply not have been possible. 5
7 FLASH This survey was carried out by TNS Political & Social network in the new seven Member States that joined the European Union in the recent years and have not yet adopted the euro (the NMS7 ) between 22 and 24 April Some 7,014 respondents from different social and demographic groups were interviewed face-to-face at home in their mother tongue on behalf of Directorate-General Economic and Financial Affairs (DG ECFIN). The methodology used is that of Eurobarometer surveys as carried out by the Directorate-General for Communication ( Research and Speechwriting Unit) 1.. A technical note on the manner in which interviews were conducted by the Institutes within the TNS Political & Social network is appended as an annex to this report. Also included are the interview methods and confidence intervals 2. Note ABREVIATIONS NMS7 BG CZ LV LT HU PL RO The seven Member States that joined the European Union in the recent years and have not yet adopted the euro (2004 and 2007) Bulgaria Czech Republic Latvia Lithuania Hungary Poland Romania The results tables are included in the annex. It should be noted that the total of the percentages in the tables of this report may exceed 100% when the respondent has the possibility of giving several answers to the question. 6
8 FLASH MAIN FINDINGS Awareness of the euro When asked about the number of Member States already in the euro area, 29% respondents know the correct answer: 17 countries. The number of respondents able to state the correct number of euro zone countries ranges from 36% in Hungary to 25% in Romania. A majority of NMS7 respondents (53%) expect their country to join the euro by 2019, down from 59% who thought this a year earlier. 78% think their country will join at some point in the future. The proportion of respondents who think their country will join the euro area at some point in the future ranges from 93% in Latvia to 70% in the Czech Republic. 78% of people in Latvia think their country will join the euro in % of respondents wrongly believe that their nation has a choice as to whether it can adopt the euro, while only 24% of respondents know that their country has no choice in this regard. While 33% of people in Latvia know that their country is committed to euro entry, only 21% do so both in Poland and the Czech Republic. As in previous waves of the survey, in most NMS7 countries citizens are more familiar with euro banknotes than euro coins: o While 53% of people know that euro banknotes have the same design in all euro area countries, only 35% correctly say that euro coins have partly different designs from country to country. o 90% of respondents have seen euro banknotes and 85% have seen euro coins; of these, 66% have already used the banknotes and 59% have used euro coins Half (50%) of the respondents say they have only used euro banknotes abroad, while half (50%) have used them domestically. 7
9 FLASH Informing citizens about the euro A majority (57%) of respondents do not feel well informed about the euro. Only 41% feel well informed. Latvia is the only NMS7 country in which more respondents feel well informed about the euro than the contrary: 50% say they are well informed, while 48% say they are not. In the other six countries, a majority of respondents say they are not well informed. Among respondents who do not feel well informed about the euro, a majority would like to receive information about the introduction of the euro well in advance of the changeover: 60% would like to receive information either as soon as possible or a few years ahead of time. The proportion of respondents who would like to be informed as soon as possible ranges from 34% in Poland to 17% in Hungary. Three quarters of respondents (75%) say they would trust information regarding the euro and issues related to the changeover provided by their national central bank. A majority (56%) also information from European institutions. Less than half of respondents would trust information about the euro changeover from governments, and national or regional authorities (46%), tax and fiscal administrations (42%), consumer associations (41%), commercial banks (38%), trade unions (30%), and journalists (28%). Television is the preferred channel for information about the introduction of the euro (selected by 72% of respondents). It is followed by the internet (58%), banks (48%), the radio (46%), and newspapers and magazines (45%). In terms of which pieces of information are essential in preparation for the changeover, knowing the value of one euro in their country s currency is considered the most important feature of the information campaign (by 76% of respondents), followed by the way the euro will be introduced (73%) and the social, economic or political implications of the euro (72%). When considering the various campaign activities that might be pursued as part of the euro handover, most respondents (71%) think that the dual display of prices in shops is essential. The dual display of the amounts on bills is seen as the second most important activity (67%). 8
10 FLASH The euro: perceptions and support for its introduction More respondents in the NMS7 think that the euro will have negative consequences for their country (54%) than think it will have positive consequences (39%). Opinions on this point have not changed since Romania is the only NMS7 country in which a higher proportion of respondents think the introduction of the euro would have positive consequences for their country, by 51% to 42%. People in the Czech Republic are the most likely to think that introduction of the euro would have negative consequences: 72% say this, with only 23% saying it would be positive. Half (50%) of all respondents think the personal consequences of introducing the euro will be negative, while 39% think they will be positive. Romania (55% vs. 35%) and Hungary (44% vs. 41%) are the only countries where a higher proportion of respondents think the introduction of the euro will have positive consequences for them personally. People in the Czech Republic are the most likely to think that the introduction of the euro would have negative consequences for them personally (65% vs. 25%). A majority of NMS7 respondents are against joining the euro, by a margin of 51% to 45%. However, a majority of respondents are in favour of introducing the euro in three countries: Romania (67% vs. 28%), Hungary (54% vs. 41%), and Bulgaria (52% vs. 43%). Opposition is highest in the Czech Republic, where 80% are against joining the euro, and only 14% are in favour. 45% of respondents want the euro to be introduced as late as possible, while 34% want to join after a certain time, and 17% want to join as soon as possible. 9
11 FLASH Consequences of adopting the euro A majority of respondents believe that the switch to the euro has had positive consequences in the countries that are already using it, by a margin of 46% to 43%. There has been no change on this point since In five countries a majority of respondents think that the euro has had positive consequences in those countries that are already using it - the exceptions being the Czech Republic and Poland. Two thirds of respondents (67%) think the changeover to the euro will increase prices, while only 22% think it will help keep prices stable. A majority of respondents in all seven countries think that introducing the euro will increase prices, ranging from 78% in Lithuania to 50% in Romania. When asked about the political and economic consequences of joining the euro, 46% of respondents think that introducing the euro will make them feel more European than they do now, and reinforce the place of Europe in the world. When asked about the practical consequences of joining the euro, 82% of people think that it will be more convenient for those who travel in other countries that use the euro, and over two thirds (68%) think it will be easier to shop in other countries that use the euro. But only 30% of respondents think that introducing the euro will protect their country from international crises. In all seven countries, most respondents say that joining the euro will make it more convenient for those who travel in other countries that use the euro, ranging from 86% in Latvia to 76% in Hungary. A majority (74%) of respondents are concerned about abusive price setting during the changeover. The proportion of respondents expressing concern about abusive price setting ranges from 81% in Latvia to 66% in Hungary and Romania. Nearly half of the respondents (46%) feel that replacing their national currency will cause them a lot of personal inconvenience. The level of agreement on this point ranges from 52% in the Czech Republic to 41% in Hungary and Romania. 48% of respondents believe that adopting the euro will mean that their country will lose a part of its identity. The proportion of respondents expressing this view ranges from 75% in Latvia to 38% in Hungary. Finally, 43% of respondents say that adopting the euro will mean that their country will lose control over its economic policy. The proportion of respondents who express this fear ranges from 63% in Latvia to 36% in Hungary. 10
12 FLASH I. AWARENESS OF THE EURO 1. CITIZENS AWARENESS OF THE EURO AREA AND THE EURO S INTRODUCTION 1.1. Awareness of the current number of euro area countries - Nearly three out of 10 of respondents say correctly that there are 17 euroarea countries - When asked how many EU countries have already introduced the euro, nearly three out of 10 NMS7 respondents (29%) say correctly that 17 have done so 3. The same number of people gave this response in the previous wave of the survey (April 2012). The proportion of respondents answering this question correctly peaked at 32% in September A majority of respondents give an incorrect answer: 39% think that there are 13 euro countries (up slightly from 38% in 2012); 12% think there are six (down from 14%), and 5% think there are 27 (down from 6%). There has been an increase in the proportion of respondents answering don t know : 15% say this now, compared with 13% in This reverses a series of declines in the number of respondents answering don t know, which peaked at 26% in September Q5a: According to you, how many EU countries have already introduced the euro? 27; 17; 13; 6; don t know. 4 In 2010, eight Member States were included in the survey, and at that time 16 countries had joined the euro. 11
, with a small increase also occurring in Latvia (34%, +1).")
13 FLASH The number of respondents who are able to state the correct number of euro zone countries ranges from 36% in Hungary to 25% in Romania. The proportion of people giving this answer increased noticeably in Hungary (36%, +5), with a small increase also occurring in Latvia (34%, +1). There was no change in Bulgaria (29%) or Romania (25%), while there were declines in the number of people able to identify the number of euro zone states in the three remaining NMS7 countries: the Czech Republic (32%, -4), Lithuania (31%, -2), and Poland (28%, -1). 12

14 FLASH The socio-demographic data shows that: Men are more likely than women to say that 17 EU countries have already introduced the euro, by a margin of 35% to 22%. While 33% of respondents aged 55 and over rightly say that 17 Member States have introduced the euro, only 25% of people aged are able to do so. Respondents who spent longer in education are more likely to say there are 17 countries in the euro area: 32% who left education aged 20 or over answer correctly, compared with 23% of those who left aged 15 or below. Nearly a third of respondents (32%) who live in large towns rightly say that 17 Member States have introduced the euro, compared with a quarter (26%) of those who live in rural villages. In terms of respondents occupations, 36% of self-employed people answer this question correctly, whereas only 24% of manual workers do so. While 35% of respondents who consider themselves to be well-informed about the euro correctly say that 17 Member States are in the euro area, only 25% of those who say they are not well-informed give the right answer. 13
15 FLASH 1.2. Expected date of the euro s adoption - Just over half of all NMS7 respondents expect their country to introduce the euro by After being asked to identify the number of countries that currently use the euro, all respondents were then asked when they think the euro will be introduced 5. Over three quarters of respondents (78%) think that the euro will be introduced at some point, either in a specific year or later than 2019, down slightly on the 79% who thought this in A majority (53%) think that the euro will be introduced in or before 2019; 59% of people took this view in A quarter of respondents (25%, +5 compared with 2012) predict that the euro will be adopted later than Among respondents who name a specific year, virtually no respondents (0%, -3) think the euro will be introduced in 2013; 5% (-5) select 2014; 15% (-6) select 2015; 11% (+2) select 2016; 8% (-3) select 2017; 13% (+9) select 2018; and 1% (+1) think the euro will be introduced in These results show a general shift away from predictions of early adoption: in 2012, 34% of respondents expected the euro to be introduced by 2015; now, only 20% do so. In contrast, 39% of people now envisage adoption in 2018 or later, as opposed to 24% who did so in Only a tenth (9%, +1) of people think that the euro will never be introduced, while 13% (no change) don t know when it will be introduced. 5 Q5c: When/in which year do you think the euro will be introduced in [COUNTRY]? 14

16 FLASH In Bulgaria, 72% of respondents expect the euro to be introduced at some point in the future (-5 compared with 2012), and 50% (-14) think it will be introduced by There has been a big shift away from the expectation of early adoption, with 21% of respondents anticipating euro accession by 2015, compared with 48% who expected this in More people in Bulgaria (22%, +9) now expect their country to join the euro later than 2019, though very few (7%, +3) think their country will never join. Around a fifth of respondents (21%, +2) don t know when Bulgaria will introduce the euro. Seven out of 10 respondents in the Czech Republic (70%) think their country will join the euro at some point in the future, which is up substantially on the 61% who thought this in However, only 10% (-7) think their country will introduce the euro by More respondents think their country will join later (22%, -6), while fewer think it will never join (18%, -8). One person in eight (12%, -3) does not know when euro introduction will take place. 15
17 FLASH The results from Latvia are significantly influenced by the recent decision of the Latvian parliament to press ahead with euro adoption in early As a result of this, it is unsurprising to find that 78% of Latvians (+41) anticipate euro accession in that year. A minority (13%) of respondents still think adoption will come in 2016 or later, but only 2% think Latvia will never join, while 5% don t know when the euro will be introduced. In Lithuania, 86% of respondents think that their country will introduce the euro at some point in the future, which is an increase on the 82% of people who said this in Over three quarters of respondents (77%, +8) think their country will join the euro by There has also been an increase in the number of people expecting near-term entry: 49% think Lithuania will introduce the euro by 2015, up from 42% who thought this in the previous survey. Only 9% (-4) think the country will join later than 2019, while 3% (-3) say that Lithuania will never join, and 11% (-1) don t know when this will happen. While 77% of people in Hungary think their country will join the euro at some point in the future (+1 compared with 2012), only 44% (-1) expect accession to occur by A third (33%, +1) say that Hungary will join later, and only 13% (-8) anticipate euro entry by A tenth of respondents (9%, no change) think that Hungary will never join the euro, while 14% (no change) don t know when it will join. In Poland, 79% of respondents anticipate euro entry at some point in the future, though this is down on the 84% who thought this in A majority (56%) of people think Poland will join by 2019, down from 65% who said this a year earlier. There has also been a fall in the number of people who expect Poland to join by 2015: 19% expect this to happen, compared with 33% in the previous survey. Nearly a quarter of respondents (23%, +4) think Poland will join after 2019, while 10% (+4) think that it will never join. A tenth of respondents (11%, +1) don t when the country will introduce the euro. Finally, 80% of respondents in Romania think that their country will join the euro at some point, down slightly on the 83% who felt this way in However, only 47% of respondents think that their country will join the euro by 2019, compared with 60% who thought this would happen a year earlier. Far fewer respondents now expect euro entry by 2015: 19% do so, as opposed to 42% during the 2012 survey. There has been a substantial increase in the number of people who think Romania will join after 2019 (33%, +10), though only 4% (+1) think the country will never join the euro. A further 16% (+2) of respondents don t know when Romania will introduce the currency. There are relatively few socio-demographic variations on this question. However, it is noticeable that people who expect the euro to have positive consequences, or who are in favour of introducing the currency, are more likely to anticipate euro entry within the next few years, whereas those who envisage negative consequences or who are against its introduction, are more likely to think that their country will never join the euro, or to say that they don t know when the currency will be introduced. 16
 think incorrectly that their country can")
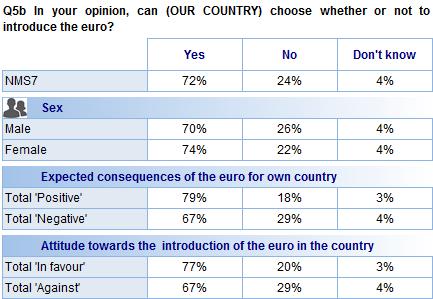
18 FLASH 1.3 Can new Member States choose whether or not to adopt the euro? - Less than a quarter of respondents are aware that their country is already committed to joining the euro - Over seven out of 10 NMS7 respondents (72%) think incorrectly that their country can choose whether or not to adopt the euro 6. This is a slight increase on the 71% who said this in 2012, and is also the highest proportion of respondents ever to have given this answer in the history of the survey. The number of people answering yes to this question has now gone up in each of the last four waves of the survey, from 60% in September Just under a quarter of respondents (24%) correctly say that their country cannot choose. Awareness that EU Member States are obliged to join the euro is highest in Latvia, where 33% of people say that their country has no option but to join. It is lowest in Poland and the Czech Republic (both 21%). Since 2012, Latvia (33%, +2), Romania (26%, +2) and Bulgaria (28%, +1) have recorded minor increases in the number of 6 Q5b: Can [COUNTRY] choose whether or not to introduce the euro? Yes; no; don t know. 17
 and Lithuania (23%, - 6).")
19 FLASH people saying that their country has no choice about whether to introduce the euro. Poland and the Czech Republic were unchanged. But there were substantial declines in the number of people answering correctly in Hungary (32%, -9) and Lithuania (23%, - 6). Socio-demographic analysis shows that: Men (26%) are slightly more likely to answer correctly than women (22%). Respondents who say that the consequences of the euro in countries already using it are positive (91%) are less likely to say their country has a choice about whether to join than those who say they consequences are negative (31%). Similarly, only 18% of respondents who expect the consequences of the euro for their own country to be positive answer correctly, compared with 29% of those who expect the consequences to be negative. Those in favour of joining the euro (20%) are less likely to know that their country has no choice about whether to join than those not in favour (29%). 18
20 FLASH 19
 of respondents think that euro banknotes")
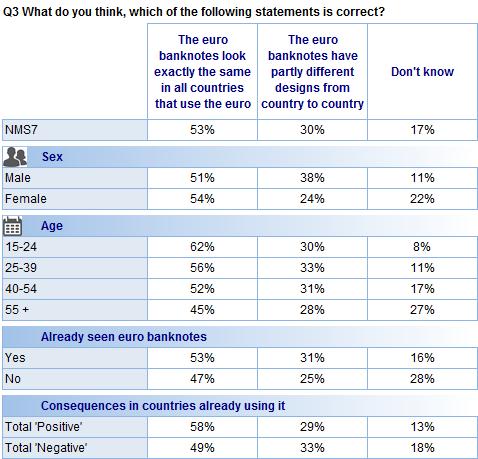
21 FLASH 1.3. Familiarity with the design of euro banknotes - A majority of respondents are aware that banknotes look the same throughout the euro zone - A majority (53%) of respondents think that euro banknotes look exactly the same in all countries that use the single currency 7. This is an increase on the 51% of people who said this in 2012, and marks the highest number of respondents who have answered this question correctly since September Just three out of 10 respondents (30%) think euro banknotes have partly different designs from country to country, while 17% don t know whether the designs vary. A majority of respondents in Romania (72%), Lithuania (56%), Bulgaria (53%), and the Czech Republic (51%) know that euro banknotes look the same throughout the euro zone. However, fewer of the respondents are aware of this in Hungary (46%), Poland (44%) and Latvia (42%). 7 Q3: And what do you think, which of the following statements is correct? The euro banknotes look exactly the same in all countries that use the euro/have partly different designs from country to country. 20
 and Hungary (-3).")
22 FLASH Compared with 2012, awareness that banknotes look the same across the euro zone increased in four countries: Lithuania (+5), Bulgaria (+3), Poland (+2) and in Romania (+1). There was no change in the Czech Republic, while awareness on this issue declined in Latvia (-5) and Hungary (-3). According to the socio-demographic data: Women are slightly more likely than men to know that euro banknotes look the same in all countries, by a margin of 54% to 51%. Younger respondents are the most likely to be aware that euro banknotes look the same in all countries: 62% of year-olds know this, compared with just 45% of people aged over 55. A majority (53%) of people who have already seen euro banknotes are aware that they look the same in all countries, compared with 47% of those who have not seen them before. While 58% of people who think the consequences of the euro in countries already using it have been positive know that euro banknotes always look the same in, only 49% of individuals who think the consequences of the euro have been negative are aware of this fact. 21
23 FLASH 22

24 FLASH 1.4. Familiarity with the design of euro coins - Most respondents are unaware that euro coins look different from country to country - As found consistently by previous surveys, respondents demonstrate less awareness about the appearance of euro coins than about euro banknotes 8. Just over a third (35%) of NMS7 respondents know that euro coins have partly different designs from country to country, compared with 53% who know that euro banknotes look the same. This result has not changed since Just under half (47%) of NMS7 respondents think that euro coins look exactly the same in all countries that use the euro (no change since 2012). Just under a fifth say they don t know (18%, no change). 8 Q4: And what do you think, which of the following statements is correct? The euro coins look exactly the same in all countries that use the euro/have partly different designs from country to country. 23
. Since 2012, awareness that euro coins have varying designs has risen substantially in Latvia (56%, +11) and Hungary (47%, +6).")
25 FLASH Awareness that euro coins differ in design from country to country ranges from 56% in Latvia to 16% in Romania, where familiarity with euro coins is lowest by a considerable margin (as in previous surveys). Since 2012, awareness that euro coins have varying designs has risen substantially in Latvia (56%, +11) and Hungary (47%, +6). But in the other five countries there was a decline in the number of people answering correctly: Bulgaria (32%, -3), the Czech Republic (43%, -2), Poland (38%, -2), Lithuania (38%, -1), and Romania (16%, -1). As the graph below shows, respondents in most countries are more familiar with euro banknotes than with euro coins, with two exceptions: Latvia and, to a lesser extent, Hungary. Romania stands out among the seven countries, since respondents there demonstrate a very high level of familiarity with euro banknotes combined with a very low awareness of euro coins. 24
26 FLASH The socio-demographic data show that: Men (43%) are more likely than women (27%) to know that euro coins have partly different designs from country to country. Respondents aged (40%) are the most likely to know that euro coins have partly different designs from country to country, while those aged 55 and over (29%) are the least likely. Whereas 40% of respondents who finished their education aged 20 and over answer this question correctly, compared with 26% of those who left school aged 15 or under. 43% of self-employed people know that euro coins have partly different designs from country to country, but only 30% of people who are not working are aware of this. While 48% of people who have seen euro coins are aware that they have differing designs, just 40% of those who have not seen them before know about this. 41% of respondents who have used euro coins know that they have varying designs, compared with 26% of people who have not used them before. 25

27 FLASH Four out of 10 people (41%) who say they are informed about the euro know that euro coins have partly different designs from country to country, versus 30% of people who say they are not informed. 26
 say that they have seen euro")
28 FLASH 2. EXPERIENCE WITH EURO CASH 2.1. Euro banknotes -The proportion of respondents who have seen and used euro banknotes and coins has remained unchanged since Nine out of ten NMS7 respondents (90%) say that they have seen euro banknotes 9, and two-thirds (66%) say that they have used them 10. Since 2012, the proportion of respondents who have seen and used euro banknotes has remained relatively unchanged. The number of respondents who have seen euro banknotes has slightly increased (+1), whilst the proportion of respondents who have used them has not changed. Both results continue a long-term trend of increases in the number of people who have seen and used euro banknotes. The proportion of respondents who have seen euro banknotes ranges from 94% in Romania and the Czech Republic, to 83% in Hungary and Latvia. There has been very little change since 2012 on this issue, with the exception of Bulgaria, where there was 9 Q1.1: Have you already seen euro banknotes? Yes; no; don t know. 10 Q2a.1: Have you already used euro banknotes? Yes; no; don t know. 27

29 FLASH a noticeable increase (+5) in the number of respondents who have seen euro banknotes. The proportion of respondents who have used euro banknotes ranges from 77% in the Czech Republic and 76% in Romania, to 58% in Hungary. On this question, Lithuania (55%,-1) and Romania (76%, -1) were the only countries to record a decrease in the proportion of people who have used euro bank notes. Latvia (62%, +4), Hungary (58%, +3), Bulgaria (63%, +2) and the Czech Republic (77%, +1) recorded an increase. Poland was the only country where the results remained stable with the previous wave. The socio-demographic data show that: Men are more likely than women to have seen euro banknotes, by 93% to 88%, and also to have used them, by 77% to 70%. Respondents who are 55 or over are the least likely to have seen or used euro banknotes. Only 62% have used them, compared with 84% of year-olds. People who spent more time in formal education are more likely to have seen and used euro banknotes. While 79% of respondents who left education aged 20 or over have used them, only 52% of those who left at 15 or under have done so. Respondents who live in large towns are more likely to have seen and used euro banknotes than those who live in rural villages: 77% of urban respondents have used euro banknotes, versus 69% of people who live in villages. 28

30 FLASH Respondents who say they are informed about the euro are more likely to say that they have seen and used euro banknotes. For example, while 80% of those who say they are informed have used euro banknotes, only 68% of people who are uninformed have used them. 29

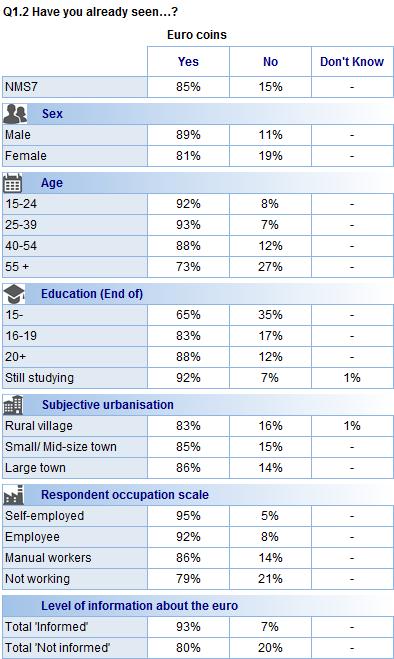
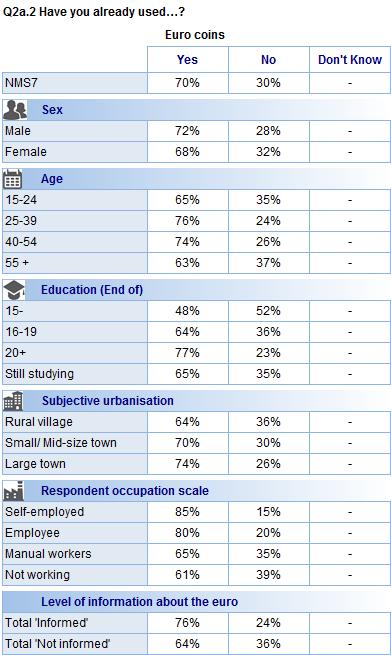
31 FLASH 2.2. Euro coins - The number of respondents who have used euro coins has continued to increase since Somewhat fewer NMS7 respondents have seen 11 or used 12 euro coins than have seen or used euro banknotes. Over eight out of ten (85%) respondents say they have seen euro coins (vs. 90% who have seen banknotes), up slightly (+1) compared with Nearly six out of 10 respondents (59%) say that they have used euro coins (vs. 66% who have used banknotes). This change from 2012 is minimal with only an increase of 1% but the trend continues to increase from the 41% recorded in The number of respondents who have seen euro coins ranges from 92% in the Czech Republic to 76% in Latvia. The proportion who have seen them has remained more or less unchanged in most NMS7 countries, with the exception of Lithuania (79%, +4) and Bulgaria (81%, +2). Similarly, an increase in the number of respondents who have used euro coins was witnessed in the majority of the NMS7. In fact, all countries except Lithuania increased 11 Q1.2: Have you already seen euro coins? Yes; no; don t know. 12 Q2a.2: Have you already used euro coins? Yes; no; don t know. 30

32 FLASH with the largest increments witnessed in Latvia (53%, +6) and Hungary (57%, +4). Lithuania experienced a decrease of 3 percentage points, where a majority of respondents continue to say that they have not used euro coins, or don t know if they have. Analysis of the socio-demographic data shows that: Men are more likely than women to have seen euro coins, by a margin of 89% to 81%, and also to have used them, by 72% to 68%. Respondents who are 55 or over are the least likely to have seen or used euro coins. Only 73% have seen them, compared with 88-92% of people in the three younger age groups. People aged 55 and over (63%) and aged (65%) are less likely to have used euro coins that those aged (74-76%). While 77% of respondents who left education at 20 or have used euro coins, only 48% of those who left at 15 or under have done so. Respondents who live in large towns (74%) are more likely to have used euro coins than their counterparts who live in rural villages (64%). Self-employed people (85%) and employees (80%) are more likely to have used euro coins than manual workers (65%) or those who are not in work (61%). 76% of people who say they are informed about the euro have used euro coins, compared with 64% of people who do not feel informed. 31
33 FLASH 32

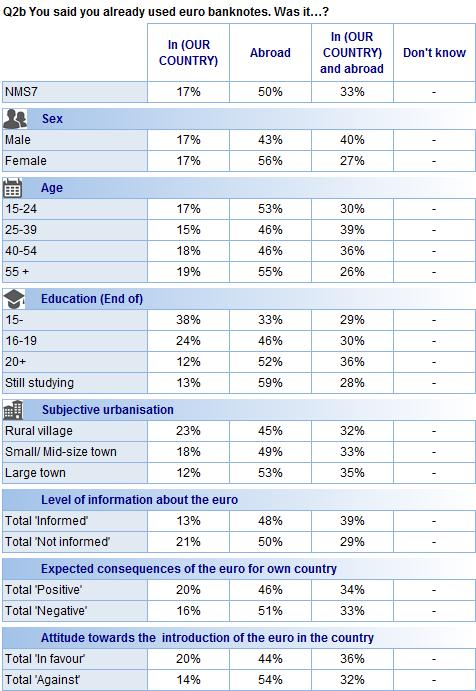
34 FLASH 2.3. Where do people use the euro? - Half of the respondents who have used euro banknotes have done so in their own country - This question applies only to respondents who say that they have used euro banknotes 13 and/or coins 14. Half (50%) of the people in this group say they have only used euro banknotes abroad, which is the same as the number of respondents who said this in A third (33%) say that they have used them in their own country and abroad (+2), and 17% say they have used them in their own country only (-2). This means that overall 50% of respondents have used euro banknotes in their country. Two thirds (65%) of respondents say they have used euro coins abroad, down slightly on the 67% who said this in A quarter (25%, +3) of respondents say that they have used them in their own country and abroad, and 10% (-1) say they have used them in their own country only. Overall, 36% of people who have used euro coins have done so in their own country. In Romania (81% vs. 19%) and Bulgaria (58% vs. 42%) more respondents have used euro banknotes domestically than have only used them abroad. But in the other five countries, a majority of respondents have only used euro banknotes abroad. The gap between the proportion of people who say they have only used euro banknotes abroad and who say they have used them in their own country is widest in the 13 Q2b: You said you already used euro banknotes. Was it: in (OUR COUNTRY); abroad; in (OUR COUNTRY) and abroad; don t know/no answer. 14 Q2c: You said you already used euro coins. Was it: in (OUR COUNTRY); abroad; in (OUR COUNTRY) and abroad; don t know/no answer. 33
, Romania (+3), and Lithuania (+1), but it declined in Hungary (-4), Bulgaria (-2), the Czech")
35 FLASH Czech Republic (74% vs. 26%), followed by Hungary (64% vs. 36%), Latvia (64% vs. 36%), Lithuania (61% vs. 39%), and Poland (59% vs. 41%). The number of people saying they used euro banknotes abroad only has increased since 2012 in Latvia (+3), Romania (+3), and Lithuania (+1), but it declined in Hungary (-4), Bulgaria (-2), the Czech Republic (-2) and Poland (-2). Romania (53% vs. 47%) is the only NMS7 country in which more respondents have used euro coins domestically than have only used them abroad. Elsewhere, a majority of respondents have only used them abroad: Latvia (85% vs. 15%), the Czech Republic (81% vs. 19%), Lithuania (76% vs. 24%), Poland (68% vs. 32%), Hungary (65% vs. 34%) and Bulgaria (64% vs. 36%). The proportion of people saying they only used euro coins abroad increased in Romania (+4), but declined in Hungary (-5) and Poland (-5). In the other four countries it was more or less unchanged. 34
. Respondents aged 55 and over (55%) and 15-24 (53%) are more likely to have only used euro banknotes abroad than 25-54 year-olds (46%).")
36 FLASH According to the socio-demographic data: Women are more likely than men to have only used euro banknotes abroad (by a margin of 56% to 43%) and also to have only used euro coins abroad (by a margin of 71% to 59%). Respondents aged 55 and over (55%) and (53%) are more likely to have only used euro banknotes abroad than year-olds (46%). A majority (52%) of respondents who finished their education aged 20 or over have only used euro banknotes abroad, compared with a only third (33%) of those who left school aged 15 or under. People who live in large towns are the most likely to say they have only used euro banknotes (53%) and coins (69%) abroad, while those who live in rural villages (45% and 59%) are the least likely to say this. Individuals who consider themselves to be informed about the euro are more likely to have used euro banknotes both at home and abroad than those who do not consider themselves informed, by a margin of 39% to 29%. However, people who say they are uninformed are more likely to have used euro banknotes only in their own country (21% vs. 13%). People who expect the introduction of the euro to have negative consequences (51%) are more likely to have only used the euro abroad than those who anticipate positive consequences (46%). 54% of people who are against the introduction of the euro have only used euro banknotes abroad, compared with 44% of those who are in favour of its introduction. 35
37 FLASH 36
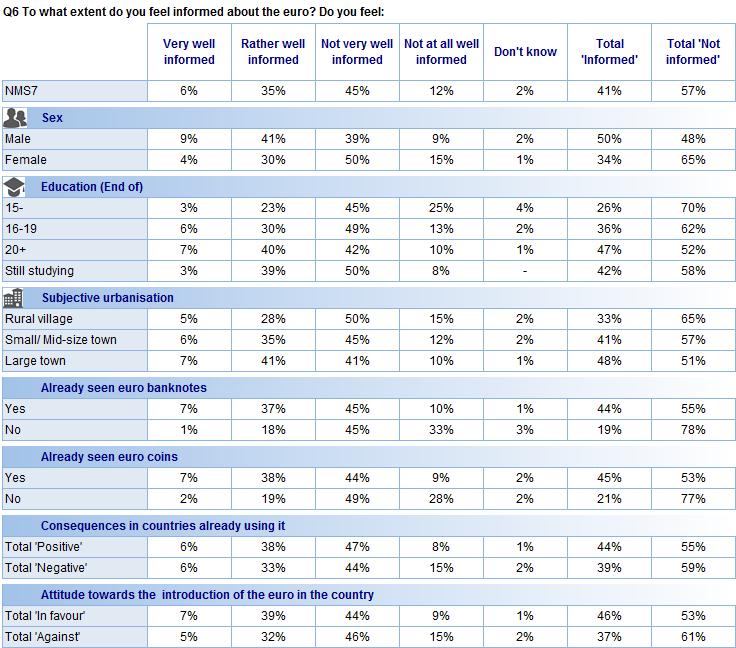
 do not feel well informed about the euro: 45% say they")
38 FLASH II. INFORMING CITIZENS ABOUT THE EURO 1. SELF-PERCEIVED LEVEL OF INFORMATION - A majority of respondents do not feel well informed about the euro - A majority of NMS7 respondents (57%) do not feel well informed about the euro: 45% say they are not very well informed, and 12% say they are not at all well informed 15. This is a decline compared with 2012, when 59% of respondents said they were not well informed. Overall, 41% of respondents consider themselves to be well informed, up from 39% in Over a third (35%) say they are rather well informed, and 6% say they are very well-informed. For the first time over the lifetime of the survey, Latvia is the only country in which more respondents feel well informed about the euro than feel not well informed, by a margin of 50% to 48%). This is a big turnaround: in 2012, 60% of people in Latvia felt they were not well informed, and only 39% felt well informed. Previously, a majority of people in the Czech Republic felt well informed, but this situation has now reversed: 50% say they are not well informed, whereas 48% feel well informed. 15 Q6: To what extent do you feel informed about the euro? Do you feel: very well informed; rather well informed; not very well informed; not at all well informed; don t know/no answer. 37
 and Poland (55% vs. 43%). Since 2012, the number of respondents who say they are well informed about the euro has increased in Latvia (+11), Poland (+4), Lithuania (+3) and Romania (+3).")
39 FLASH In the other five countries, a majority of respondents say they are not well informed: Romania (62% vs. 37%), Bulgaria (60% vs. 38%), Hungary (60% vs. 38%), Lithuania (56% vs. 41%) and Poland (55% vs. 43%). Since 2012, the number of respondents who say they are well informed about the euro has increased in Latvia (+11), Poland (+4), Lithuania (+3) and Romania (+3). However, there were declines in the Czech Republic (-3), Bulgaria (-2) and Hungary (-1). The socio-demographic data show that: Men are much more likely than women to feel well informed about the euro, by a margin of 50% to 34%. People who spent longer time in education are more likely to feel well informed: 47% of respondents who left education aged 20 or over feel well informed, as opposed to just 26% of those who left at age 15 or under. 48% of people who live in large towns feel informed about the euro, whereas only 33% of those who live in rural villages do so. A majority (52%) of self-employed people feel well informed about the euro, but only 37% of people who are not working say they are well informed. Those who have already seen and used euro banknotes and coins are much more likely to feel well informed about the currency. Respondents who think the consequences of the euro will be positive (44%) are more likely to say that they are well informed than those who think it will have negative consequences (39%). People in favour of introducing the euro are more likely to say they are informed than those who are against it, by a margin of 46% to 37%. 38
40 FLASH 39

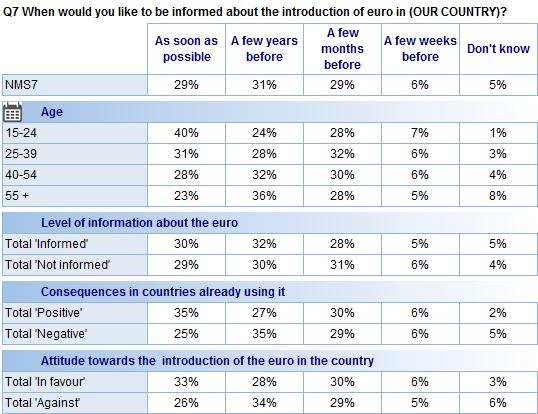
41 FLASH 2. TIMING, CHANNELS AND CONTENT OF INFORMATION 2.1. Timing for the receipt of information about the euro - Most people who do not feel well informed about the euro would like to be informed about its introduction well in advance - Respondents who said previously that they did not feel well informed about the euro were then asked when they would like to receive information about the introduction of the euro in their country 16. Almost all respondents say that they would like to receive some information in advance. About three out of 10 people (29%, +1 compared with 2012) would like to receive information as soon as possible. A similar number of respondents (31%, -3) would like to receive information a few years before the euro s introduction. And 29% of respondents (+1) would like to receive some information a few months beforehand. A small minority (6%, no change) would like to receive information only a few weeks beforehand. The number of respondents who would like to receive some information as soon as possible ranges from 34% in Poland and 33% in Latvia, to 17% in Hungary and 21% in Bulgaria. Those saying they would like to receive information a few years before ranges from 36% in Lithuania to 18% in Latvia. 16 Q7: When would you like to be informed about the introduction of the euro in [COUNTRY]? As soon as possible; a few years before; a few months before; a few weeks before; don t know/no answer 40
 are the most likely to say that they would like to receive information a few months before, while those in Lithuania (23%) are the least likely to say this.")
42 FLASH Taking these two answers together, the number of respondents who would like to receive some information either as soon as possible or at least a few years in advance ranges from 64% in Poland to 47% in Hungary. People in Hungary (40%) are the most likely to say that they would like to receive information a few months before, while those in Lithuania (23%) are the least likely to say this. Respondents in Romania (9%) are also the most likely to say they would like to receive information a few weeks before the introduction of the euro; only 3% of people in Poland saying this. As in the previous wave of the survey, Hungary is the only country in which a majority of respondents (48%) say they would prefer to receive information about the euro only months or weeks in advance. In the other six countries, most people want the information to be provided years in advance or as soon as possible. The number of respondents who say that they would like to receive information as soon as possible increased in six out of the seven countries: Latvia (33%, +8), the Czech Republic (24%, +7), Lithuania (25%, +4), Romania (32%, +2) and Hungary (17%, +1). Poland did not experience an evolution (34%) and only Bulgaria (21%, -5) registered a decline compared with
43 FLASH According to the socio-demographic data 17 : Respondents in the age group (40%) are the most likely to want to receive information as soon as possible, while those in the 55-and-over category (23%) are the least likely to require this. Whether an individual feels well informed or poorly informed about the euro has little bearing on when he or she would like to receive information (30% vs. 29%) Respondents who think the consequences of the euro have been positive in the countries that are already using it are more likely to want to receive information as soon as possible than those who say the consequences have been negative, by a margin of 35% to 25%. People in favour of joining the euro (33%) are more likely to want to receive information about its introduction as soon as possible than those who are against it (26%). 17 Base: all respondents 42
44 FLASH 43

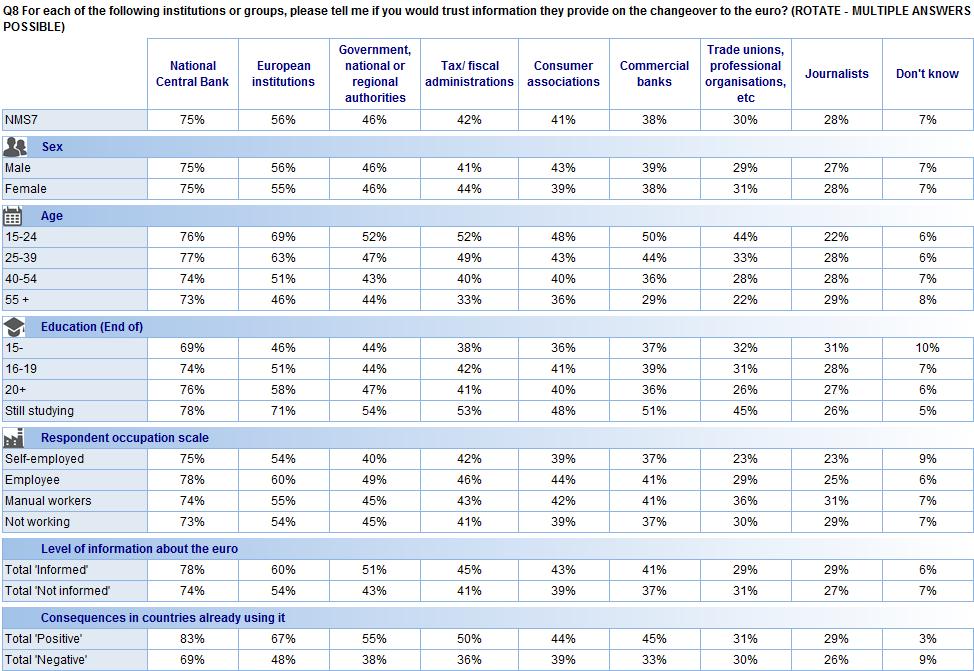
45 FLASH 2.2. Trusted distributors of information on the euro - A majority of respondents trust their national central bank and European institutions as sources of information - All respondents were then asked whether they would trust information provided on the changeover to the euro from a series of institutions or groups 18. A majority of respondents say they would trust information provided by their national central bank (75%, -1 compared with 2012) and by European institutions (56%, -2). Over four out of ten respondents say they would trust information provided by the government, and by national or regional authorities (46%, +3); by tax/fiscal administrations (42%, -1); and by consumer associations (41%, -1). However, only 38% (-3) of respondents say that they would trust information provided by commercial banks, while 30% (no change) would trust information provided by trade unions, professional organisations, etc., and 28% (-1) would trust information provided by journalists. The national central bank is the most trusted source of information in all seven countries, with the degree of trust in this institution ranging from 83% in the Czech Republic and 82% in Romania, to 59% in Lithuania and 66% in Latvia. This marks a change from 2012, when the national central bank was the most trusted information source in only five countries, the exceptions being Lithuania and Latvia. European institutions are the next most trusted sources of information in four countries: Bulgaria (67%), Lithuania (58%), Romania (57%) and Poland (54%). Over 50% of 18 Q8: For each of the following institutions or groups, please tell me if you would trust information they provide on the changeover to the euro? (ROTATE - MULTIPLE ANSWERS POSSIBLE). Government, national or regional authorities; tax/ fiscal administrations; National Central Bank; European institutions; commercial banks; journalists; trade unions, professional organisations, etc; consumer associations; don t know/no answer. 44
46 FLASH people say they trust the information provided by European institutions in all seven countries. Tax/fiscal administrations are the second most trusted source of information in the other three countries: Latvia (62%), the Czech Republic (56%) and Hungary (55%). Less than 50% of people trust their tax/fiscal administrations in the other four countries, with only 35% of people doing so in Poland. Respondents in some countries tend to be more trusting of the information sources than their counterparts in other countries. In the Czech Republic, for example, a majority of people say they trust six out of the eight sources under discussion (all except journalists and trade unions). But in Bulgaria, Hungary and Romania only two of the sources of information (the national central bank and European institutions) are viewed as trustworthy by a majority of respondents. Comparing the results with those obtained in 2012, the trends vary from country to country. In Bulgaria, trust in all eight institutions or groups has increased, with trust in commercial banks (48%, +9), tax/fiscal administrations (47%, +8) and European institutions (67%, +8) having risen the most. This is the second time in a row that Bulgarian respondents have registered an increase in trust in all eight types of institution. In the Czech Republic, the level of trust in the various institutions has declined in seven out of eight instances the exception being government, and national and regional authorities (49%, +1). The level of trust in commercial banks (54%, -9) and in journalists (19%, -6) decreased the most. In Latvia, trust in six out of eight institutions or groups increased, with tax/fiscal administrations (62%, +9) and consumer associations (46%, +7) seeing the biggest rises. However, trust in European institutions (60%, -7) has declined since Respondents in Lithuania now show an increased level of trust in government, and national and regional authorities (52%, +5) and in consumer associations (38%, +4). But their trust in other types of institution declined, and in European institutions (58%, - 6) especially. In Hungary, the respondents level of trust increased in all eight of the types of institution. Trust in consumer associations (53%, +8), government, and national and regional authorities (54%, +7) and tax/fiscal administrations (55%, +7) went up the most. In the previous wave of the survey, people in Hungary also demonstrated an increased level of trust in all but one of the eight kinds of institution. In Poland, the level of trust in all eight types of institution either remained the same or increased slightly. Trust in European institutions (54%, +4) and commercial banks (28%, +4) increased the most. In Romania, the level of trust declined in seven out of eight cases the only exception being government, and national and regional authorities (44%, +3). The level of trust in European institutions (57%, -16) has declined substantially since 2012, with the respondents faith in journalists (30%, -11) and commercial banks (45%, -9) also declining significantly. 45

47 FLASH Analysis of the socio-demographic data shows that: There are few gender variations on this question. Younger respondents express a higher level of trust in all the groups under discussion, with the notable exception of journalists, whom year-olds trust less than older respondents (trust in the national central bank is broadly similar among the four age groups). While 58% of respondents who finished their education aged 20 or over say they trust European institutions as sources of information, only 46% of those who left school aged 15 or under say this. Employees are the most likely to trust all groups and institutions apart from journalists and trade unions. Manual workers are the most likely to trust these two sources of information. People who say they are informed about the euro are more likely to trust all the sources of information than people who say they are not informed with the exception of trade unions. Respondents who expect the euro to have positive consequences are more likely to trust all eight sources of information, apart from journalists. This also applies to people in favour of introducing the euro. 46
48 FLASH 47

49 FLASH 2.3. Preferred channels for information campaign - The television and the internet continue to be seen as the most useful information channels - All respondents were then asked where it would be most useful for them to receive information about the euro and the changeover 19. Seven out of 10 respondents (72%, +2 compared with 2012) think it would be useful to receive information on television. A majority (58%, +2) also think it would be useful to receive information via the internet. Just under half of all respondents think that it would be useful to receive this information in banks (48%, no change), on the radio (46%, -1), or in newspapers and magazines (45%, +1). Over four out of 10 respondents also think it would be useful for information to be provided in schools and other places of education and training (41%, +1). Fewer than four in ten think it would be useful to get information in their letterbox (36%, +1); in public places (32%, +3); in the workplace (27%, +2); and in supermarkets and shops (16%, no change). Television is regarded as the most useful source of information in six of the NMS7 countries: Bulgaria (78%), Romania (74%), Poland (74%), Latvia (73%), Hungary (62%), and Lithuania (61%). While 67% of respondents in the Czech Republic also think 19 Q9: Where would it be most useful for you to receive information about the euro and the changeover? (ROTATE - MULTIPLE ANSWERS POSSIBLE). In banks; in supermarkets and shops; in public places; in schools 48
 are number two.")
50 FLASH it would be useful to be able to access information about the euro on television, slightly more people there (68%) think it would be useful to obtain this kind of information from banks. The internet is regarded as the second most useful source of information in all countries except the Czech Republic and Romania, where banks (49%) are number two. The internet is seen as the third most important source of information in these two countries. In Bulgaria the perceived usefulness of all 10 information sources increased as it did in the previous wave of the survey with public places (37%, +13), the letterbox (34%, +8) and banks (55%, +8) seeing the largest rises compared with However, in the Czech Republic the perceived usefulness of nine of the 10 information channels declined (the exception being supermarkets and shops, whihc were unchanged on 14%). The perceived usefulness of banks (68%, -10) and schools (45%, -8) fell the most. There was generally very little change to the results for Latvia compared with 2012, although the perceived usefulness of supermarkets and shops (28%, +4) and schools (36%, +4) as information channels increased somewhat. Respondents in Lithuania find all 10 information channels to be less useful now than they did in 2012, with the perceived value of banks (24%, -8), the radio (30%, -8) and newspapers and magazines (33%, -8) having fallen the most. As in Latvia, the results from Hungary have changed very little over the last 12 months. The perceived usefulness of the radio (34%, -4) as a source of information about the euro changed the most. Respondents in Poland regard all 10 sources of information as being more useful than they did in This contrasts with the previous wave of the survey, the perceived usefulness of all 10 information channels declined. This time, there were substantial increases in the perceived usefulness of schools (50%, +9), and newspapers and magazine (51%, +9) in particular. and other places of education and training; in the workplace; on the radio; on the television; in newspapers, magazines; in your letter box; on the internet; don t know/no answer. 49

51 FLASH Opinions in Romania have developed in the opposite direction from those in Poland over the past 12 months: all 10 sources of information are now seen as being less useful, as they were in the 2012 wave of the survey. In particular, schools (39%, -10), the radio (44%, -8), newspapers and magazine (41%, -8) and people s letterbox (34%, -8) are regarded as being less valuable as information channels than they were before. According to the socio-demographic data: Women find most information channels slightly more useful than men, with the notable exception of the internet, which men consider more useful by a margin of 62% to 55%. Younger respondents think it would be useful to receive information in certain contexts, notably schools and other educational institutions, the workplace, and the internet. Older respondents favour the television as a means of delivering information about the euro. Respondents with a higher level of education are much more likely to think it is useful to receive information in schools, in newspapers or magazines, and on the internet, than those who left school at 15 or younger. Employees (66%) and self-employed respondents (68%) are more likely than people who are not working (51%) to find it useful to receive information over the internet. Individuals who consider themselves to be well informed about the euro are more likely to see the internet as a useful source of information than those who do not think of themselves as being well informed, by a margin of 64% to 54%. 50

52 FLASH 2.4. Most favoured topics of information campaigns - All six proposed elements of the information campaign are seen as essential by a majority of respondents All respondents were next asked which issues they view as being essential to the information campaign about the euro 20. As in previous waves of the survey, a majority of respondents feel that all six issues under consideration ought to be covered. Three quarters of respondents (76%, +1 compared with 2012) think the value of one euro in their country s currency should be included in the information campaign, with a similar number of people arguing that the practical implications of joining the euro regarding their salary and bank account (75%, +1) should be included; that the way in which the euro is to be introduced (73%, +1) should be included; and that the social, economic or political implications of the euro (72%, no change) should be included. Two thirds of respondents (67%, no change) think it is important for the campaign to explain how it will be ensured that the rules for currency conversion are respected, and over half (57%, no change) think it is important for people to be shown what the euro notes and coins look like. The order of priority in which the issues are placed varies significantly from country to country. Explaining the way in which the euro will be introduced is seen as the most essential aspect of the information campaign in the Czech Republic (84%), Romania (71%) and 20 Q10: In your view, which of the following issues about the euro are essential to be covered in priority by the information campaign? (ROTATE - MULTIPLE ANSWERS POSSIBLE). The way/how the euro will be introduced in (OUR COUNTRY); the value of one euro in (COUNTRY CURRENCY); what notes and coins in euros look like; how to ensure that the rules for the currency conversion into euro are respected; The practical implications of the euro regarding your salary, your bank account; the social, economic or political implications of the euro; don t know/no answer. 51
 and Lithuania (59%).")
53 FLASH Lithuania (59%). The inclusion of the value of one euro in the local currency is seen as the most essential element in Poland (80%), Bulgaria (77%), Hungary (77%) and Romania (71%). The practical implications of joining the euro are placed first by people in Latvia (76%) and Lithuania (59%). And an explanation of the social, economic and political implications is considered the most essential component of any information campaign by respondents in Bulgaria (77%). The level of support for the inclusion of these issues also varies according to the Member State. In the Czech Republic support for prioritising particular issues ranges from 84% (the way the euro will be introduced) to 65% (what notes and coins look like). But in Lithuania, the number of people who view aspects of the information campaign as essential ranges from 59% (the way the euro will be introduced, and the practical implications of joining) to 22% (what notes and coins look like). Since 2012, there have been substantial changes on this question in most of the seven countries. However, it is important to note that respondents in a particular country tend to view all six proposed elements of the campaign as being either more or less essential than they did previously, suggesting that they are mostly judging the importance of the information campaign itself, rather than its specific content. In two Member States Bulgaria and Poland all six issues are seen as being more essential than they were in In Bulgaria the increases were all between 6 and 11 percentage points; in Poland they were between 6 and 9 percentage points. In Hungary the perceived importance of five of the six issues increased, the exception being the way in which the euro will be introduced, which was unchanged. In contrast, in the Czech Republic, Lithuania and Romania all six issues are considered to be less essential than they were a year earlier. The declines were most substantial in Romania, with far fewer respondents now seeing it as essential to explain how we can ensure that the rules for currency conversion are respected (65%, -15) and to explain what notes and coins look like (57%, -13). In the Czech Republic the social, economic and political importance of joining the euro (89%, -9) and the value of one euro in the 52

54 FLASH local currency (80%, -8) were the issues whose perceived importance fell the most; in Lithuania this applied to the issue of what notes and coins look like (22%, -6). In Latvia there was relatively little change in the perceived importance of most issues, though there was a noticeable decline in the number of respondents who think that it is essential to cover the way in which the euro will be introduced (68%, -6) The socio-demographic data suggest that: Women are more likely than men to think these issues should be covered by the information campaign, especially the question of what notes and coins look like (61% vs. 53%). Respondents who left education aged 20 or over are much more likely to emphasize covering the practical implications of joining the euro (79%), and also the social, economic or political implications (76%), than those who left school aged 15 or under (both 59%). But people who left school earlier are more likely to say that it is essential to explain what euro notes and coins look like (64% vs. 57%). Employees are the most likely to put the emphasis on giving priority to advocate including an explanation of how the rules for currency conversion are respected, and of the practical implications of joining the euro. 53
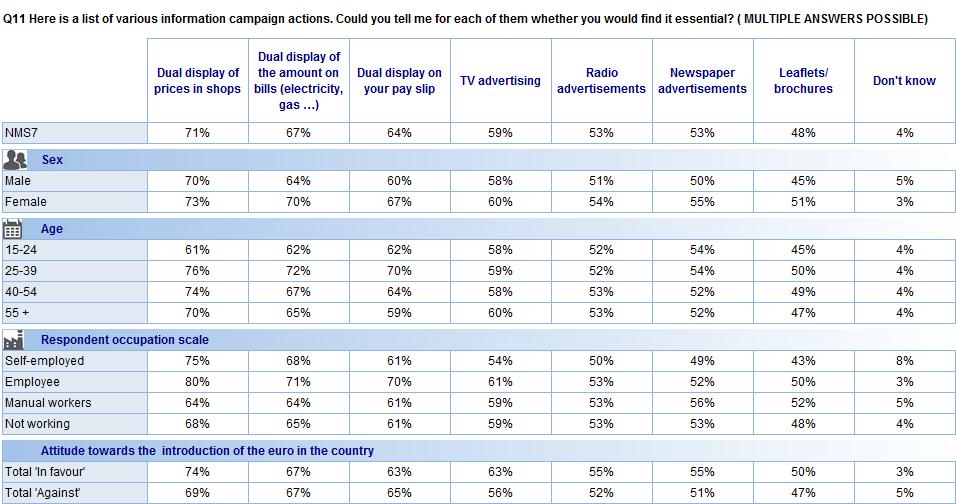
55 FLASH 2.5. Activities and events which are essential to include in an information campaign - The dual display of prices and values is seen as being the most important activity within the context of the information campaign After identifying the most important topics to cover in the information campaign about the introduction of the euro, all respondents were then asked to say which activities and events should, in their view, be part of the campaign 21. Over 50% of respondents feel that six out of the seven activities under discussion the exception being leaflets/brochures ought to be included. It is noticeable that there has been very little change on this question since 2012, with the number of people identifying the seven potential activities as essential either remaining unchanged or altering only slightly. Seven out of 10 respondents (71%, -2 points compared with 2012) think the dual display of prices in shops is essential. Around two thirds of respondents (67%, -1) think the dual display of the amount on bills is essential, and that the dual display of totals on one s pay slip should be included (64%, no change). A majority of respondents also say that TV advertisements should be included (59%, -1); that newspaper advertisements should be included (53%, no change); and that radio advertisements should be included (53%, +2). Just under half of all respondents think that leaflets and brochures should be included (48%, -1). 21 Q11: Here is a list of various information campaign actions. Could you tell me for each of them whether you would find it essential? (ROTATE - MULTIPLE ANSWERS POSSIBLE). Dual display of prices in shops; dual display of the amount on bills (electricity, gas ); dual display on your pay slip; leaflets/ brochures; TV advertisements; radio advertisements; newspaper advertisements; don t know/no answer. 54
.")
56 FLASH The dual display of prices in shops is seen as the most important aspect of the information campaign in all seven countries, with number of people who mention this ranging from 90% in Latvia to 62% in Poland. In Bulgaria, the dual display of amounts on bills is the joint top answer alongside the dual display of prices on bills (both 73%). The three forms of dual display under discussion are considered the three most important activities in the Czech Republic, Latvia, Hungary and Poland. In Bulgaria, TV advertising (65%) is seen as the third most important activity, while TV advertising is placed joint second in Lithuania (70%). In Poland, leaflet/brochures and radio advertisements are given equal importance to dual displays on bills and pay slips, and TV advertising (57-58% of respondents mention these five activities). 55
; and respondents in Latvia think that five of the seven activities are more important than in 2012 (with the other two unchanged).")
57 FLASH Compared with 2012, respondents in Lithuania attribute greater importance to all seven activities; more people in Bulgaria mention six of the activities (the exception being dual display on pay slips); and respondents in Latvia think that five of the seven activities are more important than in 2012 (with the other two unchanged). Of these three countries, Bulgaria experienced the biggest changes, with substantial increases in the number of people who consider leaflets/brochures (49%, +9) and newspaper advertisements (51%, +9) to be important. In contrast, in the Czech Republic and Romania fewer respondents regard all seven activities as being essential than did so in The largest declines occurred in Romania on the subjects of TV advertising (68%, -9), dual display of prices in shops (77%, -8), leaflets/brochures (57%, -8) radio advertisements (58%, -8) and newspaper advertisements (58%, -8). There was very little change in the results from Hungary and Poland. According to the socio-demographic data: A higher proportion of women than men think that all seven of the activities under discussion are essential to the information campaign, notably dual displays on pay slips (67% vs. 60%) and leaflets/brochures (51% vs. 45%). Dual displays of prices and values are most important to people in the age group, and of least importance to year-olds. Employees (80%) are the most likely to think that the dual display of prices in shops is essential, while manual workers (64%) are the least to think this. Respondents who are in favour of joining the euro are more likely than those who are against doing so to argue that dual displays of prices in shops (74% vs. 69%), and TV advertisements (63% vs. 56%) are essential. 56
58 FLASH 57
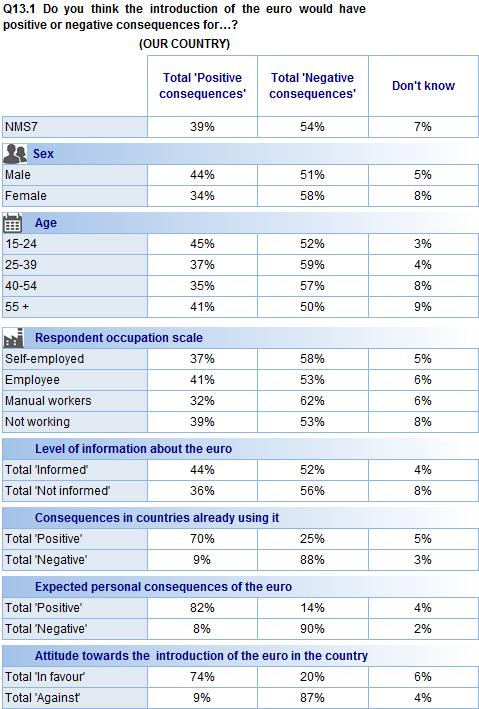
59 FLASH III. THE EURO: PERCEPTIONS AND SUPPORT FOR ITS INTRODUCTION 1. CONSEQUENCES OF THE EURO S INTRODUCTION 1.1. Consequences at a national level - A majority of respondents believe that the euro would have negative consequences for their country - All respondents were asked whether they think the introduction of the euro would have positive or negative consequences for their country 22. A majority of respondents (54%, no change compared with 2012) think the consequences would be negative, with 20% (+1) saying they would be very negative and 34% (-1) saying they would be rather negative. Four out of 10 respondents (39%, no change) think the consequences for their country would be positive, with 5% (-1) thinking they would be very positive and 34% (+1) expecting them to be rather positive. Just 7% of respondents (no change) say they don t know whether the consequences would be positive or negative. Opinions about the consequences of introducing the euro have therefore remained quite static since the November 2011 survey, when 55% of people thought that the consequences would be negative. The popular perception remains far worse than it did in May 2011, when equal numbers (43%) of people thought the consequences would be positive and negative. The latest results reinforce the impression that opinions have now stabilised following a 17-point fall in the number of people foreseeing positive consequences in the five waves of the survey up to and including November 2011, down from a peak of 55% in May Q13.1: Do you think the introduction of the euro would have positive or negative consequences for [OUR COUNTRY]? Very positive consequences; rather positive consequences; rather negative consequences; very negative consequences; don t know/no answer. 58

60 FLASH As in previous waves of the survey, Romania is the only NMS7 country in which a higher proportion of respondents think the introduction of the euro would have positive consequences for their country, by a margin of 51% to 42%. Respondents in the Czech Republic are the most likely to think that introduction of the euro would have negative consequences: 72% say this, while 23% think it would be positive. In Poland 58% of people say the consequences would be negative, and 36% think they would be positive. In Lithuania 55% think the consequences would be positive, while 35% see them as negative, with a very similar result in both Bulgaria (54% vs. 39%) and Latvia (54% vs. 40%). In Hungary, 46% of respondents think the consequences of introducing the euro would be negative, compared with 42% who think they would be positive. Since 2012, the number of respondents anticipating positive consequences has increased in the Czech Republic (+5), Bulgaria (+3) and Romania (+2). However, it declined in Latvia (-3), Poland (-3), Lithuania (-2) and Hungary (-1). 59

61 FLASH The socio-demographic data suggest that: Men (44%) are more likely than women (34%) to think that the euro will have positive consequences for their country. Younger respondents are the most likely to say they euro will have positive consequences for their country: 45% of year-olds take this view, compared with 35% of year-olds. Employees (41%) are the most likely to believe that the euro would have positive consequences, while manual workers (32%) are the least likely to feel this way. 44% of people who feel informed about the euro think it would have positive consequences and 52% think it would have negative consequences. Only 36% of respondents who feel uninformed anticipate positive consequences, while 56% expect a negative impact. Seven out of 10 respondents (70%) who think the euro is positive in countries already using it also think it would be positive for their country as well. But a quarter (25%) of those who think the euro is positive in countries already using it feel it would be negative for their own country. Over four fifths (82%) of people who think the euro would be positive for them personally also think it would also be positive for their country. While 74% of people who are in favour of joining the euro think it would be positive for their country, a fifth (20%) of those in favour think the euro would have negative consequences for their country. 60
62 FLASH 61

63 FLASH 1.2. Personal consequences of the euro s introduction - Half of all respondents think that the euro would have negative consequences for them personally - Having discussed the consequences of joining the euro at a national level, all respondents were then asked whether they think the introduction of the euro would have positive or negative consequences for them personally 23. Half of the respondents (50%, - 1 compared with 2012) think the consequences would be negative, with 18% (+1) saying they would be very negative and 32% (-2) saying they would be rather negative. By contrast, 39% (-1) think the personal consequences would be positive, with 6% (no change) thinking they would be very positive and 33% (-1) thinking they would be rather positive. One in ten (11%, +2) don t know. As with the respondents expectations of the national consequences of introducing the euro, people s personal expectations have remained steady since November 2011, when 51% thought the consequences would be negative, and 39% thought they would be positive. Up to and including November 2011 there had been a steady decline in the number of people anticipating positive personal consequences, down from a peak of 49% in May In Romania and Hungary, a majority of respondents think that the introduction of the euro would have positive consequences for them personally. In Romania 55% of pepole 23 Q13.2: Do you think the introduction of the euro would have positive or negative consequences for you personally? Very positive consequences; rather positive consequences; rather negative consequences; very negative consequences; don t know/no answer. 62
64 FLASH think the consequences would be positive, and 35% think they would be negative. In Hungary, 44% of respondents think the consequences would be positive, as opposed to 41% who think they would be negative. In the previous wave of the survey, a majority of people in Latvia felt that the personal consequences of euro introduction would be positive. However, this is no longer the case, with 48% now anticipating negative consequences and only 42% expecting positive consequences. In the three remaining countries, a clear majority of people think that the personal consequences of euro introduction would be negative: the Czech Republic (65% vs. 25%), Poland (57% vs. 34%) and Lithuania (47% vs. 33%). Since 2012, the number of respodents expecting the introduction of the euro to have positive personal consequences has increased in the Czech Republic (+4), Bulgaria (+2) and Romania (+1). These three countries also recorded increases in the number of people anticipating positive national consequences. However, the proportion of respondents who predict positive personal consequences declined in Latvia (-3), Poland (-3), Lithuania (-3), while remaining unchanged in Hungary. According to the socio-demographic data: Men (45%) are more likely than women (34%) to think that the euro will have positive consequences for them personally. While 47% of year-olds expect the euro to have positive consequences for them personally, only 36% of respondents aged 55 and over take this view. Employees (43%) and self-employed people (44%) are the most likely to say the euro would have positive consequences for them personally, while manual workers (34%) and people who are not working (37%) are the least likely to say this. 63
 of those who think the euro is positive in countries already using it think it would be negative for them personally.")
65 FLASH Over two thirds (68%) of respondents who think the euro is positive in countries already using it also think it would be positive for them personally. But a quarter (24%) of those who think the euro is positive in countries already using it think it would be negative for them personally. Over four fifths (83%) of respondents who think the euro would be positive for their country think it would also be positive for them personally. Three quarters (75%) of people who are in favour of joining the euro think it would be positive for them personally; but 16% of those in favour think the euro would have negative consequences for them. 64

66 FLASH 2. SUPPORT FOR THE SINGLE CURRENCY 2.1. Opinions within the respondents social environment - A majority of NMS7 respondents oppose the introduction of the euro - All respondents were now asked whether they are in favour of, or against, the idea of introducing the euro in their country 24. A majority of people (51%, +2 compared with 2012) are against joining the euro, while 45% of respondents (-2) are in favour. As in the previous wave of the survey, a majority of respondents are in favour of introducing the euro in three countries: Romania, where 67% are in favour (vs. 28% against); Hungary (54% vs. 41%); and Bulgaria (52% vs. 43%). But in the other four countries, a majority of people are against introducing the euro. Opposition to joining is especially strong in the Czech Republic, where 80% are against and only 14% are in favour. Most people also oppose the introduction of the euro in: Poland (60% against vs. 38% in favour); Latvia (55% vs. 42%); and Lithuania (55% vs. 41%). Since 2012, the number of people in favour of introducing the euro has declined in five of the seven countries: Poland (-6), Hungary (-4), Latvia (-4), Lithuania (-3) and Bulgaria (-1). However, there were increases in Romania (+3) and the Czech Republic (+1). 24 Q14 Generally speaking, are you personally more in favour or against the idea of introducing the euro in (OUR COUNTRY)? Very much in favour of its introduction; rather favour of its introduction; rather against of its introduction; very much against its introduction; don t know/no answer. 65
 is the most likely to in favour of introducing the euro, while the 40-54 age group (42%) is the least likely.")
67 FLASH The socio-demographic data show that: Men are more likely than women to be in favour of the introduction of the euro, by a margin of 50% to 41%. The age group (49%) is the most likely to in favour of introducing the euro, while the age group (42%) is the least likely. While 47% of employees favour the introduction of the euro, only 39% of manual workers do so. A majority (51%) of people who feel informed about the euro are in favour of its introduction, whereas only 42% of people who do not feel informed are in favour. Three quarters (73%) of people who believe the euro has had positive consequences for the countries already using it are in favour of joining, though 24% of people who think the euro has positive consequences for those countries it are still against. 85% of respondents who think the euro would have positive consequences for their own country are in favour of joining, but 13%, despite anticipating positive national consequences, are against. 66

68 FLASH 2.2. The most desired timeframe for the adoption of the euro - Adopting the euro as late as possible is the most popular option among NMS7 respondents - After considering whether they are in favour of joining the euro, all respondents were then asked when they would like the euro to become their currency 25. Over four out of ten respondents (45%, +1 compared with 2012) say they would like the euro to be introduced as late as possible. A third (34%, -1) would like to adopt the euro after a certain time. Just 17% (no change) would like to introduce the euro as soon as possible. The results to this question have remained essentially unchanged since November 2011, prior to which there was a steady increase up from 29% in May 2009 in the number of people who favoured adopting the euro as late as possible. As in previous waves of the survey, Romania is the only NMS7 country where more respondents would like to join the euro as soon as possible (36%) than would like to join as late as possible (29%). In two countries, over 50% of responents support adopting the euro as late as possible: the Czech Republic (65% vs. 5% who want to join as soon as possible); and Poland (54% vs. 10%). Elsewhere, the margin is smaller: Lithuania (47% vs. 13%); Latvia (46% vs. 15%); Hungary (36% vs. 19%); and Bulgaria (34% vs. 14%). 25 Q15: When would you like the euro to become your currency? As soon as possible; after a certain time; as late as possible; don t know/no answer. 67
. In the other four countries, the results were broadly unchanged.")
69 FLASH In two countries, more people are in favour of joining as soon as possible than were in favour of this in 2012: Latvia (+6) and Poland (+2). However, there was a substantial decline in the number of people taking this view in Hungary (-6). In the other four countries, the results were broadly unchanged. The socio-demographic data show that: Men are more likely than women to want to introduce the euro as soon as possible, by a margin of 21% to 13%. Women (51%) are more inclined than men (40%) to want to join as late as possible year-olds (44%) are the most likely to advocate joining after a certain time; year-olds (30%) are the least likely to do this. Instead, respondents in the latter age group (48%) are the most likely to want to join as late as possible, with only 39% of year-olds favouring this approach. A majority (50%) of manual workers want to join the euro as late as possible, whereas only 43% of employees say this. A majority of people who think the euro will have positive consequences for their country (54%) prefer the idea of introducing the euro after a certain time. Most people (53%) who are in favour of joining the euro want to join it after a certain time, with only 35% of those in favour believing that their country should join as soon as possible. 68
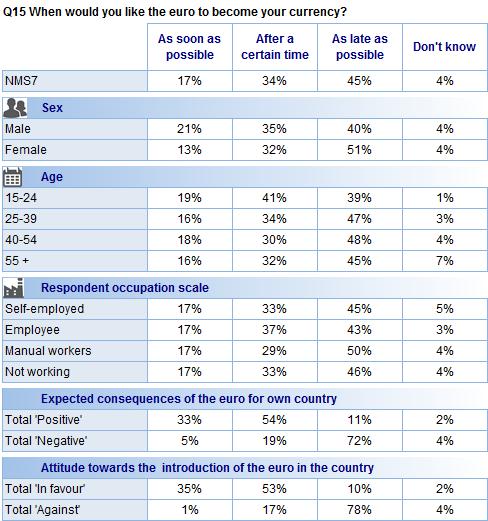
70 FLASH 69

71 FLASH IV. CONSEQUENCES OF ADOPTING THE EURO 1. THE CONSEQUENCES IN GENERAL - A majority of respondents think that the euro has had positive consequences in the countries that already use the currency - All respondents were asked whether they think the introduction of the euro has had positive or negative consequences in the countries that are using the euro already 26. A majority (46%, no change compared with 2012) think the euro has had positive consequences, with 5% (no change) saying it has been very positive, and 41% (no change) saying it has been rather positive. Slightly fewer respondents (43%, +1) think the euro has had a negative impact in those countries, with 11% (+1) believing that it has been very negative, and 32% (no change) saying it has been rather negative. A tenth of respondents (11%, -1) say they don t know. The latest results suggest that public opinion has now stabilised after a majority of respondents in November 2011 said they thought the introduction of the euro had had positive or negative consequences (46% vs. 43%). Up until that point the number of people who said the euro had had positive consequences had been declining steadily from a peak of 53% in May In five of the seven NMS7 Member States a majority of respondents think that the euro has had positive consequences in the countries that are already using it: Romania, where 56% think the consequences have been positive, and 34% think they have been 26 Q12: Do you think the introduction of the euro has had positive or negative consequences in those countries that are using the euro already? Very positive consequences; rather positive consequences; rather negative consequences; very negative consequences; don t know/no answer. 70
 think the euro s consequences have been negative, as do a majority of respondents in Poland (47% vs. 43%).")
72 FLASH negative; Hungary (51% vs. 33%); Bulgaria (46% vs. 40%); Latvia (45% vs. 40%); and Lithuania (43% vs. 41%). However, in the Czech Republic a majority of respondents (58% vs. 32%) think the euro s consequences have been negative, as do a majority of respondents in Poland (47% vs. 43%). Since 2012, the number of people who think the euro has had positive consequences has increased in three countries: Romania (+5), the Czech Republic (+4) and Bulgaria (+1). However, the number of people who take this view declined in Hungary (-4), Latvia (-4), Lithuania (-4) and Poland (-3). According to the socio-demographic data: Men (49%) are more likely than women (43%) to think that the euro has had positive consequences. Younger respondents are much more likely to think the euro has had positive consequences: 61% of year-olds say this, compared with 41-45% of respondents in the three older age groups. Respondents who feel informed about the euro are somewhat more likely to think that it has had positive consequences than those who regard themselves as uninformed, by a margin of 49% to 44%. 83% of people who think the euro will have positive consequences for their own country think it has had positive consequences in the countries that use it already. 71
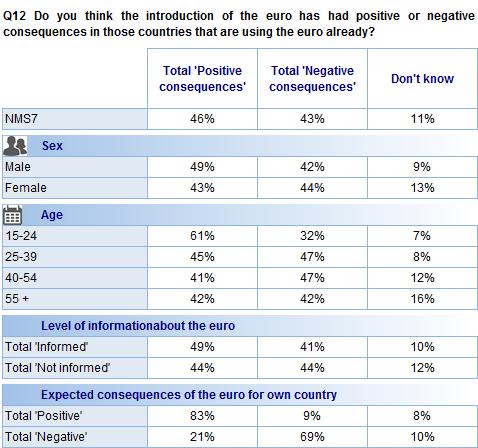
73 FLASH 72

74 FLASH 2. POLITICAL AND ECONOMIC CONSEQUENCES OF INTRODUCING THE EURO 2.1. Will the changeover to the euro increase prices? - Two thirds of respondents think that introducing the euro will result in price increases - Having considered the general consequences of euro introduction, all respondents were then asked what impact, if any, the introduction of the euro will have on prices in their country 27. Two thirds of respondents (67%, -4 compared with 2012) think the changeover will increase prices, while 22% (+2) think it will help keep prices stable. Just 5% (+1) think the euro s introduction will help reduce prices, with a further 2% (+1) saying spontaneously that it will have no impact. A majority of respondents in all seven countries thinks that introducing the euro will increase prices, ranging from the 78% of people who take this view in Lithuania to the 50% who think so in Romania. Romania (34%) has the highest proportion of people who think the euro will help keep prices stable, while Lithuania (14%) has the lowest. Romania (9%) also has the highest number of people who think the euro will help to reduce prices. In five of the seven countries, fewer respondents now think that introducing the euro will cause prices to rise than did so in 2012: the Czech Republic (-9), Bulgaria (-8), Hungary 27 Q18: What impact, if any, do you think the introduction of the euro will have on prices in (OUR COUNTRY)? Will increase prices; will help keep prices stable; will help reduce prices; no impact (DO NOT READ OUT); don t know/no answer. 73
 are more likely than men (64%) to think that introducing the euro will increase prices.")
75 FLASH (-4), Poland (-4) and Romania. However, the opposite trend can be observed in Latvia (+8) and Lithuania (+3). According to the socio-demographic data: Women (70%) are more likely than men (64%) to think that introducing the euro will increase prices year-olds (70-71%) are the most likely to think that introducing the euro will increase prices; year-olds (58%) are the least likely to take this view. 43% of people who think the euro will have positive consequences for their own country still expect prices to rise following its introduction. 85% of people who anticipate negative consequences think that prices will rise. 46% of respondents who are in favour of joining the euro also believe introducing prices will go up, as do 87% of people who are against the euro. 74

76 FLASH 2.2. Favourable political and economic consequences of the euro - Reinforcing the place of Europe in the world is seen as the main consequence of joining the euro in most NMS7 countries - All NMS7 respondents were asked whether introducing the euro would have various favourable political and economic consequences for their country 28. Over four out of 10 respondents (46%, -2 compared with 2012) think that introducing the euro will make them feel more European than they do now, and also that their joining the euro will reinforce the place of Europe in the world (46%, +2). At least three out of 10 respondents think that introducing the euro will ensure lower interest rate charges and fewer debt charges (34%, +1); that it will ensure low inflation rates (33%, +4); that it will ensure sounder public finances (32%, +2); and that it will improve growth and employment (30%, +1). A fifth of respondents (21%, +2) don t know what the effects of joining the euro will be. Romania has the highest proportion of respondents who envisage positive consequences on four out of the six issues, with the Romania results ranging from 57% of people who think that introducing the euro will reinforce the place of Europe in the world to the 38% of people who think that doing so will improve growth and employment. Bulgaria (42%) has the most respondents who think joining the euro will ensure sounder finances, while Hungary (40%) has the most people who believe it will improve growth and employment. 28 Q18: In your opinion, what of the following do you think the adoption of the euro will do for (OUR COUNTRY)? (MULTIPLE ANSWERS POSSIBLE). Will ensure lower interest rates, less debt charges; will ensure sounder public finances; will improve growth and employment; will ensure low inflation rates; will reinforce the place of Europe in the world; will make us feel more European than now; don t know/no answer. 75

77 FLASH By contrast, the Czech Republic has the lowest number of people who think that positive consequences will result in five out of the six cases, with results ranging from the 44% of people who think that introducing the euro will reinforce the place of Europe in the world to the 12% who say that doing this will improve growth and employment. The exception is the question of whether joining the euro will reinforce the place of Europe in the world; here, Poland (40%) has the lowest result. In five countries, the most popular answer is that joining the euro will reinforce the place of Europe in the world. The exceptions are Lithuania and Poland, where joining the euro will make us feel more European than we do now is the most popular answer. Over 50% of respondents think that joining the euro will reinforce the place of Europe in the world in Romania (57%), Latvia (54%) and Bulgaria (52%), while over 50% believe that joining the euro will make us feel more European than we do now in both Romania (56%) and Bulgaria (51%). Since 2012, Bulgaria has seen the most substantial changes on this question, with more people saying that all six positive consequences will result from joining the euro. In particular, more Bulgarian respondents think that introducing the euro will reinforce the place of Europe in the world (52%, +11) and ensure low inflation rates (36%, +10). Elsewhere the changes were more modest. The only other evolutions of at least 5 percentage points occurred in the Czech Republic, where more people think that joining the euro will ensure sounder public finances (22%, +5); in Hungary, where more people also anticipate sounder public finances (38%, +8); and in Poland, where more people think the euro will ensure low inflation rates (30%, +5), but where fewer respondents expect that it will make them feel more European (47%, -6). The socio-demographic data suggest that: 76

78 FLASH Men are more likely than women to think that all six of the political and economic consequences under consideration will result from joining the euro year-olds are the most likely to think that five out of the six consequences under consideration will result from joining the euro, the exception being lower interest rates. Individuals who feel informed about the euro are more likely to think that introducing it will produce all six outcomes. Respondents who think the consequences of the euro in countries that already using it have been positive are much more likely to think that favourable economic and political consequences will result from joining. Similarly, people in favour of the euro are far more likely to say that favourable economic and political consequences will ensue. 77

79 FLASH 3. PRACTICAL CONSEQUENCES OF THE EURO CHANGEOVER - Most respondents think that joining the euro will bring various practical benefits, though most do not believe that it will protect their country from international crises - Following on from the discussion of the economic and political consequences of joining the euro, respondents were now asked about the practical consequences of introducing the currency 29. It is noticeable that more people think that their country will benefit in all five ways than thought so in A majority of respondents think that four of the five practical consequences under discussion will result from euro entry. Over four fifths (82%, +1 compared with 2012) think that it will be more convenient for those who travel in other countries that use the euro. And over three fifths of people believe that joining will make it easier to shop in other countries that use the euro (68%, +2); that it will allow people to easily compare prices with other countries that use the euro (64%, +4); and that it will save money by eliminating currency exchange fees (63%, +4). However, only three out of 10 respondents think that introducing the euro will protect their country from the effects of international crises (30%, +4). 29 Q17: Do you think that the euro? (MULTIPLE ANSWERS POSSIBLE). Will allow you to easily compare prices with other countries that use the euro; will make it easier to shop in other countries that use the euro; will save money by eliminating fees of currency exchange in other countries that use the euro; will be more convenient for those who travel in other countries that use the euro; will protect (OUR COUNTRY) from the effects of international crises; don t know/no answer. 78
80 FLASH In all seven countries, the most popular answer is that upon joining the euro it will be more convenient for those who travel in other countries that use the euro, with the number of people who say this ranging from 86% in Latvia to 76% in Hungary. In all seven countries, joining the single currency will make it easier to shop in other countries that use the euro is the second most popular answer. The number of respondents who give this answer range from 73% in Latvia to 57% in Lithuania. And again in all seven countries, introducing the euro will protect our country from the effects of international crises is the least common response, with the number of people who take this view ranging from 40% in both Bulgaria and Romania, to just 19% in the Czech Republic. Compared with 2012, three countries have recorded increases in the number of people who expect all five practical outcomes from joining the euro: Bulgaria, Hungary and Poland. In Bulgaria, the biggest increases came on the questions of saving money through the elimination of currency exchange fees (64%, +10), being able to compare prices with other countries (65%, +8), and protecting the country from international crises (40%, +8). In Hungary the largest change was on the issue of being able to compare prices with other countries (66%, +8); this was also the case in Poland (63%, +7). In the other four countries, the trends were more mixed, with both increases and decreases. Evolutions of at least 5 percentage points occurred in the Czech Republic, where more people think that joining the euro will protect the country from international crises (19%, +5); in Latvia, where fewer respondents think that joining will enable them to compare prices with other countries (59%, -5); and in Romania, where more people think that joining the euro will protect the country from international crises (40%, +7), but fewer believe that it will be easier to shop in other countries that use the euro (66%, -5) or that it will be more convenient travelling to other euro countries (79%, -6). 79

81 FLASH According to the socio-demographic data: Men are more likely than women to think that joining the euro will bring all five of the practical benefits under discussion year-olds are more likely to think that all five consequences will result than their older counterparts. With the exception of the idea that the euro will protect from the effects of international crises, people who spent longer in education are more likely to think that favourable consequences will ensue. Individuals who think the euro has had or will have positive consequences are, unsurprisingly, more likely to anticipate all five beneficial results of joining the currency, as are people who are in favour of joining the euro. 80
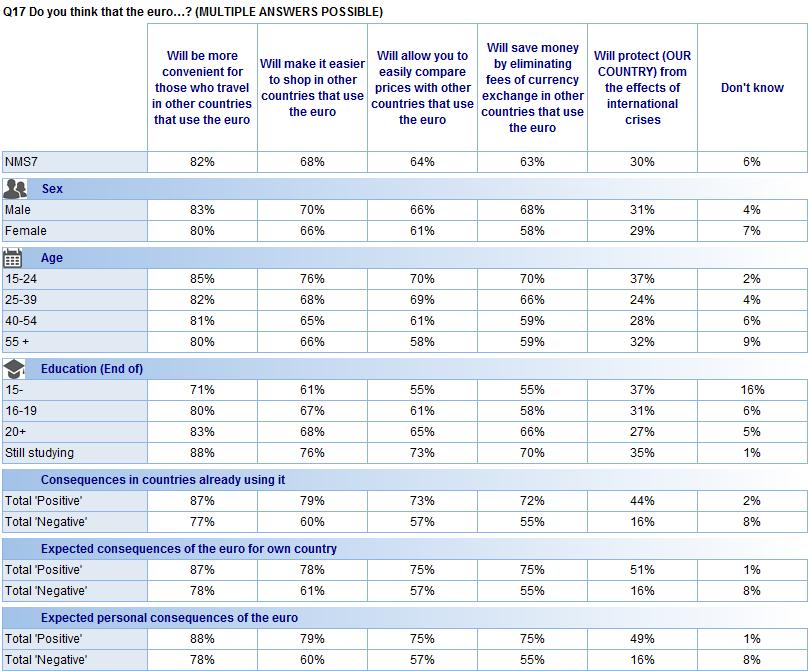
82 FLASH 81

83 FLASH 4. POTENTIAL INCONVENIENCES OF THE INTRODUCTION OF THE EURO - Three quarters of respondents are concerned about abusive price setting during the euro changeover - Having considered the likely benefits of introducing the euro, respondents were now asked about some potential drawbacks of joining the currency. Specifically, they were asked whether they agree or disagree with four statements about the effect that the changeover will have on them personally 30. Nearly three quarters of respondents (74%, no change compared with 2012) agree that they are concerned about abusive price setting during the changeover. A quarter of people (24%, no change) say they are not concerned about this. However, less than half of the respondents agree with the other three statements. Just under half (48%, +1) agree that adopting the euro will mean that their country will lose a part of its identity, versus 48% who disagree; 46% (no change) agree that the replacement of their national currency will cause them a lot of inconvenience, versus 50% who disagree; and 45% (+2) agree that adopting the euro will mean that their country will lose control over its economic policy, versus 49% who disagree. 30 Q19: Could you tell me for each of the following statements if you agree or disagree? The replacement of the (NATIONAL CURRENCY) by the euro will cause you personally a lot of inconvenience. You are concerned about abusive price setting during the changeover. Adopting the euro will mean that (OUR COUNTRY) will lose control over its economic policy. Adopting the euro will mean that (OUR COUNTRY) will lose a part of its identity. Totally agree; tend to agree; tend to disagree; totally disagree; don t know/no answer. 82

84 FLASH 4.1. Concerns regarding abuses and cheating on prices during the changeover - The level of concern about abusive price setting has now remained broadly unchanged for several years- Nearly three quarters of respondents (74%) express concern about abusive price setting the same number who agreed that this would be a problem in For seven successive surveys the number of people who agree that this could be an issue has remained constant at 73-75%, though the level of concern remains somewhat higher than the low of 67% recorded in April The number of respondents who express concern about abusive price setting ranges from 81% in Latvia, to 66% in both Hungary and Romania. The level of concern declined noticeably in the Czech Republic (74%, -6); elsewhere, there was relatively little change. 83
 of respondents who think the euro s")

85 FLASH According to the socio-demographic data: While 75% of people who completed their education aged 20 or over think the introduction of the euro will lead to abusive price setting, only 64% of those who left school aged 15 or under are worried about this Nearly two thirds (64%) of respondents who think the euro s introduction will have positive consequence for their country agree that it will lead to abusive price setting, whereas 82% of those who anticipate negative consequences say this. Of those in favour of the euro, 65% say its introduction will lead to abusive price setting; but 82% of people who are against the euro expect this to happen. 84
 of all NMS7")
86 FLASH 4.2. Changes due to the euro s introduction - The number of respondents who think the euro s introduction will cause them personal inconvenience remains at an all-time high - Nearly half (46%) of all NMS7 respondents agree that the introduction of the euro will cause them a lot of personal inconvenience. The same number of people said this in The level of concern on this issue remains high by the historical standards of the survey, with a big jump recorded between the May 2011 survey, when only 38% of respondents regarded personal inconvenience as an issue, and November 2011, by which time 45% of respondents were concerned about this. However, a majority of respondents (50%) continue to disagree that personal inconvenience will be a factor. The proportion of respondents who think the euro will cause them a lot of inconvenience ranges from 52% in the Czech Republic to 41% in both Hungary and Romania. In two countries the Czech Republic and Bulgaria a majority of respondents agree that introducing the euro would inconvenience them personally. Opinion is equally divided (on 48%) in Lithuania. Since 2012 the level of agreement has risen in Lithuania (48%, +5) and Poland (48%, +4), while declining in Hungary (41%, -7). 85

87 FLASH According to the socio-demographic data: Women are more likely than men to think that the introduction of the euro will inconvenience them personally, by a margin of 51% to 41%. 56% of people who left school aged 15 or under think the euro will inconvenience them personally, but only 44% of respondents who finished their education aged 20 or over agree. 50% of manual workers and people who are not working agree that introducing the euro will cause them personal inconvenience, whereas only 38% of selfemployed people and 42% of employees see this as an issue. Only 28% of respondents who think the euro will have positive consequences for them agree that the introduction of the euro will inconvenience them personally, whereas 63% of those who expect it to have negative consequences expect to be inconvenienced. Of those in favour of the euro, only 31% say its introduction will inconvenience them personally; in contrast, 60% of people who are against the euro expect to be inconvenienced by it. 86
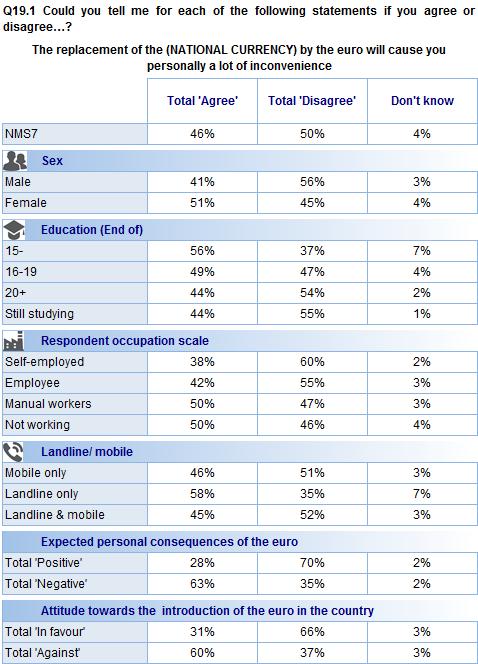
88 FLASH 87

89 FLASH 4.3. Effects on national identity due to the adoption of the euro - Opinion is evenly split on the question of whether introducing the euro would lead to a loss of national identity - Just under half (48%) of the respondents agree that adopting the euro will mean that their country will lose a part of its identity. This compares with 47% who said this in The latest results matches the 48% peak recorded in November 2011, when the level of concern about a loss of national identity jumped from the 37% recorded in May Opinion is now equally divided on this issue. The number of respondents who think adopting the euro will spell a loss of national identity ranges from 75% in Latvia to 38% in Hungary. A majority of people agree that this is a likely outcome of joining the euro in four countries: the Czech Republic, Latvia, Lithuania and Bulgaria. The level of agreement has risen steeply since 2012 in Latvia (+7), as well as in Poland (45%, +3), though it also declined in Bulgaria (49%, -4). 88
 are the least likely. While 51% of people who live in rural villages fear a loss of national identity, only 44% of those who live in large towns agree.")
90 FLASH According to the socio-demographic data: People in the age band (61%) are the most likely to think that the introduction of the euro will lead to a loss of national identity, while those aged over 55 (42%) are the least likely. While 51% of people who live in rural villages fear a loss of national identity, only 44% of those who live in large towns agree. 54% of manual workers believe the introduction of the euro will lead to a loss of national identity, but only 45% of employees agree. While 33% of respondents who think the euro will have positive consequences for them personally agree that the introduction of the euro will lead to a loss of national identity, 60% of those who expect it to have negative personal consequences say this. Of those in favour of the euro, only 32% say its introduction will lead to a loss of national identity. But 63% of people who are against the euro think a loss of national identity will result. 89
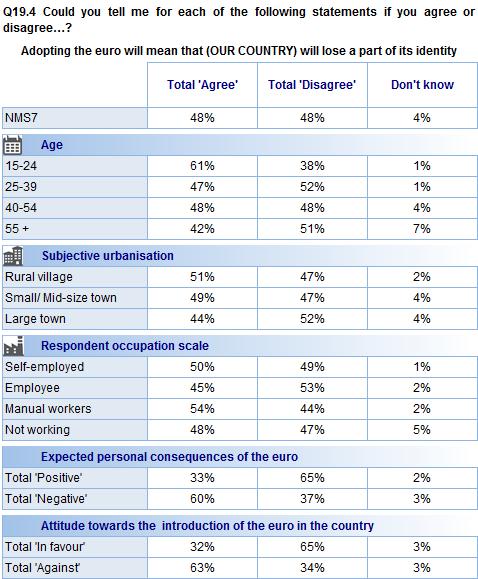
91 FLASH 90

92 FLASH 4.4. Control over a nation s economic policy - The number of respondents who think the euro s introduction will spell a loss of control over economic policy has reached an all-time high - The number of respondents who agree that adopting the euro will result in their country losing control over its economic policy has risen to 45%, up from the previous high of 43% in The level of concern on this issue jumped from 34% in May 2011 to 43% in November 2011 and, judging by the latest result, has not yet stabilised. However, for the time being a majority of people (49%) continue to disagree that adopting the euro will mean a loss of control over economic policy. The number of respondents who think adopting the euro will mean a loss of control over economic policy ranges from 63% in Latvia to 36% in Hungary. A majority of people agree with this statement in three countries: the Czech Republic, Latvia and Romania. Since 2012, the level of agreement has increased in Latvia (63%, +6) and Poland (44%, +4), though it declined somewhat in Bulgaria (43%, -3). 91
 are the least likely to agree that this could happen.")
93 FLASH According to the socio-demographic data: year-olds (50%) are the most likely to worry that introducing the euro will cause their country to lose economic control; people aged 55 and over (40%) are the least likely to agree that this could happen. Only 29% of respondents who think the euro will have positive consequences for their country agree that adopting the euro will lead to a loss of control over economic policy, whereas 58% of those who expect it to have negative consequences agree. Among those in favour of the euro, only 30% say its introduction will lead to a loss of control over economic policy. But 58% of people who are against the euro foresee a loss of economic control. 92
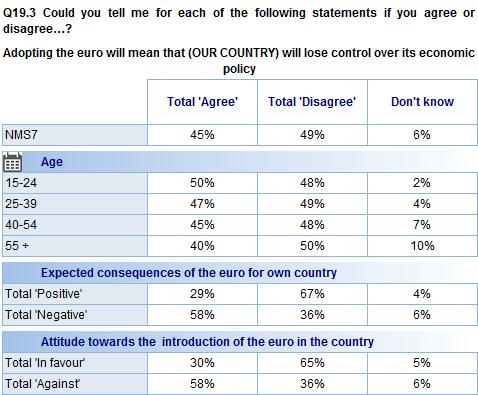
94 FLASH 93
Introduction of the euro in the new Member States. Analytical Report
 Flash Eurobarometer 270 The Gallup Organization Flash Eurobarometer European Commission Introduction of the euro in the new Member States Fieldwork: May 2009 This survey was requested by Directorate General
Introduction of the euro in the New Member States. Analytical Report
 Flash Eurobarometer European Commission Introduction of the euro in the New Member States Analytical Report Fieldwork: March 31 April 5 2006 Publication: June 2006 Flash Eurobarometer 183 Gallup Europe
The European emergency number 112
 Flash Eurobarometer The European emergency number 112 REPORT Fieldwork: December 2011 Publication: February 2012 Flash Eurobarometer TNS political & social This survey has been requested by the Directorate-General
EUROPEANS ATTITUDES TOWARDS SECURITY
 Special Eurobarometer 432 EUROPEANS ATTITUDES TOWARDS SECURITY REPORT Fieldwork: March 2015 Publication: April 2015 This survey has been requested by the European Commission, Directorate-General for Migration
INTERNAL SECURITY. Publication: November 2011
 Special Eurobarometer 371 European Commission INTERNAL SECURITY REPORT Special Eurobarometer 371 / Wave TNS opinion & social Fieldwork: June 2011 Publication: November 2011 This survey has been requested
EUROPEAN UNION CITIZENSHIP
 Flash Eurobarometer EUROPEAN UNION CITIZENSHIP REPORT Fieldwork: November 2012 Publication: February 2013 This survey has been requested by the European Commission, Directorate-General Justice and co-ordinated
EU DEVELOPMENT AID AND THE MILLENNIUM DEVELOPMENT GOALS
 Special Eurobarometer 405 EU DEVELOPMENT AID AND THE MILLENNIUM DEVELOPMENT GOALS REPORT Fieldwork: May - June 2013 Publication: November 2013 This survey has been requested by the European Commission,
CITIZENS AWARENESS AND PERCEPTIONS OF EU REGIONAL POLICY
 Flash Eurobarometer CITIZENS AWARENESS AND PERCEPTIONS OF EU REGIONAL POLICY REPORT Fieldwork: June 2015 Publication: September 2015 This survey has been requested by the European Commission, Directorate-General
Special Eurobarometer 461. Report. Designing Europe s future:
 Designing Europe s future: Trust in institutions Globalisation Support for the euro, opinions about free trade and solidarity Fieldwork Survey requested by the European Commission, Directorate-General
Flash Eurobarometer 430. Summary. European Union Citizenship
 European Union Citizenship Survey requested by the European Commission, Directorate-General for Justice and Consumers and co-ordinated by the Directorate-General for Communication This document does not
Flash Eurobarometer 430. Report. European Union Citizenship
 European Union Citizenship Survey requested by the European Commission, Directorate-General for Justice and Consumers and co-ordinated by the Directorate-General for Communication This document does not
Special Eurobarometer 440. Report. Europeans, Agriculture and the CAP
 Survey requested by the European Commission, Directorate-General for Agriculture and Rural Development and co-ordinated by the Directorate-General for Communication This document does not represent the
The European Emergency Number 112. Analytical report
 Flash Eurobarometer 314 The Gallup Organization Gallup 2 Flash Eurobarometer N o 189a EU communication and the citizens Flash Eurobarometer European Commission The European Emergency Number 112 Analytical
Flash Eurobarometer 364 ELECTORAL RIGHTS REPORT
 Flash Eurobarometer ELECTORAL RIGHTS REPORT Fieldwork: November 2012 Publication: March 2013 This survey has been requested by the European Commission, Directorate-General Justice and co-ordinated by Directorate-General
Special Eurobarometer 455
 EU Citizens views on development, cooperation and November December 2016 Survey conducted by TNS opinion & social at the request of the European Commission, Directorate-General for International Cooperation
Flash Eurobarometer 431. Report. Electoral Rights
 Electoral Rights Survey requested by the European Commission, Directorate-General for Justice and Consumers and co-ordinated by the Directorate-General for Communication This document does not represent
Special Eurobarometer 467. Report. Future of Europe. Social issues
 Future of Europe Social issues Fieldwork Publication November 2017 Survey requested by the European Commission, Directorate-General for Communication and co-ordinated by the Directorate- General for Communication
Flash Eurobarometer 429. Summary. The euro area
 LOGO CE_Vertical_EN_NEG_quadri rouge Summary Survey requested by the European Commission, Directorate-General for Economic and Financial Affairs and co-ordinated by the Directorate-General for Communication
Special Eurobarometer 464b. Report
 Europeans attitudes towards security Survey requested by the European Commission, Directorate-General for Migration and Home Affairs and co-ordinated by the Directorate-General for Communication This document
The Rights of the Child. Analytical report
 Flash Eurobarometer 273 The Gallup Organisation Analytical Report Flash EB N o 251 Public attitudes and perceptions in the euro area Flash Eurobarometer European Commission The Rights of the Child Analytical
EUROPEAN YOUTH: PARTICIPATION IN DEMOCRATIC LIFE
 Flash Eurobarometer 375 EUROPEAN YOUTH: PARTICIPATION IN DEMOCRATIC LIFE SUMMARY Fieldwork: April 2013 Publication: May 2013 This survey has been requested by the European Commission, Directorate-General
MEDIA USE IN THE EUROPEAN UNION
 Standard Eurobarometer 76 Autumn 2011 MEDIA USE IN THE EUROPEAN UNION REPORT Fieldwork: November 2011 Publication: March 2012 This survey has been requested and co-ordinated by Directorate-General for
PUBLIC PERCEPTIONS OF SCIENCE, RESEARCH AND INNOVATION
 Special Eurobarometer 419 PUBLIC PERCEPTIONS OF SCIENCE, RESEARCH AND INNOVATION SUMMARY Fieldwork: June 2014 Publication: October 2014 This survey has been requested by the European Commission, Directorate-General
Standard Eurobarometer 89 Spring Report. European citizenship
 European citizenship Fieldwork March 2018 Survey requested and co-ordinated by the European Commission, Directorate-General for Communication This document does not represent the point of view of the European
Special Eurobarometer 469. Report
 Integration of immigrants in the European Union Survey requested by the European Commission, Directorate-General for Migration and Home Affairs and co-ordinated by the Directorate-General for Communication
EUROBAROMETER The European Union today and tomorrow. Fieldwork: October - November 2008 Publication: June 2010
 EUROBAROMETER 66 Standard Eurobarometer Report European Commission EUROBAROMETER 70 3. The European Union today and tomorrow Fieldwork: October - November 2008 Publication: June 2010 Standard Eurobarometer
EUROPEAN CITIZENSHIP
 Standard Eurobarometer 78 Autumn 2012 EUROPEAN CITIZENSHIP REPORT Fieldwork: November 2012 This survey has been requested and co-ordinated by the European Commission, Directorate-General for Communication.
Employment and Social Policy
 Special Eurobarometer 77 European Commission Employment and Social Policy SUMMARY Special Eurobarometer 77 / Wave EB76. TNS opinion & social Fieldwork: September- October 0 Publication: November 0 This
Special Eurobarometer 428 GENDER EQUALITY SUMMARY
 Special Eurobarometer 428 GENDER EQUALITY SUMMARY Fieldwork: November-December 2014 Publication: March 2015 This survey has been requested by the European Commission, Directorate-General for Justice and
Citizens awareness and perceptions of EU regional policy
 Flash Eurobarometer 298 The Gallup Organization Flash Eurobarometer European Commission Citizens awareness and perceptions of EU regional policy Fieldwork: June 1 Publication: October 1 This survey was
Special Eurobarometer 470. Summary. Corruption
 Corruption Survey requested by the European Commission, Directorate-General for Migration and Home Affairs and co-ordinated by the Directorate-General for Communication This document does not represent
CITIZENS AWARENESS AND PERCEPTIONS OF EU REGIONAL POLICY
 Flash Eurobarometer 384 CITIZENS AWARENESS AND PERCEPTIONS OF EU REGIONAL POLICY SUMMARY Fieldwork: September 2013 Publication: December 2013 This survey has been requested by the European Commission,
Introduction of the euro in the New Member States
 Flash Eurobarometer Commission Introduction of the euro in the New Member States Summary Fieldwork: March 31 April 5 2006 Publication: June 2006 Flash Eurobarometer 183 The Gallup Organization Hungary
Flash Eurobarometer 431. Summary. Electoral Rights
 Survey requested by the European Commission, Directorate-General for Justice and Consumers and co-ordinated by the Directorate-General for Communication This document does not represent the point of view
PATIENTS RIGHTS IN CROSS-BORDER HEALTHCARE IN THE EUROPEAN UNION
 Special Eurobarometer 425 PATIENTS RIGHTS IN CROSS-BORDER HEALTHCARE IN THE EUROPEAN UNION SUMMARY Fieldwork: October 2014 Publication: May 2015 This survey has been requested by the European Commission,
ATTITUDES OF EUROPEAN CITIZENS TOWARDS THE ENVIRONMENT
 Special Eurobarometer 416 ATTITUDES OF EUROPEAN CITIZENS TOWARDS THE ENVIRONMENT SUMMARY Fieldwork: April - May 2014 Publication: September 2014 This survey has been requested by the European Commission,
The European Emergency Number 112
 Gallup 2 Flash Eurobarometer N o 189a EU communication and the citizens Flash Eurobarometer European Commission The European Emergency Number 112 Summary Fieldwork: January 2008 Publication: February 2008
Flash Eurobarometer 408 EUROPEAN YOUTH SUMMARY
 Flash Eurobarometer 408 EUROPEAN YOUTH SUMMARY Fieldwork: December 2014 Publication: April 2015 This survey has been requested by the European Commission, Directorate-General for Education and Culture
EUROPEANS, THE EUROPEAN UNION AND THE CRISIS
 Standard Eurobarometer 80 Autumn 2013 EUROPEANS, THE EUROPEAN UNION AND THE CRISIS REPORT Fieldwork: November 2013 This survey has been requested and co-ordinated by the European Commission, Directorate-General
PUBLIC OPINION IN THE EUROPEAN UNION
 Standard Eurobarometer 81 Spring 2014 PUBLIC OPINION IN THE EUROPEAN UNION FIRST RESULTS Fieldwork: June 2014 Publication: July 2014 This survey has been requested and co-ordinated by the European Commission,
Flash Eurobarometer 405 THE EURO AREA SUMMARY
 Flash Eurobarometer 405 THE EURO AREA SUMMARY Fieldwork: October 2014 Publication: October 2014 This survey has been requested by the European Commission, Directorate-General for Economic and Financial
Standard Eurobarometer 88 Autumn Report. Media use in the European Union
 Media use in the European Union Fieldwork November 2017 Survey requested and co-ordinated by the European Commission, Directorate-General for Communication This document does not represent the point of
Making a difference in the world: Europeans and the future of development aid
 Special Eurobarometer 375 European Commission Making a difference in the world: Europeans and the future of development aid REPORT Special Eurobarometer 375 / Wave 7.61 TNS opinion & social Fieldwork:
Introduction of the euro in the New Member States
 Gallup Flash EB N o 191 Introduction of the euro in the New Member States Flash Eurobarometer European Commission Introduction of the euro in the New Member States Summary Fieldwork: Publication: November
EUROBAROMETER 72 PUBLIC OPINION IN THE EUROPEAN UNION. Autumn The survey was requested and coordinated by Directorate-General Communication
 Standard Eurobarometer EUROBAROMETER 72 PUBLIC OPINION IN THE EUROPEAN UNION Autumn 2009 NATIONAL REPO Standard Eurobarometer 72 / Autumn 2009 TNS Opinion & Social UNITED KINGDOM The survey was requested
Special Eurobarometer 471. Summary
 Fairness, inequality and intergenerational mobility Survey requested by the European Commission, Joint Research Centre and co-ordinated by the Directorate-General for Communication This document does not
EUROPEAN CITIZENSHIP
 Standard Eurobarometer 81 Spring 2014 EUROPEAN CITIZENSHIP REPORT Fieldwork: June 2014 This survey has been requested and co-ordinated by the European Commission, Directorate-General for Communication.
EUROPEAN CITIZENSHIP
 Standard Eurobarometer 77 Spring 2012 EUROPEAN CITIZENSHIP REPORT Fieldwork: May 2012 This survey has been requested and co-ordinated by the European Commission, Directorate-General for Communication.
EUROPEAN CITIZENSHIP
 Standard Eurobarometer 80 Autumn 2013 EUROPEAN CITIZENSHIP REPORT Fieldwork: November 2013 This survey has been requested and co-ordinated by the European Commission, Directorate-General for Communication.
The Rights of the Child. Analytical report
 The Gallup Organization Flash EB N o 187 2006 Innobarometer on Clusters Flash Eurobarometer European Commission The Rights of the Child Analytical report Fieldwork: February 2008 Report: April 2008 Flash
Firearms in the European Union
 Flash Eurobarometer 383 Firearms in the European Union SUMMARY Fieldwork: September 2013 Publication: October 2013 This survey has been requested by the European Commission, Directorate-General for Home
Women in the EU. Fieldwork : February-March 2011 Publication: June Special Eurobarometer / Wave 75.1 TNS Opinion & Social EUROPEAN PARLIAMENT
 EUROPEAN PARLIAMENT Women in the EU Eurobaromètre Spécial / Vague 74.3 TNS Opinion & Social Fieldwork : February-March 2011 Publication: June 2011 Special Eurobarometer / Wave 75.1 TNS Opinion & Social
A. The image of the European Union B. The image of the European Parliament... 10
 Directorate General for Communication Direction C Relations with citizens PUBLIC OPINION MONITORING UNIT EUROPEAN ELECTIONS 2009 25/05/2009 Pre electoral survey First wave First results: European average
Standard Eurobarometer 89 Spring Report. Europeans and the future of Europe
 Fieldwork March 2018 Survey requested and co-ordinated by the European Commission, Directorate-General for Communication This document does not represent the point of view of the European Commission. The
Electoral rights of EU citizens
 Flash Eurobarometer 292 The Gallup Organization Flash EB No 292 Electoral Rights Flash Eurobarometer European Commission Electoral rights of EU citizens Fieldwork: March 2010 Publication: October 2010
WOMEN IN DECISION-MAKING POSITIONS
 Special Eurobarometer 376 WOMEN IN DECISION-MAKING POSITIONS SUMMARY Fieldwork: September 2011 Publication: March 2012 This survey has been requested by Directorate-General Justice and co-ordinated by
Views on European Union Enlargement
 Flash Eurobarometer 257 The Gallup Organization Flash EB N o 255 Dual circulation period, Slovakia Flash Eurobarometer European Commission Views on European Union Enlargement Analytical Report Fieldwork:
Electoral rights of EU citizens. Analytical Report
 Flash Eurobarometer 292 The Gallup Organization Flash EB No 292 Electoral Rights Analytical Report Flash Eurobarometer European Commission Electoral rights of EU citizens Analytical Report Fieldwork: March
EUROBAROMETER 68 AUTUMN 2007 NATIONAL REPORT UNITED KINGDOM. Standard Eurobarometer PUBLIC OPINION IN THE EUROPEAN UNION
 Standard Eurobarometer European Commission EUROBAROMETER 68 PUBLIC OPINION IN THE EUROPEAN UNION AUTUMN 2007 Standard Eurobarometer 68 / Autumn 2007 TNS Opinion & Social NATIONAL REPORT UNITED KINGDOM
Europeans and the crisis
 EUROPEAN PARLIAMENT Europeans and the crisis Report Fieldwork: August September 2010 Publication: November 2010 Special Eurobarometer/Wave 74.1 TNS Opinion & Social Eurobaromètre spécial / Vague 74.1 TNS
Europeans attitudes towards climate change
 Special Eurobarometer 313 EUROPEAN PARLIAMENT EUROPEAN COMMISSION Europeans attitudes towards climate change Special Eurobarometer 313 / Wave 71.1 TNS Opinion & Social Report Fieldwork: January - February
Flash Eurobarometer 337 TNS political &social. This document of the authors.
 Flash Eurobarometer Croatia and the European Union REPORT Fieldwork: November 2011 Publication: February 2012 Flash Eurobarometer TNS political &social This survey has been requested by the Directorate-General
Young people and science. Analytical report
 Flash Eurobarometer 239 The Gallup Organization The Gallup Organization Flash EB N o 187 2006 Innobarometer on Clusters Flash Eurobarometer European Commission Young people and science Analytical report
Special Eurobarometer 474. Summary. Europeans perceptions of the Schengen Area
 Summary Europeans perceptions of the Schengen Area Survey requested by the European Commission, Directorate-General for Migration and Home Affairs and co-ordinated by the Directorate-General for Communication
EUROPEAN CITIZENSHIP
 Standard Eurobarometer 82 Autumn 2014 EUROPEAN CITIZENSHIP REPORT Fieldwork: November 2014 This survey has been requested and co-ordinated by the European Commission, Directorate-General for Communication.
PUBLIC OPINION IN THE EUROPEAN UNION
 Standard Eurobarometer 77 Spring 2012 PUBLIC OPINION IN THE EUROPEAN UNION REPORT Fieldwork: May 2012 This survey has been requested and co-ordinated by the European Commission, Directorate-General for
Data Protection in the European Union. Data controllers perceptions. Analytical Report
 Gallup Flash Eurobarometer N o 189a EU communication and the citizens Flash Eurobarometer European Commission Data Protection in the European Union Data controllers perceptions Analytical Report Fieldwork:
Fieldwork: January 2007 Report: April 2007
 Flash Eurobarometer European Commission Entrepreneurship Survey of the EU ( Member States), United States, Iceland and Norway Summary Fieldwork: January 00 Report: April 00 Flash Eurobarometer The Gallup
Special Eurobarometer 468. Report. Attitudes of European citizens towards the environment
 Attitudes of European citizens towards the environment Fieldwork September- Publication November 2017 Survey requested by the European Commission, Directorate-General for Environment and co-ordinated by
Euro Introduction in Cyprus and Malta Ex-Post Citizen Survey
 Gallup Flash Eurobarometer N o 189a EU communication and the citizens Flash Eurobarometer European Commission Euro Introduction in Cyprus and Malta Ex-Post Citizen Survey Summary Fieldwork: February 2008
The. Special Eurobarometer 368. Special Eurobarometer 368 / Wave EB 75.3 TNS opinion & social. This document. of the authors.
 Special Eurobarometer 368 European Commission The Common Agricultural Policy REPORT Special Eurobarometer 368 / Wave TNS opinion & social Fieldwork: May 2011 Publication: September 2011 This survey has
European Parliament Eurobarometer (EB79.5) ONE YEAR TO GO UNTIL THE 2014 EUROPEAN ELECTIONS Institutional Part ANALYTICAL OVERVIEW
 ONE YEAR TO GO UNTIL THE 2014 EUROPEAN ELECTIONS Institutional Part ANALYTICAL OVERVIEW") Directorate-General for Communication Public Opinion Monitoring Unit Brussels, 21 August 2013. European Parliament Eurobarometer (EB79.5) ONE YEAR TO GO UNTIL THE 2014 EUROPEAN ELECTIONS Institutional
Directorate-General for Communication Public Opinion Monitoring Unit Brussels, 21 August 2013. European Parliament Eurobarometer (EB79.5) ONE YEAR TO GO UNTIL THE 2014 EUROPEAN ELECTIONS Institutional
Europeans attitudes towards climate change
 Special Eurobarometer European Commission Europeans attitudes towards climate change Fieldwork: August - September 2009 Publication: November 2009 Special Eurobarometer 322 / Wave 72.1 TNS Opinion & Social
Standard Eurobarometer 89 Spring Public opinion in the European Union
 Public opinion in the European Union Fieldwork March 2018 Survey requested and co-ordinated by the European Commission, Directorate-General for Communication This document does not represent the point
SPECIAL EUROBAROMETER 360
 Special Eurobarometer European Commission SPECIAL EUROBAROMETER 360 Consumer understanding of labels and the safe use of chemicals REPORT Special Eurobarometer 360 / Wave TNS Opinion & Social Fieldwork:
Views on European Union enlargement
 Flash Eurobarometer 257 The Gallup Organization Flash EB N o 257 Views on European Union enlargement Flash Eurobarometer European Commission Views on European Union enlargement Fieldwork: February 2009
Directorate General for Communication Direction C - Relations avec les citoyens PUBLIC OPINION MONITORING UNIT 27 March 2009
 Directorate General for Communication Direction C - Relations avec les citoyens PUBLIC OPINION MONITORING UNIT 27 March 2009 EUROPEANS AND THE ECONOMIC CRISIS Standard Eurobarometer (EB 71) Population:
Standard Eurobarometer 85. Public opinion in the European Union
 Public opinion in the European Union Fieldwork: May 2016 Survey conducted by TNS opinion & social at the request of the European Commission, Directorate-General for Communication Survey coordinated by
Iceland and the European Union Wave 2. Analytical report
 Flash Eurobarometer European Commission Iceland and the European Union Wave 2 Analytical report Fieldwork: August 2011 Report: October 2011 Flash Eurobarometer 327 The Gallup Organization This survey was
Data Protection in the European Union. Citizens perceptions. Analytical Report
 Gallup Flash Eurobarometer N o 189a EU communication and the citizens Flash Eurobarometer European Commission Data Protection in the European Union Citizens perceptions Analytical Report Fieldwork: January
PUBLIC OPINION IN THE EUROPEAN UNION
 Standard Eurobarometer 79 Spring 2013 PUBLIC OPINION IN THE EUROPEAN UNION FIRST RESULTS Fieldwork: May 2013 Publication: July 2013 This survey has been requested and co-ordinated by the European Commission,
Post-electoral survey 2009
 Special Eurobarometer EUROPEAN PARLIAMENT European Commission Post-electoral survey 2009 Report Fieldwork: June-July 2009 Publication: November 2009 Special Eurobarometer 320/ Wave TNS opinion & social
SPECIAL EUROBAROMETER 365
 Special Eurobarometer European Commission SPECIAL EUROBAROMETER 365 Attitudes of European citizens towards the environment SUMMARY Fieldwork: April May 2011 Special Eurobarometer 365 / Wave 75.2 TNS Opinion
EUROBAROMETER 62 PUBLIC OPINION IN THE EUROPEAN UNION
 Standard Eurobarometer European Commission EUROBAROMETER 6 PUBLIC OPINION IN THE EUROPEAN UNION AUTUMN 004 Standard Eurobarometer 6 / Autumn 004 TNS Opinion & Social NATIONAL REPORT EXECUTIVE SUMMARY ROMANIA
EUROBAROMETER 69 SPRING 2008 NATIONAL REPORT UNITED KINGDOM. Standard Eurobarometer PUBLIC OPINION IN THE EUROPEAN UNION
 Standard Eurobarometer 69 / Spring 2008 TNS Opinion & Social Standard Eurobarometer European Commission EUROBAROMETER 69 PUBLIC OPINION IN THE EUROPEAN UNION SPRING 2008 NATIONAL REPORT UNITED KINGDOM
EUROBAROMETER 73 FIRST RESULTS
 Standard Eurobarometer European Commission EUROBAROMETER 73 PUBLIC OPINION IN THE EUROPEAN UNION FIRST RESULTS Fieldwork: May 2010 Publication: August 2010 Standard Eurobarometer 73/ Spring 2010 - TNS
Special Eurobarometer 469
 Summary Integration of immigrants in the European Union Survey requested by the European Commission, Directorate-General for Migration and Home Affairs and co-ordinated by the Directorate-General for Communication
Fieldwork: November December 2010 Publication: June
 Special Eurobarometer European Commission SPECIAL EUROBAROMETER 359 Attitudes on Data Protection and Electronic Identity in the European Union REPORT Fieldwork: November December 2010 Publication: June
Fieldwork November - December 2009 Publication June 2010
 Special Eurobarometer 337 European Commission Geographical and labour market mobility Summary Fieldwork November - December 2009 Publication June 2010 Special Eurobarometer 337 / Wave 72.5 TNS Opinion
of the European Commission. Communication. This document of the authors. Standard Eurobarometer 75 / Spring 2011 TNS opinion & social
 Standard Eurobarometer European Commission EUROBAROMETER 75 SPRING 2011 Europe 2020 REPORT Standard Eurobarometer 75 / Spring 2011 TNS opinion & social Fieldwork: May 2011 Publication: August 2011 This
European Parliament Eurobarometer (EB79.5) ONE YEAR TO GO TO THE 2014 EUROPEAN ELECTIONS Economic and social part DETAILED ANALYSIS
 ONE YEAR TO GO TO THE 2014 EUROPEAN ELECTIONS Economic and social part DETAILED ANALYSIS") Directorate-General for Communication Public Opinion Monitoring Unit Brussels, 18 October 2013 European Parliament Eurobarometer (EB79.5) ONE YEAR TO GO TO THE 2014 EUROPEAN ELECTIONS Economic and social
Directorate-General for Communication Public Opinion Monitoring Unit Brussels, 18 October 2013 European Parliament Eurobarometer (EB79.5) ONE YEAR TO GO TO THE 2014 EUROPEAN ELECTIONS Economic and social
Iceland and the European Union
 Flash Eurobarometer European Commission Iceland and the European Union Fieldwork: December 2010 Report: March 2011 Flash Eurobarometer 302 The Gallup Organization This survey was requested by the Directorate-General
CULTURAL ACCESS AND PARTICIPATION
 Special Eurobarometer 399 CULTURAL ACCESS AND PARTICIPATION SUMMARY Fieldwork: April May 2013 Publication: November 2013 This survey has been requested by the European Commission, Directorate-General for
Special Eurobarometer 476. Summary. EU citizens and development cooperation
 EU citizens and development cooperation Survey requested by the European Commission, Directorate-General for International Cooperation and Development and co-ordinated by the Directorate-General for Communication
PUBLIC OPINION IN THE EUROPEAN UNION
 Standard Eurobarometer 77 Spring 2012 PUBLIC OPINION IN THE EUROPEAN UNION FIRST RESULTS Fieldwork: May 2012 Publication: July 2012 This survey has been requested and co-ordinated by the European Commission,
Cross-border health services in the EU. Analytical report
 Flash Eurobarometer European Commission Cross-border health services in the EU Analytical report Fieldwork: May 2007 Report: June 2007 Flash Eurobarometer 210 This survey was requested by Health and Consumer
Flash Eurobarometer 354. Entrepreneurship COUNTRY REPORT GREECE
 Flash Eurobarometer 354 Entrepreneurship COUNTRY REPORT GREECE Fieldwork: June 2012 This survey has been requested by the European Commission, Directorate-General Enterprise and Industry and co-ordinated
ENTREPRENEURSHIP IN THE EU AND BEYOND
 Flash Eurobarometer 354 ENTREPRENEURSHIP IN THE EU AND BEYOND COUNTRY REPORT JAPAN Fieldwork: July 2012 This survey has been requested by the European Commission, Directorate-General Enterprise and Industry
of the European Commission. and the Communication. This document of the authors. Standard Eurobarometer 75 / Spring 2011 TNS opinion & social
 Standard Eurobarometer European Commission EUROBAROMETER 75 SPRING 2011 Europeans, the European Union crisis and the REPORT Standard Eurobarometer 75 / Spring 2011 TNS opinion & social Fieldwork: May 2011
Standard Eurobarometer 77 Spring 2012 EUROPE 2020 REPORT
 Standard Eurobarometer 77 Spring 2012 EUROPE 2020 REPORT Fieldwork: May 2012 This survey has been requested and co-ordinated by the European Commission, Directorate-General for Communication. http://ec.europa.eu/public_opinion/index_en.htm