RESULTS AND DISCUSSION
|
|
|
- Homer Powers
- 5 years ago
- Views:
Transcription
1 67 CHAPTER IV RESULTS AND DISCUSSION The results of the present study, "Rural Labour Out - Migration in Theni District: Determinants and Economic Impact among Migrant Workers in Cardamom Estates" has been discussed under the following heads: 1. Socio- Economic Background of the Sample Migrants 2. Determinants of Migration 3. Work profile at the Destination Place 4. Economic Impact of Migration on the Respondents 5. Details of the Migrants' Visit to their Native Place 6. Remittance Behaviour of the Migrants 7. Infrastructural Facilities in the Destination Place 1. SOCIO- ECONOMIC BACKGROUND OF THE SAMPLE MIGRANTS 1) Socio- Economic Background of the Respondents In the light of ongoing structural changes and consequent changing contours of rural economy as a whole, the nature and pattern of migration also has been changing overtime. Accordingly, the concept of migration now connotes much wider dimension than what has been conceptualized conventionally (Karan, 2003). Migration is a selective process in which individuals with certain characteristics tend to migrate more than others (Bhatia, 1992). For example, when the better educated, the better skilled and the economically better off population migrate, and the implications will be different as compared to a situation where the poorest and illiterate migrate. Therefore, it becomes imperative to broadly identify who in a society shows higher propensity to migrate than others (Sekhar, 1993). In India, especially in rural areas, the social status and identification of an individual, starts from the household to which the individual belongs. This is mostly determined by the personal characteristics of the migrant's
2 68 households and so it is necessary to discuss the individual characteristics of the households. In this section, a brief account of socio- economic characteristics of the sample migrants has been presented. Presentation of these socio-economic characteristics of migrants helps in understanding the differences in their socio- economic background. Age Groups of the Migrants Age is the key variable in understanding the socio- economic status of an individual. Biologically, age signifies the physical and mental maturity of an individual. In terms of occupations, age has got some more significant role to play (Lamani, 2009). In a view of this, all the aspects of the present research are analysed on the basis of three classifications of age groups of the migrants' namely, Group I, Group II and Group III. Group I consists of migrants in the age group of below 30 years, group II consists of migrants in the age between years and group III consists of migrants in the age group of above 45 years. It is to be mentioned that the selected respondents were from minimum of 18 years of age to maximum of 55 years. Table 11 shows the number of sample migrants belonging to different age groups. TABLE 11 DISTRIBUTION OF MIGRANTS BY AGE GROUP S.No Age Group Number Percentage 1. Group I Group II Group III Total Source: Field Survey It can be inferred from Table 11 that all the migrants in different age groups are more or less equally distributed. It is to be mentioned that the majority of the
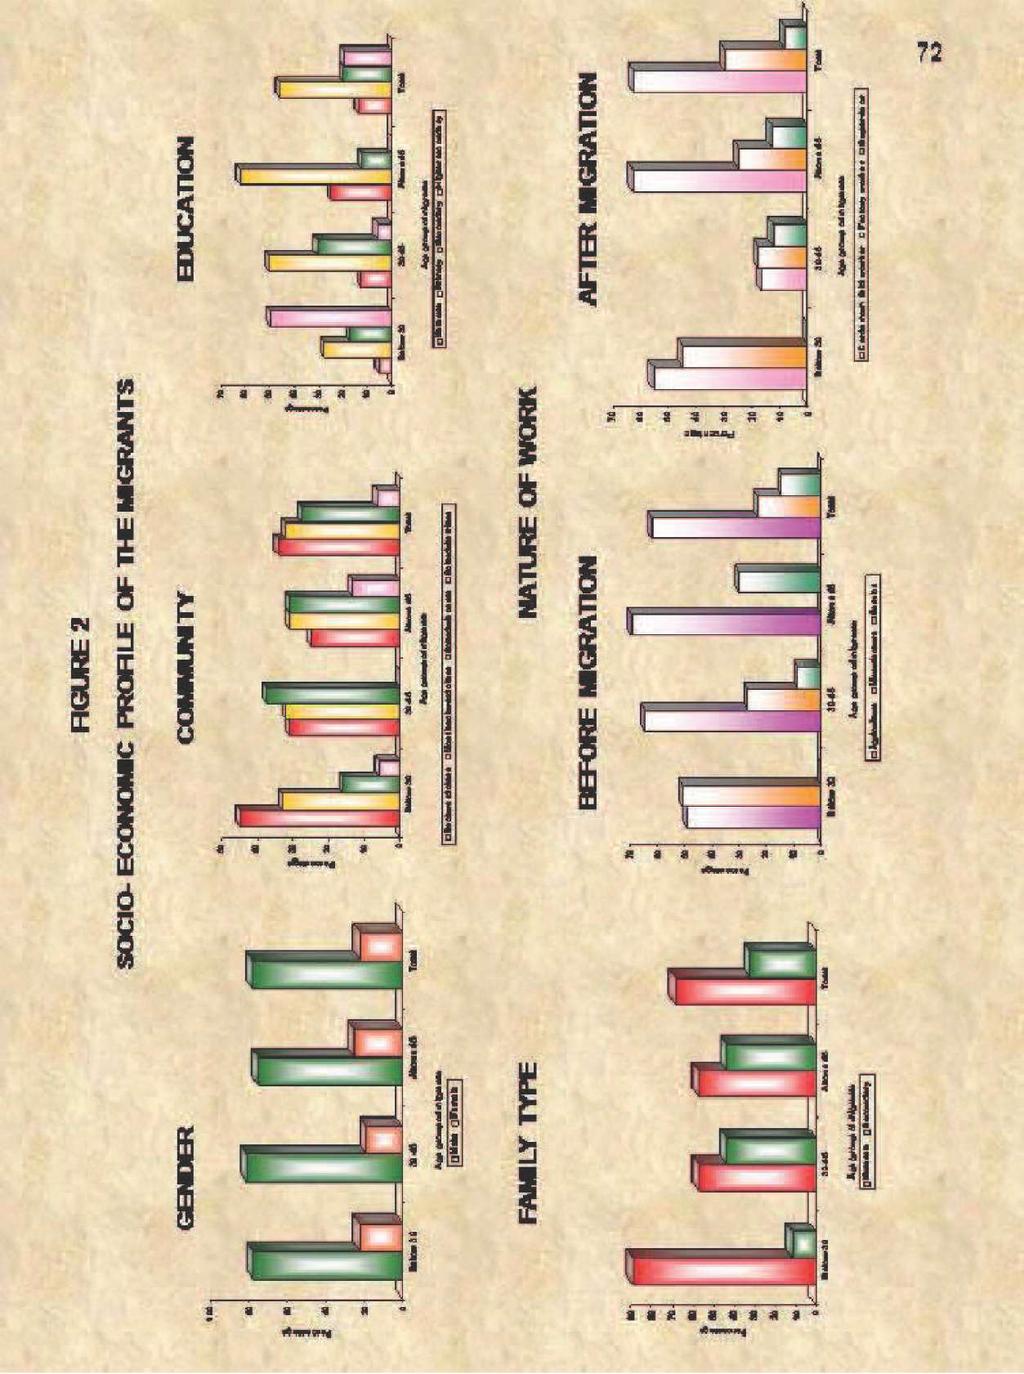
3 69 selected migrants were in younger age group (below 45 years) during the study period. This finding is in line with the view of Sjaastad's Human Investment Theory (1962). Therefore, one could infer that they had taken migration at their earlier age. Though the migrants were found equally distributed in all the age groups, it was observed that their mindset and approach were different towards migration as they had different types of experience in their pre-migration activities. The socio- economic profile of the sample migrants are presented in Table 12 and its graphical representation is given in Figure 2. TABLE 12 SOCIO-ECONOMIC PROFILE OF THE SAMPLE MIGRANTS (In number) S. Age Group of Migrants Particulars No Group I Group II Group III Total 1. Gender Male (77.56) (81.08) (75.14) (77.93) Female (22.44) (18.92) (24.86) (22.07) Total (100) (100) (100) (100) 2. Religion Hindus (94.63) (81.62) (86.74) (87.91) Muslims (5.37) (0) (6.63) (4.03) Christians (0) (18.38) (6.63) (8.06) Total (100) (100) (100) (100) 3. Community Backward Class 92 (44.88) 57 (30.81) 45 (24.86) 194 (33.98) Most Backward (33.17) (31.89) (30.94) (32.05) Class Scheduled Castes (16.00) (37.30) (30.94) (27.67) Scheduled Tribes (5.85) (0) (13.26) (6.30) Total (100) (100) (100) (100)
4 70 4. Education Illiterate (5.37) (12.97) (24.86) (14.01) Primary 57 (27.80) 93 (50.27) 113 (62.43) 263 (46.06) Secondary 35 (17.07) 57 (30.81) 23 (12.71) 115 (20.14) Higher Secondary 102 (49.76) 11 (5.95) 0 (0) 113 (19.79) Total (100) (100) (100) (100) 5. Marital Un married Status (33.66) (5.41) (0) (13.84) Married (66.34) (94.59) (87.85) (82.31) Widow (0) (0) (12.15) (3.85) Total (100) (100) (100) (100) 6. Family Size Below (22.93) (12.97) (6.63) (14.54) (49.76) (62.70) (37.57) (50.09) Above (27.31) (24.33) (55.80) (35.37) Total (100) (100) (100) (100) 7. Family Type Joint 182 (88.78) 105 (56.76) 103 (56.90) 390 (68.30) Nuclear (11.22) (43.24) (43.10) (31.70) Total (100) (100) (100) (100) 8. Employment Status- Unemployed 93 (45.37) 58 (31.35) 33 (18.23) 184 (32.22) Before migration Employed 112 (54.63) 127 (68.65) 148 (81.77) 387 (67.78) Total (100) (100) (100) (100)
5 71 9. Nature of Work- Before migration Agriculture Manufacture 55 (49.11) 57 (50.90) Service 0 (0) Total 112 (100) 10. Nature of Cardamom 113 Work- After field work (55.12) migration Factory work 92 (44.88) Supervisor of 0 cardamom field (0) Total 205 (100) 82 (64.57) 34 (26.77) 11 (8.66) 127 (100) 129 (69.73) 33 (17.84) 23 (12.43) 185 (100) 103 (69.60) 0 (0) 45 (30.41) 148 (100) 113 (62.43) 45 (24.86) 23 (12.71) 181 (100) 240 (62.03) 91 (23.51) 56 (14.47) 387 (100) 355 (62.17) 170 (29.77) 46 (8.06) 571 (100) Source: Field Survey Note: Figures in brackets indicate percentages to column total in each variable among different age groups
6 72
7 73 i) Gender-Wise Distribution of the Migrants In the existing literature, migration is generally characterized as male dominated phenomenon as the proportion of males in any migration is much higher than that of women. Although a considerable proportion of women migrants are dependent of the male workers, it is erroneous to think that all women migrants are housewives. In the absence of employment opportunities for male members, women are found forced to migrate themselves to support the family (Neetha, 2003). A study of Roy (1993) has shown that the proportion of females among migrant workers is substantial in some areas of India. In most of the work related to cardamom field, women are generally more preferable than men. It is clear from Table 12 that the percentage of male migrants is higher in all the classified age groups namely, Group I (77.56 %), Group II (81.08 %) and Group III ( %) migrants. The overall percentage of male migrants was per cent and it was per cent for female migrants. The finding of this study is in accordance with the findings of Neetha (2003) that the selected female migrants migrated to support their family. ii) Religion- Wise Distribution of the Migrants Since the study area comprises of Hindus, Christians and Muslims, it was intended to identify the number of sample migrants in each categories of religion. The religion- wise distribution of sample migrants is presented in Table 12. It can be understood that a majority of the respondents (87.91 %) were Hindus and only a meager percentage were Christians (8.06 %) and Muslims (4.03 %). It is to be noted that none of them belonged to Christians from Group I migrants and Muslims among Group II migrants. iii) Community- Wise Distribution of the Migrants Community is an important indicator of social status in the Indian content. So, it is felt necessary to study the community of the sample households in order to understand the socio- economic status of the respondents in the study area
8 74 (Kumar, 2001). It is clear from Table 12 that among the total respondents, a considerably larger proportion of migrants belonged to Backward Class (33.98 %). A greater proportion of backward class could also be seen among Group I migrants (44.88 %). However, a greater percentage of Group II migrants were Scheduled Caste (37.30 %). Respondents belonging to Most Backward Class and Scheduled Castes were equally distributed among group III migrants (30.94 %). Similar findings were observed by Chand et al. (1998), Srivastava (1998). iv) Education- Wise Distribution of the Migrants Education is a crucial input for development as it enables a person to understand his surroundings and fulfills his economic roles and consequently improves his socio- economic status (Lamani, 2009, Chand et al., 1998). Education is a major facilitating factor of migration. From areas where the number of young educated persons is in excess of supply, they tend to move to areas where there is demand for their services (Zachariah and Rajan, 2001). The overall picture in Table 12 indicates that the higher proportions of migrants were educated up to primary level (46.06 %). The percentage of primary level education was also higher among both Group II (50.27 %) and Group III (62.43 %) of migrants. Among Group I migrants, 50 per cent of them completed their higher secondary education and only a least part of them were illiterates (5.37 %). This finding is in accordance with the findings of Naik et al. (2009), Sidhu et al. (2003), Chand et al. (1998), Srivastava (1998), Santhapparaj, (1998). v) Marital Status of the Migrants As far as India is concerned, marriage is an important practice based on tradition and social values. Marital status of an individual influences the decision to migrate (Misra, 2009). Thus an attempt was made to find out the marital status of the selected migrants. Table 12 reveals that most of the selected migrants were married (82.31 %) among the total of 571 respondents. The finding of the study is similar to that of Chand et al. (1998), Suresh et al. (2007). It is observed from Table that per cent of Group I, per cent of Group II respondents were married. The percentage of widowed (3.85 %) of both male
9 75 and female migrants was very less. The study reveals that most of the sample migrants were married at their younger age and the burden of family responsibilities forced them to migrate. vi) Family Size of the Migrants The general belief is that migrants are mostly from large size households. Migration is positively correlated with family size. For large size households, it is easy to spare members to go outside for work (Sekhar, 1993). The size of the family stands for the number of persons living together in a house hold (Lamani, 2009). To have a clear picture of the varying size of the households in the sample, the respondents' household size are classified in to three groups such as below four, four to five and above five members in the family. Table 12 displays that per cent of the migrants had four to five members, per cent of them have above five members and only per cent of the families had below four members among all the three age groups. This finding is similar to that of Sekhar (1993), Singh and Sharma (1984) which had indicated that a major proportion of the sample migrants in their study had relatively larger family size. vii) Family Type of the Migrants Family considerations play an important role in migration. The underlying objective of migration is maximization of benefits of the entire family, rather than of purely individual benefits (Tripathy and Dash, 1997). Joint family system permits some of the family members to move away for adding to the income of the family (Joshi, 1999). Therefore, an analysis was made to study the type of family of the selected migrants and the result is depicted in Table 12. It is clear that a majority of migrants in all the age groups in the sample villages (68.30 %) were found belonging to joint family system. This is more prevalent among the younger age groups (88.78 %). This is so because many of them had to keep their children with their parents or relatives in their native places in order to give
10 76 better education to them. Suresh et al. (2007) also found in their study that 68 per cent of the respondents had come from joint families. viii) Employment Status of the Migrants- Before Migration The informal process in the economy resulted in the mobilization of new segment of the population in to migration for employment. Recent evidence suggests that with high insecurity in employment coupled with low wages of male members, family migration for employment is becoming increasing in common (Neetha, 2003). In this context, an attempt was made to study the employment status of the selected respondents during their pre- migration period. From Table 12, it is found that per cent of the total sample migrants were employed before their migration. The percentage of unemployment is comparatively less among all the three age groups of migrants namely, per cent in Group I, per cent in Group II and per cent in Group III of migrants respectively. So, it can be concluded that severe unemployment was not a main factor for migration of the respondents in the study area and it was found that the factors such as irregular employment, low wages, lack of irrigational facilities to their cultivable land and indebtedness forced the migrants to leave from their native places. ix) Nature of Work of the Migrants - Before Migration More than 60 per cent of the population in India lives in rural areas depending upon agriculture directly or indirectly. The economic conditions of the agrarian community are not only fluctuating but also not regular in nature. As a result, to improve one's own economic status either they have to leave agriculture or to go too far off places to do non- agricultural profession. This is one of the regular features of Indian society (Naik et al., 2009). Since the study area is also a predominant agricultural area, it is necessary to study the nature of work of the employed respondents before their migration. Table 12 depicts that among 387 employed migrants, per cent were wholly dependent on agriculture for their survival before their migration. This finding supports the view of Mishra and Reddy (2005), Santhapparaj (1998) that the households with agricultural labour as the main occupation are more prone to migration than the
11 77 others. The individual figure of the age groups of Group II and Group III also shows the similar result but it is different in the case of Group I migrants. A majority of them ( %) were engaged in manufacturing sector and none of them were in service sector. x) Nature of Work of the Migrants- After Migration Jobs available in pleasant surrounding would attract more workers than jobs that were disagreeable (Joshi and Padasia, 1991). Cardamom work comprises of three types of work such as cardamom field work, factory work and field supervision. All the three categories of workers usually start their work at 7.30 am and end at 4.00 pm every day. They work for six days a week and they have two months holiday every year. Table 12 depicts the three type of cardamom work of the classified age groups of migrants. About per cent of total migrants were pursuing cardamom field work. The study found that the higher percentage of field work was prevalent among female migrants. The individual figure of each category of age shows that per cent of Group I, per cent of Group II and per cent of Group III migrants were cardamom field workers. The remaining percentage of Group I respondents ( %) were only factory workers and none of them was supervisor. It should be mentioned that the factory work is normally done by the youngsters and supervisor job by the aged and experienced persons. So the fact is also reflected in the study as the percentage of supervisor category was less among Group II (12.43 %) and Group III respondents (12.71%). The following Plate 1, Plate 2 and Plate 3 exhibit the pictorial representation of the nature of work of the migrants in the cardamom estates.

12 78 PLATE 1 CARDAMOM FIELD WORK


13 79 PLATE 2 CARDAMOM FACTORY WORK


14 80 PLATE 3 CARDAMOM FIELD SUPERVISOR
15 81 2) Relationship between the Socio- Economic Variables and the Level of Attitude of the Respondents towards their Migration An attempt was made to evaluate the attitudes of the sample migrants with regard to their migration. In other words, the researcher intended to get the feedback of migrants after they have migrated. The difference in opinion is related with the socio- economic variables of the migrants. Hence, the relationship between the selected socio- economic variables of the migrants and their attitudes towards migration is studied as under: The attitude of the sample migrants towards migration was measured with the help of an attitude scale having 24 explanatory statements related with their post- migration (Appendix II). Based on the individual scores, the respondents were classified into three categories namely High level, Medium level and Low level. Arithmetic mean score and standard deviation scores for all the 571 respondents were computed. Those who have scored more than (Arithmetic mean+ Standard deviation) were classified as high level, those who have scored below (Arithmetic mean - Standard deviation) were classified as low level and those with scores in between (Arithmetic mean + Standard deviation) and (Arithmetic mean - Standard deviation) were classified as medium level. Table 13 depicts the classification of the total 571respondents on the basis of levels of attitude towards their migration. TABLE 13 LEVEL OF ATTITUDE OF THE RESPONDENTS S.No Level Number of Percentage respondents 1. High Level Medium Level Low level Total Source: Computed data based on field survey
16 82 It is observed from Table 13 that out of 571 sample respondents 122 (21.37 %) respondents had high level attitude, 367 (64.27 %) had medium level and 82 (14.36 %) had low level of attitude towards their migration. The attitudes of the migrants towards their migration were studied by taking the socio- economic variables such as age, gender, religion, community, education, marital status, size of the family, type of family, employment statusbefore migration, nature of work- before migration and the nature of work- after migration. The significant relationship between these selected socio- economic variables and the attitudes of the migrants were analysed with the help of chi- square test as under: i) Age and the Level of Attitude of the Migrants The relationship between the different age groups of the migrants and their level of attitudes on migration is studied and the result is presented in Table 14. TABLE 14 AGE AND THE LEVEL OF ATTITUDE OF THE MIGRANTS S.No Age Level of Attitude ( In years) High Medium Low Total 1. Below (26.83) (67.32) (5.85) (100) (11.89 ) (69.19) (18.92) (100) 3. Above (24.86) (55.80) (19.34) (100) Total (21.37) (64.27) (14.36) (100) X 2 Value : Degrees of freedom : 4 Source: Computed data based on field survey Note: Figures in brackets indicate percentages to row total
17 83 From Table 14, it is clear that a greater percentage of all the three classified age groups of migrants had medium level of attitudes namely, per cent from below 30 years category, per cent from between years category and per cent from more than 45 years of age group. The overall figure of the age groups also shows a higher percentage of medium level of attitude (64.27 %). Besides, high level of attitude was found among respondents belonging to below 30 years category (26.83 %) and more than 45 years category ( %). However, it is a reverse in the case of between years of age groups. In order to find out the differences in attitudes that are statistically significant, a chi- square test was applied and a null hypothesis was framed for this purpose. Ho: There is no significant relationship between the age and the level of attitude of the respondents towards their migration. It is vivid clear from Table 14 that the calculated % 2 value (30.812) is greater than its corresponding table value (9.49) and hence the null hypothesis is rejected. Thus, it can be concluded that age of the respondents has significant relationship with the level of attitude to migration which indicates that different age groups of migrants have different attitude towards their migration. ii) Gender and the Level of Attitude of the Migrants The attitude may be different from person to person depending upon the gender of the respondents. Migration is generally preferred by males and females having some physical and social hindrances to switch over to new places. An attempt was made to study the relationship between the gender and the different attitudes of the migrants and the results are shown in Table 15
18 84 TABLE 15 GENDER AND THE LEVEL OF ATTITUDE OF THE MIGRANTS S.No Gender Level of Attitude High Medium Low Total 1. Male (22.47) (66.97) (10.56) (100) 2. Female (17.46) (54.76) (27.78) (100) Total (21.37) (64.27) (14.36) (100) X 2 Value : Degrees of freedom : 2 Source: Computed data based on field survey Note: Figures in brackets indicate percentages to row total It is clear from Table 15 that out of 445 males, per cent, per cent and10.56 per cent of the migrants had high, medium and low level of attitude respectively on their migration. Out of 126 female respondents, per cent per cent and per cent had respectively high, medium and low level of attitude on their migration. In order to find out the significant relationship between the gender of the respondents and their level of attitude, a null hypothesis was framed and tested with the help of chi- square analysis. Ho: There exists no significant relationship between the gender and level of attitude of the respondents on their migration Table 15 clears that the calculated % 2 value (23.696) is higher than the corresponding table value (5.99) and hence the null hypothesis is rejected. Therefore, it can be concluded that there is a significant relationship between gender and the level of attitude of the respondents on migration.
19 85 iii) Religion and the Level of Attitude of the Migrants The relationship between the religion of the respondents and their level of attitude was analysed and the results are presented in Table 16. S.No TABLE 16 RELIGION AND THE LEVEL OF ATTITUDE OF THE MIGRANTS Religion Level of Attitude High Medium Low Total 1. Hindu (21.91) (63.94) (14.14) (100) 2. Non-Hindu (17.39) (66.67) (15.94) (100) Total Source: Computed data based on field survey (21.37) (64.27) (14.36) (100) 2 X Value : Degrees of freedom : 2 Note: Figures in brackets indicate percentages to row total Table 16 shows that per cent, per cent and percent of Hindus had levels of attitude such as high, medium and low respectively. It is inferred that more percentage of belonging to both group of respondents had medium level of attitude. To find out whether the relationship between the religion and levels of attitudes is significant or not, a null hypothesis was framed and tested with the help of chi-square analysis. Ho: There is no significant relationship between the religion and the level of attitude of the selected respondents to the migration The result of chi-square test applied is shown in Table 16 which reveals that the calculated X 2 value (0.787) is lower than the table value (5.99) and hence the null hypothesis is accepted. It can be concluded that the attitude of the respondents on migration is not significantly different among respondents of different religions.
20 86 iii) Community and the Level of Attitude of the Migrants The relationship between the community and the level of attitude of the selected respondents was analysed and the result is given in Table 17. TABLE 17 COMMUNITY AND THE LEVEL OF ATTITUDE OF THE MIGRANTS Level of Attitude S.No Community High Medium Low Total 1. Backward 33 (17.01) 138 (71.13) 23 (11.86) 194 (100) 2. Most Backward 23 (12.57) 137 (74.86) 23 (12.57) 183 (100) 3. Scheduled Caste/ Scheduled Tribes 66 (34.02) 92 (47.42) 36 (18.56) 194 (100) Total 122 (21.37) 367 (64.27) 82 (14.36) 571 (100) X 2 Value : Degrees of freedom : 4 Source: Computed data based on field survey Note: Figures in brackets indicate percentages to row total It is clear from Table 17 that a greater percentage of backward and most backward community (71.13 and %) had medium level of attitude. The medium level of attitude is found greater among the scheduled caste/ scheduled tribes also (47.42 %). Similarly a considerable portion of them (34.02 %) had high level attitude. It is also noted that the percentage of high and low level of attitude was similar (12.57 %) among the most backward community. The apparent difference in the levels of attitudes of the respondents belonging to different communities was studied by framing a null hypothesis as, Ho: There is no significant relationship between the community and the level of attitude of the selected respondents
21 87 The chi- square test was applied to analyse the veracity of the above statement. The calculated X 2 Value (39.712) being greater than table value (9.49) which indicates that the null hypothesis is rejected. Therefore it is inferred that there is a significant relationship between the community and the level of attitude towards their migration. iv) Education and the Level of Attitude of the Migrants Education is the most influencing factor for migration. Higher the educational Level, greater will be the level of attitude towards migration and vice versa. Education is expected to have a direct relationship with migration and hence an analysis was made in this respect. Table 18 presents the result of the analysis on different attitudes of the selected migrants. Table 18 shows that out of 80 illiterate respondents, per cent had high, per cent had medium and per cent had low level of attitude. Of the 263 respondents having primary education, majority of them (65.39 %) had medium level of attitude per cent of this group of migrants had high level attitude followed by 9.13 per cent of respondents who had low level attitude. Among 228 sample migrants having literacy level of secondary and above, the percentage difference among these three levels of attitudes is greater per cent of them had a medium level attitude and only a meager percentage of them expressed the high and the low level of attitude.
22 88 TABLE 18 EDUCATION AND THE LEVEL OF ATTITUDE OF THE MIGRANTS S.No Education Level of Attitude High Medium Low Total 1. Illiterate (13.75) (42.50) (43.75) (100) 2. Primary (25.48) (65.39) (9.13) (100) 3. Secondary and above (19.30) (70.61) (10.09) (100) Total (21.37) (64.27) (14.36) (100) X 2 Value : Degrees of freedom : 4 Source: Computed data based on field survey Note: Figures in brackets indicate percentages to row total In order to find out whether such differences are statistically significant or not, a null hypothesis was framed and tested by chi- square analysis. Ho: Education has no significant relationship with the level of attitude of the respondents. The result of chi- square analysis in Table 18 shows that the calculated X 2 value (68.120) being greater than the table value (9.49) which is significant at 5 per cent level, the null hypothesis is rejected. Thus, it can be inferred that the education level of the respondents has a significant relationship with their levels of attitude towards migration. v) Marital Status and the Level of Attitude of the Migrants Migration is normally occurring among the young and un- married people. The opinion among married and single migrants may vary. So, it is important to study the relationship between the marital status and different attitudes of the migrants. Marital status of the respondents is classified in to 'married' and
23 89 'un married'. It is to be mentioned that the marital status of ' un married' includes un- married and widow/ widower respondents. Table 19 depicts the relationship among the marital status and the attitudes of the migrants. TABLE 19 MARITAL STATUS AND THE LEVEL OF ATTITUDE OF THE MIGRANTS S.No Marital status Level of Attitude High Medium Low Total 1. Married (21.28) (63.40) (15.32) (100) 2. Un married (21.78) (68.32) (9.90) (100) Total (21.37) (64.27) (14.36) (100) X 2 Value : Degrees of freedom : 2 Source: Computed data based on field survey Note: Figures in brackets indicate percentages to row total Table 19 reveals that most of both married and un married migrants had medium level of attitude (63.40 and %) followed by high level of attitude (21.28 and %) and low level of attitude (15.32 and 9.90 %). In order to ascertain whether the relationship between the marital status of the respondents and their attitude is significant or not, a null hypothesis was framed as under: Ho: Marital status and the level of attitude have no significant relationship between themselves In order to test the aforesaid hypothesis, chi- square test was applied. As per the result presented in Table 19, the calculated value of X 2 value was which is less than the table value at 5 per cent significant level (5.99) and hence the null hypothesis is accepted. This indicates that both married and single migrants have no significant difference in their levels of attitude towards migration.
24 90 vi) Size of the Family and the Attitude of the Migrants Size of the family has a direct relationship with migration. The attitude of migration is supposed to be high among the respondents of larger size family. Hence, it is important to find out the extent of relationship between the size of the family and the level of significance of the selected respondents. Table 20 explains the association between the family size and their level of attitude. TABLE 20 FAMILY SIZE AND THE LEVEL OF ATTITUDE OF THE MIGRANTS S.No Family Size Level of Attitude High Medium Low Total 1. Below five (14.57) (77.48) (7.95) (100) 2. Five (25.23) (58.26) (16.51) (100) 3. Above five (22.28) (60.89) (16.83) (100) Total (21.37) (64.27) (14.36) (100) X 2 Value : Degrees of freedom : 4 Source: Computed data based on field survey Note: Figures in brackets indicate percentages to row total It is inferred from Table 20 that a majority of the migrants having less than five members in their family (77.48 %) had a medium level of attitude. Those who had five members in the family account for per cent, per cent and per cent had high, medium and low level of attitude respectively. The respondents having above 5 members account for per cent, per cent and per cent had high, medium and low level of attitude respectively. The statistical significance of these relationship was studied with the help of chi- square test. For this purpose a null hypothesis was framed as,
25 91 Ho: There exists no significant relationship between size of the family and the level of attitude of the respondents on migration Since the calculated X value (16.441) is greater than the corresponding table value (9.49), the null hypothesis is rejected. Hence, significant relationship between the size of the family and the attitudes of the sample migrants is proved. vii) Type of Family and the Level of Attitude of the Migrants The relationship between the type of family and the different level of the attitudes of the sample respondents was analysed and presented in Table 21. TABLE 21 TYPE OF FAMILY AND THE LEVEL OF ATTITUDE OF THE MIGRANTS S.No Family Type Level of Attitude High Medium Low Total 1. Joint (37.02) (44.20) (18.78) (100) 2. Nuclear (14.10) (73.59) (21.31) (100) Total Source: Computed data based on field survey (21.37) (64.27) (14.36) (100) 2 X Value : Degrees of freedom : 2 Note: Figures in brackets indicate percentages to row total It is clear from Table 21 that the high and medium level attitude of migrants belongs to joint family were more or less equally distributed. The level of attitudes among nuclear family migrants shows that a more percentage of them expressed a medium level attitude (73.59 %) and besides, the percentage of low level attitude (21.31 %) is more than the high level attitude (14.10 %). The significance of the difference in these levels attitudes was studied and the null hypothesis was framed.
26 92 Ho: Type of family has no significant relationship with the level of attitude of the respondents The result of the chi-square test clearly shows that the calculated X 2 Value (50.606) is greater than the table value of 5.99 at 5 per cent level of significance and hence the null hypothesis rejected. It is clear that the type of family has no significant association with the level of attitude of the sample migrants towards migration. viii) The employment Status- Before Migration and the Level of Attitudes of Migrants Employment status of the respondents shows whether the respondents are employed and unemployed before migration. Generally, the level of attitude is expected to be high among the unemployed. To find out the fact whether there is any relationship between the employment status- before migration of the respondents and the attitude level, an attempt was made and the result is shown in Table 22. S.No TABLE 22 EMPLOYMENT STATUS- BEFORE MIGRATION AND THE LEVEL OF ATTITUDE OF THE MIGRANTS Employment Level of Attitude Status High Medium Low Total 1. Unemployed (11.96) (81.52) (6.52) (100) 2. Employed (25.84) (56.07) (18.09) (100) Total Source: Computed data based on field survey (21.37) (64.27) (14.36) (100) X 2 Value : Degrees of freedom : 2 Note: Figures in brackets indicates percentage to row total
27 93 Table 22 shows that out of 184 unemployed respondents, per cent, per cent and 6.52 per cent had high, medium and low level of attitude respectively towards migration. Employed respondents having the attitude of high, medium and low level account for per cent, per cent and per cent respectively. The statistical significance was analysed by applying the chi-square test so that the null hypothesis was framed. Ho: There is no significant relationship between the employment statusbefore migration and the level of attitudes of the respondents Table 22 explains that the calculated x 2 value (35.433) is higher than the table value of 5.99 at 5 per cent significant level and hence the null hypothesis is rejected. Therefore, it is clear that employment status- before migration has a significant affiliation with the level of attitude to migration. ix) Nature of Work- Before Migration and the Attitudes of the Migrants The researcher was interested to study the relationship among the nature of work- before migration and the level of attitude of the selected respondents towards migration. The result of the analysis is presented in Table 23. TABLE 23 NATURE OF WORK- BEFORE MIGRATION AND THE LEVEL OF ATTITUDE OF THE MIGRANTS S.No Nature of Work Level of Attitude High Medium Low Total 1. Agriculture (23.33) (52.50) (24.17) (100) 2. Non-Agriculture (29.93.) (61.91) (8.16) (100) Total (25.84) (56.07) (18.09) (100) X 2 Value : Degrees of freedom : 2 Source: Computed data based on field survey Note: Figures in brackets indicate percentages to row total
28 94 Table 23 illustrates that the attitudes of the agricultural migrants dispersed among all three levels. Out of 240 agricultural respondents, per cent had high level, per cent had medium level and per cent had low level of attitudes to the migration. Non agricultural workers had also articulated their attitudes among all the level of attitudes. In order to find out whether such relationship between the nature of work before migration and their level of attitude is significant or not, chi- square test was applied and for this purpose a hypothesis was framed. Ho: The attitudes of the migrants is not associated with their nature of work- before migration Table 23 shows that the calculated x 2 value of is greater than the table value at 5 per cent level of significance which pointed out that the null hypothesis is rejected. Hence, it can be concluded that there is a significant association between the attitude of the migrants and their nature of work- before their migration. xi) The nature of Work- After Migration and the Attitude of the Migrants The nature of work- after migration was divided in to two categories namely cardamom field work and cardamom non- field work and its relationship with the attitudes of the migrants was studied. The result is presented in Table 24.
29 95 TABLE 24 NATURE OF WORK- AFTER MIGRATION AND THE LEVEL OF ATTITUDE OF THE MIGRANTS S.No Nature of Work Level of Attitude High Medium Low Total 1. Cardamom field work (21.69) (61.69) (16.62) (100) 2. Non- field work (20.83) (68.52) (10.65) (100) Total (21.37) (64.27) (14.36) (100) Source: Computed data based on field survey X 2 Value : Degrees of freedom : 2 Note: Figures in brackets indicate percentages to row total Non- field work consists of factory work and supervisor categories. Out of 355 cardamom field work respondents per cent, per cent and per cent of them of had level of attitude such as high, medium and low level respectively. In the case of the non- field worker, per cent had high, per cent had medium, and per cent had a low level of attitude. An analysis was made to study the significance of the difference in attitude level with the null hypothesis that "The attitudes of the migrants have not significantly associated with the nature of work- after migration ". The result of the chi- square analysis indicates that the null hypothesis was accepted since the calculated x 2 value of is smaller than the Table value (5.99) at 5 per cent level of significance. Accordingly, it is to be concluded that the attitudes of the migrants are not associated with the nature of work in the destination place.
30 96 2. DETERMINANTS OF MIGRATION Decision on migration is very important in the whole migration process (Joshi, 1999). It is interesting to know why some people migrate while others do not. The important factors which motivate people to move may broadly be classified in to five factors; economic factors, demographic factors, sociocultural factors, political factors and miscellaneous factors (Kumar and Sidhu, 2005) Several studies were undertaken to identify the factors for large scale migration from rural areas. Many of them indicated the importance of economic factors which are more responsible than non- economic factors inducing migration (Tiwari, 1991, Choudhary, 1991, Choudhuri, 1998, Kumar, 2001, Neetha, 2003, Rao et al., 2004, Sidhu and Sharma, 2010) whereas some studies revealed the influence of non- economic factors on migration (Joshi and Padasia, 1991, Sekhar, 1993, Zachariah and Rajan, 2001) In a view of this, it can be inferred that both economic and non economic factors affect migration in one way or the other. It is very difficult to ascertain which particular factor is responsible for inducing migration of the people. Migration is the outcome of the relative strength of push and pulls factors which seemed to be equally important (Rao et al., 2004, Sidhu and Sharma 2010). Analysis of migration also frequently distinguishes between the push and pull factors in migration (Joshi and Padasia, 1991). Push factors are those that compel a person, due to different reasons, to leave that place and go to some other place. Pull factors refer to those factors which attracts the migrants to an area. Researchers have obtained diverse findings with regard to the importance of push and pull factors. So, it necessitates a fresh look to identify the major push and pull factors in labour outmigration and their comparative significance. Hence, an attempt was made to identify the push and pull factors which influence the sample cardamom workers to migrate on the basis of their perceptions.
31 97 1) Analysis of Push Factors i) Perceptions of the Selected Respondents Towards the Push Factor Statements Migration is a complex, multivariate phenomenon. It is the most difficult part of the analysis of the process of migration. Not only the factors controlling migration vary from area to area but also the significance of the same factor varies from person to person (Ghaffari and Singh, 2000, Joshi and Padasia, 1991). Therefore, an attempt was made to analyze the different attitudes among the three classified age groups of migrants such as Group I, Group II and Group III about the push and pull factors of migration. Likert's five point scale was used to get the mean score given by the respondents on the statements related to push factors. The significance of the different attitudes was tested by using the one way analysis of variance. The result of the calculated mean score of the push factor statements and the respective 'f' statistics are presented in Table 25.
32 98 S.No TABLE 32 PERCEPTIONS OF THE MIGRANTS TOWARDS THE PUSH FACTORS Push factor Statements Mean score of different age groups Group I Group II Group III f- Statistic 1. No sufficient working * condition 2. No regular employment @ 3. Heavy workload @ 4. Longer working hours * 5. Lack of liking job * 6. No proper irrigation * 7. Not having land @ 8. Sold out the land * 9. Drought in land * 10. No suitable land for @ cultivation 11. No sufficient wages * 12. No proper distribution of * wages 13. Discrimination in payment * 14. No repayment of debt * 15. Heavy debt on asset @ 16. Conflict with neighbours * 17. Caste discrimination * 18. Conflict with employer @ 19. Family feud * 20. To enjoy the nuclear family * Total Source: Computed data based on field survey *- Significant at 5 per cent Not Significant
33 99 Table 25 reveals that the Group III respondents had a comparative more mean score ( ) on the above said push factor statements and they gave more score for 'no regular employment' in their native place (4.4972) which implies that among twenty push factor statements, this was the main reason for their migration. The other two age groups such as Group I and Group II migrants had a total mean score of and respectively. Both of these groups had also given first place to 'no regular employment' in their native place, the mean scores of this statement are and It is inferred from Table 25 that the perceptions of three age groups had significantly different on 14 statements. It should be noted that the most important statement 'no regular employment' in the native place has no significant difference in the perceptions of the migrants which reveals that all three groups of migrants had same opinion on that particular factor statement. ii) Factor Analysis of Push Factors The technique adopted to identify and analyze the important factors affecting migration is factor analysis (Kumar and Sidhu, 2005). Factor analysis is defined as the methods of analyzing multi variables in order to highlight the relationship between them and the specific phenomenon (Al-Ma'ayn and Nagaraj, 2009). Before applying factor analysis, it is customary to check whether the data is fit for the factor analysis or not. For that purpose the data adequacy tests were carried out on the data collected and tested on the basis of following considerations: the value of the Kaiser- Meyer- Oklin (KMO) statistic are very large (0.772). The test value of Bartlett's Test of Sphericity was significant indicating that correlation matrix is not an identity matrix, and the value of Chi- Square for Barletts' Test of Sphericity ( ) was also significant. These confirmed that data were adequate for factor analysis. Thus, factor analysis may be considered as an appropriate technique for analyzing the primary data.
34 100 Rotated Factor Matrix for Push Factors The perceptions of migrants on a set of 20 statements about the factors which forced the migrants to leave their native places were subjected to factor analysis. The results were obtained through Orthogonal Rotation with Varimax method and all factor loadings greater than or equal to 0.49 (ignoring the signs) were retained. Varimax rotated factor analytic result of the 20 push factors statements is presented in Table 26. TABLE 26 ROTATED CORRELATED MATRIX - PUSH FACTORS S.No Statements Factors No sufficient working condition 2. No regular employment Heavy workload Longer working hours Lack of liking job No proper irrigation Not having land Sold out the land Drought in land No suitable land for cultivation No sufficient wages No proper distribution of wages 13. Discrimination in payment
35 No repayment of debt 15. Heavy debt on asset Conflict with neighbours 17. Caste discrimination Conflict with employer 19. Family feud To enjoy the nuclear family Source: Computed data based on field survey Naming of Factors It is clear from Table 26 that all the twenty attributes have been extracted in to six factors. Each extracted group can be named according to the key words in the statements. Table 27 depicts the name of the factors, factor loading and their communality values.
36 102 TABLE 27 NAMING OF FACTORS Factor Statements Factor loading 1. Lack of employment Communality (h 2 ) No sufficient working conditions No regular employment Heavy work load Longer working hours Lack of liking job Unviable land holding No proper irrigation Not having land Sold out the land Drought in land No suitable land for cultivation Low income No sufficient wages No proper distribution of wages Discrimination in payment Indebtedness No repayment on debt Heavy debt on asset Social conflicts Conflict with neighbour Caste discrimination Conflict with employer Family conflicts Family feud Enjoy the nuclear family Source: Computed data based on field survey
37 103 Lack of Employment The first push factor is named as lack of employment. Five out of twenty push factor attributes are loaded on this factor and exhibited in Table 27. It is illustrated that all the attributes other than 'no sufficient working conditions' are positively correlated with the factor loadings. The negative loading of this attribute indicates that the respondents did not migrate because of their insufficient working conditions. All the five attributes have high communalities indicating the attributes within factor 1 have very high association among them. It is clear from Table 27 that 'lack of employment' in their native places played a dominant role in labour out migration in Theni district. Unviable Land Holding Since majority of the selected respondents were agriculturalists in their native place, the land related variables are loaded in the second major factor and be named as unviable land holding. Table 27 depicts that among the five variables 'no proper irrigation' has the highest factor loading (0.800). It should be mentioned that the study area is known to have well irrigated source district, but the cultivable lands are still having improper irrigation. Therefore 'no proper irrigation' has the greater factor loading than the other variables. All the five variables have positive correlation with the loaded factor and their higher communalities indicating that there is very high association among them in that factor. Low Income Three attributes are loaded in the third factor and be named as low income. It is observed from Table 27 that variables such as 'insufficient wages', 'no proper distribution of wages' and 'discrimination in payment of wages' are loaded in factor 3 of which two are highly correlated with the loading factor. The higher factor loading of 'insufficient wages' specified that majority of the respondents migrated due to that reason. The association among these attributes is also very high.
38 104 Indebtedness The attributes such as 'no repayment on debt' and 'heavy debt on asset' with high factor loading constituted Factor 4. The above said attributes with higher factor loading on factor 4 are characterized as indebtedness. In Table 27, the higher factor loading on its attributes helps in identifying attributes associated with factor 4. These two attributes have high communality indicating that the variables within factor 4 have very high association. Social Conflicts Table 27 portrays that three attributes are loaded in factor 5 and named as social conflicts. It is noticed that 'conflict with neighbour' has higher factor loading and communality with the factor. This result agreed the view of Joshi and Padasia (1991) that labour migration is depending not only on economic conditions and motives, but also being influenced as well by social and institutional factors. Many of the younger generations want to break away from the custom- bound atmosphere of their homes and the restriction on social behavior. The study found that more number of selected respondents of the study belongs to most backward and scheduled caste community. So, they reported that 'caste discrimination' was also one of the factors for migration. Besides that, 'conflict with neighbours and with employer' also influences the decision to migrate. All the three variables have high and positive factor loading and communality which shows the more association among them. This result supports the view of Choudhary (1991) that demographic pressure is an important factor of migration. Family Conflicts Among the push factors which affects the migration of the respondents two statements such as 'family feud' and wanted to 'enjoy the nuclear family system' are loaded in factor 6 and named as family conflicts. It is evident from Table 27 that both the statements have high and positive factor loading indicates that factor 6 underlies the above two variables. The high communality value of the attributes
39 105 indicates that the attributes within the factor 6 have very high association among them. Analysis of Eigen Value and Percentage of Variance of Push Factors of Migration The study found that factor analysis identified six deciding push factors out of twenty attributes which compel the migrants to leave their native place. The results of Eigen value and percentage of variance are presented in Table S. No TABLE 28 DECIDING PUSH FACTORS OF MIGRATION Factors 1. Lack of employment Eigen Value Percentage of Variance Cumulative Percentage of Variance opportunity Unviable land holding Low income Indebtedness Social conflicts Family conflicts Source: Computed data based on field survey It is observed from Table 28 that six factors such as 'lack of employment opportunity', 'unviable land holding', 'low income', 'indebtedness', 'social conflicts' and 'family conflicts' were extracted out of twenty attributes. These factors account for about per cent of variance in the data. It shows that per cent of the total variance is explained by the information contained in the factor matrix. The percentage of total variance is used as an index to determine how well a particular factor solution accounts for all the variables together represent. Eigen value of the first factor 'lack of employment opportunity' is 4.841, which indicates that the factor contains very high information than the other factors. The first factor 'lack of
40 106 employment opportunity' provides the maximum insights of migrating decision of the respondents in the study area. This result is in accordance with the findings of Choudhary (1991), Noronha (1998), Gupta and Prajapati (1998). The second factor called 'unviable land holding' account for per cent of variance. The Eigen value of this factor is The third and fourth factors,' low income' and 'indebtedness' account for and per cent of variance with Eigen values of and respectively. It is to be noted that 'low income' of the respondents in the native places was not a primary factor while many empirical studies proved that 'low income' was the main reason for rural out- migration (Tiwari 1991,Tiwari and Goel 2002, Srivastava,1998). Since most of the selected respondents were belong to backward, most backward and scheduled caste communities in the study area, 'social and family conflicts' also affects the migrating decision of the respondents and these variables accounts for per cent and per cent of variance with the Eigen value of and respectively. iii) Relationship between the Push Factors and the Overall Migrating Decision Behaviour of the Respondents After finding out the push factors involved in the decision of migration of the selected migrants, an attempt was made to find out the relationship between the deciding push factors and the overall migrating decision behavior of the selected respondents in the study area. 'Multiple Regression Analysis' was applied to identify the relationship between the push factors and the overall migrating behaviour. The regression co- efficient of the independent variables has been estimated and the results are shown in Table 29. It is perceived from Table 29 that co-efficient of determination (R 2 ) was indicating that 81 per cent of the variation in the migratory decision of the respondents be explained by all the six independent variables included in the model. The F - value indicates that the fitted log linear multiple regression was significant at one percent level and it is valid to draw inference.
41 107 holding, significant. Among the independent variables, lack of employment, unviable land indebtedness and family conflicts were found to be statistically TABLE 29 INFLUENCE OF PUSH FACTORS ON THE OVERALL MIGRATING DECISION OF THE RESPONDENTS Elasticity Standard S.No Variables Notation t- value Co efficient Error 1. Constant b Lack of employment opportunity X1 ** Unviable land holding X " Low income X Indebtedness X Social conflicts X Family conflicts X * Source: Computed data based on field survey "Significant at 1 per cent level Significant at 5 per cent Not significant R 2 = F - value = It could be inferred that migrating behaviour of the migrants was significantly influenced by the lack of employment opportunity in the native places. One per cent increase in the lack of employment in the native places would increase the migrating decision by per cent from its mean level. The study found that though most of the sample migrants were employed before migration, they moved to the cardamom work. This was mainly due to the irregular employment in their native places.
42 108 The elasticity co- efficient for the variable 'unviable land holding' was which indicates that one per cent increase in the unviable land holding in their native places would lead to increase the migration of the respondents by per cent, ceteris paribus. This result revealed that though the study area has well irrigational sources, most of the cultivable lands were not getting proper irrigation and that also caused the migration. Since the selected migrants had large family size, indebtedness of the migrants before migration was one of the most important factors which pushed them to move out of their native places. Its co- efficient was and it was significant at one per cent level, indicating that one per cent increase in indebtedness of the migrants would increase the migration of the respondents by per cent. The variable, family conflicts also influenced the migration of the respondents. The co- efficient of this variable was which was significant at five per cent level. This shows that one per cent increase in family conflicts would increase the migrating decision by per cent. This result supports Lee's theory (1966) that the personal factors affects the individual thresholds and facilitate or retard migration. iv) Discriminant Analysis on Push Factors of Migration among the Different Age Group of Migrants The reasons for the movement of people from their place of orgin to another place may not be the same for all (Korra, 2009). The discriminant analysis has been applied in order to identify the discriminating factors of migration among the different age groups namely, Group I, Group II and Group III of the respondents. The analysis was made firstly on the two groups of age such as Group I and Group II of migrants, secondly on Group II and Group III and thirdly on Group I and Group III migrants. To find out what factors discriminate these two groups of migrants, selected factors were considered and two group discriminant analysis was applied.
43 109 Discriminating Push Factors Leading to Migration among Group I and Group II Migrants The selected push factors for the analysis were lack of employment opportunity, unviable landholding, low income, indebtedness, social conflicts and family conflicts. Initially, to find out the discriminating push factor of migration among the first two age groups namely, Group I and Group II, the mean difference of the selected factors was found with the help of five point scale. The assigned marks on these scales are 5,4,3,2 and 1 respectively. 't' test was administered to test the significance of the mean difference. The discriminating power of the variables was computed by its Wilks Lambda. The results of the first two groups are shown in Table 30. TABLE 30 MEAN DIFFERENCE AND DISCRIMINANT POWER OF PUSH FACTORS LEADING TO MIGRATION AMONG GROUP I AND GROUP II MIGRANTS S. No Factors 1. Lack of employment opportunity (X-i) 2. Unviable land holding (X 2 ) Mean Score Among Group Group I II Mean Difference t- Statistic Wilks Lambda * @ Low income (X 3 ) @ Indebtedness (X4) @ Social conflicts (X 5 ) Family conflicts (X 6 ) " Source: Computed data based on field survey *- Significant at 5 per cent Not significant The mean difference of the discriminant push factors among the two age groups in Table 30 are identified as more and significant in the case of factors such as lack of employment opportunity, family conflicts and social conflicts.
44 110 The mean differences are 1.466, and respectively and these three factors also have the high discriminating power, since their Wilks Lambda are 0.265, and respectively. Out of the six push factors leading to migration decision, only the three factors are significant regarding their mean difference. Only these factors were included for the establishment of two GMP discriminant analysis. The unstandardised procedure was followed to establish such function. The estimated function is: Z = X X X6 The relative contribution of each discriminant push factor in the total discriminate score was computed by the product of unstandardised canonical discriminant coefficient and the mean difference of the respective discriminant factor. The requested relative contribution of discriminant variable in the total discriminant score is shown in Table 31. TABLE 31 RELATIVE CONTRIBUTION OF DISCRIMINANT FACTORS IN TOTAL DISCRIMINANT SCORE S. No 1. Lack of Factors Un Standardised Canonical discriminant co- efficient Mean Difference Product Relative contribution in total discriminant score employment opportunity (X-i) Social conflicts (X 5 ) Family conflicts X 6 ) Total Source: Computed data based on field survey Per cent of cases correctly classified: 74.5
45 111 The higher discriminant coefficient is identified in the case of family conflicts and social conflicts since the respective discriminant coefficient and It infers that the degree of influence of the above said discriminant factors on the discriminant contribution are higher. However, the relative contribution in total discriminant score is identified as higher in the case of lack of employment (63 %) followed by family conflicts and social conflicts. The estimated discriminant function correctly classifies the two age group of migrants to the extent of 74.5 per cent. The result of the group I and group II revealed that among six push factors, lack of employment opportunity in the native place have more influence on the migration decision and the mean score of group I of this factor was high which implies that the lack of employment opportunity was the main reason for migration among group I than the group II. Discriminating Push Factors Leading to Migration among Group II and Group III Migrants An attempt was made on an identification of important discriminant factors of migration among Group II years and Group III years of age of migrants. The two way discriminant analysis was administered to identify the importance of the discriminating factor. The result of mean difference, 't' test and Wilks Lambda are presented in Table 32.
46 112 TABLE 32 MEAN DIFFERENCE AND DISCRIMINANT POWER OF PUSH FACTORS LEADING TO MIGRATION AMONG GROUP II AND GROUP III MIGRANTS S. No Factors 1. Lack of employment opportunity (X-i) Mean Score Among Group Group II III Mean Difference t- Statistic Wilks Lambda Unviable land holding (X 2 ) * Low income (X 3 ) Indebtedness (X4) Social conflicts (X5) @ Family conflicts (X 6 ) @ Source: Computed data based on field survey *- Significant at 5 per cent Not significant Regarding the push factors of migration among the two classified age groups, the higher and significant difference among them is noticed in the case of low income, unviable land holding and indebtedness since the respective mean difference of these factors are significant at 5 per cent level. The higher discriminant power of the variables is seen in the factors such as family conflicts, low income, indebtedness and unviable land holding. Their respective values of Wilks Lambda are 0.218, 0.273, and Only the significant variables were taken in to account for the establishment of two groups' discriminant function. The unstandardised procedure was followed to establish such function. The estimated function is: Z = X X X4
47 113 The contribution of each discriminating factor in the total discriminant score was computed by the product of the unstandardised canonical discriminant coefficient and the mean difference of each discriminant function. The estimated discriminant coefficient and its relative contribution in the total score are explained in Table 33. S. No TABLE 33 RELATIVE CONTRIBUTION OF DISCRIMINANT FACTORS IN TOTAL Factors 1. Unviable land DISCRIMINANT SCORE Un Standardised Canonical discriminant co- efficient Mean Difference Product Relative Contribution in Total Discriminant Score holding (X 2 ) Low income (X 3 ) Indebtedness (X4) Total Source: Computed data based on field survey Per cent of cases correctly classified: 68.9 The discriminating factors namely unviable land holding and indebtedness had the higher discriminant coefficient and their relative contribution in total discriminant score also high as compared to the factor 'low income'. The discriminant coefficient of the above said factors are and and the relative contribution in total score are and respectively. The estimated discriminant function correctly classifies the two groups of migrants to the extent of 68.9 per cent. The analysis infers that the important discriminant factor leading to migration was unviable land holding among Group II migrants since these groups had given more mean score on this factor.
48 114 Discriminating Push Factors Leading to Migration among Group I and Group III Migrants The difference between the two age groups namely Group I years and Group III years of migrants with regard to the push factors was identified by the two way discriminant analysis. The result of mean difference, 't' test and Wilks Lambda are presented in Table 34. S. No TABLE 34 MEAN DIFFERENCE AND DISCRIMINANT POWER OF PUSH FACTORS LEADING TO MIGRATION AMONG GROUP I AND GROUP III MIGRANTS 1. Lack of Factors Mean Score Among Mean t- Wilks Group Group Difference Statistic Lambda I III employment @ opportunity (X1) 2. Unviable land holding (X 2 ) * Low income (X 3 ) * Indebtedness (X4) * Social conflicts (X5) @ Family conflicts (X 6 ) Source: Computed data based on field survey *- Significant at 5 per cent Not significant Out of six push factors of migration, four factors namely low income, unviable land holding, indebtedness and family conflicts had the higher mean score ( 0.568, 0.310, and 0.264). The significant mean differences are also identified in the above said factors. But the higher discriminating power can be seen in the factor 'social conflicts' followed by indebtedness and family conflicts
49 115 since their Wilks Lambda are 0.297, and The significantly differed factors were taken for the establishment of two groups of discriminant function. The unstandardised procedure was followed to establish such function which is presented below: Z = X X X X 6 The contribution of each discriminating factor in the total discriminant score was computed by the product of the unstandardised canonical discriminant coefficient and the mean difference of each discriminant function. The estimated discriminant coefficient and its relative contribution in the total score are explained in Table 35. S. N o TABLE 35 RELATIVE CONTRIBUTION OF DISCRIMINANT FACTORS IN TOTAL Factors 1. Unviable land holding (X 2 ) DISCRIMINANT SCORE Un Standardised Canonical discriminant co- efficient Mean Difference Product Relative contribution in total discriminant score Low income (X 3 ) Indebtedness (X4) Family conflicts (X 6 ) Total Source: Computed data based on field survey Per cent of cases correctly classified: 62.4 Table 35 shows that the discriminant coefficients of family conflicts and indebtedness are and which are higher than the other discriminating factors. It infers that the above said factors influenced more in the discriminant function. The more relative contribution in total discriminant score can be seen in
50 116 family conflicts and indebtedness (60.55% and %). The established discriminant function correctly classifies two groups of migrants to the extent of 62.4 per cent. The analysis reveals that more number of group III were pushed out due to family conflicts since the mean score of group III for this factor was higher than the group II. 2) Analysis of Pull Factors i) Perceptions of the Selected Respondents Towards the Pull Factor Statements The difference in the perceptions among the three age groups about the statements regarding the pull factors was analysed and the results is shown in Table 36. The mean score of each statement and the total score of all the statements given by three age group respondents are presented in Table 36. It is clear from Table that among the three groups of age of migrants, Group III migrants has maximum total score ( ). These age groups were given more mean score for the statements such as 'proper distribution of wages' (3.2486), 'continuous regular job' (2.8398) and 'skill development' (2.7403) in the place of destination. The second total maximum score was given by group I migrants ( ). They gave high score for 'continuous regular job' (3.2683) in the destination place. Thus, it can be concluded that among the fifteen pull statements, 'continuous regular job' in the place of destination was reported as a very important factor which motivated the migrants to migrate. 'Better job opportunity', proper distribution of wages', and ' the skill development' were the other important statements which determined the migration of the respondents. The significant differences in the opinion of the three age groups can be seen in 12 statements since their calculated 'f value of these statements are statistically significant at 5 percent level of significance.
51 117 TABLE 36 PERCEPTIONS OF THE MIGRANTS TOWARDS THE PULL FACTORS S.No Pull factor Statements Mean score of different age groups Group I Group II Group III f - Statistic 1. Better job opportunity * 2. Job availability for all the family members * Easy to get the job Higher wages paid Proper distribution of wages 6. Advance given by the owner @ * Very easy to learn @ 8. Working hours are limited Continuous regular job * 10. Come with prearrangement 11. More Secured for entire life * * No risk in doing * 13. Previous experience @ 14. No experience needed Skill development in short period * Total Source: Computed data based on field survey * - Significant at 5 per cent - Not Significant
52 118 ii) Factor Analysis for Pull Factors High value of Kaiser - Mayer- Olkin (KMO) test of sampling adequacy (0.668) indicates the correlation between the pairs of variables explained by other variables and thus, factor analysis is considered to be appropriate in this model. Rotated Factor Matrix for Pull Factors The perceptions of workers on a set of 15 statements about factors which attract the respondents to migrate to that place of destination were subjected to factor analysis. The results were obtained through Orthogonal Rotation with Varimax method and all factor loadings greater than or equal to 0.43 (ignoring the signs) were retained. Varimax rotated factor analytic results for the selected migrants are presented in Table 37.
53 119 TABLE 37 ROTATED CORRELATED MATRIX - PULL FACTORS S. Factors No Statements Better job opportunity Job Availability for all the family members 3. Easy to get the job Higher wages paid Proper distribution of wages Advance given by the owner Very easy to learn Working hours are limited Continuous regular job Come with pre- arrangement More Secured for entire life No risk in doing Previous experience No experience needed Skill development in short period Source: Computed from field survey Naming of Factors Table 37 exhibits the rotated factor loadings for the fifteen statements (attributes) of migration. It is clear that all the fifteen attributes were extracted in to five factors and each of them was named according to the key words in the statements. Table 38 exhibits the name of the five factors and their factor loading and communality values.
54 120 TABLE 38 NAMING OF FACTORS Factor Statements Factor loading 1. Better employment opportunity 2 Communality (h 2 ) Better job opportunity Job availability for all the family members Easy to get the job Higher wages Higher wages paid Proper distribution of wages Advance given by the owner Nature of job Very easy to learn Working hours are limited Security of job Continuous regular job Come with prearrangement More Secured for entire life No risk in doing Skill of work Previous experience No experience needed Skill development in short period Source: Computed data based on field survey
55 121 Better Employment Opportunity Among the fifteen attributes of migration, the attributes such as 'better job opportunity', 'job availability for all the family members' and 'easy to get a job' in the destination place constituted the factor 1 with higher factor loadings. The above said variables are characterized as better employment opportunity. The values of factor loadings and communalities of those three attributes are demonstrated in Table 38 that all the three variables have higher and positive factor loadings and high communality indicating that the attributes within the factor 1 have positive factor. high association among them and as well as with that Higher Wages The attributes such as 'higher wages', proper distribution of wages' and 'advance paid by the owner' are constituted in factor 2. It can be named as higher wages and shown in Table 38. The three attributes loaded in factor 2 have higher factor loading and communality. The higher factor loading on its attributes helps in identifying attributes associated with factor 2 and higher communality shows that the variables within factor 2 have very high association. At the same time, it should be noted that the third attribute 'advance given by the owner' have the negative relationship with that factor. Nature of Job Table 38 indicates that two variables such as 'very easy to learn' and 'working hours are limited' are loaded in factor 3 with high factor loading. These two variables are characterized as nature of job. The higher factor loading of the attributes in Table explains that the factor 3 underlies those variables. The higher value of communality for the two attributes indicates that the higher amount of variance is explained by the extracted factor. Security of Job Among the fifteen attributes, major number of attributes have constituted in Factor 4. It can be characterized as security of job. Table 38 describes the
56 122 factor loadings and communalities of that factor and it illustrates that among four attributes, two of them such as 'continuous regular job' and 'come with prearrangement' have high relation with that factor than the other two attributes. The finding is in consensus with the findings of Samal and Mishra (1998) where most of the migrants have their jobs pre- arranged by their friends and relatives. All the four attributes have high association among them since they have high communality values. Skill of Work Three attributes are loaded in factor 5 and named as skill of work. It is found that majority of the respondents had previous experiences, since those variables have high factor loading than the other two variables (0.799). The communality is high among the 'previous experience' and 'no experience needed'(0.705 and 0.640) which implies that the high association among them. Analysis of Eigen Value and Percentage of Variance of Pull Factors of Migration Factor analysis identified five deciding pull factors out of fifteen attributes which attracts the migrants to migrate to the cardamom work and the results are presented in Table 39. TABLE 39 DECIDING PULL FACTORS OF MIGRATION S.No 1. Factors Better employment opportunity Eigen Value Percentage of Variance Cumulative percentage of Variance Higher wages Nature of job Security of job Skill of work Source: Computed data based on field survey
57 123 It is observed from Table 39 that the five factors such as 'better employment opportunity', 'higher wages', 'nature of job', 'security of job' and 'skill of work' were extracted out of fifteen attributes. These factors account for about per cent of variance in the data. It shows that per cent of the total variance is explained by the information contained in the factor matrix. Eigen value of the first factor 'better employment opportunity' is 2.748, which indicates that the factor contains very high information than the other factors. The first factor 'better employment opportunity' in the place of destination provides the maximum insights of migrating decision of the respondents in the study area. The second important factor called 'higher wages' account for per cent of variance. The Eigen value of this factor is which stated that higher wages and its proper distribution also attracted the respondents to move. The third factor, 'nature of job ' in the cardamom work has per cent of variance with Eigen value Hence, it is clear that the selected migrants are motivated by the easy nature and limited working hours in the job also. The fourth factor 'security of job' have per cent of variance with Eigen value of which indicates that the regularity in job, pre-arrangements and no risk in doing the job also influences the migrate decision of the respondents. The final factor which determines the migration of the respondents is 'skill of work' and it has per cent of variance. iii) Relationship between Pull Factors and the Overall Migrating Decision Behaviour of the Respondents Multiple regression analysis was applied to identify the relationship between the identified pull factors and the overall migrating behaviour of the respondents. The regression co- efficient of the independent variables has been estimated and the results are shown in Table 40. The R 2 value of indicates that 73 per cent of the variation in the migrating decision of the respondents is due to the identified factors namely 'better employment opportunity', 'higher wages', 'nature of job', 'security of job' and 'skill of work' in their destination place. The F - value indicates that the fitted
58 124 log linear multiple regression was significant at one percent level and it is valid to draw inference. TABLE 40 INFLUENCE OF PULL FACTORS ON THE OVERALL MIGRATING DECISION OF THE RESPONDENTS Elasticity Co Standard S.No Variables Notation t- value efficient Error 1. Constant b * Better employment 2. opportunity X1 3. Higher wages X2 ** * Nature of job X @ Security of job X4 ** Skill of work X @ Source: Computed data based on field survey "Significant at 1 per cent level 'Significant at 5 per cent Not significant R 2 = F- value = Out of five identified pull factors, three factors such as better employment opportunity, higher wages and security of job were found to be statistically significant. The elasticity co- efficient of better employment opportunity in the place of destination was which indicates that an increase of that by one per cent will lead to increase the migration of the respondents by per cent ceteris paribus. This implies that the migrants will get the continuous employment throughout the year in the destination place and so that the migrants were encouraged to go there. The study made by Devi et al, (2009) also yields the same result.
59 125 Higher wages in the destination place also influenced the migration of the respondents. The co- efficient of this factor revealed that every one per cent increase in wages will increase migration by per cent. Though the cardamom work is agriculture in nature, the cultivation is being done throughout the year. The migrants felt that it is a more secure job for their entire life. So the variable, 'security of job' has also decided the migrating behaviour of the respondents. The co- efficient value of is statistically significant at one per cent level which shows that one per cent increase of the security feeling will increase the migration of the respondents by per cent. Over all, the finding of the study leads to the conclusion that both pull and push factors are contributing to large scale rural outmigration from Theni District. Further, the economic factors have emerged stronger as compared to non- economic factors in the present study. Similar result is found by Kumar and Sidhu (2005), Mahapatro (2010). Ravenstein's Law of Migration (1885) also states that the economic motive is always the predominant factor in influencing the decision to migrate. iv) Discriminant Analysis on the Pull Factors of Migration among Different Age Group of Migrants An analysis was made on pull factors also in order to find out the discriminating factor among the classified age groups. The selected factors were Better employment opportunity, Higher wages, Nature of job, Security of job and Skill of work. Discriminating Pull Factors Leading to Migration among Group I and Group II Migrants An initial step of finding out the mean difference of the selected pull factors among Group I and Group II migrants was made and Table 41 shows the result of mean score, 't' test values and Wilks Lambda value.
60 126 S. No TABLE 32 MEAN DIFFERENCE AND DISCRIMINANT POWER OF PULL FACTORS LEADING TO MIGRATION AMONG GROUP I AND GROUP II MIGRANTS Factors 1. Better employment opportunity (X-i) Mean Score Among Group Group I II Mean Difference t- Statistic Wilks Lambda * Higher wages (X 2 ) * Nature of job (X3) @ Security of job (X4) Skill of work (X5) @ Source: Computed data based on field survey *- Significant at 5 per cent Not significant It can be observed from Table 41 that the mean difference of the discriminant pull factors among the two age groups are identified as more and significant factors such as better employment opportunity, higher wages and security of job. The mean differences are , and respectively and these three factors also have the high discriminating power as their Wilks Lambda are 0.640, and respectively. Among the five pull factors attracting to migration decision, only the three factors are significant regarding their mean difference since their statistical 't' values are significant at 5 per cent level. Only these factors were included for the establishment of two GMP discriminant analysis. The unstandardised procedure has been followed to establish such function. The estimated function is: Z = X X X4 The product of unstandardised canonical discriminant coefficient and the mean difference of the respective discriminant factor was used to find out the
61 127 relative contribution of each discriminant factor in the total discriminate score. The result is shown in Table 42. S. No TABLE 42 RELATIVE CONTRIBUTION OF DISCRIMINANT FACTORS TO TOTAL Factors 1. Better employment opportunity (X-i) DISCRIMINANT SCORE Un Standardised Canonical discriminant co- efficient Mean Difference Product Relative contribution in total discriminant score Higher wages (X 2 ) Security of job (X 4 ) Total Source: Computed data based on field survey Per cent of cases correctly classified: 74.1 In Table 42, the higher discriminant coefficient is identified in the case of higher wages and security of job since the respective discriminant coefficients are and It infers that the degree of influence of the above said discriminant factors on the discriminant contribution are higher. The relative contribution to total discriminant score is identified as higher in the case of better employment opportunity (43.49 %). The estimated discriminant function correctly classifies the two age group of migrants to the extent of 74.1 per cent. It was found that better employment opportunity was the major pull factor for group II migrants since these groups gave more score on this factor.
62 128 Discriminating Pull Factors Leading to Migration among Group II and Group III Migrants An analysis made on pull factors of migration among Group II and Group III migrants and Table 43 shows the result of mean difference, 't' test and the values of Wilks Lambda. S. No TABLE 43 MEAN DIFFERENCE AND DISCRIMINANT POWER OF PULL FACTORS LEADING TO MIGRATION AMONG GROUP II AND GROUP III MIGRANTS Factors 1. Better employment opportunity (Xi) Mean Score Among Group Group II III Mean Difference Wilks t- Statistic Lambda * Higher wages (X 2 ) * Nature of job (X3) @ Security of job (X 4 ) @ Skill of work (X5) @ Source: Computed data based on field survey *- Significant at 5 per cent Not significant Table 43 presents that the higher and significant mean difference is noticed in the case of 'better employment opportunity' and 'higher wages' since the respective mean difference of these factors are significant at 5 per cent level. The higher discriminant can also be seen in the above said pull factors. Their respective values of Wilks Lambda are and Only two significant factors were taken in to account for the establishment of two groups' discriminant function. The unstandardised procedure was followed to establish such function. The estimated function is: Z = Xi+0.259X 2
63 129 The estimated discriminant coefficient and its relative contribution in the total score are depicted in Table 44. TABLE 44 RELATIVE CONTRIBUTION OF DISCRIMINANT FACTORS IN TOTAL DISCRIMINANT SCORE S. No Factors 1. Better employment opportunity (Xi) Un Standardised Canonical discriminant co- efficient Mean Difference Product Relative contribution in total discriminant score Higher wages (X 2 ) Total Source: Computed data based on field survey Per cent of cases correctly classified: 69.1 Among the two significant pull factors of migration, better employment opportunity has higher discriminant coefficient (0.522) and its relative contribution in total discriminant score also high (79.36 %) as compared to the factor 'higher wages'. The estimated discriminant function correctly classifies the two groups of migrants to the extent of 69.1 per cent. The mean score of better employment opportunity among group III is more than group II, hence it is to understandable that the important discriminant pull factor leading to migration among Group III is 'better employment'. Discriminating Pull Factors Leading to Migration among Group I and Group III Migrants The difference between the two age groups namely Group I and Group III migrants with regard to the pull factors was identified. The result of mean difference, 't' test and the values of Wilks Lambda are presented in Table 45.
64 130 TABLE 32 MEAN DIFFERENCE AND DISCRIMINANT POWER OF PULL FACTORS LEADING TO MIGRATION AMONG GROUP I AND GROUP III MIGRANTS S. No. Factors Mean Score Among Group I Group III Mean D ifference t- Statistic Wilks Lambda 1. Better employment opportunity (X 1 ) * Higher wages (X 2 ) * Nature of job (X3) Security of job (X4) * * Skill of work (X 5 ) @ Source: Computed data based on field survey *- Significant at 5 per cent Not Significant From Table 45, it is clear that out of five pull factors of migration among the two classified age groups, better employment opportunity, higher wages, security of job and nature of job have higher mean scores ( -0348, 0.276, and 0.179).These mean scores are significant also. The higher discriminating power can be seen in the first two pull factors since their Wilks Lambda values are and The significant by differed factors were taken for the establishment of two groups of discriminant function. The unstandardised procedure was followed to establish such function which is presented below: Z = X X X X4 The estimated discriminant coefficient and its relative contribution to the total score are explained in Table 46.
65 131 TABLE 32 RELATIVE CONTRIBUTION OF DISCRIMINANT FACTORS TO TOTAL DISCRIMINANT SCORE S. No Factors Un Standardised Canonical discriminant co- efficient Mean Difference Product Relative contribution in total discriminant score 1. Better employment opportunity (X1) Higher wages (X 2 ) Nature of job (X3) Security of job (X 4 ) Total Source: Computed data based on field survey Per cent of cases correctly classified: 63.7 Table 46 reveals that the pull factors 'higher wages' and 'security of job' have more discriminant coefficients (0.648 and 0.450). The relative contribution in total discriminant score of 'higher wages' is higher (50.70 %) followed by 'security of job' (28.90 per cent). It infers that the above said factors influence more in the discriminant function. The established discriminant function correctly classifies two groups of migrants to the extent of 63.7 per cent. It is clear that the positive sign of the mean score of higher wages among group I indicates that they were pulled by this factor. 3. WORK PROFILE AT THE DESTINATION PLACE 1) Availability of Job in the Destination Place The most important pull factor of cardamom migrated workers is the immediate and continuous job opportunity in the destination place. Thus, an
66 132 effort was made to identify the job opportunity in the destination places of the selected respondents. The result is shown in Table 47. TABLE 47 AVAILABILITY OF JOB IN THE DESTINATION PLACE (In number) S. Classification of Migrants Availability of job No Group I Group II Group III Total 1. Yes (50.73) (37.30) (62.43) (50.09) 2. No (49.27) (62.70) (37.57) (49.91) Total (100) (100) (100) (100) Source: Field Survey Note: Figures in brackets indicate percentages to column total More than half of the total sample migrants (50.09 %) stated that there was an availability of job in their destination place and they got it from the next day of their migration. This observation was noted in an earlier study as well (Tiwari, 1991). The remaining per cent of the sample migrants did not get the job immediately. More of Group III years of age groups (62.43 %) and less of Group II years of age groups (37.30 %) had got the job quickly. About half of the migrants in the age groups of Group I years got the job immediately (50.73 %) and half of them did not get it (49.27 %). 2) Period of Waiting for the Job Opportunity It is necessary to find out that how long the migrants had to wait to get the job in the place of destination. Table 48 exhibits the result of collected information regarding the waiting days of the migrants.
67 133 TABLE 32 PERIOD OF WAITING FOR JOB IN THE DESTINATION PLACE (In number) S. Classification of Migrants Period No Group I Group II Group III Total 1. Up to one week (65.35) (40.52) (16.17) (43.51) weeks (11.88) (39.66) (66.18) (36.14) weeks (22.77) (10.34) (17.65) (16.49) 4. More than a month (0) (9.48) (0) (3.86) Total (100) (100) (100) (100) Source: Field Survey Note : Figures in brackets indicate percentages to column total Out of 285 migrants who did not get the job immediately in the destination place, majority of them (43.51 %) reported that they had to wait up to one week. A least percentage of them (3.86 %) only took more than a month to get the job. A major percentage of Group I years of age (65.35 %) and Group II years of age groups (40.52 %) got the job within a week. Majority of Group III years of migrants had got the job after one week (66.18 %). It can be concluded that the migrants could get the job in the destination place within a short period. Due to some personal reasons, some migrants did not get the job immediately. 3) Sources of Information about Job Opportunity in the Destination Place Table 49 illustrates the sources of information about the job opportunity in the destination place.
68 134 TABLE 49 SOURCES OF INFORMATION ABOUT JOB AVAILABILITY IN THE DESTINATION PLACE (In number) S. Classification of Migrants Period No Group I Group II Group III Total 1. Self enquiry (5.37) (5.95) (0) (3.85) 2. Agents (21.95) (12.43) (43.09) (25.60) 3. Estate Owners (16.58) (11.89) (6.08) (11.73) 4. Friends and relatives (56.10) (69.73) (50.83) (58.84) Total (100) (100) (100) (100) Source: Field Survey Note: Figures in brackets indicate percentages to column total Majority of the migrants (58.84 %) had got their job through their friends and relatives and only a small proportion of them (3.85 %) get in to the job by self enquiry. The statistical individual data of different age groups also show the same results per cent of Group I, per cent of Group II and per cent of Group III got the job through friends and relatives. Job agents either in native places or in destination places have also played a significant role in employing the cardamom labourer in the destination place. 4) Year of Migration According to the 2001 census, migration during the decade with duration of residence of 0-9 years, the rural out- migration constituted the majority with per cent. The general information gathered by the researcher from the study area is that the migration to the cardamom estates
69 135 was taking place since the time immemorial. So an attempt was made to find out the year of migration of the respondents since it is important to study the experience of them in that particular field. The years in which the decision to migrate was ascertained from the sample migrants and shown in Table 50. TABLE 50 YEAR OF MIGRATION (In number) S. Year of Classification of Migrants No Migration Group I Group II Group III Total Total 11 (5.37) 45 (21.95) 115 (56.10) 34 (16.58) 11 (5.95) 129 (69.73) 22 (11.89) 23 (12.43) 92 (50.83) 78 (43.09) 11 (6.08) 0 (0) 114 (19.97) 252 (44.13) 148 (25.92) 57 (9.98) (100) (100) (100) (100) Source: Field Survey Note: Figures in brackets indicate percentages to column total. A perusal of Table 50 shows that a majority of the respondents (44.13 %) migrated from the study area during the years followed by the year (25.92 %). More than 50 per cent of Group III migrants were gone during Migration was taken place by a majority of Group II migrants during (69.73 %) and it was done by Group I during (56.10 %). The migration during the year among the first two age groups was comparatively low and none of the third age groups migrated during the years Thus, it can be concluded that a majority of the sample migrants migrated during , which is in accordance with census 2001 results.
70 ECONOMIC IMPACT OF MIGRATION ON THE RESPONDENTS There is a considerable evidence of the impact of out migration on remittances, incomes and investment of rural households (Srivatsava, 1998). The economic impact of migration of the sample migrants was studied by taking six economic variables namely, land holdings, income, expenditure, savings, investments and debt of the migrants and it was measured by the extent of increase or decrease in the respective variable during the pre and post migration periods. All the selected variables contributed either partially or fully towards measuring the economic impact. The apparent change in each of the above selected variables had been computed during before and after migration. Thereafter, the percentage of increase or decrease was computed for each variable. In order to find out whether such variations were statistically significant or not, test of significance (ttest) was applied. For that, the following null hypothesis was framed Ho: There is no significant increase or decrease in land holding, income, expenditure, savings, investment and debt position of the selected migrants after their migration. Table 51 presents the results of the analysis:
71 137 TABLE 32 AVERAGE CHANGE IN ECONOMIC VARIABLES OF THE RESPONDENTS AFTER MIGRATION S. Before After Percentage t- Particulars No Migration Migration of Change Value 1. Land Holdings (In acres) * a. Irrigated Land * b. Un-irrigated Land 2. Income (In Rupees) (Per month) a. Agricultural Income * b. Wage or Salary * c. Income from Other * Sources 3. Expenditure (In Rupees) (Per month) a. Food expenditure * b. Rent * c. Electricity * d. Transport * e. Medical * f. Education * g. Interest payment * h. Others * 4. Savings (In Rupees) (Per month) a. Cash on hand * b. Deposits in Bank * c. In Post office * d. Chit funds Investments (In Rupees) * a. Land b. House 6. Debt (In Rupees) a. House * b. Jewellery * c. Others @ Source: Computed data based on field survey *- Significant at 5 per Not Significant
72 138 1) Land Holding of the Migrants Land holdings of selected respondents before and after migration are presented in Table 51. The total landholdings are divided in to two categories namely, irrigated land and un-irrigated land. i) Irrigated Land Table 51 shows that the average area of irrigated land before migration was 2.98 acres and it decreased to 2.49 acres after their migration. This shows a decrease of per cent. The resultant decrease in irrigated land holding of the respondents was due to the fact that they were not able to maintain properly after migration. Moreover, there were no proper and constant irrigation facilities for their land. Hence, continuous cultivation was not done so that they were made to sell out the land. In order to find out the statistical significance of the decrease in the irrigated land holdings of the respondents 't-test was applied. It can be observed from Table 51 that the calculated t- value of decrease in the irrigated land holdings during the post migration period is statistically significant at five percent level. Hence it may be concluded that irrigated land holdings of the respondents had decreased significantly after their migration period. ii) Un- Irrigated Land The average area of un-irrigated land holdings before and after migration of the respondents in Table 51 pointed out that it was 2.60 acres before migration but decreased after their migration as 2.00 acres. Hence it is clear that there was a decrease of per cent during the post migration period. The reason reported by the respondents was that their improper maintenance forced them to sell out the land. It is evident from Table 51 that the average acres of un irrigated land holdings of respondent has significantly decreased after their migration period since the calculated 't' value (3.250) is statistically significant at 5 per cent level.
73 139 2) Income of the Migrants Income is the most influencing pull factor of migration. The migrant respondents expect more income in the destination place than what they earn in their native place. An attempt was made to study the changes in the income level of the migrants' family after their migration. Income may be earned through more than one source. Some of the selected respondents still maintained their agricultural occupations in their native place and some of them doing more than one occupation. In order to analyse the difference in entire income before and after migration, the sources of income were classified in to three categories namely, agricultural income, wage or salary and income from other sources and analysis was done on each item. i) Agricultural Income Data on the average monthly income from agricultural source of the respondents before and after migration is presented in Table 51 which explains that the average monthly of the selected migrants from the agricultural and allied activities was " per month before migration and it was " per month after they migrated. It is to be noted that the average agricultural monthly income of the respondents increased after their migration ( %) even if the average acres of agricultural landholdings decreased during their post- migration period. The migrants those having irrigated land still continued in cultivation in their native places. A few of the migrants possess cardamom estates also. Hence, the agricultural income of the migrants has increased much in postmigration period. Table 51 reveals that there was an apparent increase in agricultural income after their migration and the calculated 't' value of is statistically significant at 5 per cent level. Thus, the null hypothesis is rejected and can be concluded that there is a significant increase in the agricultural income of the respondents during their post migration period.
74 140 ii) Wage and Salary Todaro's (1969) theory established the cause for migration as the higher wage differential in the place of destination. Cardamom labourers ' income is in the form of wages. It should be pointed out that some of the selected respondents had earned income as salary before their migration, but after they moved to the destination place, they earned income as wages. It is very important to study the differences in wages or salary of the selected migrant during their pre and post- migration period. For the purpose of studying the changes in the wage or salary of the selected respondents, the researcher took the average monthly wages or salary of the respondents. It can be inferred from Table 51 that the average monthly wages or salary of the respondents during pre- migration period was " and it has increased to " during their post migration period. There was an increase of per cent. This is so because, the migrants in the destination place got a continuous work throughout the year and also there is a demand for cardamom labourer. Further, the estate owners have to pay wage as per the Plantations Act which is revised from time to time. The findings were consensus with the findings of Devi et al. (2009) and Todaro's theory (1969) where there has been a considerable increase in the per capita income of the migrants due to migration. It is clear from Table 51 that the calculated 't' value (55.172) is statistically significant at 5 per cent level. As a result the null hypothesis is rejected and can be concluded that there is significant increase in the monthly wage or salary of the respondents after their migration. iii) Income from Other Sources Some of the selected respondents earned money through other sources also such as lending money for interest, doing chit funds, getting rent for their land or house, doing business in either native or in the destination place, temporary work during the holidays. It is evident from Table 51 that the average monthly income from other sources of the respondents increased from "297.06
75 141 to " after their migration. There is a per cent increase in their income. Since the calculated 't' value of is statistically significant at 5 per cent level, the null hypothesis is rejected and it is to be concluded that there is an apparent increase in income from other sources of the respondents during their post- migration period. 3) Expenditure of the Migrants Expenditure of the respondents is one of the main economic variables which has to be analyzed to find out the economic impact of the migration. Migration is taking place on the basis of the cost of living in the destination place. If the expenditure of the migrants increases in the destination place there will be decrease in number of migration. The total expenditure can be classified into food and non-food expenditure. The researcher intends to examine both food and non-food expenditure. i) Food Expenditure of the Migrants Food expenditure in this analysis contains expenditure on rice, wheat, fruits and vegetables, meat, egg and other food items. From Table 51, it is clear that the average monthly food expenditure before the migration of the sample respondents was " But there was an increase of " after their migration. This result indicates that the food expenditure increased to per cent during their post- migration period. The result shows that there is a significant change in food expenditure after the migration of the respondents. Since the calculated 't' value (34.46) is statistically significant, the null hypothesis is rejected and it is clear that the food expenditure significantly increased during the post- migration period of the respondents. ii) Expenditure towards Rent The study found that there was a short supply of houses in the destination place, since it is a hill station. Migrant labourers lack basic infrastructural facilities like housing, drinking water, toilet and the like in their residential area and they have to pay more rent even for a small house. The difference in rent expenditure before and after migration was studied and the average monthly rent expenditure
76 142 of the selected migrants in Table 51 stated that the selected migrants spent " per month for rent before they migrated, but it was increased to " per month in the destination place. Table 51 reveals that the calculated t' value (16.62) is statistically significant at 5 per cent level, the null hypothesis is rejected and hence it is concluded that there is a significant increase in the expenditure on rent of house after the respondents' migration. iii) Expenditure towards Electricity The average monthly electricity expenditure of the respondents during their pre-migration period was " It was increased by per cent (" per month) during their post- migration period. Since the calculated 't' value (30.93) is statistically significant at 5 per cent level, the null hypothesis is rejected and hence it is concluded that there is significant increase in electricity expenditure after the migration of the respondents. iv) Expenditure towards Transport The selected migrants spend more for their transportation since they frequently visit to their native places. Besides, some of them have to travel for their working estates. The average monthly expenditure on transport of the migrants before their migration was " per month and it was " per month after migration. It is clear from Table 51 that the selected migrants had to spend an increase of per cent on their transportation in the destination place. The calculated 't' value of expenditure on transport (45.08) is statistically significant at 5 per cent level. Thus, the null hypothesis is rejected and hence it can be concluded that the average monthly expenditure on transport of the migrants was significantly increased after their migration. v) Medical Expenditure Since the destination place of the selected migrants is a hill area, the researcher was interested to analyse how far the migration affects the medical expenditure of them. The selected migrant spent on an average of " per month before they migrated to the destination place. But after they moved, the
77 143 amount spent on medical expenses increased to an average of " per month. This indicates that the medical expenditure of the migrants after their migration increased by per cent. The calculated 't' value (24.68) is statistically significant at 5 per cent level so that the null hypothesis was rejected. Thus, it is clear that the average monthly medical expenditure of the respondents is significantly increased after their migration. vi) Educational Expenditure As majority of the respondents in this study were in the age group of less than 45, the educational expenditure is supposed to be high. The average monthly educational expenditure was increased by per cent after their migration. It was " during pre- migration period and " during post migration period. The calculated 't' value (8.43) is statistically significant at 5 per cent level and hence the null hypothesis is rejected. It is concluded that educational expenditure of the selected respondents during their post migration period has significantly increased. vii) Interest Payment It is clear from Table 51 that the average monthly interest paid by the respondents before migration was " and it increased to " In other words there was, per cent increase in interest payment after their migration. It is to be noted that due to the increase in income, their economic status has increased. So that they are able to get more debt on assets and that will lead to increase in interest payment. Thus, it can be said that the higher the level of interest paid, greater will be the economic position of the migrants. As regards to the interest payment, the calculated 't' value is statistically significant at 5 per cent level. Hence the null hypothesis is rejected and it is concluded that the average monthly interest payment of respondents have significantly increased. viii) Other Expenditures of the Respondents Other expenses of the respondents include the amount spent on petrol and fuel, social and family functions, recreation expenses, and so on. Before
78 144 migration, the average monthly other expenses of the respondents was "94.11, and since there was per cent increase in that expenses, it become " after they migrated. The result in Table 51 shows that the difference is significant since the calculated 't' value (15.370) is statistically significant at 5 per cent level. Hence the null hypothesis is rejected. 4) Savings of the Migrants Whenever income of a person increases, his savings also is likely to increase. The increase in savings is a positive impact of migration so that it encourages the people to move to that place of destination. To find out the impact of migration on savings, the average monthly savings of the variables such as cash on hand, deposits in bank, post office savings and chit funds of the migrants were analysed. i) Cash on Hand It is clear from Table 51 that the average monthly savings of cash of the respondents before migration was " and there was per cent increase which became " It was interesting to note that savings in the form of cash was larger than any other savings in the study area due to the fact that their destination places are hill areas and there were not enough banks, post offices and insurance companies for their savings. Moreover, the respondents wanted to keep liquid cash in their hands to meet the unexpected expenses. The positive increase of " of cash on hand after their migration is statistically significant since the calculated 't' value (8.654) is significant at 5 per cent level. Therefore, the null hypothesis is rejected. ii) Deposits in Banks The information about amount saved by the respondents in their native places through the savings bank account was collected and analyzed. It is found that the amount of savings of the respondents in Savings Bank account during before and after migration increased from " to "
79 145 This indicates that per cent of increase in the amount of savings after their migration. The calculated 't' value of is statistically significant so that the null hypothesis is rejected and concluded that the increase of " after the migration of the respondents is significant. iii) Post Office Savings Savings of the selected respondents in post offices were analysed by taking the average monthly savings in post offices before and after the migration of the respondents. The average monthly savings in post offices by the respondents before their migration was " It increased to " after their migration. There is an increase of per cent. It is to be mentioned that though the respondents were prepared to deposit in post offices, the amount of savings in post offices had not much increased due to the non availability in the study area. It is to be noted that there was an increase of " in post office savings of the respondents after migration. This increase is significant as the calculated 't' value (7.547) is statistically significant at 5 per cent level. Therefore the null hypothesis is rejected. iv) Chit Funds Savings The average monthly savings of the respondents in chit funds before and after migration was analysed. The average monthly chit fund savings of the respondents before and after migration has increased from " to " This shows an increase of per cent. Table 51 shows that the apparent increase in chit fund savings of the respondents during the post migration period is statistically significant as the calculated 't' value (7.158) is significant at 5 per cent level. Therefore, the null hypothesis is rejected. 5) Investments of the Migrants Investment by migrants on housing, land, and consumer durables is common and it is also used in working capital requirements in agriculture (Srivatsava, 1998). Investment may be in the form of land, house, agricultural
80 146 development activities, and jewels and so on. The economic impact of the respondents can clearly be described by analyzing their investment on assets before and after their migration. This study analyzed the investments made by the selected respondents before and after migration. i) Land Investments The important form of asset in rural areas is land and it is also an important source of investment (Duraisamy and Narasimhan, 2000). The migrants are interested to invest their surplus income on land either in their native places or in their destination places. The average investment on land of the respondents was " before migration and after their migration it was " This shows an increase of per cent. Since the calculated 't' value (7.866) is statistically significant, the null hypothesis was rejected. It can be concluded that the investment on land by the respondents during their post migration period is significantly increased. ii) House Investment Investment on house is the primary interest of the migrants. Since the house rent is very high in the destination place, the selected migrants wanted to build their own house. The entire surplus income of most of the respondents of the study was invested either in land or in house. The house investment of the respondents during their pre and post- migration period was analysed. The average investment on house of the respondents before migration was " , but it became " during their post- migration period which shows per cent increase in the investment on house. The result in Table 51 showed that there was an increase of " in investment on house after the migration. Since the calculated 't' value is statistically significant at 5 per cent level, the null hypothesis is rejected. Thus, it can be concluded that the average investment on house by the respondent is significantly increased.
81 147 6) Debt of the Migrants Borrowing depends on one's own economic position. Borrowing is not a burden for people if they have enough capacity to repay it. Economic impact of the selected respondents during their post- migration period can be described by analysing the average amount of borrowings of the respondents during their pre and post- migration period. i) Debt against House or Land The amount of borrowings against the house or land by the selected migrants either in their native place or in their destination place before and after migration were taken for the study. The average of debt on house or land of the respondents before migration was " After their migration, it increased to " (32.84 %). There is an increase of " in the average of debt against house or land of the respondents and it has significantly increased since the calculated 't' value (2.524) is statistically significant. Thus the null hypothesis is rejected. ii) Debt against Jewellery Borrowings against jewellery by the respondents were commonly seen in the study area. Most of the selected migrants were getting debt against jewellery very easily from their relatives, friends and neighbours and most of them had not have the habit to approach any financial institutions. To study whether there is difference in debt on jewellery during their post migration period, the average debt on jewellory of the respondents during their pre and post migration period was taken for the study. It is to be noted from Table 51 that the amount of debt on jewellery by the respondents decreased during their post migration period. It was " before migration and it was " after migration. It is to be found from Table 51 that the decrease of debt on jewellery was " The calculated 't' value shows the significance of the decrease at 5 per cent level. Hence it can be concluded that there has been significant decrease in debt on jewellery of the respondents after their migration and the null hypothesis is rejected.
82 148 iii) Debt on Other Assets The average debt on other assets such as vehicles, animals, family ceremonies, education and the like of the migrants before and after migration were analysed. It is evident from Table 51 that the average amount of debt on other assets of the respondents before migration was " After they migrated to the destination place, it was " which indicates that 16 per cent decrease in the debt. The calculated 't' value is not statistically significant at 5 per cent level. Hence, it is found that the null hypothesis is accepted and can be concluded that the average debt on other assets of the respondents during the post migration period has not significantly decreased. 5. DETAILS OF THE MIGRANTS' VISIT TO THEIR NATIVE PLACE The information given below portrays the migrants visit to native places. 1) Frequency of Visit to the Native Places Visiting is the most common way in which the migrants keep contact with their native places whether they have relatives or property or not (Santhaparaj, 1998). The information on the frequency of visit of the selected migrants to their native place is depicted in Table 52. TABLE 52 FREQUENCY OF VISIT TO THE NATIVE PLACE (In number) S. Classification of Migrants P eriod No Group I Group II Group III Total 1. Once in a month 58 (28.29) 104 (56.21) 80 (44.20) 242 (42.38) months 68 (33.17) 35 (18.92) 79 (43.65) 182 (31.88) months 22 (10.73) 35 (18.92) 0 (0) 57 (9.98) 4. Yearly once 23 (11.22) 0 (0) 0 (0) 23 (4.03) 5. Whenever there is a need 34 (16.59) 11 (5.95) 22 (12.15) 67 (11.73) Total 205 (100) 185 (100) 181 (100) 571 (100) Source: Field Survey Note: Figures in brackets indicate percentages to column total in each variable among different age groups
83 149 Table 52 shows that among the total migrants, a greater percentage (42.38 %) used to visit their native place once in a month. It is to be noted that only 4.03 per cent of them visited once in a year since none of the two age groups namely, Group II and Group III migrants visited once in a year. Among Group I, a more percentage of respondents visited 1-3 months (33.17 %). A major proportion of both Group II and Group III had visited once in month (56.21 % and %). This result of more frequent visit to the native place of the migrants is in opposition to the result of Misra (2008) that majority of the respondents visited to their native place once in a year and only a least percentage visited once in a month. 2) Reasons for Visiting to their Native Place The researcher has attempted to study the reasons of the visit to their native place of the respondents. The ranks assigned to the five identified reasons are presented in Table 53. TABLE 53 AVERAGE WEIGHTED SCORE AND THE RANK OF REASONS FOR VISITING TO THE NATIVE PLACE BY THE MIGRANTS Average Mean S. No Reasons Rank Score 1. To see parents and children I 2. To attend religious festivals II 3. To attend family ceremonies III 4. To meet friends and relatives IV 5. To entertain myself V Source: Field Survey Table 53 reveals that the weighted average scores for the reason 'To see parents and children' proves that the migrants were visiting to their native place mainly due to that reason since it ranks first. The next high mean scores and
84 150 was given by the migrants to 'To attend religious festivals' followed by 'family ceremonies' in the native place. This implies the fact that the migrants from rural areas are still bind with their cultural and family responsibilities. Since the distance between the native place and the destination place is not far away, the migrants stated that they visited to their natives in order to meet their friends and relatives also. Thus, this reason has the fourth rank. Since the destination place of the selected respondents is a hill area, entertainment such as cinemas, games, hotels and the like in the native places is also responsible for the migrants' visits and they ranked fifth. 3) Number of Family Members Stayed in the Native Place The study brought out the number of family members of the migrants who stayed back in the native place. It is shown in Table 54. TABLE 54 NUMBER OF FAMILY MEMBERS IN THE NATIVE PLACE S. N u mber of Classification of Migrants No Members Group I Group II Group III Total 1. No one (4.88) (2.70) (6.08) (4.55) (44.88) (43.78) (38.12) (42.38) Source: Field Survey (50.24) (53.52) (55.80) (53.07) TOTAL (100) (100) (100) (100) Note: Figures in brackets indicate percentages to column total in each variable among different age groups Since majority of the selected respondents were belonging to joint family and their size of the family also large, a greater percentage of the total migrants
85 151 (53.07 %) having more number of family members (3-5) in their native place. The similar findings can be seen among the individual figure of all the three age groups. It is to be mentioned that the majority of the family members of the migrants in the native place were children and elders. The children stayed in their natives because of getting better education and the elders looked after their children and their assets if any. Only a meager portion of the total migrants (4.55 %) having no one in their native place. 4) Reasons for Stayed Back of the Family Members in their Native Place An attempt was made to study the reasons for stayed back of the family members in the native place. The results are given in Table 55. TABLE 55 REASONS FOR STAYED BACK OF FAMILY MEMBERS IN THE NATIVE PLACE S. No Reasons Classification of Migrants Group I Group II Group III Total 1. Accommodation problem (36.59) (40.54) (54.14) (43.43) 2. High cost of living (2.44) (3.78) (9.92) (5.25) 3. To look after the property (13.17) (5.95) (4.97) (8.23) 4. Education of the children (43.90) (47.57) (24.86) (39.05) 5. Others (3.90) (2.16) (6.07) (4.02) Total (100) (100) (100) (100) Source: Field Survey Note: Figures in brackets indicate percentages to column total in each variable among different age groups The sample migrants stated that accommodation problem was the major reason for the staying back of the family members in the native place (43.43 %)
86 152 followed by education of the children (39.05 %). A majority of Group III years of age migrants reported the reason as 'accommodation problem' (54.14 %). Education was the main reason among Group I and Group II migrants (43.90 % and %). This is due to the fact that most of the respondents were having large family size and since the destination place is a hill area, they were not able to have proper accommodation such as housing, sanitation, transportation, communication, and a quality education. Some of them have other problems such as health problems, family feud, insufficient income, social status and family ceremonies (3.90 % of Group I, 2.16 % of Group II and 6.07 % of Group III migrants). This result is graphically represented in Figure 3.

87 6Q n FIGURE 3 REASONS FOR STAYED BACK OF FAMLY NR34BERS IN TI-C3R NATIVE PLACES Below Above 45 Total Accomodation problem shigh cost of living To look of the property L; Education of the children Others <i Ul CO
88 REMITTANCE BEHAVIOUR OF THE MIGRANTS migrants: The following information narrates the remittance behaviour of the sample 1) Frequency of Remittance Sending The major consequence of the whole process of migration is the transfer of cash or other resources to family members staying back in the village (Misra, 2008). An important and more debatable mode of linkage is remittance from migrants. The remittance is treated as a means of meeting the social obligation of the migrants towards their aged parents by providing for their well being and of retaining their inherited property right. So the migrants have to remit a sizeable portion of their income to their native places (Santhapparaj, 1998, Chand et al., 1998). The study analysed the remittances sent by the selected respondents to their native places and presented the result in Table 56 which further reinforces their links with their villages. TABLE 56 FREQUENCY OF REMITTANCE SENDING (In number) S. No Period Classification of Migrants Group I Group II Group III Total 1. Once in a month (49.76) (68.65) (56.90) (58.14) 2. Once in 6 months (5.36) (5.95) (6.08) (5.78) 3. Once in a year (10.73) (0) (6.08) (5.78) 4. On demand (29.27) (22.70) (24.86) (25.75) 5. No remittances (4.88) (2.70) (6.08) (4.55) Total (100) (100) (100) (100) Source: Field Survey Note: Figures in brackets indicate percentages to column total in each variable among different age groups
89 155 More than half of the selected 571 migrants stated that they sent remittances once in a month regularly to their native places (58.14 %) followed by whenever there is demand (25.75 %). Misra (2008) from his study also found that a majority of the respondents sent money every month. It should be noted that a least percentage of the migrants (4.55 %) have not send any money either because their families stay with them or they do not have any dependency in their natives. More percentage can be noticed in each age group classification of the respondents also (49.76 % of Group I, % of Group II and % of Group III) remit money every month. Second more per cent was given to on demand sending by all the age groups (29.27 %, % and %) and a least percentage of migrants in each of age groups have not remitted money (4.88 % of group I, 2.70 % group II and 6.08 % of group III). 2) Amount of Remittance The attempt made to study the amount of remittance send by the respondents. Table 57 presents the remittance amount of the selected migrants. TABLE 57 AMOUNT OF REMITTANCE (In number) S. Am ount Classification of Migrants No (In Rupees) Group I Group II Group III Total 1. Below (29.23) (23.33) (32.94) (28.44) (35.90) (44.45) (20.00) (33.76) (11.79) (26.11) (34.12) (23.49) 4. Above (23.08) (6.11) (12.94) (14.31) Total (100) (100) (100) (100) Source: Field Survey Note: Figures in brackets indicate percentages to column total in each variable among different age groups
90 156 Table 57 reveals that about per cent of the total migrants remitted between " per month, per cent of them remit below "1000 per month, per cent remit " per month and per cent of the migrants remit " above The individual group data shows that a major portion of Group I migrants (35.90 %) and Group II migrants (44.45 %) remitted between " per month. Since the family responsibility is comparatively more among the Group III migrants, a more percentage of them remit " (34.12 %). Figure 4 shows the diagrammatical representation of remittance sent by the sample migrants.


-2000.")
91 FIGURE 4 AMOUNT OF RBMTTANCE S3JT BY lit MGRANTS BELOW 30 YEARS OF AGE YEARS OF AGE 35 J)* Ulill 'fciowlmo» fg MB 3000» Abcue 3 J] 1DDD : 1D9I - 39DD 1DDD -3DDD -ADiJB 10C0 I ABOVE 45 YEARS OF AGE TOTAL AGE GROUP OF MGRANTS 1194% 33.'76% I alien in; m im - gam; 55-nc: juaui anc.: I SelowlOOO»10CH) ( jabo^ 300iT Ul -si
92 158 3) Reasons for Remittances Sending The decision to remit money is closely associated with demographic, social and economic factors related with migrants and their households in the rural areas (Santhapparaj, 1998). Remittances are often used for consumer goods, better housing, education of children and productive purposes (Anh, 2005, Misra, 2008, Srivastava, 1998). Thus, an attempt was made to find out the perceptions of the migrants on reasons for the remittances sending by them. In order to reveal the significant difference among the three age groups of migrants regarding their attitude towards six reasons of remittances, the one way analysis of variance has been administered. The resulted mean score of the reasons and the respective 'f statistics are presented in Table 58. TABLE 58 REASONS FOR REMITTANCE SENDING S. No Reason Classification of Migrants Group I Group II Group III f- Statistic 1. In supporting family Marriage and illness * * Clearance of debt * 4. Construction of house @ 5. Agricultural expenditure Education of the children * * TOTAL Source: Computed data based on field survey * - Significant at 5 per cent Not Significant Table 58 reveals that the maximum mean score was given by the middle age groups (Group II migrants) for the six reasons of remittances (18.034). The highly perceived factors of remittances among these age group migrants
93 159 were 'supporting family', 'education of the children' and 'the construction of house' in their native places. Their respective mean score are 4.229, and Similar perceptions can also be seen among the Group III migrants. These age groups were given score to the same variables as 4.315, and The younger age groups (Group I) also given high score on 'supporting family' (4.065) but they sent more money for construction of house than the educational purposes. The finding of the study supports the results of Chand et al. (1998), Duraisamy and Narasimhan (2000), Semyonov and Gorodzeisky (2008), Lingaraju and Samuel (2005) that the money remitted by the migrants is mainly used by their families to the day to day consumption needs, children's education and also for ceremonial purposes. Apart from this, remitted money is also used for productive purposes like purchase of agricultural input and education. It is to be concluded that remittances are thus the singular most important forms of social assistance. The significant difference regarding the attitudes among the three groups of migrants towards the reasons for remittance sending is identified in all the reasons except 'construction of house' since the calculated 'f' statistics of these factors other than 'construction of house' are significant at 5 per cent level. 7. INFRASTRUCTURAL FACILITIES IN THE DESTINATION PLACE The provision of basic facilities and even security to the migrant labourer falls in a no man's land with the neither employers nor the government catering to these requirements (Srivastava, 1998). They remain deprived of the basic amentities of life like housing, clean drinking water, health, education facilities etc (Gill, 1998). Since, the destination place of the selected migrants is a hill area, the study attempted to find out the infrastructural problems in the destination place by getting the mean score of the migrants on the variables related to infrastructure. The different attitudes of the migrants were measured and applied in Likert's five point scale namely, 'highly satisfied', 'satisfied', 'neutral', 'not satisfied' and 'highly not satisfied'. The significant difference in the attitudes was studied by the means of one
94 160 way analysis of variance. The mean score and the calculated f values of all the variables were obtained. An analysis is discussed under the following heads: 1) Accommodation The basic amenities such as proper house, clean drinking water, and electricity and so on were scored by the respondents and the mean score of all the variables in the destination place were depicted in Table 59. TABLE 59 MIGRANTS' VIEW ON ACCOMMODATION S. No Particulars Mean score of different age groups Group I Group II Group III f- Statistic 1. Concrete house * 2. Clean drinking water Electricity * * Street light * 5. Proper road Vegetables, fruits and grossary shop * * Ration shop @ Total Source: Computed data based on field survey *- Significant at 5 per cent Not Significant Table 59 shows that among the three age groups of migrants, Group II migrants has given a high total of mean scores for seven variables related to accommodation in the destination place. They were shown higher attitude towards 'clean drinking water' (3.422), 'electricity' (3.222) and 'vegetable, fruits and grossary shops' (2.984) in the destination place. Group I has given second overall high score and they also showed high attitude on the same three variables. The study found that almost all the selected migrants had clean drinking water so that all three age
95 161 groups of respondents given high score on clean drinking water in the destination place. But the facilities such as concrete house, street light and proper road are lacking in the destination place and it was found that some of the migrants were still living in a small house without electricity. It should be noted that the attitudes of the respondents were significantly differed in all the facilities except 'ration shop' which indicates all the respondents shown the same attitude on the less availability of ration shops in the destination place. Plate 4 exhibits the pictures of the accommodation in the destination place.


96 162 PLATE 4 ACCOMMODATION IN DESTINATION PLACE
SUMMARY AND CONCLUSION
 168 CHAPTER V SUMMARY AND CONCLUSION One important facet of study on population is the study of migration arising out of various social, economic or political reasons. For a large country like India, the
Data base on child labour in India: an assessment with respect to nature of data, period and uses
 Public Disclosure Authorized Public Disclosure Authorized Public Disclosure Authorized Public Disclosure Authorized Understanding Children s Work Project Working Paper Series, June 2001 1. 43860 Data base
CHAPTER 5 SOCIAL INCLUSION LEVEL
 CHAPTER 5 SOCIAL INCLUSION LEVEL Social Inclusion means involving everyone in the society, making sure all have equal opportunities in work or to take part in social activities. It means that no one should
Dimensions of rural urban migration
 CHAPTER-6 Dimensions of rural urban migration In the preceding chapter, trends in various streams of migration have been discussed. This chapter examines the various socio-economic and demographic aspects
Causes and Impact of Labour Migration: A Case Study of Punjab Agriculture
 Agricultural Economics Research Review Vol. 24 (Conference Number) 2011 pp 459-466 Causes and Impact of Labour Migration: A Case Study of Punjab Agriculture Baljinder Kaur *, J.M. Singh, B.R. Garg, Jasdev
The Socio-Economic Status of Women Entrepreneurs in Salem District of Tamil Nadu
 DOI: 10.15613/hijrh/2015/v2i1/78209 ISSN (Print): 2349-4778 HuSS: International Journal of Research in Humanities and Social Sciences, Vol 2(1), 40-48, January June 2015 ISSN (Online): 2349-8900 The Socio-Economic
Push and Pull Factors of Migration: A Case Study of Brick Kiln Migrant Workers in Punjab
 MPRA Munich Personal RePEc Archive Push and Pull Factors of Migration: A Case Study of Brick Kiln Migrant Workers in Punjab Gursharan Singh Kainth Guru Arjan Dev Institute of Development Studies January
Rural and Urban Migrants in India:
 Rural and Urban Migrants in India: 1983-2008 Viktoria Hnatkovska and Amartya Lahiri July 2014 Abstract This paper characterizes the gross and net migration flows between rural and urban areas in India
Indian Journal of Spatial Science
 Manoj Debnath 1 Sheuli Ray 2 PhD Research Scholar, Department of Geography, NEHU, Shillong PhD Research Scholar, Department of Geography, NEHU, Shillong 1 2 Indian Journal of Spatial Science EISSN: 2249-4316
Rural and Urban Migrants in India:
 Rural and Urban Migrants in India: 1983 2008 Viktoria Hnatkovska and Amartya Lahiri This paper characterizes the gross and net migration flows between rural and urban areas in India during the period 1983
Chapter 6. A Note on Migrant Workers in Punjab
 Chapter 6 A Note on Migrant Workers in Punjab Yoshifumi Usami Introduction An important aspect of Industry-Agriculture, or Urban-Rural Linkage, is that of through labor market. Unlike the backward and
COMPARISON OF SOCIO-CULTURAL AND ECONOMIC STATUS OF INDUSTRIAL MIGRANT AND LOCAL LABOURERS
 CHAPTER IX COMPARISON OF SOCIO-CULTURAL AND ECONOMIC STATUS OF INDUSTRIAL MIGRANT AND LOCAL LABOURERS In order to study the socio-cultural and economic conditions of industrial migrant labourers it becomes
MIGRATION AND DEVELOPMENT: THE KERALA EXPERIENCE. S Irudaya Rajan K C Zachariah
 MIGRATION AND DEVELOPMENT: THE KERALA EXPERIENCE INTRODUCTION S Irudaya Rajan K C Zachariah Kerala Migration Survey (1998) estimated the number of international emigrants from Kerala at 13.6 lakh and the
IS LITERACY A CAUSE OF INCREASE IN WOMEN WORK PARTICIPATION IN PUNJAB (INDIA): A REGIONAL ANALYSIS?
: A REGIONAL ANALYSIS?") IMPACT: International Journal of Research in Applied, Natural and Social Sciences (IMPACT: IJRANSS) ISSN(E): 2321-8851; ISSN(P): 2347-4580 Vol. 2, Issue 2, Feb 2014, 49-56 Impact Journals IS LITERACY A
IMPACT: International Journal of Research in Applied, Natural and Social Sciences (IMPACT: IJRANSS) ISSN(E): 2321-8851; ISSN(P): 2347-4580 Vol. 2, Issue 2, Feb 2014, 49-56 Impact Journals IS LITERACY A
Nature And Reasons For Migration: A Case Study Of Migrated Unskilled Labour To Hyderabad City
 IOSR Journal Of Humanities And Social Science (IOSR-JHSS) Volume 21, Issue11, Ver. 11 (Nov. 216) PP 21-26 e-issn: 2279-837, p-issn: 2279-845. www.iosrjournals.org Nature And Reasons For Migration: A Case
Impact of MGNREGS on Labour Supply to Agricultural Sector of Wayanad District in Kerala
 Agricultural Economics Research Review Vol. 25(No.1) January-June 2012 pp 151-155 Research Note Impact of MGNREGS on Labour Supply to Agricultural Sector of Wayanad District in Kerala Merin S. Thadathil*
REVIEW OF LITERATURE
 15 CHAPTER II REVIEW OF LITERATURE The literature related to the present study, "Rural Labour Out - Migration in Theni District: Determinants and Economic Impact among Migrant Workers in Cardamom Estates"
The Socio-economic Status of Migrant Workers in Thiruvananthapuram District of Kerala, India. By Dilip SAIKIA a
 Journal of Economic and Social Thought www.kspjournals.org Volume 3 March 2016 Issue 1 The Socio-economic Status of Migrant Workers in Thiruvananthapuram District of Kerala, India By Dilip SAIKIA a Abstract.
Migrant Child Workers: Main Characteristics
 Chapter III Migrant Child Workers: Main Characteristics The chapter deals with the various socio, educational, locations, work related and other characteristics of the migrant child workers in order to
Majorities attitudes towards minorities in (former) Candidate Countries of the European Union:
 Candidate Countries of the European Union:") Majorities attitudes towards minorities in (former) Candidate Countries of the European Union: Results from the Eurobarometer in Candidate Countries 2003 Report 3 for the European Monitoring Centre on
Majorities attitudes towards minorities in (former) Candidate Countries of the European Union: Results from the Eurobarometer in Candidate Countries 2003 Report 3 for the European Monitoring Centre on
ECONOMIC CONDITIONS OF THE MIGRANT WORKERS IN KERALA: A STUDY IN THE TRIVANDRUM DISTRICT
 (ISSN: 2321-4155), 33-46 Economics ECONOMIC CONDITIONS OF THE MIGRANT WORKERS IN KERALA: A STUDY IN THE TRIVANDRUM DISTRICT Dilip Saikia* ABSTRACT In recent years, Kerala has been experiencing a large
Migration Trend Analysis of Farmers and Agricultural Labours in Yadgir District of Karnataka, India
 International Journal of Current Microbiology and Applied Sciences ISSN: 2319-7706 Volume 7 Number 01 (2018) Journal homepage: http://www.ijcmas.com Original Research Article https://doi.org/10.20546/ijcmas.2018.701.371
Equality Awareness in Northern Ireland: General Public
 Equality Awareness in Northern Ireland: General Public Equality Awareness Survey General Public 2016 Table of Contents 1. Introduction... 1 2. Social Attitudes and Perceptions of Equality... 11 3. Perception
INTRODUCTION I. BACKGROUND
 INTRODUCTION I. BACKGROUND Bihar is the second most populous State of India, comprising a little more than 10 per cent of the country s population. Situated in the eastern part of the country, the state
Perspective on Forced Migration in India: An Insight into Classed Vulnerability
 Perspective on in India: An Insight into Classed Vulnerability By Protap Mukherjee* and Lopamudra Ray Saraswati* *Ph.D. Scholars Population Studies Division Centre for the Study of Regional Development
DETERMINANTS OF INTERNAL MIGRATION IN PAKISTAN
 The Journal of Commerce Vol.5, No.3 pp.32-42 DETERMINANTS OF INTERNAL MIGRATION IN PAKISTAN Nisar Ahmad *, Ayesha Akram! and Haroon Hussain # Abstract The migration is a dynamic process and it effects
Chapter 4. Socio-Economic Structure of the Angami and Chakhesang Women
 Chapter 4 Socio-Economic Structure of the Angami and Chakhesang Women Chapter 3 has shown how the traditional roles of women have aggravated the situation of their unemployment in recent times. The present
ASPECTS OF MIGRATION BETWEEN SCOTLAND AND THE REST OF GREAT BRITAIN
 42 ASPECTS OF MIGRATION BETWEEN SCOTLAND AND THE REST OF GREAT BRITAIN 1966-71 The 1971 Census revealed 166,590 people* resident in England and Wales who had been resident in Scotland five years previously,
Lecture 22: Causes of Urbanization
 Slide 1 Lecture 22: Causes of Urbanization CAUSES OF GROWTH OF URBAN POPULATION Urbanization, being a process of population concentration, is caused by all those factors which change the distribution of
A Study of Attitudes of Domestic Tourist in Madurai District,Tamil Nadu
 Asian Review of Social Sciences ISSN: 2249-6319 Vol.6 No.1, 2017, pp. 47-52 The Research Publication, www.trp.org.in A Study of Attitudes of Domestic Tourist in Madurai District,Tamil Nadu S. Murugaiyan
HUMAN RESOURCES MIGRATION FROM RURAL TO URBAN WORK SPHERES
 HUMAN RESOURCES MIGRATION FROM RURAL TO URBAN WORK SPHERES * Abstract 1. Human Migration is a universal phenomenon. 2. Migration is the movement of people from one locality to another and nowadays people
Abstract. Introduction
 Introduction Abstract Globalization is the most widely debated and discussed phenomenon in all over the world. The world opinion is divided on what constitute globalization and whether the globalization
International Institute for Population Sciences, Mumbai (INDIA)
") Kunal Keshri (kunalkeshri.lrd@gmail.com) (Senior Research Fellow, e-mail:) Dr. R. B. Bhagat (Professor & Head, Dept. of Migration and Urban Studies) International Institute for Population Sciences, Mumbai
Kunal Keshri (kunalkeshri.lrd@gmail.com) (Senior Research Fellow, e-mail:) Dr. R. B. Bhagat (Professor & Head, Dept. of Migration and Urban Studies) International Institute for Population Sciences, Mumbai
WOMEN EMPOWERMENT: A STUDY OF POLITICAL PARTICIPATION OF WOMEN IN SURAT
 Available online at http://www.journalijdr.com ISSN: 2230-9926 International Journal of Development Research Vol. 07, Issue, 07, pp.13786-13791, July, 2017 ORIGINAL RESEARCH ARTICLE ORIGINAL RESEARCH ARTICLE
Structural Dynamics of Various Causes of Migration in Jaipur
 Jayant Singh and Hansraj Yadav Department of Statistics, University of Rajasthan, Jaipur, India Rajesh Singh Department of Statistics, BHU, Varanasi (U.P.), India Florentin Smarandache Department of Mathematics,
CROSS BORDER MOVEMENT AND ACHIEVEMENTS OF MIGRANT WORKERS - CHANGING PERSPECTIVES ISSN
 CROSS BORDER MOVEMENT AND ACHIEVEMENTS OF MIGRANT WORKERS - CHANGING PERSPECTIVES ISSN 2277-5846 P. Mohanraj Research Scholar, Department of Management, Erode Arts and Science College, Erode, Tamil Nadu,
Incidence of Urban Poverty in Tamil Nadu: A Micro Level Socio- Economic Analysis
 Volume-8, Issue-1 February 2018 International Journal of Engineering and Management Research Page Number: 161-168 Incidence of Urban Poverty in Tamil Nadu: A Micro Level Socio- Economic Analysis Dr. R.
Education and Employment Among Muslims in India
 Education and Employment Among Muslims in India An Analysis of Patterns and Trends Rakesh Basant Context & Key Questions Sachar Committee report clearly brought out the relative deprivation of Muslims
Return of International Female Domestic Workers and Their Reintegration: A Study of Six Villages in Kerala, India
 Return of International Female Domestic Workers and Their Reintegration: A Study of Six Villages in Kerala, India Introduction The feminization of migration is a prominent reality in recent times although
Regression Model Approach for Out-Migration on Demographic Aspects of Rural Areas of Pauri Garhwal
 175 Regression Model Approach for Out-Migration on Demographic Aspects of Rural Areas of Pauri Garhwal Pankaj Bahuguna, Research Scholar, Department of Statistics, H.N.B.G.U., Srinagar (Garhwal) Uttarakhand
Formal sector internal migration in Myanmar
 Page1 Formal sector internal migration in Myanmar Dr. Michael P Griffiths, Director of Research, Social Policy & Poverty Research Group U Kyaw Zaw Oo, Research Office, Social Policy & Poverty Research
Youth labour market overview
 0 Youth labour market overview Turkey is undergoing a demographic transition. Its population comprises 74 million people and is expected to keep growing until 2050 and begin ageing in 2025 i. The share
Chapter III SOCIO- ECONOMIC ASSESSMENT OF SLUM POPULATION IN PIMPRI- CHINCHWAD URBAN AREA
 Chapter III SOCIO- ECONOMIC ASSESSMENT OF SLUM POPULATION IN PIMPRI- CHINCHWAD URBAN AREA 1. Introduction 2. Economic status of slum population in Pimpri Chinchwad urban area 2.1: Average Annual income
Vol. 6 No. 1 January ISSN: Article Particulars Received: Accepted: Published:
 Vol. 6 No. 1 January 2018 ISSN: 2320-4168 UGC Approval No: 44120 Impact Factor: 3.017 Article Particulars Received: 08.12.2017 Accepted: 13.12.2017 Published: 20.01.2018 R. NIRMALA DEVI Guest Lecturer,
HOUSEHOLD SURVEY FOR THE AFRICAN MIGRANT PROJECT: UGANDA
 HOUSEHOLD SURVEY FOR THE AFRICAN MIGRANT PROJECT: UGANDA 1. Introduction Final Survey Methodological Report In October 2009, the World Bank contracted Makerere Statistical Consult Limited to undertake
Scheduled Tribe Out-Migration in West Bengal, India
 International Research Journal of Social Sciences E-ISSN 2319 3565 Inter-Regional Variation in Scheduled Tribe Out-Migration in West, India Abstract Manoj Debnath * and Sheuli Ray North Eastern Hill University,
GROWTH OF SCHEDULED CASTE POPULATION
 CHAPTER NO. 4 GROWTH OF SCHEDULED CASTE POPULATION 4.1 INTRODUCTION 4.2 TREND IN GROWTH OF SCHEDULED CASTE POPULATION 4.2.1 TAHSIL WISE GROWTH RATE OF SCHEDULED CASTE POPULATION 4.2.2 TAHSIL WISE MALE
Wage and income differentials on the basis of gender in Indian agriculture
 MPRA Munich Personal RePEc Archive Wage and income differentials on the basis of gender in Indian agriculture Adya Prasad Pandey and Shivesh Shivesh Department of Economics, Banaras Hindu University 12.
International Journal of Pure and Applied Sciences and Technology
 Int. J. Pure Appl. Sci. Technol., 14(2) (2013), pp. 31-38 International Journal of Pure and Applied Sciences and Technology ISSN 2229-6107 Available online at www.ijopaasat.in Research Paper Assessment
Theme : Marginalised Social Groups: Dalits/Tribals/Minorities
 COMPLETED RESEARCH PROJECTS Theme : Marginalised Social Groups: Dalits/Tribals/Minorities Development of a Vulnerability to Debt Bondage Index Collaboration/s: International Labour Organization (ILO) Project
Emigrating Israeli Families Identification Using Official Israeli Databases
 Emigrating Israeli Families Identification Using Official Israeli Databases Mark Feldman Director of Labour Statistics Sector (ICBS) In the Presentation Overview of Israel Identifying emigrating families:
Characteristics of migrants in Nairobi s informal settlements
 Introduction Characteristics of migrants in Nairobi s informal settlements Rural-urban migration continues to play an important role in the urbanization process in many countries in sub-saharan Africa
Educational Attainment and Income Inequality: Evidence from Household Data of Odisha
 IOSR Journal Of Humanities And Social Science (IOSR-JHSS) Volume 9, Issue 3 (Mar. - Apr. 2013), PP 19-24 e-issn: 2279-0837, p-issn: 2279-0845. www.iosrjournals.org Educational Attainment and Income Inequality:
Majorities attitudes towards minorities in European Union Member States
 Majorities attitudes towards minorities in European Union Member States Results from the Standard Eurobarometers 1997-2000-2003 Report 2 for the European Monitoring Centre on Racism and Xenophobia Ref.
ANNUAL SURVEY REPORT: ARMENIA
 ANNUAL SURVEY REPORT: ARMENIA 2 nd Wave (Spring 2017) OPEN Neighbourhood Communicating for a stronger partnership: connecting with citizens across the Eastern Neighbourhood June 2017 ANNUAL SURVEY REPORT,
Chapter 8 Migration. 8.1 Definition of Migration
 Chapter 8 Migration 8.1 Definition of Migration Migration is defined as the process of changing residence from one geographical location to another. In combination with fertility and mortality, migration
Women Migrants and their Mental Health: A Study of Working Women Hostellers in Mumbai
 International Research Journal of Social Sciences ISSN 9 565 Vol. (9), 4-4, September (04) Women Migrants and their Mental Health: A Study of Working Women Hostellers in Mumbai Reshmi R S, Sayeed Unisa
Analysis of the Sources and Uses of Remittance by Rural Households for Agricultural Purposes in Enugu State, Nigeria
 IOSR Journal of Agriculture and Veterinary Science (IOSR-JAVS) e-issn: 2319-2380, p-issn: 2319-2372. Volume 9, Issue 2 Ver. I (Feb. 2016), PP 84-88 www.iosrjournals.org Analysis of the Sources and Uses
Migration Dynamics of Population Change in India A Theoretical Investigation Based on NSS Reports
 4 th International Conference on Multidisciplinary Research & Practice (4ICMRP-2017) P a g e 173 Migration Dynamics of Population Change in India A Theoretical Investigation Based on NSS Reports Pradip
Extended abstract. 1. Introduction
 Extended abstract Gender wage inequality among internal migrants: Evidence from India Ajay Sharma 1 and Mousumi Das 2 Email (corresponding author): ajays@iimidr.ac.in 1. Introduction Understanding the
Synopsis of the thesis entitled
 Synopsis of the thesis entitled IMPACT OF WOMEN SELF-HELP GROUPS ON THE POOR FAMILIES A Study in Slums of Serilingampally Circles I and II of the Greater Hyderabad Municipal Corporation By NUNE SRINIVASA
Female Migration for Non-Marital Purposes: Understanding Social and Demographic Correlates of Barriers
 Female Migration for Non-Marital Purposes: Understanding Social and Demographic Correlates of Barriers Dr. Mala Mukherjee Assistant Professor Indian Institute of Dalit Studies New Delhi India Introduction
COMMUNITY PERCEPTIONS OF MIGRANTS AND IMMIGRATION
 COMMUNITY PERCEPTIONS OF MIGRANTS AND IMMIGRATION 3 1 EXECUTIVE SUMMARY 4 1.1 EXECUTIVE SUMMARY INTRODUCTION This report presents the findings from a Community survey designed to measure New Zealanders
IMPACT OF CYCLONE AILA ON THE LIVELIHOOD OF THE PEOPLE OF WEST BENGAL. Kalindi Sharma Research Scholar Department of Anthropology University of Delhi
 IMPACT OF CYCLONE AILA ON THE LIVELIHOOD OF THE PEOPLE OF WEST BENGAL Kalindi Sharma Research Scholar Department of Anthropology University of Delhi The Inception: On 25 th May 2009 A tropical Cyclone
STUDY OF SECTOR WISE GROWTH AND TRENDS IN EMPLOYMENT IN MAHARASHTRA By HeenaThakkar
 STUDY OF SECTOR WISE GROWTH AND TRENDS IN EMPLOYMENT IN MAHARASHTRA By HeenaThakkar Abstract: Maharashtra enjoys a historical reputation of being among progressive and well administered States in the country.maharashtra
Challenges Of Implementation Of Right To Education (RTE) Act 2009 For Children In The Age Group In West Bengal
 Act 2009 For Children In The Age Group In West Bengal") Challenges Of Implementation Of Right To Education (RTE) Act 2009 For Children In The 10-14 Age Group In West Bengal Ankita Dey Assistant Professor and Statistician, KPC Medical College & Hospital, Jadavpur,
Challenges Of Implementation Of Right To Education (RTE) Act 2009 For Children In The 10-14 Age Group In West Bengal Ankita Dey Assistant Professor and Statistician, KPC Medical College & Hospital, Jadavpur,
SUMMARY AND CONCLUSIONS. The study on the communication behaviour of the. Todas and the Kotas of the Nilgiris district in Tamil Nadu
 CHAPTER VIII SUMMARY AND CONCLUSIONS The study on the communication behaviour of the Todas and the Kotas of the Nilgiris district in Tamil Nadu revealed a complex pattern of relationships, attitudes and
No. 1. THE ROLE OF INTERNATIONAL MIGRATION IN MAINTAINING HUNGARY S POPULATION SIZE BETWEEN WORKING PAPERS ON POPULATION, FAMILY AND WELFARE
 NKI Central Statistical Office Demographic Research Institute H 1119 Budapest Andor utca 47 49. Telefon: (36 1) 229 8413 Fax: (36 1) 229 8552 www.demografia.hu WORKING PAPERS ON POPULATION, FAMILY AND
Urban Women Workers. A Preliminary Study. Kamla Nath
 Urban Women Workers A Preliminary Study Kamla Nath Women constitute nearly a third of the working force in India. In 1961, out of a total working force of 188.4 million, 59.4 million or 31 per cent were
Access to agricultural land, youth migration and livelihoods in Tanzania
 Access to agricultural land, youth migration and livelihoods in Tanzania Ntengua Mdoe (SUA), Milu Muyanga (MSU), T.S. Jayne (MSU) and Isaac Minde (MSU/iAGRI) Presentation at the Third AAP Conference to
Factors Influencing Rural-Urban Migration from Mountainous Areas in Iran: A Case Study in West Esfahan
 European Online Journal of Natural and Social Sciences 2014; www.european-science.com Vol.3, No.3 pp. 723-728 ISSN 1805-3602 Factors Influencing Rural-Urban Migration from Mountainous Areas in Iran: A
THE ROLE OF INTERNATIONAL MIGRATION IN MAINTAINING THE POPULATION SIZE OF HUNGARY BETWEEN LÁSZLÓ HABLICSEK and PÁL PÉTER TÓTH
 THE ROLE OF INTERNATIONAL MIGRATION IN MAINTAINING THE POPULATION SIZE OF HUNGARY BETWEEN 2000 2050 LÁSZLÓ HABLICSEK and PÁL PÉTER TÓTH INTRODUCTION 1 Fertility plays an outstanding role among the phenomena
Irregular Migration in Sub-Saharan Africa: Causes and Consequences of Young Adult Migration from Southern Ethiopia to South Africa.
 Extended Abstract Irregular Migration in Sub-Saharan Africa: Causes and Consequences of Young Adult Migration from Southern Ethiopia to South Africa. 1. Introduction Teshome D. Kanko 1, Charles H. Teller
CHAPTER 3 SOCIO-ECONOMIC CONDITIONS OF MINORITIES OF INDIA
 CHAPTER 3 SOCIO-ECONOMIC CONDITIONS OF MINORITIES OF INDIA 73 List of Contents S.No. Chapter-3 Socio economic condition of Minorities of India on the Page number basis HDI indicators 3.1 Defination of
THE EMPLOYABILITY AND WELFARE OF FEMALE LABOR MIGRANTS IN INDONESIAN CITIES
 SHASTA PRATOMO D., Regional Science Inquiry, Vol. IX, (2), 2017, pp. 109-117 109 THE EMPLOYABILITY AND WELFARE OF FEMALE LABOR MIGRANTS IN INDONESIAN CITIES Devanto SHASTA PRATOMO Senior Lecturer, Brawijaya
Statistical Analysis of Corruption Perception Index across countries
 Statistical Analysis of Corruption Perception Index across countries AMDA Project Summary Report (Under the guidance of Prof Malay Bhattacharya) Group 3 Anit Suri 1511007 Avishek Biswas 1511013 Diwakar
NCERT Solutions for Class 9 Social Science Geography : Chapter 6 Population
 NCERT Solutions for Class 9 Social Science Geography : Chapter 6 Population Question 1. Choose the right answer from the four alternatives given below (i) Migrations change the number, distribution and
Rural Labour Migration: A Case Study in Villupuram district of Tamil Nadu
 Rural Labour Migration: A Case Study in Villupuram district of Tamil Nadu R. Arivazhagan Ph.D. Research Scholar, Department of Economics, Presidency College, Chennai A. Udhayakumar Department of Economics,
CHAPTER FIVE RESULTS REGARDING ACCULTURATION LEVEL. This chapter reports the results of the statistical analysis
 CHAPTER FIVE RESULTS REGARDING ACCULTURATION LEVEL This chapter reports the results of the statistical analysis which aimed at answering the research questions regarding acculturation level. 5.1 Discriminant
Community perceptions of migrants and immigration. D e c e m b e r
 Community perceptions of migrants and immigration D e c e m b e r 0 1 OBJECTIVES AND SUMMARY OBJECTIVES The purpose of this research is to build an evidence base and track community attitudes towards migrants
Chapter-5 Non-Economic workers
 Chapter-5 Non-Economic workers Different constraints are decisive for different situations, but the most fundamental constraint is limited time. Economic and medical progress have greatly increased length
ISSN: Int. J. Adv. Res. 4(11), RESEARCH ARTICLE...
, RESEARCH ARTICLE...") Journal Homepage: - www.journalijar.com Article DOI: 10.21474/IJAR01/2083 DOI URL: http://dx.doi.org/10.21474/ijar01/2083 RESEARCH ARTICLE IMPACT OF OUT-MIGRATION ON DEMOGRAPHICS: EVIDENCE FROM DARBHANGA
Journal Homepage: - www.journalijar.com Article DOI: 10.21474/IJAR01/2083 DOI URL: http://dx.doi.org/10.21474/ijar01/2083 RESEARCH ARTICLE IMPACT OF OUT-MIGRATION ON DEMOGRAPHICS: EVIDENCE FROM DARBHANGA
ANNUAL SURVEY REPORT: BELARUS
 ANNUAL SURVEY REPORT: BELARUS 2 nd Wave (Spring 2017) OPEN Neighbourhood Communicating for a stronger partnership: connecting with citizens across the Eastern Neighbourhood June 2017 1/44 TABLE OF CONTENTS
E C O N S P E A K : A J o u r n a l o f A d v a n c e s i n M a n a g e m e n t, I T a n d S o c i a l S c i e n c e s
 The Journal of Sri Krishna Research & Educational Consortium E C O N S P E A K : A J o u r n a l o f A d v a n c e s i n M a n a g e m e n t, I T a n d S o c i a l S c i e n c e s Internationally Indexed
ANNUAL SURVEY REPORT: GEORGIA
 ANNUAL SURVEY REPORT: GEORGIA 2 nd Wave (Spring 2017) OPEN Neighbourhood Communicating for a stronger partnership: connecting with citizens across the Eastern Neighbourhood June 2017 TABLE OF CONTENTS
Learning about Irregular Migration from a unique survey
 Learning about Irregular Migration from a unique survey Laura Serlenga Department of Economics University of Bari February 2005 Plan of the talk 1. Motivations 2. Summary of the SIMI contents: brief overview
Intention to stay and labor migration of Albanian doctors and nurses
 Intention to stay and labor migration of Albanian doctors and nurses Ertila DRUGA 3 rd Conference, LSEE Research Network on Social Cohesion in SEE Social Cohesion and Economic Governance 6-7 April 2017,
The Jordanian Labour Market: Multiple segmentations of labour by nationality, gender, education and occupational classes
 The Jordanian Labour Market: Multiple segmentations of labour by nationality, gender, education and occupational classes Regional Office for Arab States Migration and Governance Network (MAGNET) 1 The
Phenomenon of trust in power in Kazakhstan Introduction
 Phenomenon of trust in power in Kazakhstan Introduction One of the most prominent contemporary sociologists who studied the relation of concepts such as "trust" and "power" is the German sociologist Niklas
The Poor in the Indian Labour Force in the 1990s. Working Paper No. 128
 CDE September, 2004 The Poor in the Indian Labour Force in the 1990s K. SUNDARAM Email: sundaram@econdse.org SURESH D. TENDULKAR Email: suresh@econdse.org Delhi School of Economics Working Paper No. 128
DISCRIMINATION IN WAGES : A CASE STUDY OF MIGRANT CONSTRUCTION WORKERS IN SURAT CITY
 Journal of Economic & Social Development, Vol. - X, No. 2, December 2014 ISSN 0973-886X 57 DISCRIMINATION IN WAGES : A CASE STUDY OF MIGRANT CONSTRUCTION WORKERS IN SURAT CITY Aruna Solanki1* and Kirti
GENDER FACTS AND FIGURES URBAN NORTH WEST SOMALIA JUNE 2011
 GENDER FACTS AND FIGURES URBAN NORTH WEST SOMALIA JUNE 2011 Overview In November-December 2010, FSNAU and partners successfully piloted food security urban survey in five towns of the North West of Somalia
Political Integration of Immigrants: Insights from Comparing to Stayers, Not Only to Natives. David Bartram
 Political Integration of Immigrants: Insights from Comparing to Stayers, Not Only to Natives David Bartram Department of Sociology University of Leicester University Road Leicester LE1 7RH United Kingdom
11. Demographic Transition in Rural China:
 11. Demographic Transition in Rural China: A field survey of five provinces Funing Zhong and Jing Xiang Introduction Rural urban migration and labour mobility are major drivers of China s recent economic
NATIONAL HOUSEHOLD SURVEY: LABOUR FORCE, EMPLOYMENT, AND INCOME
 Clause No. 15 in Report No. 1 of was adopted, without amendment, by the Council of The Regional Municipality of York at its meeting held on January 23, 2014. 15 2011 NATIONAL HOUSEHOLD SURVEY: LABOUR FORCE,
Population Composition
 Unit-II Chapter-3 People of any country are diverse in many respects. Each person is unique in her/his own way. People can be distinguished by their age, sex and their place of residence. Some of the other
ABHINAV NATIONAL MONTHLY REFEREED JOURNAL OF REASEARCH IN COMMERCE & MANAGEMENT MGNREGA AND RURAL-URBAN MIGRATION IN INDIA
 MGNREGA AND RURAL-URBAN MIGRATION IN INDIA Pallav Das Lecturer in Economics, Patuck-Gala College of Commerce and Management, Mumbai, India Email: Pallav_das@yahoo.com ABSTRACT The MGNREGA is the flagship
Socio Economic status of women weavers in informal sector in Kokrajhar town-a study
 Socio Economic status of women weavers in informal sector in Kokrajhar town-a study Abstract: Roselin Basumatary Ph.D. Research Scholar, C.M.J. University, Meghalaya Email: reeba28@rediffmail.com This
Determinants of Rural-Urban Migration in Konkan Region of Maharashtra
 Agricultural Economics Research Review Vol. 24 (Conference Number) 2011 pp 503-509 Determinants of Rural-Urban Migration in Konkan Region of Maharashtra V.A. Thorat*, J.S. Dhekale, H.K. Patil and S.N.
Migration and Rural Urbanization: The Diffusion of Urban Behavior to Rural Communities in Guatemala.
 Migration and Rural Urbanization: The Diffusion of Urban Behavior to Rural Communities in Guatemala. David P. Lindstrom 1 Adriana Lopez-Ramirez 1 Elisa Muñoz-Franco 2 1 Population Studies and Training