Irish. imagine all the people. Irish in Boston
|
|
|
- Phillip Jacobs
- 5 years ago
- Views:
Transcription


1 Irish in Boston imagine all the people is a series of publica ons produced by the Boston Redevelopment Authority for the Mayor s Office of Immigrant Advancement. The series provides a comprehensive profile of Boston s diverse immigrant communi es and their numerous contribuons to the city s social, cultural and economic landscape. It is part of an ongoing effort to celebrate immigrants and gain insight into how they shape our city. Irish imagine all the people Irish step dancers at Fenway Park, Don Harney CITY OF BOSTON Martin J. Walsh Mayor 2016 Mayor Walsh, US ambassador to Ireland Kevin O'Malley and Boston Photographer Bill Bre at Greenhill's Bakery in Dorchester, Jeremiah Robinson
2 Ireland has a long history of emigra on, but since the 1990s Ireland has consistently had posi ve net migra on.1 Irish immigra on to the United States extends back to before the Revolu onary War. In the early 1800s, thousands of Irish Catholic men began moving to the urban centers of the Northeast to take advantage of job opportuni es on construc on projects such as the Erie Canal. During and following the Great Irish Famine of , millions of Irish families arrived in the United States looking to escape these condi ons. The Famine killed as many as one million people, or 12 percent of Ireland s popula on, and began a period of popula on decline in Ireland that lasted for more than half a century. Many of the Irish immigrants who came to America during the second half of the nineteenth century se led in already established Irish communi es in New York and Boston. The Irish once were the largest foreign-born popula on in Boston, but today, although large shares of the city s popula on have Irish ancestry, the foreign-born popula on is declining. The Irish economy has grown rapidly and the country has a racted many immigrants of its own. Only the United Kingdom has a larger foreign-born Irish popula on than the United States, while Australia is the third largest des na on of Irish.2 Massachuse s has the 3rd largest share (12 percent) of the es mated 125,0223 foreign-born Irish living in the United States in States with the largest concentra ons of Irish include New York (22 percent) and California (17 percent). Irish pubs on Union Street, Chris na Kim 2


3 Popula on Share Share of Foreign-Born Irish Popula on by State Almost half of the 3,213 foreign-born Irish in Boston live in Dorchester or West Roxbury. Source: U.S. Census Bureau, 2014 American Community Survey, PUMS, BRA Research Division Of the 15,466 4 foreign-born Irish residing in Massachuse s, approximately 3,213 5 live in Boston. Irish are the 12 th largest country of origin among Boston s foreign-born popula on. Overall, foreign-born Irish in Boston cons tute 1.8 percent of the city s total foreign-born residents. Boston s foreign-born Irish, though sca ered throughout the city, live mostly in the neighborhoods of Dorchester (31 percent), West Roxbury (18 percent), and South Boston (10 percent). Other neighborhoods with smaller shares are Brighton, Roslindale, and Hyde Park. 6 The U.S. Census Bureau s ACS Public Use Microdata Sample (PUMS) allows for the detailed socio-economic analysis of specific popula ons. For smaller popula ons like foreign-born Irish in Boston, a 5-year sample is required to limit varia on due to sampling error. The analysis that follows uses ACS PUMS data. 3
 or divorced, separated or widowed (16 percent).")
4 Demographics and Educa on Irish migra on has historically been dominated by males, and 57 percent of foreign-born Irish in Boston are male. Nearly 66 percent of foreign-born Irish in Boston are either married (50 percent) or divorced, separated or widowed (16 percent). Approximately 48 percent of all foreign-born Irish are between the ages of 35 and 64, and the median age of the popula on is 44 years. A smaller share of foreign-born Irish in Boston have arrived in the United States a er 2000 (36 percent) compared to all foreign born (43 percent). Slightly less than half of foreignborn Irish (49 percent) are naturalized U.S. ci zens. Only 12 percent of foreign-born Irish ages 25 years or older in Boston have not completed high school. This share is less than for all foreignborn residents (28 percent) and only slightly greater than the na veborn popula on (9 percent). Approximately 40 percent of foreign-born Irish have a high school diploma as their highest level of educa onal a ainment. While 48 percent of foreign-born Irish 25 years or older have a ended college, only 25 percent have completed at least a bachelor s degree, compared with 29 percent of the en re foreign-born popula on, and 52 percent of the na ve born. Less than 12 percent of foreign-born Irish living in Boston hold a graduate or professional degree, compared with 14 percent of all foreign-born and 22 percent of the na ve born. Irish foreign born are likely to have a high school diploma as their highest educa onal a ainment. Educa onal A ainment - Popula on 25 Years and Older U.S. Census Bureau, American Community Survey, PUMS, BRA Research Division Analysis 4
 and fewer work in white-collar jobs")

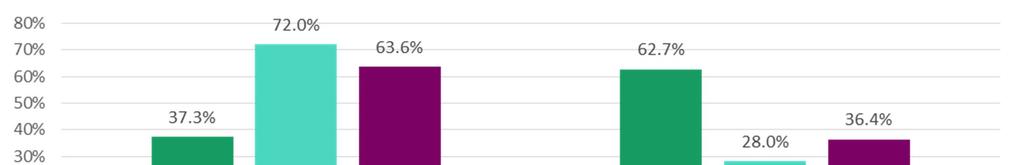
5 The labor force par cipa on rate 7 of foreign-born Irish is 72 percent compared to 68 percent for all foreign born and 69 percent for the na ve-born popula on. Even with their higher levels of educa onal a ainment, a greater share of foreign-born Irish work in what are generally categorized as bluecollar jobs (36 percent) and fewer work in white-collar jobs than the na ve born and all foreign born 8. Foreign-born Irish are underrepresented in service sector jobs (32 percent) even when compared to the na ve born (45 percent). The most common blue-collar occupa on among the Irish is construc on. Occupa ons by Na vity U.S. Census Bureau, American Community Survey, PUMS, BRA Research Division Analysis Twice as many foreign-born Irish in Boston (14 percent) are self-employed (excluding unpaid family workers), compared to all foreign born (7 percent) and the na ve born (6 percent). Fewer foreign-born Irish work in the public sector (5.5 percent) than do all foreign-born (6.8 percent) and na ve born in Boston (12.9 percent). Employment by Type of Employer U.S. Census Bureau, American Community Survey, PUMS, BRA Research Division Analysis 5


6 Imagine all the people: Age Gender Marital Status Source: U.S. Census Bureau, American Community Survey, PUMS, BRA Research Division Analysis 6


7 Housing Tenure* Housing Costs* Medical Uninsurance *Housing data are based on the householder s na vity. 7

8 8

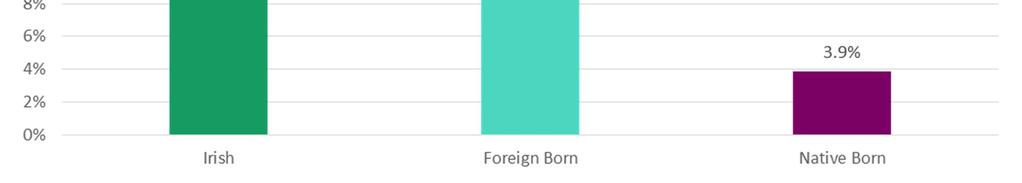
9 Standard of Living Nearly 48 percent of foreign-born Irish have achieved a middle class standard of living, compared with 45 percent of Boston s na ve-born popula on, and 29 percent of all foreign born. A family income four mes the poverty level is used as a proxy for a middle-class standard of living. The actual income needed to achieve this standard depends on the size and composi on of the family. For a two-person family in 2014, a middle class income would be at least $62,920. In contrast, only 3 percent of foreign-born Irish live below the federal poverty level compared to 20 percent for the city s popula- on. Only 3% of foreign-born Irish are poor, and 48% are at least middle class. Household Income compared to Poverty Threshold U.S. Census Bureau, American Community Survey, PUMS, BRA Research Division Analysis 9
 that calculated the value of goods and services consumed on")


10 Economic Impact Foreign-born Irish contribute to the local economy through their labor and consumer spending. The total value of their economic contribu ons was es mated using a Regional Economic Model (REMI) that calculated the value of goods and services consumed on each dollar spent. Foreign-born Irish in Boston generated total expenditures of nearly $60 million in These annual expenditures contributed slightly less than $36 million to the regional product and generated $2 million in state and local taxes. 10 In total, these expenditures supported 250 jobs in the Massachuse s economy. 11 St. Patrick s Day Parade in South Boston, Jeremiah Robinson Conclusion The number of Irish who migrate to Boston today is smaller compared to migra on in the early 20 th century. However, Ireland s ll ranks 12 th among other immigrant sending countries in the city. Foreign-born Irish in Boston contribute to the economy, culture, and civic life of the city. Foreign-born Irish are more likely to work in construc on and be self-employed. They have greater share of their popula on with a middle-class income than the na ve-born popula on and have a significantly smaller share of their popula on living below the federal poverty level than others in Boston. 10
11 1 Ruhs, M and Quinn, E., Ireland: From Rapid Immigra on to Recession, Migra on Policy Ins tute (2009). 2 UNICEF Migra on Profiles, American Fac inder website Table B05006 reports 125,022 Irish residing in the United States in 2014 with a margin of error of +/- 5,318. The 124,622 es mate reported for this analysis was tabulated from 2014 U.S. Census Bureau Public Use Microdata Sample data. Both es mates contain a margin of error due to sampling methodology. For more informa on on American Fact Finder please see: h p://fac inder.census.gov/home/ saff/main.html?_lang=en. 4 American Fac inder website Table B05006 reports 15,777 Irish residing in Massachuse s with a margin of error of +/- 2,118 in The 15,466 es mate reported for this analysis was tabulated from 2014 U.S. Census Bureau Public Use Microdata Sample data. Both es mates contain a margin of error due to sampling methodology. Lower survey response rates due to documenta on issues may result in an undercount of the popula on. 5 American Fac inder website Table B05006 reports 3,240 Irish in Boston with a margin of error of +/- 922 in The 2014 U.S. Census Bureau Public Use Microdata Sample data es mates 3,213 foreign-born Irish for Boston. Both es mates contain a margin of error due to sampling methodology American Community Survey, American Fac inder, BRA Research Analysis. 7 Defined as the share of the working-age popula on that is either currently employed or seeking work. U.S. Department of Labor, Bureau of Labor Sta s cs. (2016). 8 For a smaller popula on like foreign-born Irish in Boston, occupa ons fall into three broad categories. White collar includes managerial & professional, health care, educa- on, and arts, design entertainment, sports & media occupa ons. Service includes service, sales, office & administra ve support, community & social service occupa ons. Blue collar includes construc on, farming, fishing, and forestry, and produc on occupa- ons. Military specific occupa ons and long-term unemployed are excluded from the analysis. 9 BRA Research Division Analysis, 2014, Regional Economic Model, Inc., REMI. 10 BRA Research Division Analysis, 2014, Regional Economic Model, Inc., REMI. 11 BRA Research Division Analysis, 2014, Regional Economic Model, Inc., REMI. 11


12 Brian P. Golden, Director Produced by the Research Division Alvaro Lima, Director of Research Jonathan Lee Deputy Director Chris na Kim Research Manager Phillip Granberry Senior Researcher/Demographer Ma hew Resseger Senior Researcher/Economist Kevin Kang Research Associate Kevin Wandrei Research Assistant Interns: Xiaoxiao Ma Michael Bratsis Map by the Digital Cartography & GIS Alla Ziskin 12
Haitians. imagine all the people. Haitians in Boston
 Haitians in Boston imagine all the people is a series of publica ons produced by the Boston Redevelopment Authority for the Mayor s Office of Immigrant Advancement. The series provides a comprehensive profile
Brazilians. imagine all the people. Brazilians in Boston
 Brazilians imagine all the people Brazilians in Boston imagine all the people is a series of publications produced by the Boston Redevelopment Authority for the Mayor s Office of Immigrant Advancement.
Chinese. imagine all the people. Chinese in Boston Photos by Renato Castello & Jeremiah Robinson
 Chinese imagine all the people Chinese in Boston imagine all the people is a series of publications produced by the Boston Redevelopment Authority for the Mayor s Office of Immigrant Advancement. The series
Cape Verdeans. all the people. Cape Verdeans in Boston
 imagine Cape Verdeans all the people Cape Verdeans in Boston imagine all the people is a series of publications produced by the Boston Redevelopment Authority for the Mayor s Office of Immigrant Advancement.
Salvadorans. imagine all the people. Salvadorans in Boston
 Salvadorans imagine all the people Salvadorans in Boston imagine all the people is a series of publications produced by the Boston Redevelopment Authority for the Mayor s Office of Immigrant Advancement.
Salvadorans. in Boston
 Salvadorans in Boston Banda El Salvador at the 2013 Rose Parade in Pasadena, California. Photo by Prayitno Photography, retrieved from flickr.com/ photos/prayitnophotography (Creative Commons Attribution
Brazilians. in Boston
 Brazilians in Boston The Dewey Square mural (2012), by the Brazilian artist duo Os Gémeos (twins Otávio and Gustavo Pandolfo), spray painted on a 25-metre wide wall on the occasion of their exhibition
Overview of Boston s Population. Boston Redevelopment Authority Research Division Alvaro Lima, Director of Research September
 Overview of Boston s Population Boston Redevelopment Authority Research Division Alvaro Lima, Director of Research September - 2011 Historic Trends Boston s Population Boston reached its population peak
Brockton and Abington
 s in Massachusetts Selected Areas Brockton and Abington by Phillip Granberry, PhD and Sarah Rustan September 17, 2010 INTRODUCTION This report provides a descriptive snapshot of selected economic, social,
Latinos in Massachusetts Selected Areas: Framingham
 University of Massachusetts Boston ScholarWorks at UMass Boston Gastón Institute Publications Gastón Institute for Latino Community Development and Public Policy Publications 9-17-2010 Latinos in Massachusetts
Briefing Book- Labor Market Trends in Metro Boston
 Briefing Book- Labor Market Two other briefing books focus on the importance of formal education and ESOL courses to Boston s foreign-born residents. While there are a number of reasons why improving immigrant
Our Shared Future: U N D E R S T A N D I N G B O S T O N. #SharedFuture. Charting a Path for Immigrant Advancement in a New Political Landscape
 U N D E R S T A N D I N G B O S T O N Our Shared Future: Charting a Path for Immigrant Advancement in a New Political Landscape Wednesday, April 19 th, 2017 8:30-10:30 a.m. #SharedFuture U N D E R S T
Far From the Commonwealth: A Report on Low- Income Asian Americans in Massachusetts
 University of Massachusetts Boston ScholarWorks at UMass Boston Institute for Asian American Studies Publications Institute for Asian American Studies 1-1-2007 Far From the Commonwealth: A Report on Low-
Report prepared by: Zenaida Ravanera and Victoria Esses with Natalia Lapshina. Produced for Ci zenship and Immigra on Canada December 2014
 The Integration of Immigrants of Differing Official Language Ability and Use in Canada: Analysis of the 2006 Census and the 2007 2008 Canadian Community Health Survey Zenaida Ravanera and Victoria Esses
Louisville: Immigration Rebirth Matt Ruther, Department of Urban and Public Affairs, University of Louisville
 Louisville: Immigration Rebirth Matt Ruther, Department of Urban and Public Affairs, University of Louisville Germantown. Schnitzelburg. Irish Hill. The names of neighborhoods within Louisville s urban
Population Estimates
 Population Estimates FeBrUary 2009 Estimates of the Unauthorized Immigrant Population Residing in the United States: January 2008 MicHael HoeFer, NaNcy rytina, and BryaN c. Baker This report provides estimates
human health or the environment are concise, understandable, and readily accessible to the public [Subsec on 5 5 {c}].
![human health or the environment are concise, understandable, and readily accessible to the public [Subsec on 5 5 {c}].](/thumbs/92/107831614.jpg "human health or the environment are concise, understandable, and readily accessible to the public [Subsec on 5 5 {c}].") 6.0 Environmental Jus ce This sec on describes the legal and regulatory context for considering environmental jus ce as part of capital infrastructure projects, the methods used to iden fy minority and/or
6.0 Environmental Jus ce This sec on describes the legal and regulatory context for considering environmental jus ce as part of capital infrastructure projects, the methods used to iden fy minority and/or
The foreign born are more geographically concentrated than the native population.
 The Foreign-Born Population in the United States Population Characteristics March 1999 Issued August 2000 P20-519 This report describes the foreign-born population in the United States in 1999. It provides
Geographic Mobility Central Pennsylvania
 Geographic Mobility Central Pennsylvania Centre, Clinton, Columbia, Lycoming, Mifflin, Montour, Northumberland, Snyder, and Union Counties Central Pennsylvania Workforce Development Corporation (CPWDC)
Foreign Migration to the Cleveland-Akron-Lorain Metropolitan Area From 1995 to 2000
 EngagedScholarship@CSU Urban Publications Maxine Goodman Levin College of Urban Affairs 12-22-2005 Foreign Migration to the Cleveland-Akron-Lorain Metropolitan Area From 1995 to 2000 Mark Salling, m.salling@csuohio.edu
Characteristics of Poverty in Minnesota
 Characteristics of Poverty in Minnesota by Dennis A. Ahlburg P overty and rising inequality have often been seen as the necessary price of increased economic efficiency. In this view, a certain amount
CENSUS ANALYSIS. St. BRENDAN s PARISH, FLEMINGTON 2011 Census Details
 CENSUS ANALYSIS The Pastoral Research Office of the Australian Catholic Bishops Conference, auspiced by the Australian Catholic University in Fitzroy, has in January released the 2011 census data for each
Racial Inequities in Montgomery County
 W A S H I N G T O N A R E A R E S E A R C H I N I T I A T I V E Racial Inequities in Montgomery County Leah Hendey and Lily Posey December 2017 Montgomery County, Maryland, faces a challenge in overcoming
Institute for Public Policy and Economic Analysis
 Institute for Public Policy and Economic Analysis The Institute for Public Policy and Economic Analysis at Eastern Washington University will convey university expertise and sponsor research in social,
Pulling Open the Sticky Door
 Pulling Open the Sticky Door Social Mobility among Latinos in Nebraska Lissette Aliaga-Linares Social Demographer Office of Latino/Latin American Studies (OLLAS) University of Nebraska at Omaha Overview
EMBARGOED UNTIL THURSDAY 9/5 AT 12:01 AM
 EMBARGOED UNTIL THURSDAY 9/5 AT 12:01 AM Poverty matters No. 1 It s now 50/50: chicago region poverty growth is A suburban story Nationwide, the number of people in poverty in the suburbs has now surpassed
Demographic Data. Comprehensive Plan
 Comprehensive Plan 2010-2030 4 Demographic Data Population and demographics have changed over the past several decades in the City of Elwood. It is important to incorporate these shifts into the planning
Racial Inequities in Fairfax County
 W A S H I N G T O N A R E A R E S E A R C H I N I T I A T I V E Racial Inequities in Fairfax County Leah Hendey and Lily Posey December 2017 Fairfax County, Virginia, is an affluent jurisdiction, with
info Poverty in the San Diego Region SANDAG December 2013
 info December 2013 SANDAG Poverty in the San Diego Region Table of Contents Overview... 3 Background... 3 Federal Poverty Measurements... 4 Poverty Status for Individuals in the San Diego Region... 6 Demographic
Abstract. Acknowledgments
 Profile of Hired Farmworkers, 1998 Annual Averages. By Jack L. Runyan. Food and Rural Economics Division, Economic Research Service, U.S. Department of Agriculture. Agricultural Economic Report No. 790.
Table of Contents Informal economy and UDW: ILO and EU approaches,
 Table of Contents 1. Informal economy and UDW: ILO and EU approaches, Arsenio Fernandez Rodriguez, Labour Inspec on, Labour Administra on and OSH, ILO, Geneva 2. Labour inspec on prac ces to fight against
DEMOGRAPHIC AND SOCIOECONOMIC CHARACTERISTICS OF CUBAN-AMERICANS: A FIRST LOOK FROM THE U.S POPULATION CENSUS
 DEMOGRAPHIC AND SOCIOECONOMIC CHARACTERISTICS OF CUBAN-AMERICANS: A FIRST LOOK FROM THE U.S. 2000 POPULATION CENSUS Daniel J. Perez-Lopez 1 The 2000 U.S. Population Census, conducted between January and
IOM Rapid Assessment Report
 IOM Rapid Assessment Report Al Gogjali Village Baashiqa Sub District Mosul District Assessment Date: 9 January 2017 Loca on: Al Gogjali village Baashiqa sub district Mosul district Ninewa governorate Coordinates:
of Women in Economy and Business
 Profile of Women in Economy and Business Empowered lives. Resilient nations. Profile of Women in Economy and Business Chisinau, 2016 Profile of Women in Economy and Business, 2016 Author: Georgeta Mincu
IOM Resettlement Services
 A Somali-Bantu family arrives in Phoenix, USA 1 Christophe Calais 2003 Purpose and Partnership Rese lement is a some mes unrecognized yet compelling instrument and symbol of interna onal solidarity and
City Windsor 1981 Canada Census WARD 1
 City Windsor 1981 Canada Census March 2, 2012 Table of Contents... 3 POPULATION BY AGE... 4 LANGUAGE/RELIGION... 5 ETHNICITY/MOBILITY... 6 BIRTHPLACE / IMMIGRATION... 7 EDUCATION / LABOUR FORCE... 8 INDUSTRY
Tell us what you think. Provide feedback to help make American Community Survey data more useful for you.
 DP02 SELECTED SOCIAL CHARACTERISTICS IN THE UNITED STATES 2016 American Community Survey 1-Year Estimates Supporting documentation on code lists, subject definitions, data accuracy, and statistical testing
Nebraska s Foreign-Born and Hispanic/Latino Population
 January 2011 Nebraska s Foreign-Born and Hispanic/Latino Population Socio-Economic Trends, 2009 OLLAS Office of Latino/Latin American Studies (OLLAS) University of Nebraska - Omaha Off i c e o f La t i
Artists and Cultural Workers in Canadian Municipalities
 Artists and Cultural Workers in Canadian Municipalities Based on the 2011 National Household Survey Vol. 13 No. 1 Prepared by Kelly Hill Hill Strategies Research Inc., December 2014 ISBN 978-1-926674-36-0;
Bostwick Neighbourhood Profile
 Bostwick Profile For further information contact: John-Paul Sousa Planning Research Analyst Direct: (519) 661-2500 ext. 5989 I email: jpsousa@london.ca Page 1 Page 2 Population Characteristics & Age Distribution
Population and Dwelling Counts
 Release 1 Population and Dwelling Counts Population Counts Quick Facts In 2016, Conception Bay South had a population of 26,199, representing a percentage change of 5.4% from 2011. This compares to the
The Foreign-Born Population of Southeastern Pennsylvania. By Randy Capps
 The Foreign-Born Population of Southeastern Pennsylvania By Randy Capps Philadelphia June 15 th, 2016 Acknowledgments Ariel Ruiz at MPI analyzed the data and wrote the slides for this presentation. James
 Page 1 of 5 DP02 SELECTED SOCIAL CHARACTERISTICS IN THE UNITED STATES 2013 American Community Survey 1-Year Estimates Although the American Community Survey (ACS) produces population, demographic and housing
Nebraska s Foreign Born and Hispanic/Latino Population
 Nebraska s Foreign Born and Hispanic/ Demographic Trends, 1990 2008 January 15, 2010 Office of /Latin American Studies (OLLAS) University of Nebraska Omaha University of Nebraska Omaha Office of /Latin
Corporate. Report COUNCIL DATE: April 28, 2008 NO: R071 REGULAR COUNCIL. TO: Mayor & Council DATE: April 28, 2008
 Corporate NO: R071 Report COUNCIL DATE: April 28, 2008 REGULAR COUNCIL TO: Mayor & Council DATE: April 28, 2008 FROM: General Manager, Planning and Development FILE: 6600-01 SUBJECT: 2006 Census Information
A Portrait of Japanese Americans in the Chicago Metropolitan Area
 A Portrait of Japanese Americans in the Chicago Metropolitan Area Compared with the West, South, or Northeast regions in the US, the Midwest region has both the smallest Asian American population and the
Immigrants strengthen Colorado s economy, generating $42 billion of activity in 2011
 Immigrants strengthen Colorado s economy, generating $42 billion of activity in 2011 February 14, 2013 By Christopher Stiffler Economist Executive Summary The foreign-born population is a growing presence
AMERICAN MUSLIM VOTERS AND THE 2012 ELECTION A Demographic Profile and Survey of Attitudes
 AMERICAN MUSLIM VOTERS AND THE 2012 ELECTION A Demographic Profile and Survey of Attitudes Released: October 24, 2012 Conducted by Genesis Research Associates www.genesisresearch.net Commissioned by Council
Headship Rates and Housing Demand
 Headship Rates and Housing Demand Michael Carliner The strength of housing demand in recent years is related to an increase in the rate of net household formations. From March 1990 to March 1996, the average
Cultural Frames: An Analytical Model
 Figure 1.1 Cultural Frames: An Analytical Model Hyper-Selectivity/ Hypo-Selectivity Ethnic Capital Tangible and Intangible Resources Host Society Public Institutional Resources The Stereotype Promise/Threat
3RP LIVELIHOODS AND EMPLOYMENT DATA ANALYSIS Progress and Way Forward for
 3RP LIVELIHOODS AND EMPLOYMENT DATA ANALYSIS 2017 Progress and Way Forward for 2018-2019 For digital edition: This report has been dra ed by Bas en Revel under the leadership of 3RP co-chairs UNDP and
Rural America At A Glance
 Rural America At A Glance 7 Edition Between July 5 and July 6, the population of nonmetro America grew.6 percent. Net domestic migration from metro areas accounted for nearly half of this growth. Gains
Data base on child labour in India: an assessment with respect to nature of data, period and uses
 Public Disclosure Authorized Public Disclosure Authorized Public Disclosure Authorized Public Disclosure Authorized Understanding Children s Work Project Working Paper Series, June 2001 1. 43860 Data base
NAZI VICTIMS NOW RESIDING IN THE UNITED STATES: FINDINGS FROM THE NATIONAL JEWISH POPULATION SURVEY A UNITED JEWISH COMMUNITIES REPORT
 NAZI VICTIMS NOW RESIDING IN THE UNITED STATES: FINDINGS FROM THE NATIONAL JEWISH POPULATION SURVEY 2000-01 A UNITED JEWISH COMMUNITIES REPORT December, 2003 INTRODUCTION This April marked the fifty-eighth
Socio-Economic Mobility Among Foreign-Born Latin American and Caribbean Nationalities in New York City,
 Socio-Economic Mobility Among Foreign-Born Latin American and Caribbean Nationalities in New York City, 2000-2006 Center for Latin American, Caribbean & Latino Studies Graduate Center City University of
Community Meetings 2005
 Community Meetings 2005 Health Status Report for West Roxbury February 22, 2005 Presented by the Boston Public Health Commission Boston Neighborhoods Charlestown Allston- Brighton Back Bay Fenway Roxbury
The Brookings Institution Metropolitan Policy Program Robert Puentes, Fellow
 The Brookings Institution Metropolitan Policy Program Robert Puentes, Fellow A Review of New Urban Demographics and Impacts on Housing National Multi Housing Council Research Forum March 26, 2007 St. Louis,
This analysis confirms other recent research showing a dramatic increase in the education level of newly
 CENTER FOR IMMIGRATION STUDIES April 2018 Better Educated, but Not Better Off A look at the education level and socioeconomic success of recent immigrants, to By Steven A. Camarota and Karen Zeigler This
Employment, Education and Income
 This is one in a series of fact sheets that provide a profile of immigrants in. Understanding the makeup of our community is important for planning programs and services. Between 2006 and 2011, 15,465
People in crisis and emergency. 2.7 million* (total popula on: 12.4M**) (*FSNAU February, 2018 **UNFPA 2014)
 (*FSNAU February, 2018 **UNFPA 2014)") SITUATION OVERVIEW Severe drought condi ons con nue to compound the humanitarian situa on in parts of Somalia. Some areas in the north are experiencing intensifying drought condi on. Somaliland and Puntland
SITUATION OVERVIEW Severe drought condi ons con nue to compound the humanitarian situa on in parts of Somalia. Some areas in the north are experiencing intensifying drought condi on. Somaliland and Puntland
Prophetic City: Houston on the Cusp of a Changing America.
 Prophetic City: Houston on the Cusp of a Changing America. Tracking Responses to the Economic and Demographic Transformations through 36 Years of Houston Surveys Dr. Stephen L. Klineberg TACA 63rd Annual
2017 Year-End report. Operation: Burundi 4/7/2018. edit (h p://repor ng.unhcr.org/admin/structure/block/manage/block/29/configure)
") 2017 Year-End report 4/7/2018 Operation: Burundi edit (h p://repor ng.unhcr.org/admin/structure/block/manage/block/29/configure) People of Concern 6 % DECREASE IN 2017 2017 195,530 2016 208,049 2015 84,399
2017 Year-End report 4/7/2018 Operation: Burundi edit (h p://repor ng.unhcr.org/admin/structure/block/manage/block/29/configure) People of Concern 6 % DECREASE IN 2017 2017 195,530 2016 208,049 2015 84,399
A Statistical Profile of Artists and Cultural Workers in Canada Based on the 2011 National Household Survey and the Labour Force Survey
 A Statistical Profile of Artists and Cultural Workers in Canada Based on the 2011 National Household Survey and the Labour Force Survey Vol. 12 No. 2 Prepared by Kelly Hill Hill Strategies Research Inc.,
Profile of New York City s Chinese Americans: 2013 Edition
 Profile of New York City s Chinese Americans: 2013 Edition Asian American Federation Census Information Center Introduction Using data from the Census Bureau s 2006-2008 and 2009-2011 American Community
OFFICE OF THE CONTROLLER. City Services Auditor 2005 Taxi Commission Survey Report
 OFFICE OF THE CONTROLLER City Services Auditor 2005 Taxi Commission Survey Report February 7, 2006 TABLE OF CONTENTS INTRODUCTION 3 SURVEY DATA ANALYSIS 5 I. The Survey Respondents 5 II. The Reasonableness
Characteristics of People. The Latino population has more people under the age of 18 and fewer elderly people than the non-hispanic White population.
 The Population in the United States Population Characteristics March 1998 Issued December 1999 P20-525 Introduction This report describes the characteristics of people of or Latino origin in the United
Vulnerability and the Middle Class in South Africa
 Vulnerability and the Middle Class in South Africa Rocco Zizzamia, Simone Schotte and Murray Leibbrandt A SALDRU policy brief The meaning of being middle class and why it matters What makes you middle
Chapter. Describing the Relation between Two Variables Pearson Pren-ce Hall. All rights reserved
 Chapter 34 Describing the Relation between Two Variables 2010 Pearson Pren-ce Hall. All rights Section 4.1 Scatter Diagrams and Correlation 2010 Pearson Pren-ce Hall. All rights 4-2 2010 Pearson Pren-ce
Levels and trends in international migration
 Levels and trends in international migration The number of international migrants worldwide has continued to grow rapidly over the past fifteen years reaching million in 1, up from million in 1, 191 million
HR 1773: Agricultural Guestworker Act (Ag Act)
") HR 1773: Agricultural Guestworker Act (Ag Act) The Ag Act would establish a new agricultural guestworker program allowing US companies to hire foreign-born workers for temporary employment in that industry.
HR 1773: Agricultural Guestworker Act (Ag Act) The Ag Act would establish a new agricultural guestworker program allowing US companies to hire foreign-born workers for temporary employment in that industry.
Immigrants are playing an increasingly
 Trends in the Low-Wage Immigrant Labor Force, 2000 2005 THE URBAN INSTITUTE March 2007 Randy Capps, Karina Fortuny The Urban Institute Immigrants are playing an increasingly important role in the U.S.
WORKING PAPERS. No.2. Analysis of existing migratory data production systems and major data sources in eight South-East European countries
 WORKING PAPERS April 2014 Jointly for our common future Analysis of existing migratory data production systems and major data sources in eight South-East European countries No.2 Éva Gárdos Irén Gödri Working
The Tenth District s Brain Drain: Who Left and What Did It Cost?
 The Tenth District s Brain Drain: Who Left and What Did It Cost? By Deron Ferguson Most of the Tenth Federal Reserve District states experienced a brain drain, or an outmigration of highly educated people,
NEWS RELEASE. Red State Nail-biter: McCain and Obama in 47% - 47 % Dead Heat Among Hoosier Voters
 NEWS RELEASE FOR IMMEDIATE RELEASE: October 31, 2008 Contact: Michael Wolf, Associate Professor of Political Science, 260-481-6898 Andrew Downs, Assistant Professor of Political Science, 260-481-6691 Red
A PATHWAY TO THE MIDDLE CLASS: MIGRATION AND DEMOGRAPHIC CHANGE IN PRINCE GEORGE S COUNTY
 A PATHWAY TO THE MIDDLE CLASS: MIGRATION AND DEMOGRAPHIC CHANGE IN PRINCE GEORGE S COUNTY Brooke DeRenzis and Alice M. Rivlin The Brookings Greater Washington Research Program April 2007 ACKNOWLEDGEMENTS
Alberta Provincial Electoral Divisions
 Alberta Provincial Electoral Divisions Edmonton-Decore Compiled from the 2011 Census of Canada and National Household Survey Introduction This report presents the statistical profile for the Provincial
Migration Information Source - Chinese Immigrants in the United States
 Pagina 1 di 8 Chinese Immigrants in the United States By Aaron Terrazas, Jeanne Batalova Migration Policy Institute May 6, 2010 The United States is home to about 1.6 million Chinese immigrants (including
SECTION 1. Demographic and Economic Profiles of California s Population
 SECTION 1 Demographic and Economic Profiles of s Population s population has special characteristics compared to the United States as a whole. Section 1 presents data on the size of the populations of
Fanshawe Neighbourhood Profile
 Fanshawe Profile For further information contact: John-Paul Sousa Planning Research Analyst Direct: (519) 661-2500 ext. 5989 I email: jpsousa@london.ca Page 1 Page 2 Population Characteristics & Age Distribution
The Dynamics of Low Wage Work in Metropolitan America. October 10, For Discussion only
 The Dynamics of Low Wage Work in Metropolitan America October 10, 2008 For Discussion only Joseph Pereira, CUNY Data Service Peter Frase, Center for Urban Research John Mollenkopf, Center for Urban Research
APPENDIX H. Success of Businesses in the Dane County Construction Industry
 APPENDIX H. Success of Businesses in the Dane County Construction Industry Keen Independent examined the success of MBE/WBEs in the Dane County construction industry. The study team assessed whether business
RESIDENCE PERM IN ESTONIA
 RESIDENCE PERM IN ESTONIA Estonian na onal visa, Short term employment registra on 2200 Estonian residence permit, Employment ( Work permit ) 5000 Estonian residence permit, Business ac vity ( Company
The Changing Face of Texas:
 The Changing Face of Texas: Tracking Responses to the Economic and Demographic Transformations through 35 Years of Systematic Surveys Dr. Stephen L. Klineberg The Fort Worth City Council 11 October, 2016.
Study Area Maps. Profile Tables. W Broadway & Cambie St, Vancouver, BC Pitney Bowes 2016 Estimates and Projections. W Broadway & Cambie St
 Powered by PCensus Page 1 Study Area Maps Profile Tables 2016 Demographic Snapshot Population Trends Household Trends Population by Age and Sex Comparison Population by Age and Sex Household Maintainers
Population Estimates
 Population Estimates AUGUST 200 Estimates of the Unauthorized Immigrant Population Residing in the United States: January MICHAEL HOEFER, NANCY RYTINA, AND CHRISTOPHER CAMPBELL Estimating the size of the
Institute for Public Policy and Economic Analysis
 Institute for Public Policy and Economic Analysis The Institute for Public Policy and Economic Analysis at Eastern Washington University will convey university expertise and sponsor research in social,
Alberta Provincial Electoral Divisions
 Alberta Provincial Electoral Divisions Calgary-Foothills Compiled from the 2011 Census of Canada and National Household Survey Introduction This report presents the statistical profile for the Provincial
Ward 14 Parkdale-High Park City of Toronto Ward Profiles 2016 Census
 Bar Chart showing the rate of population growth between the years 2006 and 2016 for the Ward compared to the City of based on the 2006 and data. For more information, please contact Michael Wright at 416-392-7558
Profile of New York City s Bangladeshi Americans
 Profile of New York City s Bangladeshi Americans Introduction Using data from 2006-2010 and 2011-2015 American Community Survey (ACS) Selected Population Tables and the 2010 U.S. census, this profile outlines
Global Warming and the 2008 Presidential Election
 Global Warming and the 2008 Presidential Election Executive Summary Global Warming an Important Issue for Undecided Voters Nearly two out of three undecided voters say that the presidential candidates'
,CHAPTER II SUMMARY OF THE MAIN RESULTS
 ,CHAPTER II SUMMARY OF THE MAIN RESULTS 2.1 The 19~Q!,.,Sfnsusdatabase amounts to perhaps the most extensive. and most important. source of planning infqnnation the Cayman Islands has ever had. The tables
Mexicans in New York City, : A Visual Data Base
 Mexicans in New York City, 1990 2009: A Visual Data Base Center for Latin American, Caribbean & Latino Studies Graduate Center City University of New York 365 Fifth Avenue Room 5419 New York, New York
Demographic Change How the US is Coping with Aging, Immigration, and Other Challenges William H. Frey
 Demographic Change How the US is Coping with Aging, Immigration, and Other Challenges William H. Frey Brookings Institution University of Michigan www.frey-demographer.org US: Total and Age 65+ Growth,
Chapter 1: The Demographics of McLennan County
 Chapter 1: The Demographics of McLennan County General Population Since 2000, the Texas population has grown by more than 2.7 million residents (approximately 15%), bringing the total population of the
Race, Ethnicity, and Economic Outcomes in New Mexico
 Race, Ethnicity, and Economic Outcomes in New Mexico Race, Ethnicity, and Economic Outcomes in New Mexico New Mexico Fiscal Policy Project A program of New Mexico Voices for Children May 2011 The New Mexico
North York City of Toronto Community Council Area Profiles 2016 Census
 Bar Chart showing the rate of population growth between the years 2006 and 2016 for the Ward compared to the City of based on the 2006 and data. For more information, please contact Michael Wright at 416-392-7558
Backgrounder. This report finds that immigrants have been hit somewhat harder by the current recession than have nativeborn
 Backgrounder Center for Immigration Studies May 2009 Trends in Immigrant and Native Employment By Steven A. Camarota and Karen Jensenius This report finds that immigrants have been hit somewhat harder
people/hectare Ward Toronto
 Bar Chart showing the rate of population growth between the years 2006 and 2016 for the Ward compared to the City of based on the 2006 and data. For more information, please contact Michael Wright at 416-392-7558
Dominicans in New York City
 Center for Latin American, Caribbean & Latino Studies Graduate Center City University of New York 365 Fifth Avenue Room 5419 New York, New York 10016 212-817-8438 clacls@gc.cuny.edu http://web.gc.cuny.edu/lastudies
Extrapolated Versus Actual Rates of Violent Crime, California and the United States, from a 1992 Vantage Point
 Figure 2.1 Extrapolated Versus Actual Rates of Violent Crime, California and the United States, from a 1992 Vantage Point Incidence per 100,000 Population 1,800 1,600 1,400 1,200 1,000 800 600 400 200