Why Are the Danes Happier Than the Dutch?
|
|
|
- Arabella Kelley
- 5 years ago
- Views:
Transcription

1 Why Are the Danes Happier Than the Dutch? Ruut Veenhoven Sasqia Chin Hon Foei Jan Ott EHERO Working Paper 2015/02 1
2 Why Are the Danes Happier Than the Dutch? EHERO Working Paper 2015/ Authors: Ruut Veenhoven Sasqia Chin Hon Foei Jan Ott 2
3 WHY ARE THE DANES HAPPIER THAN THE DUTCH? Differences in conditions for happiness in Denmark and the Netherlands 1 Ruut Veenhoven 2, Sasqia Chin Hon Foei and Jan Ott Erasmus University Rotterdam, Netherlands, Erasmus Happiness Economics Research Organization EHERO Average happiness in Denmark and Netherlands: Trend plot Work in progress: Partial update of a paper presented at the Conference of Positive Psychology in Copenhagen veenhoven@ese.eur.nl 1
4 Conditions for happiness in Denmark and the Netherlands: Differences around 2010 and change since the 1970s Links lead to detail Condition for happiness Difference around 2010 Absolute scores Change in difference since the 1970s DK NL Difference in % range 1 Variable name in file States of Nations 2 Economy: small difference after 2006 Buying power ,0 % Buying power More rise in NL after 2006 Economic Growth ,88% -1,02 % +0,3% Economic growth 2013 NL less affected by 2006 recession 2
5 Education: slightly more investment, somewhat lower cognitive performance (but better social skill?) Gross enrollment ,1 % No difference % secondary education Pre-primary Gross Enrollment Primary Gross Enrollment Secondary Gross Enrollment Tertiairy Gross Enrollment Years in school, mean of 25+ aged 96,1% 89,0 +7,3% ,8% ,9% 120? 128? -6,5% 74 76? -2,% 12,1 11,9 +1,8% difference disappeared IQ ,8% School performance ,7% PISA mathematics ,4% No difference PISA reading ,1% No difference 3
6 PISA science ,6% No difference Demography: less populated, less growth, less migrants Density % Difference decreased DK became more dense Population growth % Diversity: slightly less diverse Ethnic diversity 0,055 0,073-1,1% EthnicDiversity1_ Ethnic diversity 0,08 0,11-0,03% EthnicDiversity2_ Religious diversity 0,23 0,73-58 % ReligiousDiversity2_2001 Immigrants 8,2 11,5-8% 4
7 Foreign Born % Difference declined Equality: Same gender inequality, less income inequality Gender inequality 0,056 0, % Income inequality 26,9 28,9-5,5% Freedom: more economic freedom, less private freedom Economic freedom: Business Economic freedom Labor 94,6 87,5 +7,4% BusinessFreedom2_2006 Difference declined 99,9 62,9 +37% LaborFreedom2_2006 Difference increased since 2005 Political freedom 1 1 0% CivilLiberties_2000s Difference unchanged since 1970s Private freedom 0,86 1,48-18% PrivateFreedom_1990s Life style: more fun, harder work Alcohol use 11,4 9,3 +8,14% Difference declined 5
8 Tobacco use 20 20,9-3,5% Declined equally much Sexual partners 9, % SexNumberPartners_2005 Work hours ,7% Difference declined Mental Health care: less psychiatric beds, more psychiatrists and psychologists Psychiatric beds % No difference Psychiatrists ,7% No difference Psychiatric nurses % PsychiatricNurses_2004 Psychologists % Psychologists2_2010 Social workers % SocialWorkersMHcare_20 04 Government: slightly bigger and better 6
9 Consumption 1,63 1, % GovConsumption1_2006 Difference declined Size 7,22 5, % GovSizeReal_2006 Difference declined Effectiveness 2,13 1,85 +6,9% GovQualTECH_2006 Difference declined Politics: equally democratic and stable Democracy 1,62 1,57 +1,3% DemocracyIndex1_2006 0,0 0,0 0% DemocracyIndex4_2000 No change in difference since 1968 Stability 0,83 0,77 +1,3% PoliticalStability2_2006 No change in difference since 1980 Public Goods: more public expense Education Expense 8,7 % 6% +22% Health expense 7,1 5,7 +15,1% HealthExpensePublic_2004 No change in difference since
10 Religion: less religious Religiousness 4,02 4,81-12% Religiousness2_ Religious diversity 0,23 0,73-58% ReligiousDiversity2_2001 Legal security: slightly better Rule of Law 1,94 1, % RuleLaw_2006 No difference Legal security 9,0 8,52 +6,8% LegalSecurity1_2006 Control of corruption 0,5 1,0 +6% Corruption2_2002 No difference anymore Sociability: More helpful, less voluntary work Helpfulness % Helpfulness_1995 Active volunteer 0,99 1,15-5% VolunteerActive_1990s Memberships 2,06 2,85-10 % MemberCivicOrganization _1990s 8
11 Values: little difference in preference, slightly less difference with practice Gap value-practice 0,47 0,61-10 % ValuePracticeGapmean_19 96 Welfare state: same rights, slightly more expense Welfare Rights 35,2 36,2-4% WelfareLaw3_ Difference decreased 15% of range in 2003 since 1980s Welfare expenditures 35,5 26,7 +27% WelfareExpense1_1996 Difference increased 25% of range in 2004 since ,4 21,8 +27 % WelfareExpense2b_2004 Difference increased 9% of range in 2004 since ,80 24,80 0% WelfareExpense3b_2004 Difference increased 32% of range in 2004 since
12 Average happiness in Denmark and The Netherlands: Trendplot

13 Buying power 11
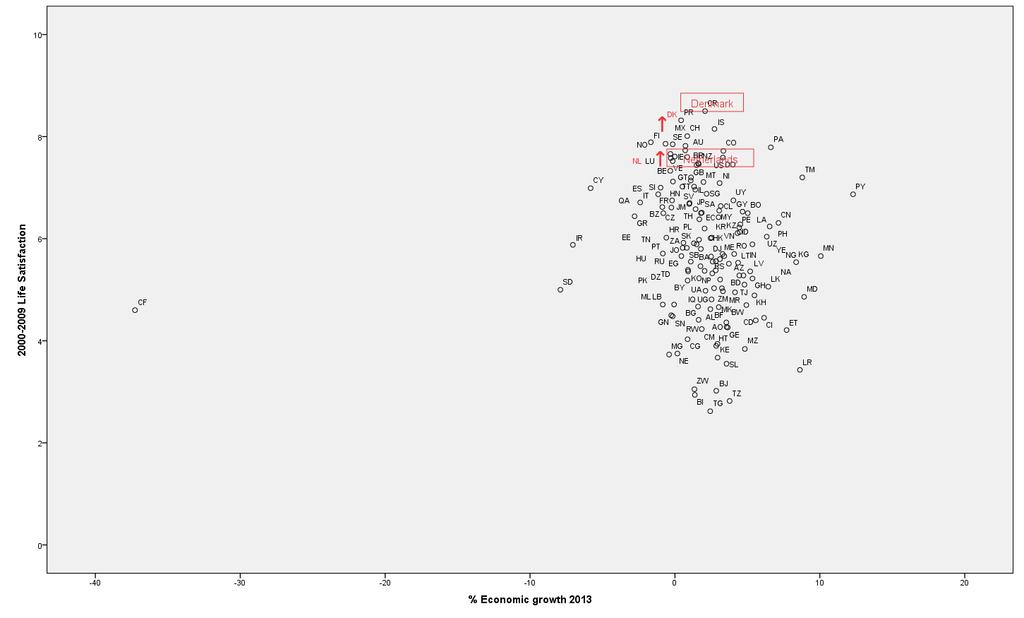
14 Economic Growth

15 Gross school enrolment Unesco Institute for Statistics, exstracted

16 Population with at least some secondary education % aged 25 and above Download UN-HDR
17 Pre-primary Gross enrolment % of children pre school age IN-HDR table. 15
18 Primary Gross Enrollment % of primary school-age population UN-HDR table 16
19 Secondary Gross Enrollment % of secondary school-age population UN-HDR table 17
20 Tertiairy Gross Enrollment % of tertiary school-age population UN-HDR table.. 18

21 Years of Schooling Average number of years of education received by people ages 25 and older, converted from education attainment levels using official durations of each level. International Human Development Indicators Accessed: 7/14/2014,2:09 PM from: Source: Barro and Lee (2013), UNESCO Institute for Statistics (2013b) and HDRO estimates based on data on educational attainment from UNESCO Institute for Statistics (2013b) and on methodology from Barro and Lee (2013). 19
 (p 311 table 11,6)")
22 Intelligence Richard Lynn and Tatu Vanhanen (2012) (p 311 table 11,6) 20
23 School performance PISA overall score Source: PISA 2012 Results: What Students Know and Can Do Average student Performance in Mathematics, reading and sciences 21
24 School performance PISA score on mathematics Source: PISA 2012 Results: What Students Know and Can Do Table I.2.3b Mean mathematics performance in PISA 2003 through
25 School performance PISA score on reading Source: PISA 2012 Results: What Students Know and Can Do Table I.4.3b Mean reading performance in PISA 2000 through
26 School performance PISA score on science Source: PISA 2012 Results: What Students Know and Can Do Table I.5.3b Mean science performance in PISA 2006 through
 download 20 February 2015, 17:47:03 25")
27 Population Density World bank 2013 Population density (people per sq. km of land area in thousands) download 20 February 2015, 17:47:03 25
 download 20 February 2015,")
28 Population growth World bank 2013 Population growth (annual %) download 20 February 2015, 17:47:03 26

29 Ethnic diversity
30 Life Satisfaction step, transformed to 0-10 (+ 10 estimates based on HappinessBW11_2000s) Ethnic diversity Danmark 8 Netherlands ,0 0,2 0,4 0,6 0,8 1, Ethnic fractionalization 28
31 Life Satisfaction step, transformed to 0-10 (+ 10 estimates based on HappinessBW11_2000s) Immigrants 10 9 Danmark 8 Netherlands % immigrants 29

32 Foreign Born Stock of foreign born in % population oecd

33 Gender inequality UNHDR table 4: Gender Inequality Index: A composite measure reflecting inequality in achievement between women and men in three dimensions: reproductive health, empowerment and the labour market. See Technical note 3 at for details on how the Gender Inequality Index is calculated. The value of GII range between 0 to 1, with 0 being 0% inequality, indicating women fare equally in comparison to men and 1 being 100% inequality, indicating women fare poorly in comparison to men 31
 download 28-02-2015")
34 Income inequality Gini 2010 GINI index (World Bank estimate) download
35 Life Satisfaction step, transformed to 0-10 (+ 10 estimates based on HappinessBW11_2000s) Business Freedom 10 9 Danmark 8 Netherlands Business Freedom (Heritage)
36 Life Satisfaction step, transformed to 0-10 (+ 10 estimates based on HappinessBW11_2000s) Labor Freedom 10 9 Danmark 8 Netherlands Regulation of labor market (Heritage)
37 Life Satisfaction step, transformed to 0-10 (+ 10 estimates based on HappinessBW11_2000s) Political freedom 10 9 Danmark 8 Netherlands early 2000s suppression of civil liberties 10 35
38 Life Satisfaction step, transformed to 0-10 (+ 10 estimates based on HappinessBW11_2000s) Private freedom 10 9 Danmark 8 Netherlands s Index of private freedom 36
 World Health Organization Regional Office for Europe, Updated: April 2014, Download")
39 Alcohol use Pure alcohol consumption, litres per capita, age 15+ European health for all database (HFA-DB) World Health Organization Regional Office for Europe, Updated: April 2014, Download
 World Health Organization Regional Office for Europe Updated: April 2014, Download 2-3-2015 38")
40 Tobacco Use % of regular daily smokers in the population, age European health for all database (HFA-DB) World Health Organization Regional Office for Europe Updated: April 2014, Download
41 Life Satisfaction step, transformed to 0-10 (+ 10 estimates based on HappinessBW11_2000s) Sexual partners 10 Danmark 8 Netherlands Number of sexual partners 39
42 Life Satisfaction step, transformed to 0-10 (+ 10 estimates based on HappinessBW11_2000s) Work hours 10 Danmark 8 Netherlands Total work time in minutes per day (males) 600 Oecd working hours per year
43 Life Satisfaction step, transformed to 0-10 (+ 10 estimates based on HappinessBW11_2000s) Psychiatric beds 10 9 Danmark 8 Netherlands Number of psychiatric beds pc 20 Psychiatric care beds, per population 2009 European health for all database (HFA-DB) World Health Organization Regional Office for Europe Updated: April 2014, Download
44 Life Satisfaction step, transformed to 0-10 (+ 10 estimates based on HappinessBW11_2000s) Psychiatrists 10 9 Danmark 8 Netherlands Number of psychiatrists pc Psychiatrists, per population, 2009 European health for all database (HFA-DB) World Health Organization Regional Office for Europe Updated: April 2014, Download
45 Life Satisfaction step, transformed to 0-10 (+ 10 estimates based on HappinessBW11_2000s) Psychiatric nurses 10 9 Danmark 8 Netherlands Number of psychiatric nurses pc 43
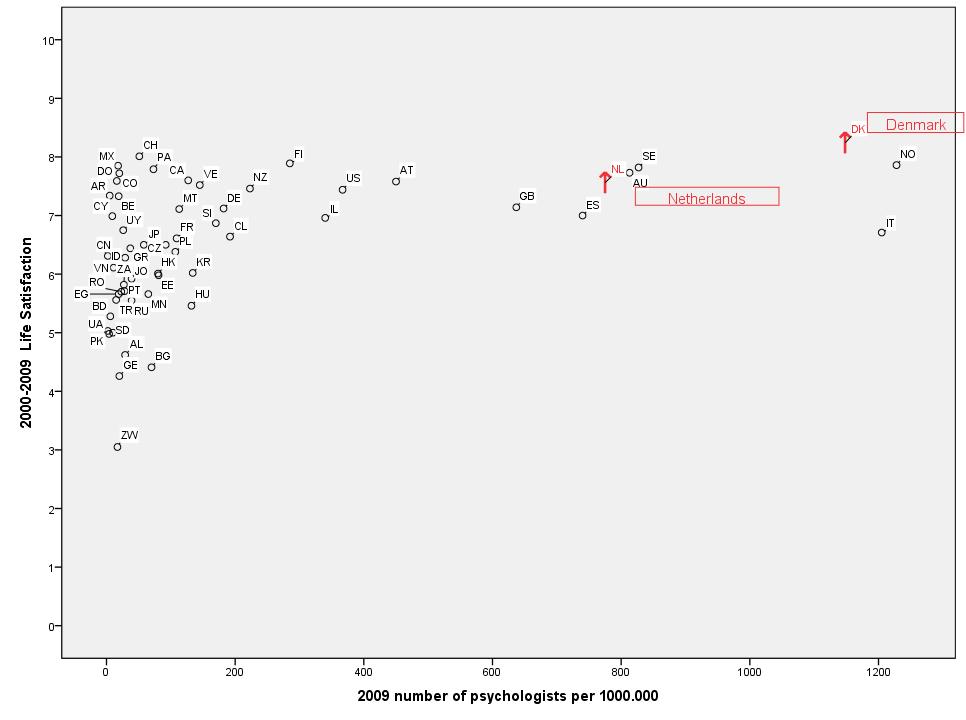
46 Psychologists 44
47 Life Satisfaction step, transformed to 0-10 (+ 10 estimates based on HappinessBW11_2000s) Social workers 10 9 Danmark 8 Netherlands Number of social workers working in mental health care pc 45
48 Life Satisfaction step, transformed to 0-10 (+ 10 estimates based on HappinessBW11_2000s) Consumption 10 9 Danmark 8 Netherlands Government Consumption as % of national consumption (Fraser) 46
49 Life Satisfaction step, transformed to 0-10 (+ 10 estimates based on HappinessBW11_2000s) Size 10 9 Danmark 8 Netherlands GovSize1Real_

50 Government effectiveness 48

51 Democracy; Index 1 49
52 Life Satisfaction step, transformed to 0-10 (+ 10 estimates based on HappinessBW11_2000s) Democracy: Index Danmark 8 Netherlands Vanhanen's Democracy Index 50

53 Stability 51
54 Life Satisfaction step, transformed to 0-10 (+ 10 estimates based on HappinessBW11_2000s) Education Expense 10 9 Danmark 8 Netherlands ,0 10,0 20, Public education expenditures in % of total government expenditures 30,0 40,0 52
55 Life Satisfaction step, transformed to 0-10 (+ 10 estimates based on HappinessBW11_2000s) Health expense 10 9 Danmark 8 Netherlands Public health Expenditure in % GDP 53
56 Life Satisfaction step, transformed to 0-10 (+ 10 estimates based on HappinessBW11_2000s) Religiousness 10 9 Danmark 8 Netherlands How important is God in your life (1-10) 54
57 Life Satisfaction step, transformed to 0-10 (+ 10 estimates based on HappinessBW11_2000s) Religious diversity 10 9 Danmark 8 Netherlands ,0 0,2 0,4 0,6 0,8 1, Religious fractionalization 55

58 Rule of Law 56
59 Life Satisfaction step, transformed to 0-10 (+ 10 estimates based on HappinessBW11_2000s) Legal security 10 9 Danmark 8 Netherlands Legal Security (Fraser) 57
60 Life Satisfaction step, transformed to 0-10 (+ 10 estimates based on HappinessBW11_2000s) Corruption 10 9 Danmark 8 Netherlands Corruption in public sector, businessmen perception 58
61 Life Satisfaction step, transformed to 0-10 (+ 10 estimates based on HappinessBW11_2000s) Helpfulness 10 Danmark 8 Netherlands ? % helped in street experiment 59
62 Life Satisfaction step, transformed to 0-10 (+ 10 estimates based on HappinessBW11_2000s) Active volunteer 10 Danmark 8 Netherlands Involvement in voluntary organisations 60
63 Life Satisfaction step, transformed to 0-10 (+ 10 estimates based on HappinessBW11_2000s) Memberships 10 Danmark 8 Netherlands membership voluntary organisation 61
64 Life Satisfaction step, transformed to 0-10 (+ 10 estimates based on HappinessBW11_2000s) Gap value-practice 10 Danmark 8 Netherlands ,5 1,0 1,5 2,0 valuepracticegapmean_
65 Life Satisfaction step, transformed to 0-10 (+ 10 estimates based on HappinessBW11_2000s) Welfare Rights 10 Danmark 8 Netherlands s (early) Generosity Index (Entitlements) 63
66 Life Satisfaction step, transformed to 0-10 (+ 10 estimates based on HappinessBW11_2000s) Welfare expenditures Social security 10 Danmark 8 Netherlands social security in % GDP 64
67 Life Satisfaction step, transformed to 0-10 (+ 10 estimates based on HappinessBW11_2000s) Welfare expenses in % gdp 10 9 Danmark 8 Netherlands Welfare Expenses in % GDP (IMF) 65
68 Life Satisfaction step, transformed to 0-10 (+ 10 estimates based on HappinessBW11_2000s) Welfare expense OECD Welfare definition 10 Danmark 8 Netherlands OECD Definition 66
69 TRENDS Trend in GDP ppp standard
70 gdp ppp standard 2011 Denmark Netherlands difference
71 Source: Created from: World Development Indicators Series : GDP per capita, PPP (constant 2011 international $) download
72 Trend in Education enrolment Education enrolment Denmark Netherlands difference ,02 74,86 5, ,56 75,95 3,61 70
73 ,21 83,03-3, ,44 86,32-4, ,6 97,41-2, ,5 2, ,39 98,95-0,56 Source: UN-HDR Trend Enrollment
74 Time Denmark Netherlands difference DK-NL
75
76 Trend mean years of schooling of adults
77 Country Denmark Netherlands Difference ,0 9,3-0, ,8 9,7 0, ,6 10,2-0, ,5 10,8-0, ,8 11,6 0, ,9 11,8 0, ,9 11,9 0, ,0 11,8 0, ,1 11,8 0, ,1 11,8 0, ,1 11,8 0, ,1 11,9 0,2 75
78 Trend school performance: PISA mathematicss Denmark Netherlands diff DK-NL
79 77
80 Trend school performance: PISA reading Denmark Netherlands difference
81 79
82 Trend school performance: PISA science Denmark Netherlands Difference
83 Trend population density (people per sq. km of land area) Country Name Denmark Netherlands Difference
84
85
86 Trend in Annual working hours Time Denmark Netherlands
87
88 Trend income inequality Gini index: measures inequality over the entire distribution of income or consumption Country Name Denmark Netherlands , ,8 27, ,
89 , , , , , ,6 31, ,0 30, ,9 28,9 87
90 Trend in alcohol use Year Denmark Netherlands ,58 7, ,40 8, ,10 8, ,89 9,77 88
91 ,68 10, ,47 11, ,84 10, ,43 11, ,91 11, ,41 11, ,50 11, ,09 11, ,47 11, ,81 11, ,40 10, ,20 10, ,26 10, ,74 10, ,90 10, ,65 10, ,85 9, ,76 10, ,94 10, ,89 9, ,14 9, ,16 9, ,27 9, ,20 10, ,69 9, ,62 10, ,69 10,06 89
92 ,56 9, ,34 9, ,54 9, ,27 9, ,28 9, ,98 9, ,98 9, ,72 9, ,14 9, ,40 9, , ,89 Source : WHO 90
93 Trend in Tobacco use Year Denmark Netherlands ,00 37, ,00 35, ,00 35,70 91
94 ,00 35, ,00 34, ,00 33, ,50 32, ,50 28, ,00 27, ,00 26, ,00 25, ,00 25, ,00 25, ,00 23, ,00 23, ,00 22, ,00 20,90 92
95 Trend in no of psychiatric beds Year Denmark Netherlands , ,52 93
96 , , , , , , , , , , , , , , , , ,45 177, ,81 176, ,9 174, ,94 174, ,83 173, ,42 170, , ,75 170, ,79 166, ,92 165, ,77 155,68 94
97 ,27 153, ,78 140, ,34 138, ,52 136, ,38 140, ,97 136, ,4 134, ,52 137, ,81 139, , ,3 95
98 Trend in no of psychiatrists per Countries Denmark Netherlands , , , , , ,10 12,22 96
99 1986 8, , , , , , ,29 13, ,79 13, ,62 14, ,05 13, ,39 14, ,96 14, ,32 13, ,55 14, ,68 15, ,99 15, ,59 16, ,81 16, ,38 17, ,43 18, ,20 18, ,89 19, , ,70 97
100 Trend in Rule of Law Rule of Law Denmark Netherlands Difference ,88 1,80 0, ,86 1,80 0, ,79 1,74 0, ,85 1,73 0,12 98
101 2003 1,91 1,71 0, ,95 1,74 0, ,97 1,70 0, ,95 1,72 0, ,04 1,74 0, ,92 1,76 0,16 Source: World Bank 99
102 Trend control of corruption Control of corruption Denmark Netherlands Difference ,29 2,21 0, ,18 2,20-0,02 100
103 ,12 2,21-0, ,21 2,17 0, ,27 2,10 0, ,32 2,02 0, ,19 1,98 0, ,35 2,07 0, ,39 2,28 0, ,32 2,19 0,13 Source: World Bank 101
104 Trend Business Freedom Entrepreneurs Business Freedom Entrepreneurs Denmark Netherlands difference ,5 7,6 0,90 102
105 2000 7,6 8,3-0, ,6 6 0, ,6 6,3 0, ,3 6 0, ,2 6,2 1, ,4 1, ,2 6,5 0, ,3 6,5 0,80 Source: Data Fraser Institute 103
106 Trend Labor Freedom Employers Labor Freedom Employers Denmark Netherlands difference ,5 2,6 0, ,7 2,8 1,90 104
107 1996 4,8 4,1 0, ,6 5,2-0, ,7 5,2-0, ,6 5-0, ,6 5,1-0, ,1 5,4-0, ,5 6,3 0, ,7 6,4 1, ,7 6,3 1,40 Source: Data Fraser Institute 105
108 Gender Inequality The Gender Empowerment Measure (GEM), is a measure of agency. It evaluates progress in advancing women's standing in political and economic forums. It examines the extent to which women and men are able to actively participate in economic and political life and take part in decision-making. Denmark Netherlands Difference 106
109 ,68 0,63 0, ,77 0,70 0, ,88 0,86 0, ,90 0,88 0,01 Source: UN-HDR 107
110 Trend in Government Consumption Government Consumption Denmark Netherlands difference ,6-3, ,7 5,9-4, ,9 6,1-4, ,7 2,5-0,80 108
111 2001 1,4 2,4-1, ,2 2,1-0, ,2 1,8-0, ,4 2-0, ,5 2,1-0, ,6 1,5 0, ,7 1,5 0,20 Source: Data Fraser Institute 109
112 Trend Government Size Denmark Netherlands difference ,1 4,3-1, ,2 4,9-1, ,1 4,8-1, ,5 4,5-1, ,1 4,6-1,50 110
113 2002 3,1 4,6-1, ,2 4,1 0, ,2 4,3-0, ,4-0, ,4 4,1 0, ,4 4,1 0,30 Source: 111
114 Trend Government effectiveness Denmark.Effectiveness NL.Effectiveness difference ,21 2,29-0, ,19 2,10-0, ,00 2,12-0, ,17 2,09 0, ,20 2,07 0, ,30 2,10 0,20 112
115 2005 2,16 1,96 0, ,32 1,87 0, ,29 1,82 0, ,19 1,86 0,33 Source: World Bank 113
116 Migration International migrant stock is the number of people born in a country other than that in which they live. It also includes refugees. Denmark Netherlands Difference
117 Source: World Bank 115
118 NOTES 1 The range is the interval between the highest and lowest country score on this variable, that is the actual range (instead of the theoretically possible range). For gdp ppp 2011 Myanmar and Macoa had the highest country score, but we decided to choose qatar as the highest country score. 1 range all countries difference dk-nl 1823 (2/1 *)100 % range 4,6 2 R. Veenhoven, States of Nations: Data set to be used for the cross-national analysis of happiness. Assessed June 25 th 2010 at: 3 Source: GDP PPP, (standard 2011), 2013 Worldbank data City states Hong Kong and Singapore excluded 116
Hong Kong, China (SAR)
") Human Development Report 2014 Sustaining Human Progress: Reducing Vulnerabilities and Building Resilience Explanatory note on the 2014 Human Development Report composite indices Hong Kong, China (SAR)
Human Development Report 2014 Sustaining Human Progress: Reducing Vulnerabilities and Building Resilience Explanatory note on the 2014 Human Development Report composite indices Hong Kong, China (SAR)
Human Development Indices and Indicators: 2018 Statistical Update. Cambodia
 Human Development Indices and Indicators: 2018 Statistical Update Briefing note for countries on the 2018 Statistical Update Introduction Cambodia This briefing note is organized into ten sections. The
Venezuela (Bolivarian Republic of)
") Human Development Report 2013 The Rise of the South: Human Progress in a Diverse World Explanatory note on 2013 HDR composite indices Venezuela (Bolivarian HDI values and rank changes in the 2013 Human
Human Development Report 2013 The Rise of the South: Human Progress in a Diverse World Explanatory note on 2013 HDR composite indices Venezuela (Bolivarian HDI values and rank changes in the 2013 Human
Human Development Indices and Indicators: 2018 Statistical Update. Eritrea
 Human Development Indices and Indicators: 2018 Statistical Update Briefing note for countries on the 2018 Statistical Update Introduction Eritrea This briefing note is organized into ten sections. The
Human Development Indices and Indicators: 2018 Statistical Update. Pakistan
 Human Development Indices and Indicators: 2018 Statistical Update Briefing note for countries on the 2018 Statistical Update Introduction Pakistan This briefing note is organized into ten sections. The
Explanatory note on the 2014 Human Development Report composite indices. Solomon Islands
 Human Development Report 2014 Sustaining Human Progress: Reducing Vulnerabilities and Building Resilience Explanatory note on the 2014 Human Development Report composite indices Solomon Islands HDI values
Venezuela (Bolivarian Republic of)
") Human Development Report 2014 Sustaining Human Progress: Reducing Vulnerabilities and Building Resilience Explanatory note on the 2014 Human Development Report composite indices Venezuela (Bolivarian HDI
Human Development Report 2014 Sustaining Human Progress: Reducing Vulnerabilities and Building Resilience Explanatory note on the 2014 Human Development Report composite indices Venezuela (Bolivarian HDI
Explanatory note on the 2014 Human Development Report composite indices. Serbia. HDI values and rank changes in the 2014 Human Development Report
 Human Development Report 2014 Sustaining Human Progress: Reducing Vulnerabilities and Building Resilience Explanatory note on the 2014 Human Development Report composite indices Serbia HDI values and rank
Human Development Indices and Indicators: 2018 Statistical Update. Indonesia
 Human Development Indices and Indicators: 2018 Statistical Update Briefing note for countries on the 2018 Statistical Update Introduction Indonesia This briefing note is organized into ten sections. The
Lao People's Democratic Republic
 Human Development Report 2014 Sustaining Human Progress: Reducing Vulnerabilities and Building Resilience Explanatory note on the 2014 Human Development Report composite indices Democratic Republic HDI
Explanatory note on the 2014 Human Development Report composite indices. Cambodia. HDI values and rank changes in the 2014 Human Development Report
 Human Development Report 2014 Sustaining Human Progress: Reducing Vulnerabilities and Building Resilience Explanatory note on the 2014 Human Development Report composite indices Cambodia HDI values and
Explanatory note on the 2014 Human Development Report composite indices. Belarus. HDI values and rank changes in the 2014 Human Development Report
 Human Development Report 2014 Sustaining Human Progress: Reducing Vulnerabilities and Building Resilience Explanatory note on the 2014 Human Development Report composite indices Belarus HDI values and
Albania. HDI values and rank changes in the 2013 Human Development Report
 Human Development Report 2013 The Rise of the South: Human Progress in a Diverse World Explanatory note on 2013 HDR composite indices Albania HDI values and rank changes in the 2013 Human Development Report
The former Yugoslav Republic of Macedonia
 Human Development Report 2014 Sustaining Human Progress: Reducing Vulnerabilities and Building Resilience Explanatory note on the 2014 Human Development Report composite indices The former Yugoslav HDI
Explanatory note on the 2014 Human Development Report composite indices. Armenia. HDI values and rank changes in the 2014 Human Development Report
 Human Development Report 2014 Sustaining Human Progress: Reducing Vulnerabilities and Building Resilience Explanatory note on the 2014 Human Development Report composite indices Armenia HDI values and
Hungary. HDI values and rank changes in the 2013 Human Development Report
 Human Development Report 2013 The Rise of the South: Human Progress in a Diverse World Explanatory note on 2013 HDR composite indices Hungary HDI values and rank changes in the 2013 Human Development Report
Explanatory note on the 2014 Human Development Report composite indices. Dominican Republic
 Human Development Report 2014 Sustaining Human Progress: Reducing Vulnerabilities and Building Resilience Explanatory note on the 2014 Human Development Report composite indices Dominican Republic HDI
Explanatory note on the 2014 Human Development Report composite indices. Palestine, State of
 Human Development Report 2014 Sustaining Human Progress: Reducing Vulnerabilities and Building Resilience Explanatory note on the 2014 Human Development Report composite indices Palestine, State of HDI
Sri Lanka. Country coverage and the methodology of the Statistical Annex of the 2015 HDR
 Human Development Report 2015 Work for human development Briefing note for countries on the 2015 Human Development Report Sri Lanka Introduction The 2015 Human Development Report (HDR) Work for Human Development
Korea s average level of current well-being: Comparative strengths and weaknesses
 How s Life in Korea? November 2017 Relative to other OECD countries, Korea s average performance across the different well-being dimensions is mixed. Although income and wealth stand below the OECD average,
Differences in National IQs behind the Eurozone Debt Crisis?
 3 Differences in National IQs behind the Eurozone Debt Crisis? Tatu Vanhanen * Department of Political Science, University of Helsinki The purpose of this article is to explore the causes of the European
Modern Slavery Country Snapshots
 Modern Slavery Country Snapshots The Country Snapshot has been developed to give the reader an immediate impression of some of the driving factors behind modern slavery within a given country. Following
Policy Implications for Human Development of Vietnam from the History of HDI
 VNU Journal of Science: Economics and Business, Vol. 30, No. 5E (2014) 40-50 Policy Implications for Human Development of Vietnam from the History of HDI Nguyễn Văn Đại *ác National Economics University,
How s Life in the Netherlands?
 How s Life in the Netherlands? November 2017 In general, the Netherlands performs well across the OECD s headline well-being indicators relative to the other OECD countries. Household net wealth was about
How s Life in Denmark?
 How s Life in Denmark? November 2017 Relative to other OECD countries, Denmark generally performs very well across the different well-being dimensions. Although average household net adjusted disposable
Japan s average level of current well-being: Comparative strengths and weaknesses
 How s Life in Japan? November 2017 Relative to other OECD countries, Japan s average performance across the different well-being dimensions is mixed. At 74%, the employment rate is well above the OECD
Chile s average level of current well-being: Comparative strengths and weaknesses
 How s Life in Chile? November 2017 Relative to other OECD countries, Chile has a mixed performance across the different well-being dimensions. Although performing well in terms of housing affordability
How s Life in Sweden?
 How s Life in Sweden? November 2017 On average, Sweden performs very well across the different well-being dimensions relative to other OECD countries. In 2016, the employment rate was one of the highest
How s Life in Turkey?
 How s Life in Turkey? November 2017 Relative to other OECD countries, Turkey has a mixed performance across the different well-being dimensions. At 51% in 2016, the employment rate in Turkey is the lowest
How s Life in Norway?
 How s Life in Norway? November 2017 Relative to other OECD countries, Norway performs very well across the OECD s different well-being indicators and dimensions. Job strain and long-term unemployment are
8. REGIONAL DISPARITIES IN GDP PER CAPITA
 8. REGIONAL DISPARITIES IN GDP PER CAPITA GDP per capita varies significantly among OECD countries (Figure 8.1). In 2003, GDP per capita in Luxembourg (USD 53 390) was more than double the OECD average
How s Life in France?
 How s Life in France? November 2017 Relative to other OECD countries, France s average performance across the different well-being dimensions is mixed. While household net adjusted disposable income stands
How s Life in Germany?
 How s Life in Germany? November 2017 Relative to other OECD countries, Germany performs well across most well-being dimensions. Household net adjusted disposable income is above the OECD average, but household
How s Life in the United Kingdom?
 How s Life in the United Kingdom? November 2017 On average, the United Kingdom performs well across a number of well-being indicators relative to other OECD countries. At 74% in 2016, the employment rate
How s Life in the United States?
 How s Life in the United States? November 2017 Relative to other OECD countries, the United States performs well in terms of material living conditions: the average household net adjusted disposable income
BRAND. Cross-national evidence on the relationship between education and attitudes towards immigrants: Past initiatives and.
 Cross-national evidence on the relationship between education and attitudes towards immigrants: Past initiatives and future OECD directions EMPLOYER BRAND Playbook Promoting Tolerance: Can education do
How s Life in Ireland?
 How s Life in Ireland? November 2017 Relative to other OECD countries, Ireland s performance across the different well-being dimensions is mixed. While Ireland s average household net adjusted disposable
How s Life in Canada?
 How s Life in Canada? November 2017 Canada typically performs above the OECD average level across most of the different well-indicators shown below. It falls within the top tier of OECD countries on household
How s Life in Slovenia?
 How s Life in Slovenia? November 2017 Slovenia s average performance across the different well-being dimensions is mixed when assessed relative to other OECD countries. The average household net adjusted
Italy s average level of current well-being: Comparative strengths and weaknesses
 How s Life in Italy? November 2017 Relative to other OECD countries, Italy s average performance across the different well-being dimensions is mixed. The employment rate, about 57% in 2016, was among the
A COMPARISON OF ARIZONA TO NATIONS OF COMPARABLE SIZE
 A COMPARISON OF ARIZONA TO NATIONS OF COMPARABLE SIZE A Report from the Office of the University Economist July 2009 Dennis Hoffman, Ph.D. Professor of Economics, University Economist, and Director, L.
How s Life in Belgium?
 How s Life in Belgium? November 2017 Relative to other countries, Belgium performs above or close to the OECD average across the different wellbeing dimensions. Household net adjusted disposable income
How s Life in Austria?
 How s Life in Austria? November 2017 Austria performs close to the OECD average in many well-being dimensions, and exceeds it in several cases. For example, in 2015, household net adjusted disposable income
How s Life in the Czech Republic?
 How s Life in the Czech Republic? November 2017 Relative to other OECD countries, the Czech Republic has mixed outcomes across the different well-being dimensions. Average earnings are in the bottom tier
Measuring Economic Freedom: Better Without Size of Government
 Soc Indic Res DOI 10.1007/s11205-016-1508-x Measuring Economic Freedom: Better Without Size of Government Jan Ott 1 Accepted: 17 November 2016 The Author(s) 2016. This article is published with open access
How s Life in Greece?
 How s Life in Greece? November 2017 Relative to other OECD countries, Greece has a mixed performance across the different well-being dimensions. Material conditions in Greece are generally below the OECD
Measuring Social Inclusion
 Measuring Social Inclusion Measuring Social Inclusion Social inclusion is a complex and multidimensional concept that cannot be measured directly. To represent the state of social inclusion in European
How s Life in New Zealand?
 How s Life in New Zealand? November 2017 On average, New Zealand performs well across the different well-being indicators and dimensions relative to other OECD countries. It has higher employment and lower
How s Life in Switzerland?
 How s Life in Switzerland? November 2017 On average, Switzerland performs well across the OECD s headline well-being indicators relative to other OECD countries. Average household net adjusted disposable
Online Supplementary Document
 Online Supplementary Document Calu Costa et al. Gender bias in careseeking practices in 57 low and middle income countries J Glob Health 2017;7:010418 Supplementary Table 1 - Careseeking questions in DHS
How s Life in Portugal?
 How s Life in Portugal? November 2017 Relative to other OECD countries, Portugal has a mixed performance across the different well-being dimensions. For example, it is in the bottom third of the OECD in
How s Life in Hungary?
 How s Life in Hungary? November 2017 Relative to other OECD countries, Hungary has a mixed performance across the different well-being dimensions. It has one of the lowest levels of household net adjusted
How s Life in the Slovak Republic?
 How s Life in the Slovak Republic? November 2017 Relative to other OECD countries, the average performance of the Slovak Republic across the different well-being dimensions is very mixed. Material conditions,
How s Life in Mexico?
 How s Life in Mexico? November 2017 Relative to other OECD countries, Mexico has a mixed performance across the different well-being dimensions. At 61% in 2016, Mexico s employment rate was below the OECD
How s Life in Estonia?
 How s Life in Estonia? November 2017 Relative to other OECD countries, Estonia s average performance across the different well-being dimensions is mixed. While it falls in the bottom tier of OECD countries
Convergence: a narrative for Europe. 12 June 2018
 Convergence: a narrative for Europe 12 June 218 1.Our economies 2 Luxembourg Ireland Denmark Sweden Netherlands Austria Finland Germany Belgium United Kingdom France Italy Spain Malta Cyprus Slovenia Portugal
Spain s average level of current well-being: Comparative strengths and weaknesses
 How s Life in Spain? November 2017 Relative to other OECD countries, Spain s average performance across the different well-being dimensions is mixed. Despite a comparatively low average household net adjusted
The Demographic Profile of Qatar
 UNITED NATIONS The Demographic Profile of Qatar Population Trends - Mortality - Fertility - Age Structure - Urbanization - International Migration - Education and Youth Unemployment Population Trends Population
Part Seven: Public Policy
 Part Seven: Public Policy Justice is itself the great standing policy of civil society; and any eminent departure from it, under any circumstances, lies under the suspicion of being no policy at all. Edmund
ARMENIA EDUCATION, TRAINING AND EMPLOYMENT DEVELOPMENTS 2017 ARMENI 01
 ARMENIA EDUCATION, TRAINING AND EMPLOYMENT DEVELOPMENTS 2017 ARMENI 01 The contents of this paper are the sole responsibility of the ETF and do not necessarily reflect the views of the EU institutions.
How s Life in Australia?
 How s Life in Australia? November 2017 In general, Australia performs well across the different well-being dimensions relative to other OECD countries. Air quality is among the best in the OECD, and average
How s Life in Poland?
 How s Life in Poland? November 2017 Relative to other OECD countries, Poland s average performance across the different well-being dimensions is mixed. Material conditions are an area of comparative weakness:
GDP per capita was lowest in the Czech Republic and the Republic of Korea. For more details, see page 3.
 International Comparisons of GDP per Capita and per Hour, 1960 9 Division of International Labor Comparisons October 21, 2010 Table of Contents Introduction.2 Charts...3 Tables...9 Technical Notes.. 18
The Demographic Profile of Somalia
 UNITED NATIONS The Demographic Profile of Somalia Population Trends - Mortality - Fertility - Age Structure - Urbanization - International Migration - Education and Youth Unemployment Population Trends
How s Life in Germany?
 October 2015 How s Life in Germany? Additional information, including the data used in this country note, can be found here: www.oecd.org/statistics/hows-life-2015-country-notes-data.xlsx HOW S LIFE IN
African Economic Development, IIB. Economic and Human Development: Concepts and Measurement
 African Economic Development, IIB. Economic and Human Development: Concepts and Measurement May 9, 2012 Arch Ritter See Nnadozie Textbook, Chapter 3 plus class notes. Note: concepts of income distribution
How s Life in Finland?
 How s Life in Finland? November 2017 In general, Finland performs well across the different well-being dimensions relative to other OECD countries. Despite levels of household net adjusted disposable income
How s Life in Iceland?
 How s Life in Iceland? November 2017 In general, Iceland performs well across the different well-being dimensions relative to other OECD countries. 86% of the Icelandic population aged 15-64 was in employment
Inclusion and Gender Equality in China
 Inclusion and Gender Equality in China 12 June 2017 Disclaimer: The views expressed in this publication are those of the authors and do not necessarily reflect the views and policies of the Asian Development
The Demographic Profile of the State of Palestine
 UNITED NATIONS The Demographic Profile of the State of Palestine Population Trends - Mortality - Fertility - Age Structure - Urbanization - International Migration - Education and Youth Unemployment Population
Slide 1. Slide 2. Slide 3. More Than 1 Billion People Live in Extreme Poverty. $1.25/day ppp World Bank Definition. % of people in developing world
 1 Slide 1 Slide 2 1. Place dots on the 3 POOREST countries in the world. 2. Place dots on the 2 countries that have experienced the greatest DECREASE in poverty over the past 3 decades. 3. Place a dot
I. Economic Islamicity Index
 Appendix 2017 I. Economic Islamicity Index 1. Economic Opportunity and Economic Freedom 1.1. Business Environment: 1.2. Economic Regulation Indicator: Economic Regulation Indicators: Regulation of Credit,
Automation and Implications for Developing Countries and Education Systems
 Automation and Implications for Developing Countries and Education Systems Harry Anthony Patrinos @hpatrinos Seoul, Korea November 2017 The Schooling Revolution Years of schooling Barro Lee Every Year
The Demographic Profile of Kuwait
 UNITED NATIONS The Demographic Profile of Kuwait Population Trends - Mortality - Fertility - Age Structure - Urbanization - International Migration - Education and Youth Unemployment Population Trends
How s Life. in the Slovak Republic?
 How s Life October 2015 in the Slovak Republic? Additional information, including the data used in this country note, can be found at: www.oecd.org/statistics/hows-life-2015-country-notes-data.xlsx HOW
The Demographic Profile of Oman
 UNITED NATIONS The Demographic Profile of Oman Population Trends - Mortality - Fertility - Age Structure - Urbanization - International Migration - Education and Youth Unemployment Population Trends Population
The Demographic Profile of Saudi Arabia
 Infant mortality rate (per 1 live births) UNITED NATIONS The Demographic Profile of Saudi Arabia Population Trends - Mortality - Fertility - Age Structure - Urbanization - International Migration - Education
The Demographic Profile of the United Arab Emirates
 UNITED NATIONS The Demographic Profile of the United Arab Emirates Population Trends - Mortality - Fertility - Age Structure - Urbanization - International Migration - Education and Youth Unemployment
Context Indicator 17: Population density
 3.2. Socio-economic situation of rural areas 3.2.1. Predominantly rural regions are more densely populated in the EU-N12 than in the EU-15 Context Indicator 17: Population density In 2011, predominantly
The interaction effect of economic freedom and democracy on corruption: A panel cross-country analysis
 The interaction effect of economic freedom and democracy on corruption: A panel cross-country analysis Author Saha, Shrabani, Gounder, Rukmani, Su, Jen-Je Published 2009 Journal Title Economics Letters
Spain PROMISE (GA693221)
") Spain Population 46.443.959 Population aged 15-29 years old 14,7% Population aged 65 years old and above 19,2% Birth Rate 9,0 International migrant stock as a percentage of the 12,7% total population PROMISE
Spain Population 46.443.959 Population aged 15-29 years old 14,7% Population aged 65 years old and above 19,2% Birth Rate 9,0 International migrant stock as a percentage of the 12,7% total population PROMISE
Goal 3: Promote Gender Equality and Empower Women
 98 Gender equality in primary school enrollment is high, with most economies having ratios of or more. This is also the case for gender equality in secondary school enrollment, but not so for tertiary
Migration and Integration
 Migration and Integration Integration in Education Education for Integration Istanbul - 13 October 2017 Francesca Borgonovi Senior Analyst - Migration and Gender Directorate for Education and Skills, OECD
INEQUALITY OF HAPPINESS IN NATIONS Introduction to this special issue
 INEQUALITY OF HAPPINESS IN NATIONS Introduction to this special issue Ruut Veenhoven Published in: Journal of Happiness Studies, 2005, vol.6, pp. 351-355 The first comparison of happiness in nations took
Changes After Socialism*
 Changes After Socialism* November 2015 Leszek Balcerowicz Warsaw School of Economics *I m grateful to Magda Ciżkowicz, Aleksander Łaszek, Sonja Wap, Marek Tatała and Tomasz Dróżdż for their assistance
Happiness and economic freedom: Are they related?
 Happiness and economic freedom: Are they related? Ilkay Yilmaz 1,a, and Mehmet Nasih Tag 2 1 Mersin University, Department of Economics, Mersin University, 33342 Mersin, Turkey 2 Mersin University, Department
Migration, Demography and Labour Mobility
 Migration, Demography and Labour Mobility Prof. Panu Poutvaara, PhD WELFARE GAINS FROM FREE MOBILITY 3 INSIGHTS FROM ECONOMICS 1/3 General insight: immigration improves overall welfare, provided that migration
Hinrich Foundation Sustainable Trade Index Country overview: Indonesia
 Hinrich Foundation Sustainable Trade Index Country overview: Indonesia Indonesia ranks 14 th on inaugural Hinrich Foundation Sustainable Trade Index The country embarks on a development strategy to move
Hinrich Foundation Sustainable Trade Index Country overview: Thailand
 Hinrich Foundation Sustainable Trade Index Country overview: Thailand Thailand ranks 8 th on inaugural Hinrich Foundation Sustainable Trade Index The country over-performs its level of per capita GDP and
The state of human development in the world and in Moldova. Antonio Vigilante
 The state of human development in the world and in Moldova Antonio Vigilante HUMAN DEVELOPMENT INDEX 1. Norway 0.953 2. Switzerland 0,944 3. Australia 0, 959 187. South Sudan 0,388; 188. Central African
Case Study on Youth Issues: Philippines
 Case Study on Youth Issues: Philippines Introduction The Philippines has one of the largest populations of the ASEAN member states, with 105 million inhabitants, surpassed only by Indonesia. It also has
Indices of Social Development
 Indices of Social Development 4th OECD World Forum 16-19 October 2012 Ellen Webbink Contents Why social development indices? How the indices are composed Progress since launch Why does social development
262 Index. D demand shocks, 146n demographic variables, 103tn
 Index A Africa, 152, 167, 173 age Filipino characteristics, 85 household heads, 59 Mexican migrants, 39, 40 Philippines migrant households, 94t 95t nonmigrant households, 96t 97t premigration income effects,
It s Time to Begin An Adult Conversation on PISA. CTF Research and Information December 2013
 It s Time to Begin An Adult Conversation on PISA CTF Research and Information December 2013 1 It s Time to Begin an Adult Conversation about PISA Myles Ellis, Acting Deputy Secretary General Another round
Taiwan s Development Strategy for the Next Phase. Dr. San, Gee Vice Chairman Taiwan External Trade Development Council Taiwan
 Taiwan s Development Strategy for the Next Phase Dr. San, Gee Vice Chairman Taiwan External Trade Development Council Taiwan 2013.10.12 1 Outline 1. Some of Taiwan s achievements 2. Taiwan s economic challenges
THE INDICATORS FOR SUSTAINABLE DEVELOPMENT:
 JULY 6, 2018 THE INDICATORS FOR SUSTAINABLE DEVELOPMENT: GENERAL FRAMEWORK 1.1 The Sustainable Development Goals (SDGs) On 25 September 2015, the UN-Assembly General adopted the 2030 Agenda for sustainable
Contemporary Human Geography
 Chapter 9 Lecture Contemporary Human Geography rd 3 Edition Chapter 9: Development Marc Healy Elgin Community College 9.1 Development Regions A developed country, also known as a More Developed Country
The political economy of electricity market liberalization: a cross-country approach
 The political economy of electricity market liberalization: a cross-country approach Erkan Erdogdu PhD Candidate The 30 th USAEE/IAEE North American Conference California Room, Capital Hilton Hotel, Washington
Gender Inequality, GDP per capita and Economic Growth
 Gender Inequality, GDP per capita and Economic Growth Master thesis in Economics Author: Tutor: Sara Jonsson Börje Johansson James Dzansi Jönköping 2011 Acknowledgements I would like to start by thanking
Charting Singapore s Economy, 1Q 2016 Publication Date: December 8 th, 2015 Number of pages: 58
 Charting Singapore s Economy, 1Q 2016 Publication Date: December 8 th, 2015 Number of pages: 58 Attribution-NonCommercial-NoDerivatives 4.0 International (CC BY-NC-ND 4.0) You are free to: Share copy and