2016 Statistical Yearbook. Republic of Palau Bureau of Budget and Planning Ministry of Finance
|
|
|
- Barrie Hardy
- 5 years ago
- Views:
Transcription


1 2016 Statistical Yearbook Republic of Palau Bureau of Budget and Planning Ministry of Finance


2 REPUBLIC OF PALAU Office of the Minister ELBUCHEL SADANG Minister Message from the Minister of Finance I am pleased to present the 2016 Statistical Yearbook of the Republic of Palau, which is written and published annually by the Bureau of Budget and Planning under the Ministry of Finance. Information provided in this yearbook is collected, compiled and generated in close cooperation with relevant government ministries and agencies, as well as semi-government agencies, private institutions and the community. This annual statistical yearbook features key socio-economic data, particularly relevant statistics collected from the public and private sector and compiled for the purpose of providing a basis for economic development planning, policy development, investment planning and decision-making. This statistical yearbook is not only important for the national and state governments to guide their development planning and decision-making processes, it also provides the basis for individual investors and corporate groups to analyze and understand specific market conditions, in connection with prevailing economic forces in the Republic of Palau. This yearbook is also used by individuals, community groups and international organizations that are interested in assessing specific components ofthe economic and social sectors. The government, especially the Office of Planning and Statistics of the Bureau of Budget and Planning, continues to build its capacity to produce this publication in a more enhanced manner, by integrating a more modern system of data collection, compilation and processing. On-going efforts are underway to train existing personnel to advance their skills and abilities, enabling them to produce more reliable, accurate and informative yearbooks on a timely basis. To further enhance this effort, relevant ministries and agencies are encouraged to continue to cooperate with the Bureau of Budget and Planning in the collection and compilation of statistical data. Furthermore, I recognize the need for strengthening the legislation to facilitate our efforts to obtain the most needed data from the government and the private sector on a regular basis. Finally, I wish to recognize the efforts of the staff in the production of this yearbook, particularly those in the Bureau of Budget and Planning who collected data and put together this yearbook, and those from other relevant ministries and agencies that provided the data. I also wish to extend my appreciation to the readers of this yearbook and hope that it will be of great assistance in providing the information you need for your research and projects. Any comments or suggestions are welcomed for the improvement of this Statistical Yearbook. Inquiries may be directed to the Bureau of Budget and Planning, Ministry of Finance, and the publication may be accessed through our website: Mesulang, Ministry of Finance P.O. Box 6011 Koror, Republic of Palau Tel: (680) / Fax: (680) I mof@palaugov.net
3
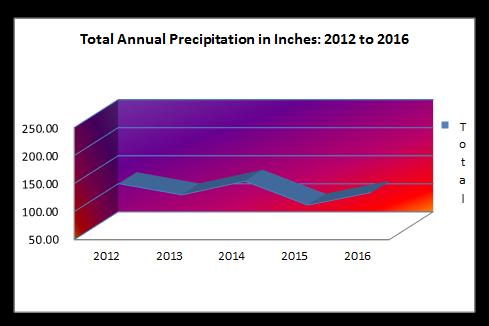
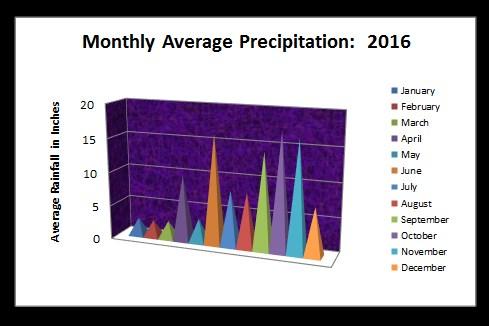
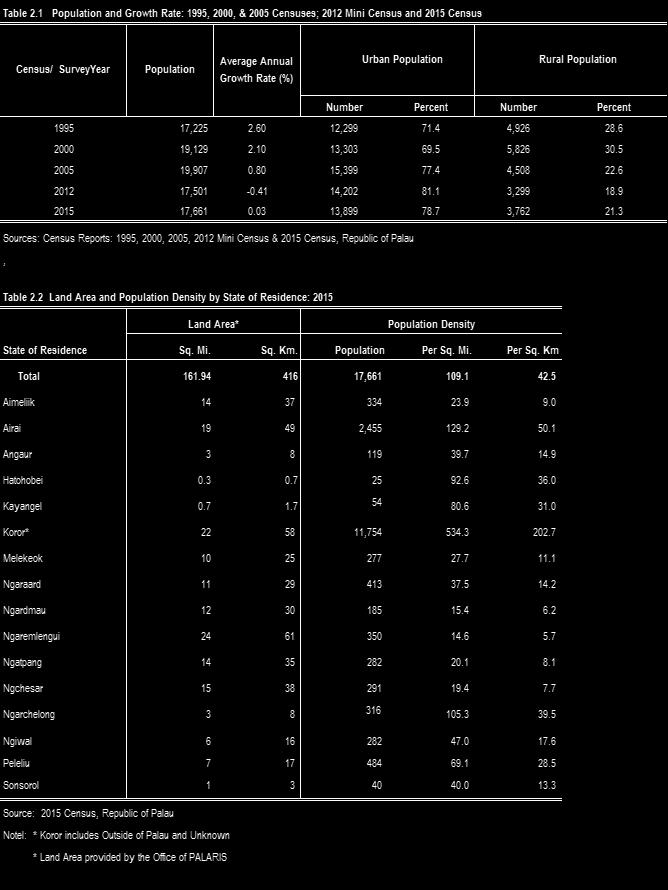
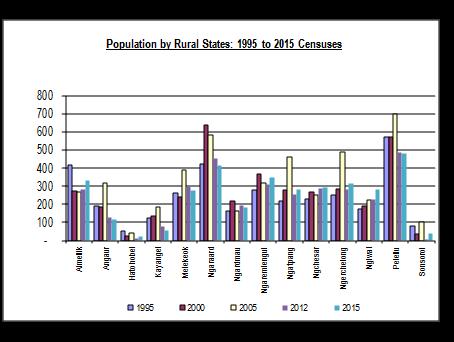
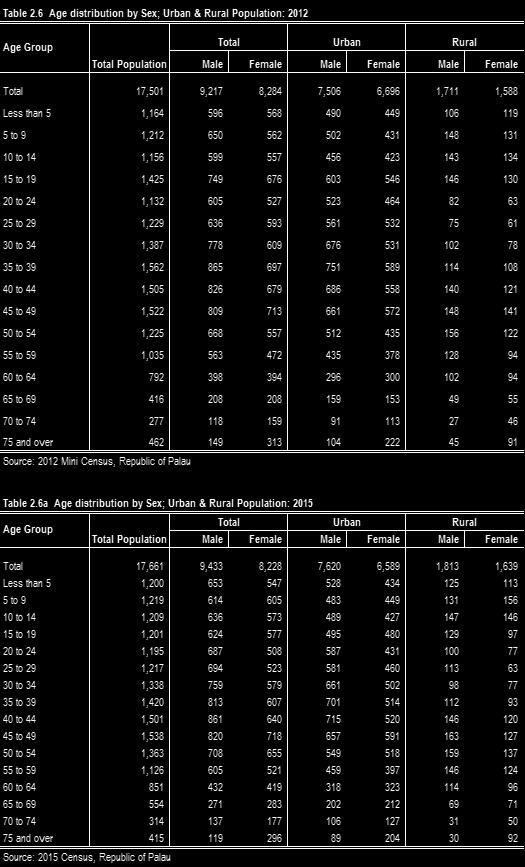
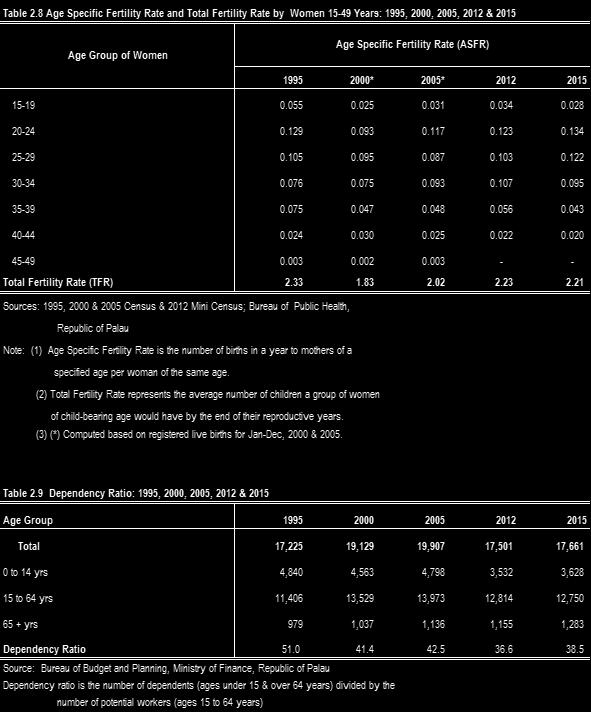
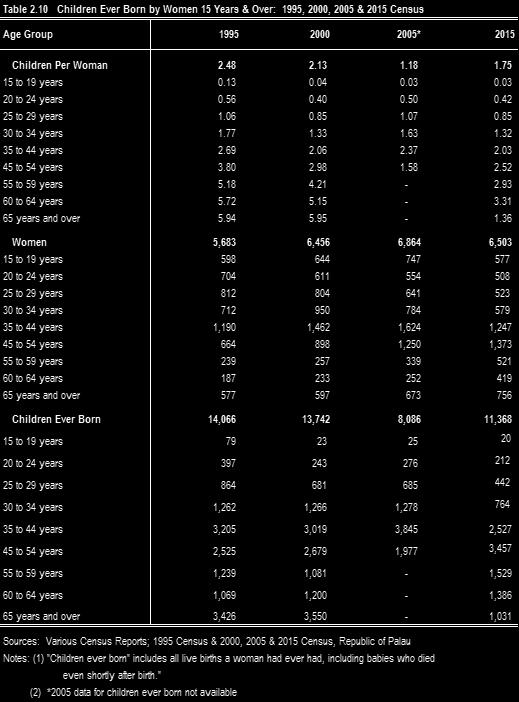
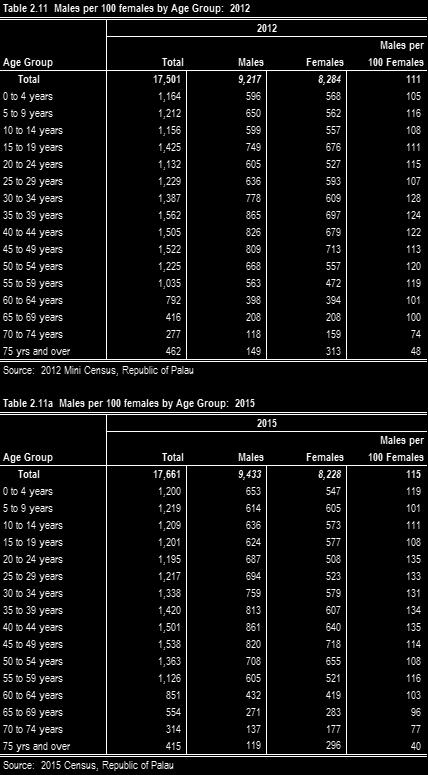
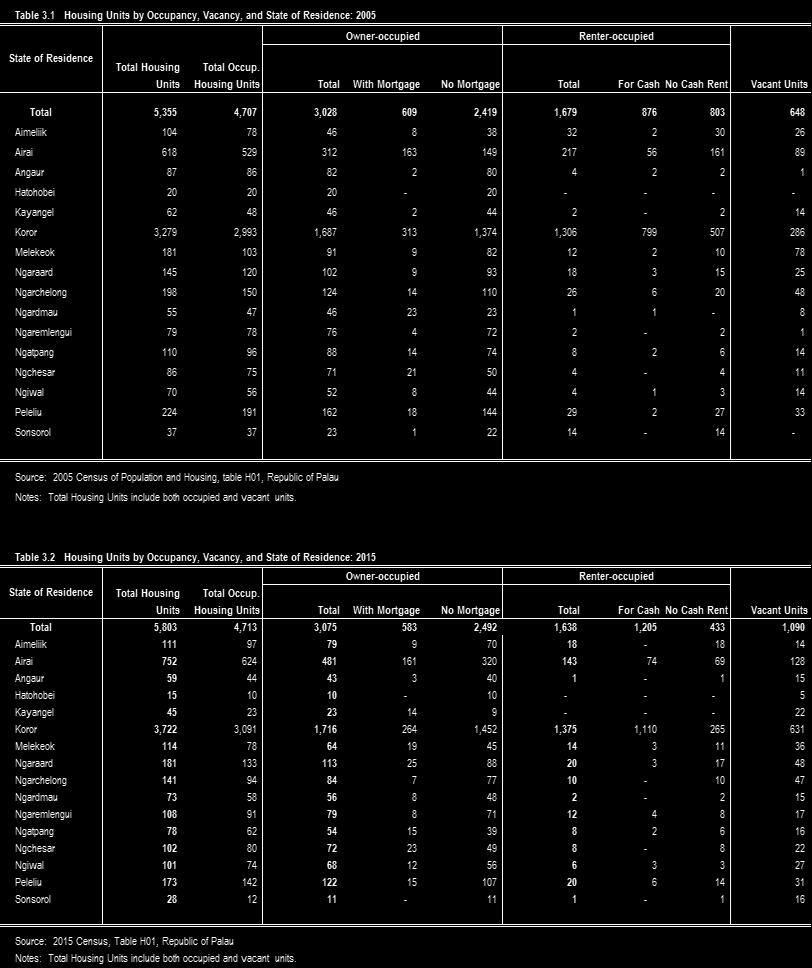
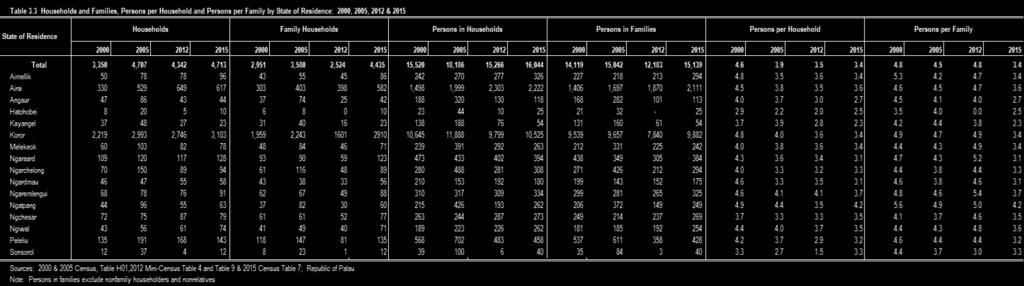
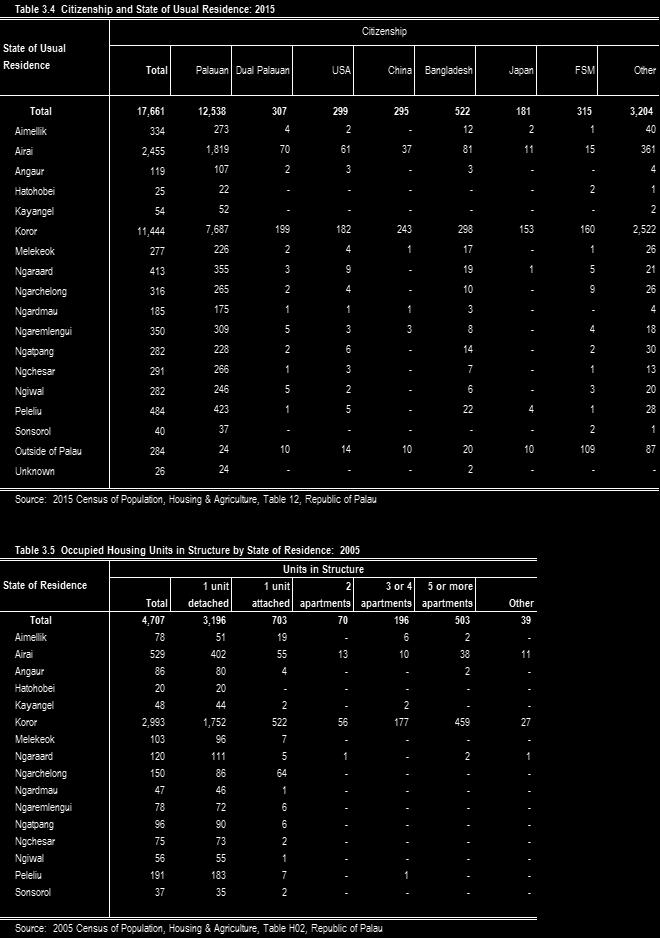
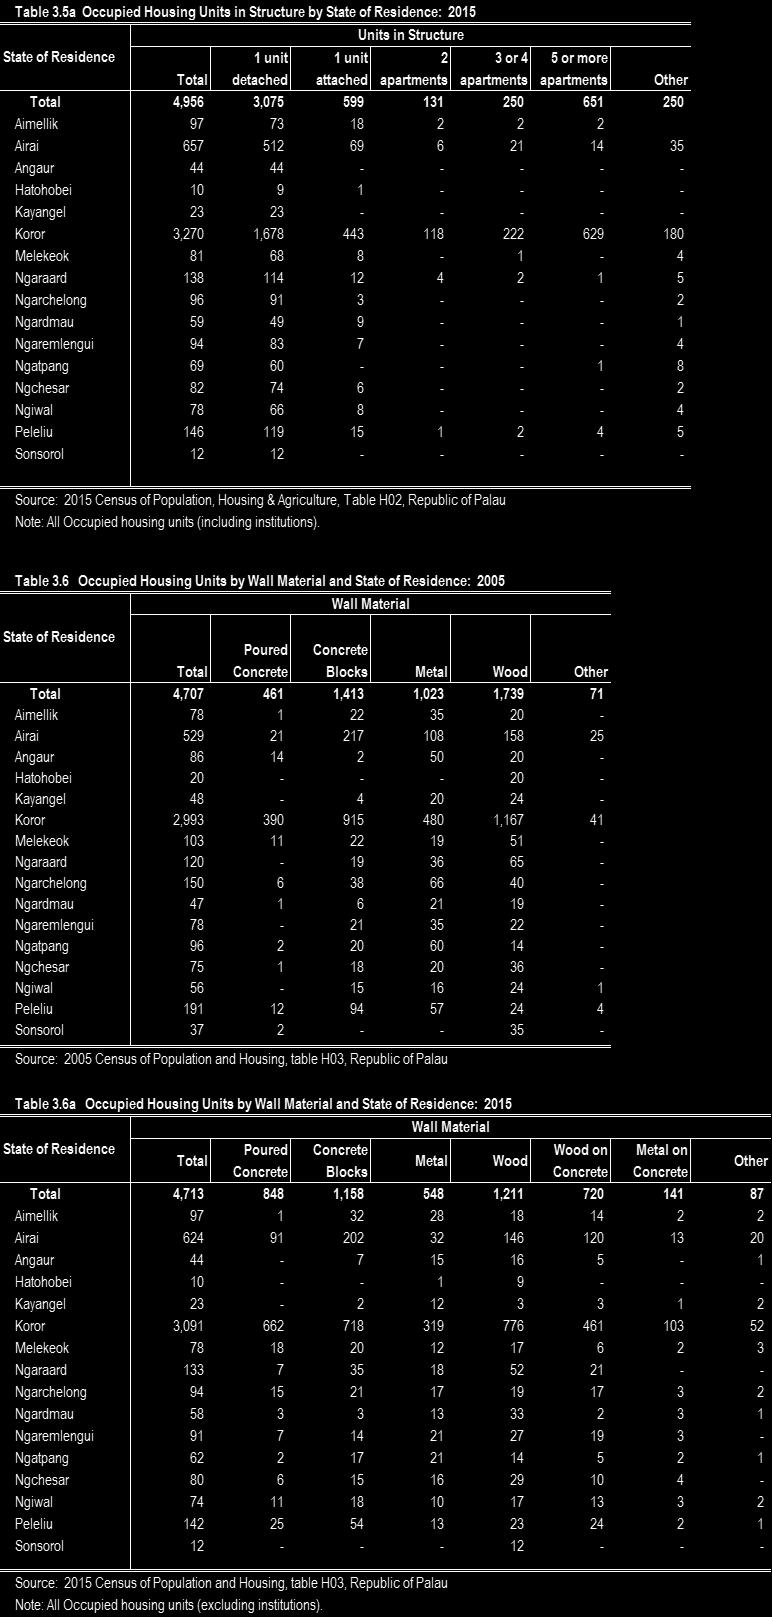
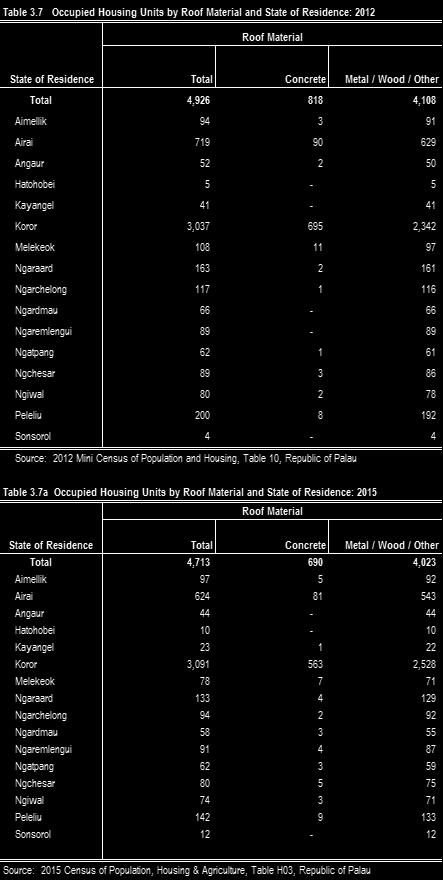
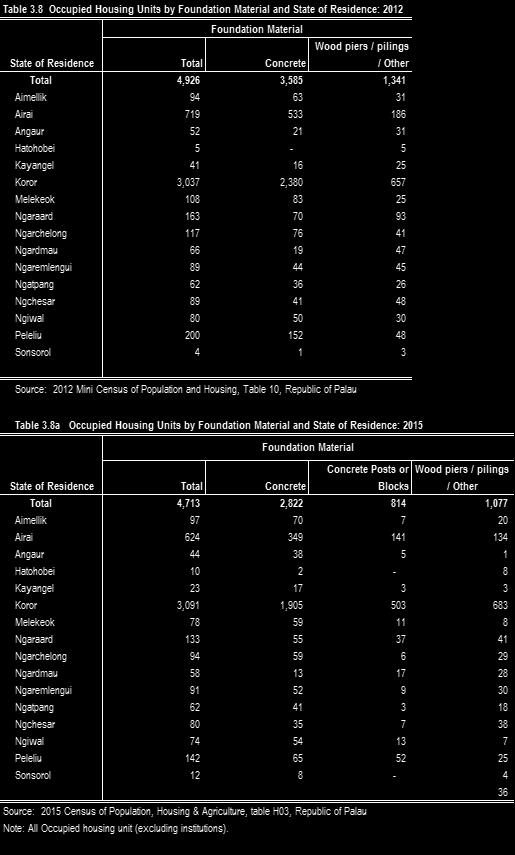
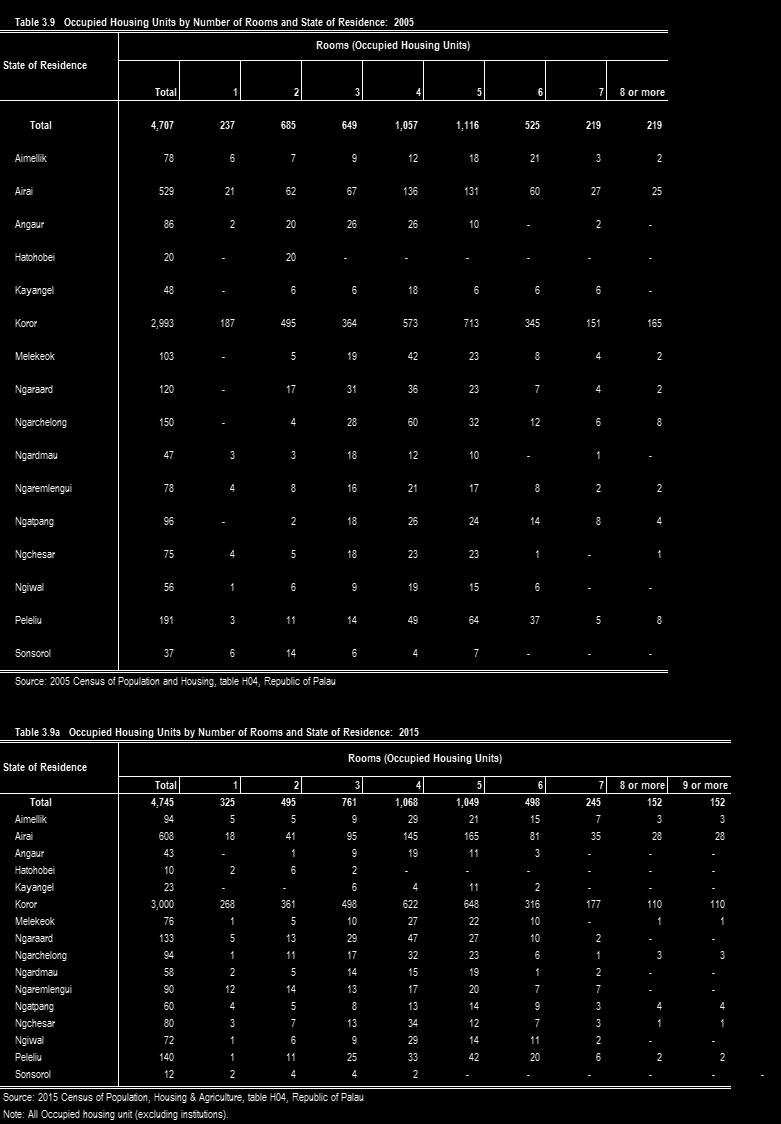
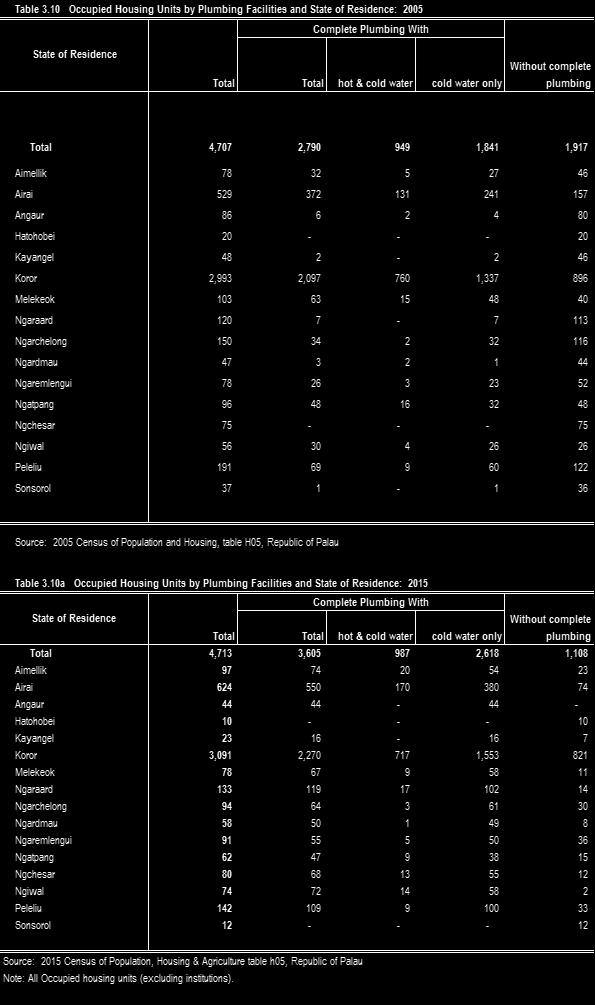
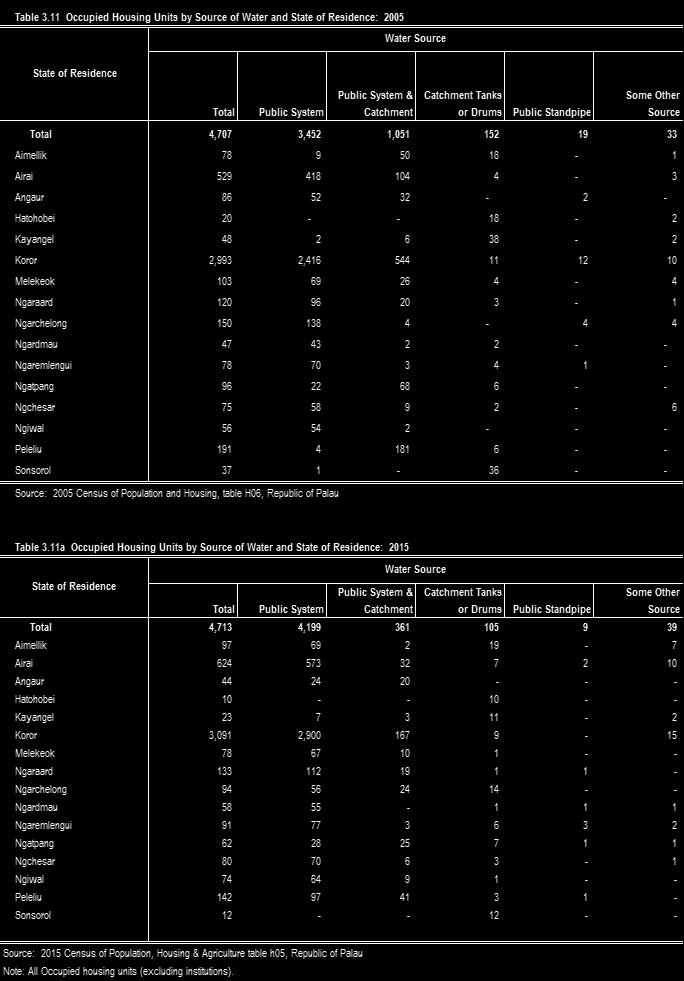
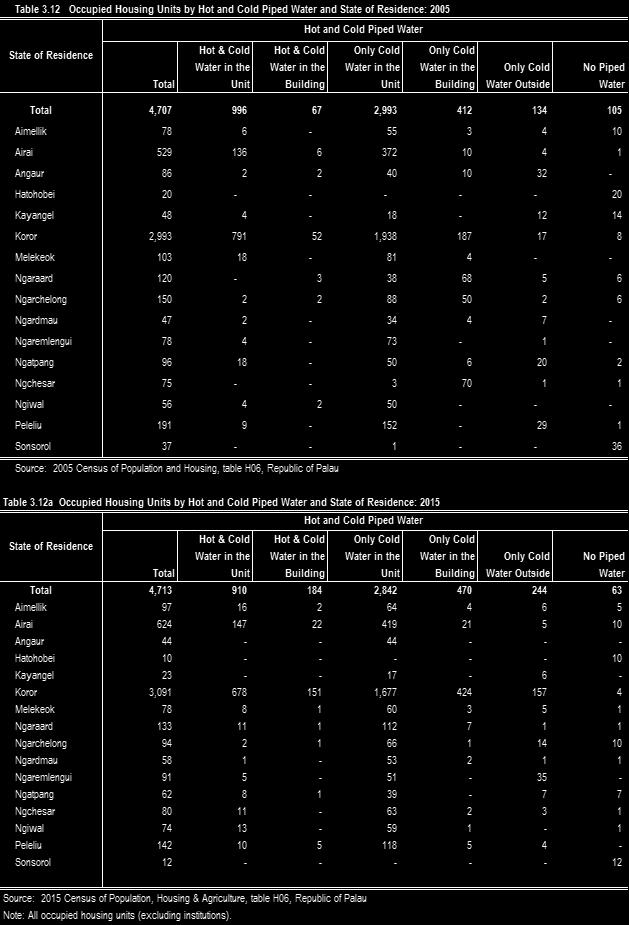
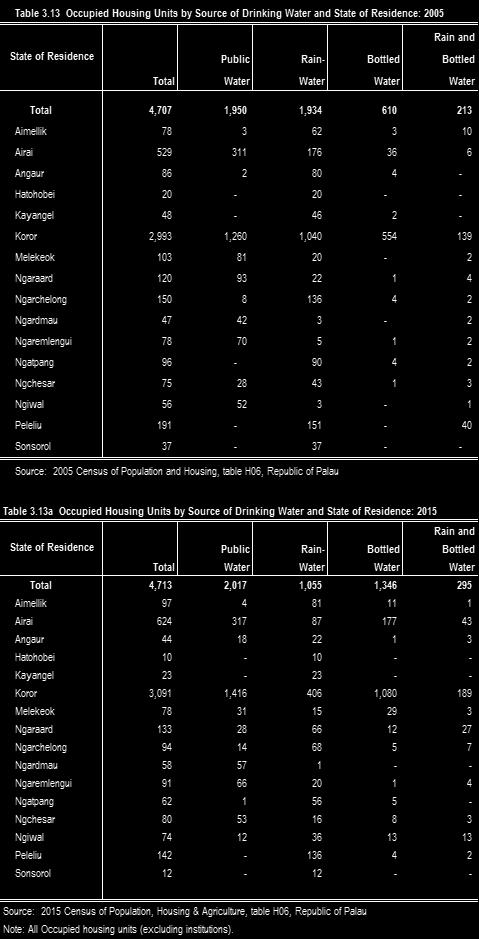
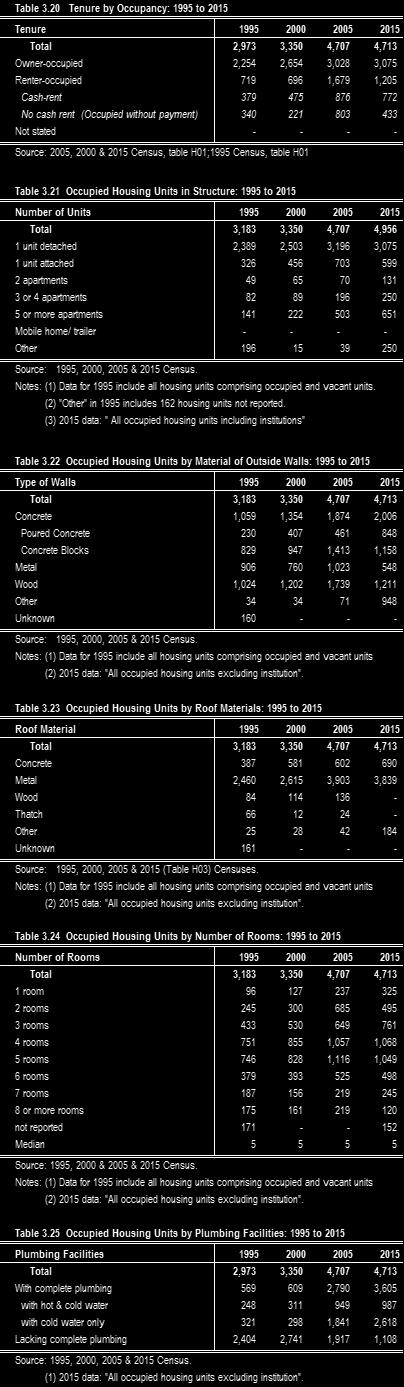
4 Table of Content CHAPTER 1. CLIMATE Page Table 1.1 Table 1.2 Table 1.3 Climate Conditions: 2012 to 2016 (Degrees Fahrenheit) Monthly Average Temperatures: 2012 to 2016 (Degrees Fahrenheit) Monthly Precipitation: CHAPTER 2. POPULATION Page Table 2.1 Table 2.2 Table 2.3 Table 2.4 Table 2.4a Table 2.5 Table 2.6 Table 2.6a Table 2.7 Table 2.8 Table 2.9 Table 2.10 Table 2.11 Table 2.11a Population and Growth Rate: 1990, 1995, 2000, & 2005 Censuses; 2012 Mini Census and 2015 Census Land Area and Population Density by State of Residence: 2015 Population by State: 1995, 2000 & 2005, 2012 Mini Census and 2015 Census Population by Age: 1995, 2000, & 2005, 2012 & 2015 Population by Age and Sex: 1995, 2000, & 2005, 2012 & 2015 Census Population by Relationship: 1995, 2000, & & 2015 Census Age distribution by Sex; Urban & Rural Population: 2012 Mini Census Age distribution by Sex: Urban & Rural Population: 2015 Census Marital Status by Birthplace: 2015 Age Specific Fertility Rate and Total Fertility Rate by Women Years: 1995, 2000, & 2005, 2012 & 2015 Dependency Ratio: 1995, 2000, 2005, 2012 & 2015 Children Ever Born by Women 15 Years & Over: 1990, 1995, 2000, 2005 & 2015 Males per 100 females by Age Group: 2012 Males per 100 females by Age Group: 2015 CHAPTER 3. HOUSING Page Table 3.1 Table 3.2 Table 3.3 Table 3.4 Table 3.5 Table 3.5a Table 3.6 Table 3.6a Table 3.7 Table 3.7a Table 3.8 Table 3.8a Table 3.9 Table 3.9a Table 3.10 Table 3.10a Table 3.11 Table 3.11a Table 3.12 Table 3.12a Table 3.13 Table 3.13a Housing Units by Occupancy, Vacancy, and State of Residence: 2005 Housing Units by Occupancy, Vacancy, and State of Residence: 2015 Households and Families, Persons per Household and Persons per Family by State of Residence: 2000, 2005, 2012 & 2015 Citizenship and State of Usual Residence: 2015 Occupied Housing Units in Structure by State of Residence: 2005 Occupied Housing Units in Structure by State of Residence: 2015 Occupied Housing Units by Wall Material and State of Residence: 2005 Occupied Housing Units by Wall Material and State of Residence: 2015 Occupied Housing Units by Roof Material and State of Residence: 2005 Occupied Housing Units by Roof Material and State of Residence: 2015 Occupied Housing Units by Foundation Material and State of Residence: 2012 Occupied Housing Units by Foundation Material and State of Residence: 2015 Occupied Housing Units by Number of Rooms and State of Residence: 2005 Occupied Housing Units by Number of Rooms and State of Residence: 2015 Occupied Housing Units by Plumbing Facilities and State of Residence: 2005 Occupied Housing Units by Plumbing Facilities and State of Residence: 2015 Occupied Housing Units by Source of Water and State of Residence: 2005 Occupied Housing Units by Source of Water and State of Residence: 2015 Occupied Housing Units by Hot and Cold Piped Water and State of Residence: 2005 Occupied Housing Units by Hot and Cold Piped Water and State of Residence: 2015 Occupied Housing Units by Source of Drinking Water and State of Residence: 2005 Occupied Housing Units by Source of Drinking Water and State of Residence: 2015
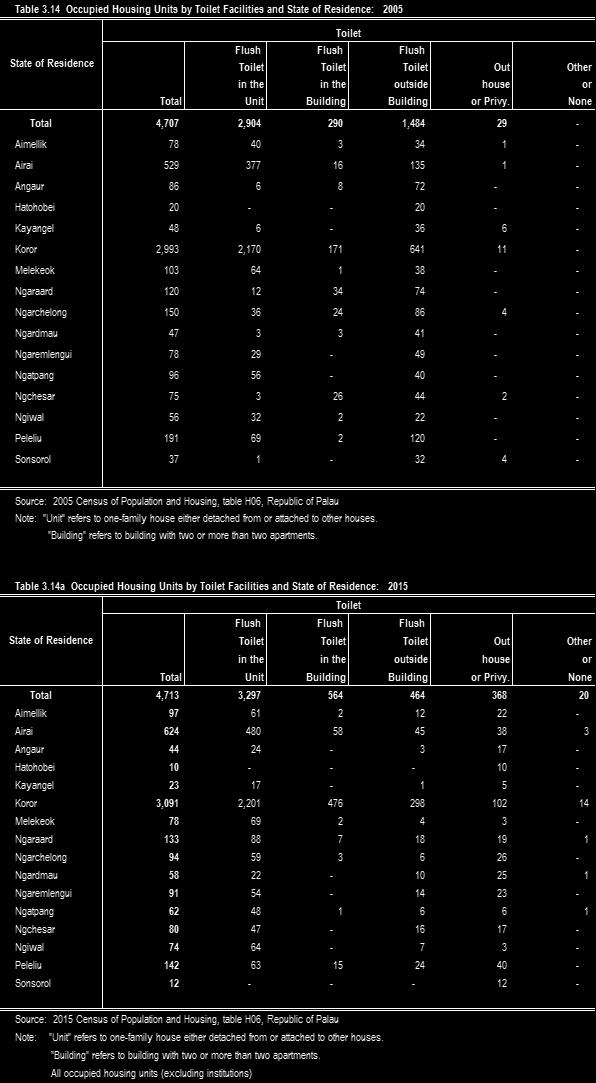
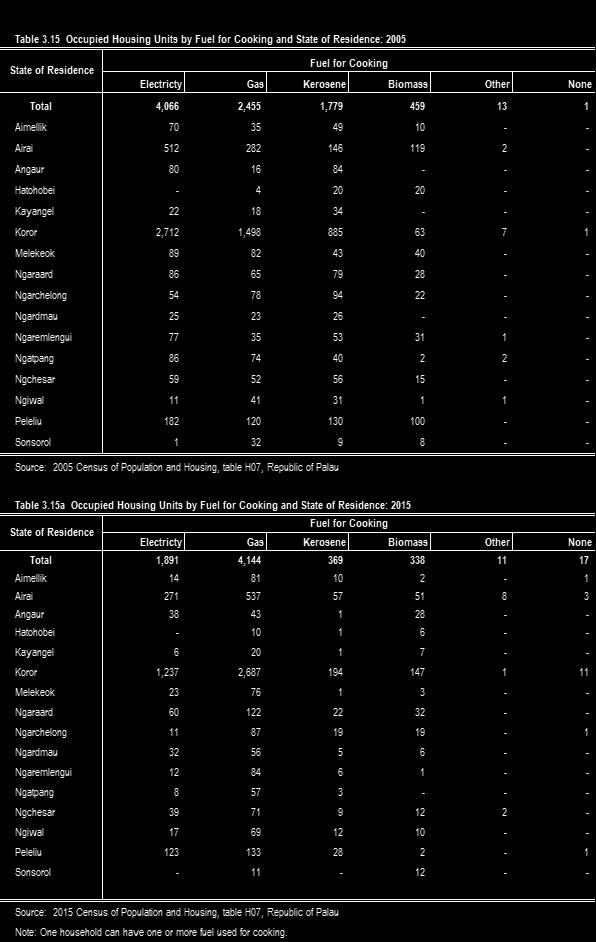
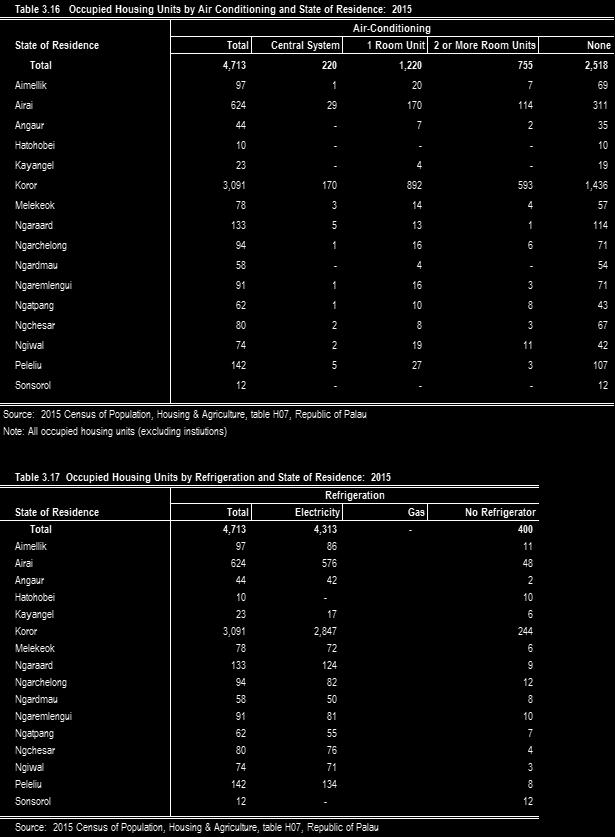
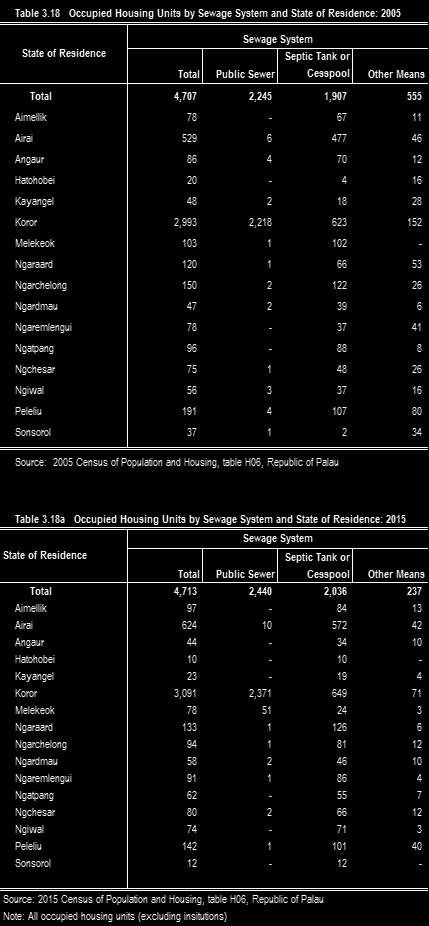
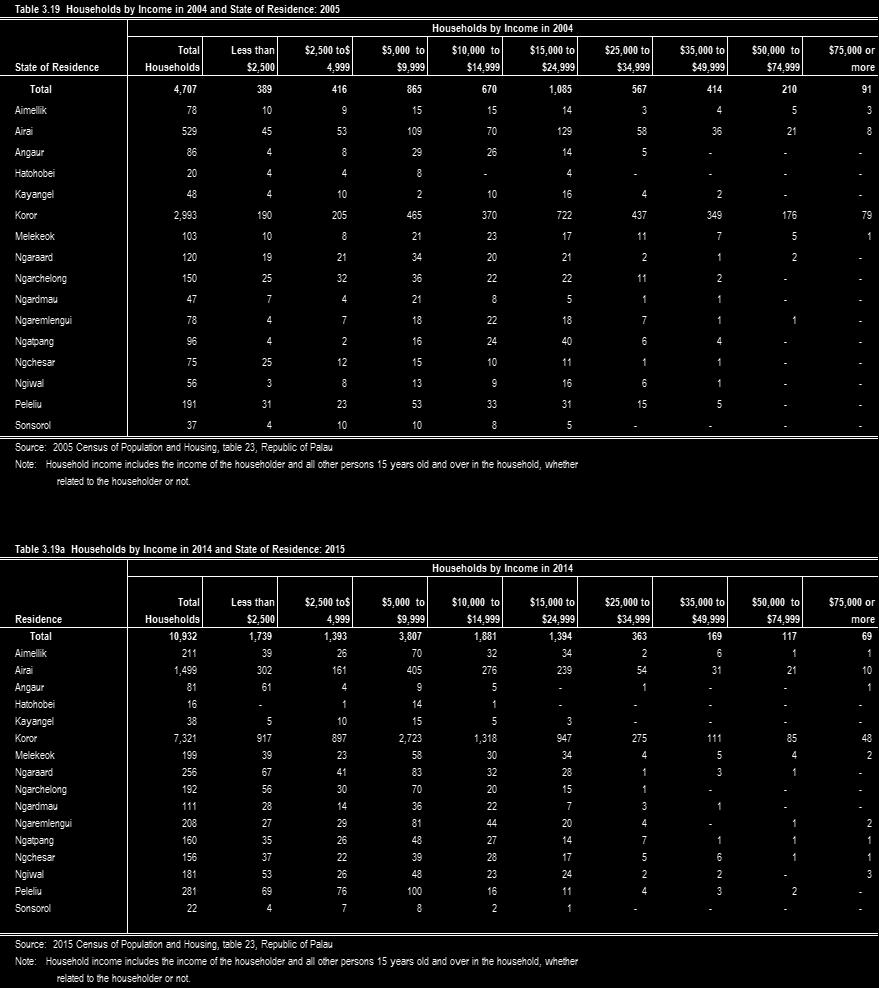
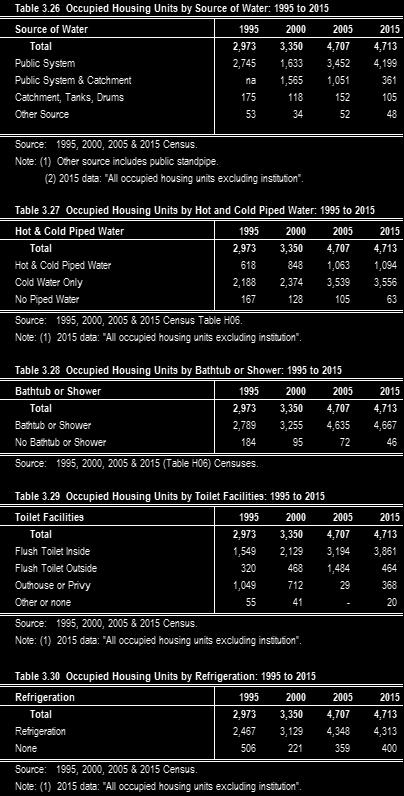
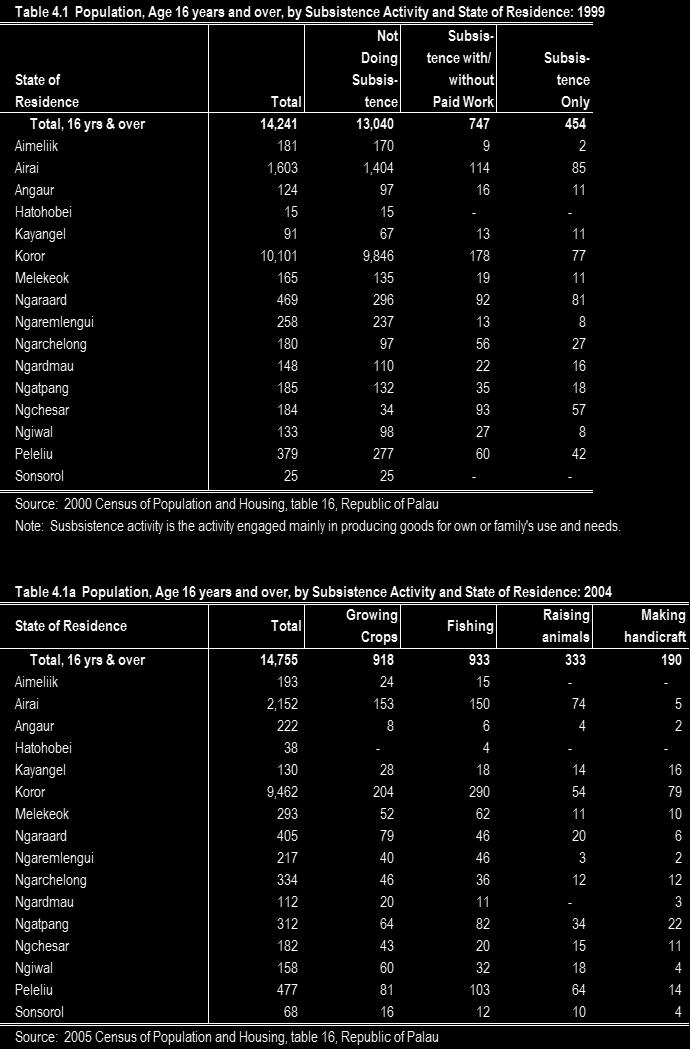
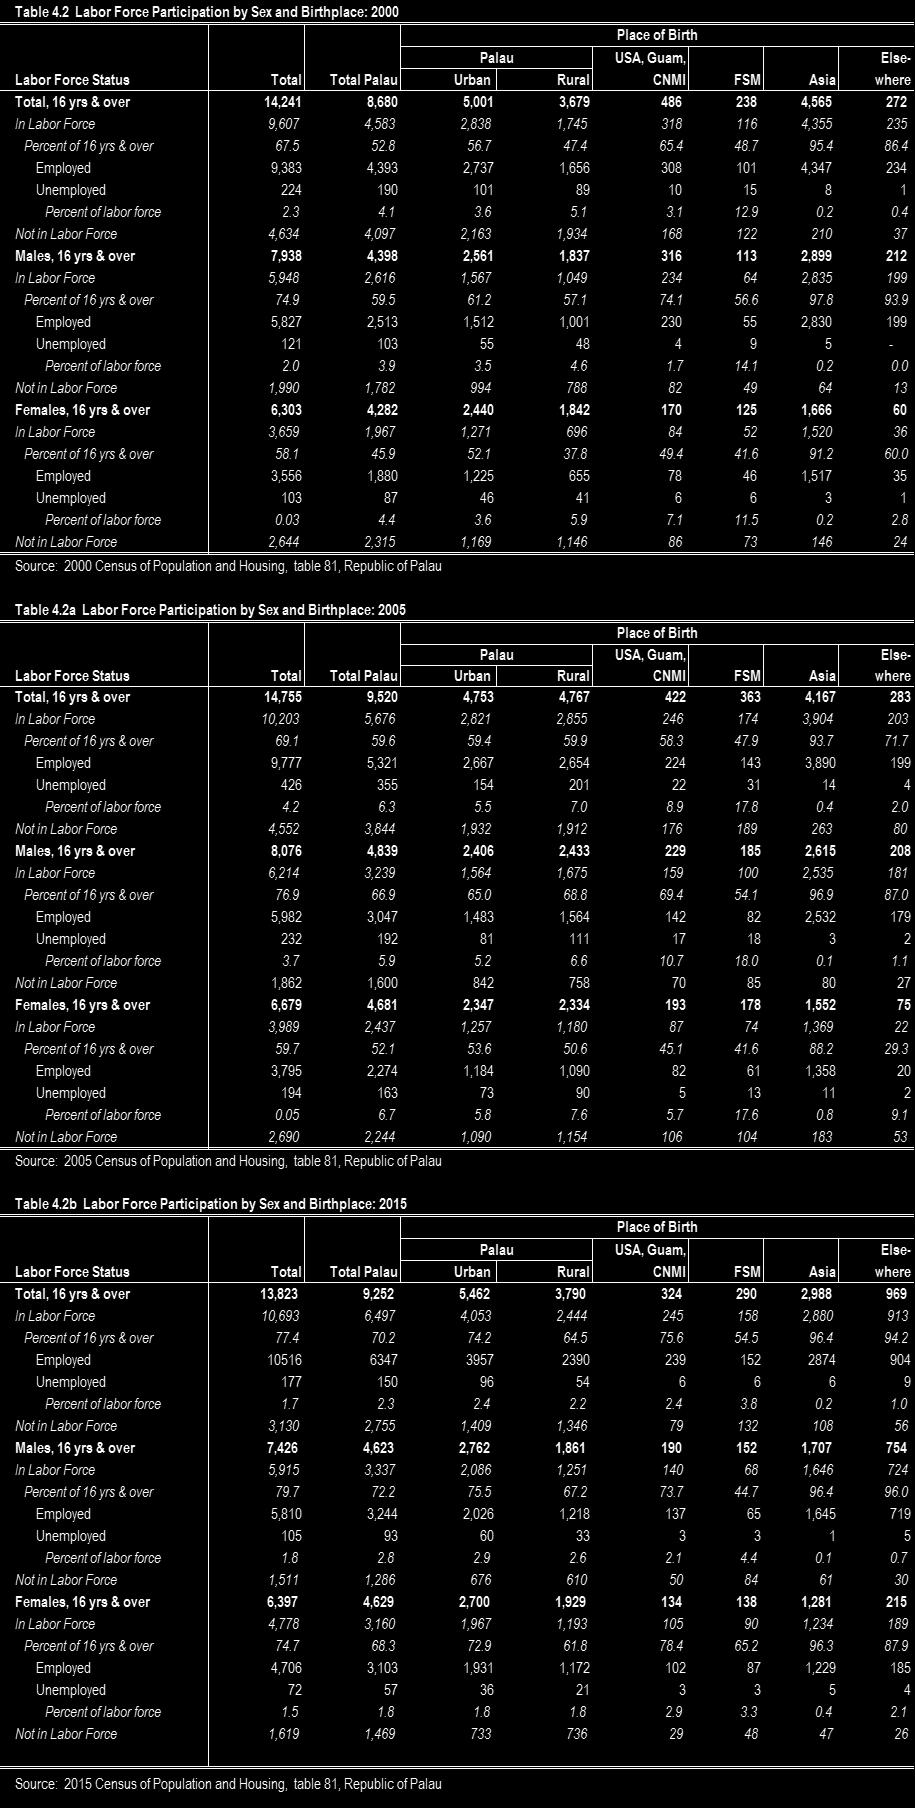
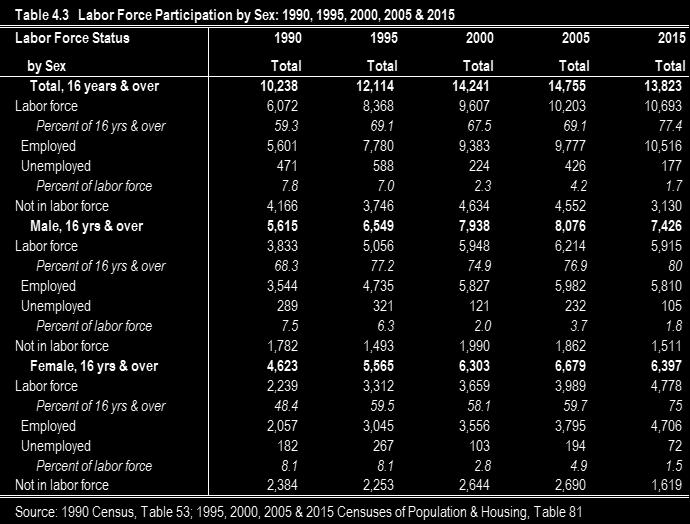
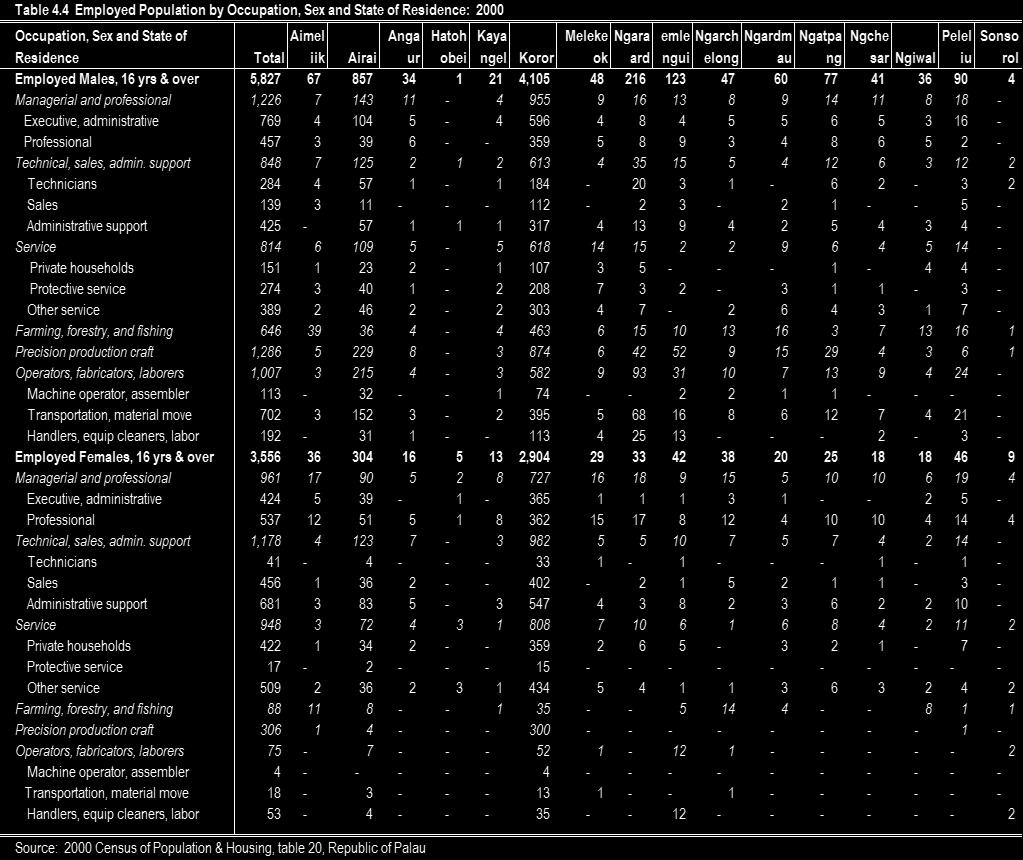
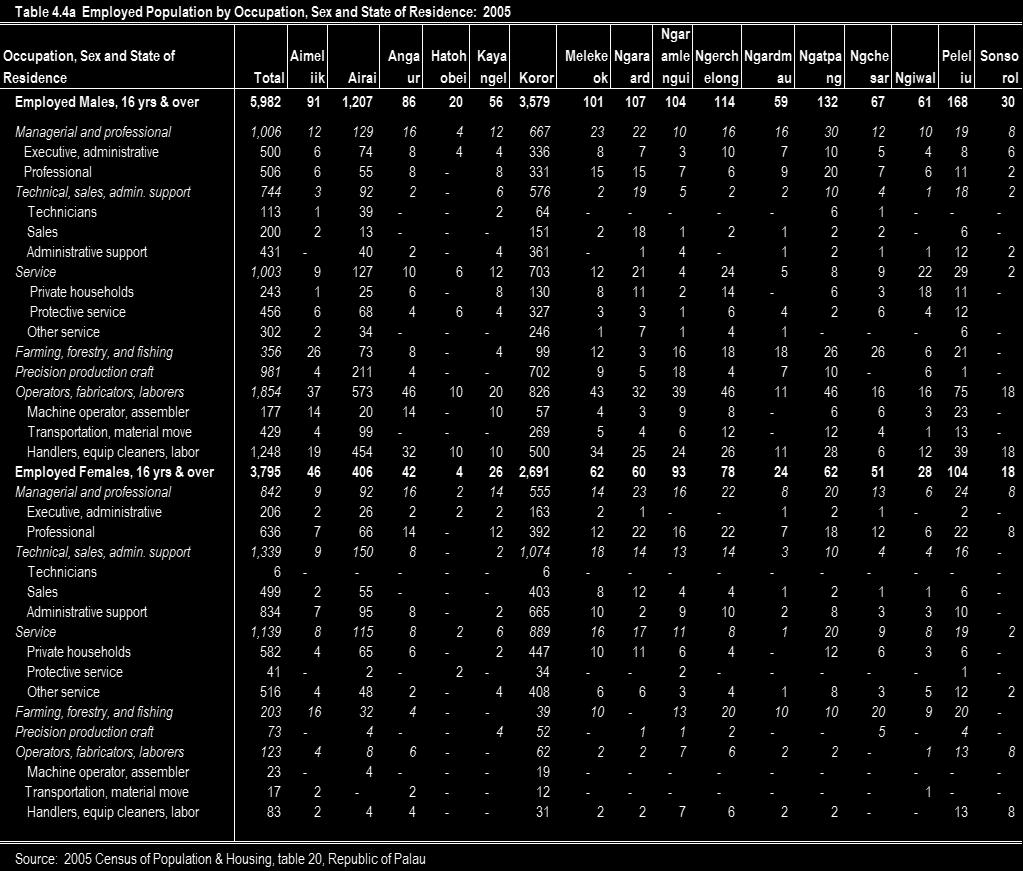
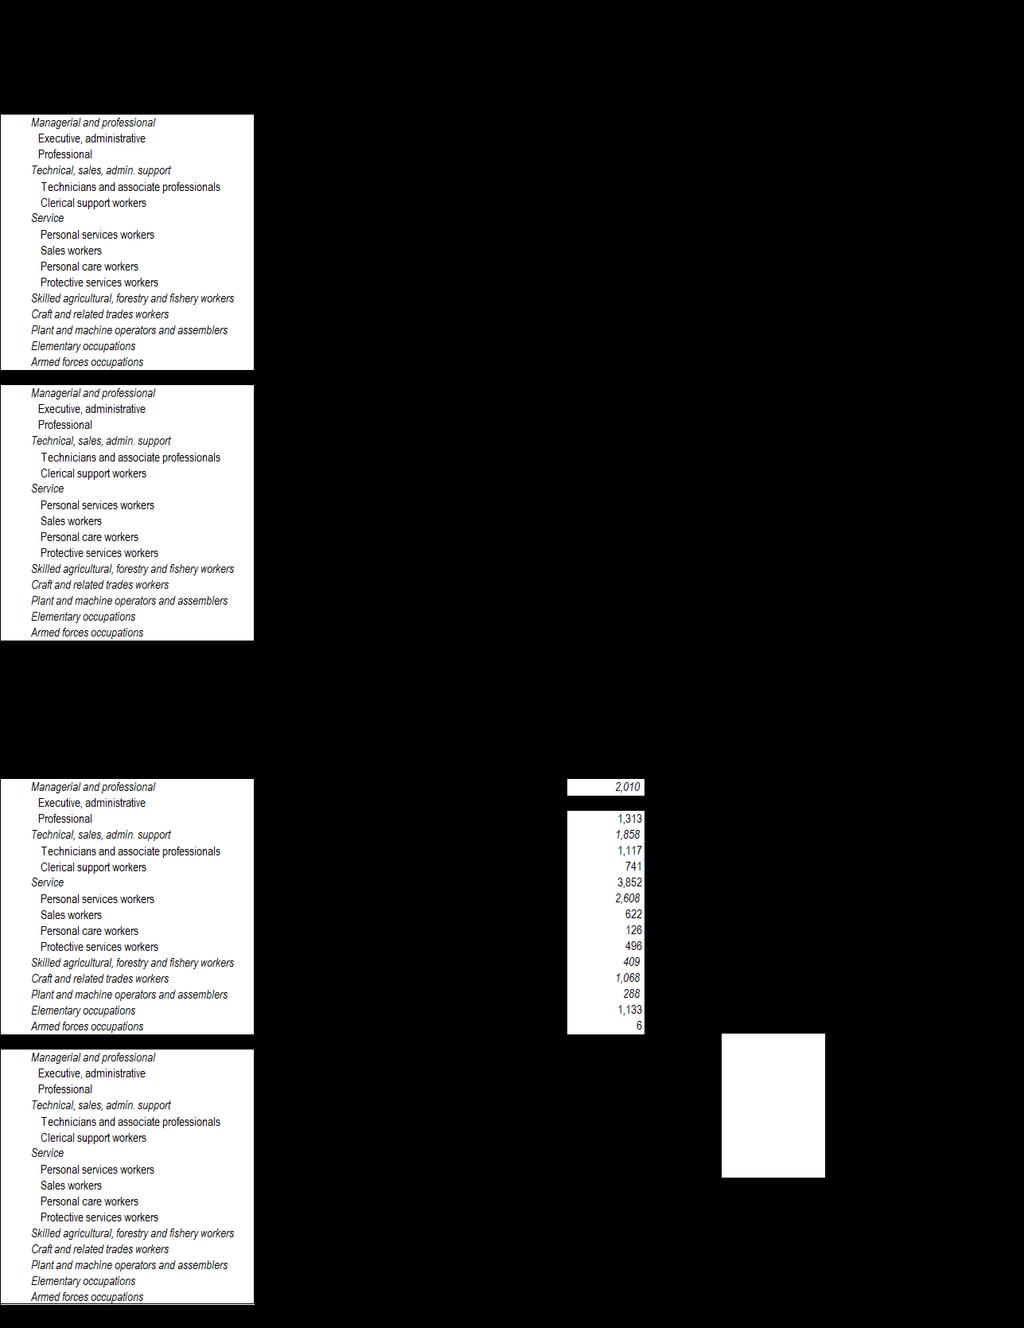
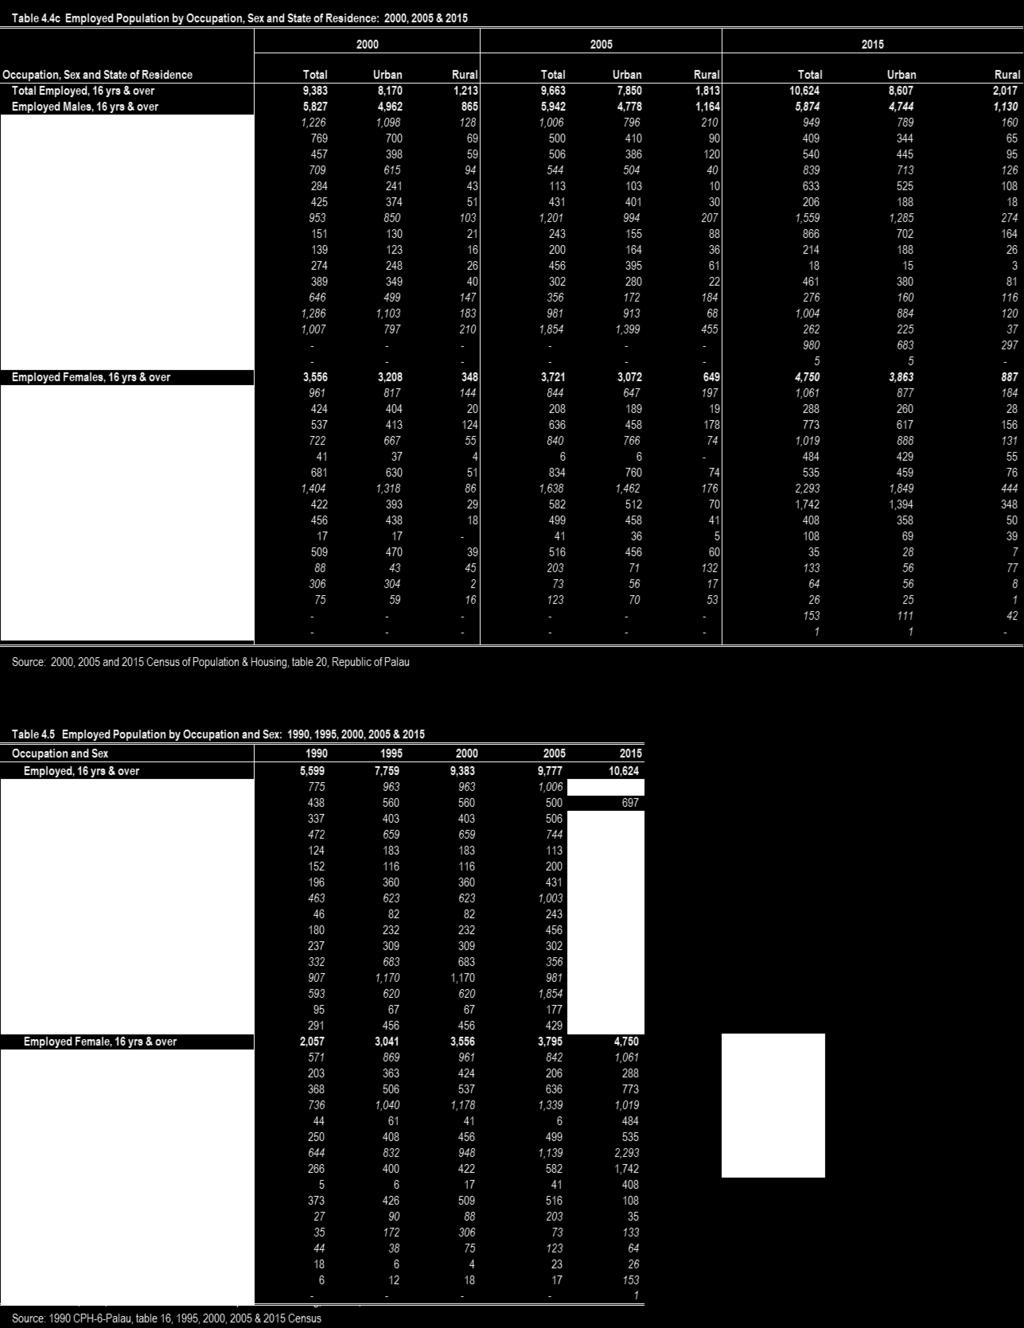
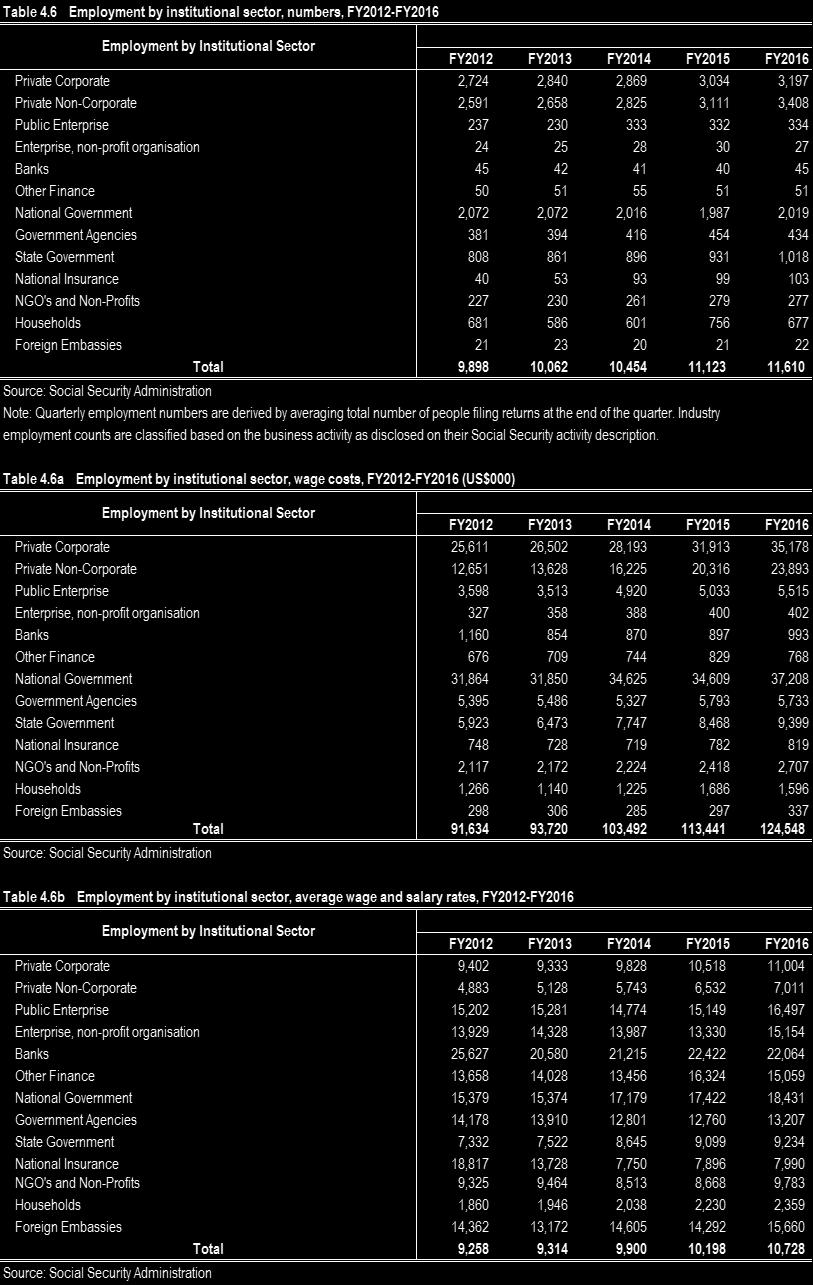
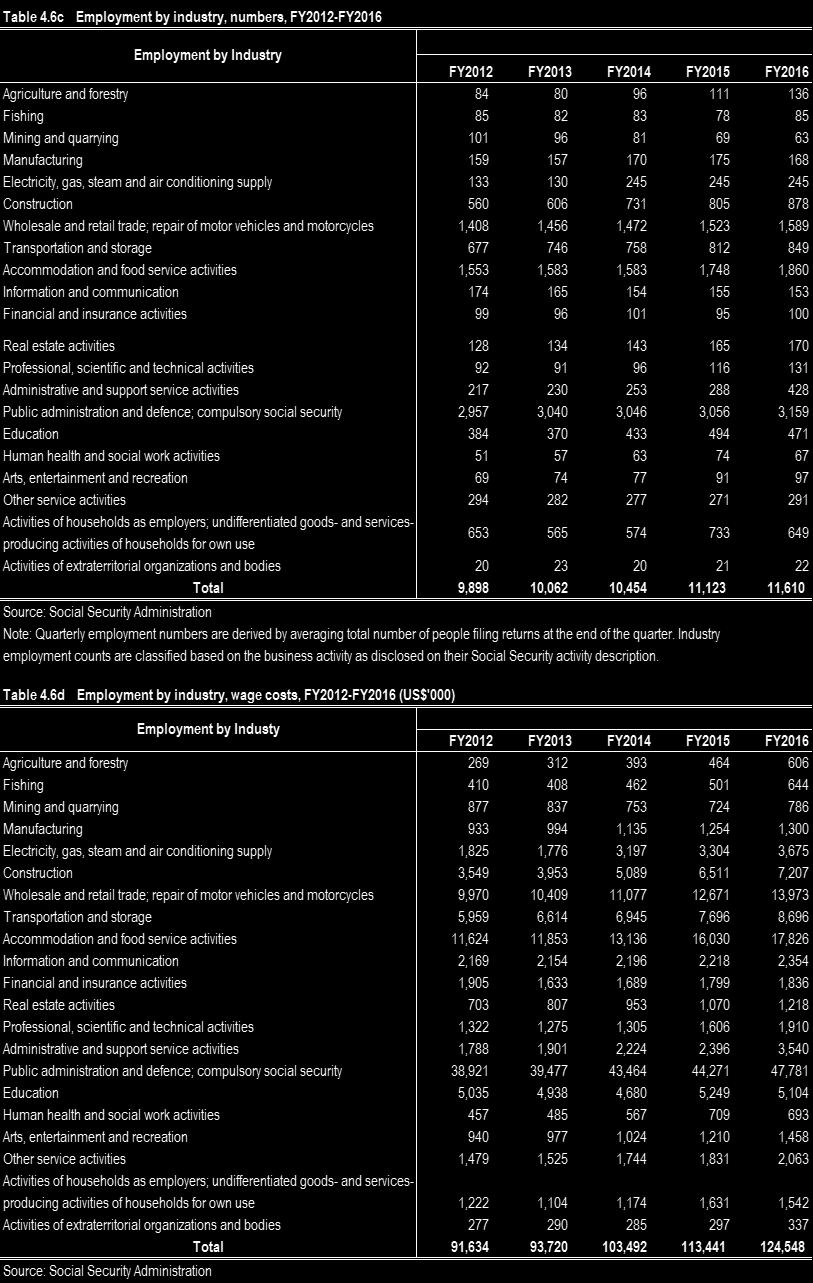
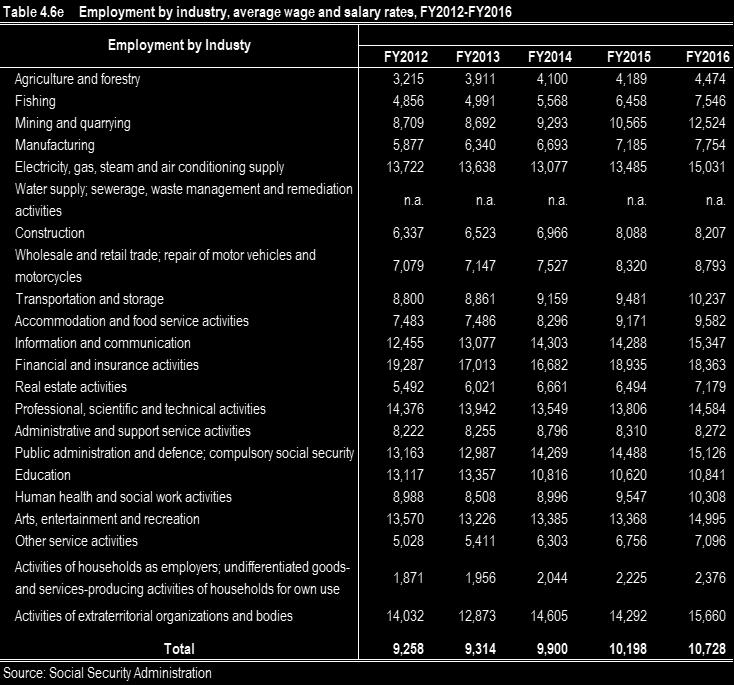
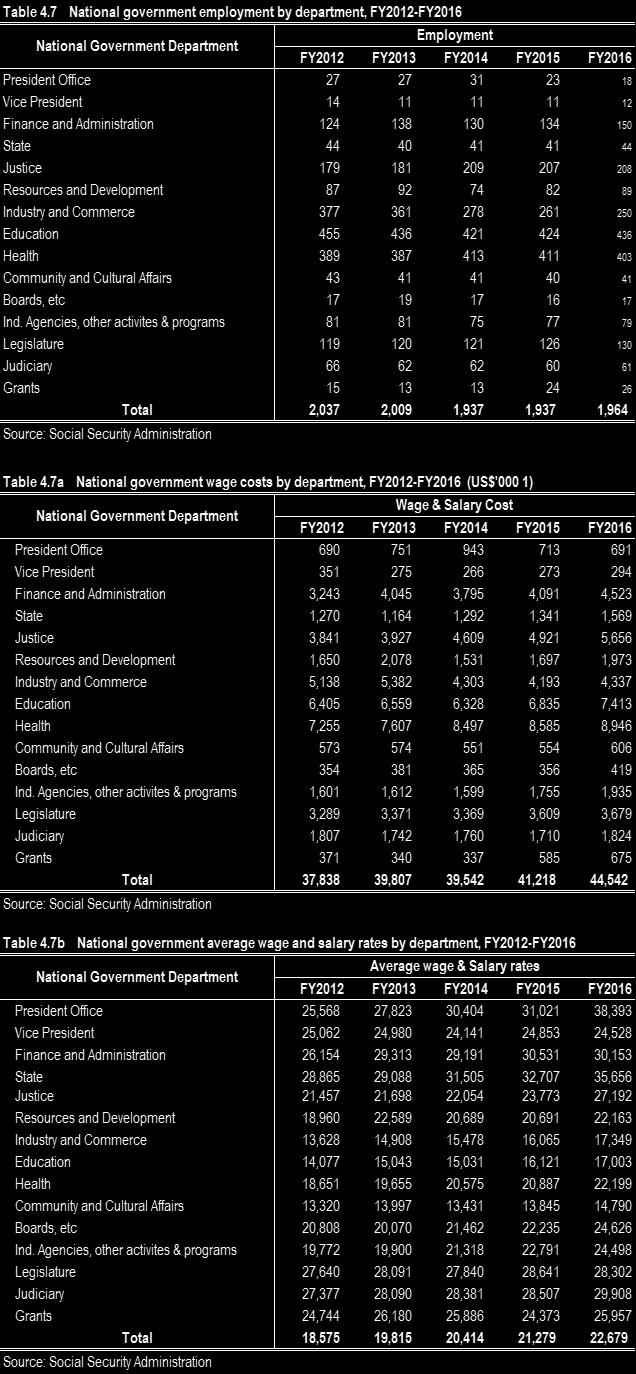
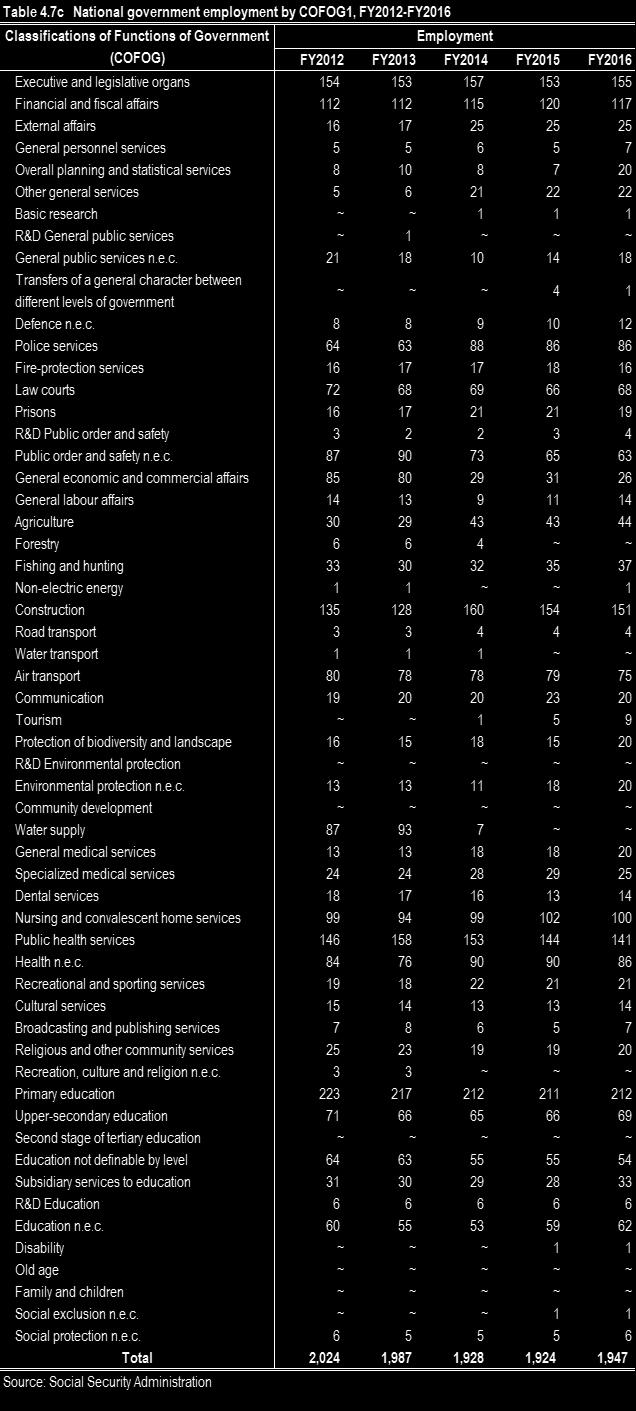
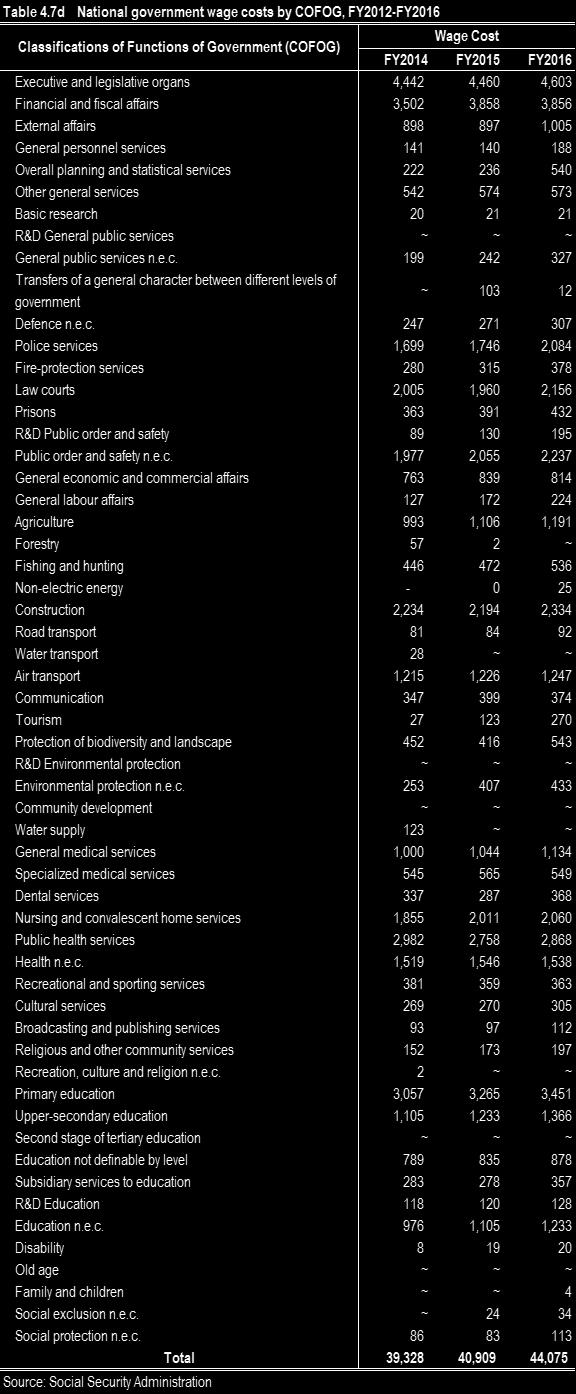
5 Table 3.14 Table 3.14a Table 3.15 Table 3.15a Table 3.16 Table 3.17 Table 3.18 Table 3.18a Table 3.19 Table 3.19a Table 3.20 Table 3.21 Table 3.22 Table 3.23 Table 3.24 Table 3.25 Table 3.26 Table 3.27 Table 3.28 Table 3.29 Table 3.30 Occupied Housing Units by Toilet Facilities and State of Residence: 2005 Occupied Housing Units by Toilet Facilities and State of Residence: 2015 Occupied Housing Units by Fuel for Cooking and State of Residence: 2005 Occupied Housing Units by Fuel for Cooking and State of Residence: 2015 Occupied Housing Units by Air Conditioning and State of Residence: 2015 Occupied Housing Units by Refrigeration and State of Residence: 2005 Occupied Housing Units by Sewage System and State of Residence: 2005 Occupied Housing Units by Sewage System and State of Residence: 2015 Households by Income in 2004 and State of Residence: 2005 Households by Income in 2014 and State of Residence: 2015 Tenure by Occupancy: Occupied Housing Units in Structure: 1995 to 2015 Occupied Housing Units by Material of Outside Walls: Occupied Housing Units by Roof Materials: Occupied Housing Units by Number of Rooms: Occupied Housing Units by Plumbing Facilities: Occupied Housing Units by Source of Water: Occupied Housing Units by Hot and Cold Piped Water: Occupied Housing Units by Bathtub or Shower: Occupied Housing Units by Toilet Facilities: Occupied Housing Units by Refrigeration: CHAPTER 4. LABOR FORCE Page Table 4.1 Table 4.1a Table 4.2 Table 4.2a Table 4.2b Table 4.3 Table 4.4 Table 4.4a Table 4.4b Table 4.4c Table 4.5 Table 4.6 Table 4.6a Table 4.6b Table 4.6c Table 4.6d Table 4.6e Table 4.7 Table 4.7a Table 4.7b Table 4.7c Table 4.7d Population, Age 16 years and over, by Subsistence Activity and State of Residence: 1999 Population, Age 16 years and over, by Subsistence Activity and State of Residence: 2004 Labor Force Participation by Sex and Birthplace: 2000 Labor Force Participation by Sex and Birthplace: 2005 Labor Force Participation by Sex and Birthplace: 2015 Labor Force Participation by Sex: 1990, 1995, 2000, 2005 & 2015 Employed Population by Occupation, Sex and State of Residence: 2000 Employed Population by Occupation, Sex and State of Residence: 2005 Employed Population by Occupation, Sex and State of Residence: 2015 Employed Population by Occupation, Sex and State of Residence: 2000, 2005, & 2015 Employed Population by Occupation and Sex: 1990, 1995, 2000 & 2005 Employment by institutional sector, numbers, FY2012-FY2016 Employment by institutional sector, wage costs, FY2012-FY2016 (US$000) Employment by institutional sector, average wage and salary rates, FY2012-FY2016 Employment by industry, numbers, FY2012-FY2016 Employment by industry, wage costs, FY2012-FY2016 (US$'000) Employment by industry, average wage and salary rates, FY2012-FY2016 National government employment by department, FY2012-FY2016. National government wage costs by department, FY2012-FY2016 (US$'000 1) National government average wage and salary rates by department, FY2012-FY2016 National government employment by COFOG1, FY2012-FY2016 National government wage costs by COFOG, FY2012-FY2016
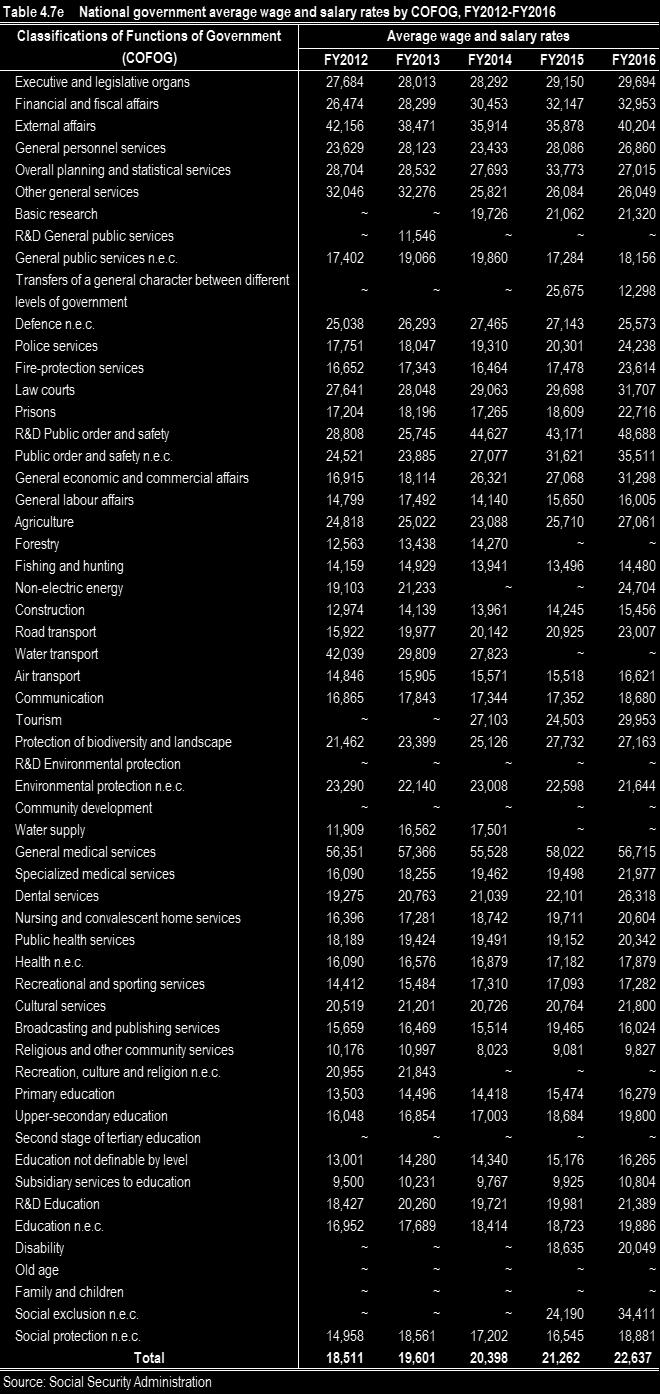
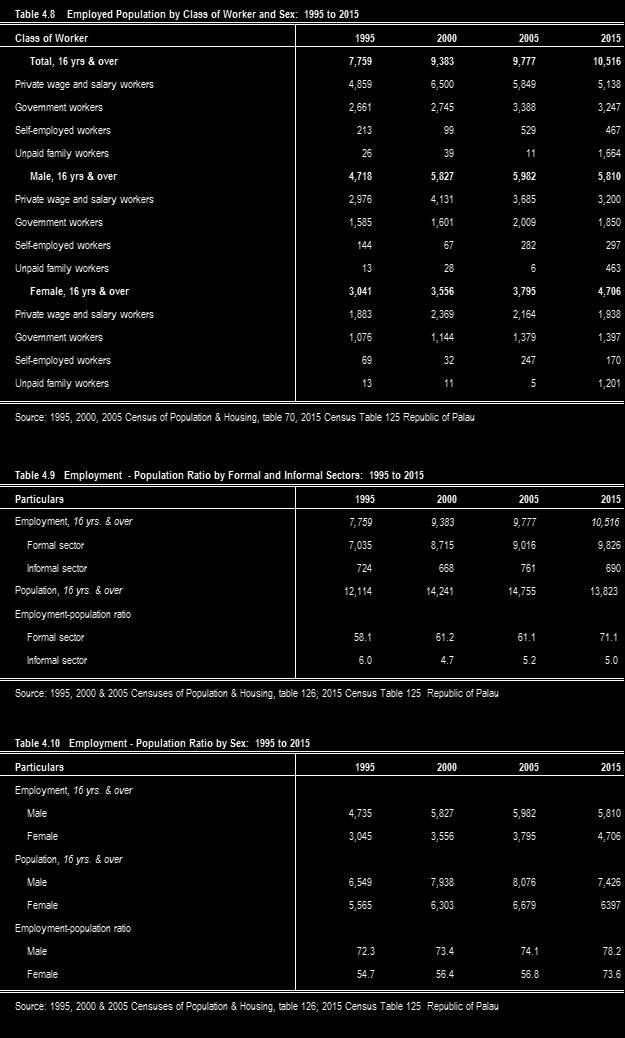
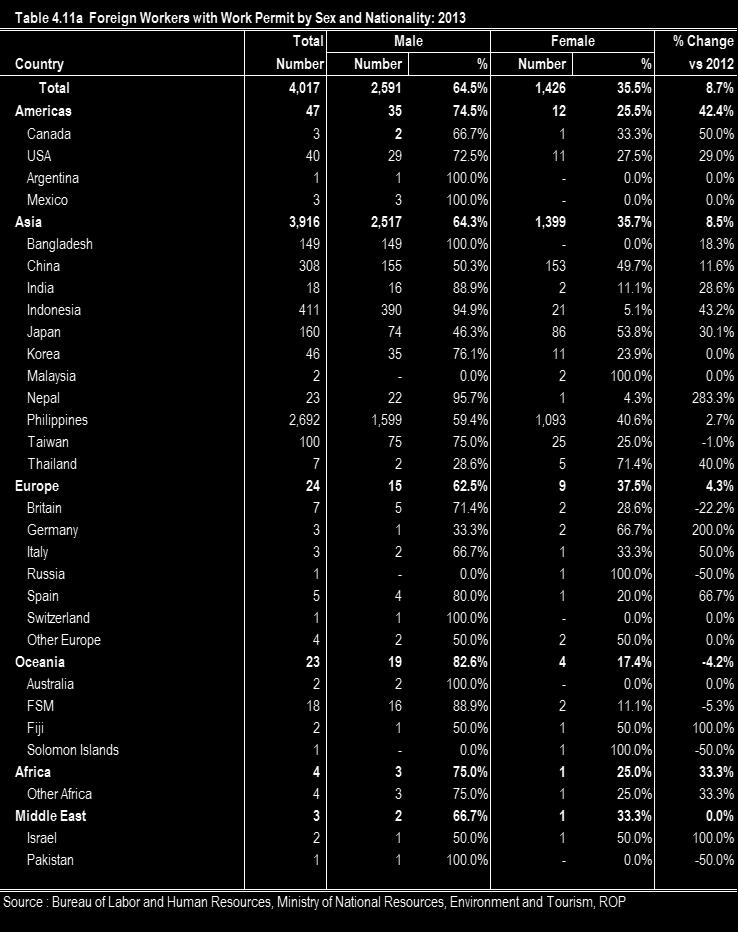
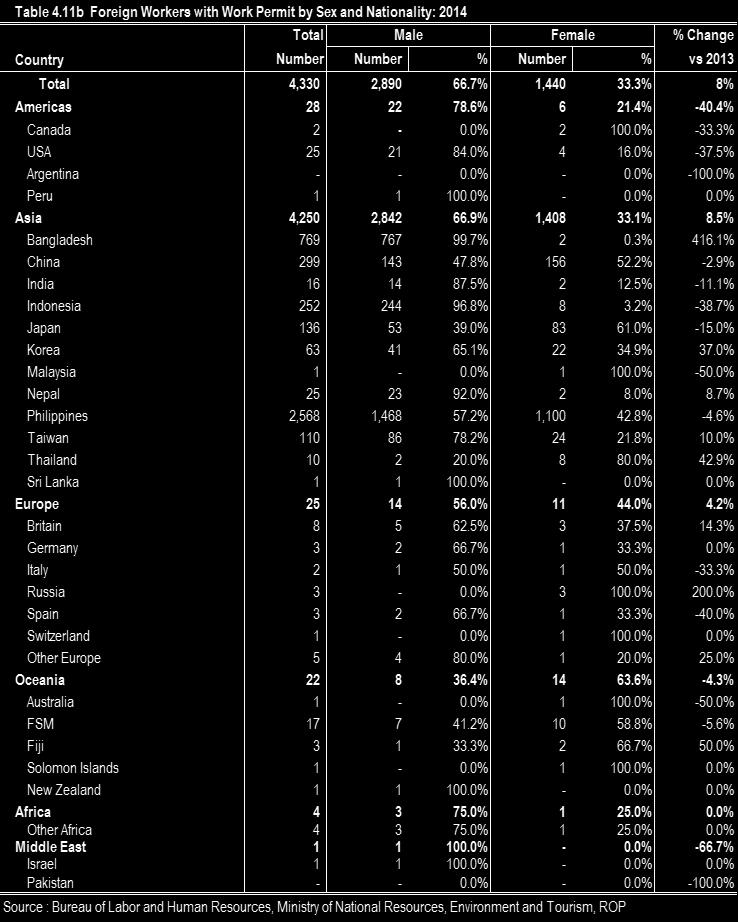
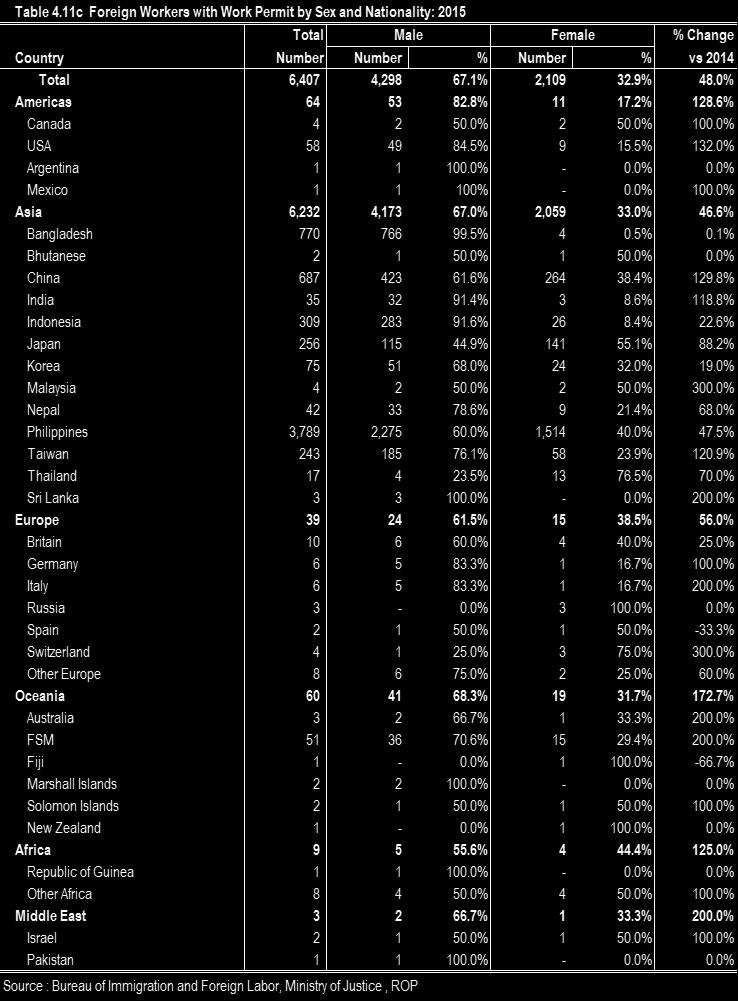
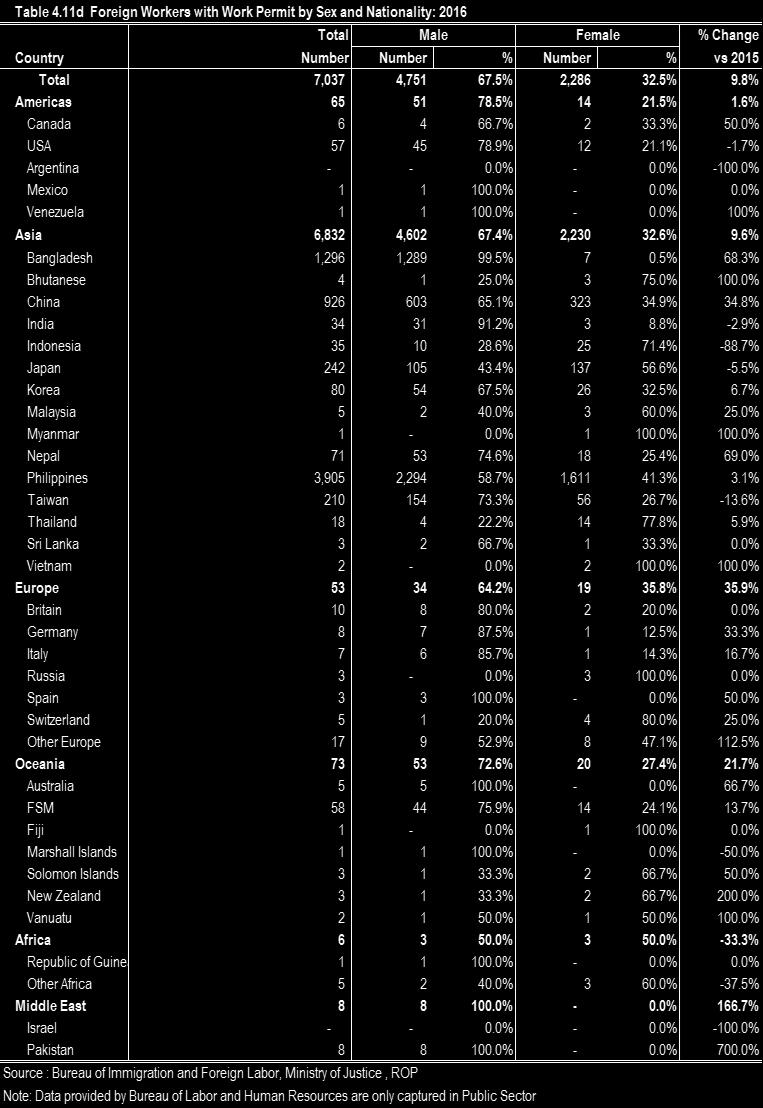
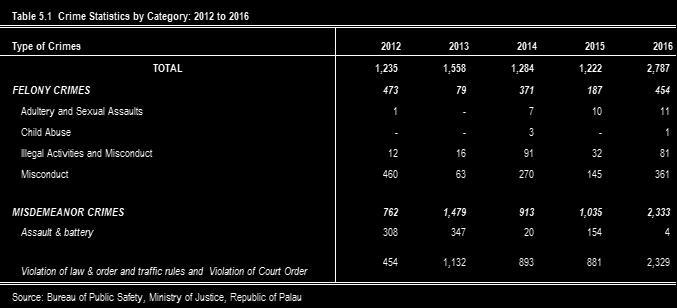
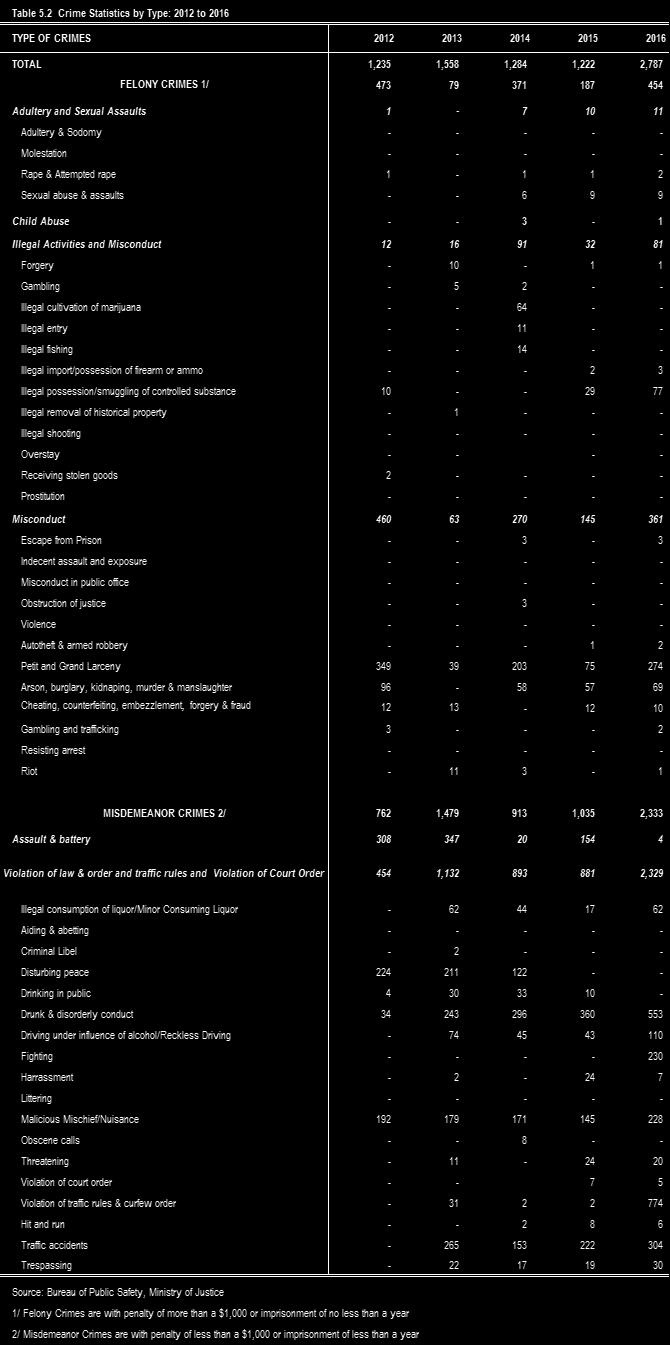
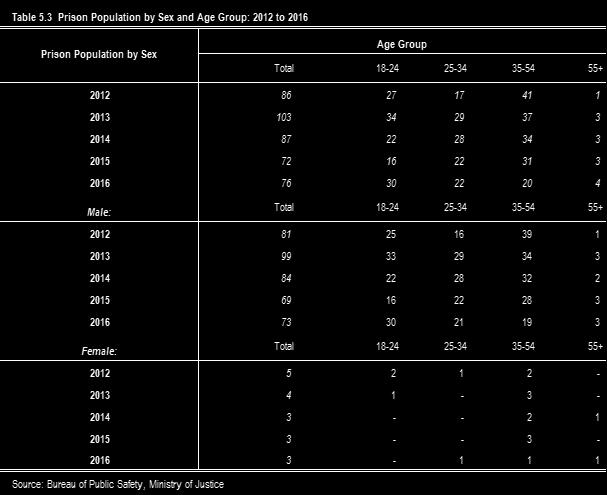
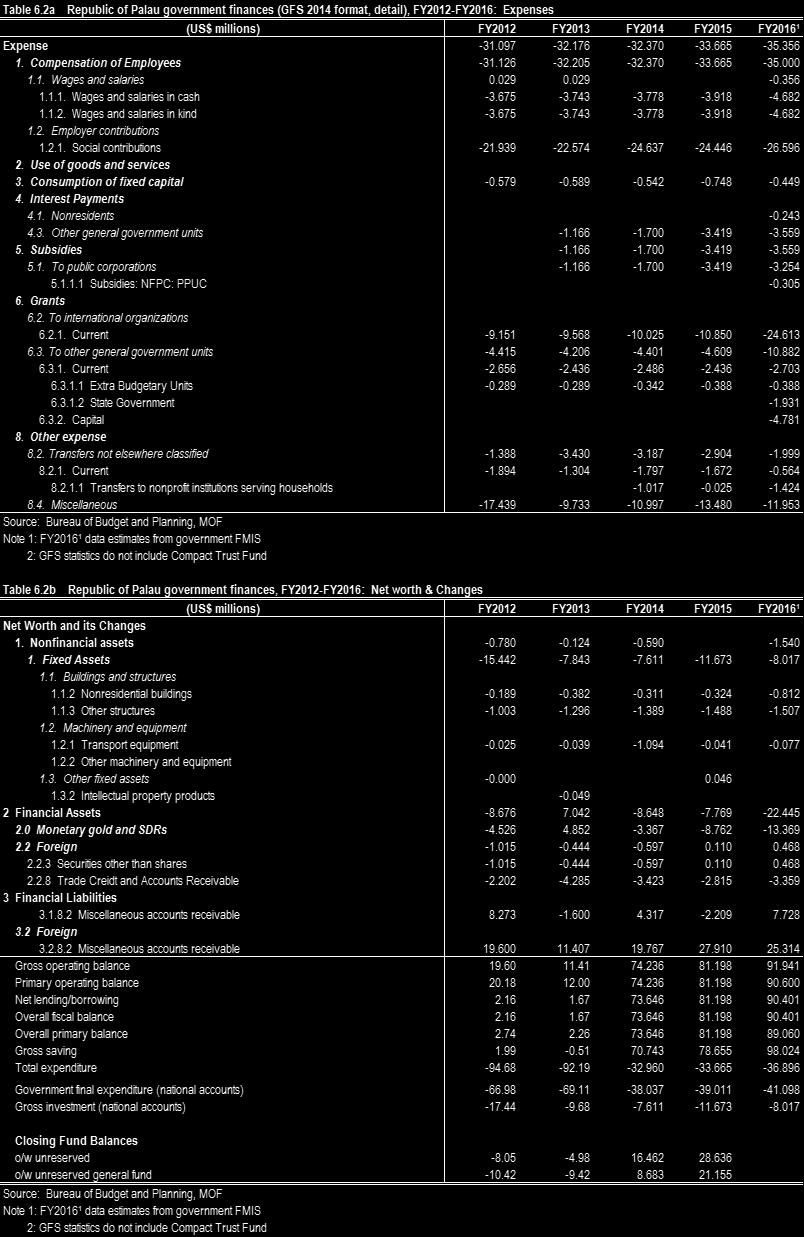
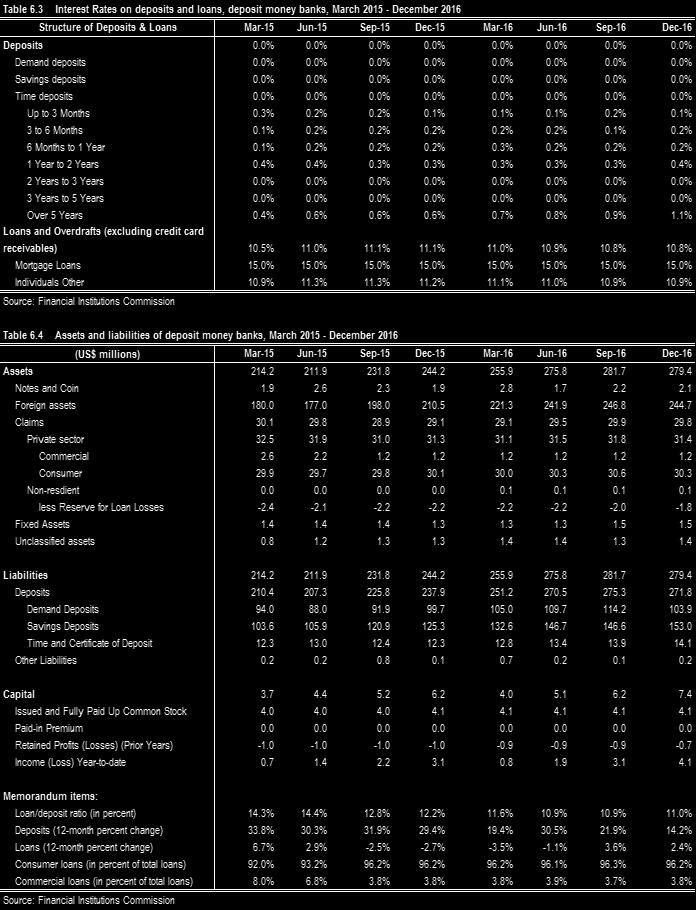
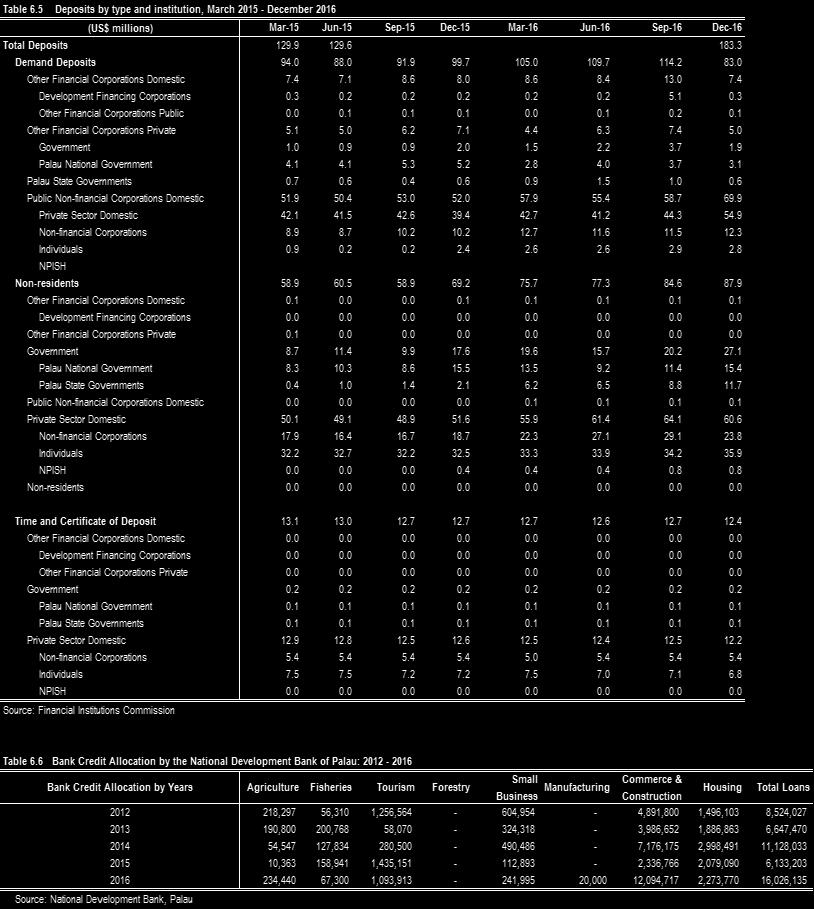
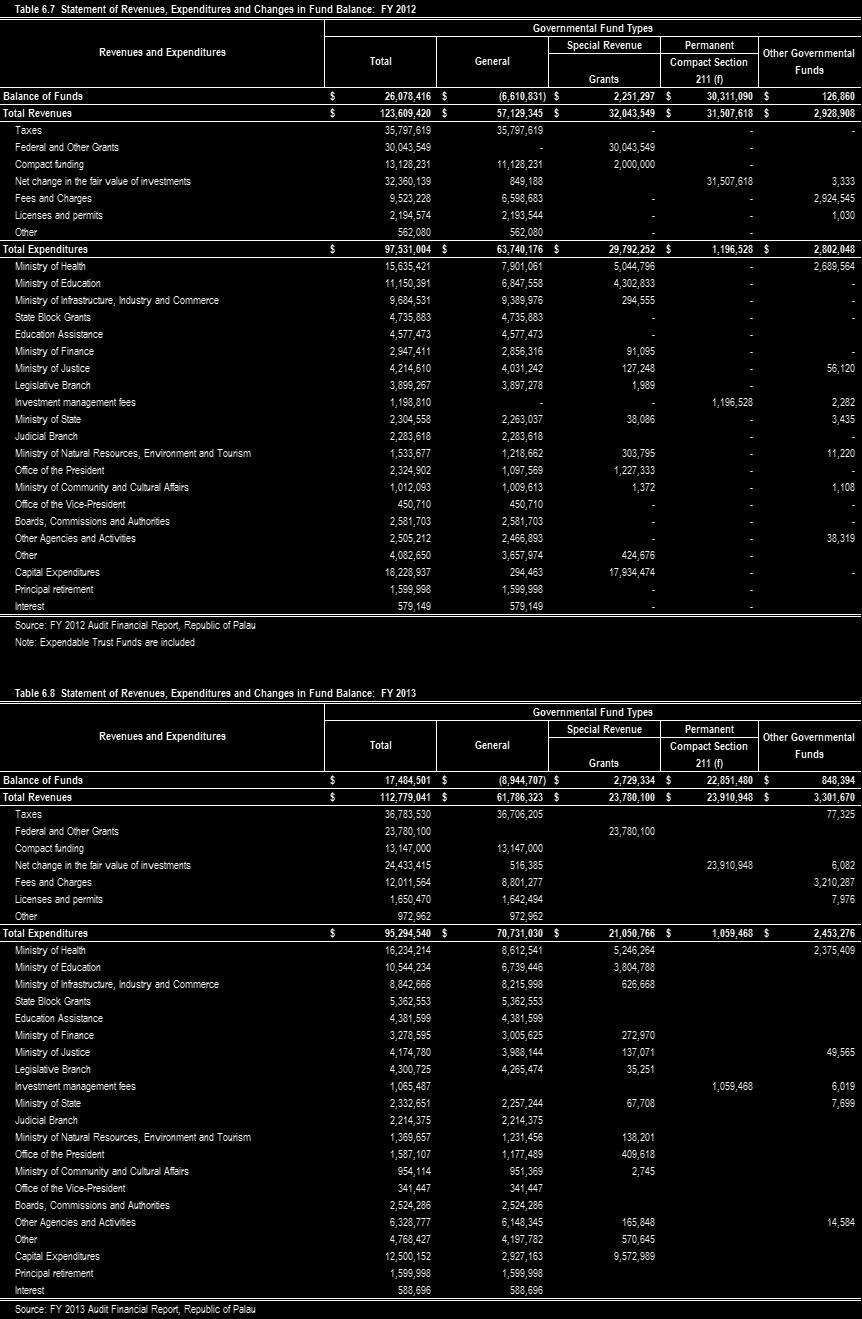
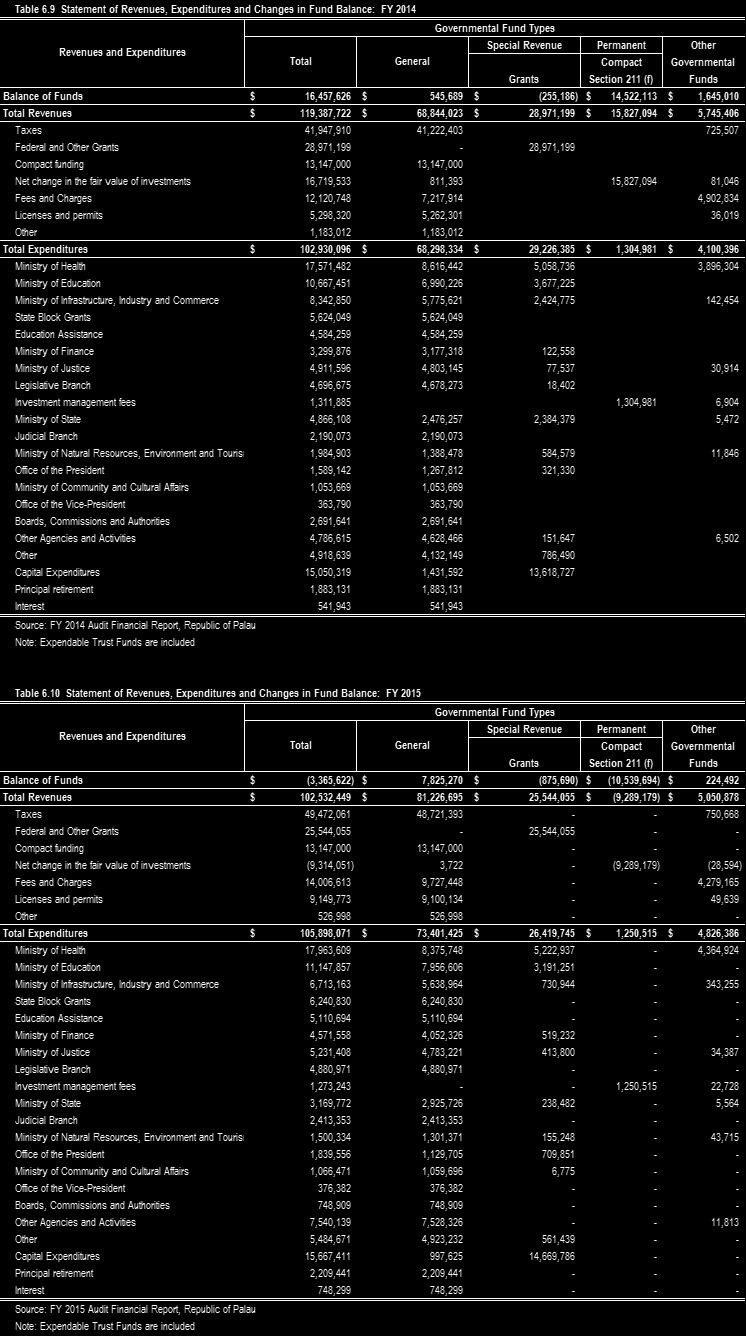
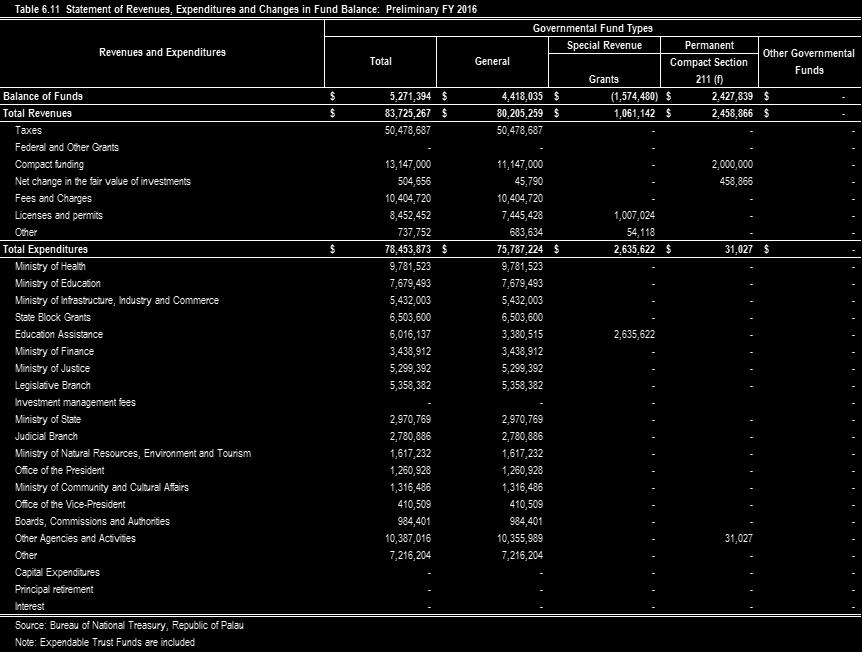
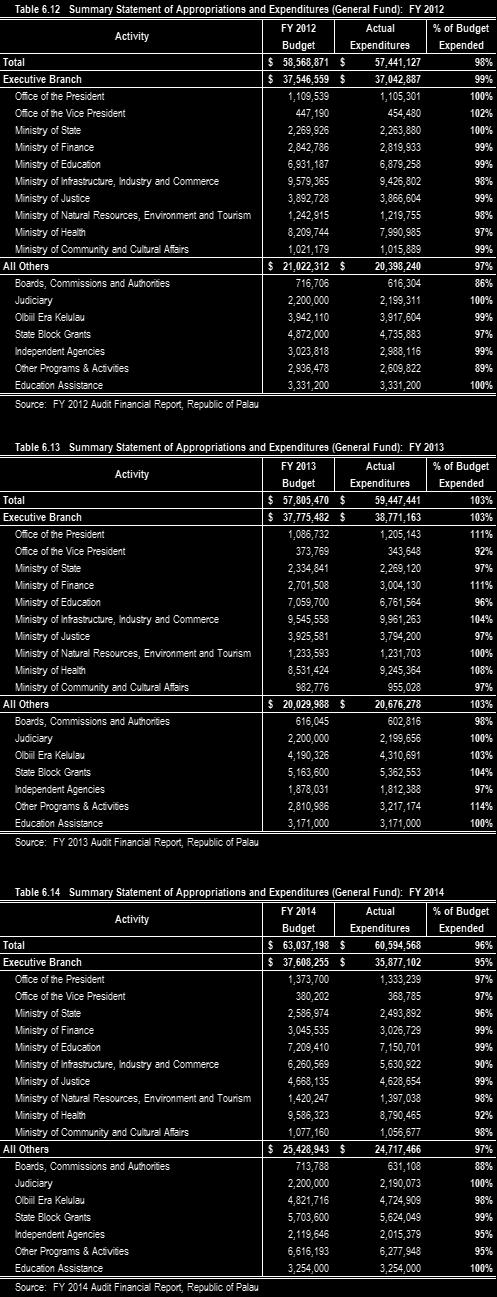
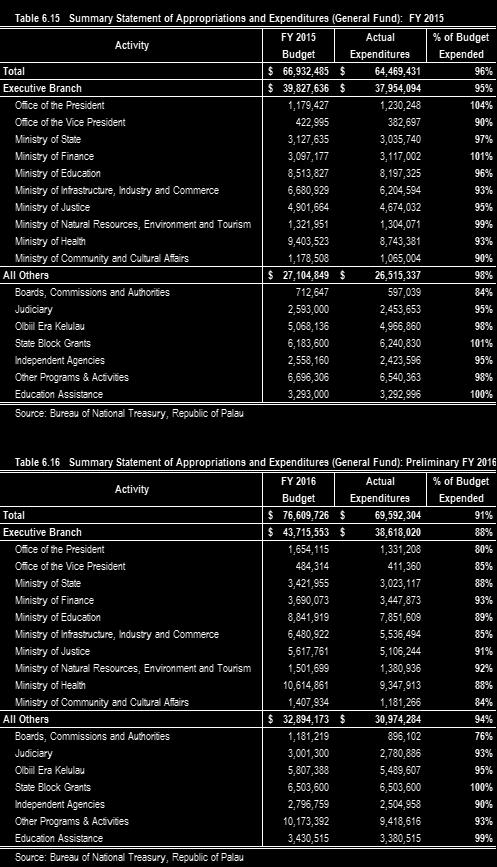
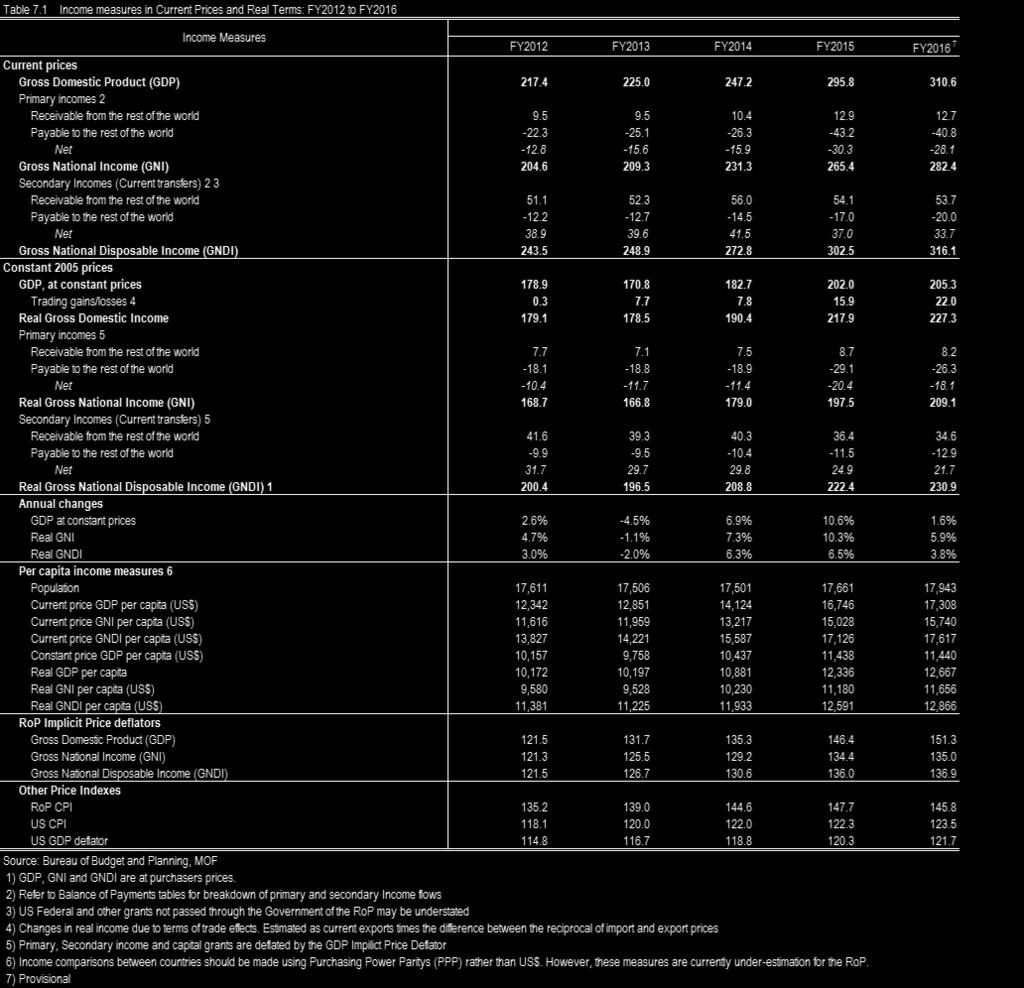
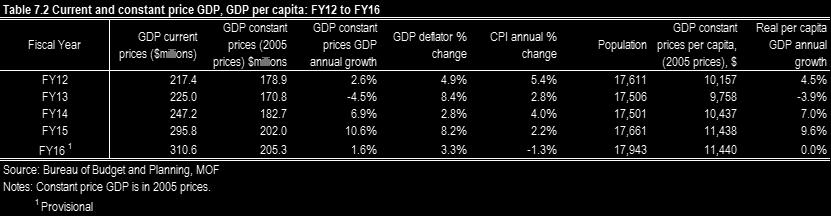
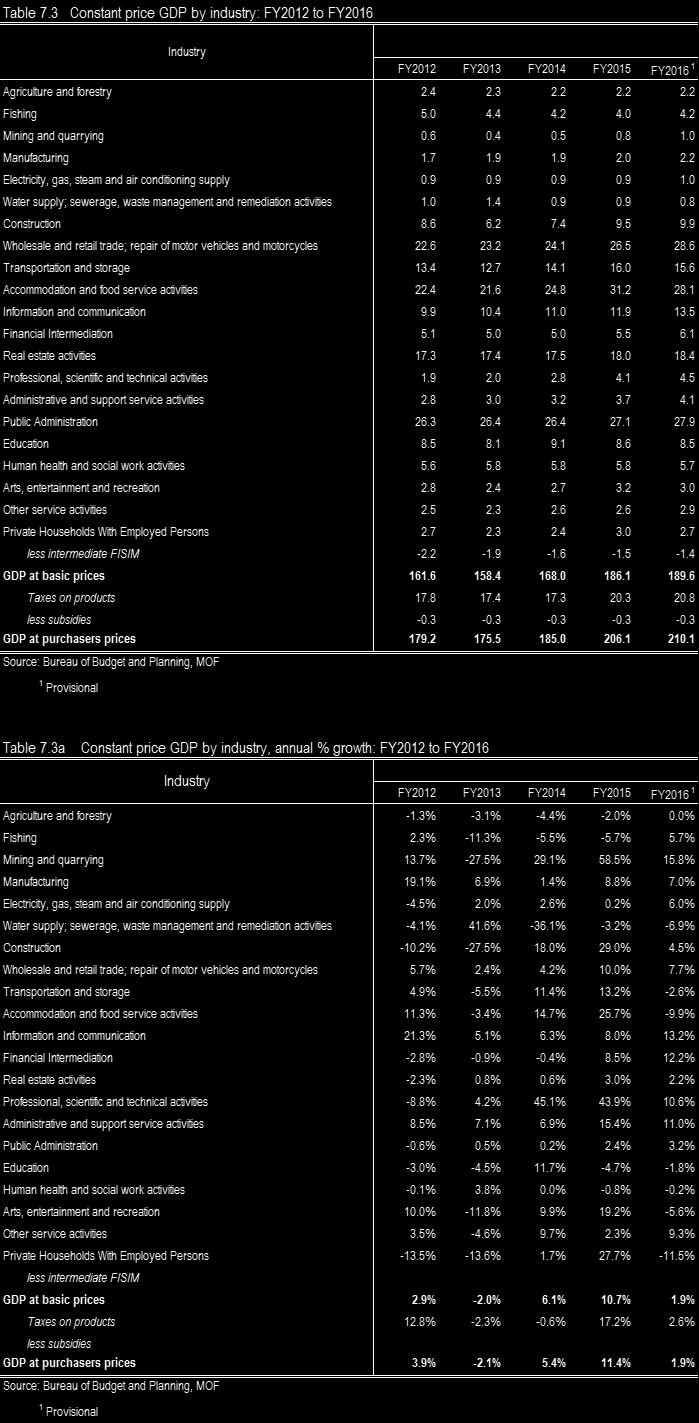
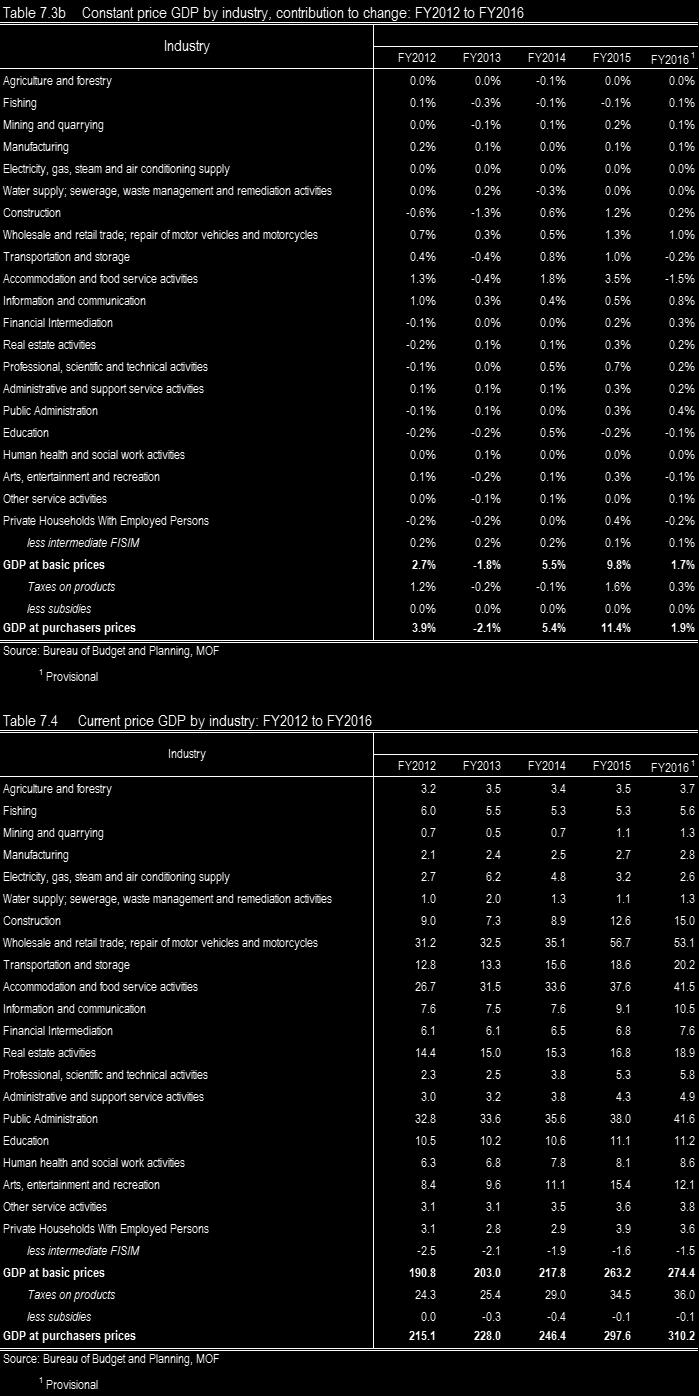
6 Table 4.7e Table 4.8 Table 4.9 Table 4.10 Table 4.11 Table 4.11a Table 4.11b Table 4.11c Table 4.11d National government average wage and salary rates by COFOG, FY2012-FY2016 Employed Population by Class of Worker and Sex: 1995 to 2015 Employment - Population Ratio by Formal and Informal Sectors: 1995 to 2015 Employment - Population Ratio by Sex: 1995 to 2015 Foreign Workers with Work Permit by Sex and Nationality: 2012 Foreign Workers with Work Permit by Sex and Nationality: 2013 Foreign Workers with Work Permit by Sex and Nationality: 2014 Foreign Workers with Work Permit by Sex and Nationality: 2015 Foreign Workers with Work Permit by Sex and Nationality: 2016 CHAPTER 5: CRIME Page Table 5.1 Table 5.1a Table 5.2 Table 5.3 Table 5.4 Table 5.5 Table 5.6 Crime Statistics by Category: 2012 to 2016 Crime Statistics by Category: 2012 to 2016 (Percent) Crime Statistics by Type: 2012 to 2016 Prison Population by Sex and Age Group: 2012 to 2016 Crime Statistics by Cause of Wildfires and Acres: Crime Statistics by Size Class of Wildfires and Acres: Crime Statistics by Illegal Activities and Misconduct: Nov-Dec 2015 & Jan-Dec 2016 CHAPTER 6. GOVERNMENT FINANCE & BANKING STATISTICS Page Table 6.1 Table 6.2 Table 6.2a Table 6.3 Table 6.4 Table 6.5 Table 6.6 Table 6.7 Table 6.8 Table 6.9 Table 6.10 Table 6.11 Table 6.12 Table 6.13 Table 6.14 Table 6.15 Table 6.16 Republic of Palau Government Financial Statement, FY2012-FY2015: Summary Republic of Palau Government Finances (GFS 2014 format detail), FY : Revenue Republic of Palau Government Finances (GFS 2014 format detail), FY : Expenses Interest Rates on deposits and loans, deposit money banks, March December 2016 Assets and liabilities of deposit money banks, March December 2016 Deposits by type and institution, March December 2016 Bank Credit Allocation by the National Development Bank of Palau: Statement of Revenues, Expenditures and Changes in Fund Balance: FY 2012 Statement of Revenues, Expenditures and Changes in Fund Balance: FY 2013 Statement of Revenues, Expenditures and Changes in Fund Balance: FY 2014 Statement of Revenues, Expenditures and Changes in Fund Balance: FY 2015 Statement of Revenues, Expenditures and Changes in Fund Balance: Preliminary FY 2016 Summary Statement of Appropriations and Expenditures (General Fund): FY 2012 Summary Statement of Appropriations and Expenditures (General Fund): FY 2013 Summary Statement of Appropriations and Expenditures (General Fund): FY 2014 Summary Statement of Appropriations and Expenditures (General Fund): FY 2015 Summary Statement of Appropriations and Expenditures (General Fund): Preliminary FY 2016 CHAPTER 7. NATIONAL ACCOUNTS; BALANCE OF PAYMENT; AND CONSUMER PRICE INDEX Page Table 7.1 Table 7.2 Table 7.3 Table 7.3a Table 7.3b Table 7.4 Income Measures in Current Prices and Real Terms: FY12 to FY16 Current and constant price GDP & GDP per capita: FY12 to FY16 Constant price GDP by Industry: FY 2012 TO FY 2016 Constant price GDP by industry and annual % growth: FY12 to FY16 Constant price GDP by industry and contribution to change: FY12 to FY16 Current price GDP by industry: FY12 to FY16 (In US$ millions)
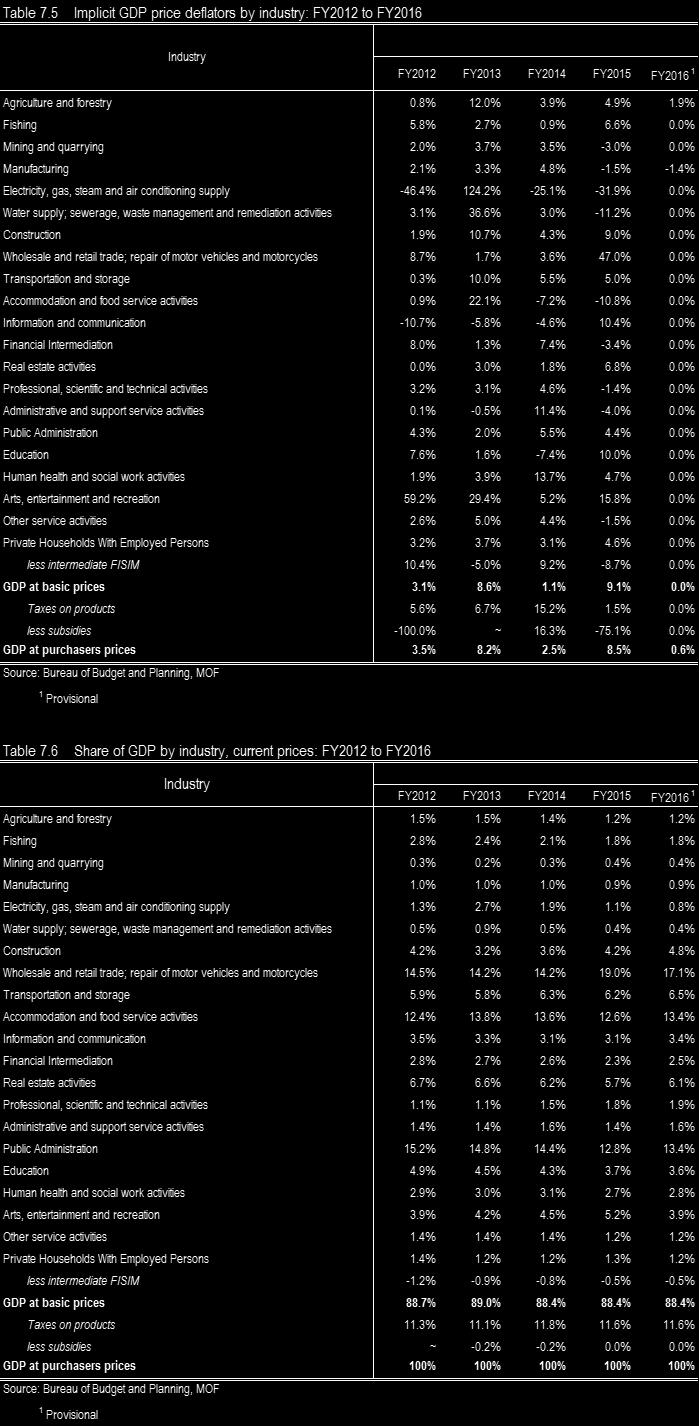
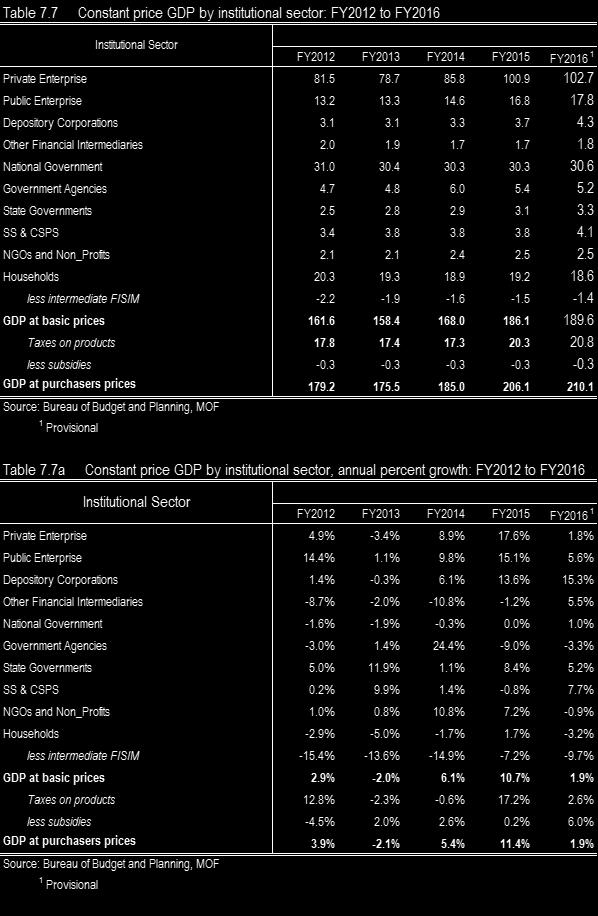
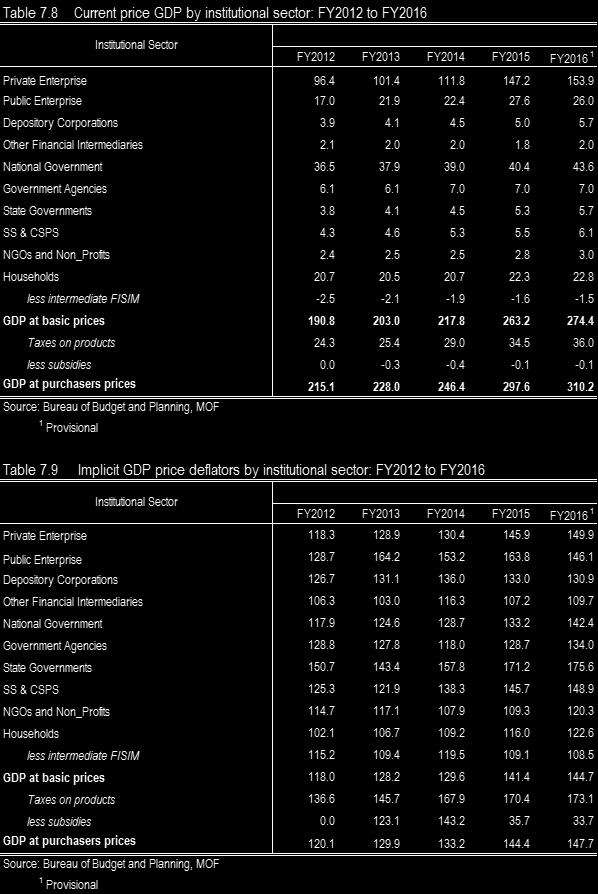
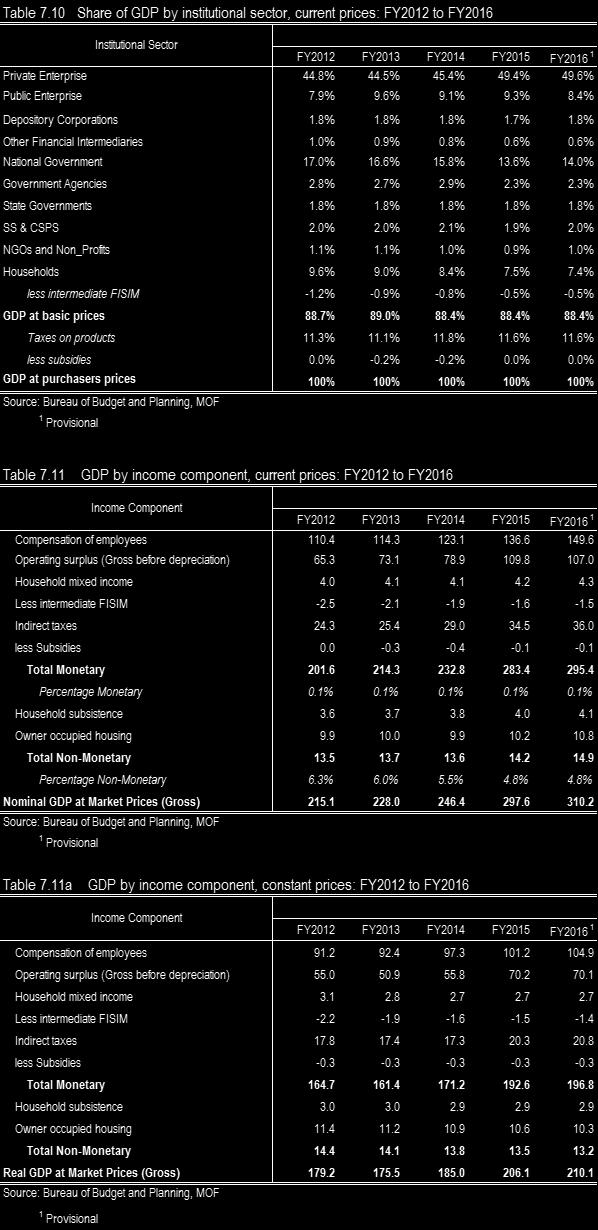
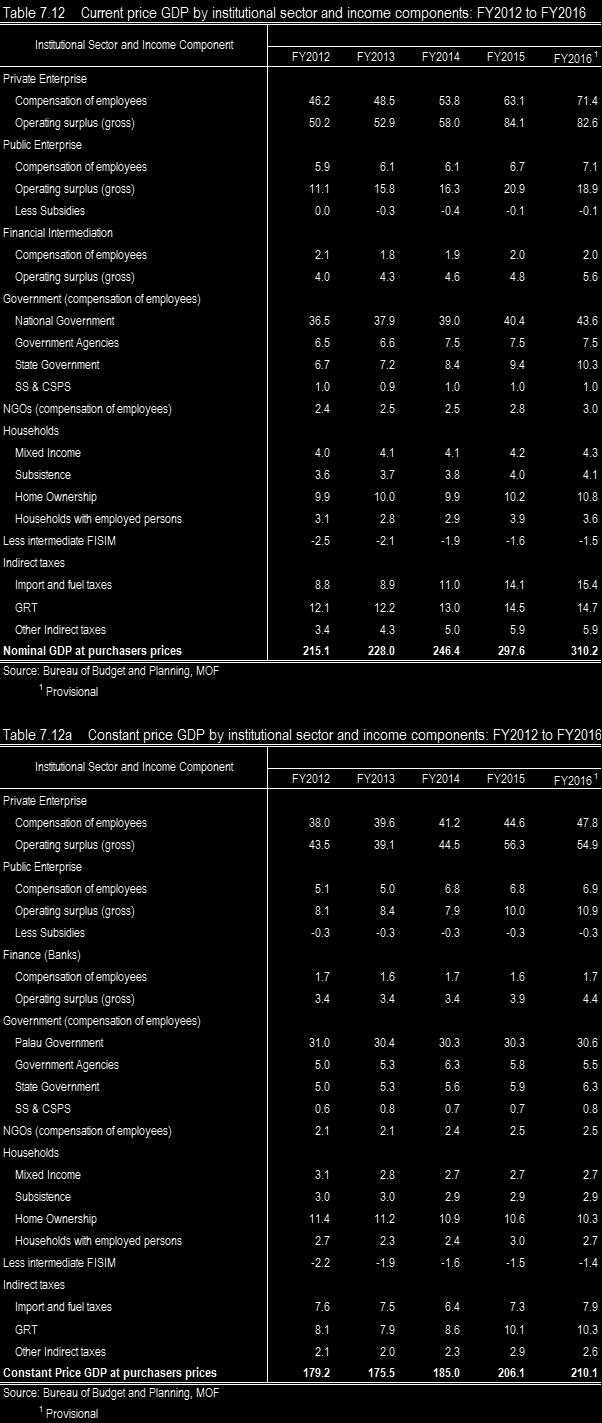
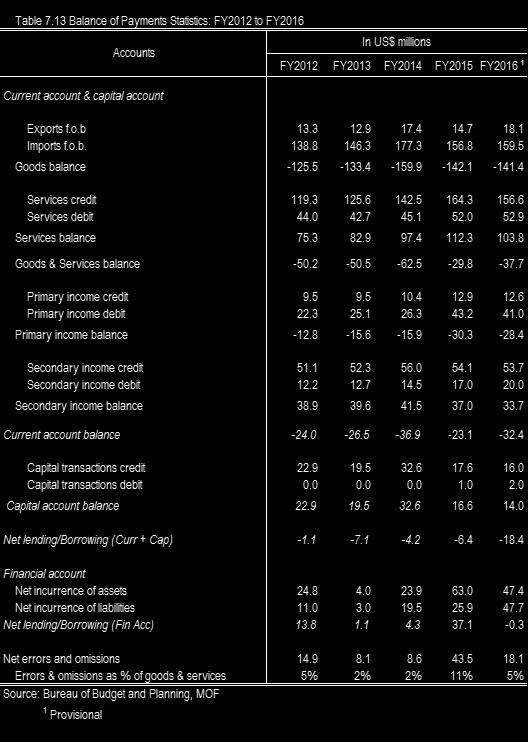
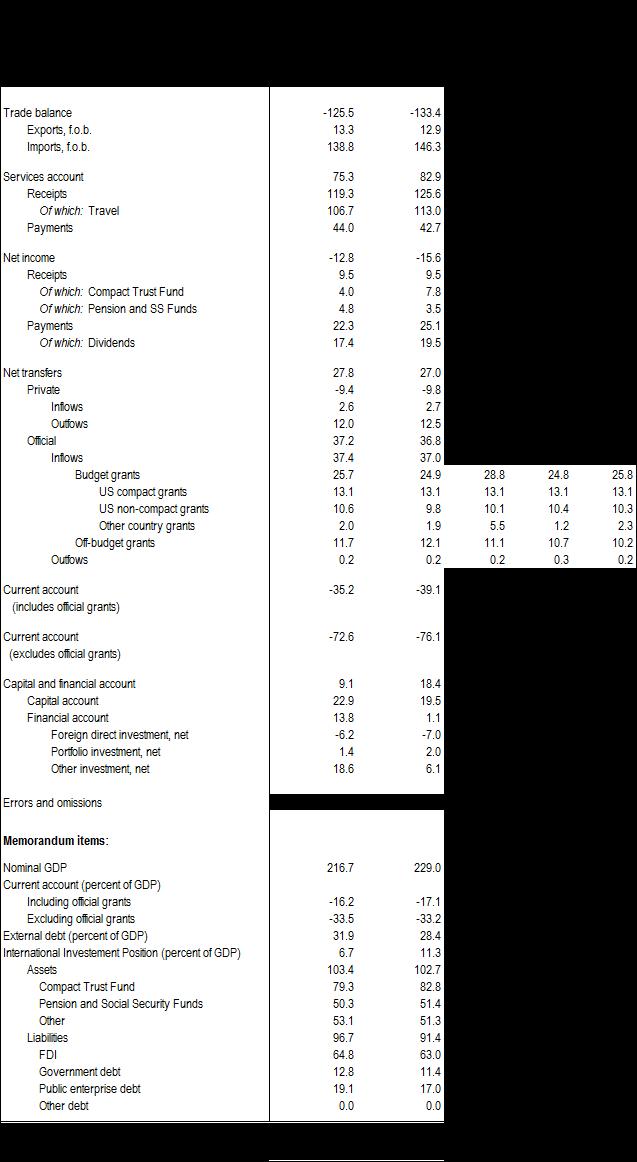
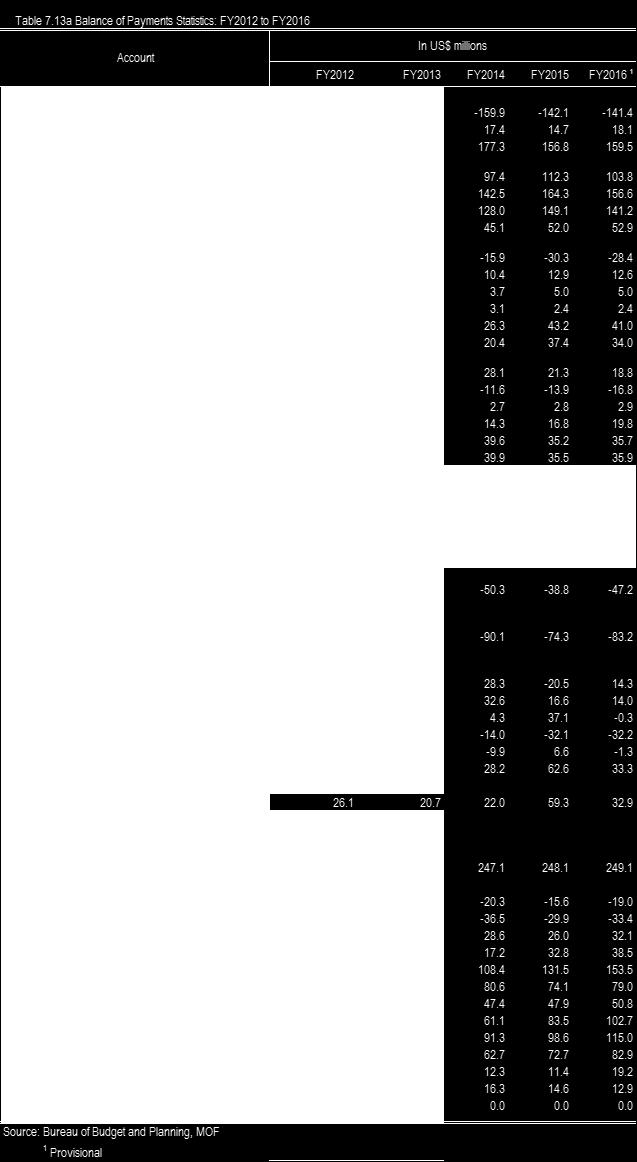
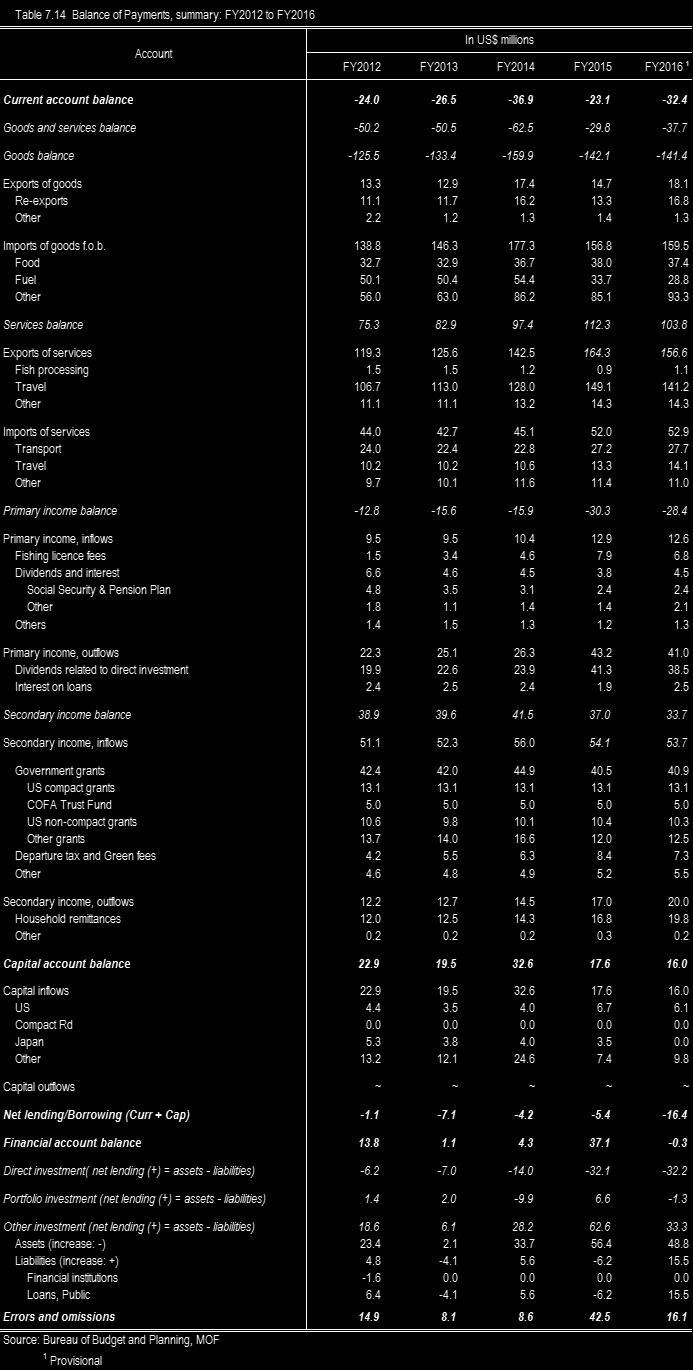
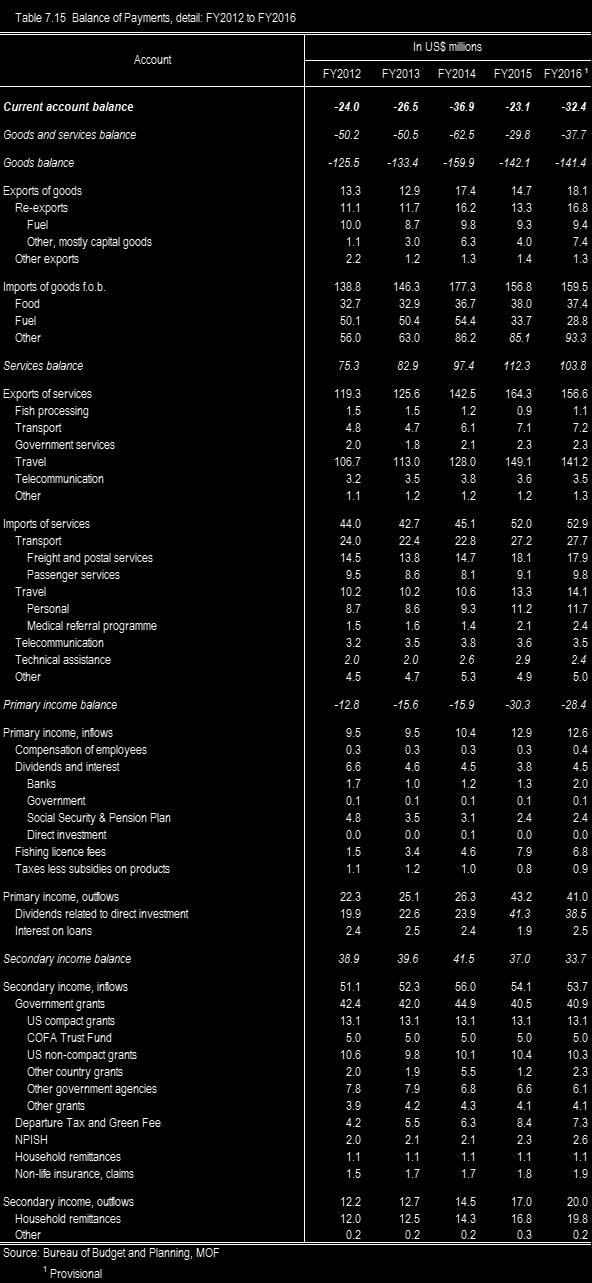
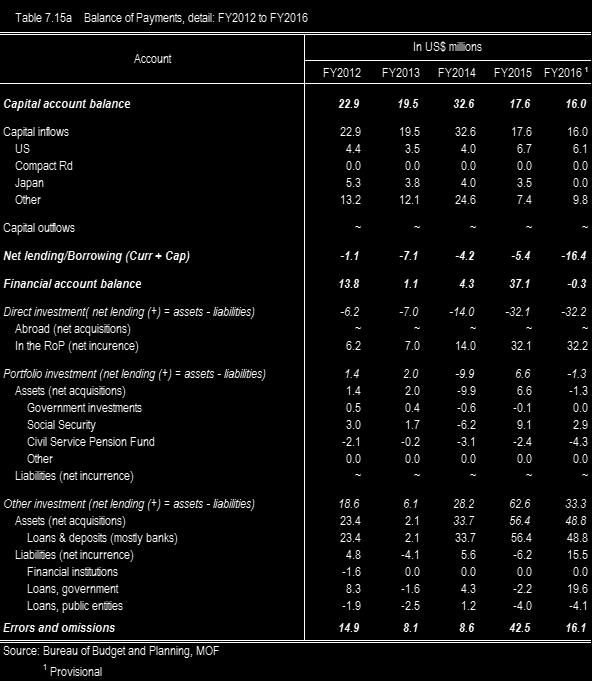
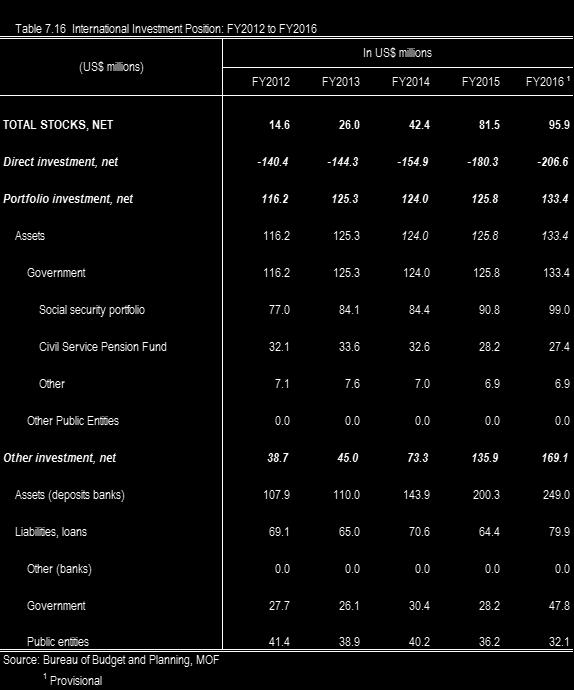
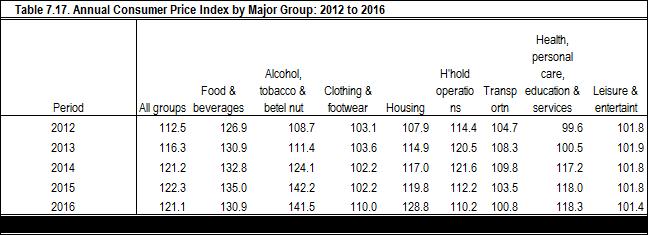
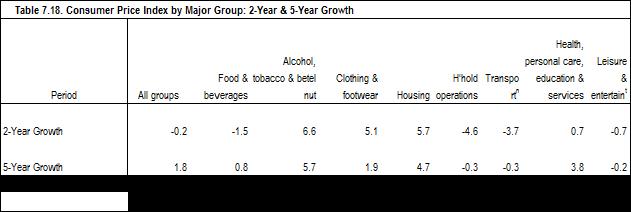
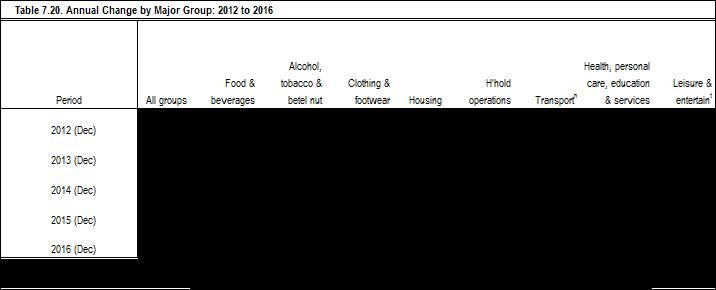
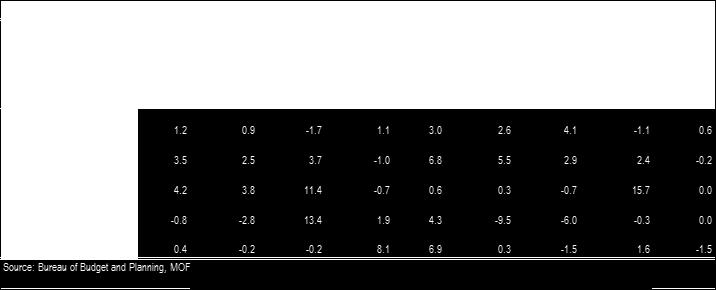
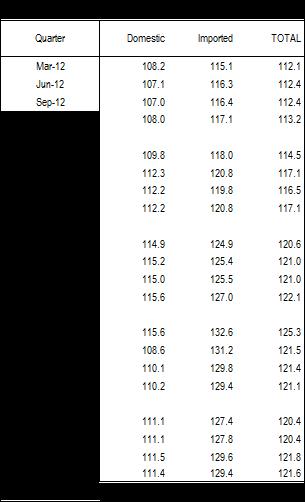
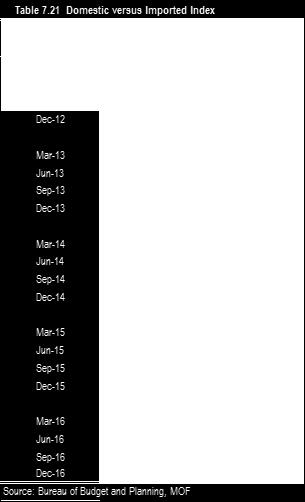
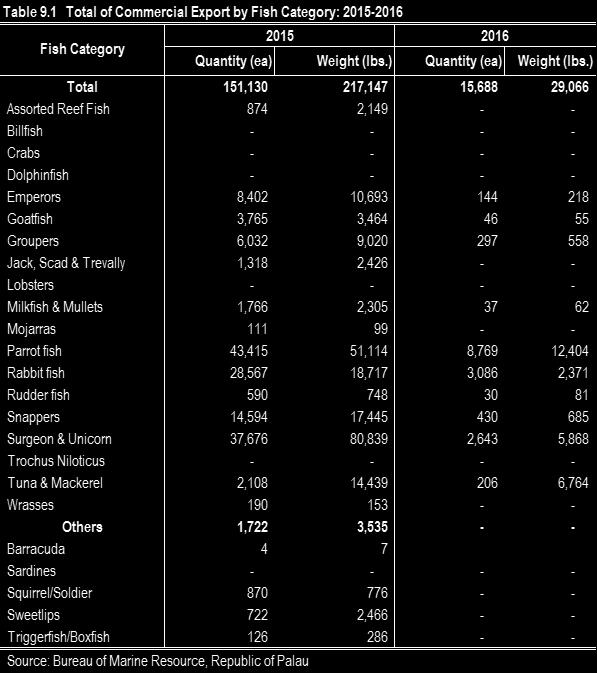
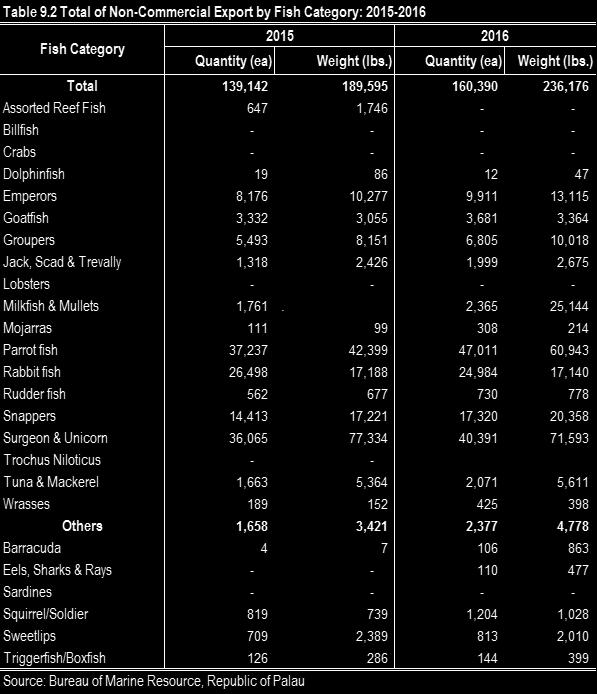
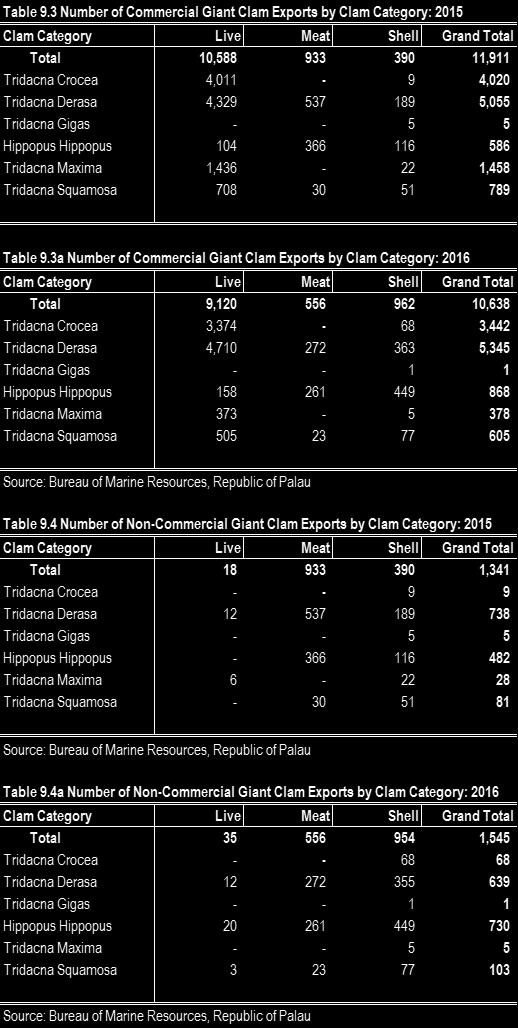
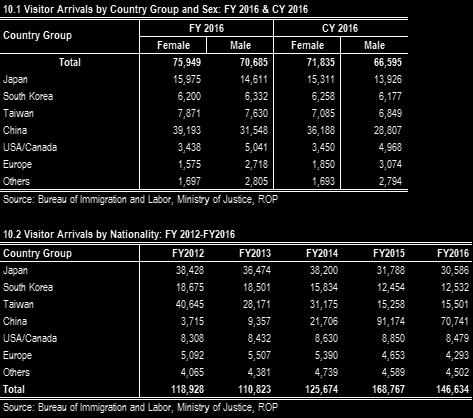
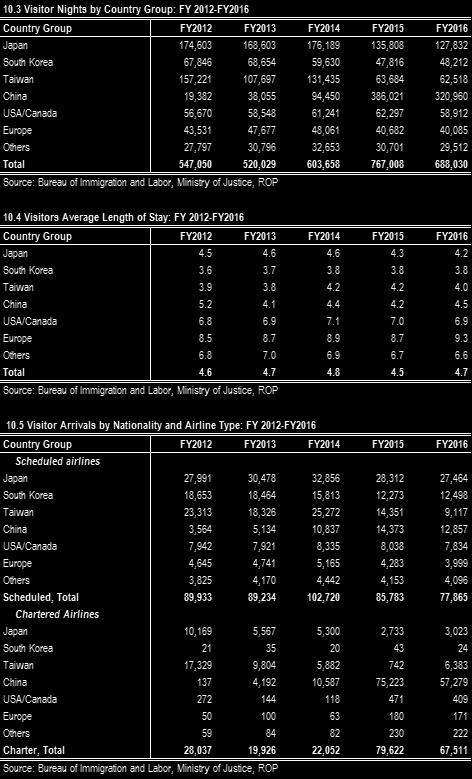
7 Table 7.5 Table 7.6 Table 7.7 Table 7.7a Table 7.8 Table 7.9 Table 7.10 Table 7.11 Table 7.11a Table 7.12 Table 7.12a Table 7.13 Table 7.13a Table 7.14 Table 7.15 Table 7.15a Table 7.16 Table 7.17 Table 7.17a Table 7.17b Table 7.18 Table 7.19 Table 7.20 Implicit GDP price deflators by industry: FY12 to FY16 Share of GDP by industry and current prices: FY12 to FY16 Constant price GDP by institutional sector: FY12 to FY16 Constant price GDP by institutional sector, annual percent growth: FY12 to FY16 Current price GDP by institutional sector: FY12 to FY16 Implicit GDP price deflators by institutional sector: FY12 to FY16 Share of GDP by institutional sector, current prices: FY12 to FY16 GDP by income component, current prices: FY12 to FY16 GDP by income component, constant prices: FY12 to FY16 Current price GDP by institutional sector and income components: FY12 to FY16 Constant price GDP by institutional sector and income components: FY12 to FY16 Balance of Payments Statistics: FY12 to FY16 Balance of Payments Statistics: FY12 to FY16 Balance of Payments, summary: FY12 to FY16 Balance of Payments, detail: FY12 to FY16 Balance of Payments, detail: FY12 to FY16 International Investment Position: FY08 to FY14 Annual Consumer Price Index by Major Group: 2012 to 2016 Quarterly Consumer Price Index by Major Group: Mar 2012 to Dec 2016 Consumer Price Index by Major Group: 2 Year & 5 Year Growth Consumer Price Index Quarterly Change by Major Group: Mar-12 to Dec-16 Annual Change by Major Group: 2012 to 2016 Domestic v. Imported Index CHAPTER 8. TRADE Page Table 8.1 Table 8.2 Imports by Harmonized System Sections, FY2012-FY2016 (FOR Value, $US millions) Imports by Broad Economic Classification (REC), FY2012-FY2016, (CIF Value, $US millions CHAPTER 9. FISHERIES Page Table 9.1 Table 9.2 Table 9.3 Table 9.3a Table 9.4 Table 9.4a Total of Commercial Export by Fish Category: Total of Non-Commercial Export by Fish Category: Total Number of Commercial Giant Clam Exports by Clam Category: 2015 Total Number of Commercial Giant Clam Exports by Clam Category: 2016 Total Number of Non-Commercial Giant Clam Exports by Clam Category: 2015 Total Number of Non-Commercial Giant Clam Exports by Clam Category: 2016 CHAPTER 10. TOURISM Page Table 10.1 Table 10.2 Table 10.3 Table 10.4 Table 10.5 Visitors Arrival by Country Group and Sex: FY 2016 & CY 2016 Visitor Arrivals by Nationality: FY 2012-FY2016 Visitor Nights by Country Group: FY 2012-FY2016 Visitors Average Length of Stay: FY 2012-FY2016 Visitor Arrivals by Nationality and Airline Type: FY 2012-FY2016
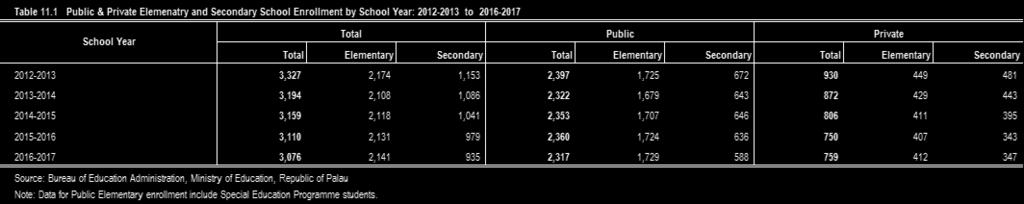
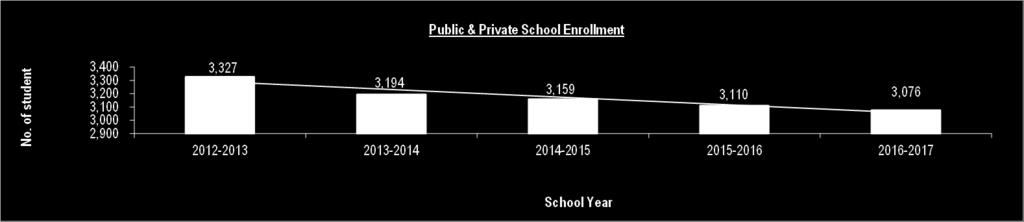
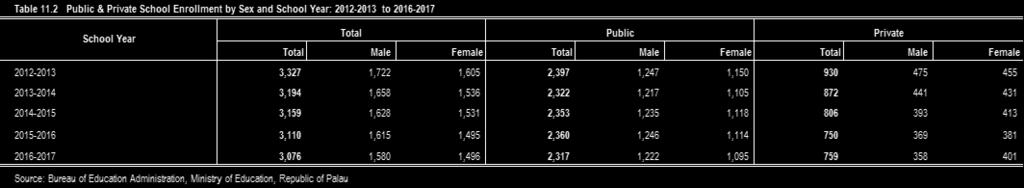
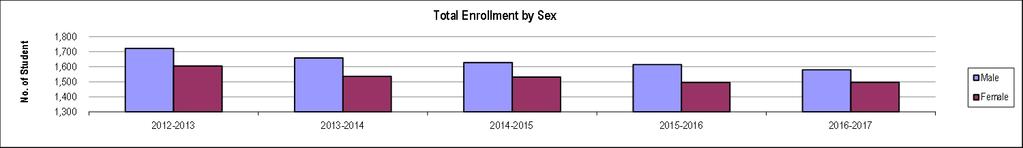
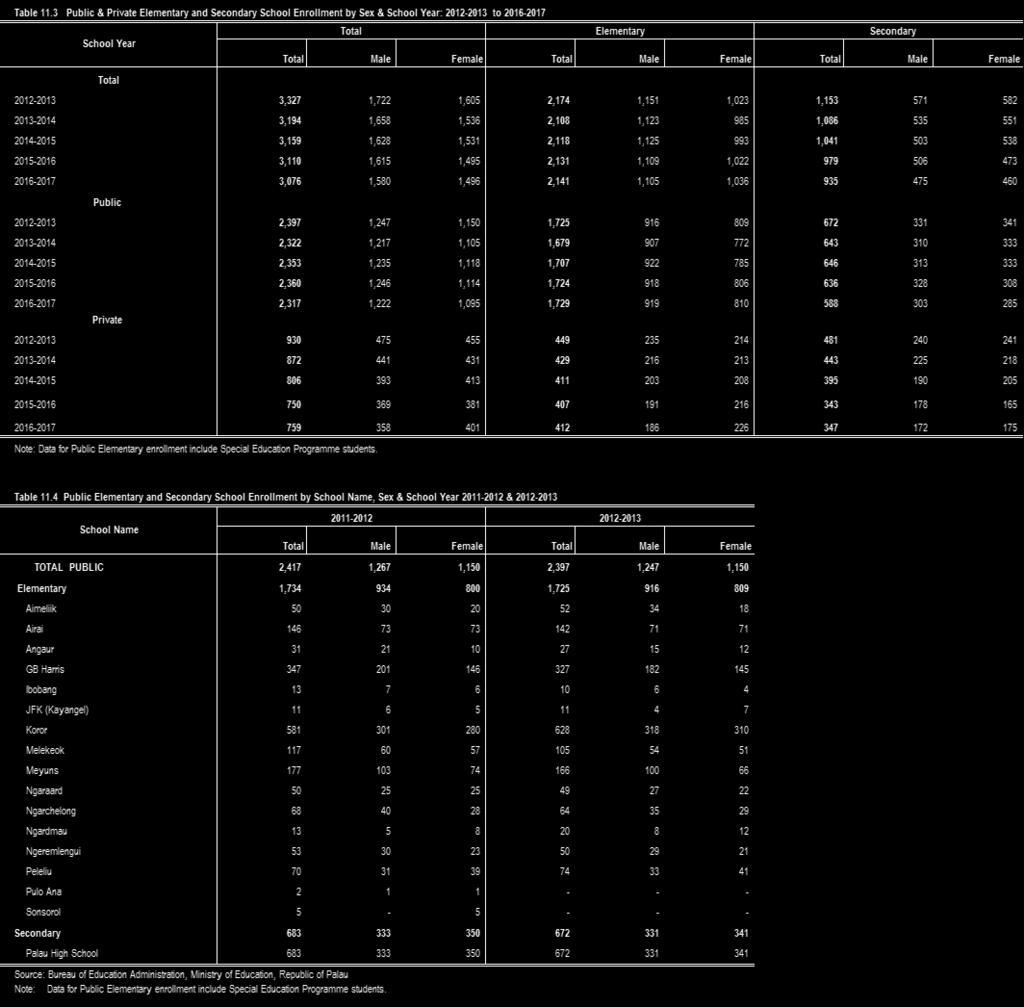
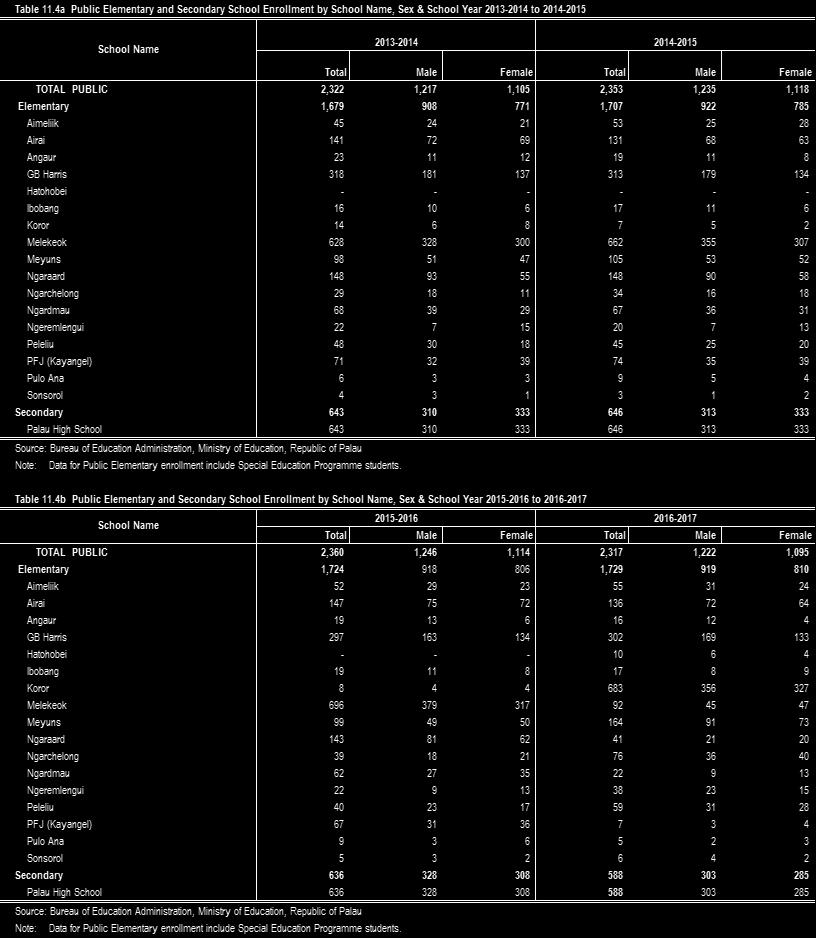
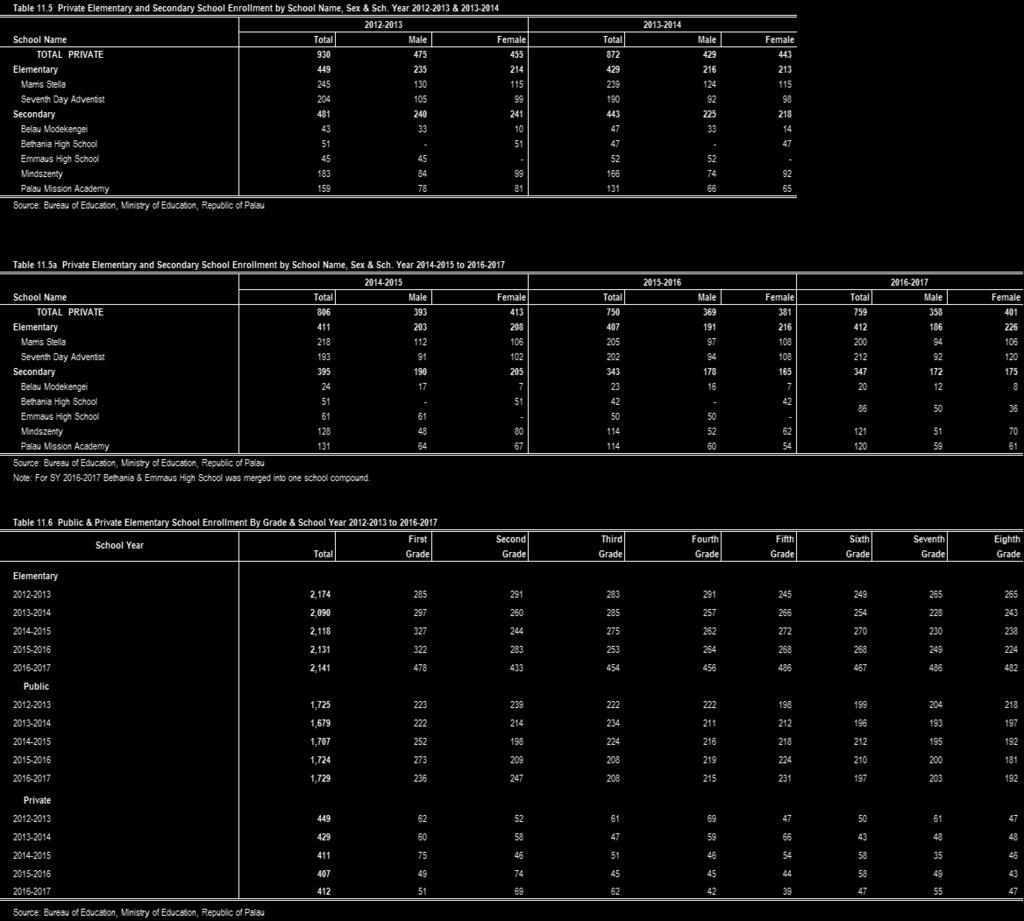
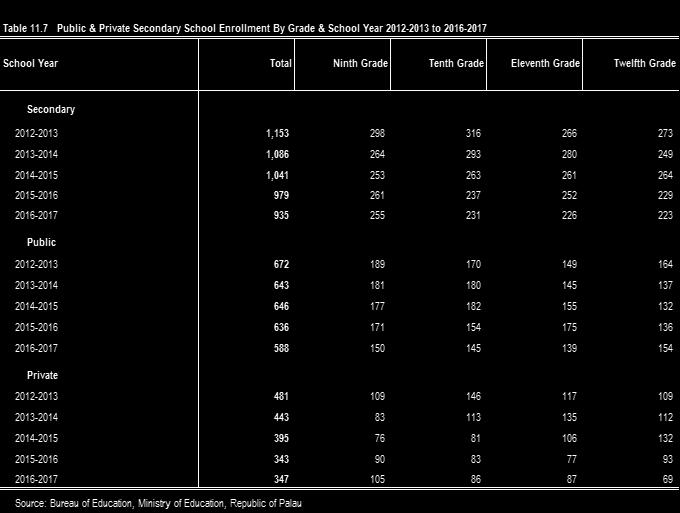
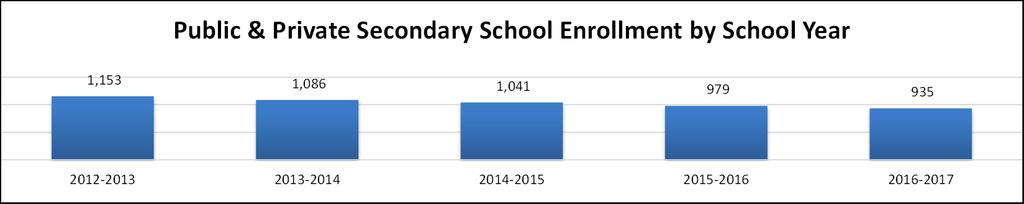
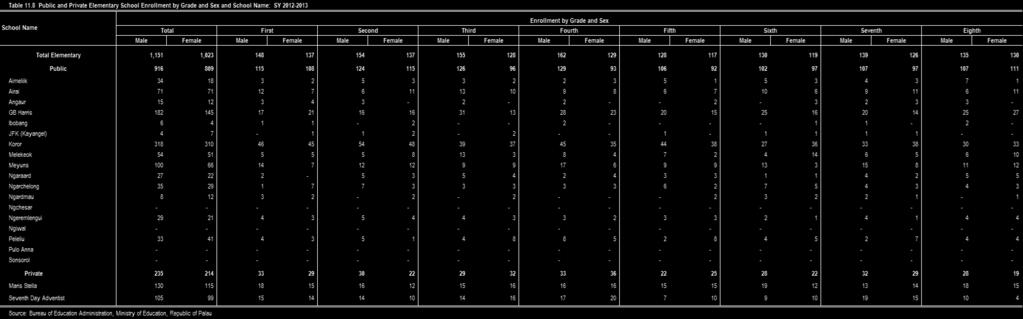
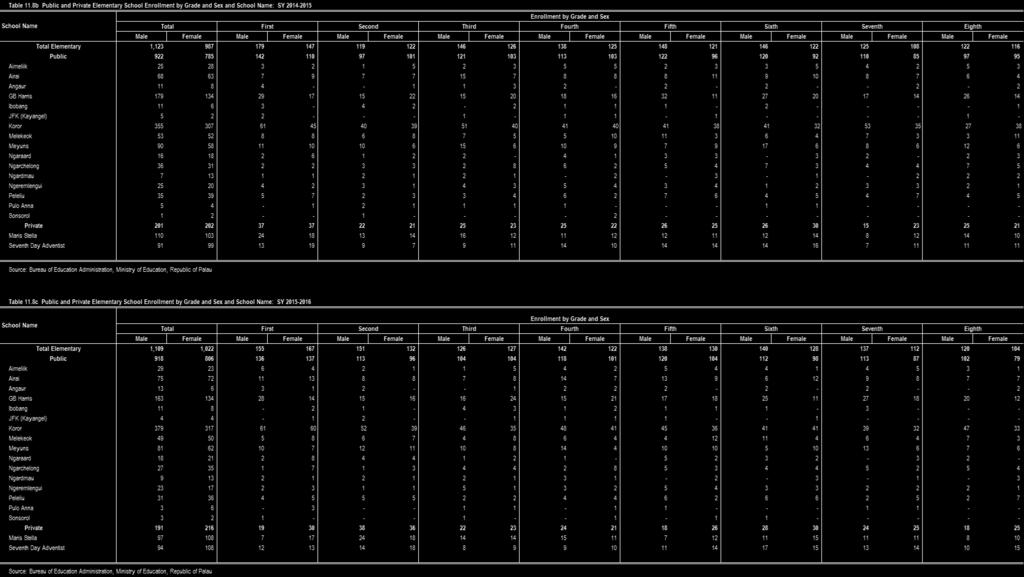
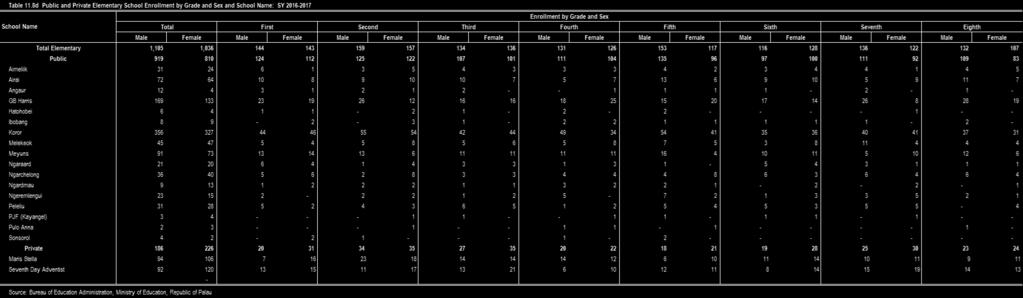
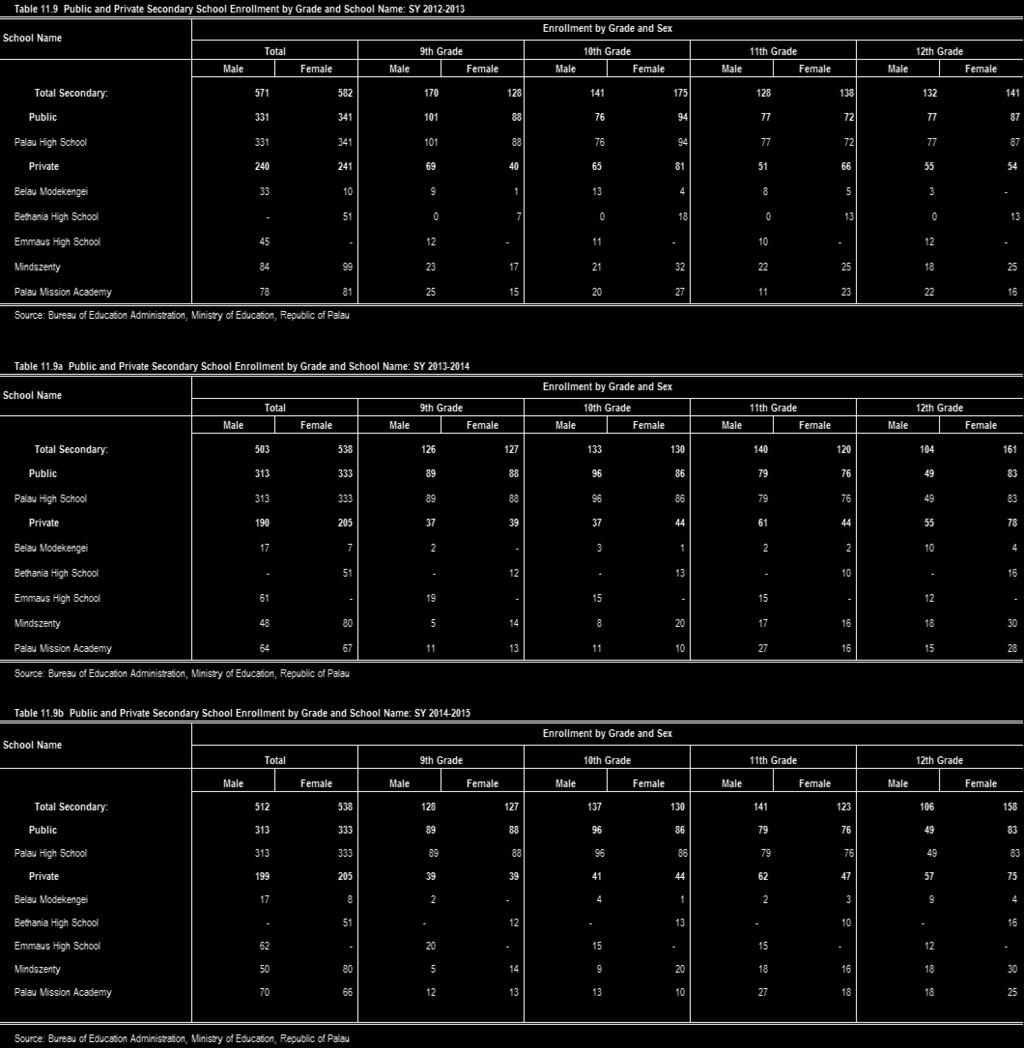
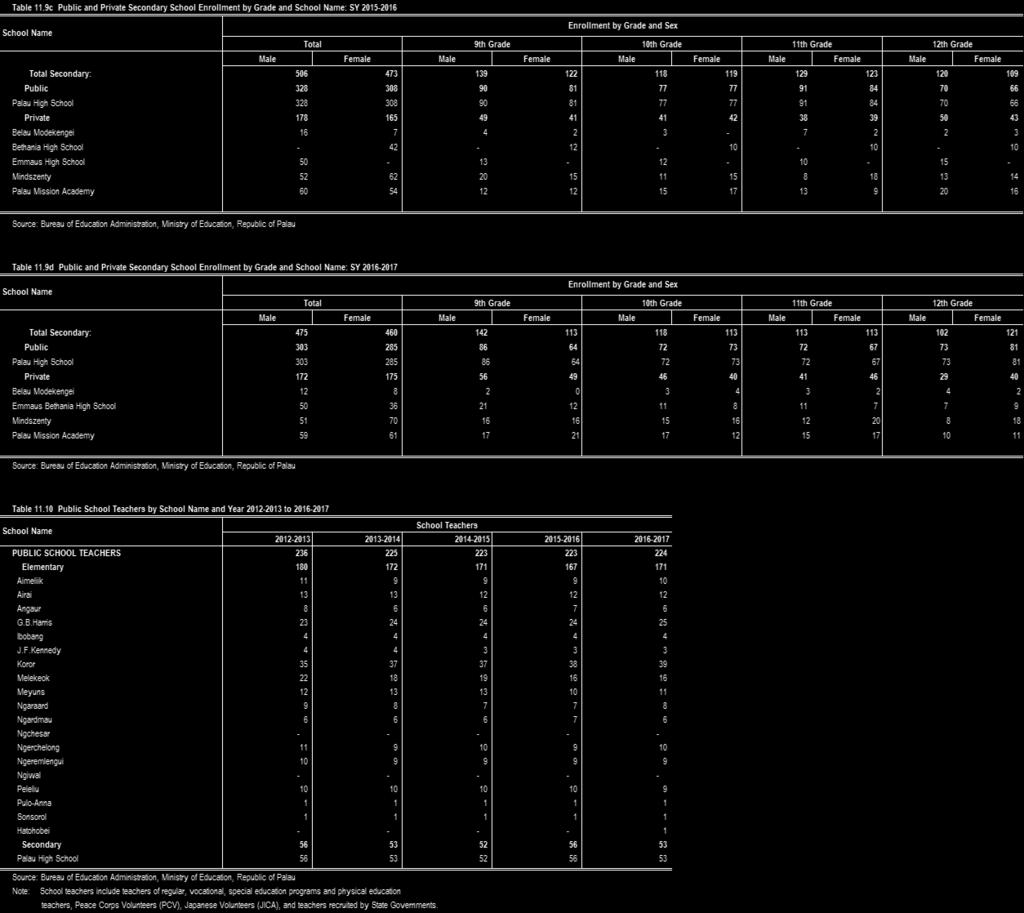
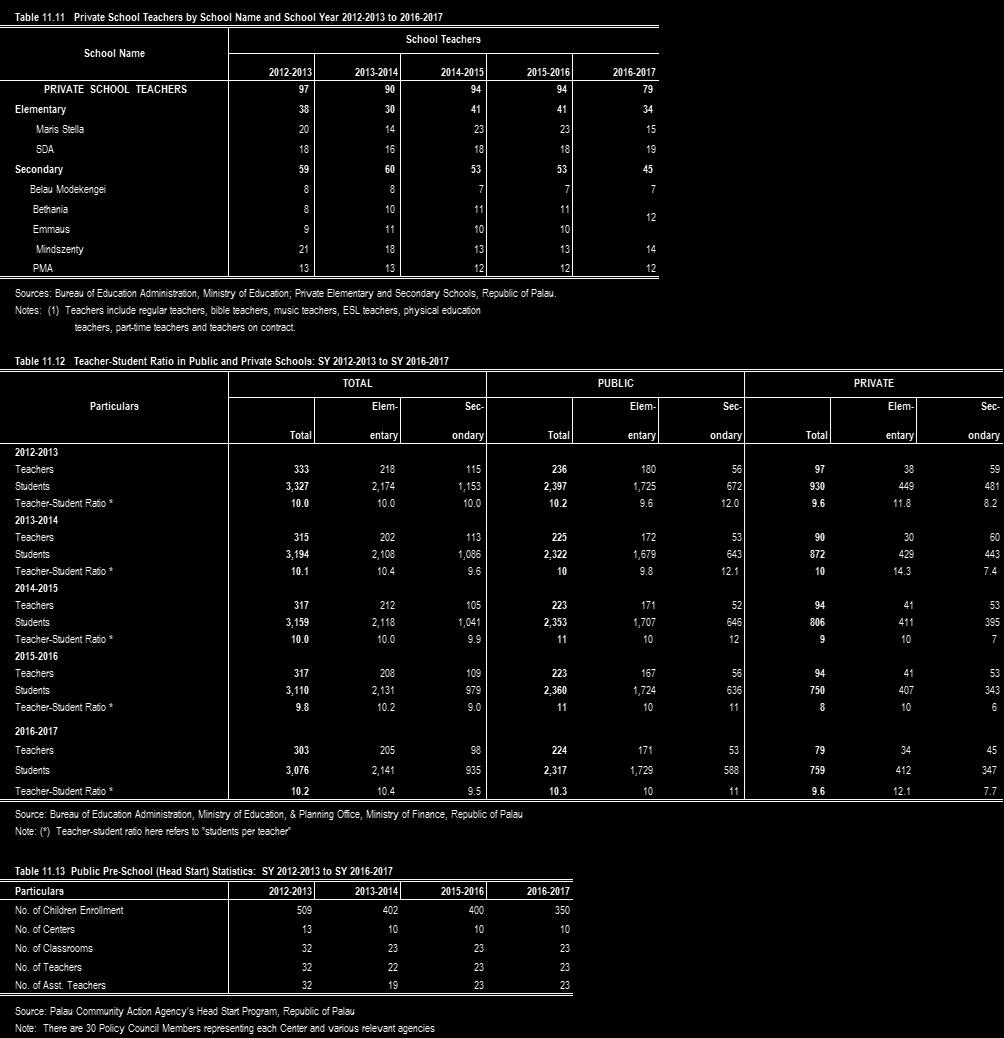
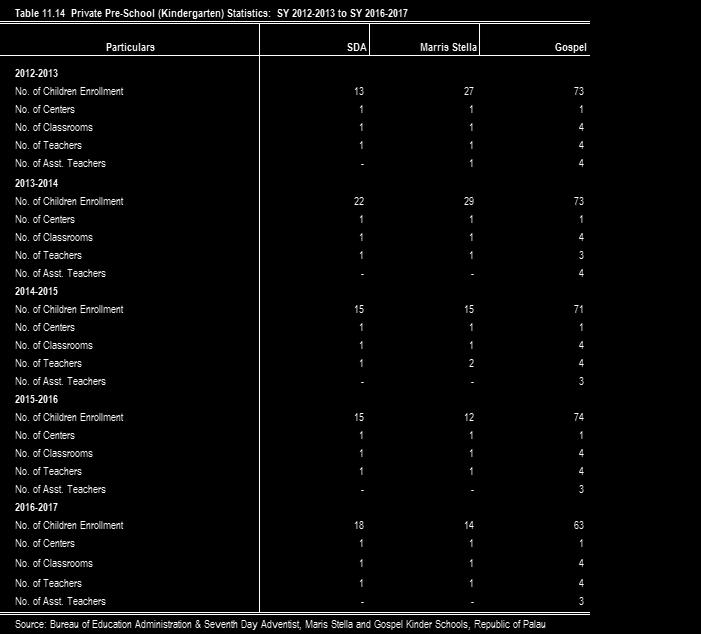
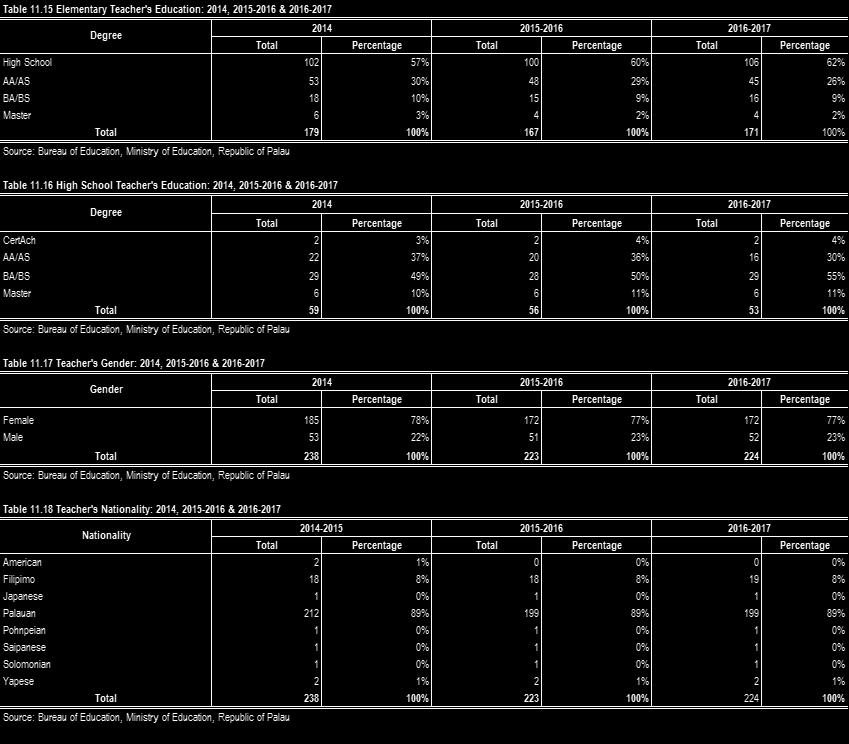
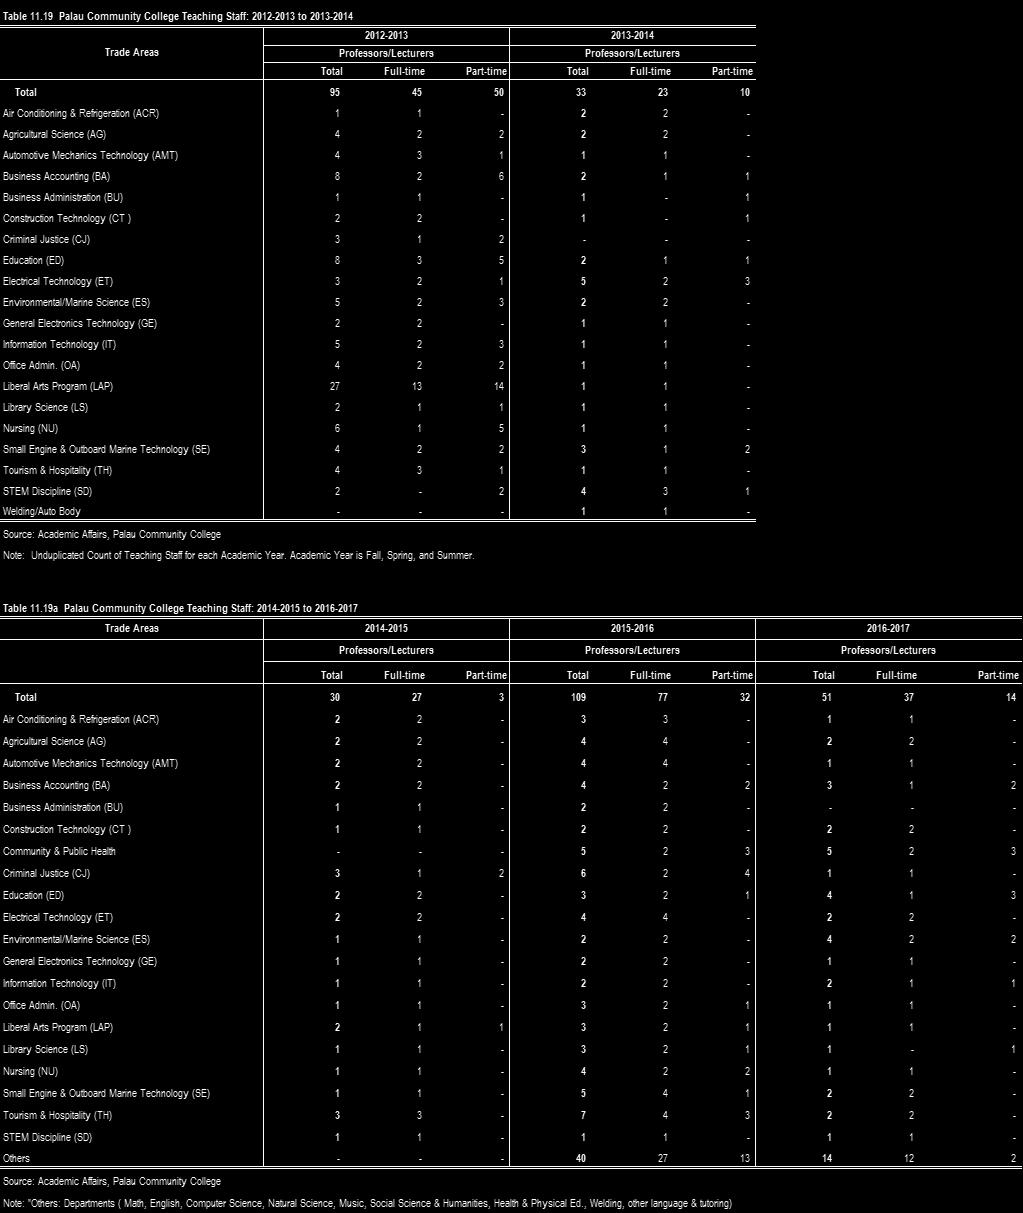
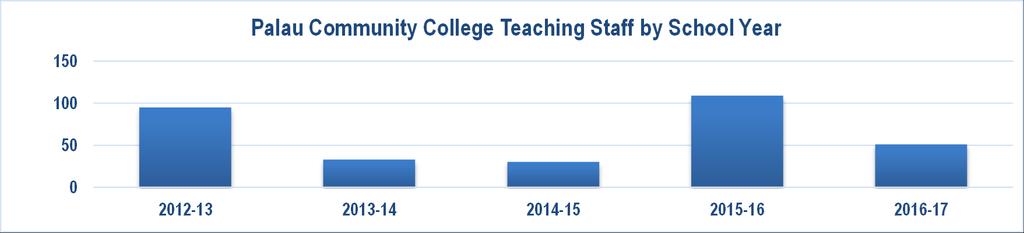
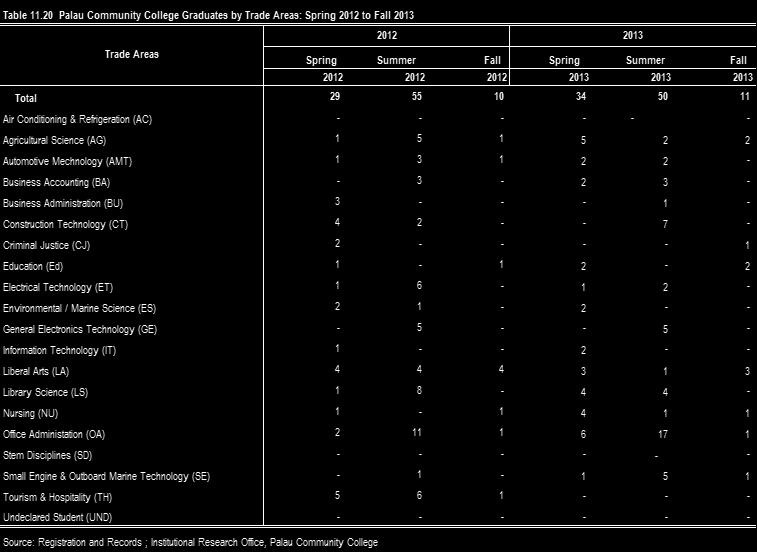
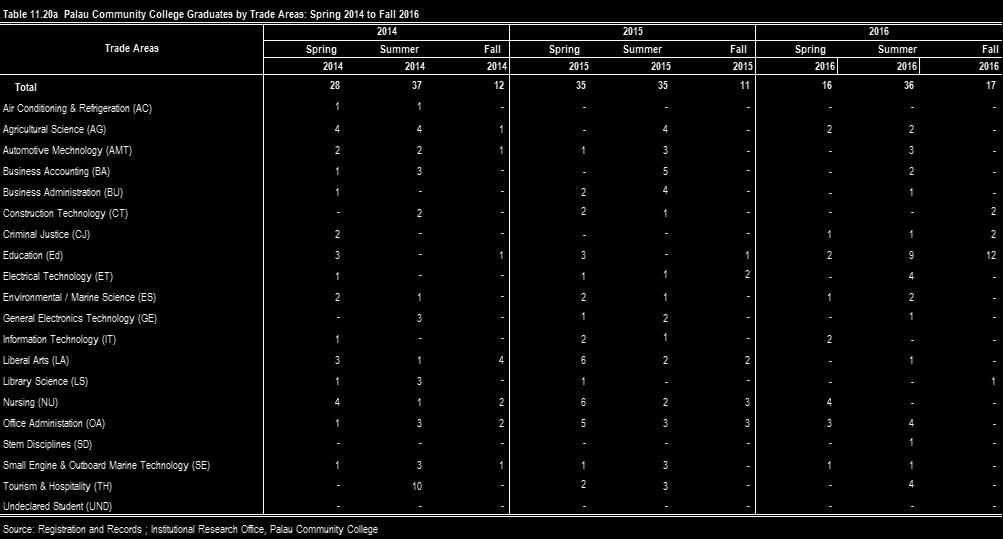
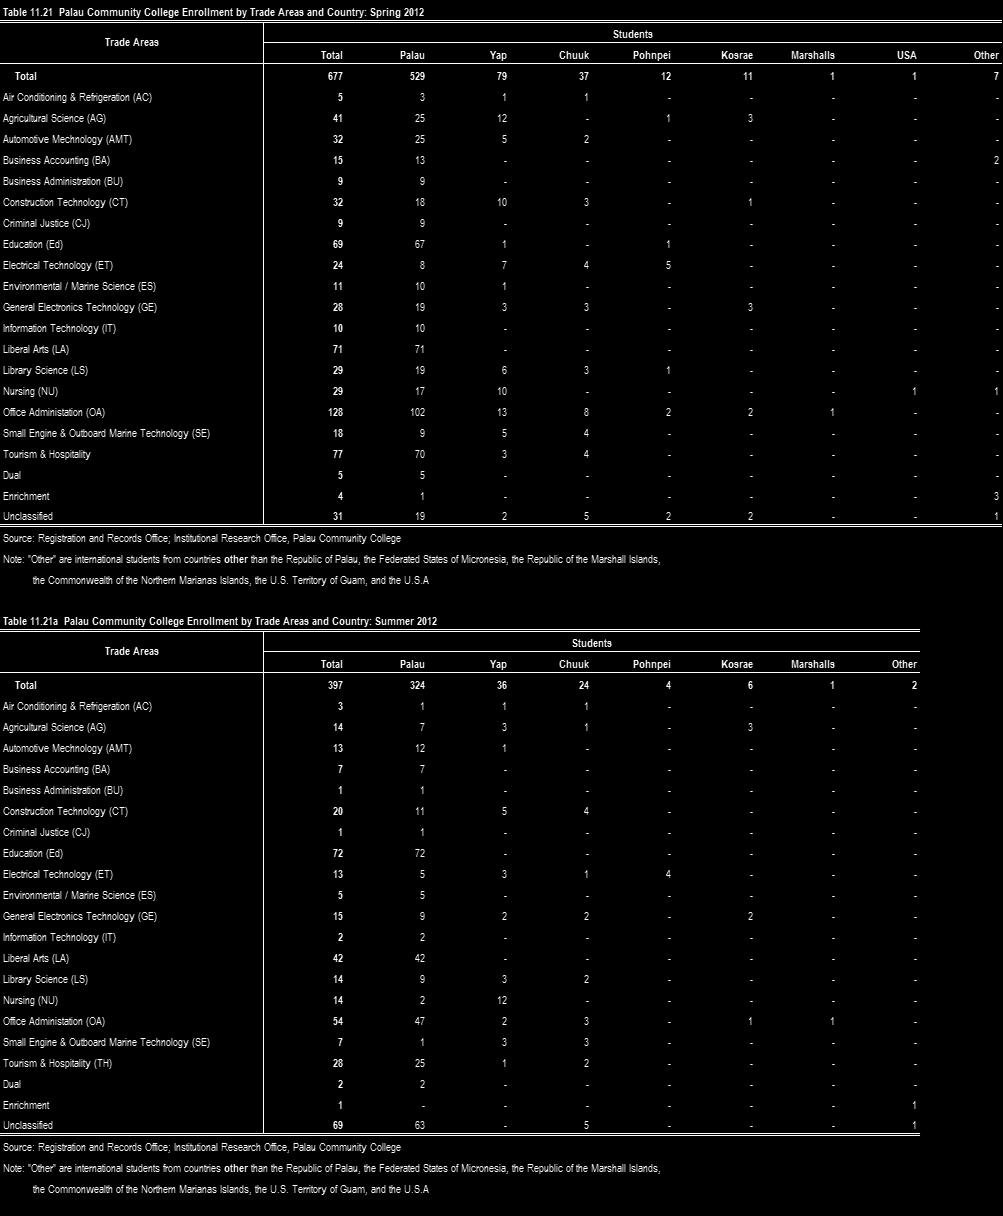
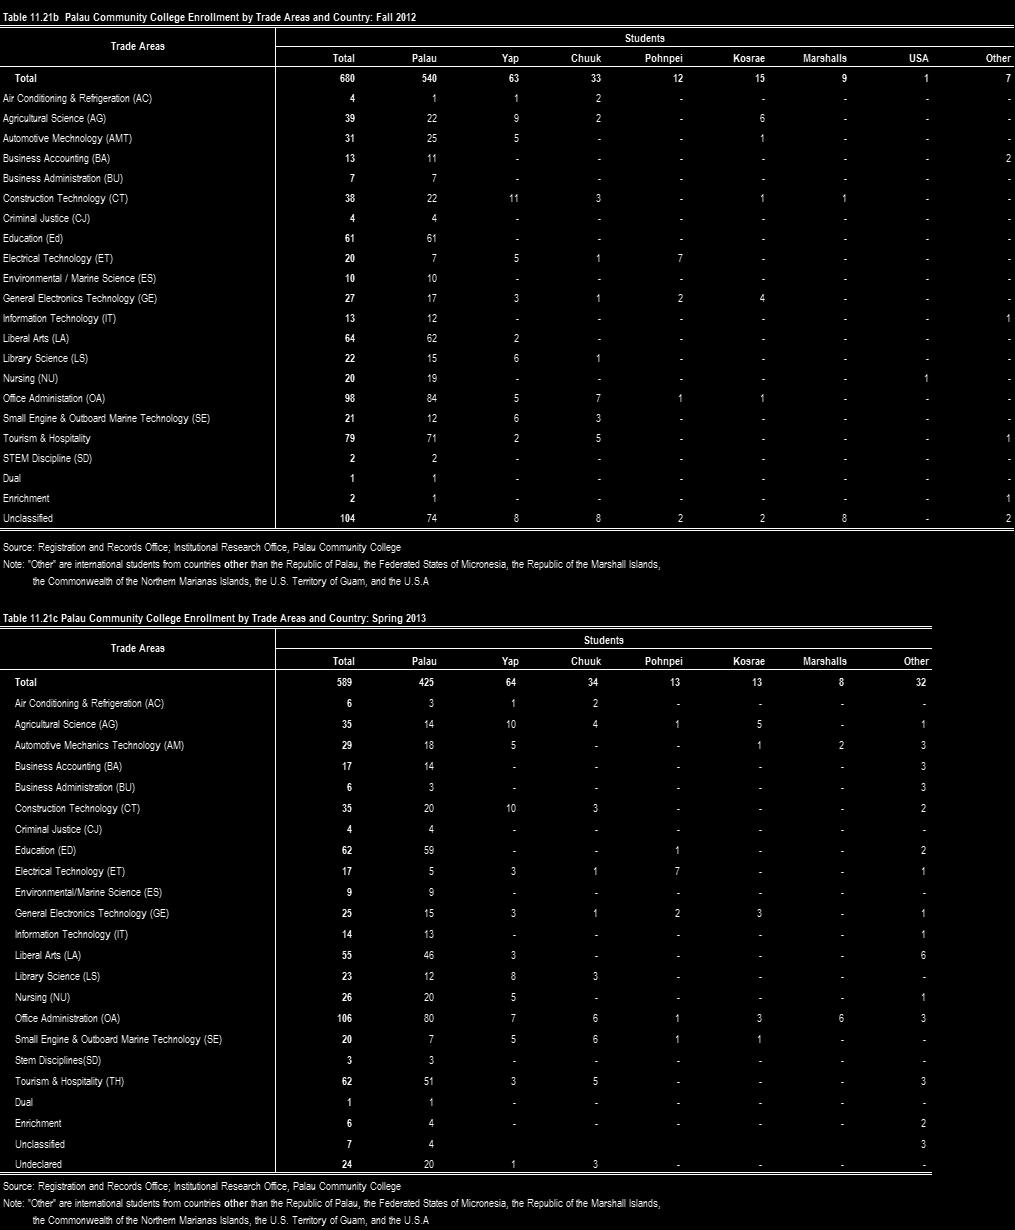
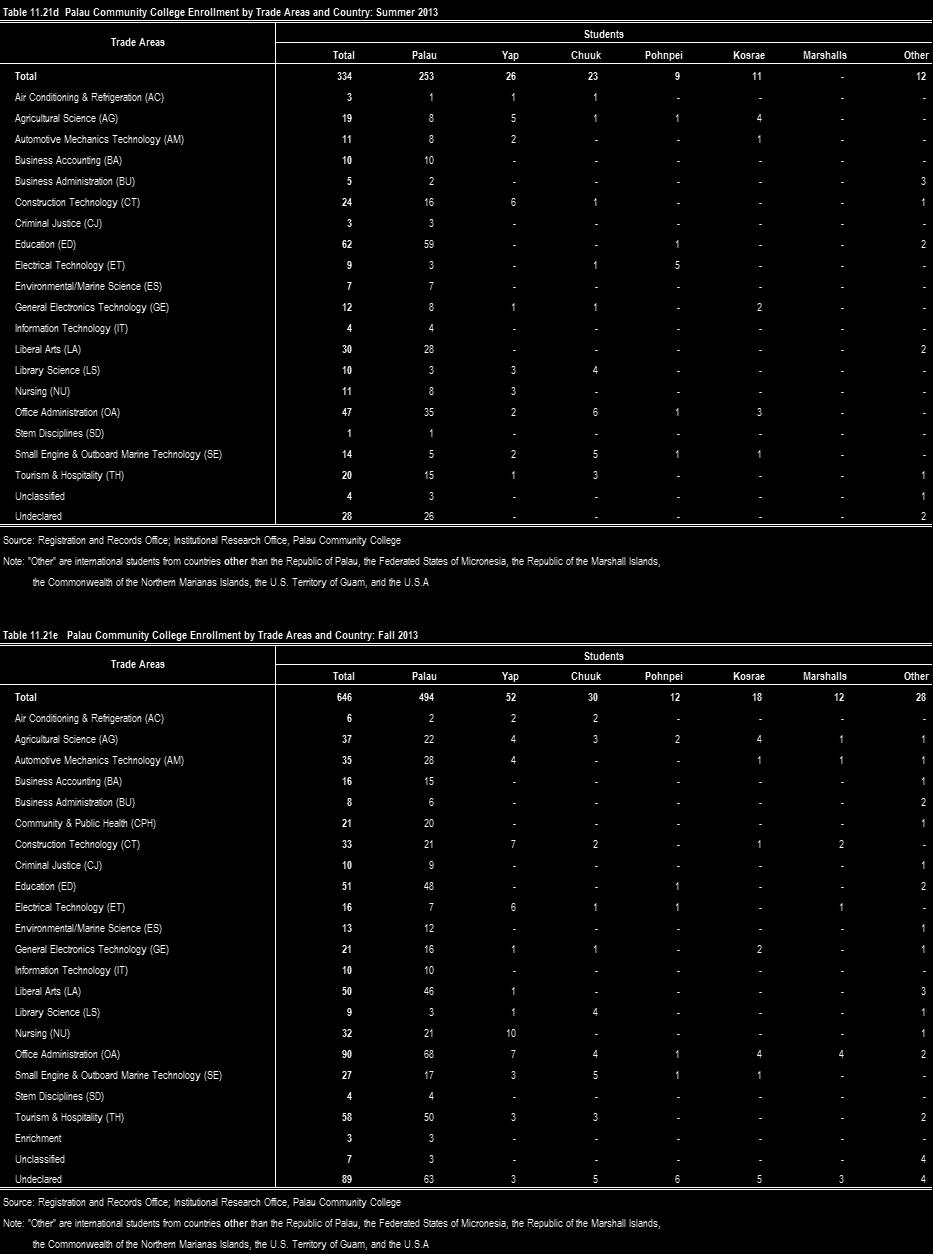
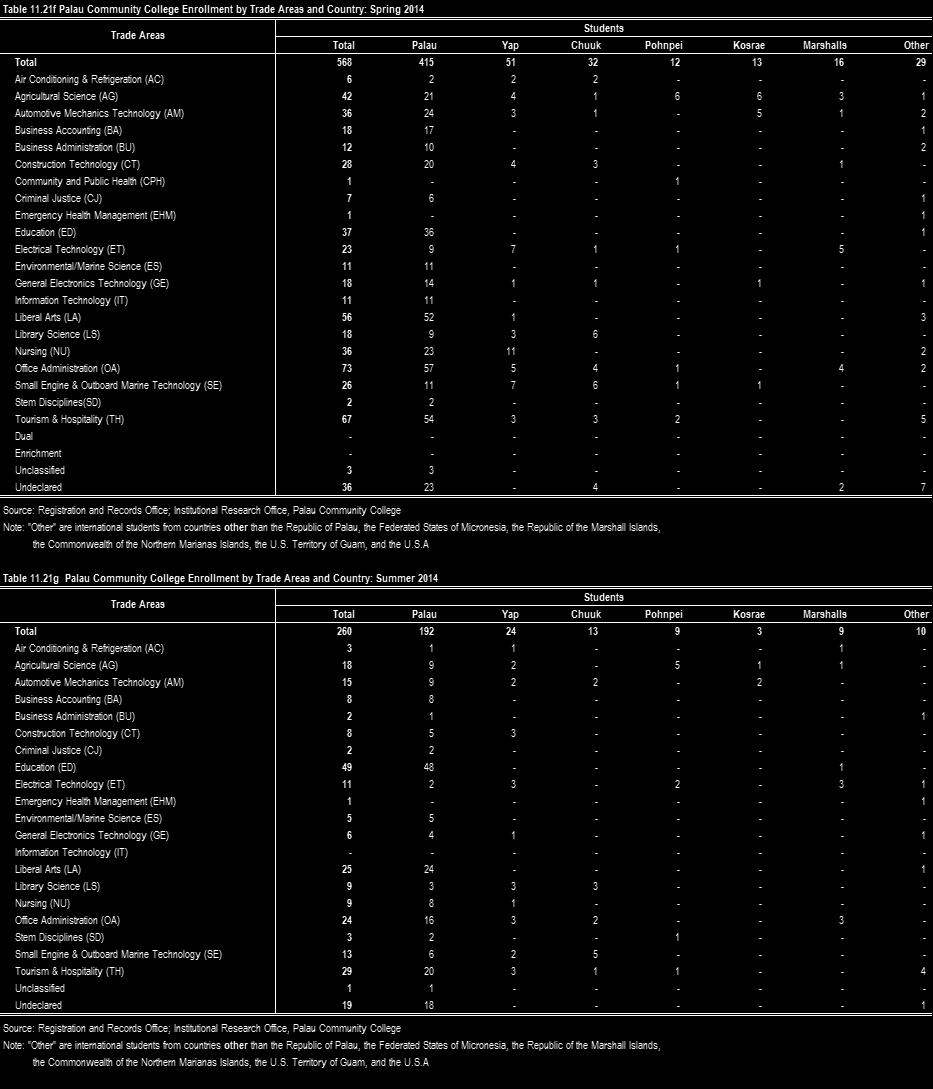
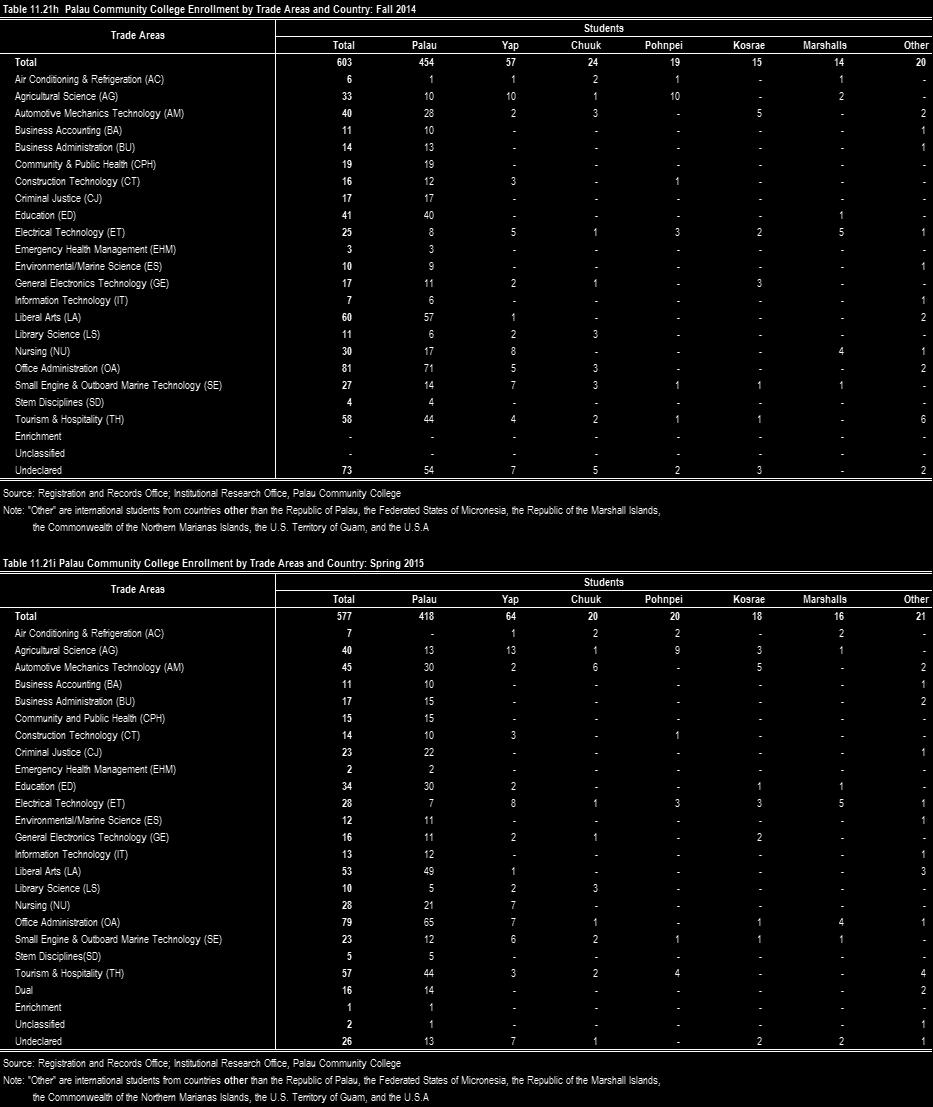
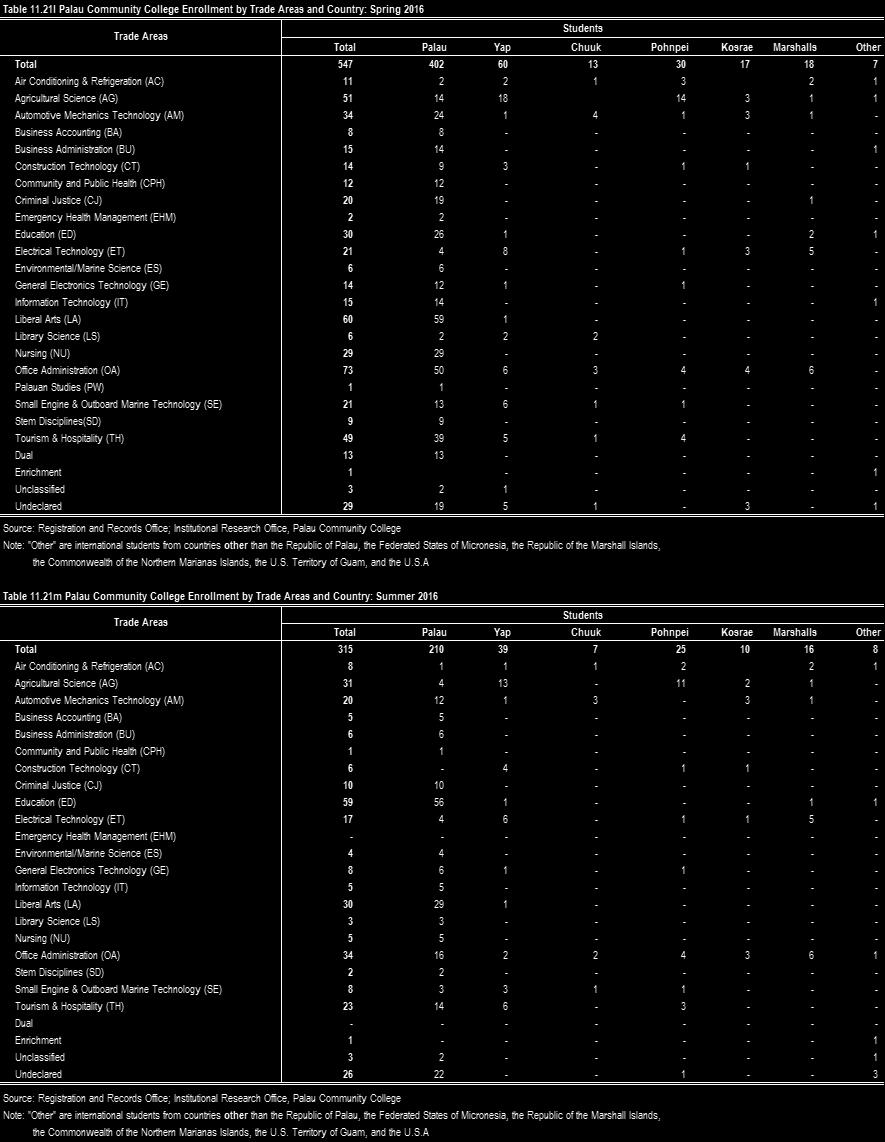
8 CHAPTER 11. EDUCATION Page Table 11.1 Table 11.2 Table 11.3 Table 11.4 Table 11.4a Table 11.4b Table 11.5 Table 11.5a Table 11.6 Table 11.7 Table 11.8 Table 11.8a Table11.8b Table 11.8c Table 11.8d Table 11.9 Table 11.9a Table 11.9b Table 11.9c Table 11.9d Table Table Table Table Table Table Table Table Table Table Table 11.19a Table Table 11.20a Table Table 11.21a Table 11.21b Table 11.21c Table 11.21d Table 11.21e Table 11.21f Table 11.21g Table 11.21h Table 11.21i Table 11.21j Public & Private Elementary and Secondary School Enrollment by School Year: to Public & Private School Enrollment by Sex and School Year: to Public & Private Elementary and Secondary School Enrollment by Sex & School Year: to Public Elementary and Secondary School Enrollment by School Name, Sex & School Year to Public Elementary and Secondary School Enrollment by School Name, Sex & School Year to Public Elementary and Secondary School Enrollment by School Name, Sex & School Year to Private Elementary and Secondary School Enrollment by School Name, Sex & School Year to Private Elementary and Secondary School Enrollment by School Name, Sex & School Year to Public & Private Elementary School Enrollment by Grade & School Year to Public & Private Secondary School Enrollment by Grade & School Year & Public and Private Elementary School Enrollment by Grade and School Name: SY Public and Private Elementary School Enrollment by Grade and School Name: SY Public and Private Elementary School Enrollment by Grade and Sex and School Name: SY Public and Private Elementary School Enrollment by Grade and Sex and School Name: SY Public and Private Elementary School Enrollment by Grade and Sex and School Name: SY Public and Private Secondary School Enrollment by Grade and School Name: SY Public and Private Secondary School Enrollment by Grade and School Name: SY Public and Private Secondary School Enrollment by Grade and School Name: SY Public and Private Secondary School Enrollment by Grade and School Name: SY Public and Private Secondary School Enrollment by Grade and School Name: SY Public School Teachers by School Name and Year to Private School Teachers by School Name and School Year to Teacher-Student Ratio in Public and Private Schools: SY to Public Pre-School (Head Start) Statistics: SY to Private Pre-School (Kindergarten) Statistics: SY to SY Elementary Teacher's Education: 2014, & High School Teacher's Education: 2014, & Teacher's Gender: 2014, & Teacher's Nationality: 2014, & Palau Community College Teaching Staff: to Palau Community College Teaching Staff: to Palau Community College Graduates by Trade Areas: Spring 2012 to Fall 2013 Palau Community College Graduates by Trade Areas: Spring 2014 to Fall 2016 Palau Community College Enrollment by Trade Areas and Country: Spring 2012 Palau Community College Enrollment by Trade Areas and Country: Summer 2012 Palau Community College Enrollment by Trade Areas and Country: Fall 2012 Palau Community College Enrollment by Trade Areas and Country: Spring 2013 Palau Community College Enrollment by Trade Areas and Country: Summer 2013 Palau Community College Enrollment by Trade Areas and Country: Fall 2013 Palau Community College Enrollment by Trade Areas and Country: Spring 2014 Palau Community College Enrollment by Trade Areas and Country: Summer 2014 Palau Community College Enrollment by Trade Areas and Country: Fall 2014 Palau Community College Enrollment by Trade Areas and Country: Spring 2015 Palau Community College Enrollment by Trade Areas and Country: Summer 2015
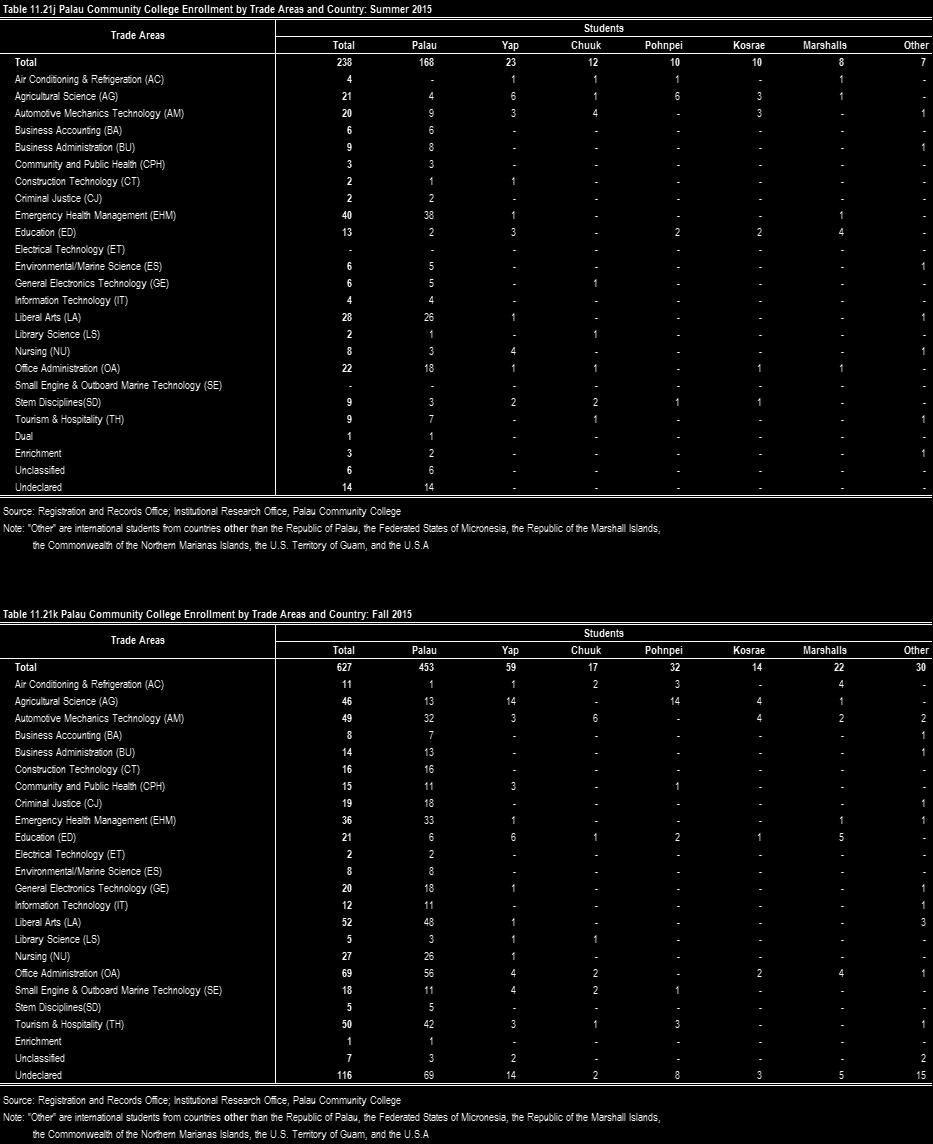
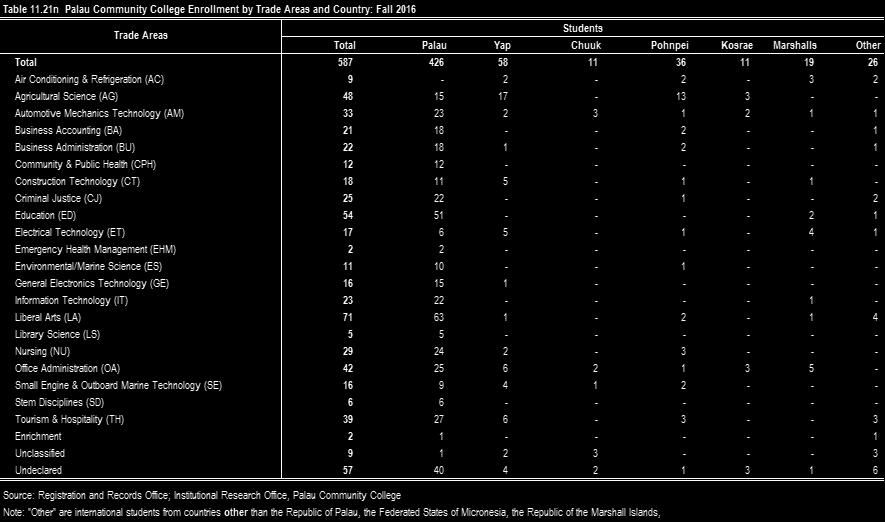
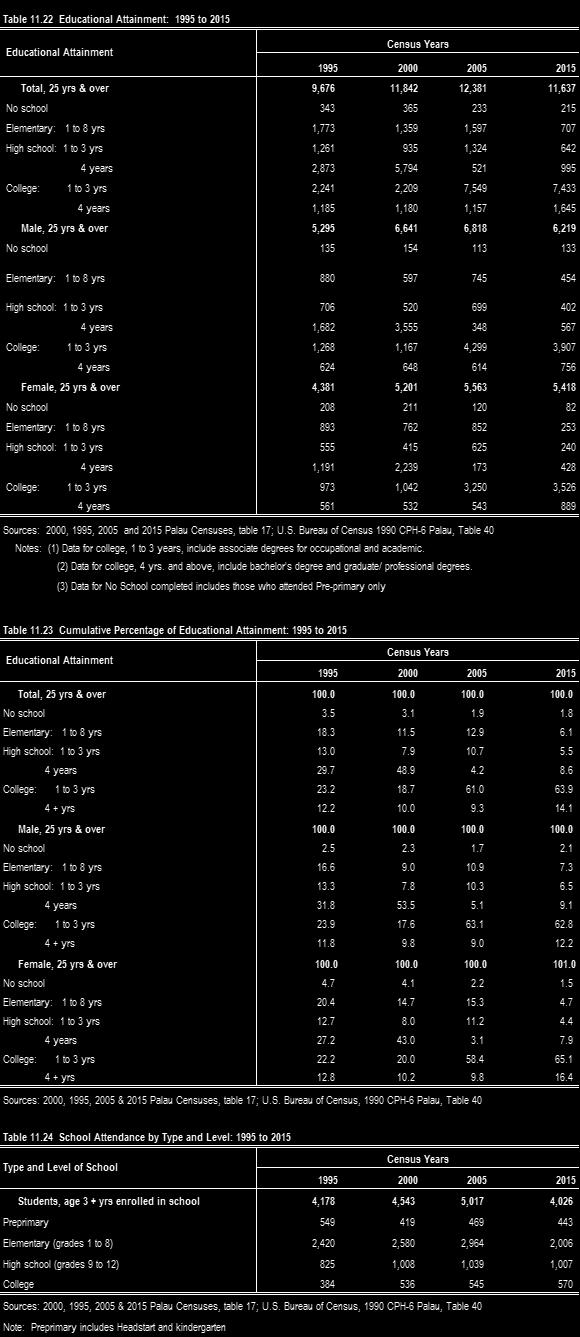
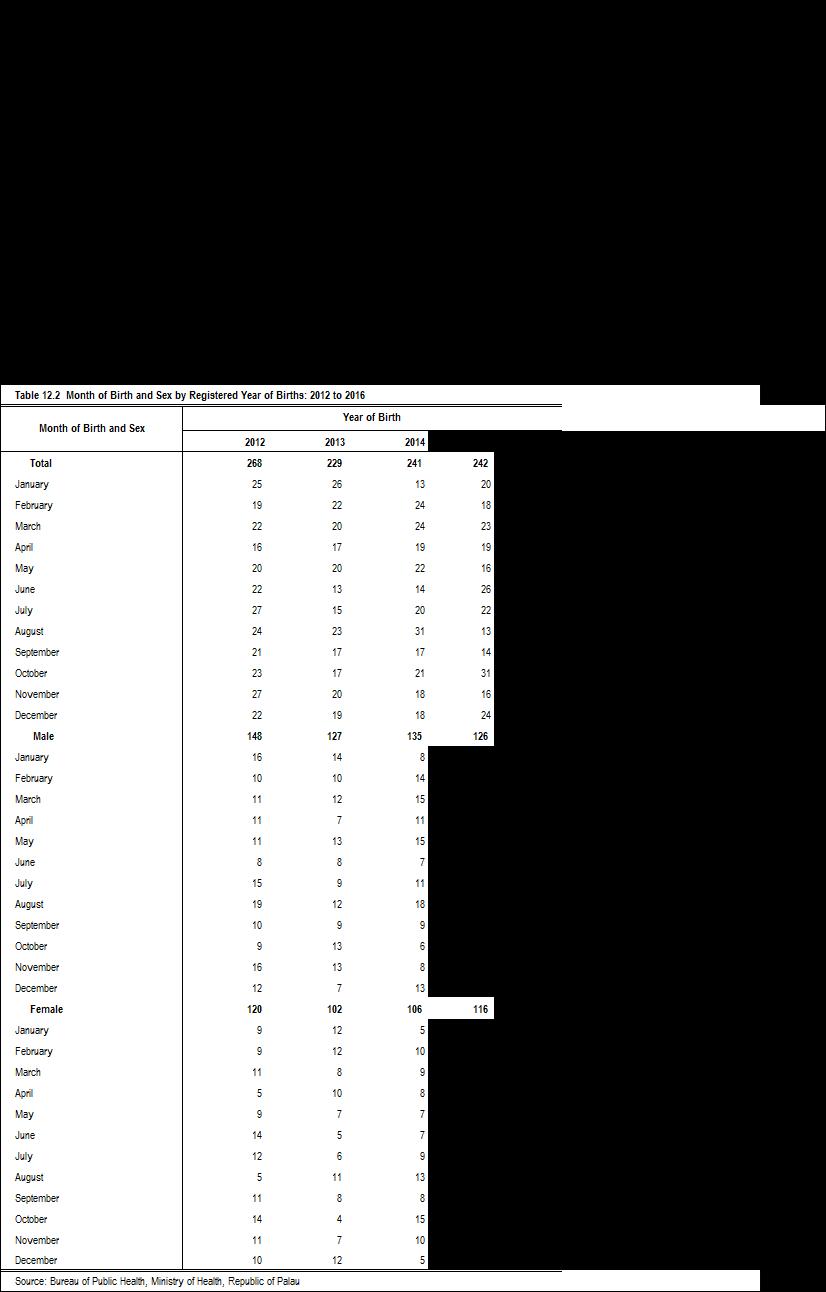
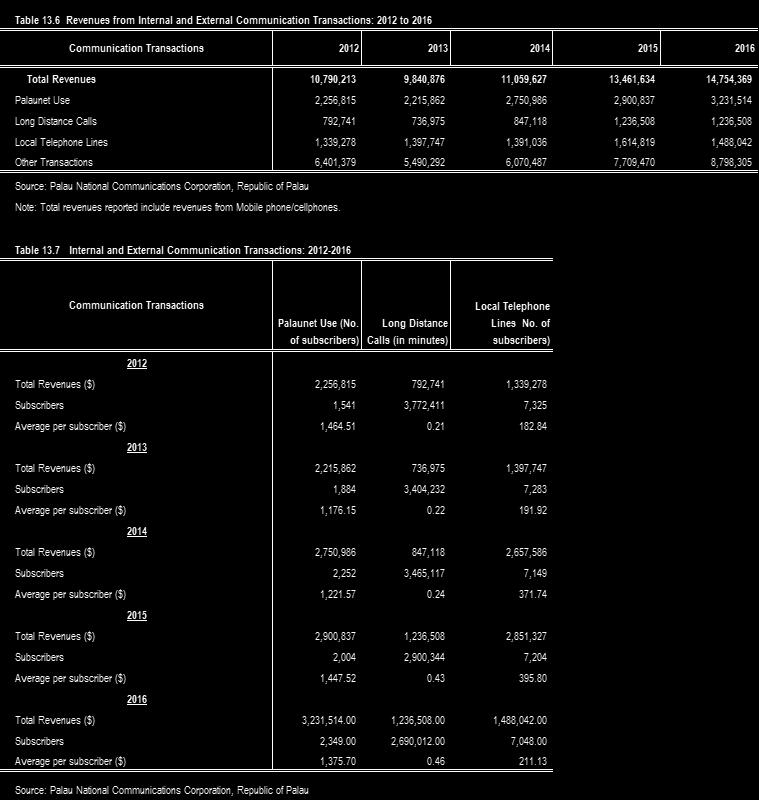
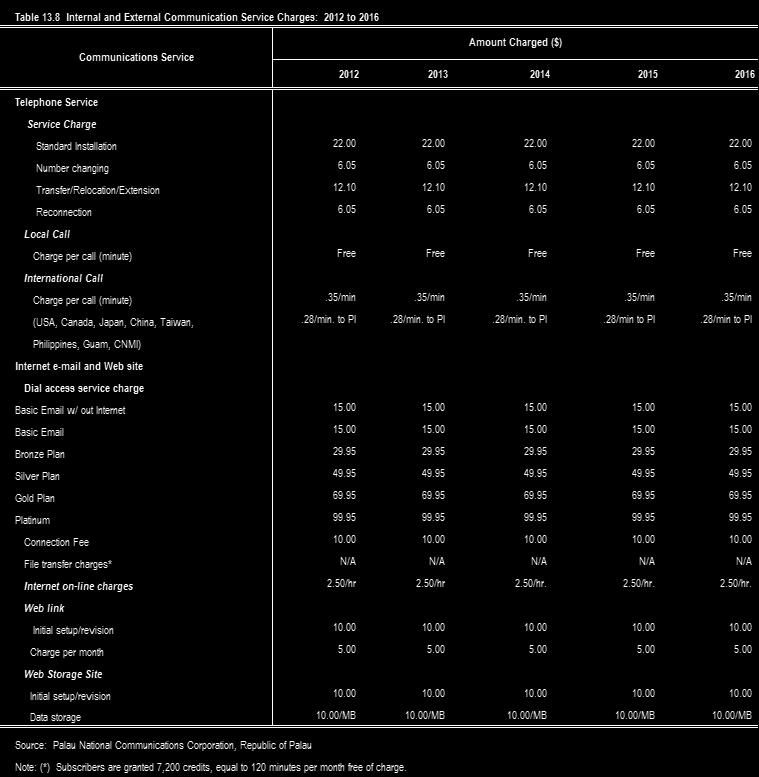
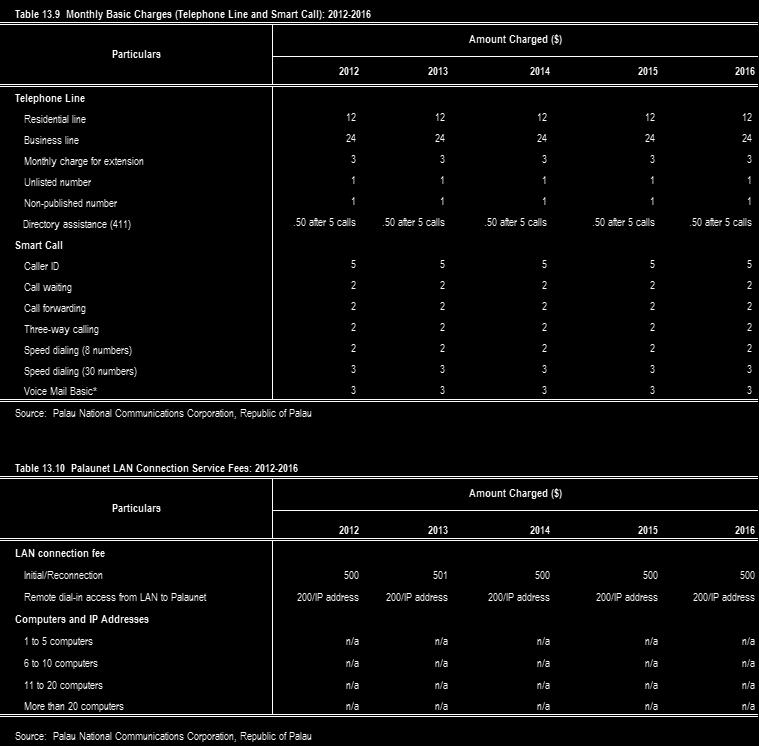
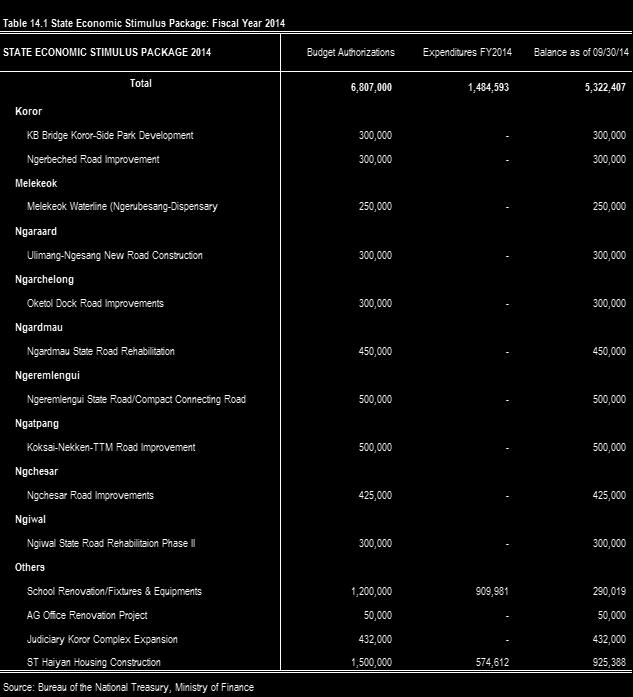
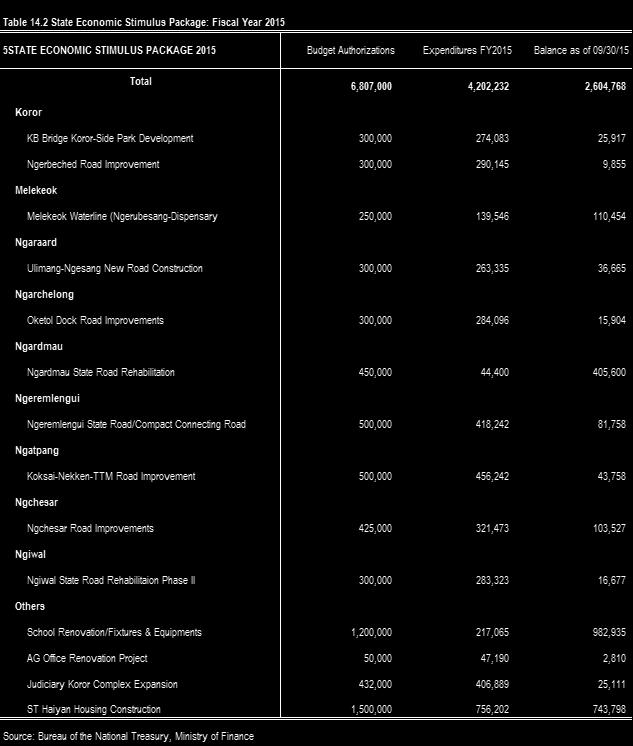
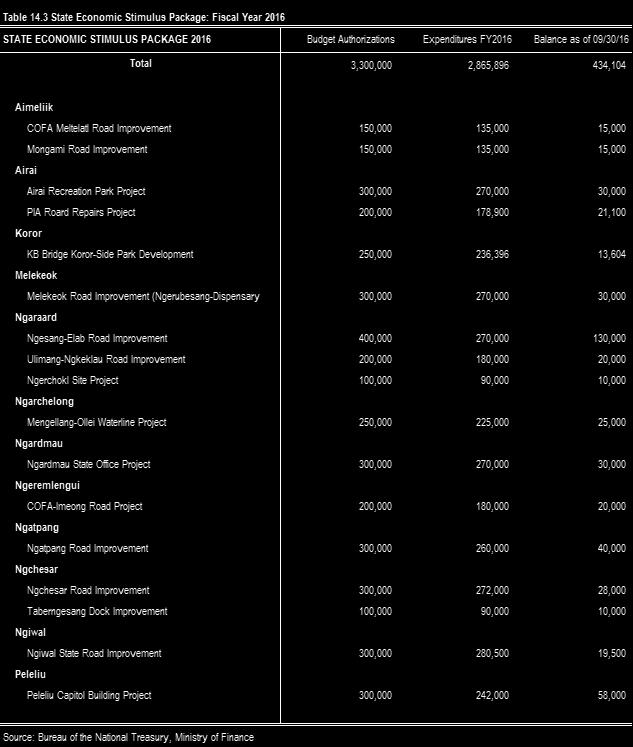
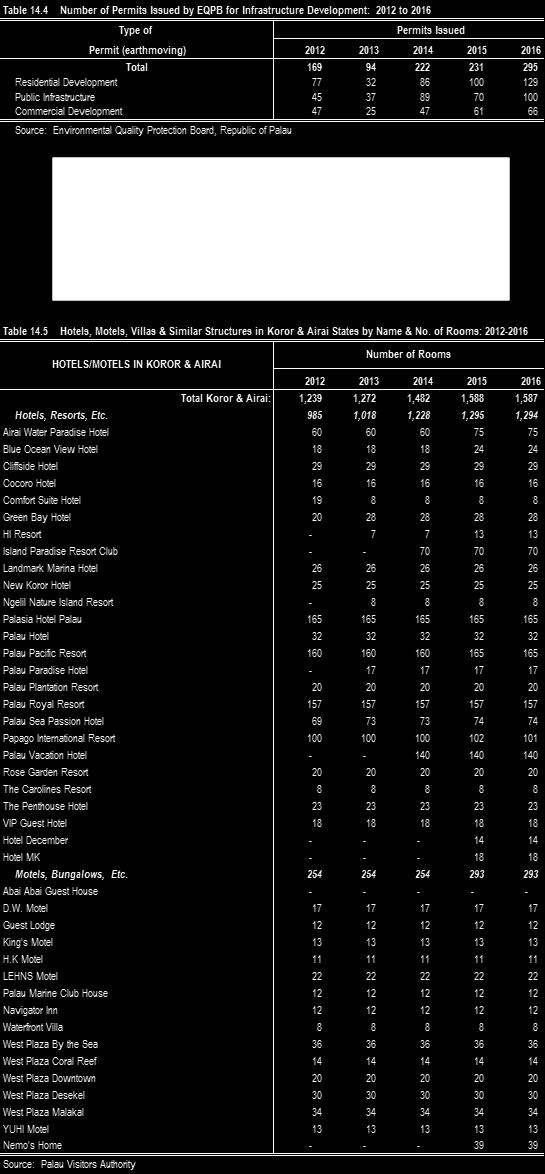
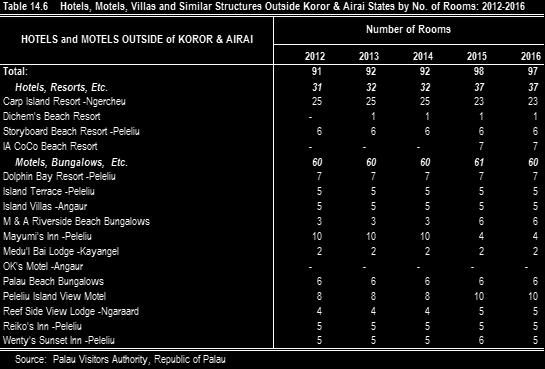
9 Table 11.21k Table 11.21l Table 11.21m Table 11.21n Table Table Table Palau Community College Enrollment by Trade Areas and Country: Fall 2015 Palau Community College Enrollment by Trade Areas and Country: Spring 2016 Palau Community College Enrollment by Trade Areas and Country: Summer 2016 Palau Community College Enrollment by Trade Areas and Country: Fall 2016 Educational Attainment: 1995 to 2015 Cumulative Percentage of Educational Attainment: 1995 to 2015 School Attendance by Type and Level: 1995 to 2015 CHAPTER 12. HEALTH Page Table 12.1 Table 12.2 Table 12.3 Table 12.4 Table 12.5 Table 12.6 Table 12.7 Table 12.8 Table 12.9 Table Table Table Table Vital Statistics: 2012 to 2016 Month of Birth and Sex by Registered Year of Births: 2012 to 2016 Registered Live Birthing Type by Year of Birth: 2012 to 2016 Registered Live Birthing Location by Year of Birth: 2012 to 2016 Registered Live Births by Attendant: 2012 to 2016 Registered Live Births by Sex and Age of Mother: 2012 to 2016 Mother s Place of Birth by Registered Live Births: 2012 to 2016 Previous Live Births by Registered Live Births: 2012 to 2016 Age Group and Sex By Registered Deaths: 2012 to 2016 Population -Physician Ratio: 2012 to 2016 Hospital Utilization Statistics: 2012 to 2016 Number of Nurses: Type of Doctors by Place of Practice: 2014 to 2016 CHAPTER 13. TRANSPORTATION Page Table 13.1 Table 13.2 Table 13.3 Table 13.3a Table 13.3b Table 13.3c Table 13.3d Table 13.3e Table 13.3f Table 13.3g Table 13.3h Table 13.4 Table 13.5 Ocean Cargo Carriers Statistics by Quarter: 2012 to 2016 (Tonnage) Ocean Cargo Carriers' Containers In-bound Statistics by Quarter: 2012 to 2016 Commercial Airline Activities Statistics by Month: 2012 Commercial Airline Activities Statistics by Month: 2013 Commercial Airline Activities Statistics by Month: 2014 Commercial Airline Activities Statistics by Month: 2015 Commercial Airline Activities Statistics by Month: 2016 Vehicle Registration by State and Year: 2012 to 2016 Revenues from Internal and External Communication Transactions: 2012 to 2016 Internal and External Communication Transactions: 2012 to 2016 Internal and External Communication Service Charges: 2012 to 2016 Monthly Basic Charges (Telephone Line and Smart Call): 2012 to 2016 Palaunet LAN Connection Service Fees: 2012 to 2016 CHAPTER 14. CONSTRUCTION Page Table 14.1 Table 14.2 Table 14.3 Table 14.4 Table 14.5 Table 14.6 State Economic Stimulus Package: Fiscal Year 2014 State Economic Stimulus Package: Fiscal Year 2015 State Economic Stimulus Package: Fiscal Year 2016 Number of Permits Issued by EQPB for Infrastructure Development: 2012 to 2016 Hotels, Motels, Villas & Similar Structures in Koror & Airai States by Name & No. of Rooms: Hotels, Motels, Villas and Similar Structures Outside Koror & Airai States by No. of Rooms:
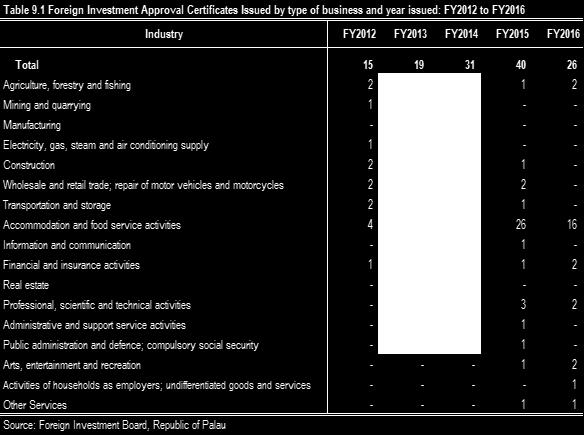
10 CHAPTER 15. FOREIGN INVESTMENT Page Table 15.1 Foreign Investment Approval Certificates Issued by type of business and year issued: 2012 to 2016
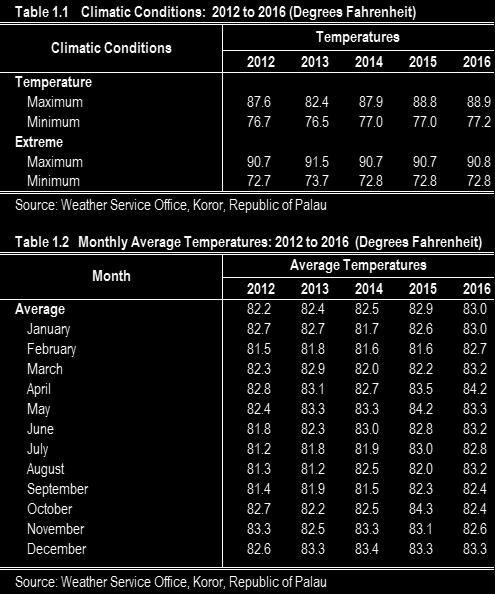
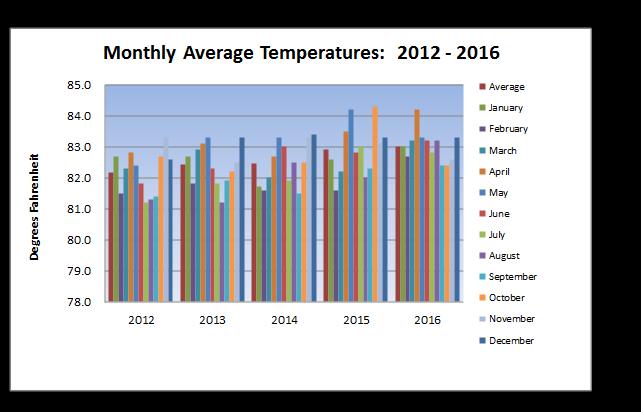
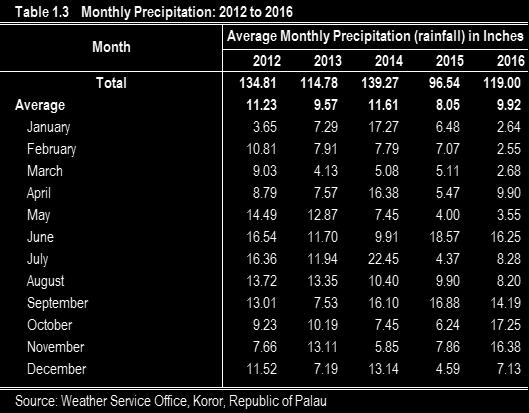
11 Chapter 1 CLIMATE STATISTICS
12
13
14 Chapter 2 POPULATION STATISTICS
15
16
17
18
19
20
21
22
23
24 Chapter 3 HOUSING STATISTICS
25
26
27
28
29
30
31
32
33
34
35
36
37
38
39
40
41
42
43 Chapter 4 LABOR FORCE STATISTICS
44
45
46
47
48
49
50
51
52
53
54
55
56
57
58
59
60
61
62
63 Chapter 5 CRIME STATISTICS
64
65
66
67
68 Chapter 6 GOVERNMENT FINANCE AND BANKING
69
70
71
72
73
74
75
76
77
78
79 Chapter 7 NATIONAL ACCOUNTS; BALANCE OF PAYMENTS; and CONSUMER PRICE INDEX
80

81
82
83
84
85
86
87
88
89
90
91
92
93
94
95
96
97
98
99
100
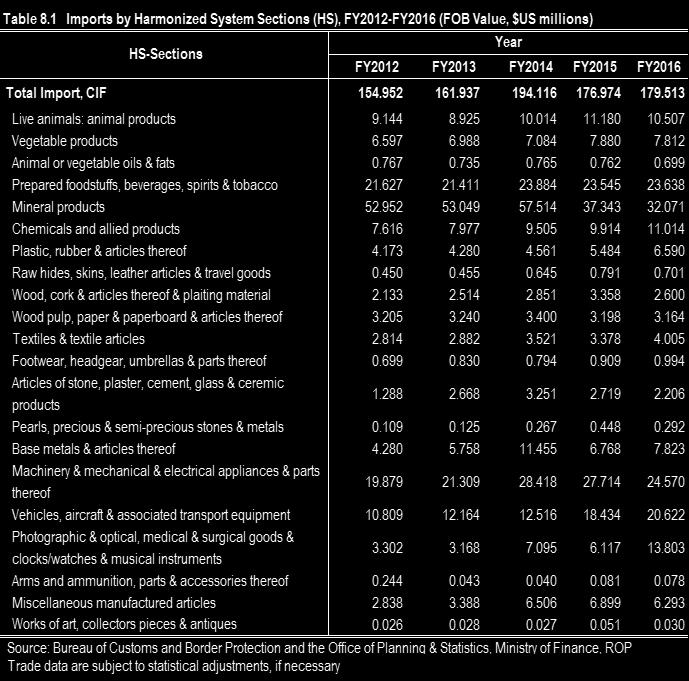
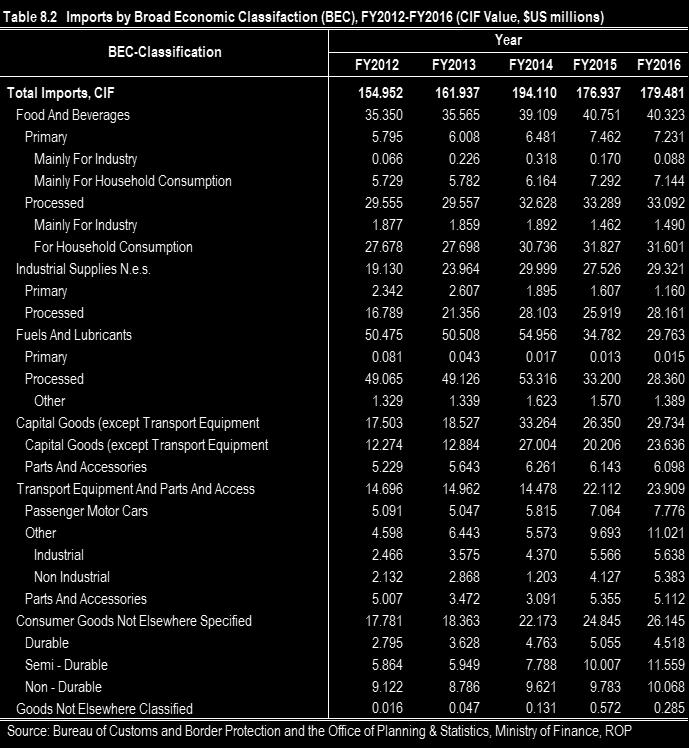
101 Chapter 8 TRADE STATISTICS
102
103
104 Chapter 9 FISHERIES STATISTICS
105
106
107
108 Chapter 10 TOURISM STATISTICS
109
110
111 Chapter 11 EDUCATION STATISTICS
112
113
114
115
116
117
118
119
120
121
122
123
124
125
126
127
128
129
130
131
132
133
134
135
136
137 Chapter 12 HEALTH STATISTICS
138
139
140
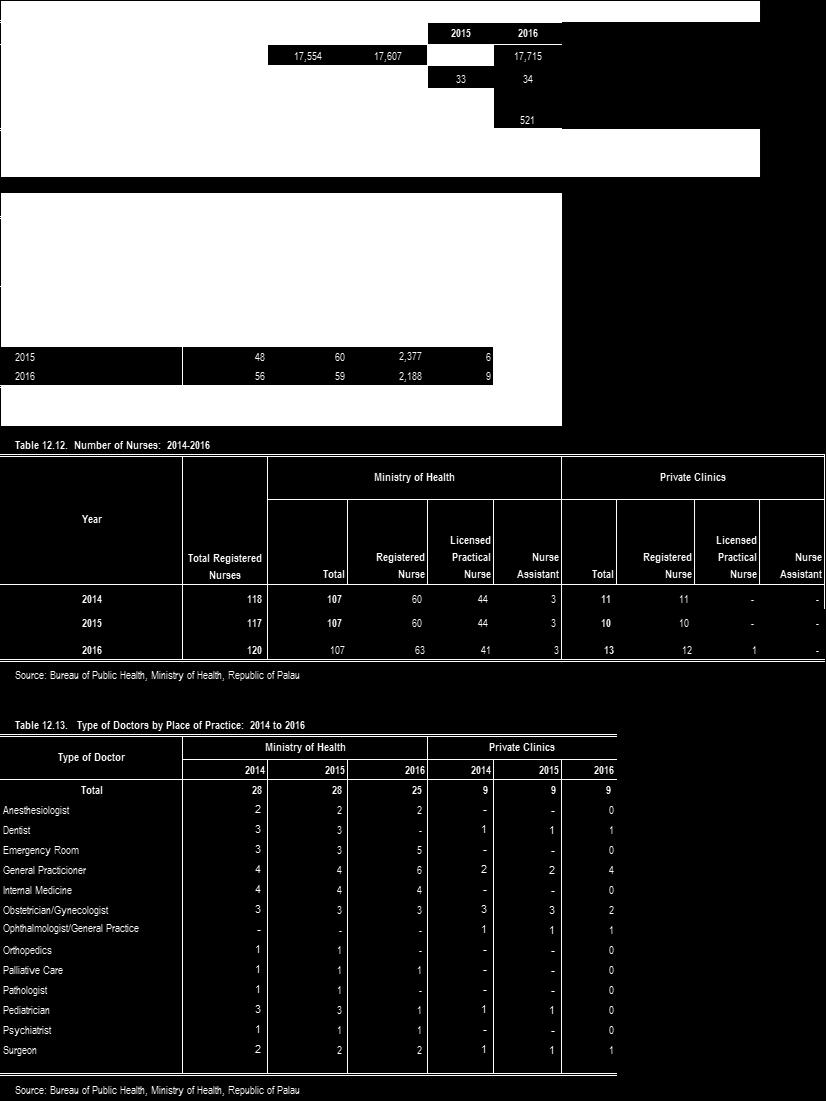
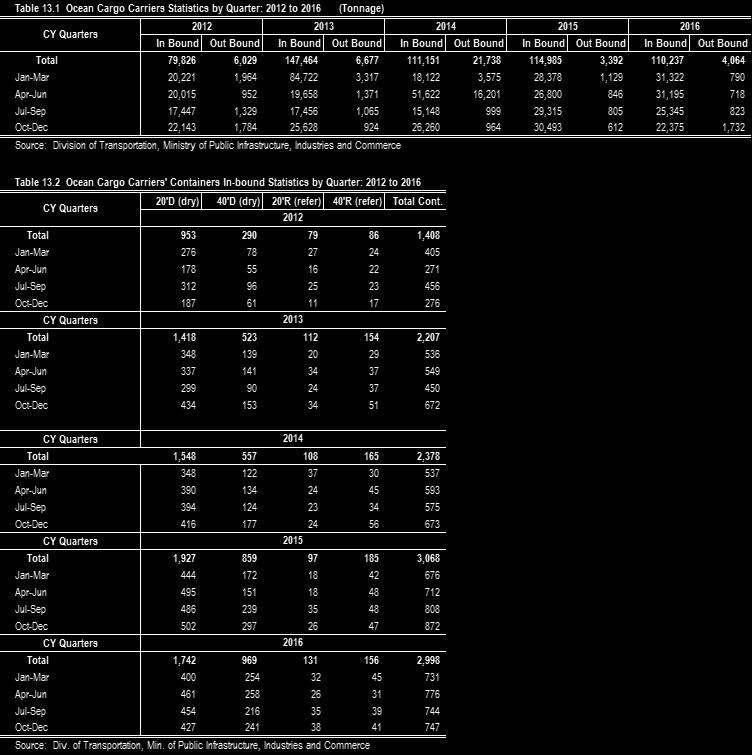
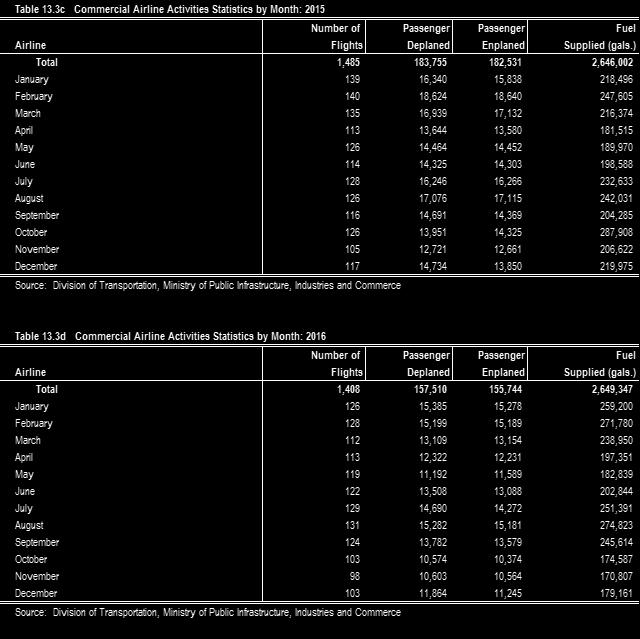
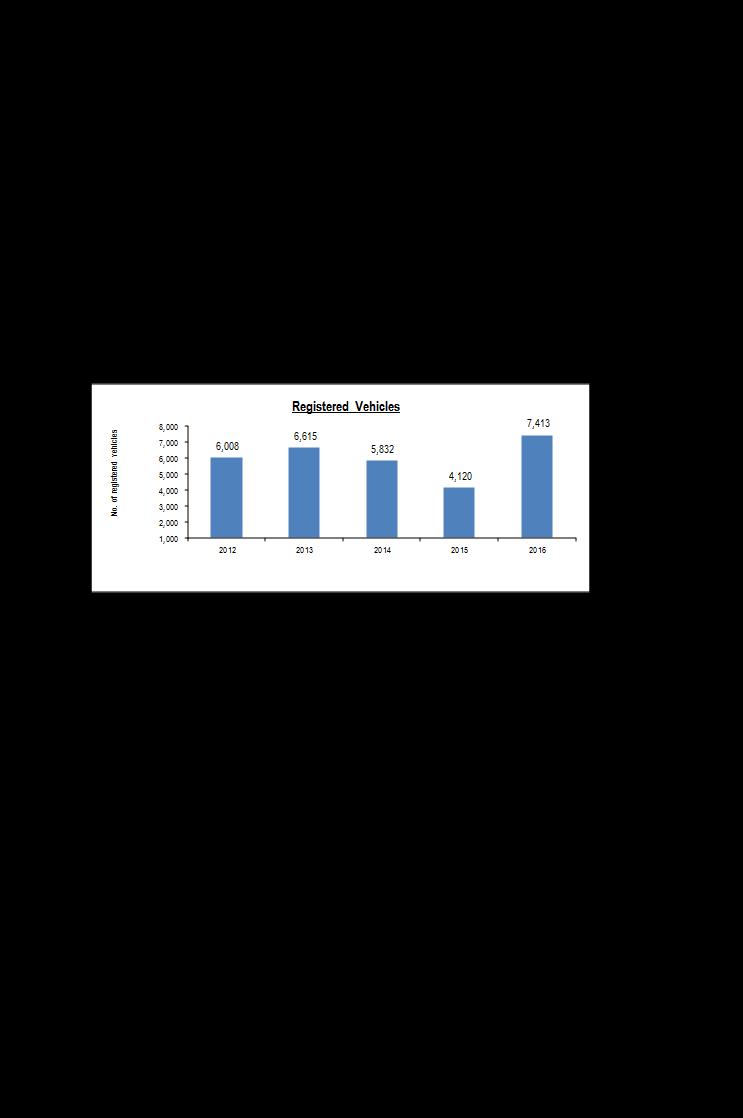
141
142 Chapter 13 TRANSPORTATION STATISTICS
143

144
145
146
147
148
149
150 Chapter 14 CONSTRUCTION STATISTICS
151
152
153
154
155
156 Chapter 15 FOREIGN INVESTMENT STATISTICS

157
Palestine in Figures 2011
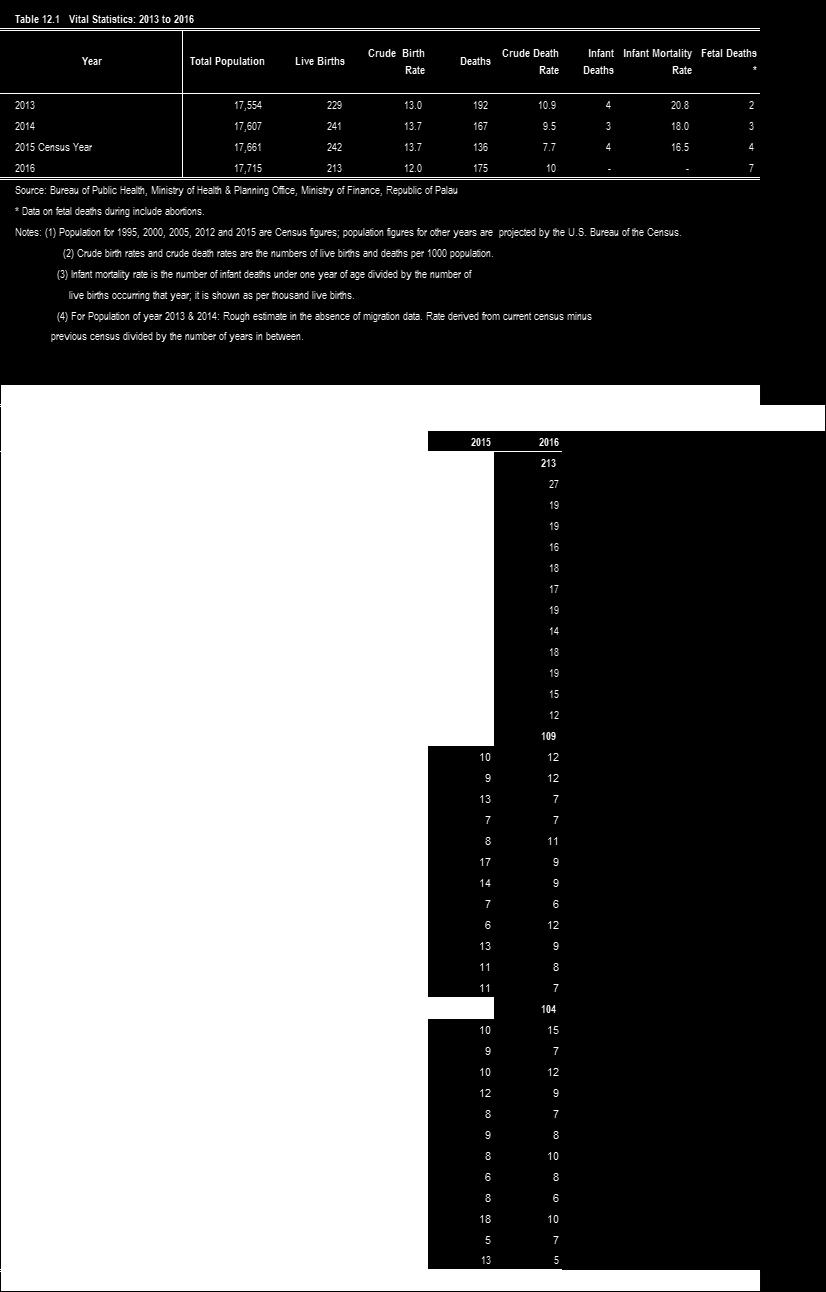
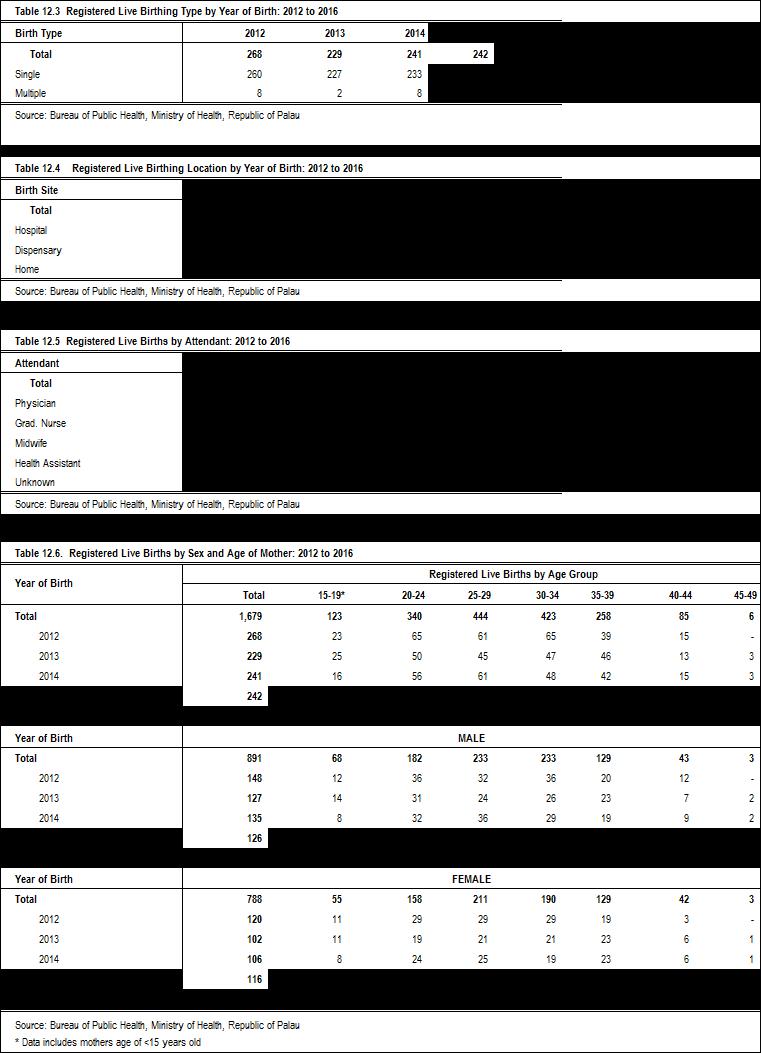
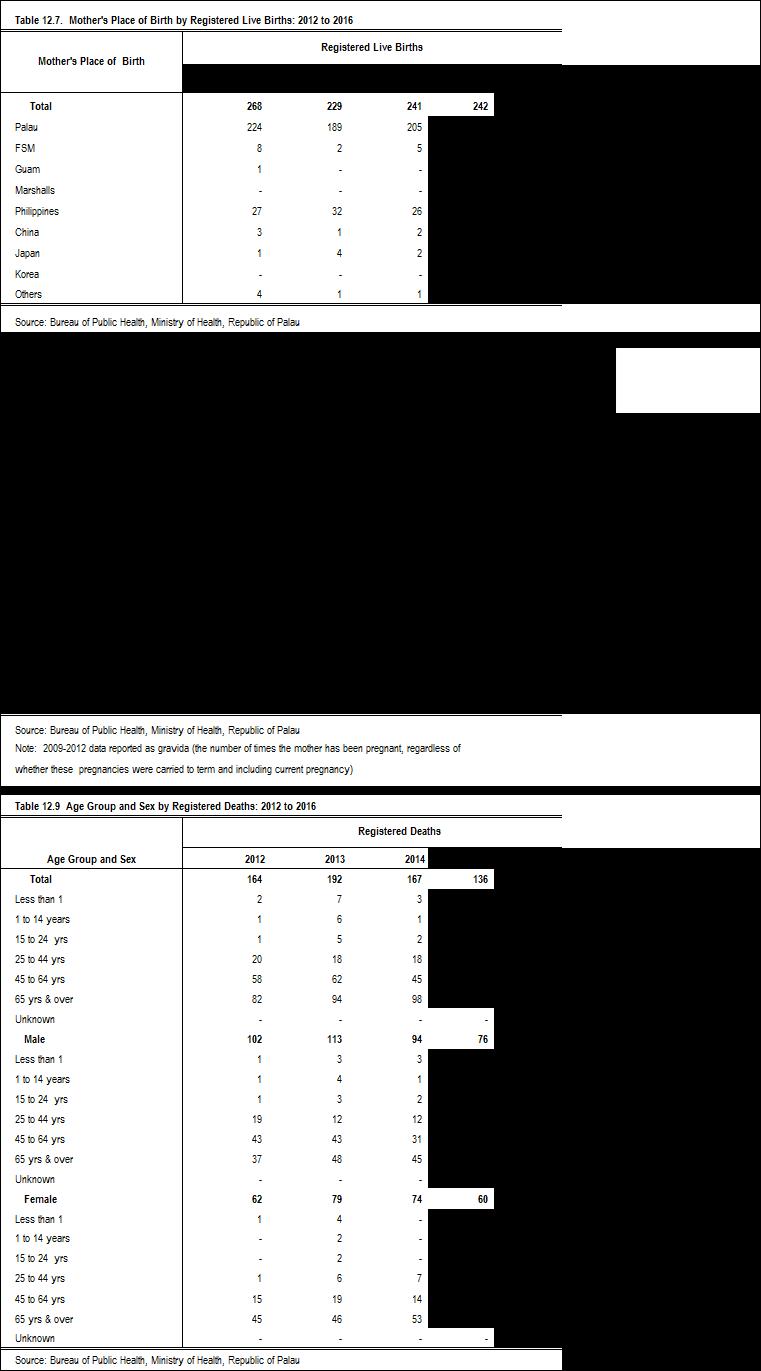
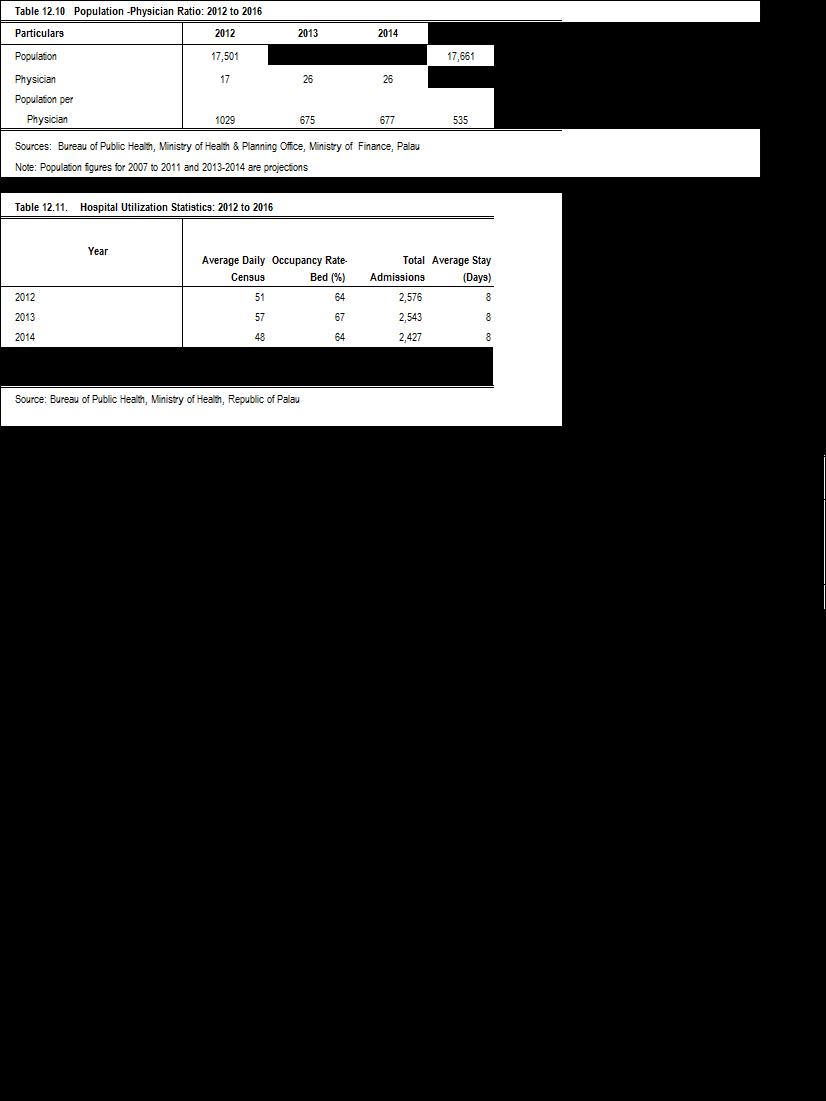
 Palestine in Figures 2011 March, 2012 This document is prepared in accordance with the standard procedures stated in the Code of Practice for Palestine Official Statistics 2006. March, 2012 All rights
Developing a Regional Core Set of Gender Statistics and Indicators in Asia and the Pacific
 Developing a Regional Core Set of Gender Statistics and Indicators in Asia and the Pacific Preparatory Survey Questionnaire REGIONAL CONSULTATIVE WORKSHOP TO DEVELOP A FRAMEWORK AND CORE SET OF GENDER
Contents. Acknowledgements...xii Leading facts and indicators...xiv Acronyms and abbreviations...xvi Map: Pacific region, Marshall Islands...
 Contents Acknowledgements...xii Leading facts and indicators...xiv Acronyms and abbreviations...xvi Map: Pacific region, Marshall Islands... xii CHAPTER 1: CENSUS ORGANIZATION AND OPERATIONS...1 CHAPTER
POPULATION AND HOUSING ITEMS ON THE GENERAL CENSUS SCHEDULES Compiled by Grace York, Librarian Emerita, University of Michigan, August 2010
 POPULATION AND HOUSING ITEMS ON THE GENERAL CENSUS SCHEDULES 1790-2010 Compiled by Grace York, Librarian Emerita, University of Michigan, August 2010 See methodology and acknowledgements at end of table.
SUMMARY ANALYSIS OF KEY INDICATORS
 SUMMARY ANALYSIS OF KEY INDICATORS from the FSM 2010 Census of Population and Housing DIVISION OF STATISTICS FSM Office of Statistics, Budget, Overseas Development Assistance and Compact Management (S.B.O.C)
Population, Health, and Human Well-Being-- Portugal
 Population, Health, and Human Well-Being-- Portugal EarthTrends Country Profiles Demographic and Health Indicators Portugal Europe World Total Population (in thousands of people) 1950 8,405 548,206 2,519,495
1. Economy. Economic Aggregates. Foreign Trade. Prices. Financial Statistics. Government Finance. Wages and Compensation. Foreign Investment
 1. Economy Economic Aggregates Foreign Trade Prices Financial Statistics Government Finance Wages and Compensation Foreign Investment GDP at Current Prices, Abu Dhabi Emirate, 2014* Non-oil GDP 952,676
Socio-Economic Profile
 LOCAL HEALTH AREA 7 - Socio-Economic Profile Powell River Comox Cumberland Denman Island Hornby Island Qualicum CENSUS POPULATION LAND AREA POPULATION DENSITY Number % of Region Sq. Km. % of Region Persons
Mongolia: Gender gaps in the agricultural and rural sector
 Subregional Workshop on Sex-Disaggregated Data in Agriculture and Rural Development in Southeast Asian Countries Bangkok, 13-16 November 2012 Mongolia: Gender gaps in the agricultural and rural sector
CANARY ISLANDS HEADLINE ECONOMIC INDICATORS
 29/07/2014 CANARY ISLANDS HEADLINE ECONOMIC INDICATORS 6 6 May 2016 Viceconsejería de Economía y Asuntos Económicos con la UE Department for Economy and European Economic Affairs CANARY ISLANDS HEADLINE
ANALYTICAL REPORT AT NATIONAL LEVEL
 TRANSITIONAL GOVERNMENT OF ETHIOPIA OFFICE OF THE POPULATION AND HOUSING CENSUS COMMISSION THE 1984 POPULATION AND HOUSING CENSUS OF ETHIOPIA ANALYTICAL REPORT AT NATIONAL LEVEL ADDIS ABABA DECEMBER 1991
Chapter 8 Migration. 8.1 Definition of Migration
 Chapter 8 Migration 8.1 Definition of Migration Migration is defined as the process of changing residence from one geographical location to another. In combination with fertility and mortality, migration
Labour Market Research Division Department of Employment Ministry of Labour July 24th, 2012
 Research Division Department of Employment Ministry of Labour July 24th, 2012 Research Division Administration Subsection Analyzing Section Managing And Developing Data Section Section East Region (Rayong
City of Greater Dandenong Our People
 City of Greater Dandenong Our People 2 City of Greater Dandenong Our People Contents Greater Dandenong people 4 Greater Dandenong people statistics 11 and analysis Population 11 Age 12 Unemployment Rate
Characteristics of People. The Latino population has more people under the age of 18 and fewer elderly people than the non-hispanic White population.
 The Population in the United States Population Characteristics March 1998 Issued December 1999 P20-525 Introduction This report describes the characteristics of people of or Latino origin in the United
Mexico as country of origin and host.
 Mexico as country of origin and host. Introduction Migration along with fertility and mortality are the main components of demographic change in a country, in Mexico, mainly related to the geographic proximity
LDC Graduation: A Case of Cambodia
 LDC Graduation: A Case of Cambodia NOU Keosothea Asia-Pacific Regional Workshop on Graduation Strategies from the LDC Siem Reap 4-6 Dec 2013 Outline of Presentation 1. Review of Recent Development Trends
Human Development Indices and Indicators: 2018 Statistical Update. Eritrea
 Human Development Indices and Indicators: 2018 Statistical Update Briefing note for countries on the 2018 Statistical Update Introduction Eritrea This briefing note is organized into ten sections. The
Human Development Indices and Indicators: 2018 Statistical Update. Pakistan
 Human Development Indices and Indicators: 2018 Statistical Update Briefing note for countries on the 2018 Statistical Update Introduction Pakistan This briefing note is organized into ten sections. The
THE BALANCE OF PAYMENTS
 THE BALANCE OF PAYMENTS REMITTANCE REPORT June 2016 Economic Information & Publications Department RESEARCH AND ECONOMIC PROGRAMMING DIVISION I S S N 0 7 9 9 3 2 8 5 THE BALANCE OF PAYMENTS REMITTANCE
Bringing skilled workers into Sri Lan Is it a viable option?
 Bringing skilled workers into Sri Lan Is it a viable option? Nisha Arunatilake October 2018 Institute of Policy Studies of Sri Lanka Sri Lanka is facing a labour shortage Construction sector - 20,224 Total
THE BALANCE OF PAYMENTS
 THE BALANCE OF PAYMENTS REMITTANCE REPORT April 2016 Economic Information & Publications Department RESEARCH AND ECONOMIC PROGRAMMING DIVISION I S S N 0 7 9 9 3 2 8 5 THE BALANCE OF PAYMENTS REMITTANCE
Human Development Indices and Indicators: 2018 Statistical Update. Cambodia
 Human Development Indices and Indicators: 2018 Statistical Update Briefing note for countries on the 2018 Statistical Update Introduction Cambodia This briefing note is organized into ten sections. The
Human Development Indices and Indicators: 2018 Statistical Update. Indonesia
 Human Development Indices and Indicators: 2018 Statistical Update Briefing note for countries on the 2018 Statistical Update Introduction Indonesia This briefing note is organized into ten sections. The
Tourism statistics in Croatia: Present status and future challenges
 Available online at www.sciencedirect.com Procedia - Social and Behavioral Sciences 44 ( 2012 ) 53 61 XI International Conference Service Sector in Terms of Changing Environment Tourism statistics in Croatia:
INTERNATIONAL GENDER PERSPECTIVE
 Chapter 7 INTERNATIONAL GENDER PERSPECTIVE OF DEVELOPMENT INDICATORS Women & Men In India 2016 115 116 International Gender Perspective International Gender Perspective of Development Indicators India
Section 1: Demographic profile
 Section 1: Demographic profile Geography North East Lincolnshire is a small unitary authority covering an area of 192km 2. The majority of the resident population live in the towns of Grimsby and Cleethorpes
The foreign born are more geographically concentrated than the native population.
 The Foreign-Born Population in the United States Population Characteristics March 1999 Issued August 2000 P20-519 This report describes the foreign-born population in the United States in 1999. It provides
Poverty Data Disaggregation: Experiences and Suggestions of China. Wang Pingping Department of Household Surveys of National Bureau of China (NBS)
") Poverty Data Disaggregation: Experiences and Suggestions of China Wang Pingping Department of Household Surveys of National Bureau of China (NBS) Disaggregated poverty data is important for most of the
Poverty Data Disaggregation: Experiences and Suggestions of China Wang Pingping Department of Household Surveys of National Bureau of China (NBS) Disaggregated poverty data is important for most of the
INTERNATIONAL COMPARISON
 Chapter 7 INTERNATIONAL COMPARISON OF GENDER INDICATORS Women & Men in India -2017 125 126 International Comparison of Gender Indicators International Comparison of Gender Indicators India is part of many
evsjv `k cwimsl vb ey iv BANGLADESH BUREAU OF STATISTICS Statistics Division, Ministry of Planning
 PRELIMINARY REPORT ON HOUSEHOLD INCOME & EXPENDITURE SURVEY-2010 June, 2011 evsjv `k cwimsl vb ey iv BANGLADESH BUREAU OF STATISTICS Statistics Division, Ministry of Planning Household Income and Expenditure
ARAGON IN SPAIN AND THE EU.
 166 167 Population; Labour market. Population Total population as of January 1st* Persons 2016 1,318,738 46,445,828 510,284,430 Population density Inhab/Km2 2016 27.6 91.8 114.6 Annual population change
Order of the Royal Thai Police Headquarters No. 606/2549
 Order of the Royal Thai Police Headquarters No. 606/2549 Re: Rules and Conditions in the Consideration of Alien Applications for Temporary Stay in the Kingdom of Thailand In considering the granting of
Labour Force Structure. Employment. Unemployment. Outside Labour Force Population and Economic Dependency Ratio
 210 Statistical Yearbook of Abu Dhabi 2016 Labour Force. 5 Labour Force Structure Employment Unemployment Outside Labour Force Population and Economic Dependency Ratio Statistical Yearbook of Abu Dhabi
Measurement, concepts and definitions of international migration: The case of South Africa *
 UNITED NATIONS SECRETARIAT ESA/STAT/AC.119/12 Department of Economic and Social Affairs November 2006 Statistics Division English only United Nations Expert Group Meeting on Measuring international migration:
Economic Research Institute of Erie Black School of Business
 Economic Research Institute of Erie Black School of Business Dr. Kenneth Louie Director, ERIE 13 th ERIE Conference July 27, 2016 www.eriedata.org Thank you to our Sponsors! Gold Sponsors Silver Sponsors
The widening income dispersion in Hong Kong :
 Lingnan University Digital Commons @ Lingnan University Staff Publications Lingnan Staff Publication 3-14-2008 The widening income dispersion in Hong Kong : 1986-2006 Hon Kwong LUI Lingnan University,
54 14, ,833, ,795 42,092, , ,741,000 5, , ,232.00
 PRICES (Source: CPI) INDICATOR Consumer Price Index (2006 = 100) All Items Food and Non -Alcoholic Beverages Alcoholic Beverages and Tobacco Clothing and Footwear Housing, Water, Electricity, Gas and other
GENDER FACTS AND FIGURES URBAN NORTH WEST SOMALIA JUNE 2011
 GENDER FACTS AND FIGURES URBAN NORTH WEST SOMALIA JUNE 2011 Overview In November-December 2010, FSNAU and partners successfully piloted food security urban survey in five towns of the North West of Somalia
HOUSEHOLD SURVEY FOR THE AFRICAN MIGRANT PROJECT: KENYA. Manual for Interviewers and Supervisors. October 2009
 0 HOUSEHOLD SURVEY FOR THE AFRICAN MIGRANT PROJECT: KENYA Manual for Interviewers and Supervisors October 2009 1 1. BACKGROUND AND OBJECTIVES This is a field work guide for the household survey. The goal
Facts & Figures in this issue: income employment growth trends baby boomers millennials immigration
 Facts & Figures in this issue: income employment growth trends baby boomers millennials immigration 2017 Baby Boomers The term baby boomer refers to individuals born in the United States between 1946 and
Fact Sheet WOMEN S PARTICIPATION IN THE PALESTINIAN LABOUR FORCE: males
 Fact Sheet WOMEN S PARTICIPATION IN THE PALESTINIAN LABOUR FORCE: -11 This fact sheet (1) presents an overview of women s employment status in terms of labour force participation, unemployment and terms
APPLICATION FOR CERTIFICATE OF ELIGIBILITY
 For applicant, part 1 Ministry of Justice, Government of Japan APPLICATION FOR CERTIFICATE OF ELIGIBILITY To the Director General of Regional Immigration Bureau Pursuant to the provisions of Article 7-2
The Human Face of the Financial Crisis
 The Human Face of the Financial Crisis Prof. Leonor Magtolis Briones UP National College of Public Administration and Governance and Co-Convenor, Social Watch Philippines Fourth Annual Forum of Emerging
Contents. Employment Rate & Labor Market Workforce Size Data 1 Page 3. Industry Growth by County Page 3-4. Occupational Predictions Region-wide Page 4
 2 Contents Rate & Labor Market Workforce Size Data 1 Page 3 Industry Growth by County Page 3-4 Occupational Predictions Region-wide Page 4 Skills of Seekers versus Available Jobs Page 5 Job Seeker Demographics
SPECIAL RELEASE. EMPLOYMENT SITUATION IN NATIONAL CAPITAL REGION January 2014 Final Results
 Number: 2014-10 Date Released: July 30, 2014 SPECIAL RELEASE EMPLOYMENT SITUATION IN NATIONAL CAPITAL REGION January 2014 Final Results The Labor Force Survey (LFS) is a nationwide survey conducted quarterly
+ + Carefully fill in and sign the application. Incomplete information will delay the processing of the application and may lead to its rejection.
 OLE_TUT 1 *1109901* RESIDENCE PERMIT APPLICATION FOR SCIENTIFIC RESEARCH This residence permit application form is for you if you are applying for a residence permit in order to conduct scientific research
APPLICATION FORM - COHORT THREE ACADEMIC YEAR /2017
 APPLICATION FORM - COHORT THREE ACADEMIC YEAR - 2016/2017 MAKERERE Attach two copies of recent passport photograph Makerere University, in partnership with The MasterCard Foundation is implementing a Scholars
Economic Loss from School Dropout due to the Syria Crisis
 COST-BENEFIT ANALYSIS Economic Loss from School Dropout due to the Syria Crisis A Cost-Benefit Analysis of the Impact of the Syria Crisis on the Education Sector unite for children Economic Loss from
SPECIAL RELEASE. EMPLOYMENT SITUATION IN NATIONAL CAPITAL REGION April 2013 Final Results
 Republic of the Philippines NATIONAL STATISTICS OFFICE National Capital Region Number: 2013-12 SPECIAL RELEASE EMPLOYMENT SITUATION IN NATIONAL CAPITAL REGION April 2013 Final Results The Labor Force Survey
SPECIAL RELEASE. EMPLOYMENT SITUATION IN NATIONAL CAPITAL REGION July 2013 Final Results
 Republic of the Philippines NATIONAL STATISTICS OFFICE National Capital Region Number: 2014-01 Date Released: February 5, 2014 SPECIAL RELEASE EMPLOYMENT SITUATION IN NATIONAL CAPITAL REGION July 2013
City Windsor 1981 Canada Census WARD 1
 City Windsor 1981 Canada Census March 2, 2012 Table of Contents... 3 POPULATION BY AGE... 4 LANGUAGE/RELIGION... 5 ETHNICITY/MOBILITY... 6 BIRTHPLACE / IMMIGRATION... 7 EDUCATION / LABOUR FORCE... 8 INDUSTRY
Palestinian Women s Reality in Labor Market:
 Int. Statistical Inst.: Proc. 58th World Statistical Congress, 2011, Dublin (Session STS039) p.2928 Palestinian Central Bureau of Statistics Palestinian Women s Reality in Labor Market: 2000-2010 Jawad
DECENT WORK IN TANZANIA
 International Labour Office DECENT WORK IN TANZANIA What do the Decent Work Indicators tell us? INTRODUCTION Work is central to people's lives, and yet many people work in conditions that are below internationally
2000 CENSUS OF POPULATION AND HOUSING REPUBLIC OF PALAU
 P2000-1 2000 CENSUS O POPULATION AND HOUSING A. ED: B. Block: C. Household No.: D. Enumerator: E. Village/Hamlet:. State: G. Address Location description REPUBLIC O PALAU H. Respondent's name: I. Phone
CHAPTER 3 SOCIO-ECONOMIC CONDITIONS OF MINORITIES OF INDIA
 CHAPTER 3 SOCIO-ECONOMIC CONDITIONS OF MINORITIES OF INDIA 73 List of Contents S.No. Chapter-3 Socio economic condition of Minorities of India on the Page number basis HDI indicators 3.1 Defination of
SPECIAL RELEASE EMPLOYMENT SITUATION IN NATIONAL CAPITAL REGION. October 2015 Final Results
 REPUBLIC OF THE PHILIPPINES PHILIPPINE STATISTICS AUTHORITY NATIONAL CAPITAL REGION Number: 2016-08 Date Released: July 31, 2016 SPECIAL RELEASE EMPLOYMENT SITUATION IN NATIONAL CAPITAL REGION October
FY 2005 Liaison Meeting - JILPT International Labor Information Project
 FY 2005 Liaison Meeting - JILPT International Labor Information Project November 7-10, 2005 Tokyo, Japan Policies and Systems for Foreign Workers in Asian Countries: With a Special Reference To The Thai
Fiscal 2016 KUIS Japanese Language Course Admission Application Form
 Name in alphabet Name in kana Name in kanji Surname / Family name Fiscal 2016 KUIS Japanese Language Course Admission Application Form Given (first and middle) names Date of birth / / [DD/MM/YY] Candidate
AMERICAN MUSLIM VOTERS AND THE 2012 ELECTION A Demographic Profile and Survey of Attitudes
 AMERICAN MUSLIM VOTERS AND THE 2012 ELECTION A Demographic Profile and Survey of Attitudes Released: October 24, 2012 Conducted by Genesis Research Associates www.genesisresearch.net Commissioned by Council
24 indicators that are relevant for disaggregation Session VI: Which indicators to disaggregate by migratory status: A proposal
 SDG targets and indicators relevant to migration 10 indicators that are migration-related Session V: Brief presentations by custodian agencies 24 indicators that are relevant for disaggregation Session
+ + Carefully fill in and sign the application. Incomplete information will delay the processing of the application and may lead to its rejection.
 OLE_MUU 1 *1069901* FINNISH RESIDENCE PERMIT APPLICATION, OTHER GROUNDS This residence permit application form is for you if you are applying for a residence permit for a reason which is not one of the
India ATJ. Please send the following to G3: Contact and Shipping Information: Provide a street address for FedEx delivery - no P.O. boxes.
 G3 Global Services Tel: 877.898.1203 Fax: 866.611.6960 ATJ@g3visas.com ATJ India Please send the following to G3: Complete this cover sheet and the enclosed Indian Visa Questionnaire (one per guest) and
BYLAWS OF THE D068, UNIVERSITY OF SOUTH CAROLINA SECTION OF THE SOCIETY OF WOMEN ENGINEERS
 1 2 3 4 5 6 7 8 9 10 11 12 13 14 15 16 17 18 19 20 21 22 23 24 25 26 27 28 29 30 31 32 33 34 35 36 37 38 39 40 41 42 43 44 45 46 BYLAWS OF THE D068, UNIVERSITY OF SOUTH CAROLINA SECTION OF THE SOCIETY
Population Change and Public Health Exercise 8A
 Population Change and Public Health Exercise 8A 1. The denominator for calculation of net migration rate is A. Mid year population of the place of destination B. Mid year population of the place of departure
GOVERNMENT OF ANGUILLA LABOUR & IMMIGRATION POLICY Effective:
 GOVERNMENT OF ANGUILLA LABOUR & IMMIGRATION POLICY 008 Effective: DRAFT IMMIGRATION & LABOUR POLICY FOR ANGUILLA 008 A. INTRODUCTION Anguilla is part of the international community and our relationships
The American Community Survey and State Legislative Districts
 The American Community Survey and State Legislative Districts Dr. Nancy A. Potok Deputy Director and Chief Operating Officer U.S. Census Bureau National Conference of State Legislatures Legislative Summit
SPECIAL RELEASE. EMPLOYMENT SITUATION IN NATIONAL CAPITAL REGION January 2012 Final Results
 Republic of the Philippines NATIONAL STATISTICS OFFICE National Capital Region Number: 2013-07 SPECIAL RELEASE EMPLOYMENT SITUATION IN NATIONAL CAPITAL REGION January 2012 Final Results The Labor Force
Vulnerability Assessment Framework
 Vulnerability Assessment Framework JORDAN RESPONSE PLAN Key findings June 2015 Developed under an interagency steering committee, including 5 NGOs, 5 UN agencies, BPRM and ECHO Refugees Outside of Camps
UNDERSTANDING TRADE, DEVELOPMENT, AND POVERTY REDUCTION
 ` UNDERSTANDING TRADE, DEVELOPMENT, AND POVERTY REDUCTION ECONOMIC INSTITUTE of CAMBODIA What Does This Handbook Talk About? Introduction Defining Trade Defining Development Defining Poverty Reduction
Looking at the future potential labor supply through the first release of labor underutilization indicators
 Mizuho Economic Outlook & Analysis June 21, 2018 Looking at the future potential labor supply through the first release of labor underutilization indicators < Summary > Japan s Ministry of Internal Affairs
BYLAWS of FINDLEY PARENT TEACHER ORGANIZATION, INC.
 BYLAWS of FINDLEY PARENT TEACHER ORGANIZATION, INC. ARTICLE 1. NAME The name of this organization shall be the Findley Parent Teacher Organization, Inc., also known as the PTO. The objectives of the PTO
MLD - Kulhudhuffushi Harbor Expansion Project
 Kulhudhuffushi Harbor Expansion Project (RRP MLD 36111-013) Due Diligence Report on Involuntary Resettlement and Indigenous Peoples March 2016 MLD - Kulhudhuffushi Harbor Expansion Project Prepared by
Measures of Poverty. Foster-Greer-Thorbecke(FGT) index Example: Consider an 8-person economy with the following income distribution
 index Example: Consider an 8-person economy with the following income distribution") Foster-Greer-Thorbecke(FGT) index Example: Consider an 8-person economy with the following income distribution Individuals Income 1 0.6 2 0.6 3 0.8 4 0.8 5 2 6 2 7 6 8 6 Poverty line= 1 Recall that Headcount
Foster-Greer-Thorbecke(FGT) index Example: Consider an 8-person economy with the following income distribution Individuals Income 1 0.6 2 0.6 3 0.8 4 0.8 5 2 6 2 7 6 8 6 Poverty line= 1 Recall that Headcount
REVIEW OF THE IMPLEMENTATION OF THE CAIRO PROGRAMME OF ACTION ( ) ACHIEVEMENTS AND CONSTRAINTS
 ACHIEVEMENTS AND CONSTRAINTS") REVIEW OF THE IMPLEMENTATION OF THE CAIRO PROGRAMME OF ACTION (1994 2009) ACHIEVEMENTS AND CONSTRAINTS Oranjestad, August 2009 Within the official delegation of the Kingdom of the Netherlands, Aruba has
REVIEW OF THE IMPLEMENTATION OF THE CAIRO PROGRAMME OF ACTION (1994 2009) ACHIEVEMENTS AND CONSTRAINTS Oranjestad, August 2009 Within the official delegation of the Kingdom of the Netherlands, Aruba has
Mary Moore Elementary PTA Standing Rules
 1 1 1 1 1 1 1 1 0 1 0 1 0 1 0 1 Mary Moore Elementary PTA Standing Rules Revised April 01 I. MEETINGS: A. Regular meetings of this Association shall be in the months of September, November, January, and
Table 1. Nepal: Monthly Data for Key Macroeconomic Indicators.
 Table 1. : Monthly Data for Key Macroeconomic Indicators. 1 1 Year-on-year change, in percent Oct Nov Dec FY to date Oct Nov Dec FY to date Oct Nov Dec FY to date ( months) ( months) ( months) Inflation
Youth labour market overview
 1 Youth labour market overview With 1.35 billion people, China has the largest population in the world and a total working age population of 937 million. For historical and political reasons, full employment
ASBA Model Superintendent Agreement
 ASBA Model Superintendent Agreement The Arkansas School Boards Association (hereinafter, Association ) is not a law firm or a substitute for an attorney or law firm. The Association cannot provide any
Template Concept Note for Knowledge Products
 Template Concept Note for Knowledge Products Project Number: 46465 Regional Capacity Development Technical Assistance (R-CDTA) Date of Submission: 15th Jan 2015 South Asia Urban Knowledge Hub (Cofinanced
Item No Halifax Regional Council July 19, 2016
 P.O. Box 1749 Halifax, Nova Scotia B3J 3A5 Canada Item No. 14.4.1 Halifax Regional Council July 19, 2016 TO: SUBMITTED BY: Mayor Savage and Members of Halifax Regional Council Original Signed Councillor
Data base on child labour in India: an assessment with respect to nature of data, period and uses
 Public Disclosure Authorized Public Disclosure Authorized Public Disclosure Authorized Public Disclosure Authorized Understanding Children s Work Project Working Paper Series, June 2001 1. 43860 Data base
Selected macro-economic indicators relating to structural changes in agricultural employment in the Slovak Republic
 Selected macro-economic indicators relating to structural changes in agricultural employment in the Slovak Republic Milan Olexa, PhD 1. Statistical Office of the Slovak Republic Economic changes after
Poverty, Livelihoods, and Access to Basic Services in Ghana
 Poverty, Livelihoods, and Access to Basic Services in Ghana Joint presentation on Shared Growth in Ghana (Part II) by Zeljko Bogetic and Quentin Wodon Presentation based on a paper by Harold Coulombe and
Fullerton Community Nursery School BY-LAWS
 Fullerton Community Nursery School BY-LAWS ARTICLE I: ARTICLE II: ARTICLE III: ARTICLE IV: NAME The name of this corporation is the Fullerton Community Nursery School. TYPE OF CORPORATION This corporation
Visit Sarasota County
 Visit Sarasota County Economic Impact of Tourism: Fiscal Year 2017 Presentation Purpose of Economic Impact Research Document Inform Marketing Inspire Communicate 2 Tourism Matters to Sarasota County $2,989,923,750
The Enabling Environment for Sustainable Enterprises in Timor-Leste Miaw Tiang Tang November 2017
 The Enabling Environment for Sustainable Enterprises in Timor-Leste Miaw Tiang Tang November 2017 Introduction to the EESE report 2016, the ILO collaborated with the CCI-TL and MECAE to assess the business
The economics* tourism
 The economics* tourism mini. 101 Ways to Predict Consumer 1 Behavior?^eSffe s^pected to ummer ^ ra elindu:fry c,tk a u % m Consumer Confidence T ' ~^r,«irif» NowFaresAreUp.Too foreigners Increasing ^ ^
Verdun borough HIGHLIGHTS. In 1996, the Verdun borough had a population of 59,714. LOCATION
 Socio-economic profile borough February 2002 HIGHLIGHTS In 1996, the borough had a population of 59,714. LOCATION Between 1991 and 1996, the population of the borough declined by 2.6%. One-person households
Current Labor Force Survey Commonwealth of the Northern Mariana Islands Fourth Quarter, July 11, 2000
 Current Labor Force Survey Commonwealth of the Northern Mariana Islands Fourth Quarter, 1999 July 11, 2000 Department of Commerce Central Statistics Division Contents Introduction and Acknowledgments...
Instructions for DS-2019 (Exchange Visitor) Request
 Request") Office of International Affairs Instructions for DS-2019 (Exchange Visitor) Request *Revised on 6/5/18 please read the entire application* Exchange Visitor s Information: Please complete ALL the information
Office of International Affairs Instructions for DS-2019 (Exchange Visitor) Request *Revised on 6/5/18 please read the entire application* Exchange Visitor s Information: Please complete ALL the information
 Page 1 of 5 DP02 SELECTED SOCIAL CHARACTERISTICS IN THE UNITED STATES 2013 American Community Survey 1-Year Estimates Although the American Community Survey (ACS) produces population, demographic and housing
Belize. (21 session) (a) Introduction by the State party
 (a) Introduction by the State party") Belize st (21 session) 31. The Committee considered the combined initial and second periodic reports of Belize (CEDAW/C/BLZ/1-2) at its 432nd, 433rd and 438th meetings, on 14 and 18 June 1999. (a) Introduction
Belize st (21 session) 31. The Committee considered the combined initial and second periodic reports of Belize (CEDAW/C/BLZ/1-2) at its 432nd, 433rd and 438th meetings, on 14 and 18 June 1999. (a) Introduction
A Statistical Profile of Artists and Cultural Workers in Canada Based on the 2011 National Household Survey and the Labour Force Survey
 A Statistical Profile of Artists and Cultural Workers in Canada Based on the 2011 National Household Survey and the Labour Force Survey Vol. 12 No. 2 Prepared by Kelly Hill Hill Strategies Research Inc.,
Customer Identity Details. Standards of Living and Education. Job/Business Details. Know Your Customer Application Form (Individuals)
") Know Your Customer Application Form (Individuals) Customer s Branch: Serving Branch:. Account Number: Date: / / Start Date of Banking Relationship: : _/ / Customer Identity Details Name in English: Name
Know Your Customer Application Form (Individuals) Customer s Branch: Serving Branch:. Account Number: Date: / / Start Date of Banking Relationship: : _/ / Customer Identity Details Name in English: Name
Gender institutional framework: Implications for household surveys
 GLOBAL FORUM ON GENDER STATISTICS ESA/STAT/AC.140/5.1 10-12 December 2007 English only Rome, Italy Gender institutional framework: Implications for household surveys Prepared by Cyril Parirenyatwa Central
Economic Linkages and Impact Analysis for the Oregon Sea Grant Programmed and Operated Hatfield Marine Science Center Visitor Center
 Economic Linkages and Impact Analysis for the Oregon Sea Grant Programmed and Operated Hatfield Marine Science Center Visitor Center Oregon State University Extension Service June 2017 Bruce Sorte, Extension
One 40-year-old woman in five has no children
 Population 0 Population Structure 00 Annual Review One 0-year-old woman in five has no children According to Statistics Finland's statistics on the population structure, per cent of the 0-year-old women
Chapter 2 Major Findings
 The 2010 Population and Housing Census (Northeastern Region) Chapter 2 Major Findings General Infomation The Northeastern Region has an area of 168,855.4 square kilometers, It has common boundary with
Emigration Statistics in Georgia. Tengiz Tsekvava Deputy Executive Director National Statistics Office of Georgia
 Emigration Statistics in Georgia Tengiz Tsekvava Deputy Executive Director National Statistics Office of Georgia Main Sources for International Migration in Georgia Annual data of inflows and outflows