Global Wage Report 2018 / 19. What lies behind gender pay gaps
|
|
|
- Earl Sullivan
- 5 years ago
- Views:
Transcription


1 Global Wage Report 218 / 19 What lies behind gender pay gaps
2 Global Wage Report 218/19 What lies behind gender pay gaps
3 International Labour Organization The International Labour Organization (ILO) was founded in 1919 to promote social justice and thereby contribute to universal and lasting peace. The ILO is responsible for drawing up and overseeing international labour standards. It is the only tripartite United Nations agency that brings together representatives of governments, employers and workers to jointly shape policies and programmes promoting decent work for all. This unique arrangement gives the ILO an edge in incorporating real world knowledge about employment and work.
4 Global Wage Report 218/19 What lies behind gender pay gaps INTERNATIONAL LABOUR OFFIE GENEVA
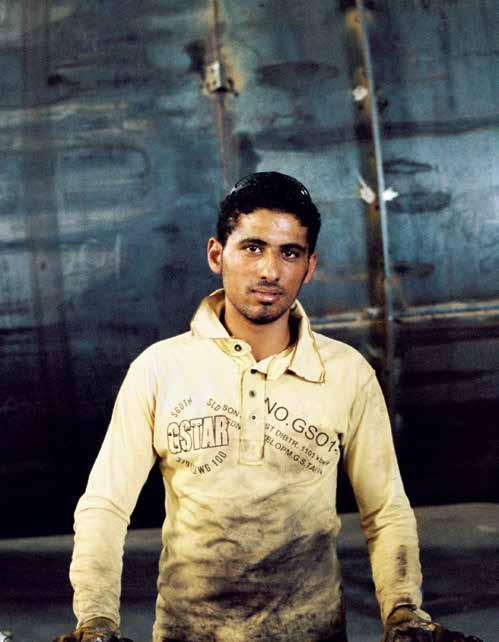
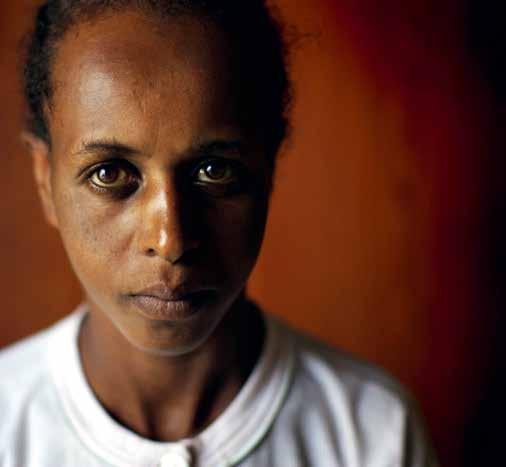
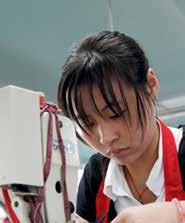
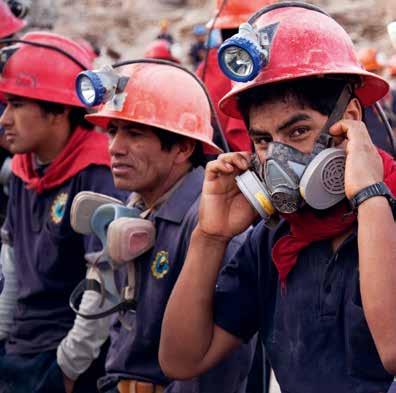
5 opyright International Labour Organization 218 First published 218 Publications of the International Labour Office enjoy copyright under Protocol 2 of the Universal opyright onvention. Nevertheless, short excerpts from them may be reproduced without authorization, on condition that the source is indicated. For rights of reproduction or translation, application should be made to ILO Publications (Rights and Licensing), International Labour Office, H-1211 Geneva 22, Switzerland, or by rights@ilo.org. The International Labour Office welcomes such applications. Libraries, institutions and other users registered with a reproduction rights organization may make copies in accordance with the licences issued to them for this purpose. Visit to find the reproduction rights organization in your country. Global Wage Report 218/19: What lies behind gender pay gaps International Labour Office Geneva: ILO, 218 ISBN (print) ISBN (web pdf) wages / wage differential / wage policy / gender equality / women workers / developed countries / developing countries 13.7 Also available in hinese: ISBN (print), (web pdf); French: ISBN (print), (web pdf); and Spanish: ISBN (print), (web pdf) ILO ataloguing in Publication ata The designations employed in ILO publications, which are in conformity with United Nations practice, and the presentation of material therein do not imply the expression of any opinion whatsoever on the part of the International Labour Office concerning the legal status of any country, area or territory or of its authorities, or concerning the delimitation of its frontiers. The responsibility for opinions expressed in signed articles, studies and other contributions rests solely with their authors, and publication does not constitute an endorsement by the International Labour Office of the opinions expressed in them. Reference to names of firms and commercial products and processes does not imply their endorsement by the International Labour Office, and any failure to mention a particular firm, commercial product or process is not a sign of disapproval. Information on ILO publications and digital products can be found at: over illustration: Panos pictures This publication was produced by the ocument and Publications Production, Printing and istribution Unit (PROO) of the ILO. Graphic and typographic design, manuscript preparation, copy editing, layout and composition, proofreading, printing, electronic publishing and distribution. PROO endeavours to use paper sourced from forests managed in an environmentally sustainable and socially responsible manner. ode: TP-WEI-ORR-MUS
6 Preface Gender pay gaps represent one of today s greatest social injustices, and I am glad to see that eradicating this injustice has taken on significant momentum in recent times. entral to this effort is Sustainable evelopment Goal (SG) target 8.5 which calls, among other things, for equal pay for work of equal value within the framework of the United Nations 23 Agenda for Sustainable evelopment. To reinforce the achievement of SG target 8.5, the ILO, together with UN Women and the OE, established the Equal Pay International oalition (EPI), an initiative to accelerate the closing of the gender pay gap across the world. The success of our efforts is crucial because inequalities within and among countries, including wage inequality, continue to be a significant obstacle to achieving a better and more sustainable future for all. This year s ILO Global Wage Report the sixth of its series therefore provides a detailed examination of gender pay inequalities so as to better understand the gender pay gap as a form of unacceptable inequality in the world of work. The report further continues the tradition of previous editions by providing comparative data and information on recent global and regional wage trends. It shows that global wage growth in 217 was not only lower than in 216, but fell to its lowest growth rate since 28, remaining far below the levels observed before the global financial crisis. This remains something of a puzzle given the recent recovery in economic growth and the gradual reduction in unemployment in major countries around the world. And although possible explanations have been offered to solve that puzzle slow productivity growth and the intensification of global competition, among others what is now widely recognized is that slow wage growth has become an obstacle to achieving sustainable economic growth. The growing consensus is that improving wages, reducing income inequalities and promoting decent work opportunities continue to be challenges that play a central role if we are to succeed in achieving the UN 23 Agenda. The second part of this year s report is devoted to the gender pay gap. Much has been written on the topic and a huge amount of research is aimed at explaining the reasons why men continue to be paid more than women across the world. So why another report? First, this report provides a critical assessment of the standard measures commonly used to estimate gender pay gaps. That assessment leads to a proposal for a new, complementary and simple way of measuring gender pay gaps that we hope will be a useful tool for the purposes of policy-making and for monitoring the evolution of the gender pay gap. Accordingly, the estimates in Part II, which cover some 7 countries and about 8 per cent of wage employees worldwide, show that on average women currently continue to be paid approximately 2 per cent less than men. Second, the report analyses and breaks down gender pay gaps to better understand what lies behind this figure. The evidence shows that, in fact, much of the gender pay gap cannot be explained by any of the
7 vi Global Wage Report 218/19 objective labour market characteristics that usually underlie the determination of wages. In high-income countries, for example, almost all of the gender pay gap remains unexplained. So what could then be the factors that lie behind gender pay gaps? The report shows that education is not, in most countries, the main issue: women wage employees across the world have just as good if not better educational attainments than men. However, occupational segregation and the polarization by gender of industries and economic sectors stand out as key factors. Women continue to be under-represented in traditionally male-occupied categories and within similar categories women are consistently paid below men, even if women s educational attainments are just as good or better than those of men in similar occupations. Gender polarization is also an important factor: the report shows that in Europe, for example, working in an enterprise with a predominantly female workforce can bring about a 14.7 per cent wage penalty compared to working in an enterprise with similar productivity attributes but a different gender mix. This 14.7 per cent gap can translate into a loss of about 3,5 (approximately US$4,) in salary per year for those who work in feminized sectors. Finally, the report shows that motherhood brings about a wage penalty that can persist across a woman s working life while the status of fatherhood is persistently associated with a wage premium. Part III of the report suggests a number of policy measures to achieve pay parity between women and men. It is my hope that together with the empirical evidence presented earlier in the report, Part III will provide policy-makers, social partners, academics and key stakeholders with a valuable source of information to contribute to eradicating pay inequalities across the world. Guy Ryder ILO irector-general
8 ontents Preface... Acknowledgements... Executive summary... v xi xiii Part I. Major trends in wages 1 Introduction Global wage trends Wage trends The global context Regional wage trends Wage indices over the last ten years Wages and productivity in high-income economies Wage inequality Part II. Measuring gender pay gaps and understanding what lies behind them 7 Introduction Measuring the gender pay gap The raw gender pay gap Going beyond the raw gender pay gap A complementary measure: The factor-weighted gender pay gap What are the factors that lie behind the gender pay gap? Estimating the gender pay gap across the hourly wage distribution What part of the gender pay gap can be explained by differences in the characteristics of women and men in the labour market? Understanding what lies behind the unexplained part of the gender pay gap: The undervaluation of women s work and the motherhood pay gap Part III. Which way forward? 1 Measures for sustainable wage growth Reducing the gender pay gap The need for better data
9 viii Global Wage Report 218/19 13 The need to move beyond simple measures of the gender pay gap Exploring the gender pay gap across the wage distribution, and reviewing the effectiveness of labour market institutions Tackling the explained part of the gender pay gap: Education, polarization and occupational segregation Tackling the unexplained part of the gender pay gap: The undervaluation of work in feminized occupations and enterprises, and implementation of equal pay Reducing the motherhood pay gap Time to accelerate progress in closing gender pay gaps Appendices I Global wage trends: Methodological issues II Real and nominal wage growth, by region and country III ountry and territory groupings, by region and income level IV overage of the Global Wage database V National data sources VI ecomposing the gender pay gap VII Educational attainments of men and women wage employees by their location and ranking in the hourly wage distribution Bibliography.... 5
10 ontents ix Boxes 1 Wage statistics in Africa Probability versus cumulative distribution functions: An illustrative example The factor-weighted gender pay gap: An illustrative example ecomposing the gender pay gap: An illustrative explanation Empirical evidence of the gender pay gap at enterprise level The Swiss equal pay tool for small firms Parenthood status in the data A word of warning A1 What are wages? Figures 1 Annual average global real wage growth, Annual average real wage growth in the G2 countries, Total increase in the real average wages of G2 countries, Annual average economic growth, (GP in constant prices) Inflation, (average consumer prices) Annual average economic growth by region, 2 and 217 (GP in constant prices) Inflation by region, 2 and 217 (average consumer prices) Annual average real wage growth by region, (percentage change) 8 9 Average real wage index for advanced G2 countries, Average real wage index for emerging G2 countries, Trends in average real wages and labour productivity in high-income countries, Key indicators: Year-on-year change in selected high-income countries, Gini estimates of wage inequality in 64 countries (hourly wages) Gender pay gaps using hourly wages Gender pay gaps using monthly earnings Pay gaps and the incidence of part-time work among women Pay gaps and the incidence of part-time work among men Wage structures, selected economies Factor-weighted gender pay gaps using hourly wages Factor-weighted gender pay gaps using monthly earnings Factor-weighted gender pay gaps: Private-sector versus public-sector employment (mean hourly wages) Factor-weighted gender pay gaps: Full-time versus part-time employment (mean hourly wages)... 42
11 x Global Wage Report 218/19 23 omparing raw gender pay gaps and factor-weighted gender pay gaps using mean hourly wage in both cases: lassification based on ranking countries (within five groups) by raw gender pay gap Gender pay gaps across the wage distribution for selected countries, latest years Share of women and men by top and bottom centiles and intervening deciles of the hourly wage distribution, selected countries, latest years Gender pay gap at the first and ninth quantiles in the hourly wage distribution, latest years Share of women and men at the bottom and top centiles of the hourly wage distribution, latest years Share of women and men at the 1th centiles and 9 9 centiles of the hourly wage distribution, latest years ecomposition of the gender pay gap, isolating the explanatory effect of education, selected countries, latest years Weighted average of the three components of the gender pay gap shown in figure 29, latest years Occupations, feminization, education and the gender pay gap, selected countries, latest years Wages and occupation by degree of feminization Hourly wage by degree of feminization in Europe, Hourly wage by degree of feminization and by wage profile in Europe, Age, participation and the gender pay gap, selected countries by income group, latest years A1 Share of paid employees in total employment, A2 Real wage growth, by region and country, A3 Educational attainments of men and women wage employees by their location and ranking in the hourly wage distribution (score in education) Tables 8.1 etails of the factor-weighted gender pay gap for Egypt Labour market endowments, attributes and characteristics for the decomposition of the gender pay gap Motherhood and fatherhood gaps for selected economies, latest years... 8 A1 ountry-specific nominal wage and real wage growth, A2 ountry and territory groupings by region A3 ountry and territory groupings by income level A4 overage of the Global Wage database, 217 (percentage) A5 overage of the Global Wage database, (percentage)
12 Acknowledgements The report was prepared by staff of the Inclusive Labour Markets, Labour Relations and Working onditions Branch (INWORK) of the ILO with contributions from other ILO colleagues in Geneva and field offices, under the responsibility of Philippe Marcadent, hief of INWORK. Patrick Belser, Rosalia Vazquez-Alvarez and ing Xu were the main authors of the report. Patrick Belser provided overall coordination of the report and drafted Part III. Rosalia Vazquez-Alvarez drafted Parts I and II and coordinated the research on the gender pay gap. ing Xu carried out the data analysis for Part I of the report. Molka Abassi gathered and analysed data for Parts I and II and provided inputs for Part III of the report. Muriel Esposito reviewed recent legal and policy trends and provided inputs for Part III. hris Edgar coordinated the editing, publication and the anonymous peer review of the entire report. Gillian Somerscales copy-edited the initial draft of the report. Our special thanks go to Manuela Tomei, irector of the ILO onditions of Work and Equality epartment, who provided extremely helpful suggestions and inputs. ILO specialists in various parts of the world are also acknowledged for their useful comments, including Sevane Ananian (airo), Xavier Estupiñan (New elhi), aniel Kostzer (Bangkok), Andres Marinakis (Santiago de hile), Mariko Ouchi (Budapest) and Nicolas Studer (Moscow). laire Piper is acknowledged for providing excellent secretarial support. Specific contributions Part II of the report is based on data cleaned and prepared by Silas Amo-Agyei, Nelly El-Mallakh, eepti Goel, Anna Lukyanova, Roxana Maurizio, Hanan Nazier, Oksana Nezhyvenko, Neda Trifkovic, Gustavo Vázquez and ayoung Yoon. The technical peer review for Part II, carried out in addition to the general peer review of the report, was undertaken by Silas Amo-Agyei. Professor Sune Karlsson (Örebro University Business School) is acknowledged for peer reviewing again the entire methodology of Part I in 217. Special thanks Our special thanks go to all the national statistical offices which assisted us with our data collection efforts. We would also like to thank the entire team at ILO/ SIAL (Information System and Labour Analysis) in Panama, in particular Bolívar Pino, for providing wage data on Latin America and the aribbean. Special thanks also go to all those who participated in the two regional workshops organized by Sevane Ananian and aimed at improving the coverage of wage data from African countries in the report. These workshops took place in airo, in ecember 217, and in Abidjan, in April 218; in particular, we commend the
13 xii Global Wage Report 218/19 support received from the ILO epartment of Statistics, the ILO Regional Office for Africa (ROAF) and the ILO ountry Office for ôte d Ivoire in Abidjan. We would also like to thank the following people for their valuable input and comments: Samia Archella, Maria Arteta, anine Berg, Florence Bonnet, María osé hamorro, ae-hee hang, Eric harest, Najati hosheh, laire Hobden, Qun Huang, Martine Humblet, Montserrat Lopez, on Messenger, Yumi Nabeshima, Rafael Peels, Bimlesh Raj, ohn Ritchotte, Patricia Roa, Verena Schmidt, Annie Van Klaveren and ose Luis Viveros Añorve, as well as members of the Interim Steering ommittee of EPI, in particular Patric Aeberhard, Sylvie urrer, Rósa Guðrún Erlingsdóttir, Byeong Hee Kwon and Salma Nims, in addition to government officials, employer and union representatives from member countries, and international gender experts, for their input in enriching Part III of the report. Our particular thanks go to two anonymous referees who peer reviewed the report as well as to all internal peer reviewers from various departments of the ILO. Nicole Fortin is gratefully acknowledged for sharing unpublished material that helped the authors of the report to perform the decomposition in Part II.
14 Executive summary Part I. Major trends in wages Lowest wage growth globally in 217 since 28 Global wage growth in 217 was not only lower than in 216, but fell to its lowest growth rate since 28, remaining far below the levels obtaining before the global financial crisis. Global wage growth in real terms (that is, adjusted for price inflation) has declined from 2.4 per cent in 216 to just 1.8 per cent in 217. If hina, whose large population and rapid wage growth significantly influence the global average, is excluded, global wage growth in real terms fell from 1.8 per cent in 216 to 1.1 per cent in 217. Real wage growth is calculated using gross monthly wages, rather than hourly wage rates, which are less frequently available, and fluctuations therefore reflect both hourly wages and the average number of hours worked. Slow wage growth in high-income countries despite economic recovery and falling unemployment In the advanced G2 countries, real wage growth declined from 1.7 per cent in 2 to.9 per cent in 216 and.4 per cent in 217. In Europe (excluding Eastern Europe), real wage growth declined from 1.6 per cent in 2 to 1.3 per cent in 216 and further declined to about zero in 217, owing to lower wage growth in countries including France and Germany, and declining real wages in Italy and Spain; in Eastern Europe, by contrast, real wage growth recovered from its 4.9 per cent decline in 2 and continued to increase thereafter, from 2.8 per cent in 216 to 5. per cent in 217. Real wage growth in the United States declined from 2.2 per cent in 2 to.7 per cent in both 216 and 217. Given the recovery in GP growth and the gradual reduction in unemployment rates in various countries, slow wage growth in high-income countries in 217 represented somewhat of a puzzle and has been the subject of intense debate. Possible explanations for subdued wage growth include slow productivity growth, the intensification of global competition, the decline in the bargaining power of workers and the inability of unemployment statistics to adequately capture slack in the labour market, as well as an uncertain economic outlook which may have discouraged firms from raising wages.1 In view of this low wage growth, it is perhaps not too surprising that the acceleration of economic growth in high-income countries in 217 was led mainly by higher investment spending, rather than by private consumption. 1. See, for example, OE, 218; IMF, 217. ontents
15 xiv Global Wage Report 218/19 More robust wage growth in low- and middle-income countries, with much diversity across countries and regions In emerging and developing countries of the G2, real wage growth has fluctuated in recent years, rising from 2.9 per cent in 2 to 4.9 per cent in 216, and then falling back to 4.3 per cent in 217. Workers in Asia and the Pacific have enjoyed the highest real wage growth among all regions over the period However, even here wage growth in 217 was lower than in 216, falling from 4.8 per cent in 216 to 3.5 per cent in 217. Wage growth also declined in entral and Western Asia, from 3. per cent in 216 to.5 per cent in 217. In Latin America and the aribbean, real wage growth in 217 increased slightly compared to 216 but remains relatively low, below the 1 per cent mark. In Africa, where wage data have been collected for the first time for a significant number of countries, real wages appear to have declined overall in 217 by 3. per cent. This is mainly attributable to negative wage trends in Egypt and Nigeria, two large countries which exert a strong influence on our weighted regional average. If these two countries are taken out of the sample, real wages in Africa are estimated to have increased by a moderate 1.3 per cent in 217. Taking a longer perspective, real wages between 1999 and 217 have almost tripled in the emerging and developing countries of the G2, while in advanced G2 countries they have increased by a much lower total of 9 per cent. Yet in many low- and middle-income countries average wages remain low and insufficient to adequately cover the needs of workers and their families. Wage growth lagging behind productivity growth in high-income countries Looking at trends in average wages and labour productivity over the period in 52 high-income countries, the report finds that, on average, labour productivity has increased more rapidly (by a total of 17 per cent) than real wages (13 per cent), although the gap between the two trends narrowed between 2 and 217. Overall, the decoupling between wages and labour productivity explains why labour income shares (the share of labour compensation in GP) in many countries remain substantially below those of the early 199s. Wage inequality highest in low-income countries Using survey data on wages from 64 countries which, together, reflect the wage distribution of about 75 per cent of the world s wage employees, the report finds that the countries with the lowest levels of wage inequality are found among the high-income group, whereas countries with the highest levels of wage inequality are found in the low- and middle-income groups. Among high-income countries, wage inequality is lowest in Sweden and highest in hile. Among low-income and middle-income countries, South Africa and Namibia have the highest inequality, Armenia and Mongolia the lowest.
16 Executive summary xv Part II. Measuring gender pay gaps and understanding what lies behind them Measuring the gender pay gap The raw gender pay gap Part II of the report provides a global analysis of the gender pay gap. The United Nations SG target 8.5, which sets out the aim to achieve by 23 equal pay for work of equal value, proposes as a main indicator to compare average hourly earnings of female and male employees (indicator 8.5.1). Using average (mean) hourly wages to estimate the gender pay gap, as suggested in SG indicator 8.5.1, the report finds that based on data for 73 countries that cover about 8 per cent of the world s employees the (weighted) global gender pay gap stands at around 16 per cent. There are wide variations among countries, with the mean hourly gender pay gap ranging from 34 per cent in Pakistan to 1.3 per cent in the Philippines (meaning that in this country, women earn on average 1.3 per cent more than men). However, there are different possible ways to measure raw gender pay gaps. The two measures that are most commonly used are the mean gender pay gap (as in the estimate above) and the median gender pay gap ; the latter compares the value located in the middle of the women s wage distribution with the value located in the middle of the men s wage distribution. Further differences arise when comparisons are made using monthly wages rather than hourly wages. Using these four different combinations (mean/median and hourly/monthly), the report finds that the weighted global estimates range from about 16 per cent to 22 per cent, depending on which measure is used. The gender pay gap of 22 per cent is obtained when using median monthly wages. A complementary measure: The factor-weighted gender pay gap The report finds that in most countries but particularly where the participation of women in wage employment is low women tend to have different characteristics than men and tend to cluster around specific hourly wages. In a wage distribution characterized by such irregularities, gender pay gap estimates based on a single number, the mean or the median, can be difficult to interpret and may provide information that is of limited use to policy-makers, as they are completely dominated and distorted by this clustering. The report thus proposes a methodology to generate complementary estimates of the gender pay gap that remove some of the major composition effects arising from the existence of these clusters (for example, when women tend to cluster in the public sector or in jobs requiring high levels of education). In essence, this methodology groups women and men wage employees into more homogeneous subgroups, and then estimates the gender pay gap in each subgroup. The methodology then constructs a weighted average of all the subgroups estimated gender pay gaps, with weights reflecting the size of each subgroup in the total population of wage employees. Using this method, the mean hourly gender pay gap becomes positive in all but two countries, and the mean hourly global gender pay gap increases from about 16 per cent to 19 per cent. ontents
17 xvi Global Wage Report 218/19 What are the factors that lie behind the gender pay gap? Estimating the gender pay gap across the hourly wage distribution The report estimates the hourly gender pay gap at different points in the wage distribution. Among high-income countries, the widening of the gender pay gap at the upper end of the distribution is striking. In contrast, in low- and middleincome countries it is at the low end of the wage distribution where women are proportionally over-represented that the gender pay gap is wider. However, there is a common pattern in labour markets across the world: as we move from lower to higher hourly wages the proportion of women declines, in some cases sharply. What part of the gender pay gap can be explained by differences in the attributes and characteristics of women and men in paid employment? Are men paid more than women because they are better educated, or because they have other observable characteristics or attributes that are associated with higher labour productivity? The report uses methods pioneered by Fortin, Lemieux and Firpo (211) to decompose the gender pay gap (at different parts of the distribution and overall) into a component that can be explained by differences in the labour market attributes of women and men and here the report singles out in particular the role of education and a component that is unexplained by such characteristics. By labour market attributes, we mean the so-called human capital characteristics (typically age, experience and education); the characteristics that define the jobs held by individuals (for example, occupational category or working time); and the characteristics that describe the workplace where production takes place (industrial sector, geographical location, and so on). Although there are large variations across countries, the report finds that, on average, education and other labour market attributes explain relatively little of the gender pay gap at different points of the wage distribution. The unexplained part of the gender pay gap generally dominates almost all countries, irrespective of income group. In high-income countries, education contributes on average less than 1 percentage point of the gender pay gap, through it contributes much more in some individual countries. This general finding is not surprising, since in high-income countries the educational attainment of women in paid employment is in many instances higher than that of men; lower educational attainments thus cannot be an explanation for the gender pay gap. More surprisingly, perhaps, lower education is not so prominent a factor explaining the gender pay gap in a majority of low- and middle-income countries either, even though women generally have lower educational attainments than men in many of these countries. In practice, however, a large share of women with low levels of education stay out of the labour market or work as own-account workers rather than paid employees. In fact, women in paid employment tend to be more highly educated than men within similar occupational groups.
18 Executive summary xvii Understanding what lies behind the unexplained part of the gender pay gap: The undervaluation of women s work and the motherhood pay gap What lies behind the unexplained part of the gender pay gap? One part of the answer relates to lower wages paid to women for work of equal value. Providing some perspective on this question, though not a full answer, the report looks at occupational categories and shows that in many countries women are more highly educated than men within the same occupational categories but nonetheless earn lower wages. This illustrates the fact that women tend to have lower wage returns for their education than men, even when they work in the same occupational category. Another part of the answer relates to the undervaluation of women s work in highly feminized occupations and enterprises. The report shows for a selection of countries that wages of women and men with similar levels of education tend to be lower in highly feminized occupations than in other occupations. Further analysis using data from the European Structure of Earnings Survey (SES) also shows that wages tend to be lower in enterprises that are highly feminized than in enterprises that are otherwise similar in terms of number of employees, economic sector, ownership and type of collective pay agreement. Finally, the report also looks at the motherhood pay gap, defined as the pay gap between mothers and non-mothers. The report estimates that the mother hood pay gap ranges from 1 per cent or less in anada, Mongolia or South Africa to as much as 3 per cent in Turkey. Lower wages for mothers may be related to a host of factors, including labour market interruptions or reduction in working time; employment in more family-friendly jobs, which are lower paying; or stereotypical hiring and promotion decisions at enterprise level which penalize the careers of mothers. Part III. Which way forward? What can be done to progressively reduce gender pay gaps across the world? While there is a range of policies and measures that can be taken to reduce these gaps, the answer to this question will necessarily be country-specific since the factors that drive and explain gender pay gaps vary from country to country and in different parts of the distribution. Better data To start with, the report emphasizes the importance of good data and highlights the need in many countries for better data on the distribution of wages. In particular, low- and middle-income countries have very limited statistics on the average wages of women and men. One feasible option would be to review and modify existing surveys by introducing, for instance, modules specifically relating to gender pay gaps into cross-sectional surveys. In better-resourced countries, panel data can go some way towards solving certain of the issues related to the interpretation of life-cycle events. ontents
19 xviii Global Wage Report 218/19 The need to move beyond simple measures of the gender pay gap The report also recommends going beyond summary measures to inspect in more detail the respective wage structures of women and men, analyse gender pay gaps in more homogeneous subgroups of wage earners, and calculate factor-weighted gender pay gaps which control for some of the major composition effects. This is especially useful where women s labour force participation is low and where women cluster in particular sectors and occupations. Finding out where in the wage distribution the gender pay gap is largest, and reviewing the effectiveness of existing labour market institutions An important question is whether the gender pay gap in a particular country is mostly driven by pay gaps at the bottom, in the middle or at the top of the wage distribution. This has important policy implications. For example, whereas a welldesigned minimum wage with broad legal coverage could reduce the gender pay gap at lower wage levels, collective agreements that are extended to vulnerable groups of workers and include provisions on gender pay gaps or pay transparency could have the same effect higher up in the wage distribution. Finally, policies and measures that promote greater representation of women in senior and highly paid positions could have a positive effect at the top levels. Measures that promote the formalization of the informal economy can also greatly benefit women, bringing them under the umbrella of legal and effective protection and empowering them to better defend their interests. Tackling the explained part of the gender pay gap, including through education, changing stereotypes, and combating employer prejudice in hiring and promotion decisions The decomposition analysis in the report shows that part of the gender pay gap can be explained by differences in the labour market attributes of women and men, including their levels of education, and the fact that they tend to work in occupations or industries that pay less. The importance of these factors varies from country to country. Where women in paid employment have lower educational achievements than men, educational policies targeting enrolment rates among girls may contribute to reducing the gender pay gap in the future. Reducing polarization and occupational segregation may require changing perceptions and stereotypes, for example to attract more women into the areas of science, technology, engineering and mathematics (STEM), which offer betterpaid employment opportunities, or to combat employer prejudice in hiring and / or promotion decisions. Tackling the unexplained portion of the gender pay gap The report finds that in many countries the largest part of the gender pay gap is unexplained by differences in attributes and characteristics of women and men. A growing number of countries are thus focusing attention on national legislation
20 Executive summary xix which prohibits pay discrimination against women and measures that promote equal pay between women and men. However, there is a long way to go. While 4 per cent of all countries have adopted the full principle of equal pay for work of equal value, the remaining countries focus instead on the narrower principle of equal pay for equal work. In addition, some countries have taken steps to promote pay transparency to expose differentials between women and men, requiring (usually large) enterprises to disclose the earnings of their employees. In recent years, a number of countries have embraced proactive pay equity laws, which require employers to regularly examine their compensation practices, assess the gender pay gaps and take action to eliminate the portion of the gap due to discrimination in pay. ountries should also look into possible ways to address the undervaluing of women s work in highly feminized occupations and industries, including by raising wages in the latter. Eliminating this bias is not only a way to narrow the gender pay gap directly, it is also a condition to reducing occupational segregation, for example by attracting more men into the education and health sectors. What can be done to reduce the motherhood pay gap? More equitable sharing of family duties between women and men, as well as adequate childcare and eldercare services, would in many instances lead to women making different occupational choices. Adequate company policies on flexible working-time arrangements would also help. The lack of programmes supporting women s return to work after childbirth also contributes to the wage penalty that women face when resuming work after a prolonged period of absence from the labour market. Time to accelerate progress in closing the gender pay gap Never before has awareness of and commitment to gender equality at work, as well as in society, been so prominent in national and international public debates. The United Nations SG 8 sets the target of achiev[ing] full and productive employment and decent work for all women and men, including for young people and persons with disabilities and equal pay for work of equal value by 23. To support this Goal, the Equal Pay International oalition (EPI), which was launched in September 217 as a multi-stakeholder initiative that includes the ILO, UN Women and the OE, seeks to achieve equal pay for women and men. There is an international momentum in favour of concrete and coordinated action to tackle gender inequality. In practice, however, progress in reducing gender pay gaps has been too slow. More vigorous and decisive action is needed. In addition to the specific measures discussed above, we set out a few more general considerations. First, accelerating progress will require both political commitment and social transformation. While public policies to enhance education, labour and social protection, and to improve social infrastructure, are necessary to close the gender pay gap, their effectiveness depends at least in part on shifting social norms and gender stereotypes. Second, comprehensive, cross-cutting approaches to gender equality are necessary to combat the gender pay gap. Indeed, not only are gender pay gaps rooted in well-entrenched stereotypes, they also represent a summary indicator
21 xx Global Wage Report 218/19 that captures many disadvantages faced by girls and women both within and outside the labour market. Hence measures to reduce or eliminate gender pay gaps should be embedded in a broader overall gender equality policy. Third, we emphasize once again that the appropriate mix of policies in any national context will depend on that particular country s circumstances, and that robust analytical work is needed to identify the largest contributory factors and hence the most effective remedies in different country contexts.
22 PART I 1 Major trends in wages Introduction This year s Global Wage Report appears in a context of slow growth in average wages in developed economies. In some countries this growth has taken place in circumstances of relatively slow economic growth, whereas in other countries it has occurred in spite of accelerating economic recovery and declining unemployment rates. There are multiple possible explanations for subdued wage growth in these latter countries, ranging from slow productivity growth to the intensification of global competition, the decline in the bargaining power of workers, the inability of unemployment statistics to adequately capture slack in the labour market, and an uncertain economic outlook which may have discouraged firms from raising wages.1 In low- and middle-income economies, growth in average wages has generally been more robust, but with much diversity across countries and regions. While wages have increased rapidly over the past decade in some countries, most particularly in hina, in many other countries average wages remain low and insufficient to adequately cover the needs of workers and their families. Overall, in low- and middle-income economies, an estimated 5 per cent of all wage earners continue to work in the informal economy, either in the informal sector or as informal workers in the formal sector (ILO, 218a). Part I of this year s Global Wage Report provides evidence of these wage trends, setting out the most recent movements in global and regional wages and discussing the economic context in which they have taken place, with a particular focus on trends in economic growth and price inflation. Ahead of this year s report a special effort has been made to increase the representation of African countries in the analysis of wage trends: this is reflected in the substantially higher number of African countries for which this report is able to include wage data. The report discusses some country-level trends and also looks at the extent to which recent wage trends in developed economies can be explained or not by changes in labour productivity. 1. On the slow wage growth in advanced economies see also OE, 218; IMF, 217. ontents
23 2 Global Wage Report 218/19 2 Global wage trends 2.1 Wage trends According to ILO estimates, the average world labour force participation rate stands at about 62 per cent of the working-age population, with approximately 3.3 billion individuals engaged in employment. Among all who are employed, some 54 per cent, that is, 1.8 billion, are wage and salaried workers, which represents an increase of some 76 million wage and salaried workers compared to years ago (ILOSTAT; ILO, 217). For most of these workers, income from wages makes up a significant proportion of their total household income. On average, the share of wages in the total incomes of households including at least one member of working age ranges from about 4 per cent in some low- and middle-income countries to between 6 and 8 per cent in high-income economies (ILO, 216a). Hence, analysing global and regional wage growth is key to understanding the growth of incomes and living standards worldwide. How have real average wages changed in recent years? Figure 1 shows estimated global real wage growth with and without hina between 26 and 217, based on data from 136 economies. Real wage growth is calculated using gross monthly wages, rather than hourly wage rates, which are less frequently available, and fluctuations therefore reflect both hourly wages and the average number of hours worked. Real wages are net of consumer price inflation: that is, nominal wages are deflated by a relevant price index, usually the consumer price index (PI). The global and regional estimates are based on a weighted average that takes into account the total number of wage employees in the respective countries, wage levels and wage growth. The full methodology and definitions of wages are provided in Appendix I, with country-specific data provided in Appendix II. The exclusion of hina, whose large population and rapid wage growth significantly influence the global average, provides an estimate that better captures what happens in other countries worldwide. It is apparent from figure 1 that global real wage growth in 217 was not only lower than in 216, but fell to its lowest growth rate since 28, remaining far below the levels obtaining in 26 or 27, before the global financial crisis. The slowdown in wage growth between 216 and 217 is observable in both series, with and without hina. The same slowdown can also be observed in the estimate, shown in figure 2, of real wage growth in the G2 countries, which account for some 6 per cent of the world s wage employees and together produce about three-quarters of global GP. While G2 wage growth is somewhat higher than global wage growth, nevertheless both estimates declined substantially between 216 and 217. Figure 2 also gives separate wage growth estimates for advanced and emerging G2 economies, 2 showing that over the whole period, real wages increased more rapidly 2. The division of G2 countries into advanced G2 and emerging G2 is based on IMF groupings, in which advanced G2 excludes European Union aggregate.
24 Part I 3 2 Global wage trends Figure 1 Annual average global real wage growth, Global Global (without hina) hange (%) ontents Note: 217 figures are preliminary estimates as national estimates are not yet available for all countries. Source: ILO estimates based on official national sources as recorded in ILOSTAT and the ILO Global Wage database. The full data set is available from the ILO Global Wage database and can be downloaded free of charge (see: Figure 2 Annual average real wage growth in the G2 countries, G2 advanced G2 emerging G hange (%) Note: 217 figures are preliminary estimates as national estimates are not yet available for all countries. Source: ILO estimates based on official national sources as recorded in ILOSTAT and the ILO Global Wage database. The full data set is available from the ILO Global Wage atabase and can be downloaded free of charge (see: in emerging G2 countries than in advanced G2 countries. Again, however, wage growth in 217 was slower than in 216 in both developed and emerging economies. Figure 3 shows that, according to our estimates, average wages in the G2 grew by a total of about 55 per cent between 1999 and 217. This figure, however, hides large differences between emerging G2 economies, where average wages tripled, and advanced G2 economies, where real average wages increased by a total of only 9 per cent. In spite of the more rapid wage growth, the level of average wages in emerging economies remains substantially lower than in advanced G2 economies. onverting all G2 countries average wages into US dollars using
25 4 Global Wage Report 218/19 Figure 3 Total increase in the real average wages of G2 countries, G2 emerging 32 Index (base year 1999 = 1) G2 G2 advanced 5 19 Note: 217 figures are preliminary estimates as national estimates are not yet available for all countries. Source: ILO estimates based on official national sources as recorded in ILOSTAT and the ILO Global Wage atabase (see: purchasing power parity (PPP) exchange rates yields a simple average wage of some US$3, per month in advanced economies and about US$1,55 per month in emerging economies The global context The slowdown in wage growth in 217 occurred in spite of more rapid economic growth. Figure 4 shows that global economic growth picked up in 217 and is expected to further increase in As can be seen, economic growth accelerated in advanced economies as well as in emerging market and developing economies. In the advanced economies, this acceleration was led mainly by higher investment spending, which had previously remained weak since the 28 9 global financial crisis, and was helped by stronger export growth. On the other hand, private consumption among advanced economies did not contribute significantly to real GP growth in the period , which is perhaps not too surprising in the light of the low wage growth documented in figures 1 and 2. In emerging markets and developing economies, faster growth was driven by both a surge in fixed investment and an acceleration in private consumption. Figure 5 shows the evolution of price inflation. While in 2 and 216 advanced countries faced the possibility of entering into a downward price spiral or deflationary period, more recently inflation rates rose from less than 1 per cent 3. The PPP conversion factor is the number of units of a country s currency required to buy the same amounts of goods and services in the domestic market as US$1 would buy in the United States. This conversion factor is for private consumption (i.e. household final consumption expenditure). For most economies, PPP figures are extrapolated from the 211 International omparison Program (IP) benchmark estimates or imputed using a statistical model based on the 211 IP. For 47 high- and upper-middle income countries, conversion factors are provided by Eurostat and the OE. 4. This paragraph is based on IMF, 217 and 218.
Executive summary. Part I. Major trends in wages
 Executive summary Part I. Major trends in wages Lowest wage growth globally in 2017 since 2008 Global wage growth in 2017 was not only lower than in 2016, but fell to its lowest growth rate since 2008,
Inclusive growth and development founded on decent work for all
 Inclusive growth and development founded on decent work for all Statement by Mr Guy Ryder, Director-General International Labour Organization International Monetary and Financial Committee Washington D.C.,
GLOBAL WAGE REPORT 2016/17
 GLOBAL WAGE REPORT 2016/17 WAGE INEQUALITY IN THE WORKPLACE Patrick Belser Senior Economist, ILO Belser@ilo.org Outline Part I: Major Trends in Wages Global trends Wages, productivity and labour shares
Executive summary. Strong records of economic growth in the Asia-Pacific region have benefited many workers.
 Executive summary Strong records of economic growth in the Asia-Pacific region have benefited many workers. In many ways, these are exciting times for Asia and the Pacific as a region. Dynamic growth and
Gender pay gap in public services: an initial report
 Introduction This report 1 examines the gender pay gap, the difference between what men and women earn, in public services. Drawing on figures from both Eurostat, the statistical office of the European
International Monetary and Financial Committee
 International Monetary and Financial Committee Thirty-Fifth Meeting April 22, 2017 IMFC Statement by Guy Ryder Director-General International Labour Organization Weak outlook for jobs at heart of uncertain
Women at Work in G20 countries: Policy action since 2017
 Women at Work in G20 countries: Policy action since 2017 Paper prepared for the 2nd Meeting of the G20 Employment Working Group under Argentina s Presidency 2018 11-12 June 2018, Geneva, Switzerland Contents
and with support from BRIEFING NOTE 1
 and with support from BRIEFING NOTE 1 Inequality and growth: the contrasting stories of Brazil and India Concern with inequality used to be confined to the political left, but today it has spread to a
Global Employment Trends for Women
 December 12 Global Employment Trends for Women Executive summary International Labour Organization Geneva Global Employment Trends for Women 2012 Executive summary 1 Executive summary An analysis of five
Inclusion and Gender Equality in China
 Inclusion and Gender Equality in China 12 June 2017 Disclaimer: The views expressed in this publication are those of the authors and do not necessarily reflect the views and policies of the Asian Development
CEDAW/C/PRT/CO/7/Add.1
 United Nations Convention on the Elimination of All Forms of Discrimination against Women CEDAW/C/PRT/CO/7/Add.1 Distr.: General 18 April 2011 Original: English ADVANCE UNEDITED VERSION Committee on the
Data on gender pay gap by education level collected by UNECE
 United Nations Working paper 18 4 March 2014 Original: English Economic Commission for Europe Conference of European Statisticians Group of Experts on Gender Statistics Work Session on Gender Statistics
The Global Economic Crisis Sectoral coverage
 Working Paper No. 271 The Global Economic Crisis Sectoral coverage Trends in Employment and Working Conditions by Economic Activity Statistical Update Third quarter 2009 Sectoral Activities Department
Conference on What Africa Can Do Now To Accelerate Youth Employment. Organized by
 Conference on What Africa Can Do Now To Accelerate Youth Employment Organized by The Olusegun Obasanjo Foundation (OOF) and The African Union Commission (AUC) (Addis Ababa, 29 January 2014) Presentation
Wage Gap Widens as Wages Fail to Keep Pace with Productivity
 Index: 2000 = 100 Wage Gap Widens as Wages Fail to Keep Pace with Productivity Michael Renner January 30, 2013 T he economic crisis in 2008 was one of the harsher signs that economic globalization has
Migrant Domestic Workers Across the World: global and regional estimates
 RESEARCH SERIES GLOBAL ACTION PROGRAMME ON MIGRANT DOMESTIC WORKERS AND THEIR FAMILIES Migrant Domestic Workers Across the World: global and regional estimates Based on the ILO report on Global estimates
Better Factories Cambodia Transparency Database Report, 10th Cycle. January 2018
 Better Factories Cambodia Transparency Database Report, 10th Cycle January 2018 ILO CATALOGUING IN PUBLICATION DATA Better Factories Cambodia: Transparency Database Report / International Labour Office;
HAS GROWTH PEAKED? 2018 growth forecasts revised upwards as broad-based recovery continues
 HAS GROWTH PEAKED? 2018 growth forecasts revised upwards as broad-based recovery continues Regional Economic Prospects May 2018 Stronger growth momentum: Growth in Q3 2017 was the strongest since Q3 2011
Danish gender wage studies
 WOMEN S MEN S & WAGES Danish gender wage studies Danish gender wage studies.... side 76 4. Danish gender wage studies Chapter 4 provides an overview of the most important economic analyses of wage differences
HIGHLIGHTS. There is a clear trend in the OECD area towards. which is reflected in the economic and innovative performance of certain OECD countries.
 HIGHLIGHTS The ability to create, distribute and exploit knowledge is increasingly central to competitive advantage, wealth creation and better standards of living. The STI Scoreboard 2001 presents the
Labor Market Dropouts and Trends in the Wages of Black and White Men
 Industrial & Labor Relations Review Volume 56 Number 4 Article 5 2003 Labor Market Dropouts and Trends in the Wages of Black and White Men Chinhui Juhn University of Houston Recommended Citation Juhn,
Summary of observations and suggestions on the two sets of joint proposals for amendments to the Code of the Maritime Labour Convention, 2006
 STCMLC/2014/1 INTERNATIONAL LABOUR ORGANIZATION International Labour Standards Department Sectoral Activities Department Summary of observations and suggestions on the two sets of joint proposals for amendments
Profits and poverty: The economics of forced labour
 S$150,000,000,000 Profits and poverty: The economics of forced labour EMBARGO Do not publish or distribute before 00.01 GMT on Tuesday 20 May 2014 EMBARGO Ne pas publier avant 00.01 GMT le mardi 20 mai
Trends in inequality worldwide (Gini coefficients)
") Section 2 Impact of trade on income inequality As described above, it has been theoretically and empirically proved that the progress of globalization as represented by trade brings benefits in the form
Section 2 Impact of trade on income inequality As described above, it has been theoretically and empirically proved that the progress of globalization as represented by trade brings benefits in the form
How s Life in France?
 How s Life in France? November 2017 Relative to other OECD countries, France s average performance across the different well-being dimensions is mixed. While household net adjusted disposable income stands
Working women have won enormous progress in breaking through long-standing educational and
 THE CURRENT JOB OUTLOOK REGIONAL LABOR REVIEW, Fall 2008 The Gender Pay Gap in New York City and Long Island: 1986 2006 by Bhaswati Sengupta Working women have won enormous progress in breaking through
Statistical Yearbook. for Asia and the Pacific
 Statistical Yearbook for Asia and the Pacific 2015 Statistical Yearbook for Asia and the Pacific 2015 Sustainable Development Goal 1 End poverty in all its forms everywhere 1.1 Poverty trends...1 1.2 Data
Reporting on ILO Standards Guide for Labour Officers in Pacific Island Member States
 Reporting on ILO Standards Guide for Labour Officers in Pacific Island Member States Reporting on ILO Standards Guide for Labour Officers in Pacific Island Member States ILO Office for Pacific Island
Short-Term Migrant Workers: The Case of Ukraine
 Short-Term Migrant Workers: The Case of Ukraine Department of Statistics Conditions of Work and Equality Department Labour Migration Branch Short-Term Migrant Workers: The Case of Ukraine Short-Term Migrant
Employment opportunities and challenges in an increasingly integrated Asia and the Pacific
 Employment opportunities and challenges in an increasingly integrated Asia and the Pacific KEIS/WAPES Training on Dual Education System and Career Guidance Kee Beom Kim Employment Specialist ILO Bangkok
California's Rising Income Inequality: Causes and Concerns Deborah Reed, February 1999
 California's Rising Income Inequality: Causes and Concerns Deborah Reed, February 1999 Copyright 1999 Public Policy Institute of California, San Francisco, CA. All rights reserved. PPIC permits short sections
Emerging Market Consumers: A comparative study of Latin America and Asia-Pacific
 Emerging Market Consumers: A comparative study of Latin America and Asia-Pacific Euromonitor International ESOMAR Latin America 2010 Table of Contents Emerging markets and the global recession Demographic
How s Life in Mexico?
 How s Life in Mexico? November 2017 Relative to other OECD countries, Mexico has a mixed performance across the different well-being dimensions. At 61% in 2016, Mexico s employment rate was below the OECD
How s Life in Austria?
 How s Life in Austria? November 2017 Austria performs close to the OECD average in many well-being dimensions, and exceeds it in several cases. For example, in 2015, household net adjusted disposable income
Ghana Lower-middle income Sub-Saharan Africa (developing only) Source: World Development Indicators (WDI) database.
 Source: World Development Indicators (WDI) database.") Knowledge for Development Ghana in Brief October 215 Poverty and Equity Global Practice Overview Poverty Reduction in Ghana Progress and Challenges A tale of success Ghana has posted a strong growth performance
Knowledge for Development Ghana in Brief October 215 Poverty and Equity Global Practice Overview Poverty Reduction in Ghana Progress and Challenges A tale of success Ghana has posted a strong growth performance
Human Development Indices and Indicators: 2018 Statistical Update. Indonesia
 Human Development Indices and Indicators: 2018 Statistical Update Briefing note for countries on the 2018 Statistical Update Introduction Indonesia This briefing note is organized into ten sections. The
How s Life in the United States?
 How s Life in the United States? November 2017 Relative to other OECD countries, the United States performs well in terms of material living conditions: the average household net adjusted disposable income
Human Development Indices and Indicators: 2018 Statistical Update. Eritrea
 Human Development Indices and Indicators: 2018 Statistical Update Briefing note for countries on the 2018 Statistical Update Introduction Eritrea This briefing note is organized into ten sections. The
RESEARCH BRIEF: The State of Black Workers before the Great Recession By Sylvia Allegretto and Steven Pitts 1
 July 23, 2010 Introduction RESEARCH BRIEF: The State of Black Workers before the Great Recession By Sylvia Allegretto and Steven Pitts 1 When first inaugurated, President Barack Obama worked to end the
DECENT WORK IN TANZANIA
 International Labour Office DECENT WORK IN TANZANIA What do the Decent Work Indicators tell us? INTRODUCTION Work is central to people's lives, and yet many people work in conditions that are below internationally
Note by Central Agency for Public Mobilization and Statistics (Egypt) 1
 1") Distr.: General 10 February 2012 English only Economic Commission for Europe Conference of European Statisticians Group of Experts on Gender Statistics Work Session on Gender Statistics Geneva, 12-14 March
Distr.: General 10 February 2012 English only Economic Commission for Europe Conference of European Statisticians Group of Experts on Gender Statistics Work Session on Gender Statistics Geneva, 12-14 March
Understanding the dynamics of labor income inequality in Latin America (WB PRWP 7795)
") Understanding the dynamics of labor income inequality in Latin America (WB PRWP 7795) Carlos Rodríguez-Castelán (World Bank) Luis-Felipe López-Calva (UNDP) Nora Lustig (Tulane University) Daniel Valderrama
Understanding the dynamics of labor income inequality in Latin America (WB PRWP 7795) Carlos Rodríguez-Castelán (World Bank) Luis-Felipe López-Calva (UNDP) Nora Lustig (Tulane University) Daniel Valderrama
Human Development Indices and Indicators: 2018 Statistical Update. Pakistan
 Human Development Indices and Indicators: 2018 Statistical Update Briefing note for countries on the 2018 Statistical Update Introduction Pakistan This briefing note is organized into ten sections. The
How s Life in Finland?
 How s Life in Finland? November 2017 In general, Finland performs well across the different well-being dimensions relative to other OECD countries. Despite levels of household net adjusted disposable income
STRUCTURAL TRANSFORMATION AND WOMEN EMPLOYMENT IN SOUTH ASIA
 International Journal of Human Resource & Industrial Research, Vol.3, Issue 2, Feb-Mar, 2016, pp 01-15 ISSN: 2349 3593 (Online), ISSN: 2349 4816 (Print) STRUCTURAL TRANSFORMATION AND WOMEN EMPLOYMENT IN
GDP per capita was lowest in the Czech Republic and the Republic of Korea. For more details, see page 3.
 International Comparisons of GDP per Capita and per Hour, 1960 9 Division of International Labor Comparisons October 21, 2010 Table of Contents Introduction.2 Charts...3 Tables...9 Technical Notes.. 18
Selected macro-economic indicators relating to structural changes in agricultural employment in the Slovak Republic
 Selected macro-economic indicators relating to structural changes in agricultural employment in the Slovak Republic Milan Olexa, PhD 1. Statistical Office of the Slovak Republic Economic changes after
The impacts of minimum wage policy in china
 The impacts of minimum wage policy in china Mixed results for women, youth and migrants Li Shi and Carl Lin With support from: The chapter is submitted by guest contributors. Carl Lin is the Assistant
Tripartite Declaration of Principles concerning Multinational Enterprises and Social Policy
 Tripartite Declaration of Principles concerning Multinational Enterprises and Social Policy Fifth Edition - March 2017 Tripartite Declaration of Principles concerning Multinational Enterprises and Social
Poverty in the Third World
 11. World Poverty Poverty in the Third World Human Poverty Index Poverty and Economic Growth Free Market and the Growth Foreign Aid Millennium Development Goals Poverty in the Third World Subsistence definitions
The Impact of Interprovincial Migration on Aggregate Output and Labour Productivity in Canada,
 The Impact of Interprovincial Migration on Aggregate Output and Labour Productivity in Canada, 1987-26 Andrew Sharpe, Jean-Francois Arsenault, and Daniel Ershov 1 Centre for the Study of Living Standards
Human Development Indices and Indicators: 2018 Statistical Update. Cambodia
 Human Development Indices and Indicators: 2018 Statistical Update Briefing note for countries on the 2018 Statistical Update Introduction Cambodia This briefing note is organized into ten sections. The
Persistent Inequality
 Canadian Centre for Policy Alternatives Ontario December 2018 Persistent Inequality Ontario s Colour-coded Labour Market Sheila Block and Grace-Edward Galabuzi www.policyalternatives.ca RESEARCH ANALYSIS
Convention on the Elimination of All Forms of Discrimination against Women
 United Nations CEDAW/C/2009/I/3/Add.4 Convention on the Elimination of All Forms of Discrimination against Women Distr.: General 12 January 2009 Original: English Committee on the Elimination of Discrimination
The Jus Semper Global Alliance Living Wages North and South
 The Jus Semper Global Alliance Living Wages North and South January 2010 The Jus Semper Global Alliance 2 Table of Contents Argument for wage equalization classic problem scenario 4 Argument for wage equalization
REPORT FROM THE COMMISSION TO THE COUNCIL, THE EUROPEAN PARLIAMENT, THE EUROPEAN ECONOMIC AND SOCIAL COMMITTEE AND THE COMMITTEE OF THE REGIONS
 EN EN EN EUROPEAN COMMISSION Brussels, xxx COM(2009) yyy final REPORT FROM THE COMMISSION TO THE COUNCIL, THE EUROPEAN PARLIAMENT, THE EUROPEAN ECONOMIC AND SOCIAL COMMITTEE AND THE COMMITTEE OF THE REGIONS
Mainstreaming gender perspectives to achieve gender equality: What role can Parliamentarians play?
 Mainstreaming gender perspectives to achieve gender equality: What role can Parliamentarians play? Briefing Paper for Members of the Parliament of the Cook Islands August 2016 Prepared by the Ministry
ILO Global Estimates on International Migrant Workers
 ILO Global Estimates on International Migrant Workers Results and Methodology Executive Summary Labour Migration Branch Conditions of Work and Equality Department Department of Statistics ILO Global Estimates
Addressing the situation and aspirations of youth
 Global Commission on THE FUTURE OF WORK issue brief Prepared for the 2nd Meeting of the Global Commission on the Future of Work 15 17 February 2018 Cluster 1: The role of work for individuals and society
CEDAW/C/2008/I/3/Add.4
 United Nations Convention on the Elimination of All Forms of Discrimination against Women CEDAW/C/2008/I/3/Add.4 Distr.: General 29 November 2007 Original: English Committee on the Elimination of Discrimination
Part 1: Focus on Income. Inequality. EMBARGOED until 5/28/14. indicator definitions and Rankings
 Part 1: Focus on Income indicator definitions and Rankings Inequality STATE OF NEW YORK CITY S HOUSING & NEIGHBORHOODS IN 2013 7 Focus on Income Inequality New York City has seen rising levels of income
G L O B A L E M P L O Y M E N T T R E N D S F O R W O M E N
 G L O B A L E M P L O Y M E N T T R E N D S F O R W O M E N 2 0 0 4 G L O B A L E M P L O Y M E N T T R E N D S F O R W O M E N 1. Overview One of the most striking phenomena of recent times has been the
Global Trends in Wages
 Global Trends in Wages Major findings and their implications for future wage policies Malte Luebker, Senior Regional Wage Specialist ILO Regional Office for Asia and the Pacific, Bangkok Email: luebker@ilo.org
Italy s average level of current well-being: Comparative strengths and weaknesses
 How s Life in Italy? November 2017 Relative to other OECD countries, Italy s average performance across the different well-being dimensions is mixed. The employment rate, about 57% in 2016, was among the
Rural and Urban Migrants in India:
 Rural and Urban Migrants in India: 1983-2008 Viktoria Hnatkovska and Amartya Lahiri July 2014 Abstract This paper characterizes the gross and net migration flows between rural and urban areas in India
Inequality in Labor Market Outcomes: Contrasting the 1980s and Earlier Decades
 Inequality in Labor Market Outcomes: Contrasting the 1980s and Earlier Decades Chinhui Juhn and Kevin M. Murphy* The views expressed in this article are those of the authors and do not necessarily reflect
CEDAW/C/2002/II/3/Add.4
 United Nations Convention on the Elimination of All Forms of Discrimination against Women CEDAW/C/2002/II/3/Add.4 Distr.: General 8 May 2002 Original: English Committee on the Elimination of Discrimination
Revisiting Socio-economic policies to address poverty in all its dimensions in Middle Income Countries
 Revisiting Socio-economic policies to address poverty in all its dimensions in Middle Income Countries 8 10 May 2018, Beirut, Lebanon Concept Note for the capacity building workshop DESA, ESCWA and ECLAC
Poverty Profile. Executive Summary. Kingdom of Thailand
 Poverty Profile Executive Summary Kingdom of Thailand February 2001 Japan Bank for International Cooperation Chapter 1 Poverty in Thailand 1-1 Poverty Line The definition of poverty and methods for calculating
Korea s average level of current well-being: Comparative strengths and weaknesses
 How s Life in Korea? November 2017 Relative to other OECD countries, Korea s average performance across the different well-being dimensions is mixed. Although income and wealth stand below the OECD average,
How s Life in Denmark?
 How s Life in Denmark? November 2017 Relative to other OECD countries, Denmark generally performs very well across the different well-being dimensions. Although average household net adjusted disposable
How s Life in the Slovak Republic?
 How s Life in the Slovak Republic? November 2017 Relative to other OECD countries, the average performance of the Slovak Republic across the different well-being dimensions is very mixed. Material conditions,
How s Life in Australia?
 How s Life in Australia? November 2017 In general, Australia performs well across the different well-being dimensions relative to other OECD countries. Air quality is among the best in the OECD, and average
How s Life in Portugal?
 How s Life in Portugal? November 2017 Relative to other OECD countries, Portugal has a mixed performance across the different well-being dimensions. For example, it is in the bottom third of the OECD in
How s Life in Slovenia?
 How s Life in Slovenia? November 2017 Slovenia s average performance across the different well-being dimensions is mixed when assessed relative to other OECD countries. The average household net adjusted
How s Life in the United Kingdom?
 How s Life in the United Kingdom? November 2017 On average, the United Kingdom performs well across a number of well-being indicators relative to other OECD countries. At 74% in 2016, the employment rate
How s Life in the Netherlands?
 How s Life in the Netherlands? November 2017 In general, the Netherlands performs well across the OECD s headline well-being indicators relative to the other OECD countries. Household net wealth was about
Insecure work and Ethnicity
 Insecure work and Ethnicity Executive Summary Our previous analysis showed that there are 3.2 million people who face insecurity in work in the UK, either because they are working on a contract that does
How s Life in Switzerland?
 How s Life in Switzerland? November 2017 On average, Switzerland performs well across the OECD s headline well-being indicators relative to other OECD countries. Average household net adjusted disposable
Poverty in Buffalo-Niagara
 Cornell University ILR School DigitalCommons@ILR Buffalo Commons Centers, Institutes, Programs 9-2014 Poverty in Buffalo-Niagara Partnership for the Public Good Follow this and additional works at: http://digitalcommons.ilr.cornell.edu/buffalocommons
vi. rising InequalIty with high growth and falling Poverty
 43 vi. rising InequalIty with high growth and falling Poverty Inequality is on the rise in several countries in East Asia, most notably in China. The good news is that poverty declined rapidly at the same
How s Life in New Zealand?
 How s Life in New Zealand? November 2017 On average, New Zealand performs well across the different well-being indicators and dimensions relative to other OECD countries. It has higher employment and lower
GLOBALIZATION, DEVELOPMENT AND POVERTY REDUCTION: THEIR SOCIAL AND GENDER DIMENSIONS
 TALKING POINTS FOR THE EXECUTIVE SECRETARY ROUNDTABLE 1: GLOBALIZATION, DEVELOPMENT AND POVERTY REDUCTION: THEIR SOCIAL AND GENDER DIMENSIONS Distinguished delegates, Ladies and gentlemen: I am pleased
Explanations of Slow Growth in Productivity and Real Wages
 Explanations of Slow Growth in Productivity and Real Wages America s Greatest Economic Problem? Introduction Slow growth in real wages is closely related to slow growth in productivity. Only by raising
Committee: Special Committee on the Sustainable Development Goals
 Committee: Special Committee on the Sustainable Development Goals Question of: Reduced Inequalities (SDG 10) Students Officer: Marta Olaizola Introduction: Inequality is becoming one of the biggest social
8. REGIONAL DISPARITIES IN GDP PER CAPITA
 8. REGIONAL DISPARITIES IN GDP PER CAPITA GDP per capita varies significantly among OECD countries (Figure 8.1). In 2003, GDP per capita in Luxembourg (USD 53 390) was more than double the OECD average
Charting South Korea s Economy, 1H 2017
 Charting South Korea s Economy, 1H 2017 Designed to help executives interpret economic numbers and incorporate them into company s planning. Publication Date: January 3 rd, 2017 Next Issue: To be published
Social Stratification: Sex and Gender Part III
 Social Stratification: Sex and Gender Part III Culture does not make people. People make culture. If it is true that the full humanity of women is not our culture, then we can and must make it our culture.
The Global Gender Pay gap. Incomes Data Services
 Incomes Data Services 23 College Hill London EC4R 2RP Telephone: 020 7429 6800 Facsimile: 020 7393 8081 E-mail: ids@incomesdata.co.uk Website: www.incomesdata.co.uk The Global Gender Pay gap Incomes Data
How s Life in Greece?
 How s Life in Greece? November 2017 Relative to other OECD countries, Greece has a mixed performance across the different well-being dimensions. Material conditions in Greece are generally below the OECD
SUMMARY LABOUR MARKET CONDITIONS POPULATION AND LABOUR FORCE. UNRWA PO Box Sheikh Jarrah East Jerusalem
 UNRWA PO Box 19149 Sheikh Jarrah East Jerusalem +97225890400 SUMMARY The Gaza labour market in secondhalf 2010 (H2 2010) showed growth in employment and unemployment relative to H2 2009. Comparing H1 and
Migrant Workers: The Case of Moldova
 TECHNICAL REPORT Migrant Workers: The Case of Moldova The ILO Labour Force Migration Survey (LFMS) was conducted in the Republic of Moldova in the last quarter of 2012 in order to assess the extent of
Quarterly Labour Market Report. February 2017
 Quarterly Labour Market Report February 2017 MB14052 Feb 2017 Ministry of Business, Innovation and Employment (MBIE) Hikina Whakatutuki - Lifting to make successful MBIE develops and delivers policy, services,
LABOUR MARKET SLACK. Article published in the Quarterly Review 2019:1, pp
 LABOUR MARKET SLACK Article published in the Quarterly Review 019:1, pp. 37-1 BOX : LABOUR MARKET SLACK 1 The labour market in Malta has experienced a strong recovery in recent years, registering a marked
GLOBAL ECONOMIC CRISIS & GENDER EQUALITY THREATS, OPPORTUNITIES AND NECESSITIES
 GLOBAL ECONOMIC CRISIS & GENDER EQUALITY THREATS, OPPORTUNITIES AND NECESSITIES ICA Gender Equality Committee Seminar: Global Crisis: Gender Opportunity? 17 November 2009 Eva Majurin COOPAfrica, ILO Dar
How s Life in Estonia?
 How s Life in Estonia? November 2017 Relative to other OECD countries, Estonia s average performance across the different well-being dimensions is mixed. While it falls in the bottom tier of OECD countries
The Demography of the Labor Force in Emerging Markets
 The Demography of the Labor Force in Emerging Markets David Lam I. Introduction This paper discusses how demographic changes are affecting the labor force in emerging markets. As will be shown below, the
Asia and the Pacific s Perspectives on the Post-2015 Development Agenda
 Ver: 2 Asia and the Pacific s Perspectives on the Post-2015 Development Agenda Dr. Noeleen Heyzer Executive Secretary United Nations Economic and Social Commission for Asia and the Pacific (ESCAP) Bangkok
Asia-Pacific to comprise two-thirds of global middle class by 2030, Report says
 Strictly embargoed until 14 March 2013, 12:00 PM EDT (New York), 4:00 PM GMT (London) Asia-Pacific to comprise two-thirds of global middle class by 2030, Report says 2013 Human Development Report says
How s Life in Germany?
 How s Life in Germany? November 2017 Relative to other OECD countries, Germany performs well across most well-being dimensions. Household net adjusted disposable income is above the OECD average, but household