Trade in Developing East Asia
|
|
|
- Rodger Singleton
- 5 years ago
- Views:
Transcription
1 Public Disclosure Authorized Policy Research Working Paper 8533 WPS8533 Public Disclosure Authorized Public Disclosure Authorized Trade in Developing East Asia How It Has Changed and Why It Matters Cristina Constantinescu Aaditya Mattoo Michele Ruta Public Disclosure Authorized East Asia and the Pacific Region Development Research Group Macroeconomics, Trade and Investment Global Practice July 218
2 Policy Research Working Paper 8533 Abstract East Asia, for long the epitome of successful engagement in trade, faces serious challenges: technological change that may threaten the very model of labor intensive industrialization and a backlash against globalization that may reduce access to important markets. A detailed analysis of the evolution of East Asia s trade and trade policy in goods and services leads to the conclusion that how East Asia copes with these global challenges will depend on how it addresses three more proximate national and regional challenges. The first is the emergence of one East Asian country, China, as a global trade giant accounting for nearly one-seventh of global exports and one-tenth of global imports which is fundamentally altering the trading patterns and opportunities of its neighbors. The second is the asymmetric implementation of national reform remarkable openness to goods trade and investment coexists with relative restrictiveness of services policies which is affecting the evolution of comparative advantage and productivity in each country. The third is the divergence between the relatively shallow and fragmented agreements that regulate the region s trade and investment and the growing importance of regional and global value chains as crucial drivers of productivity growth. This paper is a product of the East Asia and the Pacific Region, Development Research Group, and the Macroeconomics, Trade and Investment Global Practice. It is part of a larger effort by the World Bank to provide open access to its research and make a contribution to development policy discussions around the world. Policy Research Working Papers are also posted on the Web at The authors may be contacted at ineagu@worldbank.org, amattoo@worldbank.org, and mruta@worldbank.org The Policy Research Working Paper Series disseminates the findings of work in progress to encourage the exchange of ideas about development issues. An objective of the series is to get the findings out quickly, even if the presentations are less than fully polished. The papers carry the names of the authors and should be cited accordingly. The findings, interpretations, and conclusions expressed in this paper are entirely those of the authors. They do not necessarily represent the views of the International Bank for Reconstruction and Development/World Bank and its affiliated organizations, or those of the Executive Directors of the World Bank or the governments they represent. Produced by the Research Support Team
3 Trade in Developing East Asia: How It Has Changed and Why It Matters * Cristina Constantinescu, Aaditya Mattoo, Michele Ruta ** Keywords: trade policy, goods trade, services trade, China, trade agreements, global value chains JEL codes: F13, F14, F15, F63 * This study was prepared as a background paper for the East Asia Regional Flagship report, A Resurgent East Asia: Navigating a Changing World, and has benefited from valuable guidance and comments from Andrew Mason and Sudhir Shetty. We are also grateful for financial support from the World Bank s Multi Donor Trust Fund for Trade and Development and Strategic Research Program. The findings in this paper do not necessarily represent the views of the World Bank s Board of Executive Directors or the governments they represent. Any errors or omissions are the authors responsibility. ** World Bank, 1818 H Street, Washington, D.C
4 1. INTRODUCTION East Asia has for long been a paragon of successful engagement in trade. Dramatic growth in exports, stimulated by openness to foreign investment, has rapidly expanded incomes and shrunk poverty. Sustaining this success, however, faces challenges. Some of these are global, notably technological change that may threaten the very model of labor intensive industrialization, and a backlash against globalization that may reduce access to some of the most important markets. How East Asia copes with these global challenges will depend on how it addresses three more proximate national and regional challenges, which are the focus of this paper. The first is the emergence of one East Asian country, China, as a global trade giant accounting for nearly one seventh of global exports and one tenth of global imports which is fundamentally altering the trading patterns and opportunities of its neighbors. The second is the asymmetric implementation of national reform remarkable openness to goods trade and investment that coexists with relative restrictiveness of services policies which is affecting the evolution of comparative advantage and productivity in each country. The third is the divergence between the relatively shallow and fragmented agreements that regulate the region s trade and investment and the growing importance of regional and global value chains as crucial drivers of productivity growth. Developing East Asia s trade growth has been impressive in the aggregate but uneven across countries and sectors and over time. The region today accounts for about 15 percent of world trade, up from 6 percent in China, of course, stands out, with a 7 percent share today of the group s international trade. However, countries trade performance diverged in the 2s. First China s and then Vietnam and Cambodia s impressive growth in manufacturing exports, contrasted with the slower growth of earlier dynamos, Malaysia, Thailand and Indonesia, and there are now signs that China s manufacturing growth itself may be reaching a plateau. Mining products have dominated the trade growth of Mongolia and Myanmar (and to a lesser extent, Indonesia). Services trade growth has been impressive only in the Philippines, and services account on average for less than 2 percent of the region s total exports. Even though East Asia remains vulnerable to global developments, the stake in trade within the region is growing. East Asia outperformed the growth of the rest of the world, but the region has not been spared by the global trade slowdown that started in 212. At the same time, regional trade among developing East Asian economies has progressively increased. Intra developing East Asia trade was about 5 percent in the early 199s and is close to 2 percent today. This trend reflects the shift towards China as the center of gravity of trade for these economies. For countries in the region, the share of exports to China ranges between 1 and 3 percent, and for Mongolia it is as high as 8 percent. The countries in the region have taken divergent paths in response to China s emergence, depending on their stage of development and pattern of comparative advantage. Most of the relatively industrialized countries Malaysia, Thailand, the Philippines and even Indonesia have been hurt by direct competition at home and abroad from China in manufactured goods. But countries have also benefited: from increased Chinese demand, especially for services (e.g. 2
5 Philippines, Thailand and the Lao People s Democratic Republic) and commodities (Indonesia, Myanmar, Lao PDR, and Mongolia); from integration into China linked value chains (Malaysia, Vietnam); and from relocation of Chinese production (Vietnam and Cambodia). Going forward, further integration with China will increase competitive pressures in final goods markets, but also provide better access to imported inputs and a growing demand for commodities and services. Moreover, as Chinese manufacturing competitiveness declines due to higher labor costs, developing East Asian countries can be expected to gain market shares in third markets and see an increase in the relocation of production from China. The paths taken by individual countries have also been determined by the pattern of national reform. In the most dynamic China itself, as well as Vietnam and Cambodia WTO accession induced a move away from state owned monopolies to more competitive private provision of telecommunications, financial, transport and a range of other services. Even though their services regimes are still not fully open, the radical reform has delivered dramatic improvements in services productivity and access, international connectivity and manufacturing productivity. In the less dynamic Indonesia, Thailand, Myanmar, and even Malaysia and the Philippines initial regimes were less closed but the approach to reform has been more lethargic. The irony is that countries that built their manufacturing success on the back of openness to FDI have resisted similar opening in services, sacrificing productivity not just in services but also in manufacturing. A key conclusion of this paper is that further services reform is vital for continued growth, because it will affect productivity in services and in other sectors, including by influencing the evolution of comparative advantage and participation in global value chains. In fact, the increased fragmentation of production across the region has been an important factor in trade and productivity growth. Developing East Asian countries have the highest share in the world of foreign value added in gross exports a measure of backward specialization in global value chains. Traditionally, most of the intermediate inputs used in production would come from advanced economies. But today the increasing backward participation in global value chains by countries like Vietnam is in part the result of China s growing exports of sophisticated intermediate inputs. The rise of both global and regional value chains has been an important driver of productivity growth for developing East Asian countries. The reason is that GVCs lead to technology spillovers, learning externalities, better inputs and a more efficient international division of labor. On average, a 1 percent increase in the backward GVC participation of manufacturing sectors has increased labor productivity by 1.4 percent. Differently from other areas in the world such as Europe and North America, much of the rise of trade, investment and global value chains in East Asia took place despite the presence of relatively shallow trade agreements. These agreements lowered tariffs but led to relatively weak commitments in areas such as services, investment and intellectual property rights. All countries are now members of the World Trade Organization (WTO). The most recent accessions include Cambodia (24), Vietnam (27) and Lao PDR (213). ASEAN the Association of East Asia Nations which includes all East Asian developing countries except for Mongolia and China has progressively widened its scope and signed new agreements with third countries such as Australia, New Zealand, India and the Republic of Korea in the 2s. But these agreements are 3
6 still relatively shallow and efforts are underway to negotiate deeper trade rules on investment, services, competition, intellectual property rights protection, and government procurement, as in the context of the Comprehensive and Progressive Trans Pacific Partnership (CPTPP). A second key conclusion of this paper is that sustaining future growth in trade, investment and GVC participation, and hence productivity growth, will require deeper integration through a more coherent set of trade rules within the region and with the rest of the world. The rest of the paper is organized as follows. Section 2 establishes stylized facts on the trade landscape of East Asian developing countries. Section 3 focuses on four issues: the rise of China and its economic rebalancing; asymmetric trade opening and restrictions on services trade; the rise of global value chains; and the importance of deep trade agreements. Section 4 concludes. 2. THE EVOLUTION OF DEVELOPING EAST ASIA S TRADE East Asia s developing countries account today for about 15 percent of the world trade up from 6 percent in 1995 and for 8 percent of the global FDI stock up from 5 percent in There are currently 1 developing countries in the East Asia region, namely China, Mongolia, and eight of the Association of Southeast Asian Nations (ASEAN) members: Cambodia, Indonesia, Lao PDR, Malaysia, Myanmar, the Philippines, Thailand and Vietnam. These countries collectively traded 6.3 trillion USD in 215 and absorbed almost 2 trillion USD of the global FDI stock, due in great part to the contribution of China which accounts for 7 percent of the international trade in goods and services of the developing East Asian group and for 62 percent of its FDI stock. The group s dynamism over time is noteworthy, especially when it comes to exports of goods and services, which have tripled as a share of world trade since Developing East Asia s trade shows considerable heterogeneity at the country level. The trading patterns and specialization focus of the countries in the region show divergent paths, depending on their stage of development, pattern of comparative advantage, and approach to reform. The big changes have been the emergence of China and the rise in global and regional value chains. In this section, we document these developments. 1 Developing East Asia includes some of the most active participants in trade and investment in the world. As indicated in tables A.1 through A.4, more than half of the developing East Asian countries are today among or close to the first 5 largest traders and FDI recipients in the world. Some of these countries (China, Indonesia, Malaysia, Philippines, Thailand) ranked highly in previous decades as well, while others have caught up, sometimes at impressive rates. For example, Vietnam has become the 25 th largest merchandise importer by 215, climbing up from the 82 th and the 61 th positions in 198 and 199, respectively. Among the developing East Asian countries, China is particularly noteworthy for its scale and dynamism in trade and investment. Accounting for almost 14 percent of world goods exports and 1 percent of world goods imports in 215, China has stood out as the world s largest exporter since 29 (up from the 12 th place in 199), and the world s second largest importer after the United States since 29 (up from the 15 th place in 199). China has also ranked second and fifth in services imports, respectively, since 213. In addition, it has been a preferred destination for FDI for many years. As of 215, it hosted 5 percent of the global FDI. Particularly remarkable is the recent surge in China s direct investment abroad. In 215, China totaled 4 percent of the global outward direct investment, up from negligible shares in 25 and before. In fact, China s outward direct investment flows surpassed the FDI inflows for the first time in
7 a. Uneven trade growth The trade performance of developing East Asian countries has been more dynamic than that of the rest of the world. The trends in the overall trade flows of developing East Asian countries reveal several specific features (Figure 1). First, the group s trade growth has generally outperformed global trade growth for the past 3 decades (see Figure A.1 for years prior to 25). 2 Second, the trade slowdown affecting global trade volumes since 212 has not spared developing East Asia. 3 The group s trade volumes have slowed from a yearly average growth rate of 13 percent during to 3.8 percent since 212. The decline is smaller, yet still apparent when China is excluded from the aggregate, with the growth rate falling from 9.8 percent during to 4 percent after 212. Third, developing East Asia s exports of goods and trade in services have grown at comparable rates in the past decade. This is in contrast with the global trends, which point to a resilience of services trade growth relative to goods trade growth during the Great Recession and the recent trade slowdown. The gap between the growth in developing East Asia s goods imports and services imports is mostly due to the recent growth in China s travel imports. Three periods showing divergent paths can be identified in the growth experience of developing East Asian countries. An examination of the growth of goods and services export values by country and over time shows that developing East Asian countries followed different and often diverging routes for their exports, in part influenced by China s emergence. During the period that preceded the Asian Financial Crisis, goods exports were growing at comparable rates for most countries in the group (Figure 2a). Services exports were relatively more dynamic than goods exports, yet of significantly smaller magnitude (except in the cases of Thailand and the Philippines) and were mostly accounted for by travel exports (except for the Philippines, where other business services already had a significant contribution to services exports). The 2s brought a major split in the ranks (Figure 2b). China s goods exports accelerated markedly, driven by rapid growth in manufacturing, and a switch in focus from apparel to electronic equipment. Vietnam followed in China s footsteps, replicating its neighbor s earlier emphasis on apparel. Cambodia, too, grew its exports based on apparel products. Thailand, Malaysia and Indonesia stayed broadly at the same levels of 2 Two notable exceptions are the period of the Asian Financial crisis and year 215. In 215, a combination of factors including sluggish external demand, the commodity price decline, and the macroeconomic rebalancing in China caused trade growth in East Asia to fall below the world aggregate (Constantinescu et al., 216). 3 The recent trade slowdown refers to the post 212 sluggishness in the growth of global trade volume relative to the past rates and to real GDP growth. After bouncing back from the historic low of the Great Recession in 21, world trade grew by 7. percent in 211, slowed to 2.8 percent in 212 and remained around 3 percent until 216. This 3 percent is less than half the average yearly trade growth of 7 percent during period Moreover, it is in line with the GDP growth of the recent years, whereas before the crisis, and especially in the 199s, trade was growing 2 and even 3 times faster than real GDP (Constantinescu et al., 215). 5
8 growth, while the Philippines experienced a deceleration in the growth of its goods exports. Indonesia, Myanmar and Mongolia focused on commodity exports, reaping benefits from the rise of China s imports. For most countries, goods exports growth increased relative to services exports growth. One notable exception is the Philippines, which continued its focus on other business services exports. After the Great Recession, growth rates in export values throughout the region have been burdened by two situations (Figure 2c): the global trade slowdown and the decline in the commodity prices (particularly accelerated for fuels in 214 and 215). As a result, all points on the scatterplot appear closer to the origin. Yet many of the previous patterns remained and some accentuated: manufacturing exports grew faster in Vietnam and Cambodia, diverging significantly from the growth patterns of the old guard (Malaysia, Thailand, Indonesia). Export values of Indonesia, Myanmar and Mongolia were hit more severely by the commodity price shock. The Philippines continued to rely on services via other business services, while the services performance of Thailand, Cambodia, Myanmar and Lao PDR was tied to tourism. Figure 1. The aggregate perspective: developing East Asian countries goods and services trade performance, (Index of trade in current US dollars: 25=1) b. IMPORTS a. EXPORTS Index dev. EA goods exports dev. EA services exports world goods trade world services trade dev. EA goods imports dev. EA services imports world goods trade world services trade 2.3 Index Source: World Trade Organization (WTO) and authors calculations. Notes: World trade is represented by the average of exports and imports. Labels indicate services shares in percent
9 Figure 2. The country perspective: developing East Asian countries exports of goods and services in current U.S. dollars, (percent change from previous year, averaged by period) Average yearly growth of goods exports (%) a. Period b. Period c. Period MNG THACHN IDN MYS PHL MMR Average yearly growth of services exports (%) Average yearly growth of goods exports (%) MMR LAO MYS Sources: WTO, IMF Balance of Payments. Notes: Each panel includes a 45 degree line. Outer circles indicate goods and services trade values, and inner shaded circles denote services trade. Data for Vietnam not available before Lao PDR and Myanmar data are outliers in the pre Asian Financial Crisis period, hence are not shown. THA CHN VNM PHL IDN KHM MNG Average yearly growth of services exports (%) Average yearly growth of goods exports (%) CHN VNM MNG PHL THA LAO KHM MYS IDN Average yearly growth of services exports (%) 7
10 b. Changing specialization i. Goods trade The specialization patterns within goods trade differ across countries (Figure 3). China, Malaysia, the Philippines, Thailand and Vietnam experienced increasing specialization in manufacturing relative to the rest of the world over the previous decades. Mongolia and Myanmar continued to focus mostly on mining exports. For Indonesia, the share of manufacturing in total merchandise exports has increased from less than 1 percent in 198 to more than 4 percent in 215, yet mining products still dominate the country s export basket. As indicated in Table A.5, manufacturing as a share of goods trade grew significantly during the 198s and 199s and then stayed broadly at the same level in countries like China, Indonesia, Malaysia, Philippines, and Thailand. In contrast, Vietnam experienced an increase of about 3 percentage points, between 25 and 215. Figure 3. Share of manufacturing in goods exports (percent) 1 CHN KHM 9 PHL VNM 215 or latest year with data IDN THA MYS MMR 1 MNG or earliest year with data Sources: WTO Note: ISO3 country codes are indicated in labels. See Table 1 for country names. Within manufacturing, there is evidence of significant heterogeneity in exporting patterns across countries and over time (Table 1). Some countries have been and still are focused on light manufacturing (Cambodia) while others have started upgrading to more sophisticated manufacturing (Vietnam). Countries that began industrialization earlier are currently trading heavily in electronics and transport industries (Malaysia, Thailand, Philippines). China has a 8
11 diverse pattern of specialization and has moved over time from apparel and textiles to electronics, machinery and equipment. A concern with gross trade data flows is that they do not provide a sufficiently clear picture about the precise role of a country in the value chain for the product. It is, for instance, possible that a country like Vietnam may just assemble sophisticated products. We return to this issue below. Table 1. Specialization within manufacturing: three industries with the largest shares in total manufacturing exports, 2 and 215. ISO3 code Country Year 1st ISIC Rev. 3 industry Share (%) 2nd ISIC Rev. 3 industry Share (%) 3rd ISIC Rev. 3 industry Share (%) Sum of share CHN China 2 18_APPAREL 12 32_RADIO, TV & COMMUNICATION EQUIP _TEXTILES _RADIO, TV & COMMUNICATION EQUIP _MACHINERY&EQUIPMENT 9 3_OFFICE, ACCOUNTING & COMPUTING EQUIP IDN Indonesia 2 32_RADIO, TV & COMMUNICATION EQUIP. 1 18_APPAREL 9 17_TEXTILES _FOOD & BEVERAGES 25 24_CHEMICALS 1 27_BASIC METALS 7 42 KHM Cambodia 2 18_APPAREL 47 17_TEXTILES 25 22_PUBLISHING & PRINTING _APPAREL 52 17_TEXTILES 23 19_LEATHER 9 84 LAO Lao PDR _BASIC METALS 36 15_FOOD & BEVERAGES 15 32_RADIO, TV & COMMUNICATION EQUIP MMR Myanmar _FOOD & BEVERAGES 35 18_APPAREL 31 27_BASIC METALS 14 8 MNG Mongolia 2 17_TEXTILES 28 18_APPAREL 26 27_BASIC METALS _BASIC METALS 77 17_TEXTILES 11 19_LEATHER 5 93 MYS Malaysia 2 32_RADIO, TV & COMMUNICATION EQUIP. 39 3_OFFICE, ACCOUNTING & COMPUTING EQUIP _FOOD & BEVERAGES _RADIO, TV & COMMUNICATION EQUIP _FOOD & BEVERAGES 11 24_CHEMICALS 1 48 PHL Philippines 2 32_RADIO, TV & COMMUNICATION EQUIP. 52 3_OFFICE, ACCOUNTING & COMPUTING EQUIP _APPAREL _RADIO, TV & COMMUNICATION EQUIP. 36 3_OFFICE, ACCOUNTING & COMPUTING EQUIP _ELECTRICAL MACHINERY 11 6 THA Thailand 2 32_RADIO, TV & COMMUNICATION EQUIP _FOOD & BEVERAGES 15 3_OFFICE, ACCOUNTING & COMPUTING EQUIP _MOTOR VEHICLES 13 15_FOOD & BEVERAGES 13 24_CHEMICALS 1 37 VNM Vietnam 2 15_FOOD & BEVERAGES 27 18_APPAREL 19 19_LEATHER _RADIO, TV & COMMUNICATION EQUIP _APPAREL 12 19_LEATHER 11 5 Sources: UN Comtrade (WITS) ii. Services trade Services represent a relatively small share of trade and of GDP for East Asian developing countries. With the notable exception of the Philippines, the shares of services in total exports and in GDP are low for most East Asian developing countries relative to other EAP economies and the average country in the world (Figure 4a). The gap is even more striking when we exclude travel or tourism from services (Figure 4b). Services value added as a share of GDP is lower than that in other countries in the East Asia Pacific region and the average country in the world, despite progress over time (Figure 4c). These findings point to the untapped potential of services especially other than tourism in developing East Asian economies. 9
12 Figure 4. The importances of services in developing East Asian countries trade and value added, according to the level of development a. Services exports Share of services in total exports (percent) MNG 3 2 KHM LAO PHL THA VNMIDN 1 MYS CHN MMR Log of GNI per capita b. Non travel services exports Share of services (excl. travel) in total exports (percent) MNG 1 PHL LAO KHM IDN THA CHN MYS 5 MMR VNM Log of GNI per capita c. Services value added Share of services value added in GDP (percent) PHL THA MNG MYS CHN MMR KHM LAO Log of GNI per capita Share of services in total exports (percent) 4 KHM PHL 3 MMR 2 LAO THA IDN MNG 1 MYS VNM CHN Log of GNI per capita Sources: WTO, World Bank World Development Indicators (WDI). Notes: GNI is in current US dollars calculated using the Atlas method. Vertical lines indicate thresholds for lower middle, upper middle and high income categories*. In panel b, countries with share of services in total exports greater than 4 percent are not shown: AFG, COM, CYP, DJI, GRC, LUX, KIR, CPV, CUB, MLT, IRL, LBN * world bank country and lending groups. 1 Share of services (excl. travel) in total exports (percent) Share of services value added in GDP (percent) MMR IDN KHM LAO VNM PHL MNG MYS CHN THA Log of GNI per capita PHL THA MNG MYS LAO CHN KHM IDN VNM MMR Log of GNI per capita 1
13 The composition of services exports in the developing East Asian economies varies by country and over time (Table 2). For most developing East Asian countries (Indonesia, Cambodia, Lao PDR, Myanmar, Malaysia, Philippines and Thailand), travel services exports are at around 5 percent of total services exports or more. This is not the case in China and the Philippines, where other business services exports are currently relatively larger than other services. Table 2. Importance of services in trade and in GDP, and the structure of services exports ISO3 Services exports (% of goods and services exports) Transport services (% of services exports) Travel services (% of services exports) Other services (% of services exports) Services values added (% of GDP) code Country CHN China IDN Indonesia n.a KHM Cambodia n.a LAO Lao PDR n.a MMR Myanmar n.a. n.a MNG Mongolia MYS Malaysia PHL Philippines THA Thailand VNM Vietnam n.a. n.a n.a 44.2 dev. East Asia Sources: WTO Notes: Nearest later or previous years used when data not available for 25 and 215. The aggregate for developing East Asia is a simple average. iii. Integration in global value chains Developing East Asian countries are among the most integrated into global value chains (GVCs). Their integration is mostly occurring via backward participation in GVCs that is, via using imported intermediate inputs in their exports (Figure 5a). Trade in value added (TiVA) data indicate that the share of foreign value added in gross exports in China and the other developing East Asian economies was higher than the aggregate for other regions during The levels of forward participation (intermediate exports used in other countries exports) are lower than backward participation and also lower than forward participation of other regions, except for the countries that have commodities as significant items in their export bundles, such as Indonesia (Figure 5b). 4 Based on EORA data, developing East Asia is one of the three groups of countries with the highest levels of backward participation, the other two being Western Europe and the industrialized East Asia. China s share is lower because the EORA input output tables do not account for processing trade. 11
14 Figure 5. GVC participation of China and the other developing East Asia relative to the other regions of the world (percent of gross exports). a. Backward participation in GVCs b. Forward participation in GVCs 4 China Other East Asia* Other ECS MEA Other EAS SSF World Developing East Asia (excl. China) LCN (excl. Mex) North America (incl. Mex.) SAS Western Europe 4 China Other East Asia Other ECS MEA Other EAS SSF World Developing East Asia (excl. China) LCN (excl. Mex) North America (incl. Mex.) SAS Western Europe Source: Authors calculations based on OECD Trade in Value Added (TiVA) Notes: Backward participation is measured as the share of foreign value added in the total gross exports of a country. Forward participation is a country s domestic value added that is reexported by other countries, as a share of the country s exports. * Other East Asia includes BRN, HKG, KOR, JPN, MAC, SGP, TWN; Other EAS East Asia and Pacific (all income levels) except East Asia; Other ECS Europe and Central Asia (all income levels) except Western Europe; LCN Latin America & the Caribbean (all income levels); MEA Middle East and North Africa (all income levels); SAS South Asia; SSF Sub Saharan Africa (all income levels). There are important differences in GVC participation between developing East Asian countries (Figure 6). Within developing East Asia, the share of foreign value added in gross exports ranges from high for Malaysia to low for Indonesia (as well as Lao PDR and Myanmar, based on the EORA MRIO data). In terms of dynamism, interesting patterns emerge for three countries. Vietnam s participation in GVCs has increased steadily overtime and especially in recent years, reflecting its deeper engagement into GVCs. In contrast, the Philippines saw a decline in the backward participation possibly reflecting a retreat from GVCs, rather than an upgrade to more value added intensive activities. Finally, for China, the share of foreign value added in gross exports has been declining since the mid 2s, reflecting the substitution of imported inputs for domestically produced ones. At the same time, China has gradually increased its forward participation in global value chains with increasing exports of intermediate inputs. 12
15 Figure 6. GVC participation of developing East Asian countries (percent of gross exports) a. Backward participation in GVCs b. Forward participation in GVCs CHN IDN KHM MYS CHN IDN KHM MYS 5 PHL THA VNM 35 PHL THA VNM Source: Authors calculations based on OECD TiVA Notes: Backward participation is measured as the share of foreign value added in the total gross exports of a country. Forward participation is a country s domestic value added that is reexported by other countries, as a share of the country s exports. There is also important sectoral variation in GVC participation within East Asia. Figure 7 provides further illustration of the heterogeneous ways in which developing East Asian countries participate in GVCs. Indonesia is notable for its forward participation via commodities, Philippines for its forward participation via services, while Malaysia, Vietnam, Cambodia and Thailand for the backward participation via manufacturing. A comparison between 1995 and 211 highlights the ascension of Vietnam and the decline of the Philippines as relates to the foreign value added content in gross manufacturing exports, and the increase in forward participation of Indonesia s commodity sectors and of the Philippines services sector. The increase in the reexports of the Philippines domestic value added from manufacturing is driven by the electric equipment sector. 13
16 Figure 7. GVC participation in developing East Asia, by country and sector (percent of gross exports) 25 a backward participation forward participation commodities manufacturing services commodities manufacturing services CHN IDN KHM MYS PHL THA VNM World 25 2 backward participation b. 211 forward participation commodities manufacturing services commodities manufacturing services CHN IDN KHM MYS PHL THA VNM World Source: Authors calculations based on OECD TiVA Notes: Backward participation is measured as the share of foreign value added (from commodities, manufacturing and services) in the total gross exports of a country. Forward participation is a country s domestic value added (from commodities, manufacturing and services) that is reexported by other countries, as a share of the country s exports. 14
17 c. Shifting partners Close to 5 percent of developing East Asian countries trade is with countries outside the region (Figure 8). Several composition related trends are noteworthy. First, intra developing East Asian trade increased from around 5 percent in the early 199s to 18 percent by 216. Second, the share of other East Asian countries has gradually declined, notably since the late 2s. 5 Third, while trade with other advanced economies remained roughly stable, trade with other developing countries outside the region increased, particularly in the late 2s. Figure 8. Developing East Asia: bilateral trade (billion US dollars) developing East Asia Other EAS Western Europe LCN Canada and Mexico SSF other East Asia* USA other ECS MEA SAS Source: IMF Direction of Trade Statistics (DOTS). Notes: trade is exports of goods plus imports of goods. * Other East Asia includes BRN, HKG, KOR, JPN, MAC, SGP, TWN; Other EAS East Asia and Pacific (all income levels) except East Asia; Other ECS Europe and Central Asia (all income levels) except Western Europe; LCN Latin America & the Caribbean (all income levels); MEA Middle East and North Africa (all income levels); SAS South Asia; SSF Sub Saharan Africa (all income levels). The center of gravity for developing East Asian countries has shifted toward China. Figure 9 presents the regional trading patterns for the 1 developing East Asian countries in 1995 and 215. The most striking development is the increase in exposure to China, both as an origin for goods imports and as a destination for goods exports. Other developing East Asian countries have also gained in importance as trading partners. Yet the opposite seems to be true of the other East Asia group. Even though the absolute traded values have generally expanded over time (there are exceptions, for example during crisis years), the goods trade of developing East Asian 5 Other East Asia includes Brunei; Hong Kong SAR, China; Korea; Japan; Macao SAR, China; Singapore; and Taiwan, China. 15
18 countries has been gradually shifting towards China (see trade values and more information on shares in Tables A.6 and A.7). In 215, Mongolia and Lao PDR were the most exposed developing East Asian countries to intra regional trade. Mongolia sent 8 percent of its goods exports to China, while Lao PDR traded almost exclusively with developing East Asian countries, although within this group, it traded relatively less with China. Malaysia, Indonesia and Thailand were the least exposed to China, as they traded relatively more with other East Asia. Vietnam and Cambodia s trading patterns suggest engagement in GVCs via triangular trade: importing from China and other developing East Asian countries and exporting overseas to the US and Western Europe. 6 Figure 9. Bilateral trade in goods of developing East Asian countries, selected partners a. Bilateral trade with China Exports to China (% of gross exports) Imports from China (% of gross imports) 9 5 HKG TKM SLB AGO COD IRN COG MRT IRQ CHL LAO AUS KOR OMN MYS PER MMR MAC GNQ PHL THA URY KAZ VNM IDN KHM MLI AFG MNG YEM HKG KHM VNM ETH GHA PAK IRQ KGZ PER JPN CHL NER COD AUS NGA BGD THA UZB USA KENKOR SLB TGO IDN LAO MYS PHL GMB NPL AFG MRT ARE MNG MAC MMR Similar patterns emerge when examining bilateral trade in value added instead of bilateral gross trade. 16
19 b. Bilateral trade with other developing East Asian countries (excl. China) Exports to dev. East Asia (% of gross exports) Imports from dev. East Asia (% of gross imports) LAO 7 LAO 6 4 MMR SGP MDV CHN THA BEN IDN MYS BRN JPN KOR VNM PHL GNB AUS TGO OMN BFA ZMB MLI KHM MNG THA 2 BRN SGP SLBPNG MDV AUS JPN LKA VUT NZL BEN VNM PAK GNB NPL MNG IRQ DJI MYS CHN PHL IDN MMR KHM c. Bilateral trade with other East Asian countries Exports to other East Asia (% of gross exports) Imports from other East Asia (% of gross imports) MAC 5 LBR 6 BRN PNG PHL KWT IDN SAU SGP SDN GNQ JPN MLT CHL KHMIRNNZL KOR USA TON QAT MYS 3 AUS CHN MMR VNM THA 2 ARE OMN 1 MRT ZMB YEM SLB VUT LAO COG NER MNG LAO GUY FJI SDN MNG PNG HKG LKA WSM SGP MDV AUS NZL KOR BGD SLB OMN IDN USA SYC ARE PRY DJI CAF AFG NPL PHL MMR VNM BRN MYS CHN THA KHM MAC VUT
20 1 d. Bilateral trade with the U.S. and Western Europe Exports to the U.S. and Western Europe Imports from the U.S. and Western Europe (% of gross exports) (% of gross imports) KHM VNM LAO MMR IDN CHN THA MYS MNG PHL CHN PHL THA MNG VNM MYS IDN MMR K LAO Source: IMF DOTS and authors calculations. Notes: 45 degree line shown as dotted line. Labels indicate developing East Asian countries and other selected countries. Much of the rise of China as a trade partner of developing East Asian countries has to do with its larger role in GVCs. Figure 1 depicts the Chinese foreign value added embodied in the other countries gross exports of goods and services, as well as the domestic value added produced in various countries that is re exported by China. 7 Developing East Asian countries collaborate more closely with China on these two aspects of GVC participation relative to most other countries in the world, but different countries have different roles. Vietnam and Cambodia have a high content of Chinese value added in gross exports (Vietnam in its exports of electrical and optical equipment and Cambodia in its exports of garments), an indication of downstream positioning relative to China in a triangular trade to destinations overseas. Malaysia, Philippines and Thailand, which are not highly dependent on China in the bilateral gross trade charts, have more than 4 percent of their forward participation in the electrical equipment industry accounted for by China s re exports. This suggests that the three countries are heavily integrated in global value chains, upstream of China, as its suppliers of parts and components. 7 Note that country availability is restricted to the coverage in the OECD TiVA Database. For example, Mongolia, a country with high gross trade exposure to China, is not included. 18
21 Figure 1a: China s role in developing East Asia s participation in GVCs China s share in the total FVA embodied in a A country s share in DVA embodied in China s gross country s gross exports (percent) exports (percent) KHM 45 4 KOR TWN VNM 15 MEX JPN MYS TWN USA KOR PHL IDN RUS 1 THA COL BRN CZE AUS PER IND SGP BRA 5 HKG PHL JPN MYS CHL THA AUS CRI VNM SGP BRA ZAF NZL PER IDN KHM ISR IND SAU USA ARG CHE DEUCAN RUS HKG Source: OECD TiVA and authors calculations. Notes: 45 degree line shown as dotted line. FVA stands for foreign value added ; DVA stands for: domestic value added. Labels indicate developing East Asian countries and other selected countries. Note: Trade refers to both goods and services. Figure 1b: China s role in developing East Asia s participation in GVCs: focus on the electrical and optical equipment industry China s share in the total FVA embodied in a country s gross exports of electrical and optical equip. (percent) 3 25 HKG A country s share in DVA from electrical equip. sector embodied in China s gross exports (percent) 6 5 MYS PHL KOR TWN PHL HUN 1 5 CAN BRA USA MEX KOR IDN THA ARG TWN AUS PER MYS ZAF IND POL CHL RUS GBR NZL TUR SGP CZE COL JPN VNM KHM 211 JPN THA 4 CRI VNM MLT 3 IDN SGP ISR CHE CAN AUS USA DEU 2 IRL NOR CHL KHM FRA NZL GBR FIN IND SWE ROW 1 ESP LUX RUS ROU HKG Source: OECD TiVA and authors calculations. Notes: 45 degree line shown as dotted line. FVA stands for foreign value added ; DVA stands for: domestic value added. Labels indicate developing East Asian countries and other selected countries. 19
22 As a source of final demand, the role of China in the region is still limited. Gross trade statistics show that developing Asian economies vary in their exposure to China, and that the exposure has been growing over time. Yet these indicators do not clarify whether a country is potentially exposed to shocks to Chinese domestic demand or to shocks to demand of other countries that are positioned downstream from China in an international supply chain. Examining the decomposed bilateral exports to China suggests that, among the developing East Asian countries for which we have the required data, the Philippines and Indonesia are relatively more exposed to Chinese demand. This exposure could reflect the fact that these two countries, with exports respectively dominated by services and natural resources, are different from the other East Asian countries which are linked to China through manufacturing value chains that ultimately serve third countries. In general, the exposure of East Asian economies to demand shocks in China is, however, not much higher than that of other economies (Figure 11). Figure 11. Share of China in gross exports of goods and services, by type of value added, 211 % of multilateral gross exports Foreign value added in gross exports to China Domestic value added not absorbed in China Domestic value added in intermediates absorbed in China Domestic value added in final goods and services absorbed in China HKG AUS TWN JPN CHL BRA PHL* KOR ZAF IDN* SAU MYS* NZL THA* VNM* RUS ARG SGP IND CRI USA DEU COL BRN ISR CHE KHM* CAN Other Source: OECD TiVA, Wang et al. (213) and authors calculations. Note: Countries are sorted by the total domestic value added absorbed in China as a share of multilateral gross exports. 2
23 3. THE IMPLICATIONS OF AND THE POLICY RESPONSE TO THE CHANGING TRADE PATTERN This section addresses four questions associated with the changing trade trends outlined in Section 2. The first pair of questions relates to China s emergence and the appropriate national policy response. What are the trade effects of the growth of China on other developing East Asian countries? And how has the asymmetric opening of goods and services trade affected the productivity and comparative advantage of developing East Asian economies? The second pair relates to the emergence of GVCs and the appropriate response in terms of international cooperation. How does the increasing fragmentation of production across borders affect developing East Asian countries productivity? And how far are the international agreements negotiated by developing East Asia fostering the growth of GVCs and deeper international integration? We will investigate these issues in turn. a. The heterogeneous impact of China The inclusion of China in the global trade system has had a significant impact on developing East Asian countries. This section provides an assessment of the effect on trade flows. As discussed in Section 2, the rise of China as a major player in world trade has changed the nature of intraregional and extra regional trade for developing East Asian countries. China s share of world exports increased between 1995 and 215 from about 2 percent to 11 percent. In light of this change, a number of studies (most notably, Autor et al., 213) have investigated the impact of the China (supply) shock on other countries. At the same time, China grew as an importer, notably of agricultural and mining products where its share of world imports increased from 2 percent in 1995 to 1 percent in 215. This China (demand) shock also affected its trade partners, altering their trade patterns. China s supply and demand shocks have contrasting effects on East Asian developing countries that ultimately depend on their production and trade structures and the similarity of their export destinations with China. An empirical investigation is required to quantify these various channels. Econometric analysis points to a heterogeneous impact of China related trade shocks on exports of developing East Asian countries. Bastos (218) examines empirically the effect of supply and demand shocks associated with China s trade dynamics on multilateral exports of the Belt and Road Initiative (BRI) countries a group that includes, but is not limited to developing East Asian countries and finds a significant overall effect and heterogeneous impacts by country and period, for both types of trade shocks. 8,9 Table 1 presents the estimated coefficients obtained in 8 Intuitively, China related supply or competition shocks are associated with China s rising global exports, and may pose a competition challenge especially for countries with an initial export structure that is similar to China s. In contrast, China related demand shocks are associated with China s rising imports, and may represent an opportunity for countries with initial export profiles matching China s import structure. 9 The methodological approach in Bastos (218) is built on insights by Autor et al. (213). The estimation equation relates multilateral exports by country, sector and period to the China related supply and demand shocks, where the supply shock is computed as the product of the change in log of multilateral exports of China in a sector and period and the export similarity index between China and the exporting country and the same sector in 1995, while the demand shock is computed by the product of the change in log of multilateral imports of China in a sector and period and the similarity index between China s imports and the country s exports in the same sector in 21
24 Bastos (218) for the average BRI country and for each developing East Asian country separately. The results suggest that China related supply shocks may have intensified in the last decade compared to the previous. Indeed, while competition pressures from China appear to have been innocuous for the multilateral exports of the developing East Asian countries during the period , they have had a negative and significant impact for the exports of Indonesia, Malaysia, the Philippines, Thailand and Vietnam during period Demand shocks associated with the rise in China s imports are found to have significantly boosted multilateral exports of Cambodia, Indonesia and Thailand, during , and of Indonesia and Mongolia, during The positive effects associated with the rise in Chinese imports may have offset China s competition pressure on developing East Asian countries in external markets, but not consistently throughout the last two decades. The finding in Bastos (218), that China driven supply shocks may have intensified in the last decade, holds for the entire group of BRI countries, as suggested by the changing magnitude of the estimate for the average BRI country (Table 3, last row). The implication is that up until 25, China s competition pressure in external markets, for countries in East Asia specifically, and for BRI countries in general, was offset by the positive effects associated with the increasing Chinese imports. This insight corroborates the findings in World Bank (27) about the effect of the rise of China on the exports of East Asian countries during period Regressions control for period effects (given that up to four 5 year periods from the interval are being used) and panel fixed effects (either country industry level, for the regressions including all countries, or industry level, for the country specific regressions). Potential endogeneity concerns are addressed by employing 2SLS estimation, whereby the change in China s multilateral exports is instrumented using changes in sectoral Chinese exports and imports to the top 1 destinations and sources. 1 Using a different methodology, the chapter on trade in World Bank (27) finds that export growth to non China markets in industrial products was affected negatively by Chinese exports in the same products during period and more so during In addition, it finds that the negative effect was offset by the positive impact of China related demand shocks (with countries more seriously affected by the supply shocks also being the ones gaining from increased exports to China, notably Korea, Singapore, and Taiwan, China). The chapter further indicates that China appears to have been pushing other exporters up the value chain in parts and components, so that everyone ended up benefitting via specialization in specific tasks, and engagement in GVC and triangular trade. 22
25 Table 3. Impact of China shocks on exports of selected BRI countries. Supply shock Demand shock Country Cambodia *** 79.6 (31.89) (46.32) (27.4) (189.9) Indonesia * 39.76*** 36.97*** (9.82) (17.98) (15.2) (13.73) Lao (43.5) (44.35) (641.8) (363.26) Malaysia ** * (12.1) (4.64) (16.24) (16.19) Myanmar (49.83) (12.48) (15.78) (97.22) Philippines *** (14.32) (24.35) (3.56) (38.34) Thailand ** 32.35*** 6.79 (1.38) (17.74) (9.34) (23.9) Vietnam *** (15.27) (11.4) (45.67) (13.5) Mongolia *** (66.45) (19.87) (14.73) (13.44) Average BRI country *** *** 42.52*** 44.95*** (3.88) (8.31) (7.27) (16.94) Source: Bastos (218). Notes: Robust standard errors clustered by country industry, *** p<.1, ** p<.5, * p<.1. Reported coefficients are obtained using the 2SLS estimation method. The China effect on trade depends on the complementarity of the trade structure of developing East Asian countries with China and the similarity of their export destinations with China. Bastos (218) also offers an intuitive approach validated by the previous econometric results on how to identify countries that are more likely to be impacted by China s rise. First, countries that share a similarity of exports with China in both the exported products and the destination markets are likely to face competition pressure from China in the markets abroad (Figure 12a). Indeed, for Vietnam, Thailand, Malaysia and the Philippines, which have the highest similarity index among the BRI countries in 215, the econometric analysis yields negative and significant supply shock coefficients in the regressions covering the period Second, countries whose exports are similar to China s imports and who also have a large share of their exports going to China are likely to benefit from an increase in Chinese imports (Figure 12b). For Instance, Mongolia, a country in this category, is found to have a positive and significant demand shock effect during the period Third, countries that share a similarity of production structure (proxied by exports) with China and also have a large share of imports sourced from China are likely to be affected negatively in their domestic markets by Chinese competition (Figure 12c). 23
26 Figure 12. Identifying opportunities and vulnerabilities associated with competition from China a. Exposure to competition from China in third export markets: export similarity with China in products and markets, VNM THA MYS PHL IND SGP HKG IDN CZE POL TUR ISR HUN ROU KHM SVK BGR EST SVN LKA LTU PAK BGD LVA GRC HRV EGY SRB ARE BIH MMR UKR NPL RUS MDA JOR BHR ALB MKD LBN BLR GEO LAO SAU OMN ARM QAT KWT MNE KAZ BRN KGZ IRN SYR MDV MNG AFG UZB YEM AZE PSE TJK TLS TKM BTN IRQ b. Exposure to demand shocks from China, 215 Share of imports sourced from China TLS TJK IRN MNG MMR KGZ BGD PAK IRQ KHM IDN UZBSYR LAO RUS PHL KAZ ARE LKA BRN IND MYS KWT EGY YEM SAU NPL JORLBN CZE TKM BHR SGP TUR POL QAT ARM MNE UKR ALBMDA ISR AFG MDV GEO SVKEST BLR OMN MKD BIH SRB AZE PSE GRC BGR SVN HUN LTU ROU LVA BTN HRV Source: Bastos (218) Note: 45 degree line shown as dotted line. HKG THA VNM Similarity between country's exports and China's exports c. Exposure to import competition from China in the domestic market, 215 IRQ UZB SAU VNM KWT KAZ IDN KHM PAK ARM RUS ARE TJK QAT JOR UKR KGZ ALB GEO INDISR BGD AFG NPL LKA MKD MNE BLR BTN BRN BGREGY BHR AZE BIH GRC HRV LVA EST HUN LBN LTU CZE MDV PSE MDA SRB ROUSVK SYR TLS SVN TUR POL Further integration with China will affect developing East Asian countries differently and the extent of this impact will depend on the ongoing rebalancing of the Chinese economy. 11 In recent years, China has been engaged in a number of regional processes, the Belt and Road Initiative (BRI) and the Regional Comprehensive Economic Partnership (RCEP), which are likely to further reduce trade costs within East Asia because of improved transport infrastructure and reduced Share of exports to China TKM MMR LAO OMN YEM MNG IRN HKG PHL MYS THA similarity between country's exports and China's imports SGP 11 See Lardy (212), Pettis (214) and Constantinescu, Mattoo and Ruta (216) for an analysis of the implications of China s rebalancing. 24
27 trade policy barriers. Based on this analysis, the impact of further integration with China will have asymmetric effects on developing East Asian countries. Vietnam, Malaysia, the Philippines, Thailand and Indonesia source a large share of imports from China and have similar export structure and export destinations. For these countries, further integration with China will increase the competitive pressures in final goods markets. But firms involved in value chains with China will benefit from the access to cheaper inputs. Myanmar and Mongolia source a sizable share of imports from China and have an export structure that differs from China. For these economies, further integration with China will have small effects on domestic competition, while these economies will benefit from further specialization according to their comparative advantage. The risk will be that they will be even more exposed to domestic economic and policy shocks in China. At the same time, the gradual rebalancing of the Chinese economy, away from investment and industrial production and towards consumption and services, will imply that further integration in East Asia in the next decade may look quite different from the past decade. For instance, as Chinese competitiveness declines due to higher labor costs, countries like Vietnam, Cambodia and Indonesia will gain market shares in third markets. As Chinese demand for services increases, services export opportunities for countries like Malaysia (utilities and finance), the Philippines (business services) and Thailand (tourism and health) will surge. Resource exporters like Myanmar and Mongolia will still supply large shares of their exports to China and other industrializing countries, but probably not at the rising growth rates of past years. b. Asymmetric market opening in services and goods One striking aspect of East Asian reform is the contrasting attitude to the liberalization of goods and services trade which has meant foregone benefits. A region that has grown dramatically through manufacturing exports stimulated by foreign direct investment has shown a relative reluctance to be as open to foreign trade and investment in services. This reluctance is a puzzle because growth theories have for long emphasized that trade in intermediate goods and services generally improves the allocation of capital and labor across sectors and countries (Jones 211). There is also growing evidence that services reform, of which trade liberalization is one important component, can contribute significantly to inclusive growth. Services shape both overall economic performance and help people to engage productively in the modern economy. An efficient and well regulated financial sector leads to the efficient transformation of savings to investment, ensuring that resources are deployed wherever they have the highest returns, and facilitates better risk sharing in the economy. At the same time, improved access to finance improves household welfare and income growth, by allowing consumption smoothing and investment in assets that enhance longer term productivity. Improved efficiency in telecommunications allows the dissemination and diffusion of knowledge and connects firms and individuals to economic opportunity witness the spread of the internet and the dynamism that that has lent to economies around the world. Similarly, transport services help goods to move where they are most wanted and people to where they are most productive. Business services 25
28 such as accounting and legal services are important in reducing transaction costs both for firms and individuals. Education and health services enhance the quality of lives and human capital, allowing people to engage productively in the modern economy. In this section, we focus first on how services trade has an impact on two key aspects of economic performance: the growth of productivity and the evolution of comparative advantage. Improved access to finance, communications, transport, and other services, either through general reform or reform of trade and FDI policies, enhances firms productivity and other aspects of the performance of firms. The development of domestic services sectors and access to foreign services can also shift the pattern of comparative advantage. However, these benefits do not automatically follow from services liberalization, and a successful reform program will also need strengthened regulation and mechanisms to improve access to services, which is briefly discussed in the third part of this section. 12 i. Asymmetric trade policy liberalization Figure 13 depicts the asymmetric trade opening in goods and services in East Asia. On the horizontal axis is a measure of tariff protection, while on the vertical axis is a measure of services protection as measured by the Services Trade Restrictions Index, which takes values from for completely open regimes to 1 for completely closed. Apart from Cambodia and Mongolia, all the countries in the study inhabit the top left quadrant, signifying that their levels of tariff protection are lower than the global median while their levels of services protection are higher than the global median. Even though many of the larger East Asian countries are now similarly situated, the pace of reform has been strikingly different over the last two decades. Even though their regimes are still not very open, in China, Vietnam and Cambodia, WTO accession induced a move away from stateowned monopolies to more competitive private provision of telecommunications, financial, transport and a range of other services. In Indonesia, Thailand, Malaysia and the Philippines regimes at the turn of the century were less closed but the approach to reform has been more gradual and not always towards greater openness. The World Bank Services Trade Restrictions Database reveals interesting policy patterns in East Asia. Although public monopolies are now rare, and few services markets are completely closed, numerous second generation restrictions remain on entry, ownership, and operations. Even where there is little explicit discrimination against foreign providers, market access is often unpredictable because the allocation of new licenses remains opaque and highly discretionary in many countries. Regulatory discretion is accentuated by a lack of accountability in a number of countries where regulators are not required to provide reasons for rejecting a license application or where foreign providers do not have the right to appeal regulatory decisions. 12 Added urgency is lent to services reform by the deepening interlinkages between manufacturing and services sectors, manifested as the so called servicification of manufacturing, whereby services are increasingly embodied in manufactured goods. See Hallward Driemeier and Nayyar (218) for a discussion of the trends and the implications of this phenomenon. 26
29 Figure 13. Protectionism in goods trade versus services trade 8 7 IND Services Trade Restrictions Index (STRI) KWT BHR QAT PHL IDN THA OMN MYS LBN PAN SAU VNM BWA LKA DZA CHN NAM BLR ZAF MWI UGA CRI YEM ITA TZA PAK MEX URY MLI UKR FRA KHM NGA CIV LSO FIN RUS TUR BEL JPN CAN CHL KOR UZB BRA MUS DNK AUS HND MOZ ZMB MAR PRT AUT ALB COL BDI USA DEU GHA SEN CZE ESP GTM MDG KAZ ARG GRC BGR HUN KGZ PRY PER GBR BOL SWE NIC IRL DOM MNG TTO GEO ROU NZL LTU ARM ECU POL NLD JOR Sources: UNCTAD TRAINS (via WITS), World Bank Services Trade Restrictiveness database (Borchert et al. 212) and authors calculations. EGY Bank sector policies in Thailand, Philippines, Malaysia, and Vietnam restrict greenfield entry and operations. In Thailand, the limit on foreign ownership in a local bank was 49 percent, and there was a limit on operations: the number of branches and ATMs allowed per subsidiary was 2. In the Philippines, greenfield entry was not possible since the license limit of 1 had been reached, and for acquisition, the foreign ownership limit was 6 percent. In Malaysia, with the enactment of the Financial Services Act 213 and the Islamic Financial Services Act 213 in June 213, there was a comprehensive modernization and streamlining of Malaysia s regime on licensing and foreign equity limits in the banking and insurance sector (conventional and Islamic). In both conventional and Islamic finance, application for a license is now based on the prudential and best interest of Malaysia criteria. Similarly, the acquisition of a significant foreign equity interest in Malaysian banks and insurance companies could be up to 1 percent, subject to meeting the aforementioned criteria. In the context of the TPP negotiations, Malaysia promised to phase in further liberalization in the financial sector. Vietnam allowed wholly foreign owned subsidiaries but imposed a limit on the acquisition of banks. To acquire existing banks, the foreign ownership limit was 3 percent for aggregate foreign investment and 2 percent for a single foreign credit institution. Most developing East Asian countries limited foreign investment in fixed and mobile telecommunications services. The limit on foreign ownership was 49 percent in Indonesia and Malaysia, and 4 percent in the Philippines. But Malaysia is progressively removing foreign 27 TUN ZWE BGD NPL KEN VEN IRN CMR RWA Average applied Most Favored Nation (MFN) tariff (percent)
30 equity limits in the telecom sector; currently the foreign equity limit is 7 percent for network facilities providers and 1 percent for applications service providers. The limit was a more relaxed 7 percent in Vietnam, but foreign majority control required government approval, and in Thailand foreign majority owned or controlled providers could only offer services on a resale basis. In the context of the TPP negotiations, Vietnam has promised to relax or eliminate foreign equity restrictions over the same time frame. A number of countries allowed full foreign ownership in private companies, but restricted foreign ownership in state owned telecom operators. Thus, the Philippines did not allow acquisition of a state owned entity, whereas Cambodia and Lao PDR allowed only a minority foreign share in state entities. In Vietnam, the state held a dominant share in telecommunications service providers with network infrastructure. However, in the context of the TPP, Vietnam has pre committed to further liberalization. Transportation services were relatively restricted in developing East Asian countries as they were in other parts of the world. Thailand, Vietnam, Philippines, and Malaysia had restrictions on foreign ships carrying government cargo but no limitations on private cargo. On commercial presence (mode 3), for the types of transport covered by the survey (maritime, air, road, and rail), the majority of developing East Asian countries mentioned that the control must be held by local companies. In air transport, all ASEAN member states, including the developing East Asian countries (except Mongolia), signed the ASEAN Multilateral Agreement on Full Liberalization of Air Freight and Air Passenger services. It was difficult to assess how much more openness the regional air services agreements offered beyond the existing Bilateral Air Services Agreements (BASAs). ii. Services openness and productivity Research on several developing countries offers examples of the significant impact of openness to services on manufacturing productivity. Reforms in these countries visibly transformed services sectors, with greater openness and improved regulation leading to dramatic growth in domestic and foreign investment. Local manufacturing firms were no longer at the mercy of inefficient public monopolies but could now source services from a wide range of domestic and foreign providers operating in an increasingly competitive environment. As a result, they had access to better, newer, more reliable, and more diverse business services. These improvements enhanced firms ability to invest in new business opportunities and better production technology, to exploit economies of scale by concentrating production in fewer locations, to efficiently manage inventories, and to coordinate decisions with suppliers and customers Several studies show that access to low cost and high quality (domestic or foreign) producer services can promote productivity and economic growth (Hoekman and Mattoo 28). Arnold et al. (216) collected detailed information on the pace of reform across Indian services sectors, with a focus on entry and operational restrictions. The results suggest that procompetitive reforms in banking, transport, insurance, and telecommunications boosted the productivity of both foreign and locally owned manufacturing firms. Using firmlevel data for the Czech Republic for , Arnold, Javorcik, and Mattoo (211) find a positive effect on the productivity of domestic firms in downstream manufacturing as a result of services sector reforms leading to greater FDI. Using the annual manufacturing survey of Chilean firms, Fernandes and Paunov (212) find a positive 28
31 An example of the power of services reform is offered by Indonesia. Duggan, Rahardja, and Varela (213) examined the extent to which policy restrictions on foreign direct investment in the Indonesian service sector affected the performance of manufacturers over the period They used firm level data on manufacturers total factor productivity and the OECD s foreign direct investment Regulatory Restrictiveness Index, combined with data from Indonesia s input output tables regarding the intensity with which manufacturing sectors use services inputs. Controlling for firm level fixed effects and other relevant policy indicators, they find, first, that relaxing policies toward foreign direct investment in the service sector was associated with improvements in perceived performance of the service sector. Second, they found that this relaxation in service sector foreign direct investment policies accounted for 8 percent of the observed increase in manufacturers total factor productivity over the period. The total factor productivity gains accrued disproportionately to firms that are relatively more productive, and gains are related to the relaxation of restrictions in both the transport and electricity, gas, and water sectors. Total factor productivity gains were associated, in particular, with the relaxation of foreign equity limits, screening, and prior approval requirements, but less so with discriminatory regulations that prevent multinationals from hiring key personnel abroad (Figure 14). Figure 14. Indonesia: Services FDI reform and productivity in the manufacturing industries a. Services FDI reform b. Productivity gains from services reform Overall FDI Index All Services Real estate investment Lower Bound (9% Conf.) Mid Point Estimate Upper Bound (9% Conf.) Business services Financial services All Communications Media Hotels & restaurants Transport Distribution Domestic Construction Electricity Source: Duggan, Rahardja and Varela (213) iii. Services openness and comparative advantage Since a large part of goods trade includes trade in embodied services, the development of the domestic services sector and access to imported services inputs can be expected to influence comparative advantage in manufacturing trade. The impact of services development on manufacturing trade is not straightforward. Since services are used as inputs in the production effect of substantial FDI inflows in producer services sectors on the total factor productivity of Chilean manufacturing firms. Their findings also suggest that services FDI fosters innovation in manufacturing and offers opportunities for laggard firms to catch up with industry leaders. These benefits arise not just from foreign investment but also from cross border trade in services. For example, Amiti and Wei (29) find that services offshoring by high income countries tends to raise their manufacturing sectors productivity. 29
32 of manufactured goods, their development can increase manufacturing production. But since services and manufacturing compete for resources, the development of services can be at the expense of manufacturing. For example, the development of the services sector has drawn resources away from manufacturing not just in industrial countries like the United States and the United Kingdom, but also in developing countries like India and possibly the Philippines (see, for example, Kochar et al. 26). Some early studies examined the link between services as inputs in manufacturing and the pattern of manufacturing exports using single national input output tables. For example, Francois and Woerz (28) find significant and strong positive effects of increased business services openness (greater imports) on some industries. Their reliance on national data means that inputs cannot be broken down according to their origins, and services inputs are mismeasured due to two way trade in intermediate products. More recently, Stehrer, Foster, and de Vries (212), Timmer et al. (213), and Liu et al. (217) used the newly constructed international input output tables to measure more precisely the embodied services and indirect trade through other sectors. Liu et al. (217) focus on two key services sectors: financial services and business services. Domestic services development has a mixed effect on the revealed comparative advantage (RCA) of manufacturing exports. Liu et al. (217) quantify the indirect role of services in international trade in goods and construct new measures of revealed comparative advantage based on domestic value added in gross exports. 14 In their econometric analysis of the impact of services development on RCA in manufacturing sectors, the key explanatory variable is the interaction between a measure of the development of financial (or business) services and the financial (or business) services intensity of each manufacturing sector. Services development reduces the RCA of manufacturing exports in manufacturing sectors with low embodied services (basic and fabricated metals) but increases it in sectors with a high degree of embodied services (food, beverages and tobacco). Liu et al. also consider the role of services imports in overcoming the limitations of domestic services markets. In countries with less developed services, manufacturing exports benefit more from access to foreign services inputs. Such a bypass effect is also discussed in a theoretical model by Ju and Wei (21), which derives the conditions for financial globalization to serve as a substitute for reforms of domestic financial systems. These results suggest that lower services trade barriers can help developing countries bypass inefficient domestic services provision and promote their manufacturing exports through intersectoral linkages. The patterns across East Asian developing countries of their direct and indirect domestic valueadded exports of services reveals the current state and potential evolution of their comparative advantage in services. In Figures 15 and 16, developing East Asian countries are placed in the 14 Note that RCA based on gross exports (used as a dependent variable) can cause an endogeneity problem because the embodied services (used as explanatory variables) are part of gross manufacturing exports. Liu et al. (217) avoid this problem because manufacturing RCA is based on the value added created by the factors employed in manufacturing sectors, excluding the embodied services in gross exports contributed by the factors employed in services sectors. 3
33 context of other countries for which value added trade data are available. The horizontal axis measures direct value added exports of services and the vertical axis measures indirect domestic value added exports of services (the value added exports of services embodied in exports of goods). Lines representing the median shares divide the countries into groups occupying four quadrants. For financial services, Figure 15 shows that there is heterogeneity across developing East Asian countries: In the bottom left quadrant is Indonesia. The low competitiveness of financial services is reflected in the low share of direct exports and the low level of embodied exports which could reflect the low financial services intensity of goods production, the reliance primarily on imported financial services, or both. In the top left quadrant are China, Vietnam and Thailand, which are not yet sufficiently competitive to export financial services directly, but which do export a significant share indirectly. That goods sectors in these countries rely significantly on domestically produced financial services could be because financial services in these countries have reached an intermediate level of development at which they can compete in the domestic market but not yet internationally. It could also be that restrictions on cross border imports in these countries oblige goods producers to use domestically produced services. In the top right quadrant is Malaysia, whose more developed financial services sector exports both directly and indirectly. In the bottom right quadrant are Cambodia and less clearly, the Philippines, along with such mature deindustrializers as Britain and the United States, where the domestic tangible industries have shrunk in importance and financial services are mostly exported directly. The Philippines is too similar to Vietnam to be treated as qualitatively different, and Cambodia s presence may merit further exploration. 31
34 Figure 15. Direct and indirect value added exports of financial services as shares of GDP, BGR MYS ISL Indirect Value Added Exports/GDP (percent) THA CRI MAR DNK CZE KOR HRV PRT ZAF HUN SVN CAN CHN IND RUS NZL ITA VNM EST CHL FRA TUN PER AUS NOR POL PHL GRC SVK SWE BRN ROU DEU TUR ESP BRALTU FIN KHM IDN ARG COL MEX JPN USA SAU ISR BEL AUT LVA NLD GBR Direct Value Added Exports/GDP (percent) Source: OECD TiVA and authors calculations. For business services, Figure 16 shows two interesting differences with developing East Asia: Given the greater cross border tradability or openness to trade of business services, there is less scope for an intermediate stage (for countries to populate the top left quadrant). When a country is not competitive in producing these services, it neither exports them nor do its goods sectors import them. When a country is competitive, it exports both directly and indirectly. Most countries in the region inhabit the bottom left hand quadrant, where both direct and indirect exports of business services are low, reflecting the relative weakness of this sector. In the bottom right quadrant are Philippines, and surprisingly, Malaysia, and along with the premature deindustrializer, India, where direct exports of business services are high but indirect exports are low. In the case of the Philippines, the explanation is the relative strength of business services and the relative weakness of goods sectors, but the Malaysian case deserves closer inspection. 32
35 Figure 16. Direct and indirect value added exports of business services as shares of GDP, CHE LUX Indirect Value Added Exports/GDP (percent) IRL SVN DEU FRA CHL ISR SVK NLD ISL NZL DNK ITA CZE AUT KOR HKG FIN PRT HRV POL LVA AUS BGR MEX NOR ESP PER ARG USA LTU CAN ZAF JPN BRA RUS TUR CHN COL MYS THA GRC KHMBRN ROU PHL SAU VNM TUN IND IDN HUN BEL SWE EST SGP GBR CRI MLT CYP MAR Direct Value Added Exports/GDP (percent) Source: OECD TiVA and authors calculations. iv. Challenges in services reform The significant benefits of services openness cannot be achieved by a mechanical opening of markets. Flawed reform programs can substantially reduce gains from liberalization (World Bank 22, chapter 3). While precise recommendations require detailed analysis of each service sector in each country, three broad types of action are likely to be desirable: emphasizing competition, strengthening the regulatory environment, and creating mechanisms to improve access to essential services in the poorest areas. Regional cooperation and international support could help in each of these respects. The largest gains come from eliminating barriers to entry and enhancing competition. Some East Asian developing countries like Malaysia and Thailand have given priority to a change in ownership from public to private or national to foreign hands, while retaining limitations on new entry. These restrictions can lead to a transfer of rents not just to domestic firms but also to foreign firms at the expense of consumer welfare. It is sometimes suggested that unrestricted entry is not always desirable, and in areas like banking might threaten bank viability and financial 33
36 stability. But such concerns are ideally addressed through effective prudential regulation and there must be a strong presumption in favor of eliminating barriers to entry. Effective regulation ranging from prudential regulation in financial and professional services to pro competitive regulation in telecommunications and other network based services is critical to the success of liberalization (Mattoo and Sauve, 23). While regulatory capacity is a limited in some countries in the region like Lao PDR and Myanmar, regulatory design is a challenge even for the more advanced countries in the region and the world. Rapid changes in services technology and business models are rendering redundant old models of regulation. Conventional communication is being disrupted and displaced by platforms like Facebook and WeChat, conventional financial services by fintech and providers like the Ant Financial Services Group (formerly Alipay), and conventional transport by Uber and Didi Chuxing. Regulatory institutions that can address conventional concerns and emerging issues can be costly and require sophisticated skills. Regional cooperation may enable a reduction of costs and a pooling of skills and help to develop regional solutions to problems. A key problem is that improvements in domestic standards are often needed to export services, but standards that are too high can hurt domestic access to services or competitiveness in other markets. For example, in the case of professional services, low standards and disparities in domestic training and examinations can become a major impediment to obtaining foreign recognition; but too high standards make these services unaffordable for the poor and small firms. A concrete example of the dilemma: the Philippines initially enacted national privacy legislation in order to ensure continued access to the EU data processing market; but the result was that many Philippinesbased US firms found it difficult/costly to operate in the Philippines and suspended investment plans; whereupon the Philippines government was obliged to reversed course. Striking an appropriate balance in these cases is a challenge and a regional approach may help countries create locally appropriate standards without segmenting markets and also enhance the region s influence on the evolution of international standards in these new areas. Liberalization often requires complementary policies to help improve access to essential services for the poor, but these policies have not always been put in place even in the more advanced countries. In certain poor countries, and certain regions within all countries, improvements in services policy and regulation will not be sufficient to ensure access to essential services and therefore special mechanisms are needed. The effectiveness of international assistance could be maximized by allocating it in a manner similar to that used domestically by countries like Chile and Peru to achieve wider access to services ranging from telecommunications to education (Mattoo, Nielsen and Nordas, 26). For instance, once a region or group within a country has been identified as needing assistance because the market is not delivering affordable services funds could be pooled and allocated through international competitive tenders to the firm which offers to provide the necessary infrastructure at least cost. Providing poorer countries assistance in meeting the costs of the programs could increase the benefits of and sustain liberalization by ensuring that the gains are distributed widely. 34
37 c. Participation in GVCs and productivity growth A key feature of developing East Asian countries has been their increasing participation in regional and global value chains. Section 2 has documented the changing nature of East Asian trade with the rise of production fragmentation across borders. The focus of this section is to investigate how GVC participation has affected productivity growth in the region. Trading in the context of GVCs is associated with multiple border crossing by intermediate products and services. Economists rely on this fact to identify GVC related trade and to set it apart from conventional trade. Specifically, they look for the following two features in the international trade data: (1) the significant presence of foreign value added in a country s total or sectoral gross exports, and (2) the significant presence of domestic value added produced by a country or its sectors in the gross exports of all other countries. The first feature reflects backward participation in GVCs, which occurs when countries specialize in downstream, often low skilled, stages of the process of production, using imported parts, components and other processed intermediates to produce output that is then exported. The second feature is associated with forward participation in GVCs, typical of countries that offshore labor intensive stages of the production process while specializing in upstream high skilled stages of production such as design, research and development. 15 This method of identification is not always foolproof, especially in the case of forward participation, which can be confounded with conventional trading of oil and other raw materials. 16 GVC participation can increase labor productivity through two main channels. Recent theoretical models have shown that productivity gains associated with offshoring and participation in GVCs may accrue from the finer international division of labor, which is isomorphic to factoraugmenting technical change (Grossman and Rossi Hansberg 28). In addition to specialization, GVC participation can boost productivity growth through greater diversity in input varieties, learning externalities and technology spillovers (Li and Liu 214; Baldwin and Robert Nicoud 214). 17 The latter effects may be especially important for developing countries with backward participation in GVCs, stemming from the engagement with firms in technologically advanced countries. In this section, we investigate whether the pattern of productivity growth for developing East Asian countries can in part be explained by the changes in GVC participation. We proceed by examining the general trends in labor productivity based on country specific data from The Total Economy Database. As for the trends in backward and forward GVC participation of the developing East Asian countries, we refer the reader to the discussion in Section 1. Second, we 15 Calculation of both backward and forward participation in GVCs involves applying Leontief s approach to synthetically derived international input output tables (Hummels, Ishi and Yi 21; Koopman, Wang, and Wei 214). 16 Indeed, output exported by oil and commodity producers tends to be found in exports of multiple countries that use raw materials as intermediate inputs embodied in their output. Consequently, the forward participation of oil and commodity producers can be high even when the producers themselves may not be engaged in GVCs. 17 Trade in general can lead to productivity gains through multiple channels that are the object of a large body of research see IMF (216), Chapter 2, for a brief survey. 35
38 check whether labor productivity and backward GVC participation are associated at countrysector level, in general for the average country in the sample, and in the specific case of the developing East Asia. Third, we subject this association to more rigorous scrutiny, to see whether it is robust to controlling for other obvious drivers of labor productivity. Labor productivity growth rates in developing East Asia are among the highest in the world but some of the countries have seen declines in the past two decades. In level terms, labor productivity in the developing East Asian countries is yet to catch up with developed countries. The 215 rankings range from 48/123 for Malaysia to 113/123 for Cambodia, with China being ranked 83/123 and Vietnam 12/123. However, the picture is completely different as relates to labor productivity growth: the 215 rankings range from 2/123 for Vietnam to 28/123 for Thailand. Labor productivity growth in the countries of focus has been consistently above the averages of the mature economies, and, with few exceptions, also above the world and the emerging market averages. There has been plenty of discussion about the average world productivity being sluggish in recent years, particularly since the Great Recession (World Bank, 218). Slower productivity growth in the 21s relative to the 2s seems to also affect some of the developing East Asian countries, most notably China, Malaysia and Myanmar (Table 4). Table 4. Labor productivity in the developing East Asian countries Labor productivity growth Country/region 198s 199s 2s 21s World n.a. n.a Mature Economies n.a. n.a Emerging Markets and Developing Economies n.a. n.a China Indonesia Cambodia Myanmar Malaysia Philippines Thailand Vietnam Source: Conference Board, The Total Economy Dataset. Note: Arrows denote change from previous decade. Decade labelled 21s refers to period Prima facie evidence indicates a positive correlation between backward GVC participation and productivity growth for developing East Asian countries. For the average country in the world, sectors with larger growth in backward GVC participation tend to also have larger growth in labor productivity. In Figure 17, we explore the time variation in the TiVA data (yearly from ) and find that, for the average developing East Asian country sector combination, the level of 36
39 labor productivity and the level of backward GVC participation are positively associated. 18 The strength of this association is heterogeneous across country sector combinations, but it displays a surprisingly consistent upward path. 19 Figure 17. Emerging East Asia: correlation between labor productivity and backward GVC participation in manufacturing sectors, by country ( ) 18 For this step, we use OECD TiVA to compute the backward GVC participation indicator. OECD TiVA covers 63 countries and 34 goods and services sectors and spans period The following developing East Asian countries are included in the TiVA database: China, Indonesia, Malaysia, Philippines, Thailand and Vietnam. For labor productivity by country and sector, we use data on value added from OECD TiVA and on employment from OECD STAN, WIOD (Release 213) and UNIDO INDSTAT2. 19 Each row in Figures 17 and 18 refers to a country. The first figure in each row presents all the sector year combinations of that country next to all the country sector year combinations in the sample. The y axis indicates the position of a country relative to the rest, as concerns the level of labor productivity. The x axis indicates the same for the degree of GVC participation, but the ranking in this case is less accurate due to the scale effects (being more to the right may indicate that a country simply exports more than the others). The second figure in each row zooms in on the sector year combinations of the country in focus and indicates for each sector the strength of the association between the level of labor productivity and the level of backward GVC participation. 37
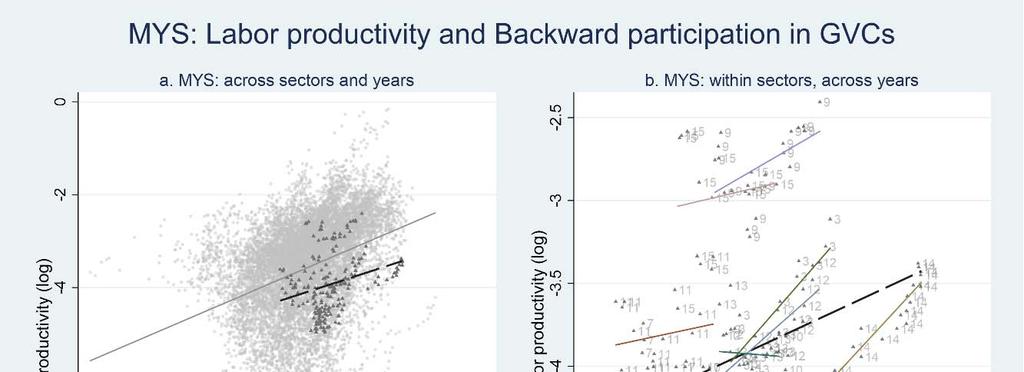
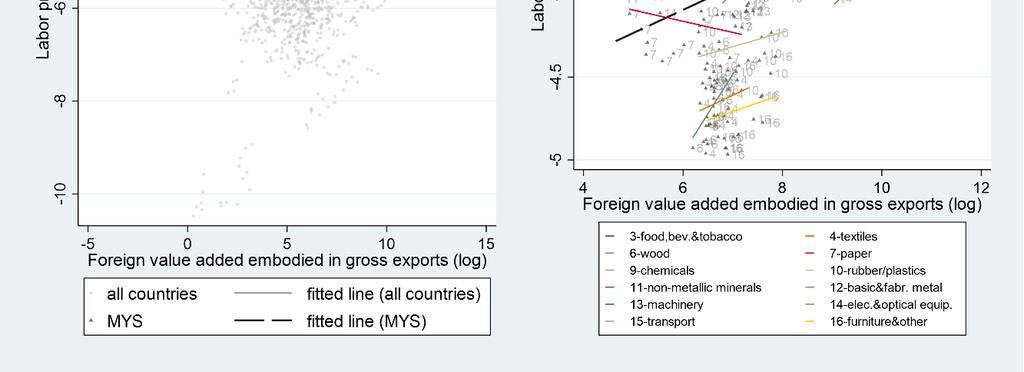
40 38
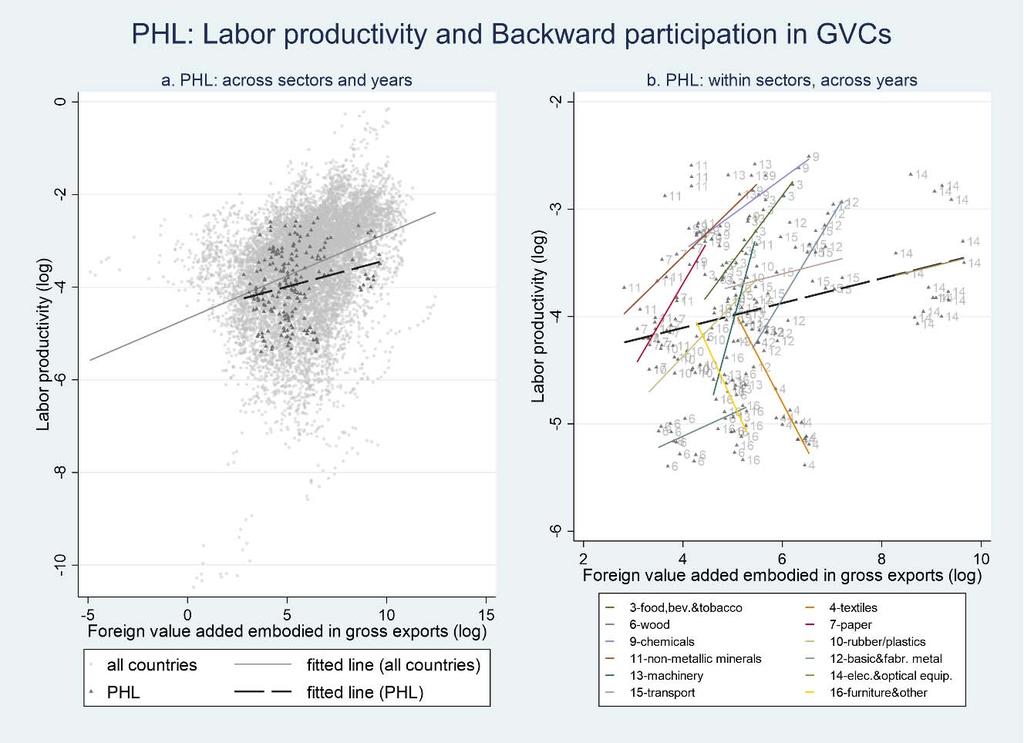
41 39
42 Figure 18. Emerging East Asia: correlation between labor productivity and backward GVC participation in manufacturing sectors, by country ( ) 4
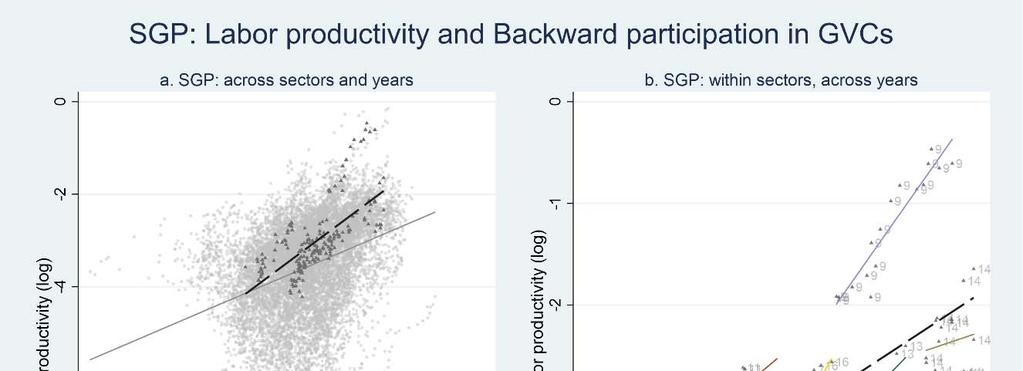

43 41
44 Econometric analysis allows us to identify rigorously the effect of backward GVC participation on productivity growth. Labor productivity has a multitude of drivers. To investigate whether GVC participation is among the significant ones in the context of the developing East Asian countries, we draw on the econometric framework in Constantinescu, Mattoo and Ruta (217). We apply that framework to data on value added, output and trade from the OECD ICIO and TiVA and on employment and capital from OECD STAN, WIOD (Release 213) and UNIDO INDSTAT2. 2 We estimate the impact of GVC related trade and non GVC related trade on labor productivity for the average country in the world, and then use interaction terms to investigate whether a differential effect exists for the developing East Asian group. Annex B provides the details of the econometric analysis. The analysis shows that GVC participation has been a significant driver of productivity growth for developing East Asian economies. Results are presented in table 5. For the average country/sector in the world, they confirm the findings in Constantinescu, Mattoo and Ruta (217) that total imports and total exports influence productivity (specification 1), that the imported input channel is relatively more important (specification 2), and that imported inputs matter for productivity whether or not they are related to GVCs (specification 3). 21 The coefficients of the interacted terms which aim to capture differential impact for developing East Asian countries relative to the average country/sector in the world are generally not significant. Gross final imports have a negative impact on productivity that is significant at the 5 percent level, suggesting that the positive effect of international competition may be outweighed by the resulting contraction in the scale of production. Our GVC results suggest that, on average, a 1 percent increase in the backward GVC participation of manufacturing sectors in developing East Asian countries corresponds to a 1.4 percent increase in labor productivity, other things being equal. In other words, developing East Asia also sees a productivity boost from GVC related imported inputs or backward linkages, and the magnitude is not significantly different from the global average. 2 The resulting data set covers 55 countries, 12 sectors and period 1995 through 211. It includes the following developing East Asian countries: China, Indonesia, Malaysia, Philippines and Vietnam. Estimations are restricted to manufacturing sectors (excluding manufacturing of coke, refined petroleum and nuclear fuel). 21 While all trade variables included in the regressions have endogeneity concerns associated with them, our focus is on identifying the causal effect due to backward GVC participation, for which we were able to find a plausible instrument. Hence, we examine this effect using IV estimation. Backward GVC participation of sector s in country c is instrumented by the average value added from the United States, Japan and Germany embodied in the exports of industry s of three countries in the sample that are closest in income to the country c. 42
45 Table 5. Labor productivity and trade Dependent variable log of labor productivity Specification Average effect Differential effect for developing East Asia Regressors (1) (2) log of gross imports.752***.483 (.212) (.632) log of gross exports.838***.541 (.172) (.66) log of gross final imports ** (.128) (.382) log of gross intermediate imports.141***.847 (.238) (.768) log of gross final exports * (.198) (.689) log of gross intermediate exports.429**.395 (.214) (.654) log of gross final imports.266*.17** log of FVA embodied in domestically absorbed output log of FVA embodied in exports (GVC backward part.) (.161) (.496).879***.622 (.182) (.518).14**.138 (.581) (.183) Notes: FVA stands for foreign value added. Specification 1 relates labor productivity to gross imports and gross exports. Specification 2 relates labor productivity to gross imports and gross exports by type of product (final and intermediates). Specifications 1 and 2 are estimated using the Ordinary Least Squares (OLS) estimation. Specification 3 relates labor productivity to three components of gross imports. It is estimated using Instrumental Variables (IV) estimation, where GVC backward participation is instrumented by the average value added originating from Germany, Japan and the United States that is embodied in the exports of three countries in the sample that have the most similar per capita income to the country in question. Regressions are run at the country, year and sector level and include controls for the log of capital stock per employee as well as the following fixed effects: country industry; country year and industry year. Column (1) displays coefficients of trade indicators (denoting average effect across countries, sectors and years) from regressions that do not account for a differential effect for developing East Asia. Column (2) displays coefficients of trade indicators interacted with developing East Asia dummy variable from regressions that account for a differential effect (average effects from these regressions are similar to average effects reported in column (1). Standard errors indicated in parenthesis; * p<.1, ** p<.5, *** p<.1. Number of observations ranges between 8,368 and 8,7. R squared:.985. Sample is restricted to manufacturing sectors excluding manufacturing of coke, refined petroleum and nuclear fuel. d. Shallow and fragmented trade agreements The trade policy framework in which developing East Asian countries operate has changed over time. By 213, with the entry of Lao PDR, all developing East Asian countries had become members of the WTO. Indonesia, Malaysia, Myanmar, the Philippines and Thailand have been members since the start in 1995, followed by Mongolia in China entered the WTO in 21, Cambodia in 24 and Vietnam in 27. In addition, as further documented below, developing East Asian economies are members of several preferential trade agreements (PTAs). The combination of multilateral, regional and (often) unilateral trade policy reforms has dramatically 43
46 reduced applied tariffs in the region. However, even though the number of trade agreements has grown, they remain relatively shallow and fragmented in nature. Developing East Asian countries are involved in a growing number of preferential trade agreements. The noodle bowl of Asian trade agreements has become denser in the last decade. Developing East Asian countries have signed a total of 36 PTAs. 22 Since some of these agreements involve several countries, such as the Association of East Asian Nations (ASEAN), each developing East Asian country has on average an agreement with 8 partners. While the proliferation of overlapping trade agreements has certainly contributed to the reduction of tariffs and other nontariff restrictions to trade, it also creates multiple, and possibly inconsistent, trade rules. The risk is that divergent trade rules may create costs for businesses and lower the efficiency of global and regional value chains (Baldwin and Kawai, 213). The content of East Asian trade agreements has also changed over time. ASEAN provides a good example of this evolving content. The free trade area, liberalizing goods trade among ASEAN economies, was established in Subsequent protocols covering services and intellectual property rights were added in 1995, an investment agreement and dispute settlement mechanism was included in 1996, and a framework agreement for the mutual recognition of standards was signed in In some cases, the new set of rules are of a legally binding nature, as for investment (WTO, 211). For other policy areas, such as intellectual property rights protection, cooperation is only on a best endeavor basis, As the ASEAN Framework Agreement on Services reflects. The extent of commitments in the agreement is limited, but the agreement does make references to schedules of commitments (Art. X) and a few more specific concessions. International agreements have not played a significant role in driving regional services reform. Drawing on surveys of applied policies in the key services sectors of ASEAN countries, Gootiiz and Mattoo (217) assessed the impact of the ASEAN Framework Agreement on Services (AFAS) and the ambitious ASEAN Economic Community Blueprint, which envisaged integrated services markets by 215 (Table 8). The analysis finds that over this period, ASEAN did not integrate faster internally than vis à vis the rest of the world: policies applied to trade with other ASEAN countries were virtually the same as those applied to trade with the rest of the world. Moreover, the recent commitments scheduled under AFAS did not produce significant liberalization and, in a few instances, services trade policy actually became more restrictive. The two exceptions are in areas that are not on the multilateral negotiating agenda: steps have been taken toward creating regional open skies in air transport, and a few mutual recognition agreements have been negotiated in professional services. These findings suggest that regional negotiations have added the most value when they were focused on areas that are not being addressed multilaterally. 22 In addition, developing East Asian countries are also members of 6 partial scope agreements that cover only a limited number of products. 44
47 Table 8. Restrictiveness of GATS commitments, Doha offers, AFAS commitments, applied policy and Blueprint goals by country Restrictiveness of GATS Restrictiveness of Doha Offers Restrictiveness of AFAS Restrictiveness of applied Restrictiveness of Blueprint Country Commitments commitments policy goals BRN No data 19.1 IDN KHM LAO MMR MYS PHL SGP THA VNM Trade rules in East Asia appear to be patchy and trade agreements remain relatively shallow. Table 9 provides an overview of the policy areas that are covered by developing East Asia countries trade agreements. Some of the policy areas that are covered by the WTO agreements are absent from most East Asian PTAs, including public procurement (covered by a plurilateral WTO agreement), subsidies and state trading enterprises. Since all developing East Asian economies are members of the WTO, multilateral rules apply to them. However, PTAs in other regions tend to go beyond multilateral rules in these areas, indicating that regional disciplines may be weaker in ASEAN than in other regions. Coverage of policy areas that are not regulated by the WTO, such as competition policy, intellectual property rights, movements of capital, visa and asylum, is even patchier. These gaps indicate that the trade agreements signed by developing East Asian countries are shallow relative to other regions with comparable shares of intraregional trade such as North America and Europe. Initiatives such as the Comprehensive and Progressive Trans Pacific Partnership (CPTPP) and the Regional Comprehensive Economic Partnership (RCEP) may help fill these regulatory gaps. But they may also risk creating regulatory fragmentation within the region and between the region and other key trading partners. This indicates the importance of ensuring open regionalism in East Asia, i.e. rules should aim at being non discriminatory or minimize their discriminatory component. 45


48 Table 9. Content of developing East Asian countries preferential agreements WTO Plus WTO Extra CONTENT FTA Customs FTA Agriculture AD Customs CVM GATS SPS TBT TRIPS TRIMS State Aid Export Taxes STE Public Procurement Investment IPR Competition Policy Movement of Capital Visa and Asylum Environmental Laws Regional Cooperation Information Society Education and Training Research and Technology Labour Market Regulation SME Agriculture Consumer Protection Cultural Cooperation Industrial Cooperation Innovation Policies Economic Policy Dialogue Data Protection Mining Public Administration ASEAN FTA China Costa Rica China Peru Malaysia Australia New Zealand Malaysia Chile China ASEAN Korea Source: Content of Deep Trade Agreements World Bank database, Hofman et al. (217). Notes: ASEAN FTA stands for Association of Southeast Asian Nations free trade area; Table lists policy areas covered in at least 3 agreements. Deepening trade agreements in East Asia can promote further GVC integration and support productivity growth. The shallow and fragmented nature of trade agreements in East Asia, and the resulting inadequacy and inconsistency of trade and investment rules within East Asia can be a stumbling block to further GVC integration and, hence, negatively affect productivity growth. Recent research shows that the depth of trade agreements is positively correlated with GVC integration (Ruta 217). Specifically, Laget et al. (218) find that signing deep PTAs doubles trade in parts and components and increases re exported value added by about 22 percent. Intuitively, better protection of foreign investment and intellectual property rights, a more competitive environment safeguarded by competition policy and the regulation of state owned enterprises, greater freedom of movement of people and capital across borders, and other deep provisions embedded in PTAs contribute to promote GVCs. Such a policy environment will be even more relevant as developing East Asian countries aim to specialize not only through low value added tasks like product assembly but aim to participate increasingly in the production of more sophisticated goods and services. Ongoing trade negotiations within East Asia and with the rest Australia Thailand Iceland China China New Zealand Thailand New Zealand Switzerland China ASEAN Australia New Zealand Pakistan Malaysia Japan ASEAN Japan Philippines Japan Viet Nam China Singapore Japan Indonesia 46
Poverty Alleviation and Inclusive Social Development in Asia and the Pacific
 Poverty Alleviation and Inclusive Social Development in Asia and the Pacific Nagesh Kumar, Director, Social Development Division, UN-ESCAP At EGM on Strategies for Eradicating Poverty to achieve Sustainable
Globalization, Technology and the Decline in Labor Share of Income. Mitali Das Strategy, Policy and Research Department. IMF
 Globalization, Technology and the Decline in Labor Share of Income Mitali Das Strategy, Policy and Research Department. IMF 1 The global labor share of income has been on a downward trend Evolution of
UNDERSTANDING GVCS: INSIGHTS FROM RECENT OECD WORK
 UNDERSTANDING GVCS: INSIGHTS FROM RECENT OECD WORK Javier Lopez Gonzalez, Development Division, OECD Trade and Agriculture Directorate Bangkok 12 th of December 2014 Outline i. How do we capture participation?
GLOBAL MONITORING REPORT 2015/2016
 GLOBAL MONITORING REPORT 215/216 Development Goals in an Era of Demographic Change MARCIO CRUZ DEVELOPMENT PROSPECTS GROUP Global Monitoring Report 215/216 Implications of Demographic Change: Pathways
0 20,000 40,000 60,000 GDP per capita ($)
") 4 Chapter 1 Economic Growth and Economic Development: The Questions Density of countries 1960 1980 2000 0 20,000 40,000 60,000 GDP per capita ($) FIGURE 11 Estimates of the distribution of countries according
4 Chapter 1 Economic Growth and Economic Development: The Questions Density of countries 1960 1980 2000 0 20,000 40,000 60,000 GDP per capita ($) FIGURE 11 Estimates of the distribution of countries according
Country-Specific Investments and the Rights of Non-Citizens
 ARTICLE Country-Specific Investments and the Rights of Non-Citizens ADAM S. CHILTON & ERIC A. POSNER * In a 2007 article, Adam Cox and Eric Posner developed a Second Order theory of immigration law that
Global Profile of Diasporas
 Tenth Coordination Meeting on International Migration New York, 9-10 February 2012 Global Profile of Diasporas Jean-Christophe Dumont Head of International Migration Division Directorate for Employment,
U.S. Food Aid and Civil Conflict
 Web Appendix for U.S. Food Aid and Civil Conflict Nathan Nunn Harvard University, BREAD, NBER Nancy Qian Yale University, BREAD, NBER (Not for Publication) August 2013 1 1. Introduction This appendix accompanies
Skills for Trade, Employability and Inclusive Growth. Matching skills for the future of work and regional integration in Asia and the Pacific
 Inter-regional Technical Forum on Skills for Trade, Employability and Inclusive Growth Matching skills for the future of work and regional integration in Asia and the Pacific Akiko Sakamoto ILO-Bangkok
LINGUISTIC DIVERSITY, OFFICIAL LANGUAGE CHOICE AND NATION BUILDING: THEORY AND EVIDENCE
 LINGUISTIC DIVERSITY, OFFICIAL LANGUAGE CHOICE AND NATION BUILDING: THEORY AND EVIDENCE David D. Laitin (Stanford University) and Rajesh Ramachandran (Goethe University) The International Political Economy
Productive capacity development in the Asia-Pacific LDCs
 Productive capacity development in the Asia-Pacific LDCs ESCAP/OHRLLS Asia-Pacific Regional Meeting on Implementing the Istanbul Programme of Action (IPoA) 14-16 December 2011, Bangkok, Thailand Clovis
Follow links for Class Use and other Permissions. For more information send to:
 COPYRIGHT NOTICE: Daron Acemoglu: Introduction to Modern Economic Growth is published by Princeton University Press and copyrighted, 2008, by Princeton University Press. All rights reserved. No part of
Global Imbalances 2017 External Sector Report
 International Monetary Fund Global Imbalances 2017 External Sector Report Gustavo Adler and Luis Cubeddu IMF Research Department Bruegel Brussels, September 26, 2017 Roadmap I. Recent developments II.
Human Development : Retrospective and Prospects. Jeni Klugman, HDRO/ UNDP. Tuesday February 23, 2010
 Human Development : Retrospective and Prospects Jeni Klugman, HDRO/ UNDP Tuesday February 23, 2010 1 Overview 1. What is the HDR? 2. Retrospective 3. Prospects What is Human Development? Development can
Gender Inequality and Growth: The Case of Rich vs. Poor Countries
 World Bank From the SelectedWorks of Mohammad Amin July, 2012 Gender Inequality and Growth: The Case of Rich vs. Poor Countries Mohammad Amin Veselin Kuntchev Available at: https://works.bepress.com/mohammad_amin/45/
the atlas of E C O N O M I C C O M P L E X I T Y
 the atlas of E C O N O M I C C O M P L E X I T Y M a p p i n g P a t h s T o P r o s p e r i t y Hausmann, Hidalgo et al. T H E A T L A S O F E C O N O M I C C O M P L E X I T Y M A P P I N G P A T H S
Chad TCD Sub-Saharan Africa Low income Channel Islands CHI Europe & Central Asia High income Chile CHL Latin America & Caribbean High income China CHN
 Afghanistan AFG South Asia Low income Albania ALB Europe & Central Asia Upper middle income Algeria DZA Middle East & North Africa Upper middle income American Samoa ASM East Asia & Pacific Upper middle
Inclusive Growth: Challenges For The East Asia Region
 Inclusive Growth: Challenges For The East Asia Region ADFIAP International CEO Forum XI New World Makati Hotel, Makati City, Dec 8, 2015 Rogier van den Brink Lead Economist and Program Leader World Bank
Chapter 17. Other source data Macroeconomic data. Betina Dimaranan
 Chapter 17 Other source data 17.1 Macroeconomic data Betina Dimaranan The 1992 macroeconomic data that was used directly in the FIT process to update the regional inputoutput tables include the following
Avoiding unemployment is not enough
 n 4 August 2018 Avoiding unemployment is not enough An analysis of other forms of labour underutilization 1 The unemployment rate is undoubtedly the most widely cited labour market indicator by media and
Economic Growth: Lecture 1, Questions and Evidence
 14.452 Economic Growth: Lecture 1, Questions and Evidence Daron Acemoglu MIT October 24, 2017. Daron Acemoglu (MIT) Economic Growth Lecture 1 October 24, 2017. 1 / 38 Cross-Country Income Differences Cross-Country
POLITECNICO DI TORINO Repository ISTITUZIONALE
 POLITECNICO DI TORINO Repository ISTITUZIONALE Global effects of local food-production crises: a virtual water perspective Original Global effects of local food-production crises: a virtual water perspective
The Rule of Law for All July 2013 The Hague, Netherlands
 The Rule of Law for All 8-11 July 2013 The Hague, Netherlands (I was called) to bring about the rule of righteousness in the land... so that the strong should not harm the weak. - Prologue, Hammurabi s
Trans-Pacific Trade and Investment Relations Region Is Key Driver of Global Economic Growth
 Trans-Pacific Trade and Investment Relations Region Is Key Driver of Global Economic Growth Background The Asia-Pacific region is a key driver of global economic growth, representing nearly half of the
ADDRESSING THE ISSUE OF YOUTH UNEMPLOYMENT: ISSUES AND THE CAUSES. Samuel Freije World Development Report 2013 Team, World Bank
 ADDRESSING THE ISSUE OF YOUTH UNEMPLOYMENT: ISSUES AND THE CAUSES Samuel Freije World Development Report 2013 Team, World Bank A growing concern about jobs The global financial crisis resulted in massive
Report on the 3P Anti-trafficking Policy Index 2015 (Cho, Seo-Young University of Marburg)
") The Country-rankings of the 3P Anti-trafficking Policy Index for 2015 Released - Best Practice of Austria, the UK, and Spain - Modest Improvement in Protection and Prevention Efforts - Persistently Weak
The Country-rankings of the 3P Anti-trafficking Policy Index for 2015 Released - Best Practice of Austria, the UK, and Spain - Modest Improvement in Protection and Prevention Efforts - Persistently Weak
Global trends: an ever more integrated world economy?
 Global trends: an ever more integrated world economy? Bernard Hoekman Banque Mondiale Peut-on domestiquer la mondialisation Lyon, 9 Novembre, 211 1 1965 1967 1969 1971 1973 1975 1977 1979 1981 1983 1985
It is about Wealth, not (only) Income: What the World Bank says and does not say
 Income: What the World Bank says and does not say") Georgetown University From the SelectedWorks of Josep M. Colomer February 19, 2018 It is about Wealth, not (only) Income: What the World Bank says and does not say Josep M. Colomer Available at: https://works.bepress.com/josep_colomer/
Georgetown University From the SelectedWorks of Josep M. Colomer February 19, 2018 It is about Wealth, not (only) Income: What the World Bank says and does not say Josep M. Colomer Available at: https://works.bepress.com/josep_colomer/
Charting Indonesia s Economy, 1H 2017
 Charting Indonesia s Economy, 1H 2017 Designed to help executives interpret economic numbers and incorporate them into company s planning. Publication Date: January 3 rd, 2017 Next Issue: To be published
Economic Growth: Lecture 1, Questions and Evidence
 14.452 Economic Growth: Lecture 1, Questions and Evidence Daron Acemoglu MIT October 21, 2014 Daron Acemoglu (MIT) Economic Growth Lecture 1 October 21, 2014. 1 / 39 Cross-Country Income Differences Cross-Country
comercio internacional
 S E R I E comercio internacional 9 T rade and investment promotion between Asia- Pacific and Latin America: Present position and future prospects Mikio Kuwayama José Carlos Mattos Jaime Contador International
The Challenge of Inclusive Growth: Making Growth Work for the Poor
 2015/FDM2/004 Session: 1 The Challenge of Inclusive Growth: Making Growth Work for the Poor Purpose: Information Submitted by: World Bank Group Finance and Central Bank Deputies Meeting Cebu, Philippines
Proliferation of FTAs in East Asia
 Proliferation of FTAs in East Asia Shujiro URATA Waseda University and RIETI April 8, 2005 Contents I. Introduction II. Regionalization in East Asia III. Recent Surge of FTAs in East Asia IV. The Factors
The Institute for Economics & Peace Quantifying Peace and its Benefits
 The Institute for Economics & Peace Quantifying Peace and its Benefits The Institute for Economics and Peace (IEP) is an independent, non partisan, non profit research organization dedicated to promoting
IS THE CASE FOR CENTRAL BANK INDEPENDENCE DEAD?
 IS THE CASE FOR CENTRAL BANK INDEPENDENCE DEAD? ED BALLS AND ANNA STANSBURY DISCUSSED BY LAWRENCE SUMMERS AND ADAM POSEN PETERSON INSTITUTE FOR INTERNATIONAL ECONOMICS WASHINGTON, DC APRIL 23, 2018 ALESINA
Deepening and Widening of Production Networks in ASEAN *
 ERIA-DP-216-9 ERIA Discussion Paper Series Deepening and Widening of Production Networks in ASEAN * Ayako OBASHI University of Wisconsin and Keio University Fukunari KIMURA Keio University and Economic
Chapter 5: Internationalization & Industrialization
 Chapter 5: Internationalization & Industrialization Chapter 5: Internationalization & Industrialization... 1 5.1 THEORY OF INVESTMENT... 4 5.2 AN OPEN ECONOMY: IMPORT-EXPORT-LED GROWTH MODEL... 6 5.3 FOREIGN
Governance from words to deeds
 Governance from words to deeds Learning Lunch with Miguel Schloss 1818 Society Water Group, May 13, 2011 Agenda There is no such thing as a free lunch Milton Freedman Governance: why and what for The approach:
Release notes MDR NAL publication [xml]
![Release notes MDR NAL publication [xml]](/thumbs/82/84771393.jpg "Release notes MDR NAL publication [xml]") Dissemination and Reuse Directorate Documentary Management and Metadata Unit Standardisation and Registry of Metadata Section Release notes MDR NAL publication 2060525-0 [xml] Publications Office of the
Dissemination and Reuse Directorate Documentary Management and Metadata Unit Standardisation and Registry of Metadata Section Release notes MDR NAL publication 2060525-0 [xml] Publications Office of the
VIII. Government and Governance
 247 VIII. Government and Governance Snapshot Based on latest data, three-quarters of the economies in Asia and the Pacific incurred fiscal deficits. Fiscal deficits also exceeded 2% of gross domestic product
World Bank list of economies (NOV 2017)
") World Bank list of economies (NOV 2017) (Bold indicates a change of classification, whole line bold is WSAVA member) Changed in 2017 to tier colour nr. WSAVA MEMBER? Economy/ Association Code WSAVA REGION
World Bank list of economies (NOV 2017) (Bold indicates a change of classification, whole line bold is WSAVA member) Changed in 2017 to tier colour nr. WSAVA MEMBER? Economy/ Association Code WSAVA REGION
Education, financial markets and economic growth
 Education, financial markets and economic growth Lucas Papademos European Central Bank 35th Economics Conference on Human Capital and Economic Growth Österreichische Nationalbank Vienna, 21 May 1 Outline
INCLUSIVE GROWTH AND POLICIES: THE ASIAN EXPERIENCE. Thangavel Palanivel Chief Economist for Asia-Pacific UNDP, New York
 INCLUSIVE GROWTH AND POLICIES: THE ASIAN EXPERIENCE Thangavel Palanivel Chief Economist for Asia-Pacific UNDP, New York Growth is Inclusive When It takes place in sectors in which the poor work (e.g.,
Is There Convergence in the Future of Global Capitalism? Dani Rodrik April 2017
 Is There Convergence in the Future of Global Capitalism? Dani Rodrik April 2017 Convergence of what? Economics: standards of living GDP per head Politics: models of governance liberal/social democracy
MIC Forum: The Rise of the Middle Class
 MIC Forum: The Rise of the Middle Class Augusto de la Torre Jamele Rigolini We would like to thank Shubham Chaudhuri, Stefano Curto, Maria Davalos, Carolina Sanchez-Paramo and Joao Pedro Wagner de Azevedo
Charting Singapore s Economy, 1H 2017
 Charting Singapore s Economy, 1H 2017 Designed to help executives interpret economic numbers and incorporate them into company s planning. Publication Date: January 3 rd, 2017 Next Issue: To be published
Diagnostic Tools and Empirical Analysis of Governance as an Input in the Fight against Corruption.
 Diagnostic Tools and Empirical Analysis of Governance as an Input in the Fight against Corruption. Anti-corruption Workshop Francesca Recanatini World Bank Institute www.worldbank.org/wbi/governance/esp
THAILAND SYSTEMATIC COUNTRY DIAGNOSTIC Public Engagement
 THAILAND SYSTEMATIC COUNTRY DIAGNOSTIC Public Engagement March 2016 Contents 1. Objectives of the Engagement 2. Systematic Country Diagnostic (SCD) 3. Country Context 4. Growth Story 5. Poverty Story 6.
Policies against Human Trafficking: The Role of Religion and Political Institutions
 Policies against Human Trafficking: The Role of Religion and Political Institutions Niklas Potrafke CESIFO WORKING PAPER NO. 4278 CATEGORY 2: PUBLIC CHOICE JUNE 2013 An electronic version of the paper
Charting South Korea s Economy, 1H 2017
 Charting South Korea s Economy, 1H 2017 Designed to help executives interpret economic numbers and incorporate them into company s planning. Publication Date: January 3 rd, 2017 Next Issue: To be published
Presence of language-learning opportunities abroad and migration to Germany
 Presence of language-learning opportunities abroad and migration to Germany Matthias Huber Silke Uebelmesser University of Jena, Germany International Forum on Migration Statistics OECD, Paris, January
Social Outlook for Asia and the Pacific: Poorly Protected. Predrag Savic, Social Development Division, ESCAP. Bangkok, November 13, 2018
 Social Outlook for Asia and the Pacific: Poorly Protected Predrag Savic, Social Development Division, ESCAP Bangkok, November 13, 2018 Outline 1. Poverty as a challenge in Asia and the Pacific 2. Lack
SINO-ASEAN ECONOMIC INTEGRATION AND ITS IMPACT ON INTRA-ASEAN TRADE
 SINO-ASEAN ECONOMIC INTEGRATION AND ITS IMPACT ON INTRA-ASEAN TRADE Sarah Y. TONG & LIM Tin Seng EAI Working Paper No. 144 ISSN 219-1318 ISBN 978-981-8-2359-7 All rights reserved Date of Publication: 8
Statistics to Measure Offshoring and its Impact
 Statistics to Measure Offshoring and its Impact by Robert C. Feenstra University of California, Davis, and NBER For presentation at THE FOURTH IMF STATISTICAL FORUM LIFTING THE SMALL BOATS: STATISTICS
Globalization GLOBALIZATION REGIONAL TABLES. Introduction. Key Trends. Key Indicators for Asia and the Pacific 2009
 GLOBALIZATION 217 Globalization The People s Republic of China (PRC) has by far the biggest share of merchandise exports in the region and has replaced Japan as the top exporter. The largest part of Asia
Dirk Pilat:
 Note: This presentation reflects my personal views and not necessarily those of the OECD or its member countries. Research Institute for Economy Trade and Industry, 28 March 2006 The Globalisation of Value
China and India:Convergence and Divergence
 China and India:Convergence and Divergence I. "What China is good at, India is not and vice versa. The countries are inverted mirror of each other».. «very real possibility that China and India will in
Charting Australia s Economy
 Charting Australia s Economy Designed to help executives catch up with the economy and incorporate macro impacts into company s planning. Annual subscription includes 2 semiannual issues published in June
EXECUTIVE SUMMARY. Shuji Uchikawa
 EXECUTIVE SUMMARY Shuji Uchikawa ASEAN member countries agreed to establish the ASEAN Economic Community by 2015 and transform ASEAN into a region with free movement of goods, services, investment, skilled
Supplementary figures
 Supplementary figures Source: OECD (211d, p. 8). Figure S3.1 Business enterprise expenditure on R&D, 1999 and 29 (as a percentage of GDP) ISR FIN SWE KOR (1999, 28) JPN CHE (2, 28) USA (1999, 28) DNK AUT
Charting Philippines Economy, 1H 2017
 Charting Philippines Economy, 1H 2017 Designed to help executives interpret economic numbers and incorporate them into company s planning. Publication Date: January 3 rd, 2017 Next Issue: To be published
Making Growth Work for the Poor: The Challenge of Inclusive Growth
 15/SOM1/EC/39 Agenda Item: 7 Making Growth Work for the Poor: The Challenge of Inclusive Growth Purpose: Information Submitted by: World Bank First Economic Committee Meeting Clark, Philippines 4-5 February
PART 1. TRADE, FDI and ODA
 PART 1 TRADE, FDI and ODA 15 China s Trade and FDI to MRB Countries: An Advocacy Document Xingmin Yin INTRODUCTION The Mekong River Basin (MRB) covers five countries: Cambodia, Lao PDR, Myanmar, Thailand,
I. Patterns Economic Development in Africa
 ECON 184 I. Patterns Economic Development in Africa ECON 184: Patterns of Econ. Dev. January 7, 2010 1 1 Trivia 1. Name this President ECON 184: Patterns of Econ. Dev. January 7, 2010 2 Answers ECON 184:
 Governance Research Indicators Project Governance Matters III: Indicators for 1996-2002 Daniel Kaufmann, Aart Kraay and Massimo Mastruzzi The World Bank Presentation at the Wokshop at 10.3 on New Frontiers,
Investing in Malaria Elimination in the Asia Pacific Region
 Investing in Malaria Elimination in the Asia Pacific Region Malaria elimination in the Asia Pacific region is an achievable goal with benefits outweighing the costs, paving the way for global malaria eradication.
MEGA-REGIONAL FTAS AND CHINA
 Multi-year Expert Meeting on Enhancing the Enabling Economic Environment at All Levels in Support of Inclusive and Sustainable Development (2nd session) Towards an enabling multilateral trading system
Japan s Policy to Strengthen Economic Partnership. November 2003
 Japan s Policy to Strengthen Economic Partnership November 2003 1. Basic Structure of Japan s External Economic Policy -Promoting Economic Partnership Agreements with closely related countries and regions
The State of Food and Agriculture. A annual FAO report Since 1947
 The State of Food and Agriculture A annual FAO report Since 1947 Characteristics of SOFA thematic reports Thematic focus Key audiences: Member governments FAO meetings; Media; Civil society; Researchers
Charting Cambodia s Economy
 Charting Cambodia s Economy Designed to help executives catch up with the economy and incorporate macro impacts into company s planning. Annual subscription includes 2 semiannual issues published in June
World trade interdependencies: a New Zealand perspective
 World trade interdependencies: a New Zealand perspective David Gillmore and Phil Briggs A key determinant of New Zealand s growth is its trade with the rest of the world. We have developed a world inputoutput
The Role of Human Capital: Immigrant Earnings
 The Role of Human Capital: Immigrant Earnings Econ821 Prof. Lutz Hendricks March 10, 2016 1 / 32 The Idea How could one measure human capital without knowing the production function? The problem: we only
International Migration to the OECD in the 21 st Century
 KNOMAD Working Paper 16 International Migration to the OECD in the 21 st Century Cansin Arslan Jean-Christophe Dumont Zovanga L. Kone Çağlar Özden, Christopher R. Parsons Theodora Xenogiani October 2016
Economics of the Trans- Pacific Partnership (TPP)
") Economics of the Trans- Pacific Partnership (TPP) AED/IS 4540 International Commerce and the World Economy Professor Sheldon sheldon.1@osu.edu What is TPP? Trans-Pacific Trade Partnership (TPP), signed
Economics of the Trans- Pacific Partnership (TPP) AED/IS 4540 International Commerce and the World Economy Professor Sheldon sheldon.1@osu.edu What is TPP? Trans-Pacific Trade Partnership (TPP), signed
Who Gives Foreign Aid to Whom and Why?
 Journal of Economic Growth, 5: 33 63 (March 2000) c 2000 Kluwer Academic Publishers. Printed in the Netherlands. Who Gives Foreign Aid to Whom and Why? ALBERTO ALESINA Department of Economics, Harvard
VIETNAM FOCUS. The Next Growth Story In Asia?
 The Next Growth Story In Asia? Vietnam s economic policy has dramatically transformed the nation since 9, spurring fast economic and social development. Consequently, Vietnam s economy took off booming
HIGHLIGHTS. Part I. Sustainable Development Goals. People
 xxix HIGHLIGHTS Part I. Sustainable Development Goals The Millennium Development Goals (MDGs) had shaped development policies around the world with specific, time-bound, and quantifiable targets since
Governance Research Indicators Project
 Governance Research Indicators Project Governance Matters III: Indicators for 1996-2002 Daniel Kaufmann, Aart Kraay and Massimo Mastruzzi The World Bank Presentation at the Munich Centre for Economic,
1.3. Rankings: imports, exports and overall trade volume Philippines trade with EU Member States Structure and trends by product
 Front Cover Contents 1 Overview 2 1. Trade Relations 1.1. Trade in goods: main trends 1.2. Trade in services 1.3. Rankings: imports, exports and overall trade volume 1.4. Comparison of EU-Philippines
TRENDS AND DEVELOPMENTS IN COMMERCIAL SERVICES TRADE 1
 2 TRENDS AND DEVELOPMENTS IN COMMERCIAL SERVICES TRADE 1 CHAPTER 2 A. ASIA-PACIFIC EXPORTS OF COMMERCIAL SERVICES CONTINUE TO SLOW A slow-down of merchandise exports by Asia-Pacific economies during 213
Micro Structure of Global Imbalance and the Development of Global value-chains. Jun Yang and Zhi Wang Research Institute of Global Value Chain, UIBE
 Micro Structure of Global Imbalance and the Development of Global value-chains Jun Yang and Zhi Wang Research Institute of Global Value Chain, UIBE Xin Li Beijing Normal University Abstract Global imbalances
Volatility, diversification and development in the Gulf Cooperation Council countries
 Kuwait Programme on Development, Governance and Globalisation in the Gulf States Volatility, diversification and development in the Gulf Cooperation Council countries Miklos Koren and Silvana Tenreyro
Corporate Corruption Matters for Public Governance:
 Corporate Corruption Matters for Public Governance: Empirical Evidence and Implications for Anti-Corruption Strategies Daniel Kaufmann, World Bank Institute www.worldbank.org/wbi/governance Keynote Presentation
ECONOMICS INTERNATIONAL MIGRATION TO THE OECD IN THE TWENTY-FIRST CENTURY. Cansin Arslan International Migration Division, OECD
 ECONOMICS INTERNATIONAL MIGRATION TO THE OECD IN THE TWENTY-FIRST CENTURY by Cansin Arslan International Migration Division, OECD Jean-Christophe Dumont International Migration Division, OECD Zovanga Kone
Poverty, Inequality and Jobs: How does the sectoral composition of employment affect inequality?
 Poverty, Inequality and Jobs: How does the sectoral composition of employment affect inequality? Arief Yusuf, Padjadjaran University, Indonesia & Andy Sumner, King s College London Introduction Traditional
Economic Trends Across the Asia Pacific Region. Pansy Yau Deputy Director of Research
 Economic Trends Across the Asia Pacific Region Pansy Yau Deputy Director of Research 2 Rebalancing of the World Economy % 70.00 65.00 60.00 55.00 50.00 45.00 40.00 35.00 Share of world total GDP (PPP)
Country Update. Manufactured products exports: Technical Barriers to Trade faced by exporters from Vietnam VIET NAM. Provided by
 VIET NAM JULY 2016 CONNEXION FORUM Country Update Manufactured products exports: Technical Barriers to Trade faced by exporters from Vietnam Provided by CUTS International, Hanoi Resource Centre www.cuts-hrc.org/en
Why some countries grow rich, and others don t
 Why some countries grow rich, and others don t 2008 Yan Fu Memorial Lecture James A. Robinson Harvard University The Comparative Prosperity of Nations Vast differences in prosperity across countries today.
Mastercard Index of Women Entrepreneurs (MIWE) 2018
 2018") Mastercard Index of Women Entrepreneurs (MIWE) 2018 Table of Contents 1.0 Introduction 2.0 Overview of Key Findings 2 15 1.1. Description of 9 18 Indicator and Sources 2.1. Benchmark: Women Business Owners
Mastercard Index of Women Entrepreneurs (MIWE) 2018 Table of Contents 1.0 Introduction 2.0 Overview of Key Findings 2 15 1.1. Description of 9 18 Indicator and Sources 2.1. Benchmark: Women Business Owners
Governance and Corruption: Evidence and Implications
 Governance and Corruption: Evidence and Implications Francesca Recanatini and Daniel Kaufmann Meeting with future Russian Leaders, The World Bank, October 25 th, 2002 Governance and Poverty Nexus Lower
Decent Work for All ASIAN DECENT WORK DECADE
 Tourism and employment in Asia: Challenges and opportunities in the context of the economic crisis Guy Thijs Deputy Regional Director ILO Regional Office for Asia and the Pacific Decent Work for All ASIAN
TRAVEL SERVICE EXPORTS AS COMPARATIVE ADVANTAGE IN SOUTH AFRICA
 TRAVEL SERVICE EXPORTS AS COMPARATIVE ADVANTAGE IN SOUTH AFRICA Johan Fourie 1 World service exports have grown at a rapid rate over the past few decades. While some countries have benefited from the surge
Improving International Migration Statistics Selected examples from OECD
 CARIM-East Methodological Workshop II Warsaw, 27-28 October 2011 Improving International Migration Statistics Selected examples from OECD Jean-Christophe Dumont Head of International Migration Division
2011 ICP: Validation and Experimental calculations
 Public Disclosure Authorized Public Disclosure Authorized Public Disclosure Authorized Public Disclosure Authorized International Comparison Program [01.02] 2011 ICP: Validation and Experimental calculations
Economic Development: Miracle, Crisis and Regionalism
 Economic Development: Miracle, Crisis and Regionalism Min Shu School of International Liberal Studies Waseda University 18 Dec 2017 IR of Southeast Asia 1 Outline of the Lecture Southeast Asian economies
Mizuho Economic Outlook & Analysis
 Mizuho Economic Outlook & Analysis The 18th Questionnaire Survey of Japanese Corporate Enterprises Regarding Business in Asia (February 18) - Japanese Firms Reevaluate China as a Destination for Business
Presentation on TPP & TTIP Background and Implications. by Dr V.S. SESHADRI at Centre for WTO Studies New Delhi 3 March 2014
 Presentation on TPP & TTIP Background and Implications by Dr V.S. SESHADRI at Centre for WTO Studies New Delhi 3 March 2014 Contents of Presentation 1. What is TPP? 2. What is TTIP? 3. How are these initiatives
Worldwide Governance Indicators and key Findings: Implications for Credit, Investment and Policies in Emerging Markets
 Worldwide Governance Indicators and key Findings: Implications for Credit, Investment and Policies in Emerging Markets Daniel Kaufmann The World Bank Institute www.worldbank.org/wbi/governance or, www.
AFTA as Real Free trade Area
 1 Executive Summary AFTA as Real Free trade Area Submitted to Department of Business Economics Ministry of Commerce By Kwanjai Sothitorn Nualnoi Pongsa Arunsmith Mallikamas Treerat Pornchaiwiseskul January
Chapter 11. Trade Policy in Developing Countries
 Chapter 11 Trade Policy in Developing Countries Preview Import-substituting industrialization Trade liberalization since 1985 Trade and growth: Takeoff in Asia Copyright 2015 Pearson Education, Inc. All