2016 Uniform Crime Reporting for CAPCOG
|
|
|
- Aldous Erik Stevenson
- 5 years ago
- Views:
Transcription
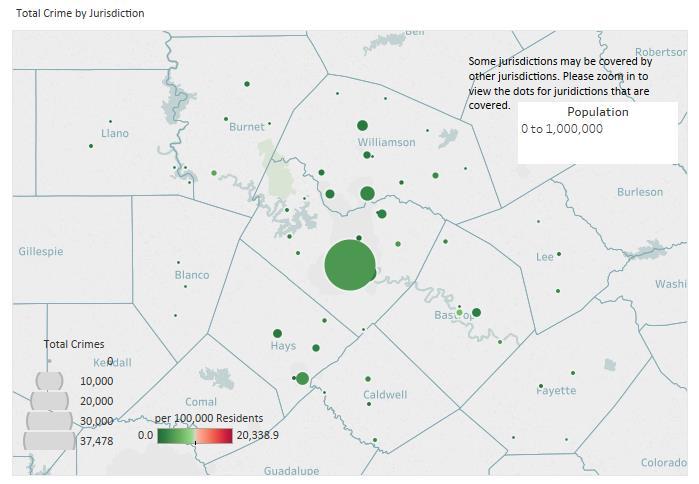
1 2016 Uniform Crime Reporting for CAPCOG Every year, the Texas Department of Public Safety publishes the Crime in Texas Report, which provides summary information on 7 types of crimes tracked and reported on by law enforcement agencies that participate in Uniform Crime Reporting. These crimes include: murder, rape, robbery, aggravated assault, burglary, larceny, and auto theft. The uniformity of this reporting makes it easy to compare crime across the different law enforcement jurisdictions in Texas. In October 2017, the 2016 report was released. It contains information on the number of crimes reported, crimes cleared, and arrests made under each of the 7 index crimes. Comparing crime data across all jurisdictions in the CAPCOG region can be useful to get a picture of crime trends and issues in the region s different communities. Because the information provided in the Crime in Texas Report is presented in a format that makes analyzing the Capital Area difficult, we ve compiled this information into a series of data visualizations below The post below contains some observations on total and violent crime in the CAPCOG region. Additional information and data on specific types of crime has been made available on CAPCOG s Criminal Justice Resource Page. Before discussing the data itself, there are a few important facets of the data to note. One difficulty when comparing crime across jurisdiction is differences in populations. To account for these differences across jurisdictions, we calculate the crime rate, which presents crimes per 100,000 residents. Looking at crime rates allows for more useful comparisons across jurisdictions, but it is also worth pointing out that in communities with small populations, a single crime has a very large impact on the crime rate. For example, each crime reported by the Austin PD (956,911 residents) increases their crime rate by around 0.1; while each crime reported in Mustang Ridge (990 residents) or Lexington (1,183 residents) increases the crime rate of those jurisdictions by around 100. Another challenge when working with crime rates is that Independent School Districts (ISD) and University Police Departments do not have any permanent residents, so calculating a crime rate per 100,000 residents is not possible. Additionally, crime rates, which normalize data based on resident population, do not necessarily do a good job of accounting for non-resident activity. For example, if a small community is a large retail destination (e.g., Sunset Valley in Travis County), the resident population is a poor proxy for the total number of people in the community at any one time. As a general rule, small communities with lots of non-resident activity will have higher crime rates. The Crime in Texas Report also contains information on the number of arrests made and number of crimes cleared by each reporting agency in the Capital Area. Because it is hard to compare the number of arrests and clearances across jurisdictions with differences in the number of crimes committed, arrest rates and clearance rates per crime are typically used for comparisons. In 2016, the CAPCOG region had a 16% arrest rate and a 20% clearance rate for all crimes. For violent crimes, the arrest and clearance rates were 43% and 49%, respectively. For context, nationwide, total crime arrest and clearance rates are slightly higher, at 20% and 22%, respectively. National violent crime arrest and clearance rates are slightly lower than the rates in the Capital Area, at 41% and 46%. Total Crime Total crime is the sum total of all of the incidents of the 7 index crimes in the Crime in Texas Report. The figure below contains a table with information on the total number of crimes reported, the rate of crime
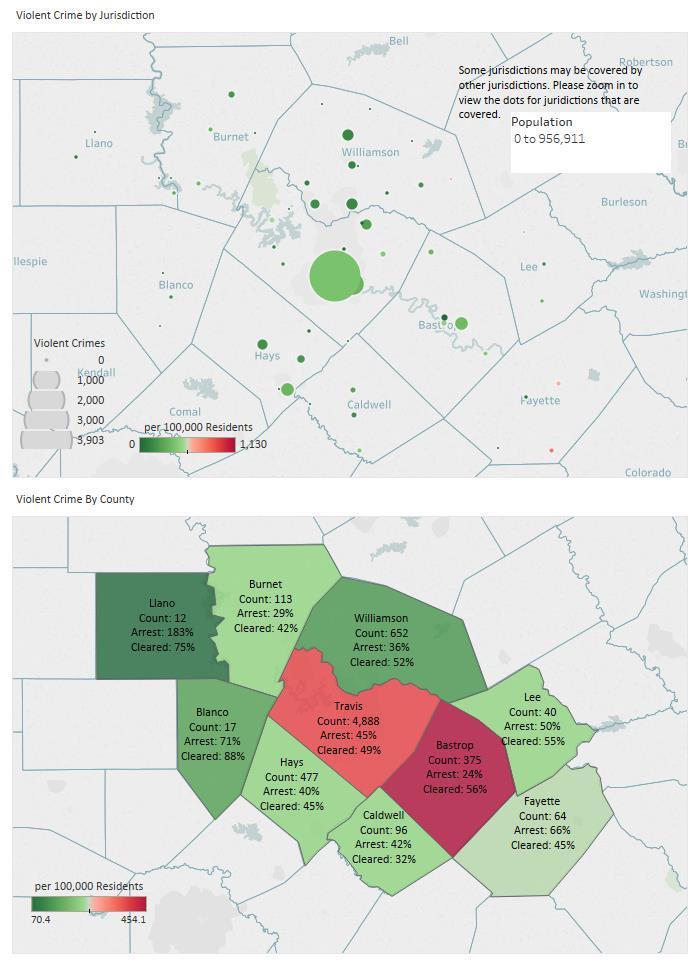
2 per 100,000 residents in the jurisdiction, and the number and percent of crimes cleared and arrests made by law enforcement agencies. This table can be used to find information about total crime in any jurisdiction in the CAPCOG region and can be filtered by county to compare crime across the different jurisdictions in each county. The figure also contains a map with dots that represent the number of crimes committed in the jurisdiction (dot size) and the jurisdiction s crime rate (dot color). Users can filter which jurisdictions are represented on this map based on their population. Lastly, the figure contains a second map, which, rather than examining jurisdictions, provides information on crime, arrest, and clearance for each county in the CAPCOG region. This map is color coded so that counties with the lowest crime rates are dark green, and the counties with the highest crime rates are dark red.
3

4 There are a few trends that emerge in the data above. First, urban areas tend to have higher crime rates. The 18 highest crime rates in the region and 19 of the 20 highest rates in the Capital Area were reported by city police departments. County sheriff s departments, which tend to serve more rural populations, reported lower crime rates. Of the Capital Area s 10 counties, 8 county sheriff s departments reported crime rates that place them in the bottom 20 among all jurisdictions. The cities that make up the top 10 highest crime rates in the region are geographically dispersed. Seven of the 10 CAPCOG counties host a city with a crime rate in the region s top 10. o Only Blanco County, Caldwell County (Lockhart is 11 th ), and Llano County (the City of Llano did not report) are without a city in the top 10. Of the 12 jurisdictions in the region with over 25,000 residents, 8 have a crime rate higher than the regions median crime rate of 1, o 3 of the 4 agencies with greater than 25,000 residents and a crime rate below the median rate are in Williamson County, these are the Leander PD, the Georgetown PD, and the Williamson County Sheriff s Office. The Hays County Sheriff s Office is the other agency in this group.
5 Only 4 jurisdictions in the CAPCOG region contain over 100,000 residents. Of those, only the Williamson County Sheriff s Office had a crime rate below 2,000 in The 2 cities, Round Rock and Austin, had higher crime rates than the 2 counties in that group. Along with observations about reported crime, we can also make a few observations about arrest rates and crime rates: High arrest rates (arrests per crime) tend to be correlated with higher crime rates. 7 of the 10 agencies with the highest arrest rates have a crime rate greater than the median for the region. 8 of the 10 agencies with the lowest arrest rates have a crime rate below the median crime rate in the CAPCOG region. Half of these agencies made 0 arrests in No university police department in the region had an arrest rate above the regional median. On the other hand, 2 of the 3 school district police departments had arrest rates above this median. With a little extra work, we can compare arrests and clearance rates for agencies based on the number of residents under their jurisdiction. The optimal community size may be somewhere between 5,000 and 10,000 residents, at least based on arrest and clearance rates. All jurisdictions within this population range reported an arrest rate, a clearance rate, or both that were above the regional median. Larger populations show a dip in clearance rates. Over 50% of jurisdictions with populations between 10,000 and 50,000 were above the regional median for arrest rate, but only a quarter of these jurisdictions are above the median clearance rate. Smaller communities make arrests and clear crimes at a lower rate. Of the 17 jurisdictions with between 1,000 and 5,000 residents in the Capital Area, only 7 have either an arrest rate or clearance rates above the region s median rate. More information can be taken from the above figure by using the filters and looking closer at the data. Violent Crime Violent crime, which is the subset of total crime where the victim is physically harmed, includes: murder, rape, robbery, and aggravated assault. These crimes make up about 11% of all index crimes reported in As with total crime, the Austin PD (3,903) reported more violent crimes than the rest of region combined (2,831). The median violent crime rate for the region is 155.1, and the median arrest rate is 36% for violent crimes. The median clearance rate for violent crime by CAPCOG jurisdictions is 50%, more than double the median clearance rate for total crime. In order to compare violent crime across the different jurisdictions and counties in the Capital Area, the below figure was created. It is similar in structure to the figure above, but contains information on violent crime rather than total crime.
6
7
8 Notably: Of the 60 total agencies in the Capital Area, 7 agencies reported no violent crimes and 6 more agencies reported only one violent crime in The Granite Shoals PD is the only agency with a jurisdiction of over 5,000 residents to report less than 10 violent crimes in Although the total number of violent crimes in small communities is low, the 10 highest violent crime rates in 2016 were from cities that had fewer than 10,000 residents. The Austin PD reported the 11 th highest violent crime rate in the region. 9 of the 10 jurisdictions with populations between 5,000 and 10,000 residents had a violent crime rate greater than the median rate for the Capital Area. Violent crime rates for agencies reporting at least 10 violent crimes, range from 68.4 by the Fayette County Sheriff s Office to by the Schulenburg PD. Interestingly, Schulenburg is a city in Fayette County. Next we can take a look at some observations on violent crime arrest rates and clearance rates. One detail about the data it is possible for arrest and clearance rates to exceed 100%. This occurs when arrests or clearances are made for crimes committed in a previous year or when multiple arrests are made in relation to a single crime. For violent crimes 6 agencies in the Capital Area made more arrests than were reported in their jurisdiction, and 2 agencies cleared more violent crimes than were reported. 7 of the 8 agencies serving jurisdictions with populations between 10,000 and 20,000 residents have a violent crime arrest rate greater than the median rate. Only 1 of the 4 agencies with a jurisdiction of 20,000 to 50,000 had a violent crime clearance rate greater than the median rate in 2016, the Kyle Police Department. In the Capital Area, 5 of the 6 campus police departments had a violent crime clearance rate above the median rate for jurisdictions in the region. More information can be taken from the above figure by using the filters and looking closer at the data. Next Steps The next step in looking at crime in the region for 2016 is to look each individual index crime and identify outliers and trends for each specific crime. If you would like to do this please visits the criminal justice resource page which contains figures similar to the ones in this blog for all 7 index crimes, as well as the two figures that appear hear, and one for property crime which is a subset of total crime for the crimes that do not involve an interaction between the victim and the offender. These crimes are burglary, larceny, and auto theft. CAPCOG uses this data as part of the regional Criminal Justice Planning process. We continue to work to provide the data the region s stakeholders need to make informed decisions about criminal justice in the region. We also hope that by posting this data, we re helping to make information about crime in the region more accessible. To that end, let us know if these figures are helpful. Definitely let us know if there are ways we can make these graphics more helpful. And keep an eye out for future Data Points posts to examine regional crime trends further.
CAPCOG Regional Strategic Criminal Justice Plan
 CAPCOG Regional Strategic Criminal Justice Plan Plan Year 2018 Prepared by the Capital Area Council of Governments for the Office of the Governor s Criminal Justice Division December, 2016 Table of Contents
Section Five INDEX OFFENSE ANALYSIS. Population Groups Urban-Suburban-Rural Municipalities Colleges and Universities. Index Offense Analysis
 Section Five INDEX OFFENSE ANALYSIS Population Groups Urban-Suburban-Rural Municipalities Colleges and Universities 95 CRIME INDEX FOR POPULATION GROUPS 2006 The presentation of crime statistics by population
BYLAWS of the CAPITAL AREA ECONOMIC DEVELOPMENT DISTRICT, INC.
 BYLAWS of the CAPITAL AREA ECONOMIC DEVELOPMENT DISTRICT, INC. Article I. Creation and Purpose Sec. 1.1. Sec. 1.2. Economic Development District The Capital Area Economic Development District, Inc. was
Section One SYNOPSIS: UNIFORM CRIME REPORTING PROGRAM. Synopsis: Uniform Crime Reporting Program
 Section One SYNOPSIS: UNIFORM CRIME REPORTING PROGRAM Synopsis: Uniform Crime Reporting Program 1 DEFINITION THE NEW JERSEY UNIFORM CRIME REPORTING SYSTEM The New Jersey Uniform Crime Reporting System
WILLIAMSON STATE OF THE COUNTY Capital Area Council of Governments
 WILLIAMSON STATE OF THE COUNTY 2011 Capital Area Council of Governments POPULATION Capital Area Council of Governments POPULATION THE RISE OF TEXAS During the past decade, the State of Texas has proved
Section One SYNOPSIS: UNIFORM CRIME REPORTING PROGRAM. Synopsis: Uniform Crime Reporting System
 Section One SYNOPSIS: UNIFORM CRIME REPORTING PROGRAM 1 DEFINITION THE NEW JERSEY UNIFORM CRIME REPORTING SYSTEM The New Jersey Uniform Crime Reporting System is based upon the compilation, classification,
City Crime Rankings
 City Crime Rankings 2008-2009 Methodology The crimes tracked by the UCR Program include violent crimes of murder, rape, robbery, and aggravated assault and property crimes of burglary, larceny-theft, and
Section Six CRIME IN THE CITIES
 Section Six CRIME IN THE CITIES 103 CRIME IN THE CITIES This section deals with serious crimes reported in the large urban cities of the state. These cities represent 19 percent of the population and historically
Criminal History Analysis with Suspects Arrested at Portland State University
 Criminal History Analysis with Suspects Arrested at Portland State University Kris R. Henning, Ph.D. Christian Peterson Portland State University Greg Stewart, Sgt. Portland Police Bureau February 22,
Section Six CRIME IN THE CITIES
 Section Six CRIME IN THE CITIES Crime in the Cities 103 CRIME IN THE CITIES This section deals with serious crimes reported in the large urban cities of the state. These cities represent 19 percent of
Understanding Transit s Impact on Public Safety
 Understanding Transit s Impact on Public Safety June 2009 401 B Street, Suite 800 San Diego, CA 92101-4231 Phone 619.699.1900 Fax 619.699.1905 Online www.sandag.org UNDERSTANDING TRANSIT S IMPACT ON PUBLIC
Section Six CRIME IN THE CITIES
 Section Six CRIME IN THE CITIES 103 CRIME IN THE CITIES This section deals with serious crimes reported in the large urban cities of the state. These cities represent 19 percent of the population and historically
Violent Crime in Massachusetts: A 25-Year Retrospective
 Violent Crime in Massachusetts: A 25-Year Retrospective Annual Policy Brief (1988 2012) Issued February 2014 Report prepared by: Massachusetts Executive Office of Public Safety and Security Office of Grants
The Crime Drop in Florida: An Examination of the Trends and Possible Causes
 The Crime Drop in Florida: An Examination of the Trends and Possible Causes by: William D. Bales Ph.D. Florida State University College of Criminology and Criminal Justice and Alex R. Piquero, Ph.D. University
Appendix Table 2 FBI INDEX CRIME RATE PER 1,000 POPULATION BY JURISDICTION San Diego Region, 2000, 2003, and 2004
 Appendix Table 2 FBI INDEX CRIME RATE PER 1,000 POPULATION BY JURISDICTION San Diego Region, 2000, 2003, and 2004 Change 2000 2003 2004 2000-2004 2003-2004 Carlsbad 26.3 27.2 26.2
CHICAGO POLICE DEPARTMENT RESEARCH AND DEVELOPMENT DIVISION
 PUBLICLY ACCESSIBLE DATA, DATA REQUEST GUIDELINES, AND DEFINITIONS PUBLICLY ACCESSIBLE DATA PAGE 2 DATA REQUEST GUIDELINES PAGE 3 DEFINITIONS PAGE 5 25 March 2011 PUBLICLY ACCESSIBLE DATA On behalf of
Crime in Oregon Report
 Crime in Report June 2010 Criminal Justice Commission State of 1 Crime in Violent and property crime in has been decreasing since the late s. In ranked 40 th for violent crime and 23 rd for property crime;
Summary and Interpretation of the Federal Bureau of Investigation s Uniform Crime Report, 2005
 Research Corporation September 25, 2006 Summary and Interpretation of the Federal Bureau of Investigation s Uniform Crime Report, 2005 Sandra J. Erickson, MFS Research Associate Rosemary J. Erickson, Ph.D.
Murder and Non-Negligent Manslaughter
 Murder and non-negligent manslaughter are defined as the unlawful killing of another human being. Murder statistics tend to be the most reliable of all index crime statistics as most murders do not go
2010 TRENDS. Aggravated Assault
 Aggravated assault is the unlawful attack by one person (or persons) upon a victim with the intent to inflict great bodily injury. It is usually accomplished by the use of a weapon; or when a person (or
CENTER FOR URBAN POLICY AND THE ENVIRONMENT MAY 2007
 I N D I A N A IDENTIFYING CHOICES AND SUPPORTING ACTION TO IMPROVE COMMUNITIES CENTER FOR URBAN POLICY AND THE ENVIRONMENT MAY 27 Timely and Accurate Data Reporting Is Important for Fighting Crime What
Offender Population Forecasts. House Appropriations Public Safety Subcommittee January 19, 2012
 Offender Population Forecasts House Appropriations Public Safety Subcommittee January 19, 2012 Crimes per 100,000 population VIRGINIA TRENDS In 2010, Virginia recorded its lowest violent crime rate over
Research Assignment 2: Deviance, Crime and Employment Data Mining Exercises complete all three parts of the assignment
 Research Assignment 2: Deviance, Crime and Employment Data Mining Exercises complete all three parts of the assignment E X P L O R I N G C R I M I N A L A C T I V I T Y, U N E M P L O Y M E N T, A N D
The California Crime Spike An Analysis of the Preliminary 2012 Data
 The California Crime Spike An Analysis of the Preliminary 2012 Data Kent S. Scheidegger Criminal Justice Legal Foundation June 2013 Criminal Justice Legal Foundation Criminal Justice Legal Foundation www.cjlf.org
Fall 2016 Update. for
 Fall 216 Update for Ferguson, Gray, and Davis An Analysis of Recorded Crime Incidents and Arrests in Baltimore City, March 21 through December 215 October 216 Stephen L. Morgan Johns Hopkins University
CITY OF PUNTA GORDA POLICE DEPARTMENT I N T E R O F F I C E M E M O R A N D U M
 CITY OF PUNTA GORDA POLICE DEPARTMENT I N T E R O F F I C E M E M O R A N D U M To: Howard Kunik, City Manager From: Albert A. Arenal, Chief of Police Date: Subject: Florida Department of Law Enforcement
Bylaws. of the CAPITAL AREA COUNCIL OF GOVERNMENTS ARTICLE I - CREATION AND PURPOSE
 Bylaws of the CAPITAL AREA COUNCIL OF GOVERNMENTS ARTICLE I - CREATION AND PURPOSE Section 1.1 - Preamble We, the representatives of local governments in State Planning Region 12, join together in a voluntary
Who Is In Our State Prisons? From the Office of California State Senator George Runner
 Who Is In Our State Prisons? From the Office of California State Senator George Runner On almost a daily basis Californians read that our state prison system is too big, too expensive, growing at an explosive
Arizona Crime Trends: A System Review,
 Arizona Criminal Justice Commission Statistical Analysis Center Publication Our mission is to sustain and enhance the coordination, cohesiveness, productivity and effectiveness of the Criminal Justice
Great Gatsby Curve: Empirical Background. Steven N. Durlauf University of Wisconsin
 Great Gatsby Curve: Empirical Background Steven N. Durlauf University of Wisconsin 1 changes have taken place in ghetto neighborhoods, and the groups that have been left behind are collectively different
Crime and Justice in the United States and in England and Wales,
 U.S. Department of Justice Office of Justice Programs Bureau of Justice Statistics Crime and Justice in the and in and Wales, 1981-96 In victim surveys, crime rates for robbery, assault, burglary, and
ASIAN AMERICAN BUSINESSES EXPLODING IN DIVERSITY & NUMBERS
 ASIAN AMERICAN BUSINESSES EXPLODING IN DIVERSITY & NUMBERS CENTRAL TEXAS ASIAN AMERICAN OWNED BUSINESSES REPORT 2016 PRESENTED BY THE GREATER AUSTIN ASIAN CHAMBER OF COMMERCE FORWARD Exploding in Diversity
CRIME AND STAFFING ANALYSIS FOR THE TULSA POLICE DEPARTMENT: A FINAL REPORT*
 CRIME AND STAFFING ANALYSIS FOR THE TULSA POLICE DEPARTMENT: A FINAL REPORT* Nicholas Corsaro, PhD Robin S. Engel, PhD Murat Ozer, PhD Samantha Henderson, MA Jillian Shafer, MA Institute of Crime Science
THE EFFECT OF CONCEALED WEAPONS LAWS: AN EXTREME BOUND ANALYSIS
 THE EFFECT OF CONCEALED WEAPONS LAWS: AN EXTREME BOUND ANALYSIS WILLIAM ALAN BARTLEY and MARK A. COHEN+ Lott and Mustard [I9971 provide evidence that enactment of concealed handgun ( right-to-carty ) laws
Who Is In Our State Prisons?
 Who Is In Our State Prisons? On almost a daily basis Californians read that our state prison system is too big, too expensive, growing at an explosive pace, and incarcerating tens of thousands of low level
Public Safety Realignment and Crime Rates in California
 Public Safety Realignment and Crime Rates in California December 2013 Magnus Lofstrom Steven Raphael Supported with funding from the Smith Richardson Foundation AP Photo/Rich Pedroncelli Summary C alifornia
WILLIAMSON COUNTY STATISTICAL AREA COMMUNITY HEALTH PROFILE: SOUTH
 2013 WCSA COMMUNITY HEALTH PROFILE: WEST WILLIAMSON COUNTY STATISTICAL AREA COMMUNITY HEALTH PROFILE: SOUTH Executive Summary Williamson County grew 83 percent from 2000 to 2012. Round Rock, the largest
Preliminary Effects of Oversampling on the National Crime Victimization Survey
 Preliminary Effects of Oversampling on the National Crime Victimization Survey Katrina Washington, Barbara Blass and Karen King U.S. Census Bureau, Washington D.C. 20233 Note: This report is released to
WILLIAMSON COUNTY DISTRICT ATTORNEY. Shawn Dick
 WILLIAMSON COUNTY DISTRICT ATTORNEY Shawn Dick FY19 D.A. GOALS Properly classify and compensate all positions within the office at ONE TIME with a comprehensive organizational plan. Obtain personnel resources
THE EFFECTIVENESS AND COST OF SECURED AND UNSECURED PRETRIAL RELEASE IN CALIFORNIA'S LARGE URBAN COUNTIES:
 THE EFFECTIVENESS AND COST OF SECURED AND UNSECURED PRETRIAL RELEASE IN CALIFORNIA'S LARGE URBAN COUNTIES: 1990-2000 By Michael K. Block, Ph.D. Professor of Economics & Law University of Arizona March,
CENTER FOR CRIMINAL JUSTICE RESEARCH, POLICY AND PRACTICE
 November 2018 Center for Criminal Justice Research, Policy & Practice: The Rise (and Partial Fall) of Adults in Illinois Prisons from Winnebago County Research Brief Prepared by David Olson, Ph.D., Don
Near Westside Neighborhood Indianapolis, IN
 LISC Sustainable Communities Initiative Neighborhood Quality Monitoring Report Neighborhood Indianapolis, IN Baseline Report: May 2011 With Revisions: June 2014 Neighborhood Table of Contents INTRODUCTION...
4. Common Crimes against Business
 4. Common Crimes against Business We refer to common crime when talking about conventional crime or street crime, such as burglary, robbery or theft, which is perpetrated against both individuals and businesses.
RECORDED CRIME & CLEARANCES
 PSNI Statistics: Annual Statistical Report Statistical Report No. 1 RECORDED CRIME & CLEARANCES 1 ST APRIL 2007 31 ST MARCH 2008 Central Statistics Branch, Operational Support Department Lisnasharragh,
Identifying Chronic Offenders
 1 Identifying Chronic Offenders SUMMARY About 5 percent of offenders were responsible for 19 percent of the criminal convictions in Minnesota over the last four years, including 37 percent of the convictions
Quarterly Crime Statistics 4 th Quarter 2009 (1-October-2005 to 31-December-2009)
") Quarterly Crime Statistics 4 th Quarter 29 (1-October-25 to 31-December-29) Authorising Officer: Commissioner Of The Bermuda Police Service Security Classification: This document is marked as UNCLASSIFIED.
Quarterly Crime Statistics 4 th Quarter 29 (1-October-25 to 31-December-29) Authorising Officer: Commissioner Of The Bermuda Police Service Security Classification: This document is marked as UNCLASSIFIED.
Integrated Approaches to Planning Substance Abuse/Chemical Dependence Prevention and Treatement Services in Erie County. Impact Assessment Report
 Integrated Approaches to Planning Substance Abuse/Chemical Dependence Prevention and Treatement Services in Erie County Impact Assessment Report William F. Wieczorek, Ph.D. Alan Delmerico, Ph.D. Travis
Crime Harm and Problem Oriented Policing
 Crime Harm and Problem Oriented Policing Dr. Peter Neyroud Institute of Criminology A Pracademic career Police Chief (Thames Valley and National Policing Improvement Agency) Academic Researcher, author
CAMDEN CITY JUVENILE ARRESTS
 2002-2006 CAMDEN CITY JUVENILE ARRESTS INTRODUCTION The Walter Rand Institute for Public Affairs (WRI) at the Camden Campus of Rutgers University provides research and analysis on a variety of public policy
State and Local Law Enforcement Personnel in Alaska:
 [Revised 25 Aug 2014] JUSTICE CENTER UNIVERSITY of ALASKA ANCHORAGE AUGUST 2014, AJSAC 14-02 State and Local Law Enforcement Personnel in Alaska: 1982 2012 Khristy Parker, MPA, Research Professional This
British Columbia, Crime Statistics in. Crime Statistics in British Columbia, Table of Contents
 Ministry of Public Safety and Solicitor General Policing and Security Branch Crime Statistics in British Columbia, 2016 Table of Contents Highlights... 1 Table 1: Police-Reported Criminal Code and Drug
Apache County Criminal Justice Data Profile
 Arizona Criminal Justice Commission Statistical Analysis Center Publication Our mission is to sustain and enhance the coordination, cohesiveness, productivity and effectiveness of the Criminal Justice
Maine Statistical Analysis Center. USM Muskie School of Public Service.
 2012 Juvenile Justice Data Book Statistical Analysis Center USM Muskie School of Public Service http://muskie.usm.maine.edu/justiceresearch About the University of Southern (USM) Muskie School of Public
Justice Reinvestment in Oklahoma. Detailed Analysis. October 17, Council of State Governments Justice Center
 Justice Reinvestment in Oklahoma Detailed Analysis October 17, 2011 Council of State Governments Justice Center Marshall Clement, Project Director Anne Bettesworth, Policy Analyst Jessy Tyler, Senior Research
POVERTY AND PROGRESS IN NEW YORK IX. Alex Armlovich ISSUE BRIEF. Crime Trends in Public Housing, June State and Local Policy
 1 June 2016 Poverty and Progress In New York IX Crime Trends in Public Housing, 2015 16 ISSUE BRIEF State and Local Policy POVERTY AND PROGRESS IN NEW YORK IX Crime Trends in Public Housing, 2015 16 Alex
Individual Incident Entry (IIE) To begin entering a Group A or Group B incident into the state repository, click the Incident / Arrest button.
 To begin entering a Group A or Group B incident into the state repository, click the Incident / Arrest button.") Individual Incident Entry (IIE) To begin entering a Group A or Group B incident into the state repository, click the Incident / Arrest button. Choose Incident or Arrest Click the Incident Report button
Individual Incident Entry (IIE) To begin entering a Group A or Group B incident into the state repository, click the Incident / Arrest button. Choose Incident or Arrest Click the Incident Report button
Los Angeles County Sheriff s Department. Proposition 47 Report
 Los Angeles County Sheriff s Department Proposition 47 Report August 31, 2017 PROPOSITION 47 FLOW CHART PROPOSITION 47 OFFENDERS LA COUNTY LASD 70,265 29,055 *Repeat Offenders are offenders arrested for
COOLIDGE POLICE DEPARTMENT. Monthly Activity Report
 COOLIDGE POLICE DEPARTMENT Monthly Activity Report April 214 Count Coolidge Police Department 214 Uniform Crime Report & Traffic Data 213 January February March April May June July August September October
Model Performance Measures for Counties
 Model Performance Measures for Counties 2017 Center of Innovation and Excellence 701 4th Avenue South Suite 360, Minneapolis, MN 55415 612-348-4466 612-348-7423 Table of contents Contents Public Safety
A Profile of Women Released Into Cook County Communities from Jail and Prison
 Loyola University Chicago Loyola ecommons Criminal Justice & Criminology: Faculty Publications & Other Works Faculty Publications 10-18-2012 A Profile of Women Released Into Cook County Communities from
Felony Defendants in Large Urban Counties, 2000
 U.S. Department of Justice Office of Justice Programs Bureau of Justice Statistics State Court Processing Statistics Felony Defendants in Large Urban Counties, Arrest charges Demographic characteristics
Concealed Handguns: Danger or Asset to Texas?
 VPC analysis of data from the Texas Department of Public Safety suggests that concealed carry licensees may be more prone to firearm-related violations than the general public. The VPC calculated that
CONCEALED CARRY LAWS AND WEAPONS
 CONCEALED CARRY LAWS AND WEAPONS As of 2007-05-19 Myth: Concealed carry laws increase crime Fact: Forty states 1, comprising the majority of the American population, are "right-to-carry" states. Statistics
Analyzing Racial Disparities in Traffic Stops Statistics from the Texas Department of Public Safety
 Analyzing Racial Disparities in Traffic Stops Statistics from the Texas Department of Public Safety Frank R. Baumgartner, Leah Christiani, and Kevin Roach 1 University of North Carolina at Chapel Hill
Presentation to the Legislative Finance Committee. January 15, 2018
 Presentation to the Legislative Finance Committee January 15, 218 The LFC has a review of the crime increase in the Bernalillo County/Albuquerque area on the work plan Target completion date is Spring
Does Inequality Increase Crime? The Effect of Income Inequality on Crime Rates in California Counties
 Does Inequality Increase Crime? The Effect of Income Inequality on Crime Rates in California Counties Wenbin Chen, Matthew Keen San Francisco State University December 20, 2014 Abstract This article estimates
Statistics on offences and coercive methods
 Justice 2016 Statistics on and coercive methods Offences known to the authorities 2015 Drunken driving caused by narcotic substances increased by 19.7 per cent According to Statistics Finland's data, a
Crime Statistics 2011/2012
 Crime Statistics 211/212 Embargo: 3 September 212 Contents 1 PREAMBLE 2 2 EXECUTIVE SUMMARY 3 2.1 State-wide crime statistics 211/212 3 3 TOTAL CRIME 5 3.1 Across Victoria 5 3.2 By region 8 3.3 Where crime
2014 Survey of Crime Risk Assessment Strategies in the United States
 04 Survey of Crime Risk Assessment Strategies in the United States This survey investigates the various components employed to assess crime risk and to defend against litigation and also examines recent
Criminal Records in High Crime Neighborhoods
 Rochester SACSI Research Working Paper # 2002-03 7/19/02 Criminal Records in High Crime Neighborhoods Summary This paper examines the arrest records of sample of young minority men living in high crime
Boise Police Department
 Boise Police Department 2007 Neighborhood Survey Report - 1 - TABLE OF CONTENTS INTRODUCTION 3 BACKGROUND AND EVALUATION PROCESS...3 BOISE POLICE DEPARTMENT OVERALL SURVEY RESULTS.4 BENCH AREA NEIGHBORHOOD
Dallas Police Department Crime Report
 Dallas Police Department Crime Report Public Safety Committee March 28, 2016 www.dallaspolice.net David O. Brown Chief Of Police 2 *Note: Report generated from preliminary data 3 Type 5 Type 4 Type 3 Type
Byram Police Department
 Byram Police Department 2018 Annual Report www.byrampolice.net ~ www.facebook.com/byrampd Offices (601) 372-7747 ~ Non-Emergency Dispatch (601) 372-2327 141 Southpointe Drive, Byram, MS 39272 BYRAM POLICE
Sentencing Chronic Offenders
 2 Sentencing Chronic Offenders SUMMARY Generally, the sanctions received by a convicted felon increase with the severity of the crime committed and the offender s criminal history. But because Minnesota
Arden-Arcade. Crime & Safety FY2016. CIL Data Profile. February
 CIL Data Profile Arden-Arcade Crime & Safety FY2016 Crime and violence negatively impact communities by reducing productivity, decreasing property values, and disrupting social and emotional health, and
State Issue 1 The Neighborhood Safety, Drug Treatment, and Rehabilitation Amendment
 TO: FROM: RE: Members of the Commission and Advisory Committee Sara Andrews, Director State Issue 1 The Neighborhood Safety, Drug Treatment, and Rehabilitation Amendment DATE: September 27, 2018 The purpose
Calls for Service. Average 4,500-5,000 Calls for Service Per Month Average approximately 150 Calls per Day 2 58,722 54,514 57,524 56,639 60,000 50,000
 1 Calls for Service 60,000 57,524 58,722 54,514 56,639 50,000 40,000 30,000 21,480 20,000 10,000 0 2011 2012 2013 2014 2015 Average 4,500-5,000 Calls for Service Per Month Average approximately 150 Calls
Integrated Approaches to Planning Substance Abuse/Chemical Dependence Prevention and Treatement Services in Erie County. Impact Assessment Report
 Integrated Approaches to Planning Substance Abuse/Chemical Dependence Prevention and Treatement Services in Erie County Impact Assessment Report Alan Delmerico, Ph.D. William F. Wieczorek, Ph.D. Rachel
Running head: School District Quality and Crime 1
 Running head: School District Quality and Crime 1 School District Quality and Crime: A Cross-Sectional Statistical Analysis Chelsea Paige Ringl Department of Sociology, Anthropology, Social Work, and Criminal
Statistics on offences and coercive methods
 Justice Statistics on offences and coercive methods Offences reported to the authorities,, 1st quarter Reported number of crimes against life and health decreased by 8.7 per cent in January to March According
JURISDICTION, MUTUAL AID & REGIONAL SERVICES
 JURISDICTION, MUTUAL AID & REGIONAL SERVICES WRITTEN DIRECTIVE: 1.9 EFFECTIVE DATE: 04-14-1995 REVISION DATE: 04-12-2016 Contents: I. Purpose II. Policy III. Procedures IV. Regional Services I. Purpose
Cost Benefit Analysis of Maine Prisons Investment
 Cost Benefit Analysis of Maine Prisons Investment Policy Analysis & Program Evaluation Professor: Devon Lynch By: Stephanie Rebelo Yolanda Dennis Jennifer Chaves Courtney Thraen 1 Similar to many other
Alaska Correctional Populations,
 -. -~ A Publication.of the Justice Center Fall 1992 UNIVERSITY OF ALASKA ANCHORAGE Vol. 9, No. 3 Alaska Correctional Populations, 1980-1992 N.E. Schafer and Melissa S. Green In the last issue of the Alaska
Juveniles Prosecuted in State Criminal Courts
 U.S. Department of Justice Office of Justice Programs Bureau of Justice Statistics Selected Findings National Survey of Prosecutors, 1994 March 1997, NCJ-164265 Juveniles Prosecuted in State Criminal Courts
S.C. Commission on Prosecution Coordination. FY Funding Request
 Caseload Equalization FY 215-216 Funding Request Current conditions in South Carolina Second in the number of women killed by men Sixth highest violent crime rate in the country South Carolina exceeds
Uniform Crime Reporting (UCR) State Program Bulletin 07-3
 State Program Bulletin 07-3") U.S. Department of Justice Federal Bureau of Investigation Criminal Justice Information Services Division Uniform Crime Reporting (UCR) State Program Bulletin 07-3 SECTION 1 MESSAGE TO PROGRAM PARTICIPANTS
U.S. Department of Justice Federal Bureau of Investigation Criminal Justice Information Services Division Uniform Crime Reporting (UCR) State Program Bulletin 07-3 SECTION 1 MESSAGE TO PROGRAM PARTICIPANTS
Common sense tells us that crime should increase during hard times. We ve all seen examples. By Christopher Uggen
 14 Pathways Fall 212 By Christopher Uggen Common sense tells us that crime should increase during hard times. We ve all seen examples of people taking desperate actions when they are cold, broke, and hungry,
The Impact of Shall-Issue Laws on Carrying Handguns. Duha Altindag. Louisiana State University. October Abstract
 The Impact of Shall-Issue Laws on Carrying Handguns Duha Altindag Louisiana State University October 2010 Abstract A shall-issue law allows individuals to carry concealed handguns. There is a debate in
Trends for Children and Youth in the New Zealand Justice System
 March, 2012 Trends for Children and Youth in the New Zealand Justice System 2001-2010 Key Points Over the 10 years to 2010, a consistent pattern of decreasing numbers can be seen across the youth justice
California Police Chiefs Association
 Membership Issues Report Date: October 5, 2016 To: From: Subject: President Ken Corney CPCA Board of Directors Robert M. Lehner, M.B.A., Chief of Police City of Elk Grove Police Department Effects of the
2012 ANNUAL REPORT MARYLAND STATE POLICE FORENSIC SCIENCES DIVISION STATEWIDE DNA DATABASE
 2012 ANNUAL REPORT MARYLAND STATE POLICE FORENSIC SCIENCES DIVISION STATEWIDE DNA DATABASE 1 REPORT April 2013 2 TABLE OF CONTENTS 2012 STATEWIDE DNA DATABASE ANNUAL REPORT Table of Contents i Executive
Quarterly Crime Statistics Q (01-January-2014 to 31-March-2014)
") Quarterly Crime Statistics 214 (1-January-214 to 31-March-214) Authorising Officer: Commissioner Of The Bermuda Police Service Author: Analysis Unit Date: 7-MAY-214 File Location: G:\Intelligence Briefings\INTELLIGENCE
Quarterly Crime Statistics 214 (1-January-214 to 31-March-214) Authorising Officer: Commissioner Of The Bermuda Police Service Author: Analysis Unit Date: 7-MAY-214 File Location: G:\Intelligence Briefings\INTELLIGENCE
Sentence THE SENTENCING GUIDELINES NEWSLETTER MAY 2005 ISSUE 02
 the Sentencing Guidelines Council MAY 2005 ISSUE 02 The Sentencing Guidelines Council is acutely aware of the growing need for research and statistical information about sentencing as sentencers and local
SENATE SPONSORSHIP. Bill Summary
 Second Regular Session Sixty-fourth General Assembly STATE OF COLORADO REREVISED This Version Includes All Amendments Adopted in the Second House LLS NO. 0-0.01 Beth Braby HOUSE BILL 0- HOUSE SPONSORSHIP
Problems of Criminal Statistics in the United States
 Journal of Criminal Law and Criminology Volume 46 Issue 2 Article 3 1955 Problems of Criminal Statistics in the United States Ronald H. Beattie Follow this and additional works at: https://scholarlycommons.law.northwestern.edu/jclc
REPORT # O L A OFFICE OF THE LEGISLATIVE AUDITOR STATE OF M INNESOTA PROGRAM EVALUATION R EPORT. Chronic Offenders
 O L A REPORT # 01-05 OFFICE OF THE LEGISLATIVE AUDITOR STATE OF M INNESOTA PROGRAM EVALUATION R EPORT Chronic Offenders FEBRUARY 2001 Photo Credits: The cover and summary photograph was provided by Digital
Crime & Justice. Maine Statistical Analysis Center. USM Muskie School of Public Service.
 Maine Crime & Justice Data Book 2008 Maine Statistical Analysis Center USM Muskie School of Public Service http://muskie.usm.maine.edu/justiceresearch COVER.indd 1 3/18/2009 2:32:12 PM About the University
RAPTOR VISITOR IDENTIFICATION SYSTEM. Ov e rv i e w. Pr o c e d u r e s. Dripping Springs Independent School District Operating Procedures
 RAPTOR VISITOR IDENTIFICATION SYSTEM Dripping Springs Independent School District Operating Procedures Index Page Topic 1 Overview 1 Procedures 2 Vendors/Contractors/Others 2 Match with the Database 3
PUBLIC WELFARE FOUNDATION FINAL/INTERIM REPORT GRANT # # DATE OF SUBMISSION December 3, 2013
 PUBLIC WELFARE FOUNDATION FINAL/INTERIM REPORT GRANT # #12-095 DATE OF SUBMISSION December 3, 2013 Name of Organization: American Bar Association Criminal Justice Section Type of Report (Interim, Progress,
MEASURING CRIME BY MAIL SURVEYS:
 MEASURING CRIME BY MAIL SURVEYS: THE TEXAS CRIME TREND SURVEY Alfred St. Louis, Texas Department of Public Safety Introduction The Texas Crime Trend Survey is a mail survey of the general public. The purpose