Migration and Labour Force Trends
|
|
|
- Marshall Stevens
- 5 years ago
- Views:
Transcription


1 Bay of Plenty Overview 2014 immigration.govt.nz
2 2 ISBN May, 2015 Crown Copyright 2015 The material contained in this report is subject to Crown copyright protection unless otherwise indicated. The Crown copyright protected material may be reproduced free of charge in any format or media without requiring specific permission. This is subject to the material being reproduced accurately and not being used in a derogatory manner or in a misleading context. Where the material is being published or issued to others, the source and copyright status should be acknowledged. The permission to reproduce Crown copyright protected material does not extend to any material in this report that is identified as being the copyright of a third party. Authorisation to reproduce such material should be obtained from the copyright holders.

3 Foreword 1 With the sunniest climate in New Zealand s North Island, a reputation as New Zealand s top holiday destination and a vibrant arts and cultural scene, the Bay of Plenty stands out as an appealing destination for migrants looking for a change of pace and an outdoor-driven lifestyle. In this report, we take an in-depth look at the Bay of Plenty s migrants, forming a picture of who they are, where they have come from and how long they have lived in New Zealand. We also compare the Bay of Plenty migrant picture with the rest of New Zealand. One of the key drivers of immigration is to supply the skills businesses need that cannot be located in our local labour market. This report identifies how the Bay of Plenty s migrant population are represented in the Bay of Plenty labour force with a particular focus on skilled migrants. It is important that the Bay of Plenty s economic growth continues to be stimulated and sustained through the ongoing attraction and retention of skilled migrants, and Immigration New Zealand has developed a number of approaches to support this goal. Immigration New Zealand works closely with key agencies and groups in the Bay of Plenty in order to attract and retain migrants with the skills and inward investment that the local economy needs. One of the key ways in which this can be achieved is through knowledge-sharing. The statistics and trends identified in this Immigration New Zealand report provide migrant-specific information that will explain current trends and guide future economic planning. Steve McGill GM Settlement, Protection and Attraction
4 2 Table of Contents Bay of Plenty Context 4 Introduction 5 Bay of Plenty s migrant demographics 7 Migration, and the Bay of Plenty labour market 11 Permanent migration 13 Temporary migration 16 International students 20 Conclusion and further information 24
5 Tables 3 Table 1: Percentage of overseas-born population by region of origin in Table 2: Table 3: Number and percentage of migrants by their region of origin who have been in NZ for less than two years Overseas and New Zealand-born population by highest qualification attained 9 10 Table 4: Work and labour force status by birthplace and resident location 11 Table 5: Table 6: Table 7: Top source countries of Skilled Migrant Category principal applicants in the Bay of Plenty Skilled Migrant Category approved workers, with a job offer in the Bay of Plenty Number of people granted Essential Skills work visas by region they are employed within Table 8: Source country of Essential Skills workers 2009/10 to 2013/14 18 Table 9: Table 10: Table 11: Essential Skills migrant category approved workers, with a job offer in the Bay of Plenty Number of people granted student visas by region of study over the past 10 years Number of people granted first student visas by region of study over the past 10 years Figures Figure 1: Figure 2: Figure 3: Figure 4: Figure 5: Figure 6: Figure 7: Figure 8: The proportion of the overseas-born population compared to the New Zealand-born population in the Bay of Plenty in 2001, 2006 and 2013 The proportion of the overseas-born population compared to the New Zealand- born population in the Rest of New Zealand (excl. Auckland) in 2001, 2006 and 2013 The proportion of the overseas-born population compared to the New Zealand- born population in Auckland in 2001, 2006 and 2013 Proportion of migrants in the Bay of Plenty, the Rest of New Zealand (excl. Auckland) and Auckland by total length of time in New Zealand Percentage of overseas-born and New Zealand-born individuals who are not in the labour force in the Bay of Plenty Percentage of overseas-born and New Zealand-born individuals who are employed in the Bay of Plenty Percentage of overseas-born and New Zealand-born individuals who are unemployed in the Bay of Plenty Trends in the source countries of Skilled Migrant Category principal applicants Figure 9: Trends in the source countries of Essential Skills workers 18
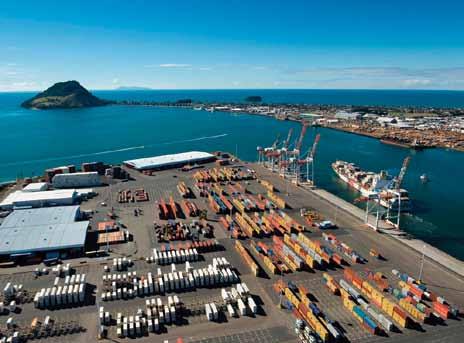
. The major population centres are Tauranga, Rotorua and Whakatane.")
6 4 Bay of Plenty Context The Bay of Plenty lies east of the Kaimai-Mamaku Ranges and south of the Coromandel Peninsula in the North Island and is known for its beaches, kiwifruit, tourism, forestry and geothermal energy. It is also home to New Zealand s only active marine volcano (White Island). The major population centres are Tauranga, Rotorua and Whakatane. The Tauranga labour market is the fifth largest in New Zealand, and over the past 20 years Tauranga City has experienced one of the fastest rates of population growth in New Zealand. Around 300,000 people (seven percent of New Zealand s overall population) live in the Bay of Plenty. There is a significant aging population (15 percent are aged over 65, with 25 percent projected to be in this age group by 2031) and a large young Maori population (34 percent are aged under 15). The net migration population is expected to grow by 16,400 people between 2006 and 2031, and a further 35,600 people are expected through natural increases. Population growth is expected to be concentrated in Tauranga City and the Western Bay of Plenty District, with declining populations in the Eastern district. With an overseas-born population of 17 percent, the Bay of Plenty matches that of the Rest of New Zealand (excluding Auckland). The largest group (40 percent) has migrated from the United Kingdom and Ireland, with a smaller quantity (22 percent) from Asia. Most of the recent migrants arriving in the past two years have been from Asia (45 percent). About a quarter of the overseas-born population has been living in the Bay of Plenty for five years or more, with 39 percent there for 20 years or more. The migrant population is more qualified than the New Zealand population which is consistent with other regions in New Zealand. As in other parts of New Zealand, rural communities in the Bay of Plenty are thinning out as people move into growing cities, such as Tauranga. The Bay of Plenty has a higher than average level of deprivation, especially within the rural Eastern parts of the region. The region s eight local authorities have collectively developed the Invest Bay of Plenty Plan. The plan aims to provide a shared vision and collective voice for development in the Bay of Plenty. It identifies key goals for the next 30 years and provides a concise and high-level strategy for accomplishing these objectives.

7 Introduction 5 Purpose The purpose of this paper is to provide an overview of the Bay of Plenty s current migrant population and migration trends, and specifically to look at the impact migrants in the Bay of Plenty have on the region s labour market. The data in the report is publicly available through the websites of Statistics New Zealand and the Ministry of Business, Innovation and Employment (MBIE). Background A driving goal of Government is to build a more competitive and internationally focused economy. Migration plays a key role in meeting this goal as it helps grow New Zealand s labour force which in turn drives our economy. Migration also increases international connections that give access to foreign knowledge, foreign capital and international trade. In July 2014, Government approved the New Zealand Migrant Settlement and Integration Strategy, a revised approach to successfully settle and integrate migrants in New Zealand. The Migrant Settlement and Integration Strategy builds on the New Zealand Settlement Strategy which led settlement work in New Zealand over the past decade. It places value on the economic contribution of migration and stresses the importance of the long-term integration of migrants in conjunction with successful initial settlement. The strategy s aim is that migrants: Make New Zealand their home, participate fully and contribute to all aspects of New Zealand life. Key to achieving this aim are the strategy s five outcomes Employment, Education and Training, Inclusion, English Language and Health and Wellbeing (see page 6). Employment, and Education and Training are the key outcomes for the strategy (reflecting their importance to the Government s Business Growth Agenda). However, all five outcomes are strongly interconnected and contribute to the strategy s aim, as well as to each other. For example, good English language skills and good health support migrants participation in employment, while education and training helps them to make social connections that support their wellbeing and inclusion.
8 6 New Outcomes Framework for Migrant Settlement and Integration Outcome 1: Employment Working-age migrants have work that matches their skills and New Zealandready qualifications Outcome 2: Education and Training Migrants achieve educational and vocational qualifications Outcome 5: Health and Wellbeing Migrants enjoy healthy lives and feel confident and safe Overarching Outcome Migrants make New Zealand their home, participate fully and contribute to all aspects of New Zealand life. Outcome 3: English Language Migrants confidently use English in their daily lives Outcome 4: Inclusion Migrants participate in and have a sense of belonging to their community and to New Zealand As part of the strategy, regional support to attract and retain migrants is being stepped up, with Immigration New Zealand establishing new Regional Partnership Agreements. The first of these Agreements is underway in Auckland. Quality immigration data on the current migrant population in the Bay of Plenty, their participation in the work force, as well as future projections of inward and outward migration, helps inform the Bay of Plenty s economic planning and in turn can help deliver on the outcomes defined in the Migration Settlement and Integration Strategy.
9 Bay of Plenty s migrant demographics 7 The 2013 Census estimated the Bay of Plenty s usual resident population at 267,741 six percent of the total New Zealand population. This is a four percent increase in population since the 2006 Census. The Bay of Plenty is the fifth most populous region of the 16 regions in New Zealand. The 2013 Census estimated that 17 percent of the Bay of Plenty s total population was born overseas. This is similar to the 18 percent of overseas-born in the total population recorded across the Rest of New Zealand (excluding Auckland) 1. However, it is quite a bit lower than Auckland where 39 percent of the population were born overseas. This section of the report will look at the demographics of the Bay of Plenty s migrant population by gender, country of birth, and years since arrival in New Zealand. Comparisons between the migrant population and non-migrant population within the Bay of Plenty will be made, as well as a comparison with the migrant population of the rest of New Zealand. Population size and gender The 2013 Census estimated that 17 percent of the Bay of Plenty s population was born overseas. This is an increase on the two previous censuses, with 15 percent in the 2006 and 13 percent in 2001 Census. This is comparable to the Rest of New Zealand (excluding Auckland) where the migrant population as a proportion of the total population has grown from 14 percent in 2001 to 18 percent in This is illustrated in Figures 1-3. Figure 1: The proportion of the overseas-born population compared to the New Zealand-born population in the Bay of Plenty in 2001, 2006 and % 15% 17% 87% 85% 83% Overseas born population New Zealand born population Source: Census 2013, Statistics New Zealand Figure 2: The proportion of the overseas-born population compared to the New Zealand-born population in the Rest of New Zealand (excl. Auckland) in 2001, 2006 and % 16% 18% 86% 84% 82% Overseas born population New Zealand born population Source: Census 2013, Statistics New Zealand 1 The Bay of Plenty has been compared to the Rest of New Zealand (excluding Auckland), and to Auckland. Auckland has a proportionally much larger migrant population than the rest of New Zealand.
10 8 Figure 3: The proportion of the overseas-born population compared to the New Zealand-born population in Auckland in 2001, 2006 and % 37% 39% 68% 63% 61% Overseas born population New Zealand born population Source: Census 2013, Statistics New Zealand The male to female ratio of the overseas-born population is very similar nationwide. Of those living in the Bay of Plenty who were born overseas, 49 percent are male and 51 percent are female. Region of origin of the migrant population The region of origin composition of the overseas-born population within the Bay of Plenty resembles that of the Rest of New Zealand (excluding Auckland) as seen in Table 1. Forty percent of the overseas-born population of the Bay of Plenty is from the UK and Ireland. Like all other regions in New Zealand, except Auckland, this is the largest group within the region. A further 22 percent of the overseas population is from Asia. Table 1: Percentage of overseas-born population by region of origin in 2013 Region of origin Bay of Plenty Rest of New Zealand (excluding Auckland) Auckland UK & Ireland 40% 36% 17% Asia 22% 23% 39% Australia 10% 9% 4% Europe* 9% 9% 5% Middle East and Africa 9% 8% 10% Pacific Islands 6% 9% 21% North America 4% 4% 2% Other 2% 1% 1% Source: Census 2013, Statistics New Zealand * Europe (excl UK & Ireland) Years since arrival Of the overseas-born population living in the Bay of Plenty, about a quarter (23 percent) have been in New Zealand for five years or less. A larger proportion, 39 percent, have been living in the Bay of Plenty for 20 years or more; this proportion is slightly higher than for the rest of New Zealand and much higher than in Auckland.
11 Figure 4: Proportion of migrants in the Bay of Plenty, the Rest of New Zealand (excluding Auckland) and Auckland, by total length of time in New Zealand 9 40% 30% 20% 10% 0% less than 5 years 5-9 years years 20 years or more Bay of Plenty Source: Census 2013, Statistics New Zealand REST OF NZ (excl Auckland) AUCKLAND Most recent migrants Table 2 examines those migrants, living in the Bay of Plenty, who have been in New Zealand for two years or less. Of this group, 45 percent came from Asia; this is higher than the proportion (39 percent) of recent Asian migrants in the Rest of New Zealand (excluding Auckland), but lower than in the Auckland region (53 percent). Most of the other regions of origin follow a similar pattern to the Rest of New Zealand (excluding Auckland). The exception is the Pacific Islands which account for only four percent of recent migrants in the Bay of Plenty, compared to seven percent for the Rest of New Zealand (excluding Auckland) and 12 percent in Auckland. Table 2: Number and percentage of migrants by their region of origin, who have been in NZ less than two years Australia Pacific Islands UK & Ireland Europe* North America Asia Middle East & Africa Other Bay of Plenty Total number , , % of total overseas born population 10% 4% 20% 7% 5% 45% 6% 3% Rest of New Zealand (excl Auckland) Total number 5,919 4,488 14,049 5,322 4,050 26,088 4,686 2,169 % of total overseas-born population 9% 7% 21% 8% 6% 39% 7% 3% Auckland Total number 2,634 7,605 7,644 3,864 2,094 35,037 5,328 1,395 % of total overseas born population 4% 12% 12% 6% 3% 53% 8% 2% *Europe excluding UK and Ireland Source: Census 2013, Statistics New Zealand

12 10 Migrants qualifications A knowledge-based society relies on a highly qualified labour force, not only in high-tech and research sectors, but increasingly in all sectors of the economy and society. The Bay of Plenty s economy will continue to rely on offshore skills and talent to support its growth. Table 3 shows that the overseas-born population of the Bay of Plenty is more qualified than the New Zealand-born population. This trend is the same across New Zealand. Table 3: Overseas and New Zealand-born population by highest qualification attained No qualification Level 1-3 certificate Level 4 certificate or Level 5 or 6 diploma Bachelor degree and level 7 qualification Honours or postgraduate degree Overseas secondary school qualification Bay of Plenty New Zealandborn Overseasborn 27% 38% 22% 9% 3% 0% 14% 17% 22% 14% 8% 25% Rest of New Zealand (excl Auckland) New Zealandborn Overseasborn 25% 39% 20% 11% 4% 0% 14% 18% 18% 17% 12% 22% Auckland New Zealandborn Overseasborn 19% 40% 19% 15% 6% 1% 14% 19% 15% 19% 10% 23% Source: Census 2013, Statistics New Zealand
13 Migration, and the Bay of Plenty labour market 11 Statistics New Zealand projects that net migration will result in an increase of 16,400 people in the Bay of Plenty between 2006 and Immigration New Zealand (as part of MBIE), recognises the significance that migration plays in meeting workforce needs, and together with local council and economic development agencies has a shared interest in attracting and retaining migrants to the Bay of Plenty to meet skill shortages. Immigration New Zealand s priorities align with the Government s Business Growth Agenda which prioritises lifting the skills and productivity of the workforce overall and ensuring skilled migration meets New Zealand s needs. Bay of Plenty context This section will focus on migrant participation in the Bay of Plenty s labour force. Table 4 shows that both within the Bay of Plenty and across the country the labour force participation rate, employment rate and unemployment rate are similar. Figures 5-7 illustrate how these rates have changed over time in the Bay of Plenty, with the employment and not in the labour force rates for the overseas-born population aligning with those of the New Zealand-born population. Table 4: Work and labour force status by birthplace and resident location 2 Employed full-time Employed part-time Unemployed NILF* Bay of Plenty Overseas-born 46% 14% 4% 36% NZ born 48% 15% 5% 32% Rest of NZ (excl Auckland) Overseas-born 47% 14% 4% 35% NZ born 48% 15% 5% 32% Auckland Overseas-born 47% 12% 5% 36% NZ born 50% 14% 5% 31% *Not in labour force Source: Census 2013, Statistics New Zealand As stated in a technical report published by Auckland Council 3, participation, employment and unemployment rates are three of the most commonly reported and widely understood indicators of the state of the labour market. Respectively, they tell us the percentage of the population that is in the labour force, what percentage of the population is in work, and what percentage of individuals who want to work are unable to find a job. Together, these three indicators can provide insight into the pressures that individuals are facing in relation to finding and keeping a job, and the decisions they make about whether to seek work or to pursue other, non-work activities. 2 Work and labour force status classifies a person aged 15 years and over by their inclusion or exclusion from the labour force. For an employed person, it distinguishes between full-time employment (30 hours or more per week) or part-time employment (fewer than 30 hours per week). A person who was not employed is classified as either Unemployed or Not in the labour force 3 Auckland Council (2014); The Labour Market and Skills in Auckland 2014: Technical Report 2014/026
14 12 Figure 5: Percentage of overseas-born and New Zealand-born individuals who are not in the labour force in the Bay of Plenty NOT IN LABOUR FORCE 50% 40% 30% 15% OVERSEAS-BORN NEW ZEALAND-BORN Source: Census 2013, Statistics New Zealand Figure 6: Percentage of overseas-born and New Zealand-born individuals who are employed in the Bay of Plenty EMPLOYED 70% 60% 50% 40% OVERSEAS-BORN NEW ZEALAND-BORN Source: Census 2013, Statistics New Zealand Figure 7: Percentage of overseas-born and New Zealand-born individuals who are unemployed in the Bay of Plenty UNEMPLOYED 6% 4% 2% 0% OVERSEAS-BORN NEW ZEALAND-BORN Source: Census 2013, Statistics New Zealand
15 Permanent migration 13 People who wish to migrate permanently to New Zealand must apply through categories that come under one of the three residence streams of the New Zealand Residence Programme (NZRP). These are: Skilled/Business Migrant Category 52 percent of NZRP in 2013/14 Family Category 40 percent of NZRP in 2013/14 International (Pacific Access Category and the Samoan Quota) and Humanitarian (refugees) 8 percent of NZRP in 2013/14 Residence provides a person with the right to live in New Zealand and to gain access to all the normal work, business, education, property, and health privileges available to New Zealanders. The permanent migrant flows have been relatively stable over time. In 2013/14, there were 44,008 residence approvals in New Zealand, up from 38,961 in 2012/13. In 2013/14, 73 percent of residence applications were approved in New Zealand (onshore). This is as a result of immigration policies that support the transition of migrants who have been living and working in New Zealand from temporary to permanent visa status 4. Bay of Plenty context The data on permanent migrants in the Bay of Plenty refers to migrants coming to New Zealand under the Skilled Migrant Category (SMC). New Zealand needs skilled migrants to contribute to productivity, skills acquisition, diversity and growth in a variety of industries. The SMC is a pointsbased system designed to ensure people migrating to New Zealand have the skills, qualifications and work experience that New Zealand needs. The SMC is also the largest migrant stream in the NZRP, accounting for 46 percent of NZRP applications. In 2013/14, 51 percent of migrants approved under the SMC were principal applicants and 49 percent were secondary applicants (partners and children). In 2013/14 the Bay of Plenty attracted four percent of skilled migrant category principal applicants to New Zealand. Skilled principal applicants receive bonus points in their application for having an offer of employment outside of Auckland to enhance the ability of other regions to utilise immigration to support regional economic development. Source country The following table (Table 5) shows the source country of SMC principal applicants from 2009/10 to 2013/14. Overall there is a national and regional trend of declining numbers of migrants from the UK, and a rise in migrants from India and China. The figures for Bay of Plenty show similar trends. Figure 8 shows the trend across the top five source countries for the years 2009/10 to 2013/14. 4 These policies include the Long Term Business Visa, Work to Residence, and Study to Work Policies for foreign graduates.
16 14 Table 5: Top source country of Skilled Migrant Category principal applicants in the Bay of Plenty Source country of principal applicant 2009/ / / / /14 India 43 (10%) 85 (19%) 85 (28%) 76 (27%) 154 (39%) UK 102 (25%) 75 (17%) 52 (17%) 48(17%) 54 (14%) Philippines 80 (19%) 67 (15%) 54 (17%) 45 (16%) 44 (11%) China 13 (3%) 20 (5%) 10 (3%) 10 (4%) 31 (8%) Fiji 12 (3%) 30 (7%) 12 (4%) 5 (2%) 15 (4%) Total Principal Applicants Source: Ministry of Business, Innovation and Employment The top five source countries represented 75 percent 5 of the total Bay of Plenty SMC approved principal applicants in 2013/14. Figure 8: Trends in the source countries of Skilled Migrant Category principal applicants in the Bay of Plenty 50% 40% 30% 20% 10% 0% 2009/ / / / /14 INDIA UK Philippines CHINA FIJI Source: Ministry of Business, Innovation and Employment Occupations Table 6 shows the ranking for the top 10 occupational groups under which skilled migrants received an offer of employment for the 2013/14 year. It shows occupations by industry and occupation 6. The table shows the number of approved workers for the Bay of Plenty in the 2013/14 year. The second column of data shows the percentage change for each occupation from the 2012/13 year, while the last column shows the top two source countries for each. 5 This may differ to the total in the table due to rounding 6 Occupations are based on those defined by The Australian and New Zealand Standard Classification of Occupations (ANZSCO). Occupations listed under industry in this report, are equivalent to those listed under the ANZSCO sub-major group.
17 Table 6: Skilled Migrant Category approved applicants, with a job offer in the Bay of Plenty 15 Number of applicants 2013/14 % change 2012/13 to 2013/14 Top 2 source countries for each occupation Total SMC applicants with a job offer in the Bay of Plenty % India, Philipines Top 10 occupations by industry Health Professionals 97 9% India, Philippines Hospitality, Retail and Service Managers % India, China Food Trades Workers 59 79% India, China Engineering, ICT and Science Technicians % India, UK Automotive and Engineering Trades Workers 20 33% Philippines, India Specialist Managers 16 14% UK, South Africa Design, Engineering, Science and Transport Professionals Electrotechnology and Telecommunications Trades Workers 14-42% UK, USA % Fiji, UK Other Technicians and Trades Workers % India, China Education Professionals 12 0% UK, India Top 5 occupations Registered Nurses 69 25% India, Philippines Chefs 39 69% India, China Cafe and Restaurant Managers % India, China Retail Managers % India, China ICT Support Technicians % India, China Source: Ministry of Business, Innovation and Employment

18 16 Temporary migration The temporary work policy aims to facilitate the access of employers and industry to global skills and knowledge, while complementing the Government s education, training, employment and economic development policies. Work visas allow employers to recruit temporary workers from overseas to meet particular or seasonal work shortages as well as protecting employment opportunities and conditions for New Zealand workers. In 2013/14, 155,794 people were granted work visas in New Zealand, an increase of seven percent from the 144,936 approvals in the previous year. Immigration New Zealand statistics show that many temporary workers later secure permanent residence in New Zealand. Research shows that around one-third of temporary workers gain residence within five years 7. The Essential Skills policy facilitates the entry of people required on a temporary basis to fill shortages where suitable New Zealand citizens or residents are not available for the work offered. The demand for Essential Skills workers slowed down from October 2008 with the onset of the global economic slowdown and its effect on the domestic economy. Bay of Plenty context In the last two years the demand for Essential Skills workers has increased. In 2013/14, a total of 26,502 people were approved to work in New Zealand under the Essential Skill work policy. The Bay of Plenty accounts for about four percent of these workers. This is illustrated in Table 7. Working Holiday makers, partners of work visa holders, partners of some student visa holders and partners of New Zealand citizens and residents can also be issued temporary work visas. However the administrative data does not identify how many of these individuals moved to the Bay of Plenty. Essential skills workers The Essential Skills Category is a good indicator of labour demand as it is a labour market tested visa. This means that the occupation recorded on the Essential Skills visa is either on one of the Essential Skills in Demand lists or, a labour market test has been done to ensure there are no New Zealanders who can do, or be readily trained to do, the job offered and, that the employer has genuinely searched for suitably qualified and trained New Zealand workers. 7 MBIE, Migration Trends and Outlook 2012/2013
19 17 Table 7: Number of people granted Essential Skills work visas by region they are employed within Region Financial Year % change 2012/13 to 2004 / / / / / / / / / / /14 Auckland 8,286 9,225 9,860 10,583 10,191 7,873 8,094 7,016 6,638 7,584 14% Canterbury 2,946 3,233 3,499 4,545 3,568 2,910 2,469 3,335 4,694 6,591 40% Otago 2,495 2,864 3,259 3,904 3,206 2,645 2,531 2,482 2,604 2,927 12% Wellington 2,219 2,470 2,376 3,496 2,637 1,978 1,869 1,963 1,979 2,122 7% Waikato 1,597 1,610 1,673 1,776 1,492 1,100 1,086 1,198 1,195 1,342 12% Bay of Plenty ,526 1,529 1, % Nelson/Marlborough/ Tasman ,274 1,887 1, % Southland % Taranaki % Manawatu-Whanganui % Hawke s Bay % Northland % West Coast % Gisborne % Total where region is known 21,042 23,450 26,735 31,352 26,347 20,506 20,022 20,000 21,074 25,302 20% % of total essential skills workers where region is known 76% 82% 86% 86% 89% 89% 90% 91% 94% 95% 1% Total 27,827 28,744 31,015 36,334 29,627 22,947 22,341 22,065 22,406 26,502 18% Source: Ministry of Business, Innovation and Employment.
20 18 Source country In 2013/14, 847 Essential Skills workers were approved with an offer of employment in the Bay of Plenty. Table 8 shows the top five source countries of these workers. In 2013/14, these top five source countries accounted for 64 percent of the total number of Essential Skills workers with a job offer in the Bay of Plenty. Table 8: Source country of Essential Skills workers 2009/10 to 2013/ / / / / /14 India 70 (9%) 90 (12%) 134 (18%) 170 (24%) 215 (25%) UK 151 (19%) 156 (20%) 155 (21%) 123 (18%) 145 (17%) Philippines 129 (17%) 149 (19%) 12 (17%) 94 (13%) 90 (11%) USA 33 (4%) 33 (4%) 28 (4%) 44 (6%) 51 (6%) China 39 (5%) 33 (4%) 39 (5%) 29 (4%) 41 (5%) Source: Ministry of Business, Innovation and Employment Figure 9: Trends in the source countries of Essential Skills workers 30% 20% 10% 0% 2009/ / / / /14 INDIA UK PHILIPPINES UNITED STATES CHINA Source: Ministry of Business, Innovation and Employment Occupations Table 9 shows the ranking for the top 10 occupational groups for which Essential Skills workers received an offer of employment for the 2013/14 year. It shows occupations by industry and occupation 8. The table shows the number of approved Essential Skills workers for the Bay of Plenty in the 2013/14 year. The second column of data shows the percentage change for each occupation from the 2012/13 year, whilst the last column shows the top two source countries for each. 8 These occupations are based on those defined in The Australian and New Zealand Standard Classification of Occupations (ANZSCO). Occupations listed under industry in this report, are equivalent to those listed under the ANZSCO sub-major group.
21 Table 9: Essential Skills migrant category approved workers, with a job offer in the Bay of Plenty 19 Number of workers 2013/14 % change 2012/13 to 2013/14 Top 2 source countries in 2013/14 Total workers approved Essential Skills visa % India, UK Top 10 occupations by industry Health Professionals 151-6% UK, Philippines Food Trades Workers % India, Brazil Carers and Aides 73 12% Philippines, India Hospitality, Retail and Service Managers 64 36% India, China Automotive and Engineering Trades Workers 47 18% Philippines, India Farmers and Farm Managers 38-37% Philippines, South Africa Design, Engineering, Science and Transport Profs % UK, South Africa Educational Professionals 23 44% UK, Chile Other Technicians and Trades Workers 22 5% UK, Brazil Sports and Personal Service Workers 22 5% UK, Canada Top 10 occupations Chefs 97-12% India, Brazil General Practitioners and Resident Medical Officers 61-5% UK, USA Aged and Disabled Carers 47 18% Philippines, Fiji Registered Nurses 44-21% Philippines, India Livestock Farmers 34-29% Philippines, South Africa Café and Restaurant Managers 32-3% India, UK Nursing Support and Personal Carers 26 24% Philippines, India Metal Fitters and Machinists % Philippines, India Retail Managers 16 60% China, India Other Medical Practitioners 15 15% USA* *Only source country with more than one application approved for the 2013/14 year Source: Ministry of Business, Innovation and Employment
22 20 International students International Education makes a considerable contribution to New Zealand s economy. The current economic value of export education is estimated to be worth $2.6 billion. The Leadership Statement for International Education 2011 which aims to double the economic value of international education to $5 billion over the next 15 years, includes targets to: increase the number of international students enrolled in New Zealand providers offshore, from 3,000 to 10,000 double the number of international postgraduate students (particularly in programmes in addition to those at PhD level) from 10,000 to 20,000 increase the transition rate from study to residence for international university students. International students also contribute to New Zealand s skilled workforce. Many of them (37 percent) stay to work in New Zealand after they complete their study and 42 percent of skilled migrant category principal applicants used to be an international student in New Zealand 9. To ensure New Zealand continues to benefit from having international students and secure a healthy growth in this sector, we must ensure that international students in New Zealand have a high quality experience. This enables us to maintain New Zealand s reputation as a safe and attractive education destination. The Student Policy aims to facilitate the entry of genuine students with a focus on attracting and developing students who have the skills New Zealand needs. Steps to promote pathways to work and residence for skilled international students are facilitated through immigration policies. These policies are intended to attract genuine international students and enable the most skilled to stay in New Zealand and take up skilled employment, so that they can help drive economic growth. Over the past decade, 22 percent of student visa holders were granted a resident visa within five years of being issued their first student visa 10. The trend is a steady take up of permanent residence over time. Several factors might influence the length of time it takes a student to get residence, including the length of time of study and whether there is an intermediary move to a work visa before applying for residence. In 2013/14, 73,510 international students were approved to study in New Zealand, a 15 percent increase from 64,190 in 2012/13. Bay of Plenty context In 2013/14, 2,313 people intending to study in the Bay of Plenty were granted student visas. This represents a 29 percent increase from 2012/13 (see Table 10). In the same period the growth in new student visa applicants studying in the Bay of Plenty was 24 percent (see Table 11). 9 MBIE, Migration Trends and Outlook 2012/ MBIE, Migration Trends and Outlook 2012/2013.
23 21 Table 10: Number of people granted student visas by region of study over the past 10 years Region Financial Year 2004 / / / / / / / / / /14 % change 2012/13 to 2013/14 Auckland 35,343 31,387 29,891 30,805 33,334 34,102 36,757 34,983 32,207 39,240 22% Canterbury 11,172 9,434 8,721 8,193 8,366 8,489 7,109 4,947 4,992 5,592 12% Wellington 7,000 5,034 4,805 4,508 4,231 4,422 4,371 4,162 4,148 4,206 1% Waikato 5,189 4,662 3,942 3,761 3,812 3,821 3,705 3,674 3,494 3,670 5% Otago 3,368 3,511 3,312 3,220 3,360 3,556 3,629 3,524 3,526 3,587 2% Bay of Plenty 1, ,079 1,396 1,520 2,238 2,057 1,792 2,313 29% Manawatu-Whanganui 3,035 2,751 2,369 2,249 2,220 2,283 2,327 2,494 2,240 2,247 0% Nelson/Marlborough/ Tasman % Southland % Hawke s Bay % Taranaki % Northland % Gisborne % West Coast % Total where region is known 68,847 60,214 56,433 56,219 59,299 61,092 63,079 58,905 55,061 63,785 16% % of total students where region is known 89% 87% 84% 81% 81% 84% 85% 85% 86% 87% 1% Total 77,626 69,264 67,149 69,105 73,109 72,755 74,096 68,905 64,190 73,510 15% Source: Ministry of Business, Innovation and Employment.
24 22 Table 11: Number of people granted first student visas by region of study over the past 10 years Region Financial Year 2004 / / / / / / / / / /14 % change 2012/13 to 2013/14 Auckland 9,363 9,983 12,232 15,425 17,706 17,873 19,305 17,478 14,884 20,424 37% Canterbury 3,669 3,701 4,211 4,385 4,850 4,662 3,616 2,047 2,502 3,146 26% Wellington 1,966 1,916 2,089 2,176 2,333 2,482 2,438 2,246 2,292 2,319 1% Waikato 1,525 1,586 1,653 1,958 2,179 1,917 1,827 1,776 1,725 1,939 12% Otago 1,679 1,564 1,693 1,725 1,894 2,026 2,064 1,829 1,767 1,884 7% Bay of Plenty ,074 1,097 1,711 1,408 1,211 1,499 24% Manawatu-Whanganui 848 1,026 1,088 1,240 1,182 1,141 1,115 1,214 1,038 1,035 0% Nelson/Marlborough/ Tasman % Southland % Hawke s Bay % Northland % Taranaki % Gisborne % West Coast % Total where region is known 20,907 21,752 25,266 29,366 33,093 33,227 34,103 30,074 27,105 34,174 26% % of total students where region is known 80% 80% 78% 77% 79% 87% 88% 87% 86% 87% 1% Total 26,073 27,341 32,470 37,942 41,698 38,357 38,588 34,425 31,444 39,203 25% Source: Ministry of Business, Innovation and Employment.

25 The following dashboard is based on Immigration New Zealand (INZ) data on student visas issued. This data source is the most immediate data available on the international education sector, as there is only a one month lag between student visas approved and INZ publishing the data. Student visa data is a strong indicator of whether students are remaining, leaving or entering New Zealand to study, which can be used as a predictor for future enrolment trends. October.pdf 23 The report linked below is from Education New Zealand s website. It provides a snapshot of the trends in New Zealand s international education industry for the 2014 year to date. The report uses data from the Export Education Levy, Single Data Return (SDR) and student visa statistics from INZ. This report builds on similar reports released for January- April 2013, January- August 2013, and a full year report for the 2013 year. April%202014%20web.pdf
26 24 Conclusion and further information This report collated data from Statistics New Zealand s 2013 Census and INZ data sourced from MBIE. The report provides an overview of the demographics of the overseas-born population living in the Bay of Plenty, and detailed information on the source country and occupation of migrants who have come to New Zealand under the SMC and the Essential Skills policy with job offers in the Bay of Plenty. Some of the key points of note are: 17 percent of the Bay of Plenty s population are overseas-born 40 percent of the Bay of Plenty s overseas-born population come from the United Kingdom and Ireland, and a further 22 percent from Asia 39 percent of the approved SMC principal applicants with a job offer in the Bay of Plenty in 2013/14 came from India The top three occupations for SMC principal applicants, in the Bay of Plenty, were: registered nurses; chefs and; café and restaurant managers 25 percent of approved Essential Skills workers in the Bay of Plenty came from India, followed by the United Kingdom with 17 percent The top three occupations for Essential Skills workers in the Bay of Plenty were: chefs; general practitioners and resident medical officers; and aged and disabled carers Four percent of student visas granted in 2013/14, where a region was specified, were for study in the Bay of Plenty. Other sources: Directory of site listings and regional information as well as graphical maps for regions
27
28 MB13049
Migration and Labour Force Trends
 Migration and Labour Force Trends Northland Overview 2014 immigration.govt.nz 2 ISBN 978-0-908335-20-6 May, 2015 Crown Copyright 2015 The material contained in this report is subject to Crown copyright
Migration and Labour Force Trends
 Southland Overview 2014 immigration.govt.nz 2 ISBN 978-0-478-43371-5 May, 2015 Crown Copyright 2015 The material contained in this report is subject to Crown copyright protection unless otherwise indicated.
Migration and Labour Force Trends
 Migration and Labour Force Trends Welington Overview 2015 immigration.govt.nz 2 Table of Contents Wellington Executive Summary 2 Introduction 3 Background 4 Wellington s migrant demographics 6 Migration
Migration and Labour Force Trends
 Migration and Labour Force Trends Taranaki Overview 2015 immigration.govt.nz 2 Table of Contents Taranaki Executive Summary 2 Introduction 3 Background 4 Taranaki s migrant demographics 6 Migration and
Migration and Labour Force Trends
 Migration and Labour Force Trends Manawatu-Whanganui Overview 2015 immigration.govt.nz 2 Table of Contents Manawatu-Whanganui Executive Summary 2 Introduction 4 Background 5 Manawatu-Whanganui s migrant
Migration and Labour Force Trends
 Migration and Labour Force Trends Otago Overview 2015 immigration.govt.nz 2 Table of Contents Otago Executive Summary 2 Introduction 3 Background 4 Otago migrant demographics 6 Migration and the Otago
Regional Migration Trends
 Regional Migration Trends Auckland Overview 2015/16 immigration.govt.nz For more information www.immigration.govt.nz www.mbie.govt.nz Publishing date: December 2017 ISSN 2538-0303 Crown Copyright 2017
Regional Migration Trends
 Regional Migration Trends Hawke s Bay Overview 2015/16 immigration.govt.nz For more information www.immigration.govt.nz www.mbie.govt.nz Publishing date: December 2017 ISSN 2538-0338 Crown Copyright 2017
Regional Migration Trends
 Regional Migration Trends Nelson, Marlborough and Tasman Overview 2015/16 immigration.govt.nz For more information www.immigration.govt.nz www.mbie.govt.nz Publishing date: December 2017 ISSN 2538-0346
Regional Migration Trends
 Regional Migration Trends Manawatu-Whanganui Overview 2015/16 immigration.govt.nz For more information www.immigration.govt.nz www.mbie.govt.nz Publishing date: December 2017 ISSN 2538-0419 Crown Copyright
Regional Migration Trends
 Regional Migration Trends Otago Overview 2015/16 immigration.govt.nz For more information www.immigration.govt.nz www.mbie.govt.nz Publishing date: December 2017 ISSN 2538-0362 Crown Copyright 2017 The
Migration Trends Key Indicators Report
 Migration Trends Key Indicators Report June 214 MB 12939 August 14 Photograph by Chris WIlliams Ministry of Business, Innovation and Employment (MBIE) Hikina Whakatutuki Lifting to make successful MBIE
Executive summary. Migration Trends and Outlook 2014/15
 Executive summary This annual report is the 15th in a series that examines trends in temporary and permanent migration to and from New Zealand. The report updates trends to 2014/15 and compares recent
Migrant Youth: A statistical profile of recently arrived young migrants. immigration.govt.nz
 Migrant Youth: A statistical profile of recently arrived young migrants. immigration.govt.nz ABOUT THIS REPORT Published September 2017 By Ministry of Business, Innovation and Employment 15 Stout Street
Migration Trends Key Indicators December 2014
 Migration Trends Key Indicators December 214 Ministry of Business, Innovation and Employment (MBIE) Hikina Whakatutuki - Lifting to make successful MBIE develops and delivers policy, services, advice and
Migration Trends Key Indicators Report
 Migration Trends Key Indicators Report June 2013 DOL 12433.1 AUG 13 Ministry of Business, Innovation and Employment (MBIE) Hikina Whakatutuki Lifting to make successful MBIE develops and delivers policy,
Future direction of the immigration system: overview. CABINET PAPER (March 2017)
") Future direction of the immigration system: overview CABINET PAPER (March 2017) This document has been proactively released. Redactions made to the document have been made consistent with provisions of
Future direction of the immigration system: overview CABINET PAPER (March 2017) This document has been proactively released. Redactions made to the document have been made consistent with provisions of
New Zealand Residence Programme. CABINET PAPER (October 2016)
") New Zealand Residence Programme CABINET PAPER (October 2016) This document has been proactively released. Redactions made to the document have been made consistent with provisions of the Official Information
New Zealand Residence Programme CABINET PAPER (October 2016) This document has been proactively released. Redactions made to the document have been made consistent with provisions of the Official Information
Quarterly Labour Market Report. February 2017
 Quarterly Labour Market Report February 2017 MB14052 Feb 2017 Ministry of Business, Innovation and Employment (MBIE) Hikina Whakatutuki - Lifting to make successful MBIE develops and delivers policy, services,
Executive Summary. Background NEW MIGRANT SETTLEMENT AND INTEGRATION STRATEGY
 NEW MIGRANT SETTLEMENT AND INTEGRATION STRATEGY Executive Summary In July 2014 Government made decisions on an updated strategic framework for migrant settlement and integration in New Zealand and new
OUTWARD MIGRATION FROM NEW ZEALAND
 OUTWARD MIGRATION FROM NEW ZEALAND Manuila Tausi 24 October 2012 Outline Background Objectives of the study Data integration process Movements Profile of migrants Retention of migrants Duration of stay
DOL The Labour Market and Settlement Outcomes of Migrant Partners in New Zealand
 DOL 12414 The Labour Market and Settlement Outcomes of Migrant Partners in New Zealand Ministry of Business, Innovation and Employment (MBIE) Hikina Whakatutuki Lifting to make successful MBIE develops
Settling in New Zealand
 Settling in New Zealand Migrants perceptions of their experience 2015 Migrant Survey ISBN 978-1-98-851761-2 (online) May 2017 Disclaimer The Ministry of Business, Innovation and Employment has made every
People. Population size and growth. Components of population change
 The social report monitors outcomes for the New Zealand population. This section contains background information on the size and characteristics of the population to provide a context for the indicators
Ministry of Business, Innovation and Employment. Suite of proposed changes to the Essential Skills visa: discussion document
 Submission by to the Ministry of Business, Innovation and Employment on the Suite of proposed changes to the Essential Skills visa: discussion document 21 May 2017 BusinessNZ PO Box 1925 Wellington Ph:
1. A Regional Snapshot
 SMARTGROWTH WORKSHOP, 29 MAY 2002 Recent developments in population movement and growth in the Western Bay of Plenty Professor Richard Bedford Deputy Vice-Chancellor (Research) and Convenor, Migration
Migration Trends Key Indicators Report
 Migration Trends Key Indicators Report June 2012 DOL 12176 AUG 12 MIGRATION TRENDS KEY INDICATORS REPORT: JUNE 2012 Purpose This report summarises key indicators of migration trends for the 2011/12 financial
Characteristics of the underemployed in New Zealand
 Characteristics of the underemployed in New Zealand focuses on the proportion of underemployment for part-time workers. It brings in underemployment rates and levels to provide context. We explore personal,
INZ Tourism & Hospitality Data and Insights. December 2017
 INZ Tourism & Hospitality Data and Insights December 2017 Contents Work and Residence Visa: Key Occupations (3-4) Spotlight on Post-Study Employer Assisted visas (5-9) Working Holiday Visa (10) China Visitor
MONTHLY MIGRATION TRENDS
 MONTHLY MIGRATION TRENDS FEBRUARY 2010 DOL11131.9 JAN 10 MIGRATION TRENDS KEY INDICATORS REPORT: FEBRUARY 2010 Purpose This report provides a brief summary of migration trends for the 2009/10 financial
The Maori Population A Profile of the Trends Within Iwi Rohe
 The Maori Population A Profile of the Trends Within Iwi Rohe Report on Mataatua Iwi Rohe Report prepared for Te Puni Kōkiri by Kaipuke Consultants Ltd 9 June 2009 The Maori Population A Profile of the
COMMUNITY PERCEPTIONS OF MIGRANTS AND IMMIGRATION
 COMMUNITY PERCEPTIONS OF MIGRANTS AND IMMIGRATION 3 1 EXECUTIVE SUMMARY 4 1.1 EXECUTIVE SUMMARY INTRODUCTION This report presents the findings from a Community survey designed to measure New Zealanders
Immigration Policy Review
 Immigration Policy Review Wellington Regional Council 4 October 2013 www.berl.co.nz Background Author(s): Hillmarè Schulze DISCLAIMER All work is done, and services rendered at the request of, and for
The Maori Population A Profile of the Trends Within Iwi Rohe
 The Maori Population A Profile of the Trends Within Iwi Rohe Report on Tauranga Moana Iwi Rohe Report prepared for Te Puni Kōkiri by Kaipuke Consultants Ltd 9 June 2009 The Maori Population A Profile of
MONTHLY MIGRATION TRENDS
 MONTHLY MIGRATION TRENDS MARCH 2010 DOL11131.10 MAR 10 MIGRATION TRENDS KEY INDICATORS REPORT: MARCH 2010 Purpose This report provides a brief summary of migration trends for the 2009/10 financial year
Fiscal Impacts of Immigration in 2013
 www.berl.co.nz Authors: Dr Ganesh Nana and Hugh Dixon All work is done, and services rendered at the request of, and for the purposes of the client only. Neither BERL nor any of its employees accepts any
The Maori Population A Profile of the Trends Within Iwi Rohe
 The Maori Population A Profile of the Trends Within Iwi Rohe Report on Te Arawa Waka Iwi Rohe Report prepared for Te Puni Kōkiri by Kaipuke Consultants Ltd 9 June 2009 The Maori Population A Profile of
RE: PROPOSED CHANGES TO THE SKILLED MIGRANT CATEGORY
 JacksonStone House 3-11 Hunter Street PO Box 1925 Wellington 6140 New Zealand Tel: 04 496-6555 Fax: 04 496-6550 www.businessnz.org.nz Shane Kinley Policy Director, Labour & Immigration Policy Branch Ministry
City of Greater Dandenong Our People
 City of Greater Dandenong Our People 2 City of Greater Dandenong Our People Contents Greater Dandenong people 4 Greater Dandenong people statistics 11 and analysis Population 11 Age 12 Unemployment Rate
LABOUR, SCIENCE AND ENTERPRISE GROUP. Submission form for: proposed changes to the Skilled Migrant Category
 LABOUR, SCIENCE AND ENTERPRISE GROUP Submission form for: proposed changes to the Skilled Migrant Category Purpose of the Skilled Migrant Category The Skilled Migrant Category (SMC) is a policy for people
External migration. Executive summary
 21/4 7 March 21 External migration Executive summary New Zealand s permanent and long-term migrant flows have oscillated between positive and negative net figures over the last 4 years, with a net gain
Demographic Trends: 2012
 Demographic Trends: 2012 1 Crown copyright This work is licensed under the Creative Commons Attribution 3.0 New Zealand licence. You are free to copy, distribute, and adapt the work, as long as you attribute
MOVING TO JOBS? Dave Maré and Jason Timmins Motu Economic and Public Policy Research Trust Motu Working Paper 1 #
 MOVING TO JOBS? Dave Maré and Jason Timmins Motu Economic and Public Policy Research Trust Motu Working Paper 1 # 2003-07 2 June 2003 Dave Maré (dave.mare@motu.org.nz) is Motu s Senior Research Fellow;
Immigration HIGHLIGHTS. Introduction. New Zealand Labour Party. Manifesto 2017
 Immigration HIGHLIGHTS Ensure that businesses are able to get genuinely skilled migrants when they need them. This will include introducing an Exceptional Skills Visa for highly skilled or talented people
Tourism & Hospitality Sector: Information for Employers
 Tourism & Hospitality Sector: Information for Employers immigration.govt.nz Disclaimer: this document was verified and reproduced in December 2017, however, immigration policy and instructions are subject
THE NORTHERN TERRITORY S RY S OVERSEAS BORN POPULATION
 STUDIES RESEARCH BRIEF ISSUE Number 2008010 School for Social and Policy Research 2008 Population Studies Group School for Social and Policy Research Charles Darwin University Northern Territory 0909 dean.carson@cdu.edu.au
Australia & New Zealand. Redefining Your Immigration Strategy Amongst a Sea of Change
 Australia & New Zealand Redefining Your Immigration Strategy Amongst a Sea of Change 1 With You Today Insert picture Insert picture Sasko Markovski Partner Sydney, Australia Chris Spentzaris Partner Melbourne,
Proactively released consistent with the Official Information Act
 I N C O N F I D E N C E Cabinet Economic Growth and Infrastructure Committee Minute of Decision EGI-17-MIN-0197 This document contains information for the New Zealand Cabinet. It must be treated in confidence
Pacific Economic Trends and Snapshot
 Pacific Economic Trends and Snapshot September 213 Report to Ministry of Business, Innovation, and Employment Contents 1. Key points... 3 2. Demographic trends... 5 3. Qualifications and skills... 7 4.
A Multicultural Northern Territory Statistics from the 2016 Census (and more!) Andrew Taylor and Fiona Shalley
 Andrew Taylor and Fiona Shalley") A Multicultural Northern Territory Statistics from the 2016 Census (and more!) Andrew Taylor and Fiona Shalley Todays discussion Part I Background and the NT s multicultural make-up Part II Key statistics,
A Multicultural Northern Territory Statistics from the 2016 Census (and more!) Andrew Taylor and Fiona Shalley Todays discussion Part I Background and the NT s multicultural make-up Part II Key statistics,
2015/16 Annual review of the Ministry of Business, Innovation and Employment
 2015/16 Annual review of the Ministry of Business, Innovation and Employment Report of the Commerce Committee Contents Recommendation 2 Introduction 2 Financial performance and audit opinion 2 Payroll
There have been many theories expressed to explain the current NOM, including:
 Dispelling the Myths About Australia s Population Growth By Mark Webster 12/05/2010 The 2010 Intergenerational Report has opened up a debate in Australia about what Australia's population should be long
People. Population size and growth
 The social report monitors outcomes for the New Zealand population. This section provides background information on who those people are, and provides a context for the indicators that follow. People Population
Self-Assessment Guide for Residence in New Zealand
 INZ 1003 Self-Assessment Guide for Residence in New Zealand A guide to the options for gaining residence in New Zealand Residence in New Zealand Potential migrants who want to live in New Zealand permanently
The Economic and Social Outcomes of Children of Migrants in New Zealand
 The Economic and Social Outcomes of Children of Migrants in New Zealand Julie Woolf Statistics New Zealand Julie.Woolf@stats.govt.nz, phone (04 931 4781) Abstract This paper uses General Social Survey
Contemporary Pacific Status Report
 Contemporary Status Report A snapshot of peoples in New Zealand i Ministry for Peoples Contemporary Status Report A snapshot of peoples in New Zealand The Contemporary Status Report offers a present-day
POPULATION AND SUSTAINABLE DEVELOPMENT 2003
 POPULATION AND SUSTAINABLE DEVELOPMENT 2003 This report discusses how changes in New Zealand s population over the next 50 years are likely to impact on our future development and wellbeing. It is published
Study to Work and Residence. EIT October
 Study to Work and Residence EIT October 16 2013 Overview Term time work rights Graduate work visa policy Skilled Migrant Category (SMC) Other work to residence options Accessing further information Introduction
Trends in Labour Supply
 Trends in Labour Supply Ellis Connolly, Kathryn Davis and Gareth Spence* The labour force has grown strongly since the mid s due to both a rising participation rate and faster population growth. The increase
Màori Towards 2000 THE WHAKAPAKARI SERIES
 Whakapakari: Tatauranga Taupori Number 1 1998 ISBN 478 9136 2 Towards 2 INTRODUCTION Following World War II, fertility rose and continued at a high level for the next two decades. Over the same period,
Recent changes to the Essential Skills visa policy and the Skilled Migrant Category. Elizabeth Gerard Senior Advisor, Skills and Employment policy
 Recent changes to the Essential Skills visa policy and the Skilled Migrant Category Elizabeth Gerard Senior Advisor, Skills and Employment policy Overview The Government has recently announced changes
MIGRATION BETWEEN THE ASIA-PACIFIC AND AUSTRALIA A DEVELOPMENT PERSPECTIVE
 MIGRATION BETWEEN THE ASIA-PACIFIC AND AUSTRALIA A DEVELOPMENT PERSPECTIVE by Graeme Hugo University Professorial Research Fellow Professor of Geography and Director of the National Centre for Social Applications
Community perceptions of migrants and immigration. D e c e m b e r
 Community perceptions of migrants and immigration D e c e m b e r 0 1 OBJECTIVES AND SUMMARY OBJECTIVES The purpose of this research is to build an evidence base and track community attitudes towards migrants
ALMR response to the Migration Advisory Committee s call for evidence on EEA migration and future immigration policy
 ALMR response to the Migration Advisory Committee s call for evidence on EEA migration and future immigration policy About us and the sector The ALMR is the leading body representing the eating and drinking
Parliamentary briefing
 Session 2012 13 30/10/2012 Parliamentary briefing Oral Question: Impact of current immigration policy on the attractiveness of United Kingdom universities to overseas students (Lord Giddens) 30 th October
Investing in Skills for Domestic Employment or Migration? Observations from the Pacific Region
 Skills for Inclusive and Sustainable Growth in Developing Asia-Pacific: An International Forum 2012 Investing in Skills for Domestic Employment or Migration? Observations from the Pacific Region Sunhwa
The demographic diversity of immigrant populations in Australia
 The demographic diversity of immigrant populations in Australia Professor James Raymer School of Demography Research School of Social Sciences Mobility Symposium, Department of Immigration and Border Protection
Queensland s Labour Market Progress: A 2006 Census of Population and Housing Profile
 Queensland s Labour Market Progress: A 2006 Census of Population and Housing Profile Issue No. 9 People in Queensland Labour Market Research Unit August 2008 Key Points Queensland s Labour Market Progress:
New Zealand Sport & Recreation Sector. An overview of the labour market test and when it is needed under the Essential Skills instructions
 New Zealand Sport & Recreation Sector An overview of the labour market test and when it is needed under the Essential Skills instructions Essential Skills Applicants in need of a work visa for a job from
QUANTIFYING TRANSNATIONALISM: ASIAN SKILLED MIGRATION TO AUSTRALIA
 QUANTIFYING TRANSNATIONALISM: ASIAN SKILLED MIGRATION TO AUSTRALIA by Graeme Hugo Federation Fellow Professor of Geography and Director of the National Centre for Social Applications of GIS The University
Response to the Department of Home Affairs consultation on Managing Australia's Migrant Intake
 Response to the Department of Home Affairs consultation on Managing Australia's Migrant Intake February 2018 Business Council of Australia February 2018 1 The Business Council of Australia draws on the
Introduction CHRISTCHURCH CITY UPDATE 2000
 CHRISTCHURCH CITY UPDATE 2000 Introduction Christchurch City experienced significant population growth during the first half of the 1990s. This trend was fuelled by high levels of international migration,
Designer Immigrants? International Students, as Potential Skilled Migrants Lesleyanne Hawthorne Professor International Workforce
 Designer Immigrants? International Students, as Potential Skilled Migrants Lesleyanne Hawthorne Professor International Workforce High-Skilled Immigration Policy and the Global Competition for Talent 22-23
Planning in the Context of a New New Zealand: Demographic and Economic Challenges
 Planning in the Context of a New New Zealand: Demographic and Economic Challenges PAUL SPOONLEY Pro Vice-Chancellor College of Humanities and Social Sciences NZPI Conference 22 March 2018 In 10 Years 2
Evaluation of the General Skilled Migration Categories Report. Submission to DIMA
 Evaluation of the General Skilled Migration Categories Report Submission to DIMA By the MIA September 2006 THE MIGRATION INSTITUTE OF AUSTRALIA (MIA) The Migration Institute of Australia ( MIA ) is the
Chapter One: people & demographics
 Chapter One: people & demographics The composition of Alberta s population is the foundation for its post-secondary enrolment growth. The population s demographic profile determines the pressure points
2014 Migration Update Report
 2014 Migration Update Report by Graeme Hugo ARC Australian Professorial Fellow and Professor of Geography, The University of Adelaide Presentation to 2014 Migration Update Conference, Adelaide 11 th September,
Work Visa Application
 OFFICE USE ONLY Client no.: Date received: / / Application no.: November 2017 INZ 1015 Work Visa Application based on qualifications, employment or humanitarian reasons Apply for your visa online it s
Why Auckland? Advice and opportunity: A Study of Why Migrants Settle in Auckland
 Pathways, Circuits and Crossroads Conference 13 December 2011 Why Auckland? Advice and opportunity: A Study of Why Migrants Settle in Auckland Abigail Johnston Migration Research Introduction Background:
Health Workforce Mobility: Migration and Integration in Australia
 Health Workforce Mobility: Migration and Integration in Australia Lesleyanne Hawthorne Professor International Health Workforce Centre for Health Policy WHO 4 th Global Forum on Human Resources for Health
Employment outcomes of postsecondary educated immigrants, 2006 Census
 Employment outcomes of postsecondary educated immigrants, 2006 Census Li Xue and Li Xu September 2010 Research and Evaluation The views and opinions expressed in this document are those of the author(s)
A2 Skilled Migration in and out of New Zealand: Immigrants, Workers, Students and Emigrants
 A2 Skilled Migration in and out of New Zealand: Immigrants, Workers, Students and Emigrants Richard Bedford University of Waikato A2.1 The brief for this paper At the outset, it is useful to recall the
Employer Sponsored Visas
 These employer sponsored options enable Australian employers to recruit skilled overseas nationals. Benefits to employers include: Satisfying recruitment needs and shortages Transferring specialised knowledge
Demographics. Chapter 2 - Table of contents. Environmental Scan 2008
 Environmental Scan 2008 2 Ontario s population, and consequently its labour force, is aging rapidly. The province faces many challenges related to a falling birth rate, an aging population and a large
MIGRATION UPDATE 2013
 MIGRATION UPDATE 2013 by Graeme Hugo ARC Australian Professorial Fellow and Professor of Geography, The University of Adelaide Presentation to 2013 Migration Update Conference, Adelaide 19 th September,
Immigration New Zealand. Hamilton 27 October 2017
 Immigration New Zealand Hamilton 27 October 2017 Immigration and the Tourism & Hospitality Sector 1. Immigration policy changes what these mean for your business and your staff (slides 3 to 17). 2. Insights
Bringing skilled workers into Sri Lan Is it a viable option?
 Bringing skilled workers into Sri Lan Is it a viable option? Nisha Arunatilake October 2018 Institute of Policy Studies of Sri Lanka Sri Lanka is facing a labour shortage Construction sector - 20,224 Total
Influence of Migration Pathways on International VET Student Recruitment: TAFE Queensland s Experiences
 Influence of Migration Pathways on International VET Student Recruitment: TAFE Queensland s Experiences Janelle Chapman Southbank Institute of Technology Agenda -Aging and Skills Shortage Issues -Skilled
> FOR VET MAINSTREAM COURSES (7 FEBRUARY 2019) Visa subclass Visa name Study rights Enrolment location Fee structure Further information / conditions
 Visa subclass Visa name Study rights Enrolment location Fee structure Further information / conditions") VISA SUBCLASS GUIDE > FOR VET MAINSTREAM COURSES (7 FEBRUARY 2019) This visa sub-class guide applies to vocational education and training (VET) enrolments. Please note visa holders should discuss their
VISA SUBCLASS GUIDE > FOR VET MAINSTREAM COURSES (7 FEBRUARY 2019) This visa sub-class guide applies to vocational education and training (VET) enrolments. Please note visa holders should discuss their
Profile of Canada s International Student Movement: From Temporary to Permanent Residents. Pathways to Prosperity April 20 th, 2018 Vancouver, BC
 Profile of Canada s International Student Movement: From Temporary to Permanent Residents Pathways to Prosperity April 20 th, 2018 Vancouver, BC Purpose Take stock of IRCC s approach to international students
The economic contribution of international students. Australian Council for Private Education and Training
 The economic contribution of international students Australian Council for Private Education and Training Contents Glossary... i Executive Summary... i 1 Background... 1 2 Australia s international education
Population growth affects citizens perceptions of community strength, identity and cohesion
 Introduction to Demographics Information on the demographic makeup of New Zealand s six largest cities is critical to understanding the nature of urban communities and how they are changing. Factors such
Policy Brief on Labour Force
 The Republic of the Union of Myanmar 2014 Myanmar Population and Housing Census Policy Brief on Labour Force Department of Population Ministry of Labour, Immigration and Population With technical assistance
Post-Secondary Education, Training and Labour September Profile of the New Brunswick Labour Force
 Post-Secondary Education, Training and Labour September 2018 Profile of the New Brunswick Labour Force Contents Population Trends... 2 Key Labour Force Statistics... 5 New Brunswick Overview... 5 Sub-Regional
Civil and Political Rights
 DESIRED OUTCOMES All people enjoy civil and political rights. Mechanisms to regulate and arbitrate people s rights in respect of each other are trustworthy. Civil and Political Rights INTRODUCTION The
Immigration Alert Changes to New Zealand s residence programme
 Immigration Alert Changes to New Zealand s residence programme Immigration levels in New Zealand have been a hot political topic over the past year. Concern has focussed primarily on the impact on housing
New Zealand Regions, : Incomes. Pool, I., Baxendine, S., Cochrane, W., Lindop, J.
 DISCUSSION PAPERS Population Studies Centre No 58 November 2005 New Zealand Regions, 1986-2001: Incomes Pool, I., Baxendine, S., Cochrane, W., Lindop, J. University of Waikato Te Whare Wānanga ō Waikato
State-nominated Occupation List
 State-nominated Occupation List Industry skills requirement through state-nominated skilled migration APRIL 2016 Page 1 RESTAURANT & CATERING AUSTRALIA Restaurant & Catering Australia (R&CA) is the national
POPULATION STUDIES RESEARCH BRIEF ISSUE Number
 POPULATION STUDIES RESEARCH BRIEF ISSUE Number 2008021 School for Social and Policy Research 2008 Population Studies Group School for Social and Policy Research Charles Darwin University Northern Territory
Regional employment and labour mobility
 Regional employment and labour mobility Need for a Donor-led Strategy Richard Curtain 1 Key argument Australia needs to do more to give young people from the Pacific & Timor-Leste better access to jobs